Power Consumption and Performance of a Wearable · PDF fileappliance. Power Consumption and...
40
CARNEGIE MELLON Department of Electrical and Computer Engineering~ Power Consumption and Performance of a Wearable Computing System Denis P. Reilly 1998 Advisor: Prof. Siewiorek
Transcript of Power Consumption and Performance of a Wearable · PDF fileappliance. Power Consumption and...
CARNEGIE MELLONDepartment of Electrical and Computer Engineering~
Power Consumption andPerformance of a Wearable
Computing System
Denis P. Reilly
1998
Advisor: Prof. Siewiorek
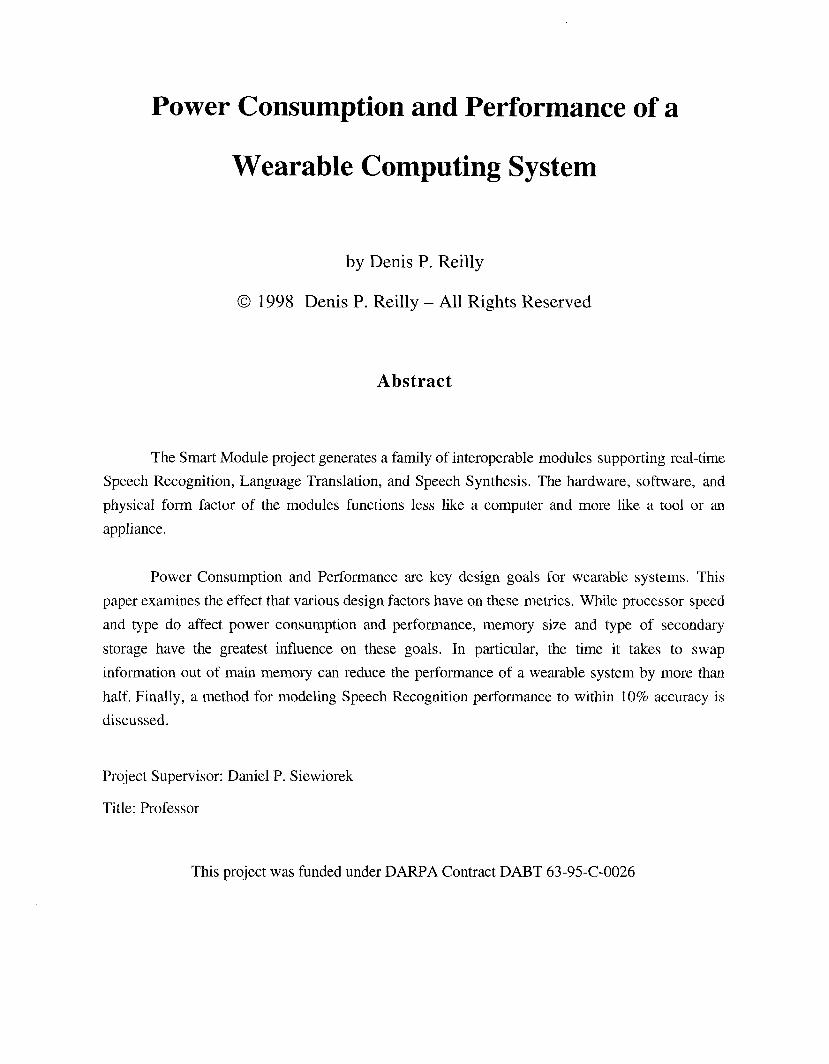
Power Consumption and Performance of a
Wearable Computing System
© 1998
by Denis P. Reilly
Denis P. Reilly - All Rights Reserved
Abstract
The Smart Module project generates a family of interoperable modules supporting real-time
Speech Recognition, Language Translation, and Speech Synthesis. The hardware, software, and
physical form factor of the modules functions less like a computer and more like a tool or an
appliance.
Power Consumption and Performance are key design goals for wearable systems. This
paper examines the effect that various design factors have on these metrics. While processor speed
and type do affect power consumption and performance, memory size and type of secondary
storage have the greatest influence on these goals. In particular, the time it takes to swap
information out of main memory can reduce the performance of a wearable system by more than
half. Finally, a method for modeling Speech Recognition performance to within 10% accuracy is
discussed.
Project Supervisor: Daniel P. Siewiorek
Title: Professor
This project was funded under DARPA Contract DABT 63-95-C-0026

Acknowledgments
I would like to thank my advisor, Dan Siewiorek, for the valuable advice he gave me in the
writing of this paper, as well as the Smart Module Project leader, Asim Smailagic, for giving me
the chance to make a contribution to this project. I would also like to thank the writers of the Smart
Module application software, Ralf Brown, "Ravi" Ravishankar and Kevin Lenzo. A special word
of thanks goes to John Dorsey, my "Special Programming Buddy", who helped me with my first
explorations into Unix Daemon programming, as well as the wonderful world of Newtonscript.
I’d also like to thank some of the people who I met here at CMU, most notably Phil
Koopman, who took me around Pittsburgh when I first came to CMU for Open House, only to be
the second reader on this project a year later. Things really do come full circle, I suppose. In
addition, I’ve encountered too many people in ICES and on D-level for me to possibly thank them
all individually here, so I won’t try - you all know who you are.
Finally, I’d like to thank my family and especially my fianc6, Sarah, for being there for me
this past year and for helping me keep a reasonable level of sanity.
Section 1
Smart Module Overview
1.1 Introduction
One of the main goals of "wearable computing" is to design small, dedicated, truly portable
computer hardware, tightly integrated with its software, that performs a specific function. This
changes the concept of how a computer can be used. Bringing computing-intensive applications to
a wearable platform means that users have mobile access to those applications at any time and any
place, much like a pocketknife can be used while hiking. A well designed wearable computer
should make using computing-intensive applications almost as easy and intuitive as using a hand
tool.
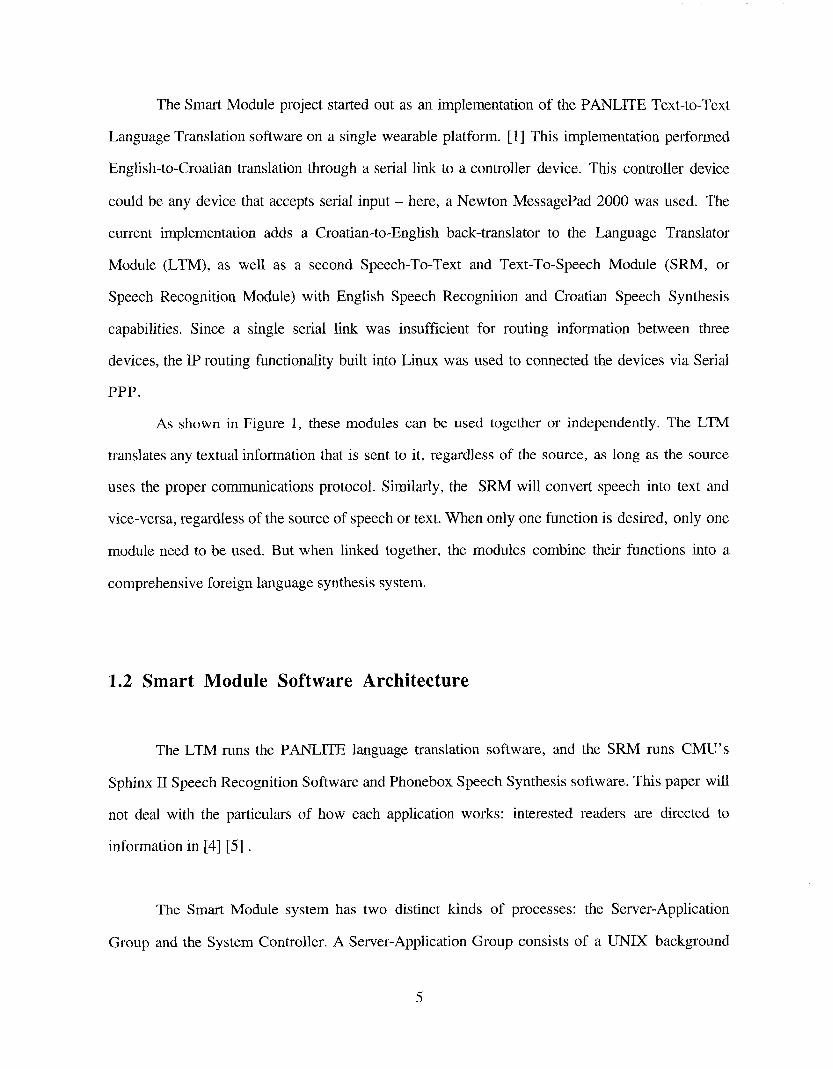
There are several criteria that can be of use when designing a wearable system:
¯ Keep the latencies involved with running the OS and the application as low as possible.
(as close to "instant response" as possible)
¯ Make the battery life as long as possible (reduce power consumption)
¯ Make the interface to the software as intuitive as possible.
¯ Make the form factor of the device as unobtrusive as possible.
(This involves making the device lightweight and operable in multiple orientations)
If all these criteria are met, then the end result will be computer that operates like a hand
tool instead of like a computer. The perfect wearable computer would be more like a Swiss Army

Knife, performing its function extremely well with no latency in an intuitive manner and with an
easily portable form factor, and running close to forever without changing batteries.
This paper will focus on the first two goals of improving performance and reducing power
consumption. These goals seem to be inherently contradictory at first glance: any computing device
that runs at a high clock frequency will tend to consume more power. This paper examines how
close the Smart Module project is to achieving these goals.
The Smart Module project adds two more criteria to the wearable computer design process.
These wearable devices must be modular; they should be usable in different configurations. They
must also be scaleable; existing code should be easily portable to the modules. By using a well-
known OS, the modules have the potential to run a wide variety of applications supported by its
hardware. The OS chosen was Red Hat Linux 5.0, because it is free, customizable, and the
applications already ran on the Linux platform. Linux itself is also scaleable in that it runs on a
wide range of configurations from multiprocessor Pentium II servers to 386-based machines.
SystemController
LTM, ]
Smart Modules Used Independently Smart Modules Used Together
Figure 1. Overall Smart Module System Architecture
4
The Smart Module project started out as an implementation of the PANLITE Text-to-Text
Language Translation software on a single wearable platform. [1] This implementation performed
English-to-Croatian translation through a serial link to a controller device. This controller device
could be any device that accepts serial input - here, a Newton MessagePad 2000 was used. The
current implementation adds a Croatian-to-English back-translator to the Language Translator
Module (LTM), as well as a second Speech-To-Text and Text-To-Speech Module (SRM,
Speech Recognition Module) with English Speech Recognition and Croatian Speech Synthesis
capabilities. Since a single serial link was insufficient for routing information between three
devices, the IP routing functionality built into Linux was used to connected the devices via Serial
PPP.
As shown in Figure 1, these modules can be used together or independently. The LTM
translates any textual information that is sent to it, regardless of the source, as long as the source
uses the proper communications protocol. Similarly, the SRM will convert speech into text and
vice-versa, regardless of the source of speech or text. When only one function is desired, only one
module need to be used. But when linked together, the modules combine their functions into a
comprehensive foreign language synthesis system.
1.2 Smart Module Software Architecture
The LTM runs the PANLITE language translation software, and the SRM runs CMU’s
Sphinx II Speech Recognition Software and Phonebox Speech Synthesis software. This paper will
not deal with the particulars of how each application works: interested readers are directed to
information in [4] [5].
The Smart Module system has two distinct kinds of processes: the Server-Application
Group and the System Controller. A Server-Application Group consists of a UNIX background

process which communicates with an application, such as PANLITE, via Inter-Process
Communication within a module. The server process also communicates with the System
Controller over the TCP/IP Network. The System Controller keeps track of what servers are
present on which modules, and coordinates the flow of information between the servers. It is
possible to interface any number of applications with one server process. Figure 2 illustrates how
data flows between the different pieces of Smart Module software.
I System Controller
TCP/IP
IPC
Data andCommands
Data
]Application]
Figure 2. Flow of Data in Smart Module Software
If a device were designed with sufficient memory, hard disk space, and user input
capability, it would be possible to host multiple Server-Application Groups and even the System
Controller on a single device, assuming this device can function at a sufficient level of
performance. This also allows for some measure of flexibility, as new specialized functions, such
as concurrent translation to additional languages, can be supported by either adding a new
hardware module or incorporating a new server into an existing hardware module.
The System Controller process does not usually need human interaction. In the current
configuration of the Smart Module System, the System Controller operates on a Newton
MessagePad 2000 to give the user a chance to correct the Speech Recognition output if some
words are misrecognized. If future modules contain applications with near-perfect accuracy, the
6

System Controller can be reduced to a simple state machine residing on one of the modules. Or,
since the System Controller is not very processor intensive, it can be included in another, less
powerful module. Whenever that module needs access to the more intensive computation, it can
connect to the appropriate Smart Module and have it do all the processing.
The key factors that determine how many processes can be run on a module are memory,
storage space, and available CPU cycles. Of these, the most important factor is memory, as will be
demonstrated later in this paper. Because it is desirable to run these applications with as little
latency as possible, the entirety of an application’s working data set should be able to stay memory
resident. If any of the application’s active data set is swapped out of fast memory, as most modern
OS’s will do when memory is exhausted, the slow disk accesses will drive the overall latency of
the application to unacceptable levels. Ideally, then, it is only desirable to add servers and
applications to a hardware module when there is sufficient memory for it, and avoid using swap
space altogether.
1.3 Smart Module Hardware Architecture
The Smart Modules have a very simple system-level hardware architecture. The heart of
this architecture is the Cardio processor card, which combines the processor and many of the
motherboard chips into one package, about the size of a PCMCIA card. The hardware architecture
of the modules is illustrated in Figure 3.
All the necessary signals for the ISA and IDE buses come out of the Cardio card. The
Cardio also supports two serial ports, which are used for communication between the modules.
Video Out and Keyboard capabilities are also provided on the board, and they are used in the
project for debugging purposes.
7
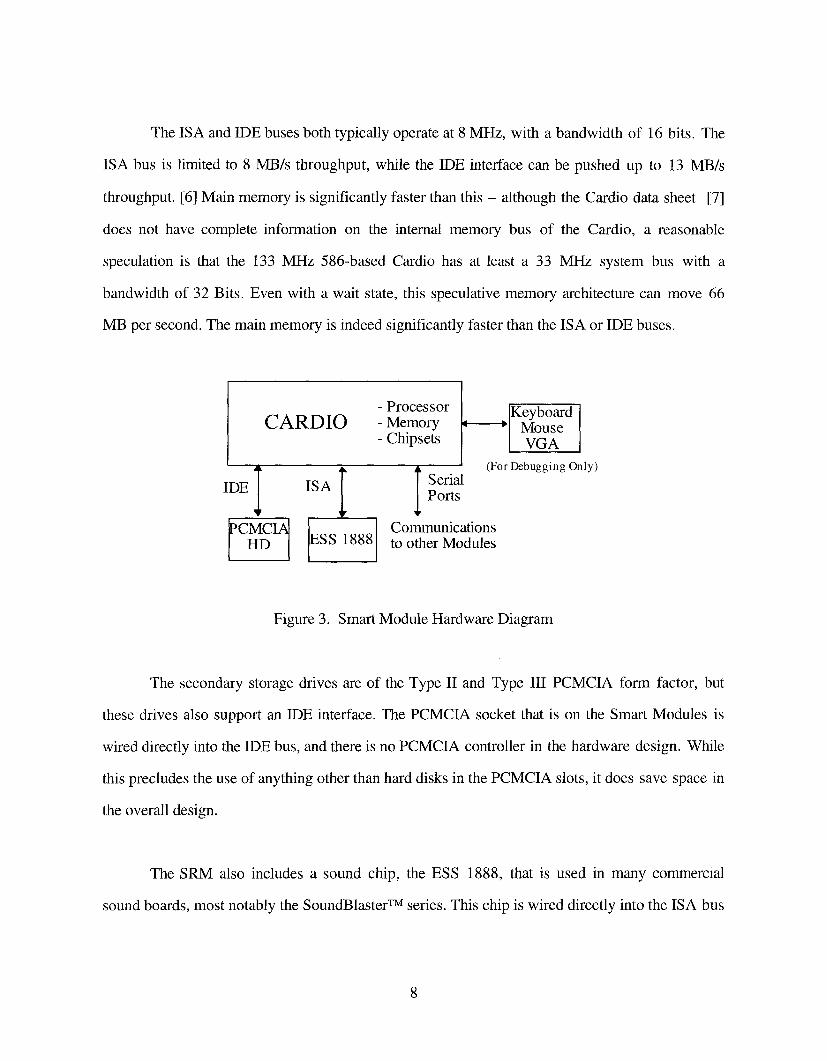
The ISA and IDE buses both typically operate at 8 MHz, with a bandwidth of 16 bits. The
ISA bus is limited to 8 MB/s throughput, while the IDE interface can be pushed up to 13 MB/s
throughput. [6] Main memory is significantly faster than this - although the Cardio data sheet [7]
does not have complete information on the internal memory bus of the Cardio, a reasonable
speculation is that the 133 MHz 586-based Cardio has at least a 33 MHz system bus with a
bandwidth of 32 Bits. Even with a wait state, this speculative memory architecture can move 66
MB per second. The main memory is indeed significantly faster than the ISA or IDE buses.
CARDIO
PCMCINHD
ISA
ESS 1888
- Processor [Keyboard I- Memory ~ Mouse- Chipsets VGA
(For Debugging Only)
ISerialPorts
Communicationsto other Modules
Figure 3. Smart Module Hardware Diagram
The secondary storage drives are of the Type II and Type III PCMCIA form factor, but
these drives also support an IDE interface. The PCMCIA socket that is on the Smart Modules is
wired directly into the IDE bus, and there is no PCMCIA controller in the hardware design. While
this precludes the use of anything other than hard disks in the PCMCIA slots, it does save space in
the overall design.
The SRM also includes a sound chip, the ESS 1888, that is used in many commercial
TMsound boards, most notably the SoundBlaster series. This chip is wired directly into the ISA bus
8

according to ESS reference designs; the result is that the software running on the Cardio sees the
ESS chip as a normal sound card attached to the ISA bus, and deals with it accordingly.
1.4 Smart Module Communication
The original Smart Module communications infrastructure consisted of a simple serial link
between the System Controller and the LTM module. This configuration was adequate for
communications between two devices over one link. But this infrastructure became inadequate
when a third device was needed. A second serial link could have been added between modules, but
some type of forwarding scheme would have been necessary between the modules. One would
have to implement this scheme directly in the server software. This scenario would necessitate
reprogramming the server every time a new module is added, reducing the overall modularity of
the system.
Original SM Communications Interface
Serial PPP Network(Forwarding done Automatically)
New SM Communications Interface
Figure 4. Simple Serial Link vs. Serial PPP
9

The communications infrastructure has been changed to a TCP/IP based network running
over serial PPP links, as detailed above in Figure 4. TCP/IP can be built directly into the Linux
kernel, eliminating the need to deal with network particulars in the Server software. It also
supports packet forwarding directly in the kernel. Finally, it can be utilized over a variety of
communications media, opening up the possibility of eventually replacing the serial PPP link with
a serial or PCMCIA-based wireless solution. It is even possible for the system to communicate
with any TCP/IP based intranet or the Internet, if a module is configured as a gateway with a
connection to an outside network.
SystemController
Translator
Figure 5. The Smart Module Virtual Network
Using this networking scheme, the position of each module in the physical network does
not matter; the System Controller simply sends out all communications for all modules over the
same link, creating a virtual network as shown in Figure 5. The 1nodules themselves handle
routing. New modules added to the system can have the capability to modify each others’ routing
tables automatically. Currently, because all of the modules used are physically connected with each
other, the Linux ppp server automatically configures the routing tables of the modules. But if more
modules are added to the system, a dynamic routing protocol must be used to modify the tables of
a module that may not be physically connected to the module that is added.
10
Section 2
Power/Performance Analysis
2.1 Factors affecting Power Consumption and Performance
Improving power consumption and performance seem to be contradictory goals at first
glance: any computing device that runs at a high clock frequency will tend to consume more
power, and a sure way to insure that a device consumes less power is to operate it at a lower clock
frequency. The following are factors that should affect the overall power consumption of the
system:
- Increases in raw processor clock speed between processors of the same generation should
increase the overall power consumption of the system. Power consumption in digital systems is
directly proportional to the rate at which the system clock operates in CMOS devices, since most of
the power is consumed when transistors switch.
- Advances in technology between microprocessor generations have the potential to enable
more advanced processors to do more on the same power budget. This means that, depending on
the goals of the microprocessor designers, a processor from the next generation can operate just as
fast, or even faster, then processors of the current generation while using less power. While this
does not hold true for all microprocessor families, it is important that any processor used in a
wearable system be more power efficient then its less advanced siblings, and that the increase in
performance does not come at the expense of a proportional increase in power consumption.
11
- Using a flash disk for secondary storage should consume less power then using a
spinning disk drive for many reasons, most notably because flash disks have no moving parts.
- Regardless of the type of secondary storage used, performance will decrease and power
consumption will increase if swap space is used excessively by the applications. This is due to the
increased disk activity when swapping. The Cardio cards do support additional memory, but this
memory must be added on the ISA bus, making that memory much slower than spinning disk
drives, and degrading the overall performance of the system.
2.2 Method of Testing
Power consumption measurements were taken by monitoring the current consumed by each
module. Each module was tested at a constant 7.2 volts. The current was measured by a multimeter
at intervals of 400 ms. The multimeter output all its measurements over a serial link, through which
the measurements were recorded. Using this equipment, an accurate measurement can be taken of
the current flowing through the device (and thus, the power consumed) at any point in time.
Appendix D has a typical graph of power consumption over time.
The parts of the module that contribute to power consumption are the Cardio module
(which includes the processor, memory, and support chipsets), the IDE drive, the sound chip, and
the serial ports. Although it is possible only to measure the power consumption of the module as a
whole, the global power consumption statistics will yield clues as to how much power each part is
consuming.
Performance can be quantified in many different ways. For this experiment, it is considered
in terms of how quickly the end-user sees results after initiating a transaction - the less latency that
12
the end-user perceives, the better. This means that the performance of the system actually takes into
account various factors: the speed of the processor and memory, the latency of the application task,
the communications overhead, and the latency of the system controller. Improving any one of these
factors will in turn improve the overall performance of the system. However, the only factor that
can be changed is the speed of the processor and memory.
The power and performance measurements were taken using a body of 10 English test
sentences for the Recognizer and Translator, and their 10 Croatian translations for the Synthesizer.
These sentences were chosen so that each application would have sentences of varying difficulty to
interpret. The additional Swapping measurements were taken using an additional body of 24
sentences sent to the Translator in rapid-fire succession.
2.3 Configurations Tested
It is necessary to keep the Smart Module server software consistent across all the
configurations tested for the sake of comparison. However, there are different hardware
parameters that can be modified in order to test the effect of various factors on power consumption
and performance:
¯ Cardio Cards:
Different Cardio cards were used in the Smart Module system to analyze the effect of
processor type, system speed, and memory on the performance of the system. These cards are
summarized in Table 1.
13
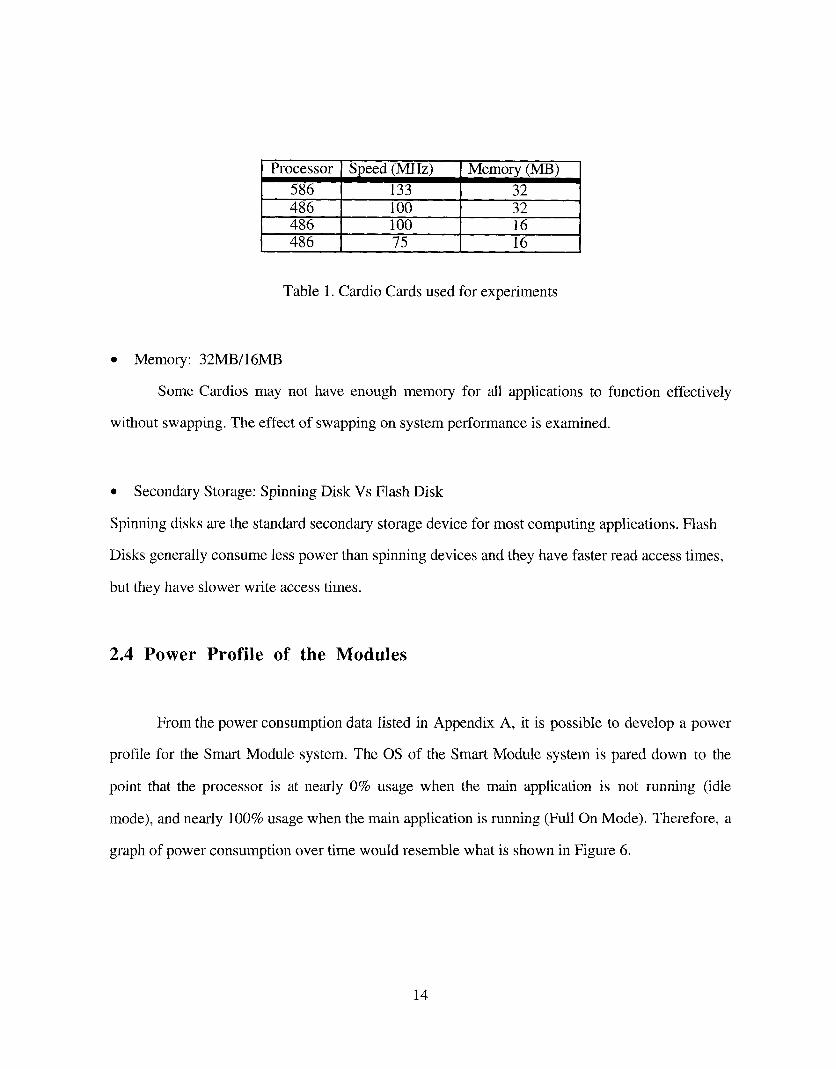
Processor586486486486
Speed(MHz) Memory(MB)133 32100 32100 1675 16
Table 1. Cardio Cards used for experiments
¯ Memory: 32MB/16MB
Some Cardios may not have enough memory for all applications to function effectively
without swapping. The effect of swapping on system performance is examined.
¯ Secondary Storage: Spinning Disk Vs Flash Disk
Spinning disks are the standard secondary storage device for most computing applications. Flash
Disks generally consume less power than spinning devices and they have faster read access times,
but they have slower write access tfines.
2.4 Power Profile of the Modules
From the power consumption data listed in Appendix A, it is possible to develop a power
profile for the Smart Module system. The OS of the Smart Module system is pared down to the
point that the processor is at nearly 0% usage when the main application is not running (idle
mode), and nearly 100% usage when the main application is running (Full On Mode). Therefore,
graph of power consumption over time would resemble what is shown in Figure 6.
14

Power (W)Idle
Suspend
FullOn
Idle
Time
Figure 6. Model of Power Consumption over Time
According to this model, each module has three states that apply to Power Consumption:
Suspend, Idle, and Full On. Each state has an approximate power consumption value associated
with it. In addition, each state transition has a latency value (in seconds) associated with it. This
state diagram is depicted in Figure 7.
Figure 7. Power Consumption States of Smart Module System
15
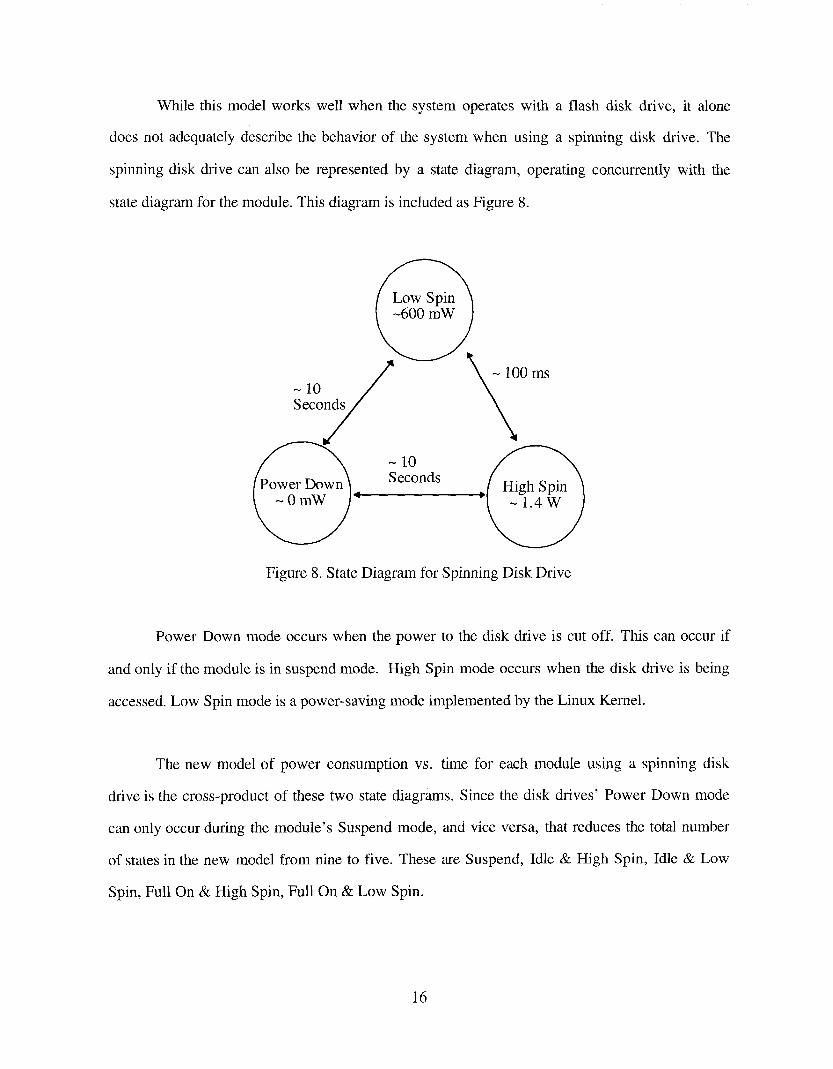
While this model works well when the system operates with a flash disk drive, it alone
does not adequately describe the behavior of the system when using a spinning disk drive. The
spinning disk drive can also be represented by a state diagram, operating concurrently with the
state diagram for the module. This diagram is included as Figure 8.
Figure 8. State Diagram for Spinning Disk Drive
Power Down mode occurs when the power to the disk drive is cut off. This can occur if
and only if the module is in suspend mode. High Spin mode occurs when the disk drive is being
accessed. Low Spin mode is a power-saving mode implemented by the Linux Kernel.
The new model of power consumption vs. time for each module using a spinning disk
drive is the cross-product of these two state diagrams. Since the disk drives’ Power Down mode
can only occur during the module’s Suspend mode, and vice versa, that reduces the total number
of states in the new model from nine to five. These are Suspend, Idle & High Spin, Idle & Low
Spin, Full On & High Spin, Full On & Low Spin.
16
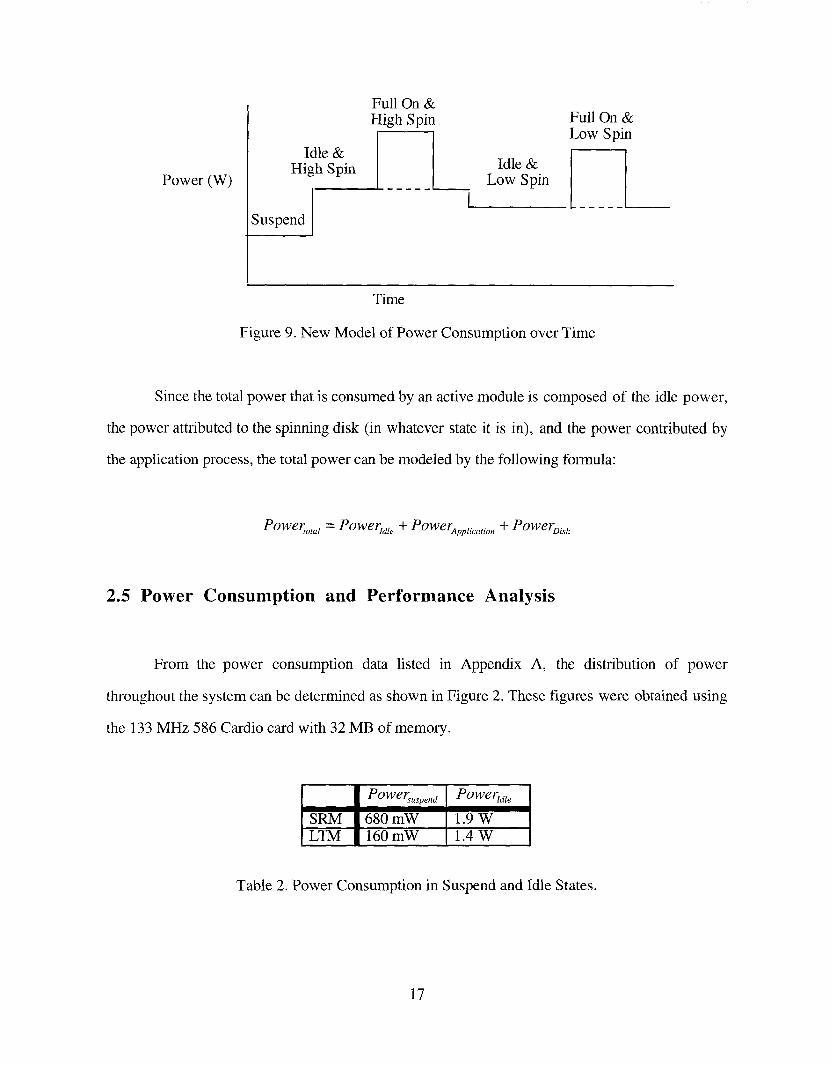
Power(W)
Idle &High Spin
Suspend
Full On &High Spin
I l_ ..... Idle &Low Spin
Full On &Low Spin
Time
Figure 9. New Model of Power Consumption over Time
Since the total power that is consumed by an active module is composed of the idle power,
the power attributed to the spinning disk (in whatever state it is in), and the power contributed
the application process, the total power can be modeled by the following formula:
2.5 Power Consumption and Performance Analysis
From the power consumption data listed in Appendix A, the distribution of power
throughout the system can be determined as shown in Figure 2. These figures were obtained using
the 133 MHz 586 Cardio card with 32 MB of memory.
Powe~us~,~ndPowertdte
SRM 680 mW 1.9 WLTM 160mW 1.4 W
Table 2. Power Consumption in Suspend and Idle States.
17

The Smart Modules consume their absolute minimum amount of power while they are in
suspend mode, when they consume a mere 160 mW. While the system is running, but idle, about
1.48 W of power could be directly attributed to the Cardio card and various support chips.
As the SRM module is currently designed, the sound chip is always activated, even when
the module is in suspend mode, and it always consumes a minimum of 500 mW. This means that
the SRM, even when in suspend mode, consumes 660-680 mW. This makes a significant
difference in terms of how long a module can be suspended without changing batteries.
While the module is in its idle mode, it consumes a minimum of 1.4 W. Again, with the
sound chip on, the SRM will consume a minimum of about 1.9 W in idle mode. These figures
were measured while each module was idle and running off the Flash disk drives.
SRMLTM
Low S~in High Spin0.6 W 1.2 W0.6 W 0.9 W
Table 3. Power~i.~,~ during Idle Loop (133 MHz 586 w/32 MB RAM)
The spinning drive consumes between 0.9 W and 1.2 W of power while it is spinning, as
shown in Table 3. This can bring the total idle power consumption, Poweria~e + Powerz)i,,~, to a
maximum of 3.1 W for the SRM when the drive is in full spin mode.. The spinning drive has the
ability to partially spin down, however, and save approximately 400 mW to 600 mW when it is in
this low-spin state.
Finally, the applications themselves consume a certain amount of power, PowerAp~ticatio,~, as
shown in Table 4.
18
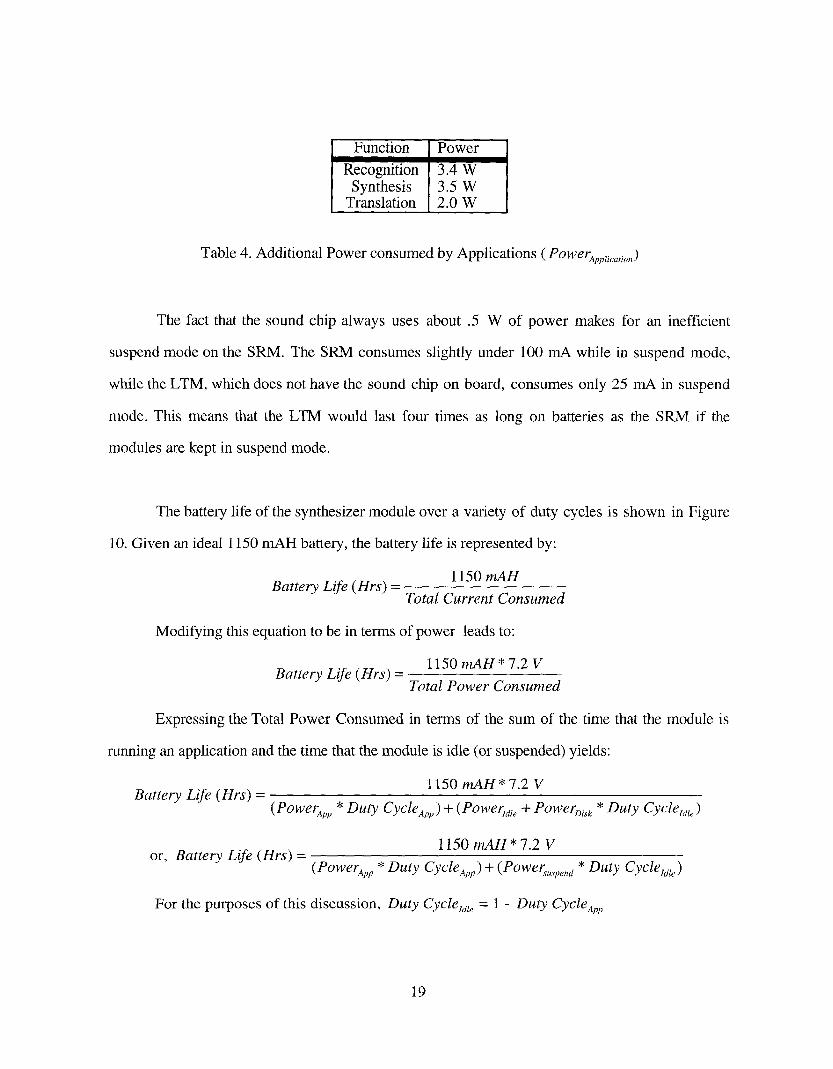
Function Power
Recognition 3.4 WSynthesis 3.5 W
Translation 2.0 W
Table 4. Additional Power consumed by Applications (PowerApp~c,,~on)
The fact that the sound chip always uses about .5 W of power makes for an inefficient
suspend mode on the SRM. The SRM consumes slightly under 100 mA while in suspend mode,
while the LTM, which does not have the sound chip on board, consumes only 25 mA in suspend
mode. This means that the LTM would last four times as long on batteries as the SRM if the
modules are kept in suspend mode.
The battery life of the synthesizer module over a variety of duty cycles is shown in Figure
10. Given an ideal 1150 mAH battery, the battery life is represented by:
Battery Life ( Hrs) 1150 mAH
Total Current Consumed
Modifying this equation to be in terms of power leads to:
Battery Life ( Hrs) 1150 mAH * 7.2 V
Total Power Consumed
Expressing the Total Power Consumed in terms of the sum of the time that the module is
running an application and the time that the module is idle (or suspended) yields:
Battery Life ( Hrs) 1150 mAH * 7.2 V
( PowerApp * Duty CycleApp) + ( Power~ie + Power~isk * Duty Cycle1~e
or, Battery Life (Hrs) 1150 mAH * 7.2 V
( PowerApp * Duty CyCleApp) q- ( Power,~..~pen a * Duty Cycletaie)
For the purposes of this discussion, Duty Cyclezez~ = 1 - Duty CycleApp
19

14
12
0
Battery Life Of Synthesizer Module
Duty Cycle
~High Spin ~Low Spin ......... Flash Disk ..................SuspendModeI
Figure 10. Battery Life of Synthesizer Module using 1150 mAH battery
The vastly reduced power dissipation and performance characteristics of flash technology
for secondary storage make it an obvious choice for wearable devices, even considering the high
cost of flash disks. While using flash memory does not affect the modules’ power dissipation
while sleeping, it does reduce power during operation, and increase battery life, as seen in Figure
10. This data indicates that when the module is performing only Speech Synthesis with a 20% duty
cycle, using a flash disk will extend the life of a 1150 rnAH battery by approximately 33% over a
spinning disk drive. It should be noted, however, that if the drive is configured to spin down at
certain times, then the actual battery life of the spinning disk drive in the above graph will be
somewhere between the High Spin and the Low Spin curves.
The effect of the use of the Suspend Mode can also be seen on the graph. With this curve,
the Duty Cycle refers to the amount of time the application is running vs. time in suspend mode.
20

By clever utilization of Suspend Mode features in module design, the effective life of a module on
one battery can increase to almost 5 hours with a 20% duty cycle, and this value can go up to 6 1/2
hours if the sound chip is not powered while in suspend mode.
While the Advanced Power Management that is included in each Cardio system enables the
module to control when it goes to sleep, it should not affect power while the unit is awake.
However, when certain types of legitimate APM calls are used, it was found that the module will
actually consume more power when it is idle then when it is running an application. This is
apparently because the Cardio does not correctly implement the CPU Idle call in the AMP
specification [3]. If the Linux AMP driver makes these calls when the CPU is idle, as indicated in
the specification, the idle power actually goes up from about 2.8 W (in High Spin mode) to close
to 6W.
LTM with CPU Idle Calls
6
5.5
4.5
4
3.5
3
2.5
Time (400 ms intervals)
LTM without CPU IdleCalls
5
4.5
2.5
2
Time (400 ms intervals)
Figure 11. Effect of CPU IDLE calls on Power Consumption
21
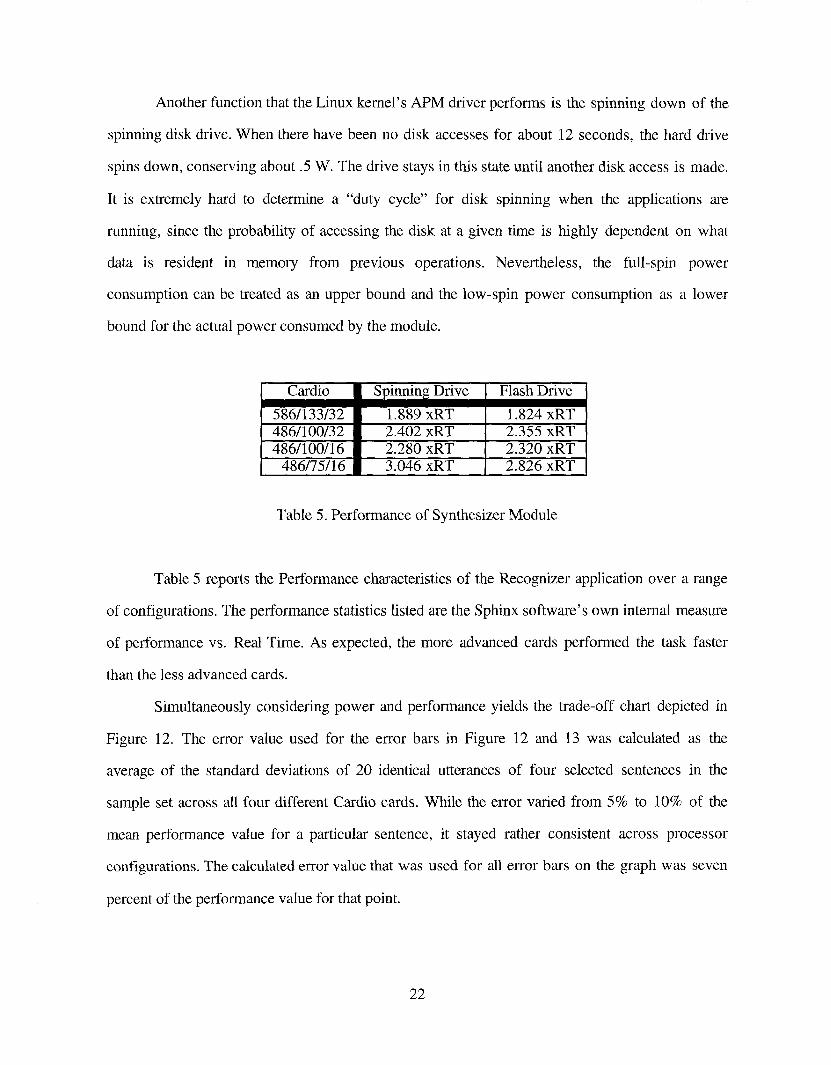
Another function that the Linux kernel’s APM driver performs is the spinning down of the
spinning disk drive. When there have been no disk accesses for about 12 seconds, the hard drive
spins down, conserving about .5 W. The drive stays in this state until another disk access is made.
It is extremely hard to determine a "duty cycle" for disk spinning when the applications are
running, since the probability of accessing the disk at a given time is highly dependent on what
data is resident in memory from previous operations. Nevertheless, the full-spin power
consumption can be treated as an upper bound and the low-spin power consmnption as a lower
bound for the actual power consumed by the module.
Cardio
586/133/32486/100/32486/100/16
486/75/16
Spinning Drive Flash Drive!
1.889 xRT 1.824 xRT2.402 xRT 2.355 xRT2.280 xRT 2.320 xRT3.046 xRT 2.826 xRT
Table 5. Performance of Synthesizer Module
Table 5 reports the Performance characteristics of the Recognizer application over a range
of configurations. The performance statistics listed are the Sphinx software’ s own internal measure
of performance vs. Real Time. As expected, the more advanced cards performed the task faster
than the less advanced cards.
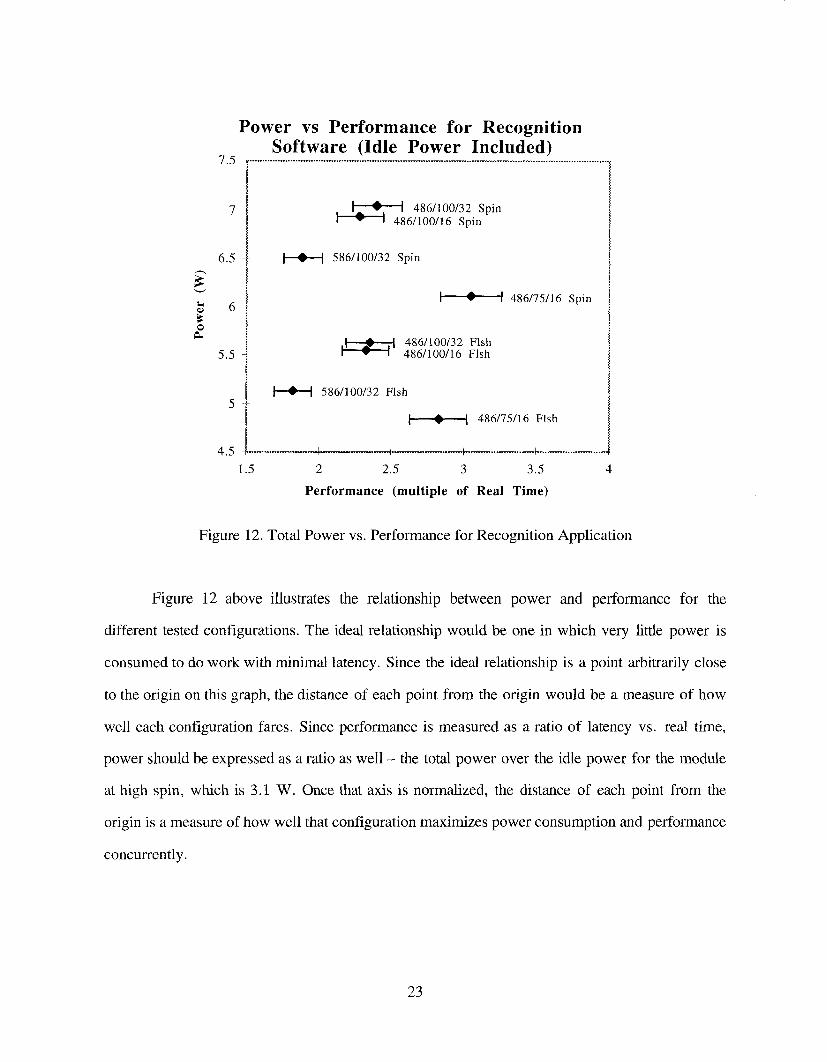
Simultaneously considering power and performance yields the trade-off chart depicted in
Figure 12. The error value used for the error bars in Figure 12 and 13 was calculated as the
average of the standard deviations of 20 identical utterances of four selected sentences in the
sample set across all four different Cardio cards. While the error varied from 5% to 10% of the
mean performance value for a particular sentence, it stayed rather consistent across processor
configurations. The calculated error value that was used for all error bars on the graph was seven
percent of the performance value for that point.
22
Power vs Performance for RecognitionSoftware (Idle Power Included)
6.5
5.5
~~48 486/100/32 Spin6/100/16 Spin
586/100/32 Spin
486/75/16 Spin
486/100/32 Flsh486/100/16 Flsh
586/100/32 Flsh
[ ~. [ 486/75/16 Fish
2 2.5 3 3.5
Performance (multiple of Real Time)
Figure 12. Total Power vs. Performance for Recognition Application
Figure 12 above illustrates the relationship between power and performance for the
different tested configurations. The ideal relationship would be one in which very little power is
consumed to do work with minimal latency. Since the ideal relationship is a point arbitrarily close
to the origin on this graph, the distance of each point from the origin would be a measure of how
well each configuration fares. Since performance is measured as a ratio of latency vs. real time,
power should be expressed as a ratio as well - the total power over the idle power for the module
at high spin, which is 3.1 W. Once that axis is normalized, the distance of each point from the
origin is a measure of how well that configuration maximizes power consumption and performance
concurrently.
23
Power vs
2.3
2.2
2.1
2
1.9
1.8
1.7
1.6
1.5
Performance for RecognitionSoftware (Normalized to Idle Power)
[ ¯ ’, 486/100/32 Spin~ 486/100/16 Spin
586/100/32 Spin
486/75/16 Spin
486/100/32 Fish486/100/16 Fish
586/100/32 Flsh
] @ ~ 486/75/16 Fish
1.5 2 2.5 3 3.5 4
Performance (multiple of Real Time)
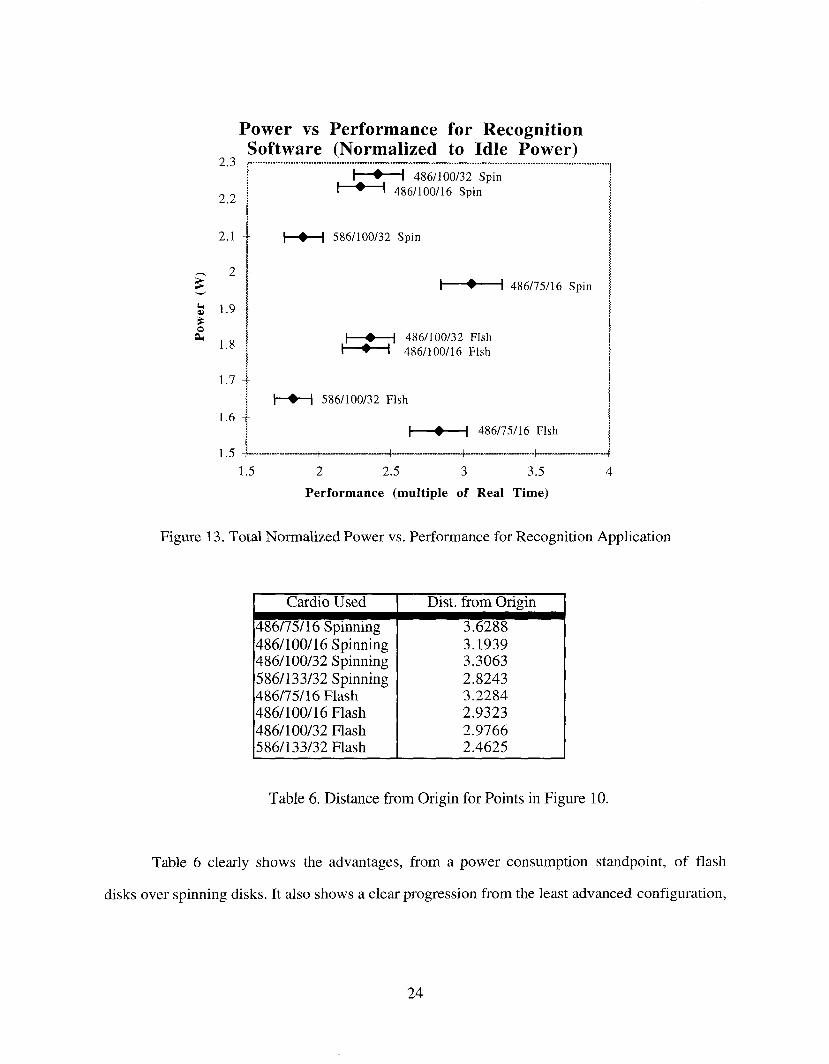
Figure 13. Total Normalized Power vs. Performance for Recognition Application
Cardio Used
486/75/16 Spinning486/100/16 Spinning486/100/32 Spinning586/133/32 Spinning486/75/16 Flash486/100/16 Flash486/100/32 Flash586/133/32 Flash
Dist.~omOfigin
3.62883.19393.30632.82433.22842.93232.97662.4625
Table 6. Distance from Origin for Points in Figure 10.
Table 6 clearly shows the advantages, from a power consumption standpoint, of flash
disks over spinning disks. It also shows a clear progression from the least advanced configuration,
24
the 75 MHz 486/16, to the most advanced card, the 133 MHz 586/133/32, in terms of power
consumption and performance.
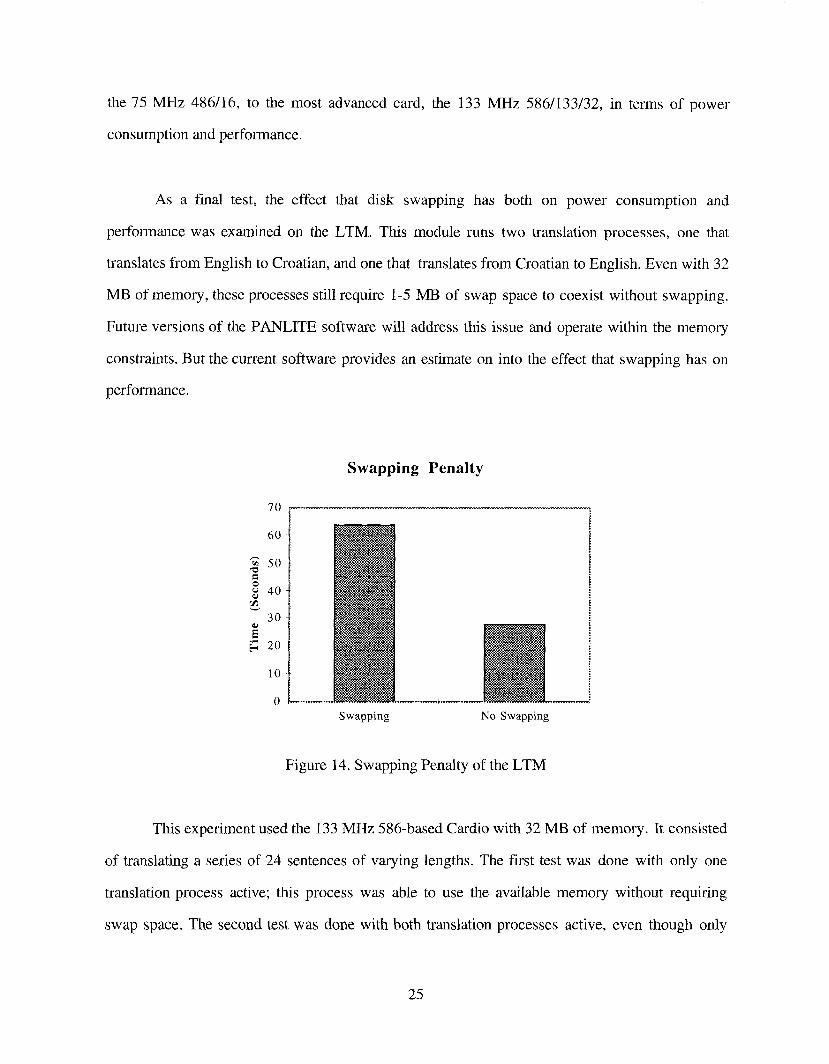
As a final test, the effect that disk swapping has both on power consumption and
performance was examined on the LTM. This module runs two translation processes, one that
translates from English to Croatian, and one that translates from Croatian to English. Even with 32
MB of memory, these processes still require 1-5 MB of swap space to coexist without swapping.
Future versions of the PANLITE software will address this issue and operate within the memory
constraints. But the current software provides an estimate on into the effect that swapping has on
performance.
Swapping Penalty
7O
60
~" 50
~ 40
30
N 20
10
Swapping No Swapping
Figure 14. Swapping Penalty of the LTM
This experiment used the 133 MHz 586-based Cardio with 32 MB of memory. It consisted
of translating a series of 24 sentences of varying lengths. The first test was done with only one
translation process active; this process was able to use the available memory without requiring
swap space. The second test was done with both translation processes active, even though only
25

one was used. With both processes active, about 5 MB of disk space was actively used as swap
space. The effect of swapping on the system was dramatic - although the average power
consumption of the system decreased by 4%, the running time of the experiment more than
doubled.
26

Section 3
Performance Forecasting
Now that the performance and power consumption of these systems has been determined
and analyzed, the next logical step would be to develop a model to predict power and performance
values for potential new systems before actually porting the applications to these platforms. This
would be a good way to test candidate platforms before implementation of the solution.
Power consumption is a bit easier to predict than performance. While applications are
running, they will consume as much processor and system resources as they can possibly use. To
determine the maximum power, a benchmark should be run that activates every resource the
processor has, and the result will be a reasonable upper-bound on power consumption. The
benchmark used should be chosen such that any peripherals used by the application also experience
full utilization. Actual power consumption will be determined by how efficient the memory system
is, as well as the duty cycle of the application.
But determining performance across processor generations and families can be a difficult
task. Synthetic benchmarks are a useful tool in determining performance. However, synthetic
benchmarks often use narrow, restrictive algorithms that, at best, can never truly mimic the
performance of a specific application or, at worst, take advantage of an architectural feature that
would go unnoticed in a real application, giving misleading numbers. However, since the smart
module applications are computing-intensive, a synthetic benchmark would serve as a good first-
order approximation of potential performance.
27
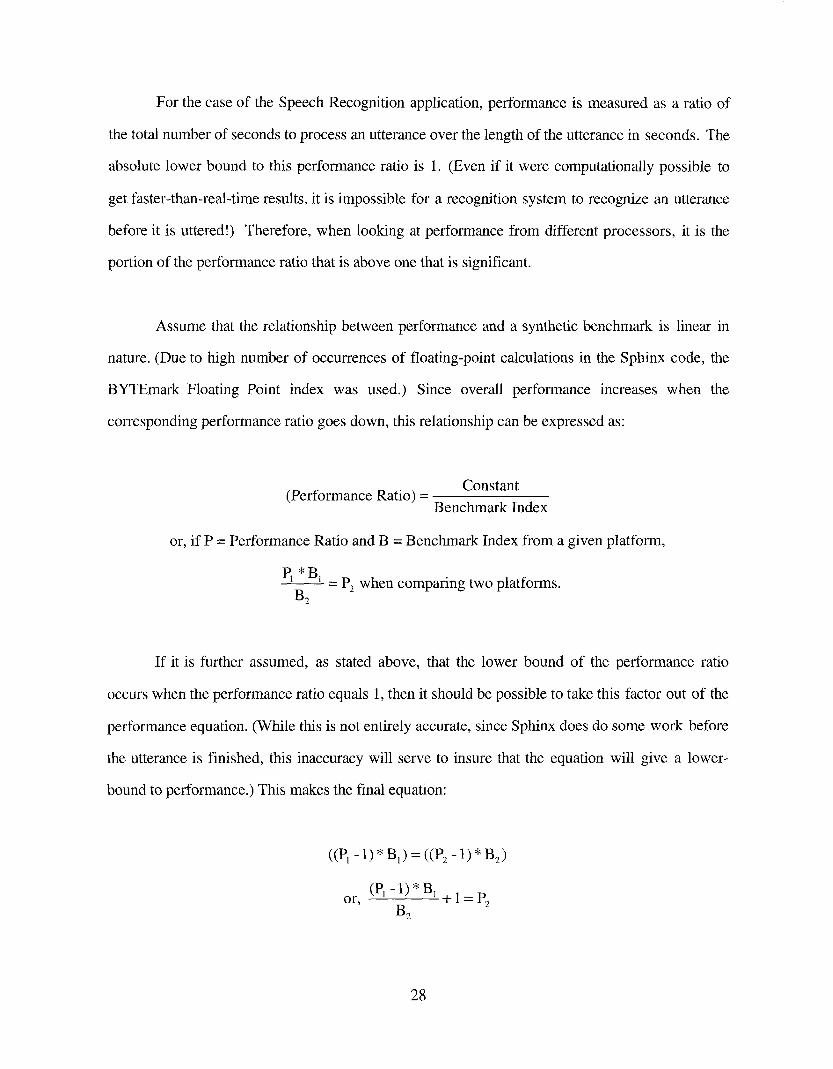
For the case of the Speech Recognition application, performance is measured as a ratio of
the total number of seconds to process an utterance over the length of the utterance in seconds. The
absolute lower bound to this performance ratio is 1. (Even if it were computationally possible to
get faster-than-real-time results, it is impossible for a recognition system to recognize an utterance
before it is uttered!) Therefore, when looking at performance from different processors, it is the
portion of the performance ratio that is above one that is significant.
Assume that the relationship between performance and a synthetic benchmark is linear in
nature. (Due to high number of occurrences of floating-point calculations in the Sphinx code, the
BYTEmark Floating Point index was used.) Since overall performance increases when the
corresponding performance ratio goes down, this relationship can be expressed as:
(Performance Ratio) Constant
Benchmark Index
or, if P = Performance Ratio and B = Benchmark Index from a given platform,
Pl * B1 _ P2 when comparing two platforms.
B2
If it is further assumed, as stated above, that the lower bound of the performance ratio
occurs when the performance ratio equals 1, then it should be possible to take this factor out of the
performance equation. (While this is not entirely accurate, since Sphinx does do some work before
the utterance is finished, this inaccuracy will serve to insure that the equation will give a lower-
bound to performance.) This makes the final equation:
((P~- 1) * B,) = ((P2-1)
(P1 - 1) * or, ~-I=P2B2
28

Using this equation, and using the performance statistics from the 486-based 75-MHz
Cardio as a basis, Figure 15 predicts performance over a range of actual BYTEmark FP index
values.
While this does serve as a rather crude approximation, it is an upper bound for the
measured value of performance vs. real time, as denoted by the boxes being below the predicted
curve. The error bars on the curve represent the seven percent experimental measured variation that
was observed in Section 2.5. If the relationship between performance and the benchmark index is
proved to be non-linear on a particular platform, then this equation may have to be modified. But at
least for the tested platforms, this equation can be used to give a first-order approximation of
Recognizer performance.
Predicting Performance of Recognizer
3.5000
3.0000
"-~ 2.5000
~ 2.0000
1.5000
4~5/16
486/10~
1.0000 + 4 ~0.200 0.250 0.300 0.350 0.400 0.450 0.500
BYTEmark FP Index
Figure 15. Predicting the Performance of the Recognizer Applicationusing Synthetic Benchmarks.
29
Section 4
Summary
4.1 Conclusions
Power consumption and performance are key design goals for wearable systems. And even
though it is easy to maximize one at the expense of the other, it is possible to improve on both
concurrently.
Memory size and type of secondary storage have a great impact on the power consumption
and performance of these systems. If main memory is not large enough to hold the working sets of
all applications without swapping, then the performance of the overall system could be cut by more
than half. If flash cards are used for secondary storage, then the overall power consumption of the
system could be improved by as much as 20%.
Of potentially more importance is the ability to test future hardware platforms for their
fitness to host applications for wearable systems before actually porting the applications. The
methods outlined in Section 3 will give a good first-order approximation for the performance that
the Speech Recognizer application might achieve on a new platform.
4.2 Future Work
There are some simple ways this work can be extended: future modules should have a way
to disable peripheral chips like the Sound chip when the module enters the suspend state, reducing
30

the power consumed while suspended. And it would be interesting to see how the system performs
when the Translator is modified so swapping does not occur when two translators attempt to share
32 Megabytes of RAM.
Larger flash cards will be available soon, and when they arrive it will be possible to
examine the benefit of flash technology on the Translation and Synthesis applications.
But the real challenge that lies ahead is not just to continue optimizing performance of these
modules, but to integrate them into some of the other wearable computing projects that are
organized by the Institute for Complex Engineered Systems. The System Controller process does
not require much processing power to operate, and can be easily integrated into an existing
wearable system. Then, when a user needs "expert knowledge" such as Language Translation or
Speech Synthesis, he or she can just plug in the proper module and have access to that knowledge
in any remote location.
31
Appendix A
Experimental Results
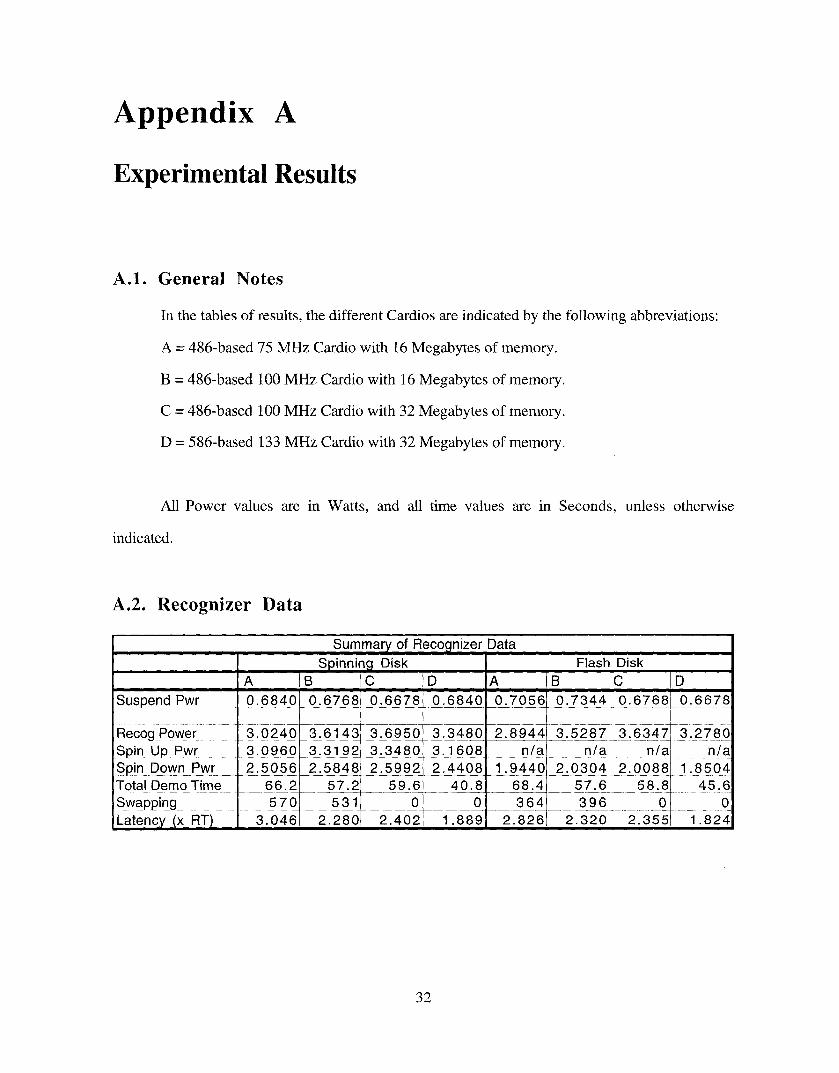
Aolo General Notes
In the tables of results, the different Cardios are indicated by the following abbreviations:
A = 486-based 75 MHz Cardio with 16 Megabytes of memory.
B = 486-based 100 MHz Cardio with 16 Megabytes of memory.
C = 486-based 100 MHz Cardio with 32 Megabytes of memory.
D = 586-based 133 MHz Cardio with 32 Megabytes of memory.
All Power values are in Watts, and all time values are in Seconds, unless otherwise
indicated.
A.2. Recognizer Data
Summary of Reco£1nizer DataSpinnin£1 Disk Flash Disk
A B iC D A B C DS~s_pendPw[ _ 0.6840 0.6768! 0.6678 0..68~4_0. 0.~_7~05~6~0~.7~3~_4 _0_.6768, .0..6678
~#iq~Pwr_ 3.0960 3.3192 3.3480 3.1608 n/a n/a~ .#/a #~’Spin Down Pwr 2.5056 2.5848 2.5992 2.4408 1.9440 2.0304 2.0088 1.8504TotaJ De~£ Time 66.2 57.2[ 59.6 40.8 68.4 57.6 58.8 45.6
Latency (x RT) 3.046 2.280~ 2.402 1.889 2.826 2.320] 2.355 1.824
32

Ao3, Synthesizer Data
Max PwrMin PwrA~vg Demo PwrTotal Demo Time
Summar)/of S~/nthesizer Data’A IB IC D
6.876 7.7760 7.7616 7.0920[_3.1_6_.0__8 3.3192_ 3.3264_ 3_~3!9~
6.274 6.2072 7.4880 6.745070 59.21 54.4 34.0
A.4. Translator Data
The Translator Module was not able to function correctly with the 16MB cards when both
translators were active at the same time, so all measurements were taken with the 32 MB cards.
Summary/of Translator DataC D
Suspend PwrMax PwrMin PwrAvg Demo PwrTotal Demo Time
0.1632~ 0.15844 ’9-52. 4.80962.9952 2.82244.0006 3.7975
641 63.6
Swapping Experiment1~ Swap iW/Swap
Max Pwr 6.372 5.0904Min Pwr 2.8008 2.808_A%g Demo PwrTotal Demo Time
3.9868 3.836928.4 64
33

Appendix B
Demo Sentence Set
B.1. Sentences for Main Experiment
These are the sentences that are used for the Recognizer and Translator experiments, along
with their Croatian translations that are used in the Synthesizer experiment. All translations are
obtained directly from the PANLITE translator. While the Translator should process these
sentences with little difficulty, the current version of the Synthesizer has trouble with some of the
Croatian words. Also, the Recognizer generally has an easier time recognizing the earlier sentences
than the later sentences, since the earlier sentences are present in the Language Model of Sphinx.
Are there any mine fields on this map?
Ima li ikakvih minskih polja na ovoj mapi li?
Has anyone been hurt by mine explosions?
Nekoga bio pouredzen u svoje eksplozijama li?
Please show me on this map.
Molim vas poka~ite mi na ovoj mapi.
Speak into the microphone more slowly.
Govorite u mikrofon jo~ sporo.
It is important that we locate landmines.
Va~no je va~no se locirati zakopane mine.
How long are you staying in this town?
Koliko fete se zadrzati u ovom gradu li?
34
Who can I speak with about that?
Mo~e dane razgovara sa oko je li?
How much is that worth?
Koliko je taj vrednost li?
Why are you here?
Zagto se vas ovdje li?
When will he return?
Kad 6e on izbjeglica li?
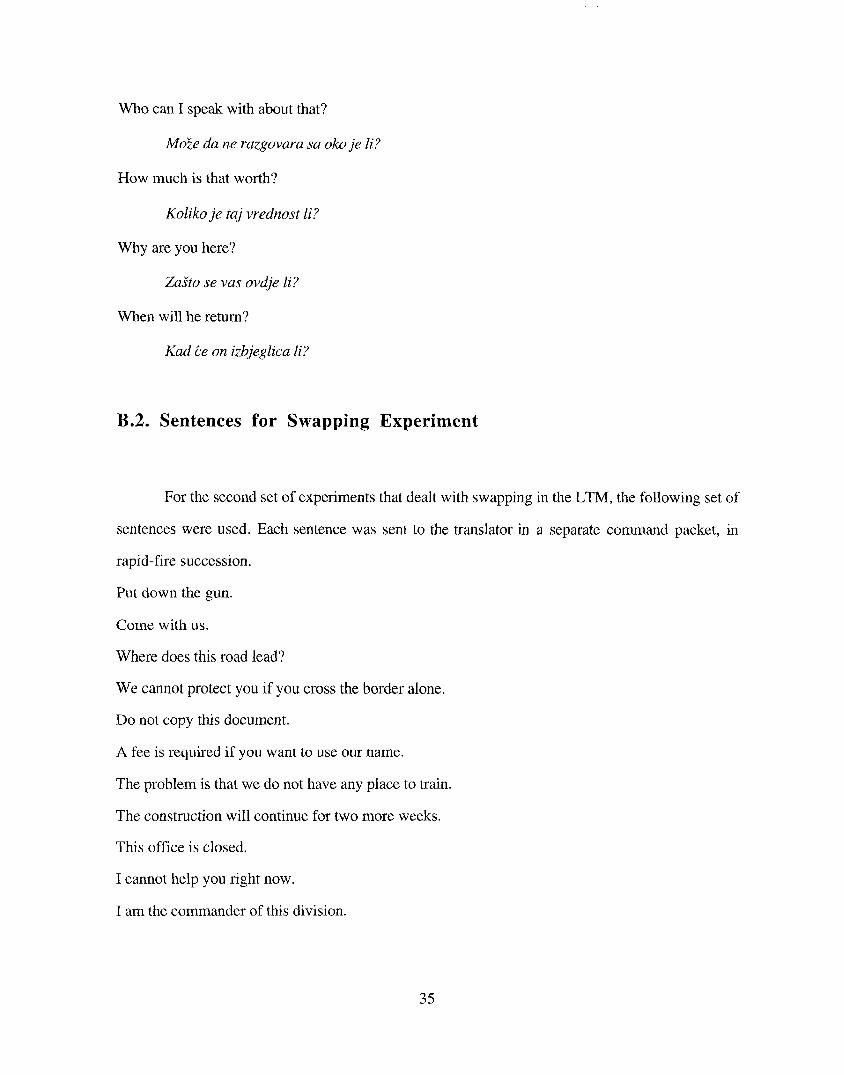
B.2. Sentences for Swapping Experiment
For the second set of experiments that dealt with swapping in the LTM, the following set of
sentences were used. Each sentence was sent to the translator in a separate command packet, in
rapid-fire succession.
Put down the gun.
Come with us.
Where does this road lead?
We cannot protect you if you cross the border alone.
Do not copy this document.
A fee is required if you want to use our name.
The problem is that we do not have any place to train.
The construction will continue for two more weeks.
This office is closed.
I cannot help you right now.
I am the commander of this division.
35

I am not carrying any weapons.
This is a camera.
Direct all your complaints to my commanding officer in Sarajevo.
Please tell us where the minefield is.
Read this report for your own safety.
If we do not succeed, we risk failure.
Please do not touch the equipment.
It is very sensitive.
We do not accept dinars as currency.
I do not know your cousin in the United States.
How much are these cigarettes?
I will give you this pack of cigarettes if you stop bothering us.
Turn around and lie on the ground.
36

Appendix C
Power Consumption Over Time
C.1. Typical Power Consumption Graph
The following graph illustrates the power consumption of one module configuration over
time. (This example used the 586-based card running at 133 MHz with 32 Megs of memory and
spinning disk drive.) Here, many of the power-related events discussed in the paper can be seen
graphically, along with a discussion of their relevance.
¯ Ticks 1-12: The module is in sleep mode, consuming approximately 680 mW.
¯ Ticks 13-35: The TCP/IP connection is established. While this appears to contribute
substantially to the power consumed in the system, most of the power consumption in this area
can be attributed instead to bringing the system out of suspend mode and spinning up the HD
from rest.
¯ Ticks 36-78: As the experiment starts with the ten sentences listed in Appendix B, we see that
the hard drive is in Full Spin Mode here, consuming 3.16 W when idle.
¯ Ticks 79-149: The Hard Drive spins down in the middle of sentence #2. The module now
consumes 2.4 W when idle.
¯ Ticks 150 - 278: As the experiment continues, the hard drive spins up at tick 150 and down
again at tick 184.
¯ Ticks 278-279: This spike is attributed to closing the TCP link.
¯ Ticks 280-305: Closing the TCP link caused the drive to spin up again.
37

Cardio D with Spinning Disk
7
6
Time (400 ms Ticks)
Figure C- 1. Power Consumption of Synthesizer Module over time
38

Bibliographly
[ 1] C.K. Christakos. Optimizing a Language Translation Application for Mobile Use. Master’s
Project, Carnegie Mellon University, 1997.
[2] J. Dorsey. "Smart Module Networking", personal communication, 1998.
[3] Intel Corporation and Microsoft Corporation. APM BIOS Interface Specification
Revision 1.2, 1996
[4] R. E. Frederking and R. Brown. The Pangloss-lite machine translation system. Expanding MT
Horisons: Proceedings of the Second Conference of the Association for Machine
Translation in the Americas, pages 268-272, 1996.
[5] Ravishankar, M., Efficient Algorithms for Speech Recognition. Ph.D Thesis, Carnegie Mellon
University, May 1996, Tech Report. CMU-CS-96-143
[6] Rosch, W. The Winn L. Rosch Hardware Bible, Third Edition. Sams Publishing, Indiana,
1994.1
[7] Epson Corporation. Epson CARDIO 486-D4 Data Sheet, 1997.
39