Power analysis for the Bootstrap Likelihood Ratio Test for...
19
1 Power analysis for the Bootstrap Likelihood Ratio Test for the Number of Classes in Latent Class Models Fetene B. Tekle 1 , Dereje W. Gudicha 2 and Jeroen K. Vermunt 2 Abstract Latent class (LC) analysis is used to construct empirical evidence on the existence of latent subgroups based on the associations among a set of observed discrete variables. One of the tests used to infer about the number of underlying subgroups is the bootstrap likelihood ratio test (BLRT). Although power analysis is rarely conducted for this test, it is important to identify, clarify, and specify the design issues that influence the statistical inference on the number of latent classes based on the BLRT. This paper proposes a computationally efficient `short-cut’ method to evaluate the power of the BLRT, as well as presents a procedure to determine a required sample size to attain a specific power level. Results of our numerical study showed that this short-cut method yields reliable estimates of the power of the BLRT. The numerical study also showed that the sample size required to achieve a specified power level depends on various factors of which the class separation plays a dominant role. In some situations, a sample size of 200 may be enough, while in others 2000 or more subjects are required to achieve the required power. Key words: Bootstrap, Latent Class Models, Likelihood ratio test, Power, Sample size 1. Introduction Latent class (LC) models as developed by Lazarsfeld and Henry (1968) are used by social and behavioural scientists as a statistical method for building typologies, taxonomies, and classifications based on relevant observed characteristics of the subjects under study. With the advances in statistical computing, more researchers have become interested in the application of LC analysis in recent years. The application of LC analysis is notable in social and behavioural sciences (e.g., Genge 2014; and Leask et al. 2009), in medicine (e.g., Rindskopf 2002), and marketing (e.g., Zenor and Srivastava 1993, and Dias and Vermunt 2007). Using LC analysis, researchers can assemble empirical evidence on possible latent subgroups or classes of individuals based on the association 1 Correspondence should be addressed to Fetene B. Tekle, Department of Nonclinical Statistics & Computing, Janssen Research & Development, Beerse, Belgium, E-mail: [email protected] . 2 Department of Methodology and Statistics, Tilburg University, The Netherlands.
Transcript of Power analysis for the Bootstrap Likelihood Ratio Test for...

1
Power analysis for the Bootstrap Likelihood Ratio Test for the
Number of Classes in Latent Class Models
Fetene B. Tekle
1, Dereje W. Gudicha
2 and Jeroen K. Vermunt
2
Abstract Latent class (LC) analysis is used to construct empirical evidence on the existence of latent
subgroups based on the associations among a set of observed discrete variables. One of the tests
used to infer about the number of underlying subgroups is the bootstrap likelihood ratio test
(BLRT). Although power analysis is rarely conducted for this test, it is important to identify,
clarify, and specify the design issues that influence the statistical inference on the number of latent
classes based on the BLRT. This paper proposes a computationally efficient `short-cut’ method to
evaluate the power of the BLRT, as well as presents a procedure to determine a required sample
size to attain a specific power level. Results of our numerical study showed that this short-cut
method yields reliable estimates of the power of the BLRT. The numerical study also showed that
the sample size required to achieve a specified power level depends on various factors of which the
class separation plays a dominant role. In some situations, a sample size of 200 may be enough,
while in others 2000 or more subjects are required to achieve the required power.
Key words: Bootstrap, Latent Class Models, Likelihood ratio test, Power, Sample size
1. Introduction
Latent class (LC) models as developed by Lazarsfeld and Henry (1968) are used by social and
behavioural scientists as a statistical method for building typologies, taxonomies, and classifications
based on relevant observed characteristics of the subjects under study. With the advances in
statistical computing, more researchers have become interested in the application of LC analysis in
recent years. The application of LC analysis is notable in social and behavioural sciences (e.g.,
Genge 2014; and Leask et al. 2009), in medicine (e.g., Rindskopf 2002), and marketing (e.g., Zenor
and Srivastava 1993, and Dias and Vermunt 2007). Using LC analysis, researchers can assemble
empirical evidence on possible latent subgroups or classes of individuals based on the association
1 Correspondence should be addressed to Fetene B. Tekle, Department of Nonclinical Statistics &
Computing, Janssen Research & Development, Beerse, Belgium, E-mail: [email protected].
2 Department of Methodology and Statistics, Tilburg University, The Netherlands.

2
among the observed discrete variables. Unless being pre-specified based on theoretical grounds,
determining the number of latent classes K is part of the empirical data analysis. A popular
approach is to fit models with different numbers of classes and compare these models using
information criteria (IC) such as the Akaike’s IC (Akaike 1974), the Bayesian IC (Schwarz 1978),
or one of their modified versions, where the model with the lowest value for the information criteria
is selected. One of the problems associated with the use of information criteria is that they may
point at different numbers of classes, for example, the Akaike IC may suggest a 4 class model while
the Bayesian IC suggests a 3 class model.
Another approach to compare models with different number of classes is by means of a
likelihood ratio test (LRT), which tests whether a model with 1K classes fits significantly better
than a model with K classes. The LRT considers the log likelihood difference of nested models as a
test statistic, which under certain regularity conditions asymptotically follows a central chi-square
distribution with degrees of freedom equal to the difference in the number of parameters of the two
nested models. One of the regularity conditions is that the parameter restrictions under the null
model must be an interior point (and thus not a boundary) of the permissible region of parameters
(Steiger et al. 1985; Shapiro 1985). However, as pointed by Wolfe (1970), Hartigan (1977), Everitt
(1981), Holt and Macready (1989), Bock (1996), and McLachlan and Peel (2000), among others, a
model with K classes is obtained from a model with 1K classes by fixing one class proportion to
0, which is restriction on the boundary. Another alternative for obtaining a model with K classes
from a model with 1K classes is by setting the class-specific parameters in two classes equal, but
this violate another regularity condition for the LRT namely that the information matrix is non-
singular (Jeffries 2003).
Rather than relying on a chi-square distribution, it is also possible to construct the distribution
of the LR statistic using a parametric bootstrap approach (Langeheine et al. 1996; McLachlan 1987;
Nylund et al. 2007; van der Heijden et al. 1997). Using the parametric bootstrap, data sets referred
to as the bootstrap samples, are generated based on the parameter estimates of the K class model.
Both the models with K classes and 1K classes are then fitted to these data sets, from which we
compute the LR statistic as the differences in the log likelihood between the two models. This
yields the empirical distribution of the LR under the null hypothesis. The statistical significance of
the LRT is then evaluated by comparing the observed value of the LR statistic with this empirical
reference distribution. Such a bootstrap LRT (BLRT) procedure of null hypothesis significance
testing is implemented in various LC analysis software, such as Latent GOLD (Vermunt and
Magidson 2008, 2013) and Mplus (Muthén and Muthén 1998-2010). Very little is however known
about the statistical power for the BLRT in LC analysis.

3
Power analysis is an important aspect of scientific research since it involves the identification
and specification of the design issues that influence statistical inference. The common ad hoc
practice is to assume that a single value for sample size (for example, N =200 or 500) suits all
studies using LC analysis. However, as we explain later in details, the required sample size in LC
analysis depends on several population and study design characteristics. In contrast with standard
statistical models (e.g., ANOVA, linear regression), power analysis in LC models is not
straightforward as it involves not only the usual factors such as level of significance, effect size,
sample size, and test statistic, but also design factors which are exclusive to LC analysis. Examples
of latter factors are the class proportions, the number of classes, the number of observed indicator
variables, and separation level between classes.
The current paper introduces methods for assessing the power of the BLRT and for determining
the required sample size for studies using a LC model. One possible way, to determine the power of
the BLRT is by simulation; that is, by repeating the BLRT a large number of times for data sets
simulated from the alternative model (Tollenaar and Mooijaart 2003; Davidson and MacKinnon
2006). Because the BLRT is itself already a computationally intensive method, such a method is
not suited for use in practice. We propose a much faster alternative which involves reconstructing
and comparing the distribution of the BLTR under the null and the alternative hypotheses. This
‘short-cut’ method is also suitable for sample size determination, which involves power
computation for multiple sample sizes.
The remainder of this paper is organized as follows. In section 2, we give a brief review of the
LC models and the BLRT for the number of classes. In section 3, we provide details of power
analysis for the BLRT. We discuss a procedure for determining the minimum required sample size
in section 4. We give a description and results of a numerical study conducted to illustrate the
proposed efficient power and sample size computation methods in section 5. The paper ends with a
brief discussion in section 6.
2. The latent class model and bootstrap likelihood ratio test
LC model was introduced by Lazarsfeld and Henry (1968), who used the technique as a tool for
building typologies (or clustering) based on dichotomous observed variables. Since then many
extensions have been proposed such as models for other types of response variables (ordinal,
nominal, count, continuous), models with multiple latent variables, and models with covariates (see
Magidson and Vermunt, 2004, for an overview). More recently, Oberski (2015) proposed modelling
local dependence as an alternative to increasing the number of classes. For simplicity, in this paper
we consider a simple LC model with single categorical latent variable and binary observed
variables. Further, we assume local independence.

4
Let itY , with Tt ...,3,2,1 , denote the binary variable containing the response of person i on one
of T items, and X a categorical latent variable with K classes. An LC model contains two types of
model parameters, the class proportions and the class-specific response probabilities. The class
proportion )( kXPk specifies the relative size of a class, for Kk ,3,2,1 , and also referred
to as prior class membership probability. Since each individual belongs to one of K exhaustive
and mutually exclusive classes, the sum of the class probabilities is constrained to 1, i.e., 11
K
kk
and 0k . The class-specific response probabilities )|1( kXYP itkt specify the probability
of individuals in the kth
class to endorse item t. Thus, the conditional item parameters have
Bernoulli distribution with success probability kt as the unknown parameter, for Tt ,,1 . The
LC model further assumes that the item responses are independent conditioned on the class.
Let KTKK θπψ , KTKTK ,,,,,,, 11111,1 denote the vector of unknown
parameters for a latent class model with K classes. The probability of having a response pattern
),,,( 21 iTiii YYY Y can be modelled as a weighted sum of K class-specific probabilities (Collins
and Lanza 2010; Langeheine et al. 1996; Magidson and Vermunt, 2004; Vermunt 2010). That is,
the joint probability of the items is given by:
K
k
T
t
y
kt
y
ktkKiititP
1 1
)1()1(),( ψY
. (1)
The unknown model parameters are estimated using the maximum likelihood (ML) method, in
which the values of Kψ , say
Kψ , are obtained through the expectation-maximization (EM)
algorithm that maximizes the log-likelihood function:
N
i
K
k
T
t
y
kt
y
ktkKititl
1 1 1
)1(1log)( ψ . (2)
The EM algorithm maximizes this incomplete data log-likelihood function in an indirect manner. In
the E-step one computes the expected complete data log-likelihood, which involves calculating the
posterior class membership probabilities. In the M-step, the expected complete data log-likelihood
function is maximized, yielding new estimates of the class proportions and class-conditional
probabilities. The algorithm repeats these E- and M-steps until the log-likelihood function reaches a
maximum or a certain convergence criteria (McLachlan and Peel 2000). Because the log-likelihood
function may contain multiple local maxima, parameter estimation should be repeated using
multiple random start sets.

5
In the applications of LC models, the most important model selection issue concerns the number
of classes. The usual procedure to decide on the number of classes begins with a small number of
classes and then checks whether an additional class could improve the fit significantly. More
specifically, we test the null hypothesis
:0H Number of classes K (3)
against the alternative hypothesis
1 : 1H Number of classes K . (4)
To compare the improvement in fit between the adjacent class models, that is comparing the models
with K and 1K classes, one can compute the LR as the difference in log likelihoods:
)ˆ(log)ˆ(log2 )1( KK LLLR ψψ , (5)
where KΨ and )1(ˆ
KΨ are the ML estimators for parameters under H0 and H1, respectively. Whether
the null should be rejected or retained is evaluated by comparing the observed LR in (5) to the
distribution of the LR under the null hypothesis.
Whereas usually the LRT can be based on a central chi-square distribution with degrees of
freedom equal to the difference in the number of parameters in H1 and H0, this does not apply to the
hypotheses formulated in (3) and (4). As was noted among others by Wolfe (1970), Hartigan
(1977), Everitt (1981), Holt & Macready (1989), Bock (1996), and McLachlan & Peel (2000),
among others, the LR statistic given in (5) does not follow chi-square distribution because of non-
regularity. In principle, the K class model is nested in the 1K class model, and is obtained by a)
setting one of the class proportions to zero, or b) setting the class specific parameters in two classes
equal. In both cases, the regularity conditions for a standard asymptotic distribution fail because of
such problem as in (a) is on the boundary of the parameter space, and either KTθ or TK )1( θ is
not identified, in (b) is not identified and furthermore, the information matrix becomes singular
(Jeffries 2003; Lo et al. 2001; Shapiro 1985 ; Takane et al. 2003).
Lo et al. (2001) proposed approximating the distribution of LR using a weighted sum of
independent chi-square distributions, in which the weights are obtained from the information
matrix. However, Jeffries (2003) noted that the Lo et al. (2001) assumptions are generally not
satisfied in the context of mixture models. Instead of using the theoretical chi-square distribution,
one can employ a parametric bootstrap approach, in which one constructs the distribution of the LR
statistic in (5) empirically (McLachlan 1987). This often is referred to as the bootstrap likelihood
ratio test (BLRT). The BLRT requires using the ML estimate KΨ of the model with K classes to
generate the bootstrap samples. The LR statistic defined in (5) is then computed based on these
bootstrap samples. This yields the reference distribution under H0 for null significance testing of

6
the H0 model against the H1 model. More specifically, in the BLRT, a p-value for the LRT is
obtained by the following steps, as discussed by Langeheine et al. (1996), Nylund et al. (2007) and
van der Heijden et al. (1997):
1. Estimate both the model under the null and the alternative hypothesis by ML and compute the
LR as in (5). Note that multiple starting values should be used to prevent local maxima.
2. Generate a bootstrap sample using the ML estimates under the null hypothesis KΨ as the
population values and compute the LR by estimating both the null and the alternative models
with this bootstrap sample.
3. Repeat step 2 many times (say 500 times), which yield an estimate of the distribution of the
LR statistic.
4. Estimate the p-value by comparing the distribution obtained in step 3 with the LR obtained in
step 1. That is, obtain the p-value as the proportion of bootstrap LR values that is larger or
equal to the LR value from step 1.
The p-value obtained in step 4 is called bootstrap p-value and is used to decide whether the K
class model under the null hypothesis should be rejected in favour of the ( 1K ) class model under
the alternative hypothesis. The procedure is implemented in various LC analysis software packages,
for example, in Latent GOLD (Vermunt and Magidson 2008, 2013) and Mplus (Muthén and
Muthén 1998-2010). To gain computationally efficiency parallel computing can be used. Below we
describe two methods (a brute force and a computationally efficient method) to determine the
statistical power of the BLRT.
3. Power analysis for the BLRT
The statistical power of a test is the probability of rejecting the model under the null hypothesis (H0)
given that the model under the alternative hypothesis (H1) holds in the population. Thus, we assume
the model under the alternative hypothesis is the true population model with known population
parameters. In power analysis for hypothesis about the number of classes, the main interest can be
either determining the ability of the test to detect the correct number of classes or estimating the
sample size necessary to achieve a certain acceptable power level (e.g. a power of .8 or more).
This section presents power and sample size computation methods for the BLRT. As we
pointed out in the previous section, various studies dealt with the bootstrap procedure for p-value
computation (Langeheine et al. 1996; McLachlan 1987; Nylund et al. 2007; van der Heijden et al.
1997), which involves constructing the empirical distribution of the LR statistic only under the null
hypothesis. However, these studies did not investigate the computation of the distribution under the
alternative hypothesis, which is what is also needed for the evaluation of the power of the test.

7
One possible way to evaluate the power of the BLRT involves repeating the BLRT procedure
for a large number of simulated samples from the population defined under H1 (Tollenaar and
Mooijaart 2003; Davidson and MacKinnon 2006). The power is then estimated by the proportion
of simulated samples under H1 with a bootstrap p-value that leads to rejection of the null hypothesis
given the specified sample size and nominal α level, and the assumed values for the population
parameters. We call this method “power based on proportion of p-values” (PPP). Since for every
simulated sample the full bootstrap procedure needs to be repeated, the PPP method is
computationally very demanding. This makes it less useful for practical purposes, especially if one
wishes to determine the minimum required sample size to achieve a specific power level, which as
explained below requires repeating the power computation for a range of samples sizes.
To overcome the computational problems associated with the PPP method, we propose an
alternative computationally much less demanding procedure for estimating the power for the BLRT,
which we call the “short-cut” method. Actually, the proposed short-cut procedure is based on
exactly the same theoretical idea as any power computation; that is, we obtain the critical value
from the distribution under H0 and compute the probability of obtaining a value for the test statistic
larger that the critical value from the distribution under H1. However, because we cannot rely on
known asymptotic distributions under the null and alternative hypothesis, the short-cut method
approximates these distributions by Monte Carlo simulation. First, it estimates the critical value of
the test from the empirical distribution of the LRT statistic under H0. Subsequently, it estimates the
power as the proportion of LR values exceeding this critical value in Monte Carlo samples
generated under H1. We now provide more details on these two steps.
Given the nominal significance level α, the LR statistic defined in (5) rejects the null
hypothesis that the number of classes is K instead of 1K provided that the observed value of the
LR statistic exceeds a critical value (CV) C . That is, the model under H0 is rejected if
CLR , (6)
where C is the (1-α)th
quantile of the underlying distribution of the LR test statistic under the null
hypothesis. Since, as explained earlier, the regularity conditions are violated, one cannot rely on an
asymptotic chi-square distribution to obtain the CV. By considering an empirical distribution 0F
that satisfies the data generating conditions under H0, it is possible to estimate the CV such that
)|()|( 00 FCLRPHCLRP (7)
To construct the empirical distribution 0F , one needs the parameter values for the population under
H0. In practice these population parameter values can be estimated by fitting the model under H0 to
certain sample data. In the context of a power computation, this will be a large pilot data set
8
generated from the population defined under H1, which is sometimes referred to as exemplary data
(Self et al., 1992). Note that the use of an exemplary data set is the standard approach to power
computation for the LRT.
Whereas in the bootstrap procedure described in section 2 the Monte Carlo method was used to
obtain a p-value, here we use it to obtain the critical value C . Let ),,( 1
b
T
bb yy Y be a random
sample of size N drawn from LC model with K classes )ˆ,( KiP ψY , where Kψ is the ML estimate
under H0 obtained based on the exemplary data set generated according to the H1 LC model with
1K classes. Let bLR0 be the LR statistic computed for the replicate sample b , for Bb ,,1 . This
results in a series of values which can be rearranged in order such that BLRLRLR 0
2
0
1
0 .
From this ordered statistic, we obtain the estimate of the critical value C as the quantile at
th)]1([ B position; that is,
)]1([ˆ
BQC , (8)
where Q[h] is the thh quantile in the ordered statistic of the bootstrap LR under H0. Once an estimate
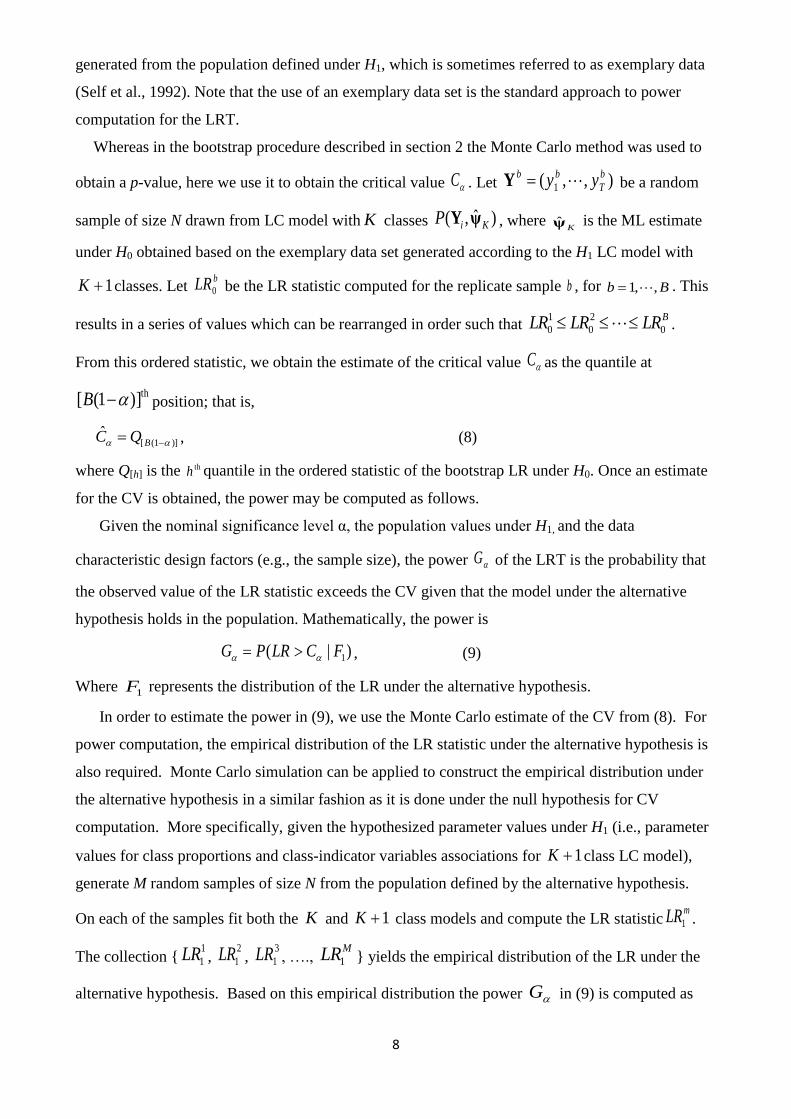
for the CV is obtained, the power may be computed as follows.
Given the nominal significance level α, the population values under H1, and the data
characteristic design factors (e.g., the sample size), the power G of the LRT is the probability that
the observed value of the LR statistic exceeds the CV given that the model under the alternative
hypothesis holds in the population. Mathematically, the power is
)|( 1FCLRPG , (9)
Where 1F represents the distribution of the LR under the alternative hypothesis.
In order to estimate the power in (9), we use the Monte Carlo estimate of the CV from (8). For
power computation, the empirical distribution of the LR statistic under the alternative hypothesis is
also required. Monte Carlo simulation can be applied to construct the empirical distribution under
the alternative hypothesis in a similar fashion as it is done under the null hypothesis for CV
computation. More specifically, given the hypothesized parameter values under H1 (i.e., parameter
values for class proportions and class-indicator variables associations for 1K class LC model),
generate M random samples of size N from the population defined by the alternative hypothesis.
On each of the samples fit both the K and 1K class models and compute the LR statisticmLR1 .
The collection {1
1LR , 2
1LR , 3
1LR , …., MLR1 } yields the empirical distribution of the LR under the
alternative hypothesis. Based on this empirical distribution the power G in (9) is computed as
9
M
mCLRm
MG
1]ˆ[ 1
1ˆ
, (10)
where ][h is an indicator function equal to 1 if h is true and 0 otherwise, and where C is the
bootstrap estimate of the CV given in (8).
It should be noted that, as with the PPP method, power computation using the short-cut method
requires specification of the population under H1. This implies that we estimate the power of the
BLRT for a specific sample size and type I error given the assumed K+1 class population model.
Changing the parameter settings for the population model will also change the estimated power. In
fact, specifying the parameters of the latent class model is similar to setting the effect size in a
power analysis for say a regression analysis.
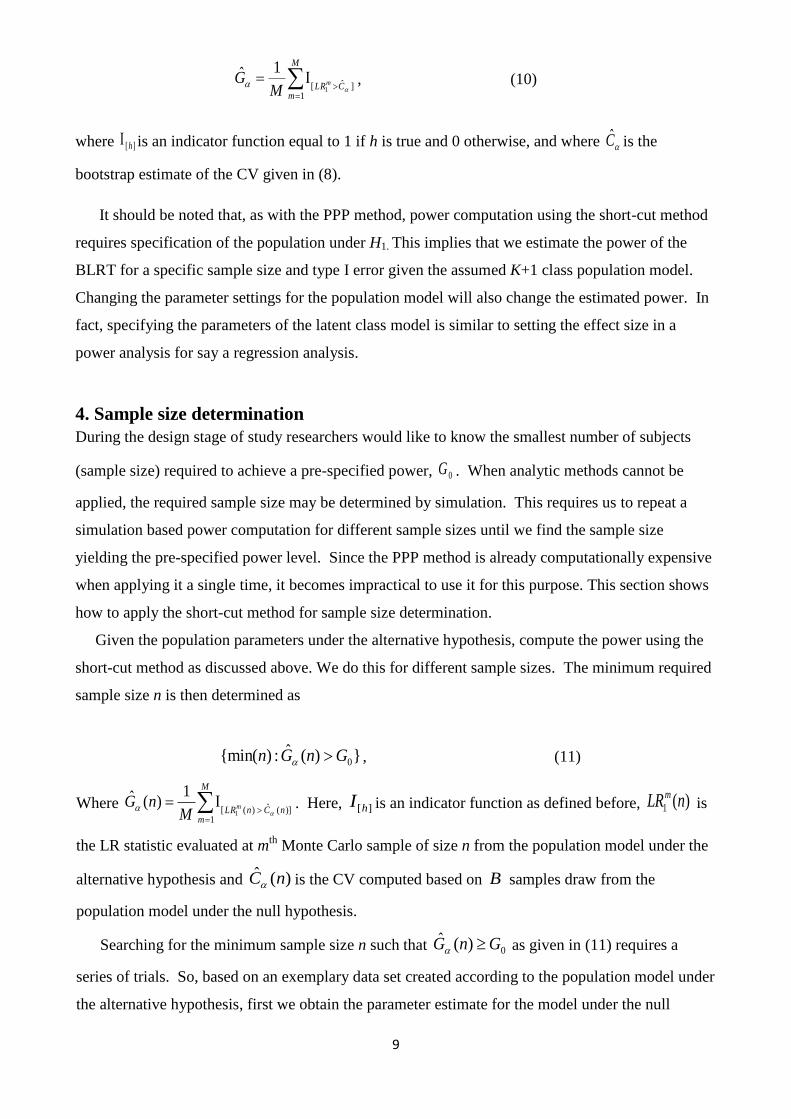
4. Sample size determination
During the design stage of study researchers would like to know the smallest number of subjects
(sample size) required to achieve a pre-specified power, 0G . When analytic methods cannot be
applied, the required sample size may be determined by simulation. This requires us to repeat a
simulation based power computation for different sample sizes until we find the sample size
yielding the pre-specified power level. Since the PPP method is already computationally expensive
when applying it a single time, it becomes impractical to use it for this purpose. This section shows
how to apply the short-cut method for sample size determination.
Given the population parameters under the alternative hypothesis, compute the power using the
short-cut method as discussed above. We do this for different sample sizes. The minimum required
sample size n is then determined as
})(ˆ:){min( 0GnGn , (11)
Where
M
mnCnLRm
MnG
1)](ˆ)([ 1
1)(ˆ
. Here, ][hI is an indicator function as defined before, )(1 nLRm
is
the LR statistic evaluated at mth
Monte Carlo sample of size n from the population model under the
alternative hypothesis and )(ˆ nC is the CV computed based on B samples draw from the
population model under the null hypothesis.
Searching for the minimum sample size n such that 0)(ˆ GnG as given in (11) requires a
series of trials. So, based on an exemplary data set created according to the population model under
the alternative hypothesis, first we obtain the parameter estimate for the model under the null

10
hypothesis. The CV is then computed based on B independent samples of arbitrary size n drawn
from )ˆ,( KiP ψY as discussed in section 3. Next, we take M independent samples of size n from the
population model ),( 1KiP ψY and evaluate the test statistic )(1 nLRmat each sample, for
Mm ,,1 . A smaller value of n is needed for the next trial if 0)(ˆ GnG , otherwise a larger
value is needed. A linear search algorithm can be used to obtain a good guess for the next trial.
5. Numerical study
5.1 Setup of the numerical study
The objective of this numerical study is to illustrate and compare the proposed methods for power
computation and sample size determination. We considered different scenarios of parameter values
for class proportions and class-indicator variable associations for the population model under the
alternative hypothesis. These scenarios define a range of differences between the null and
alternative hypothesis, as we explain further below. We consider both the PPP and short-cut
methods discussed in section 3 and compare the results under different design conditions. As it is
computationally too demanding to determine sample size using the PPP method, we illustrate the
determination of the sample size only using the short-cut method.
As is always required in power or sample size computation, we should specify the population
parameter values and the values of the other design factors. Since the aim of a power analysis for a
LC model is to identify whether the test is able to detect the differences between the latent classes,
separation between classes can be expected to be an important factor. Class separation can be
manipulated, among others, by the number of indicator variables, the number of classes, the
response probabilities for the most likely response, and the class proportions (see Vermunt, 2010;
Collins and Lanza, 2010). The number of indicator variables was set to T=6 and T=10, while the
number of classes was set to K=2, K=3 and K=4. Three values were used for the class-specific
response probabilities; that is, 0.7, 0.8 and 0.9, yielding what we refer to as the low, moderate, and
high separation condition. In the model with 4 classes, with a moderate separation level, the
response probabilities are set to kt =0.8 in class 1, to kt =0.2 in class 2, to kt =0.8 for the first half
of the indicators and kt =0.2 for the other half in class 3, and to kt =0.2 for the first half of the
indicators and kt =0.8 for the other half in class 4. Models with 2 and 3 classes are obtained by
removing last class(es). The class sizes k were specified to be equal or unequal, were in the
unequal conditions the class sizes were set to (0.6, 0.4), (0.5, 0.3, 0.2), and (0.4, 0.3, 0.2, 0.1), for 2,
3, and 4-class models, respectively. The design conditions with low separation and unequal class
proportions represent a smaller difference between the null to the alternative hypothesis, as the null

11
hypothesis may be obtained by either setting one of the class proportion to zero or the class specific
response probabilities in two classes equal.
The type I error rate was fixed to 0.05. For power analysis, the sample size N was set to 75, 150,
300, 500, and 600. For the computation of minimum sample size, we set the desired power, 0G , to
0.80. Note that Cohen (1988) suggests, as a rule of thumb, that power is moderate when it is about
0.50 and high when it is at least 0.80.
The above mentioned numerical study set up results in a total of 2 (number of indicators) x 3
(number of classes) x 3 (class-indicator associations) x 2 (class proportions) x 5 (sample size)
simulation conditions. Using the short-cut method, for each simulation condition, an exemplary data
set (of 1000 observations) was generated according to the H1 model and the H0 parameters were
estimated using this data set. Next, for each simulation condition, B=500 samples were generated
according to the H0 parameters and the CV value was computed. Given a specified sample size, the
power is then computed based on M=500 samples generated according to the H1 model as discussed
in section 3.
The estimated power of the short-cut method is evaluated by comparing it with the PPP
method. Using the PPP method, for each Monte Carlo sample m generated according to the H1
model, p-value was computed using 500 bootstrap samples drawn from the ML estimates of the H0
model. The power is then computed as the proportion of the Monte Carlo samples (M=500) with a
bootstrap p-value smaller than .05.
As is the case for mixture models in general, the likelihood function for a LC model can have
multiple maxima, and thus there is no guarantee that a global maximum is located. Since the
bootstrap procedure makes use of the ML estimates, occurrence of local maxima may introduce
some bias (Langeheine et al. 1996; McLachlan 1987). To avoid local maxima (and hence minimize
this bias), multiple starting values are specified. More specifically, using the exemplary data set
created according to the H1 model, we fit the H0 model by specifying multiple start values. Next,
when computing the bootstrap LR distribution under H0 based replicate samples, we used the
parameter estimate obtained from the exemplary data set as the starting values.
5.2 Results for power computation
Before discussing the results in more detail, we would like to stress the huge difference in
computation time between the PPP and the short-cut method. The average computation time per cell
in Table 1 was 2 hours and 37 minutes for the PPP method and 3 minutes for the short-cut method.
This shows that the proposed short-cut method is indeed much faster, and that it can easily be used
multiple times as is required for sample size computation.

12
Table 1 shows the power of the BLRT under different separation, number of indicator variables
T, number of classes, and sample size N for models with equal class sizes. The reported power
concerns the test of the model with one class less than the true LC model. Because the power of the
BLRT was always 1 (100%) under a high separation level irrespective of the other design
conditions, the results are not shown for these conditions. As can be observed from Table 1, the
power of the test increases as the separation level goes from low to moderate. The BLRT can
generally detect the true model when the separation between classes is moderate to high but not
when the class separation is low. Another general trend that can be deduced from Table 1 is that the
power increases as the number of indicator variables increases for a given separation condition.
Another clear trend from Table 1 is that the power of the test increases as the sample size increases,
keeping other conditions constant. The effect of sample size is more evident for low separation and
for true number of classes larger than 2. When class separation is moderate and equal class
proportions are assumed, the power of the test is high (at least 0.80) for a sample size as low as 150.
However, also in the moderate separation condition the sample size should be larger when the true
model contains more than 2 classes.
As can be seen from Table 1, the power is almost equal to 1 for all design conditions when a
true 2 class model is compared against a model that assumes a single homogeneous group. This
implies that the test can detect a true 2 class model for all design conditions in our numerical study.
Identifying a true 3 class model against a 2 class model does not require a large sample either, so
long as the separation between classes is moderate. However, with low class separation more than
300 subjects are needed to have high power with T=10 indicators and more than 500 subjects with
T=6 indicators. Detecting a true 4 class model against a 3 class model is easiest for the test when the
separation level is moderate and the number of indicator variables is at least 10. However, it
requires more than 150 subjects when the separation is moderate and the number of indicator
variables is 6. When the separation level is low, this test requires slightly more than 600 subjects to
have high power with 10 indicators. With 6 indicators, the power is only 0.16 with 600 subjects,
which is far too low by any standard.
What can also be seen from the results reported in Table 1 is that the estimated power obtained
using short-cut method is always close to the estimate obtained with the PPP method. Sometimes it
is slightly larger, especially in the very low power conditions, but in other situation there is not
systematic deviation in a certain direction. Note also that we are using Monte Carlo methods, so
slight differences will always be present, also if one repeats the same method a second time.
Overall, the differences between the two methods seem to be irrelevant for practical purposes.
Since the numerical results for the LCM with unequal class sizes show trends as those with equal
class sizes with respect to the design conditions, a separate table is not shown. The power in general
increases with sample size, number of indicator variables and the separation condition from low to

13
moderate. However, the power of the test is slightly lower when the class sizes are unequal
compared to the results in Table 1 for equal class sizes.
Table 1. Approximated power for Bootstrap Likelihood Ratio Test with T number of binary
indicator variables and equal class sizes.
Hypotheses
Sample
size (N)
Separation*
Method
Low Moderate
T = 6 T = 10 T = 6 T = 10
H0: 1 class
H1: 2 class
75 Short-cut 0.894 1.000 1.000 1.000
PPP 0.892 0. 996 0.954 1.000
150 Short-cut 0.992 1.000 1.000 1.000
PPP 0.998 1.000 1.000 1.000
300 Short-cut 1.000 1.000 1.000 1.000
PPP 1.000 1.000 1.000 1.000
500 Short-cut 1.000 1.000 1.000 1.000
PPP 1.000 1.000 1.000 1.000
600 Short-cut 1.000 1.000 1.000 1.000
PPP 1.000 1.000 1.000 1.000
H0: 2 class
H1: 3 class
75 Short-cut 0.104 0.118 0.634 0.956
PPP 0.052 0.138 0.562 0.948
150 Short-cut 0.198 0.330 0.908 1.000
PPP 0.142 0.432 0.914 1.000
300 Short-cut 0.314 0.786 1.000 1.000
PPP 0.354 0.814 1.000 1.000
500 Short-cut 0.652 0.986 1.000 1.000
PPP 0.700 0.988 1.000 1.000
600 Short-cut 0.824 0.996 1.000 1.000

14
PPP 0.758 0.996 1.000 1.000
H0: 3 class
H1: 4 class
75 Short-cut 0.040 0.074 0.200 0.702
PPP 0.014 0.028 0.154 0.998
150 Short-cut 0.062 0.134 0.554 0.988
PPP 0.028 0.062 0.526 1.00
300 Short-cut 0.094 0.240 0.926 1.000
PPP 0.046 0.218 0.948 1.000
500 Short-cut 0.126 0.524 1.000 1.000
PPP 0.098 0.578 0.998 1.000
600 Short-cut 0.160 0.716 1.000 1.000
PPP 0.142 0.722 1.000 1.000
*Note: Power is equal to 1.000 in all conditions when separation is high. The results reported in this table
are obtained using 500 Monte Carlo and/or bootstrap samples.
5.3 Results for sample size approximation
Table 2 shows the minimum required sample size to achieve a power of 0.80 under different design
conditions. As can be seen, very small sample sizes are needed when class separation is high: a
sample size of 41 subjects suffices in the least favourable of the investigated conditions. Similarly, a
sample size of 60 subjects is enough in the least favourable condition to detect a 2 class model
against a homogeneous group (results are not shown). Also with a moderate class separation,
sample sizes do not need to be very large: a sample size of 225 subjects is large enough all four
conditions. However, when class separation is low, the minimum required sample size is much
larger than what most researchers use in practice. For example, a researcher using 6 indicator
variables may require 1800 or more subjects to detect a true 4 class against a 3 class model with a
power of 0.80. The number of subjects that is required reduces by increasing the number of
indicator variables, but still more than 700 subjects are required even with 10 indicator variables. In
general, the smaller the number of indicator variables or the worse the separation, the larger the
number of subjects needed to achieve a high power. It can also be observed from Table 2 that the
larger the number of true classes, the larger the required number of subjects.

15
The required sample sizes reported in Table 2 are for conditions in which the class
proportions are equal. When class proportions are unequal, the required sample sizes will be larger
than those reported in Table 2.
Table 2. Approximate minimum required sample size (n) to achieve a power of 0.80 for Bootstrap
Likelihood Ratio Test with T binary indicator variables and equal class sizes.
Hypotheses
T
Separation
Low Moderate High
H0: 2 class ; H1: 3 class 6 670 104 25
10 291 52 14
H0: 3 class; H1: 4 class 6 1830 225 41
10 705 86 19
Note: The results reported in this table are obtained using 500 Monte Carlo samples.
6. Discussion
This paper dealt with power and sample size computation for the BLRT in LC analysis. One
possible way to compute the power of the BLRT is via Monte Carlo simulation, yielding what we
referred to as the PPP (power by proportion of p values) method. Because Monte Carlo evaluation
of the bootstrap is computationally very intensive, we proposed a much faster alternative, which is
based on standard power computation theory. Since asymptotic do not hold for the LRT in latent
class models, Monte Carlo simulation is used to construct the sampling distributions of the test
statistic under the null and the alternative hypothesis. Using the estimated critical value obtained
from the former distribution, the power can be obtained from the latter distribution.
The behaviour of short-cut method was investigated via a numerical study and compared with
the computationally intensive PPP method, which we treated as the gold standard. The estimated
power obtained with the much faster short-cut method is very similar to the one obtained with the
PPP method, though the short-cut method seems to slightly overestimate the power when the power
is very low. However, for power levels above .5, which are the values of main practical interest, the
two methods always gave identical conclusions. From this we conclude that the short-cut method is
good approach for power and sample size computation for the BLRT in LC analysis.
As a side product, our numerical study showed the design factors affecting the power of the
BLTR in a LCA. It also showed that the idea of a single value for the sample size, say of 200 or

16
500 subjects, fitting for all studies is erroneous. With low class separation, much larger numbers of
subjects and/or more indicators are needed to get high statistical power. The most unfavourable
situation we investigated required 1800 subjects, which occurred when comparing a 4 with a 3 class
model under low separation and 6 indicator variables condition. On other hand, when separation
between classes is moderate or high, the power could be sufficient with sample sizes and numbers
of indicator variables that are commonly used in practice. In any case, it is clear that it is important
to perform power analysis under anticipated design conditions prior to the design of the study,
which can now be easily done with the tool described in this paper.
In this study, we restricted ourselves to power analysis for simple unrestricted LC models for
dichotomous responses. The proposed short-cut approach can also be applied to more complex LC
models with constraints on the response probabilities, with explanatory variables, and with
polytomous indicators. Another interesting area of research is the generalization to other types of
mixture models, such as mixtures of normals and hidden Markov models, in which BLRT is used to
decide about the number of mixture components and the number of latent states, respectively.
The power analysis methods described in this paper require specification of the parameter values
under alternative hypothesis. This is similar to setting the effect size in a power computation for
example as in a simple ANOVA. However, often we have only vague ideas about the possible
population parameters of a latent class model. A possible solution is to use a conservative setting
with classes which are not too well separated and possibly also of unequal sizes. Another alternative
is to use ranges of plausible values for parameters under the alternative hypothesis (see, for
example, Tekle et al. 2008) or, as in Bayesian paradigm, to specify prior distributions for
parameters under alternative hypothesis (Johnson and Rossell, 2010; Rubin 1981). Further
research should focus on such alternative approaches which make it possible to take the uncertainty
about the population parameters into account.
17
References:
Akaike H (1974) A new look at the statistical model identification. IEEE Transactions on
Automatic Control 19: 716–723.
Bock HH (1996). Probabilistic models in cluster analysis. Computational Statistics and Data
Analysis 23: 6–28.
Cohen J (1988) Statistical power analysis for the behavioral sciences. Lawrence Erlbaum, New
Jersey.
Collins LM, Lanza ST (2010). Latent class and latent transition analysis: With applications in the
social, behavioral, and health sciences. New Jersey: John Wiley & Sons.
Davidson R, MacKinnon JG (2006) The power of bootstrap and asymptotic tests. Journal of
Econometrics 133: 421-441.
Dias JG, Vermunt JK (2007) Latent class modeling of website users' search patterns: Implications
for online market segmentation. Journal of Retailing and Consumer Services 14: 359-368.
Everitt BS (1981). A Monte Carlo investigation of the likelihood ratio test for the number of
components in a mixture of normal distributions. Multivariate Behavioral Research 16:171–
80.
Genge E (2014) A latent class analysis of the public attitude towards the euro adoption in
Poland. Advances in Data Analysis and Classification 8: 427-442.
Hartigan JA. (1977). Distribution problems in clustering. In Classification and Clustering, edited
by JV Ryzin, 45–72. New York: Academic Press.
Holt JA, Macready GB (1989) A Simulation Study of the Difference Chi-Square Statistic for
Comparing Latent Class Models Under Violation of Regularity Conditions. Applied
Psychological Measurement 13: 221-231.
Jeffries NO (2003) A note on 'testing the number of components in a normal mixture. Biometrika
90: 991-994.
Johnson VE, Rossell D (2010) On the use of non-local prior densities in Bayesian hypothesis tests.
Journal of Royal Statistical Society 27: 143-170.
Langeheine R, Pannekoek J, van de Pol F (1996) Bootstrapping Goodness-of-Fit Measures in
Categorical Data Analysis. Sociological Methods and Research 24: 492-616.

18
Lazarsfeld PF, Henry NW (1968) Latent Structure Analysis. Houghton Mifflin, Boston.
Leask SJ, Vermunt JK, Done DJ, Crowd TJ, Blows M, Boks MP (2009) Beyond symptom
dimensions: Schizophrenia risk factors for patient groups derived by latent class analysis.
Schizophrenia Research 115: 346–350.
Lo YT, Mendell NR, Rubin DB (2001) Testing the number of components in a normal mixture,
Biometrika 88: 767-778.
Magidson J, Vermunt J K (2004) Latent class models. In Kaplan D (eds.) The Sage Handbook of
Quantitative Methodology for the Social Sciences (pp. 175-198). Thousand Oakes: Sage
Publications.
McLachlan G (1987) On bootstrapping the likelihood ratio test statistic for the number of
components in a normal mixture, Applied Statistics-Journal of the Royal Statistical Society
36: 318-324.
McLachlan G, Basford K (1988) Mixture Models: Inference and Applications to Clustering. Marcel
Dekker, New York.
McLachlan G, Peel D (2000) Finite Mixture Models. John Wiley, New York.
Muthén LK, Muthén BO (1998-2010) Mplus User's Guide. Sixth Edition, Muthén & Muthén, Los
Angeles, CA.
Nylund KL, Muthen M, Muthen BO (2007) Deciding on the Number of Classes in Latent Class
Analysis and Growth Mixture Modeling: A Monte Carlo simulation study. Structural equation
modelling 14: 535-569.
Oberski D (2015) Beyond the number of classes: separating substantive from non-substantive
dependence in latent class analysis: Advances in Data Analysis and Classification, DOI
10.1007/s11634-015-0211-0.
Rindskopf D (2002) The use of latent class analysis in medical diagnosis. Proceedings of the
Annual Meeting of the American Statistical Association, American Statistical Association,
Alexandria VA, pp. 2912–2916.
Rubin DB (1981) The Bayesian Bootstrap, Annals of Statistics 9(1), 130-134.
Schwarz G (1978) Estimating the dimension of a model. Ann Stat. 6: 461-464.
Self SG, Mauritsen RH, Ohara J (1992) Power calculations for likelihood ratio tests in generalized
linear models. Biometrics 48: 31–39.

19
Shapiro A (1985) Asymptotic distribution of test statistics in the analysis of moment structures
under inequality constraints. Biometrika 72: 133–144.
Steiger JH, Shapiro A, Browne MW (1985) On the multivariate asymptotic distribution of
sequential chi-square statistics. Psychometrika 50: 253-263.
Takane Y, van der Heijden PGM, Browne MW (2003) On likelihood ratio tests for dimensionality
selection. In Higuchi T, Iba Y, and Ishiguro M. (Eds.), Proceedings of Science of Modeling:
The 30th Anniversary Meeting of the Information Criterion (AIC), (pp.348 - 349). Report on
Research and Education 17. Tokyo: The Institute of Statistical Mathematics.
Tekle FB, Tan FEE, Berger MPF (2008) Maximin D-optimal designs for binary longitudinal
responses. Computational Statistics & Data Analysis 52(12): 5253-5262.
Tollenaar N, Mooijaart A (2003) Type I errors and power of the parametric bootstrap goodness-of-
fit test: full and limited information. British Journal of Mathematical and Statistical
Psychology 56: 271-88.
Van der Heijden PGM, HitHart H, Dessens JAG (1997) A parametric bootstrap procedure to
perform statistical tests in latent class analysis. In: J. Rost and R. Langeheine (eds.)
Applications of latent trait and latent class models in the social sciences. New York: Waxman
Muenster. p. 190-202.
Vermunt JK (2010) Latent class Modeling with covariates: Two Improved Three- Step Approaches.
Political Analysis 18: 450-469.
Vermunt JK, Magidson J (2008) Manual for latent GOLD 4.5 syntax module. Statistical
Innovations Inc, Belmont, MA.
Vermunt JK, Magidson J (2013) Latent GOLD 5.0 Upgrade Manual. Statistical Innovations Inc,
Belmont, MA.
Wolfe JH (1970). Pattern clustering by multivariate mixture analysis. Multivariate Behavioral
Research 5: 329–350.
Zenor MJ, Srivastava RK (1993) Inferring market structure with aggregate data: A latent segment
logit approach. Journal of Marketing Research 25: 369-379.


![Assessing Uncertainty in Simulation Based Maritime Risk ...dorpjr/Publications/JournalPapers/RA...techniques such as bootstrap or likelihood based methods [27], the Bayesian paradigm](https://static.fdocuments.in/doc/165x107/6108c051ebc1373ab9260bb6/assessing-uncertainty-in-simulation-based-maritime-risk-dorpjrpublicationsjournalpapersra.jpg)