Poverty Reduction Strategy Paper - World Bank Group's Internet!
124
REPUBLIC OF CHAD Unity – Work - Progress MINISTRY OF PLANNING, DEVELOPMENT AND COOPERATION PRSP Steering Committee National Poverty Reduction Strategy Paper N’Djamena – June 2003
Transcript of Poverty Reduction Strategy Paper - World Bank Group's Internet!

REPUBLIC OF CHAD Unity – Work - Progress
MINISTRY OF PLANNING, DEVELOPMENT AND COOPERATION
PRSP Steering Committee
National Poverty Reduction
Strategy Paper
N’Djamena – June 2003

1

2
PREFACE
Poverty is just as much a challenge today as it ever was, as the recent improvement in Africa’s economic situation is still insufficient and the continent remains relegated to the sidelines of the world economy. Most reports produced recently stress the specificities of sub-Saharan Africa where the number of poor in absolute terms continues to increase, whereas progress has been made in other regions of the world. Indeed, it seems that minimum growth rates of 5-8 percent will be needed to have an effective impact on economic and social development. Chad’s main objective is to implement an economic policy that will bring about lasting and sustainable development, particularly in the oil era. This development must involve high growth rates holding steady over a relatively long period. The PRSP has proven to be the instrument of choice in attaining this objective. This exercise is not new; the Government of Chad had already submitted a paper to the Geneva IV Round Table in 1998 outlining the key strategic options for development based on “poverty reduction.” The Government wanted the preparation of the National Poverty Reduction Strategy (NPRS) to be participatory. For this reason, it set up a steering committee in April 2000 comprising some 30 members from the public sector, private sector, civil society associations (NGOs, women’s organizations, youth organizations, the public and private media, etc.) and the National Assembly. For three years, the steering committee worked tirelessly on the paper so that it would better reflect the concerns of the Chadian population. A number of different activities were carried out:
• a launching seminar (April 25 –27, 2000); • a study on the perceptions of well being and poverty (April-June 2000); • 10 thematic and sectoral studies (May-July 2000); • a civil society forum (November 2000); • country-wide participatory consultations (December 2000-January 2001), • an assessment of typical intervention through some existing projects (February-
March 2001) ; • a national seminar to define strategic areas and priority actions (May 8-12,
2001); • regional seminars to re-establish strategic areas and priority actions and adopt
performance indicators and a monitoring/assessment mechanism (March 19-21, 2002).
All these components progressively refined the various versions of the PRSP, which was also enhanced with the input of Chad’s development partners, particularly the United Nations System, World Bank, IMF, European Union, France, and GTZ.

3
Having adopted the Millennium Development Goals (MDG), Chad shares the opinion of the rest of the world that the PRSP is, first and foremost, a strategy that reflects the expectations of the general population and the resources that the Government must deploy to enable that population to increase its standard of well-being. It is possible that some data presented in this report may be incomplete or partial, however the strategic issues and priority actions are consistent overall, and the Government and its partners are adhering to them. Subsequent revisions of the document will provide the opportunity to adjust certain quantitative indicators in light of new data from current surveys, in particular ECOSIT (survey of informal sector consumption), EDST (demographic and health survey), and the census. The document that the Government has just adopted will be submitted to the donor community in the coming months for them to sign on. Until then, the steering committee and the sectoral ministries (with the support of partners represented on the ground) will undertake a thorough evaluation of projects and programs by sector of activity. The implementation and follow-up of the PRSP will once again call for a more decentralized and participatory consensus-building approach. In the interest of transparency and good governance, the structures to be created will work in conjunction with regional and local governments to ensure that the expenditure executed within the framework of the PRSP will actually reach the targeted beneficiaries. The Government, for its part, will spare no effort to ensure that this strategy truly reduces poverty by 2015.
N’Djamena, June 5, 2003
/s/
Djimrangar Dadnadji Minister of Plan, Development and Cooperation

4
TABLE OF CONTENTS
Introduction ..........................................................................................................................10 Chapter 1 Background and Process for Preparation of the PRSP..............................11 1.1 The International, Regional and National Background .....................................11 1.1.1 The International and Regional Context ..........................................................11 1.1.2 The National Context .......................................................................................12 1.2 Presentation of the Participatory Process ............................................................15 1.2.1 The Steering Committee in Chare of the Strategy Preparation Process ...........15 1.2.2 The Strategy Preparation Process .....................................................................16 Chapter 2 Diagnostic Assessment of Poverty in Chad ..................................................18 2.1 Profile of Poverty in Chad .....................................................................................19 2.1.1 Quantitative Analysis of Poverty......................................................................19 2.1.2 Qualitative Analysis of Poverty........................................................................23 2.1.2.1 Poverty and Well-Being as Perceived by the Population ..........................23 2.1.2.2 Lessons Drawn from Participatory Consultations ....................................24 2.1.3 Typification of Poor Households .....................................................................28 2.2 Vulnerable Social Groups......................................................................................32 Chapter 3 Determinants of Poverty and Opportunities in Chad.................................36 3.1 Determinants of Poverty ........................................................................................36 3.1.1. Governance.......................................................................................................36 3.1.2. Modest Economic Growth ...............................................................................38 3.1.2.1 Low Productivity in the Primary Sector ...................................................38 3.1.2.2 A Practically Nonexistent Processing Sector ...........................................40 3.1.2.3 A Largely Unproductive Tertiary Sector ..................................................41 3.1.3 Highly Deficient Human Resources and Living Conditions ............................41 3.1.3.1 Education, Training, and Literacy Classes ...............................................41 3.1.3.2 Inadequate Health Care Coverage and Hypothetical Nutrition ................42 3.1.3.3 HIV/AIDS.................................................................................................44 3.1.3.4 Status of Women in Chad.........................................................................44 3.1.3.5 Lack of Social Protection .........................................................................44 3.1.4 Inappropriate and Dilapidated Basic Economic Infrastructure ........................44 3.1.4.1 The Road Network ...................................................................................44 3.1.4.2 Energy.......................................................................................................45 3.1.4.3 Telecommunication..................................................................................45 3.1.4.4. The Banking System and Microfinance ...................................................46 3.1.5. Other Obstacles to Poverty Reduction .............................................................46 3.1.5.1 Debt ..........................................................................................................46 3.1.5.2 Demographic Factors ...............................................................................47 3.1.5.3 Explosive Remnants of War, Factors Exacerbating Poverty....................47 3.2 Chad’s Strengths ....................................................................................................49 3.2.1 Opportunities....................................................................................................49 3.2.2 The Long-Term Outlook for Growth and Development ..................................51 3.2.2.1 The Oil Boom Era ....................................................................................51 3.2.2.2 The Highly Indebted Poor Countries (HIPC) Initiative............................51

5
Chapter 4 The Overall Outlook for Development Through 2015................................52 4.1 An Integrated Vision of Poverty Reduction Combined with the Preparation of the Post-Oil Boom Era...........................................................52 4.2 Poverty Reduction Targets from 2003 to 2015 ....................................................54 4.2.1 Promote Good Governance ..............................................................................54 4.2.1.1 Consolidation of the Rule of Law ............................................................55 4.2.1.2 Role of the State, the Private Sector, and Civil Society...........................55 4.2.1.3 Efficient and Transparent Management of Public Affairs .......................60 4.2.2 Ensure Strong and Sustained Economic Growth .............................................60 4.2.2.1 Exploitation of the Sources of Growth.....................................................61 4.2.2.2 Promotion of the Private Sector ...............................................................61 4.2.2.3 Development of Basic Infrastructure and Support for Growth ...............62 4.2.2.4 Achieve a Sustainable Increase in Rural Output ......................................64 4.2.3 Improving Human Capital................................................................................66 4.2.3.1 Education, Training, and Literacy Campaigns .........................................66 4.2.3.2 Health .......................................................................................................68 4.2.3.3 HIV/AIDS.................................................................................................68 4.2.4 Improving the Living Conditions of Vulnerable Groups .................................68 4.2.4.1 Integrated Urban Development ................................................................68 4.2.4.2 Support for Microenterprises, SME, and Employment ............................69 4.2.4.3 Social Protection ......................................................................................70 4.2.5 Restoring and Safeguarding Ecosystems..........................................................70 4.2.5.1 Strengthen the Regulatory Framework and Natural Resource Management Capabilities .....................................................................71 4.2.5.2 Improvement of Household Energy Management....................................71 Chapter 5 Macroeconomic Framework..........................................................................72 5.1 Sources of Economic Growth ................................................................................72 5.2 Conditions Necessary to Growth and Poverty Reduction ..................................74 5.2.1 Macroeconomic Stability .................................................................................75 5.2.1.1 Objectives.................................................................................................75 5.2.1.2 Economic Policies ....................................................................................77 5.2.1.2.1 Fiscal Policies....................................................................................77 5.2.1.2.2 Monetary and Financial Sector Policies ............................................84 Chapter 6 Implementation of the PRSP.........................................................................87 6.1 Stages of Implementation ......................................................................................87 6.2 Monitoring ..............................................................................................................88 6.3 Assessment ..............................................................................................................89 6.3.1 Preparation of the Program for 2006-10...........................................................90 6.3.2 Updating ...........................................................................................................90 6.4 Institutional Framework........................................................................................90 6.4.1 The High Interministerial Committee for PRSP Supervision ..........................90 6.4.2 The Government/Donors Committee ...............................................................91 6.4.3 The Steering Committee...................................................................................91 6.4.4 Sectoral Monitoring and Evaluation Units.......................................................91 6.4.5 Regional, Departmental, and Subprefectural Units..........................................92

6
Boxes 1. A Civil Society Keen to Participate Fully in National Life but Without the Required Skills ...............................................................................................38 2. An Incipient Private Sector Facing a Regulatory Offering it Few Incentives ..........38 3. Oil Revenues, 2004-15 Projections ..........................................................................78 4. Principal Actions Underway to Strengthen the Monitoring of Expenditure in the Priority Sectors ...........................................................................................81 Charts 1. Distribution (in percent) of Households According to Standard of Living and Level of Education of the Head of Household ..............................................29 2. Distribution of Households with Access to Portable Water (tap, public fountain, well) by Household Standard of Living.............................29 3. National Distribution of Households by Standard of Living and Gender of the Head of Household.....................................................................................30 4. Percentage of Children Under 5 years of Age Suffering from Malnutrition (Insufficient Weight) ............................................................................................31 5. Infant and Child Mortality Rates by Households’ Standard of Living.....................31 6. Distribution (in percent)of Childbirths by Place and Households’ Standard of Living ...................................................................................................................32 Tables 1 Food-Related and Overall Poverty Lines in 1995-96 Per Capita and Per Day.........20 2. Incidence and Depth of Poverty in Chad in 1995-96 (ECOSIT I)............................20 3. HDI Estimates, by Region........................................................................................22 4. Summary of the Issues Raised by People, by Zone, According to Priorities ...........24 5. Distribution of the Disabled, by Disability...............................................................34 6. Public Spending by Sectors, 2003-06.......................................................................83 Annexes 1. Matrix of Priority Actions of Phase I of the PRSP...................................................93 2. Partial List of New Projects Identified on a Sector-by-Sector Basis, Financing for Which is to be Sought in the Context of the National Poverty Reduction Strategy................................................................................106 3. Quantitative Poverty Reduction Objectives ...........................................................115 4. Table 1 Detail of Macroeconomic Framework............................................................120 Table 2 Gross Domestic Product by Sector, 2001-15 .................................................121 Table 3 Consolidated Government Operations, 2003-15 ............................................122 Table 4 Balance of Payments, 2003-15 .......................................................................123 Table 5 Monetary Survey, 2003-15 .............................................................................124

7
ACRONYMS AND ABBREVIATIONS ACBF African Capacity Building Foundation ADB African Development Bank AFD Agence Française de Développement APE Parents Associations APICED Agency to Support Community Initiatives in Education B.E.T. / BET Borkou Ennedi Tibesti BdL Brasseries du Logone (Breweries of Logone) BEAC Bank of Central African States BGT Boissons et Glacières du Tchad (Chadian Soft Drinks and Coolers
Company) BOP Balance of Payments CAEMC Central African Economic and Monetary Community CCIAMA Chamber of Commerce, Industry, Agriculture, Mining and Crafts CCSRP Oil Revenue Control and Surveillance Board CELIAF Women’s Associations Liaison and Information Unit CEMAC Central African Economic and Monetary Community CEN-SAD Community of Sahel and Saharan States CESRAP Unit to Monitor Reform of Public Administration CFAF CFA Franc (African Financial Community Franc) CNSP Children needing special protection CP Steering Committee CST Compagnie Sucrière du Tchad (Chadian Sugar Company) CTNSC National Technical Monitoring and Control Committee DDENs Departmental delegations in national education DHS Cotontchad’s oil and soap products division DSEED Directorate of Statistics and Economic and Demographic Studies DSIS Health Information System Division ECOSIT Survey on Consumption and the Informal Sector in Chad EDST Demography and Health Survey EHIPC Enhanced Heavily Indebted Poor Countries [Initiative] EMT Migration Survey EMT Migration Survey for Chad EPBEP Survey on Perception of Well-Being and Poverty ERW Explosive remnants of war ESAF Enhanced Structural Adjustment Facility ETFP technical education and professional training EU European Union FACIL Local Initiatives Concerted Action Fund FAO
Food and Agriculture Organization
FER Road Maintenance Fund FGF Fund for Future Generations GDP Gross Domestic Product

8
GNDI Gross national disposable income H.I. Handicap International HCI High Interministerial Committee for PRSP Supervision HPI Human Poverty Index ICAO International Civil Aviation O. IDA International Development Association IEC Information and Communication (outreach) ILO International Labour Organization IMF International Monetary Fund INSEED National Institute for Statistics and Economic and Population
Research LGRP Law on the management of oil revenues LRVZ Veterinary Research and Zootechnology Laboratory M.I.T. Intermediate Means of Transport MA Ministry of Agriculture MASF Ministry of Social Affairs of Chad MAT Ministry of Territorial (Regional) Development MCT Manufacture des Cigarettes du Tchad (Chadian Cigarette
Manufacturer) MD Ministry of Decentralization MDG Millennium Development Goals MEE Ministry of Environment and Water MEF Ministry of Economy and Finance MEN National Education Ministry MFI Microfinance institution MJ Ministry of Justice MMED Ministry of Mining and Energy MPDC Ministry of Planning, Development, and Cooperation MSP Ministry of Public Health MTPT Ministry of Public Transport in Chad NEPAD New Partnership for Africa’s Development NGO Nongovernmental organization OHADA Organization for the Harmonization of Business Law in Africa OMVSD Office to Develop the Satégui-Déréssia Plain ONDR National Office for Rural Development PFIE Information for the Environment Training Program PNLS National Program to Combat AIDS PNT National Transportation Program PPLS Population and Fight against AIDS project PRGF Poverty Reduction and Growth Facility PRSP Poverty Reduction Strategy Paper PTA Teachers and Parents Associations REPAFEM Poverty Reduction and Actions for Women SAC Structural Adjustment Credit SAP Structural Adjustment Program SENAREC National Capacity Building Secretariat SME Small and medium-sized enterprise

9
SNBG National Good Governance Strategy STEE Société Tchadienne d’Eau et d’Electricité (Chadian Water and
Electricity Company) UNDP United Nations Development Programme UNICEF United Nations Children’s Fund VRDs Sewer and drainage systems WHO World Health Organization WPDS Women in particularly dire straits

10
Introduction The National Poverty Reduction Strategy (N.P.R.S.) is the concrete manifestation of the Government’s commitment with respect to Chad’s eligibility under the Enhanced Highly Indebted Poor Countries (EHIPC) Initiative, established by the Bretton Woods institutions. To implement this strategy, the funds freed by debt relief (estimated at approximately US$260 million through 2015) will complement national resources, including revenue from Doba oil exploitation as of 2004. Apart from that commitment, the National Poverty Reduction Strategy will tie in and periodically update, on a more coherent and comprehensive scale, all the sectoral poverty reduction strategies to be implemented in the country over the next fifteen years. The first stage of implementation of the strategy will cover the 2004-2006 period and should continue to benefit from a national, regional, and international environment that is relatively favorable for a comprehensive and sustainable focus on poverty reduction issues. In particular, the participatory approach that was a key factor in preparing the strategy should be boosted by a consolidation of democratic fundamentals as the institutions contemplated in the 1996 Constitution materialize, by ongoing efforts to implement decentralization and deconcentration policy, the strengthening of the legislature and the judiciary, national capacity-building in government institutions and civil society, and the development of communication and consensus-building mechanisms at the national and local levels. As it moves from a period of stagnation, or even economic and social decline caused by the war, to the start of a petroleum-based era, the Chadian economy has experienced several years of strong growth, thanks to oil-industry related investments. The new prospects opening up for Chad pose both a real opportunity and the challenge of eradicating poverty. The challenge consists of creating the conditions for sustained growth by the end of the oil era, together with equitable distribution, both geographically and in terms of the benefits to present and future generations, of the fruits of that sustained growth permitted by an appropriate and efficient use of both EHIPC Initiative and oil project funds. A series of activities have been undertaken since 2000 to seize this opportunity and take up this challenge. They have involved all segments of the population and the results are described in this National Poverty Reduction Strategy Paper. This document is articulated around the following points:
• Background and process for preparation of the PRSP • Diagnostic assessment of poverty in Chad • Determinants of poverty and opportunities in Chad • The overall outlook for development through 2015 • Macroeconomic framework • Implementation of the PRSP.

11
Chapter 1 Background and process for preparation of the PRSP 1.1 The international, regional and national background
1.1.1 The international and regional context The ambivalent results of the adjustment programs implemented all over the world since the late 1970s, which at best induced growth but without reducing inequalities, led in the 1990s, thanks to the major social policy summits organized by the United Nations, to increasing worldwide awareness of the need for a new development paradigm. While acknowledging the importance of growth in the fight against poverty, the new paradigm also emphasizes the need, in poverty eradication efforts, for a global strategy based on an efficient division of labor between the state, the private sector, and civil society designed to ensure effective and accountable governance, as well as a more equitable allocation of the fruits of economic growth for social progress. Another issue that adjustment programs in Sub-Saharan Africa have failed to solve is the debt burden. Moreover, as a result of the various Paris Club member debt relief schemes for poor countries, multilateral financial institution loans now constitute a predominant part of these countries’ debt structure. This situation led the International Monetary Fund (IMF) and the World Bank to propose to their members a new initiative in 1996 designed to alleviate the unsustainable debt burden of poor countries. Thus, the alleged failure of the adjustment programs generally thought of as foreign constructs justifies the poverty reduction strategies that the IMF and the World Bank intend to support thereafter: strategies that, thanks to the participatory approach adopted in both preparation and implementation, are called upon to establish a close link between economic growth, on the one hand, and, on the other, poverty reduction and the debt relief granted by development partners. To that end, the IMF’s Poverty Reduction and Growth Facility (PRGF), in coordination with the enhanced HIPC Initiative and the World Bank’s Structural Adjustment Credit (SAC), take poverty reduction strategies as the basic framework for garnering the support of development partners for countries’ own efforts to lead their populations out of poverty. Another feature of the current international context is the steady downward trend in government development assistance and the decline of preferential treatment systems in international trade. Given this growing shortage of low-cost funding and the dearth of trading privileges, poverty reduction strategies have to be both efficient and capable of achieving sustainable solutions. Prepared with this backdrop in mind, the PRSP aims to consolidate the gains made with adjustment programs by integrating them with the new globalized economic order and taking into consideration world development goals in the third millennium.

12
Driven by relentless progress in information and communication technology, globalization liberalizes trade and integrates first capital markets, and then goods and services markets. Thus, in every country in the world, competitiveness has become -- for the private sector converted into the key source of wealth and for the state as strategist – an absolute imperative. However, the liberalization of markets and of private initiative has also triggered and maintained expansion of the so-called informal sector in countries such as Chad, in which it accounts for 70 percent of GDP. The strengthening of inter-African cooperation and integration is expanding markets for businesses and combining the efforts of African states to work more effectively for improvements in the well-being of their peoples. Key developments here include the establishment of the Central African Economic and Monetary Community (CEMAC) in 1994, the Community of Sahel and Saharan States (CEN-SAD) in 1998, and the African Union in July 2002. The New Partnership for Africa’s Development (NEPAD) is the latest initiative. Its principal objective is to enable African economies to overcome their shortcomings in terms of infrastructure and to boost their ability to participate more successfully in the liberalization of international trade in goods and services. This initiative is sponsored, since 1995, by the World Trade Organization. Forged and promoted directly by the African Heads of State, the new partnership is backed by Africa’s development partners and characterized by a steadfast commitment to good governance and the strengthening of democratic institutions designed to achieve sustainable human development in the Continent. The latter’s support for the development goals of the third millennium had already paved the way for the pursuit of policies geared, in every sector, to broadening the options open to all people in a society --men and women, the poor or members of vulnerable groups – who were henceforth placed at the center of the development process. For this to materialize, each of the initiatives undertaken at the national, subregional, or continental level, needs, above all in government administration, to be supported by a general environment conducive to institutions and individuals developing their knowledge and practical skills, as well as the necessary motivation and sense of responsibility. Capacity building was identified in the 1990s as the missing link in development. Its importance for all African countries led the African Capacity Building Foundation, created in 1991, to take up the challenge at the continental level. Chad has recognized the urgent need to reinforce capacities and has entrusted the task to a National Capacity Building Secretariat (SENAREC). In both its contents and implementation mechanisms, the PRSP takes into account the implications of the aforementioned broad initiatives undertaken at the international and regional level as well as new developments at the national level.
1.1.2 The national context Since independence in 1960, Chad has drawn up and implemented several national, economic and social development plans, in addition to structural adjustment programs since 1987. The overall stated objective of these plans and programs has always been “to raise the standard of living of the population.” This was to be achieved by developing the agricultural-forestry-

13
pastoral sector, which employs almost 80 percent of the Chadian population, the creation of social and economic infrastructure that would both open up the interior of the country and link it with the rest of the world, human resource development for a more efficient workforce, etc. Specifically, those programs were to lead to enhanced access to educational, health, and sanitation services, safe water, food security, and so on. Nevertheless, although these programs were put in place, the population has been becoming increasingly poor for the past three decades. Chad’s socio-economic indicators rank among the worst for countries in Sub-Saharan Africa. When the process of preparing the PRSP began, 54 percent of the population lived below the poverty line. Epidemics and endemic diseases are still rampant (including HIV/AIDS, to which 1704 [Tr. SIC] people would succumb in 2000, taking the total number of orphans to 55,000) and child vaccination coverage ranges from 16 to 20 percent. A large portion of the population suffers from chronic food insecurity. Almost 90 percent of the homes offer no protection against inclement weather. One percent of the population has access to electricity and 30 percent have access to safe water. Less than 10 percent of the population has basic sanitation services and there is one telephone line per thousand inhabitants. At the same time, clear progress can be seen in the education sector, where the enrollment ratio was 67.4 percent in 1998/99. However, the percentage of enrolled girls was low at every level of education, depriving the economy and society of the advantages associated with improved education for women. As the participatory consultations showed, there is still not enough sensitization of parents regarding the importance of educating girls, teenagers, and tomorrow’s mothers. Furthermore, the above-mentioned programs have not led to a transformation of the national economy, which still suffers from:
- Very low productivity; - Extreme vulnerability to both domestic and external shocks; - The lack of a dynamic private sector; - Insufficient infrastructure, especially roads; and - An over-sized informal sector.
In effect, the productive apparatus remains dominated by the primary and tertiary sectors in which technical progress is slow, with a predominance of informal, low-productivity activities. The investment ratio is therefore weak (still less than 10 percent), and most of it is government investment at that. Indeed, the dearth of savings and of domestic credit is still a major constraint on the growth of private investment. Overall, in the 1980s and 1990s, the economy was characterized by a practically stagnant standard of living for the population, with GDP per capita – one of the lowest in the world –growing by barely 1.4 percent per annum for over 20 years. Thus, the tax base is tiny (the tax burden averaged six percent between 1988 and 1998) and external trade yields a structural deficit because of the low level of exports. This creates enormous dependence on outside aid, while even a modest level of debt in relation to GDP turns out to be unsustainable for lack of the domestic resources needed to service it. The upshot of this whole set of adverse conditions was a human development index of 0.403 in 1999, a year in which six out of every 10 Chadians suffered a high degree of deprivation in terms of life expectancy, health, education, and well-being.

14
Among the reasons for this failure of the development programs are: • Political instability, which sometimes prevented these plans and programs from running
their full course; • Poor planning of certain actions, which took neither the local context nor the real needs of
the population into account; • Insufficient monitoring of certain actions while they were being carried out; • Failure to involve grassroots groups in the preparation of development programs and
policies; and • The lack of sustainability of actions undertaken with respect to infrastructure and training. To offset the negative impact of these shortcomings on human resource development, implementation of the PRSP should draw on lessons from previous successes and failures. To that end, it was prepared by national staff using a participatory approach, which made it possible to associate civil society and private sector groups with the entire process. The population living in both towns and villages was closely involved in the diagnostic assessment through participatory consultations and the survey on perceptions of well-being and poverty. The national context has also improved as a result of remarkable progress on the democratic front. The process that got under way in 1990 and led to the emergence of civil society and a dynamic, privately-owned press which plays an active part in democratic debate culminated in the holding of the second presidential elections in 2001 and parliamentary elections in 2002. Ongoing decentralization should also enhance the degree to which the population runs its own affairs, especially during preparation, implementation, and monitoring and evaluation of development activities. That is why the PRSP includes as one of its priorities or prior conditions more expeditious restoration of a climate of peace, notably by boosting security for persons and property and generally strengthening the rule of law. Effective judiciary that sees that justice is done and court decisions are punctually enforced, combined with rehabilitation and complete reintegration into society of demobilized military personnel will have a decisive impact on the creation of conditions conducive to the success of the PRSP. As regards economic and social developments, the structural reforms embarked upon in connection with the adjustment programs and the drive toward greater subregional integration, particularly following the devaluation of the CFA franc in January 1994, have led to some key productive sectors being opened up to free competition in the objective that they will become more competitive and the state more disengaged intrusive. At the same time, those reforms led to an improvement in public resource management, the liberalization of trade, greater domestic capacity to manage development, etc. However, the results are not yet sufficient to stimulate the kind of growth needed to bring about a sustainable improvement in the standard of living of the population. In particular, current provisions for young people, who not only make up the bulk of the population (over 48 percent of the population is under 15 years of age) but also need to be prepared for their future responsibilities, for women, who act as a stabilizing force in the family and in society, and for the environment (when over half the country is Sahelian desert) all fall far short of PRSP targets. Thus, following the fourth round table in Geneva, sectoral consultations paved the way for programs focusing on poverty in the priority sectors (education, health and social services, rural development, infrastructure), which constituted a solid basis on which to build the national poverty reduction strategy. Nevertheless, successful implementation of the strategy

15
remains indissolubly tied to the country’s ability to raise domestic and external resources and to manage them effectively. Transparency in the handling of public funds will therefore be of the utmost important to ensure that they are used efficiently and in order to maintain the trust and the involvement of the different actors in the PRSP. The mechanism employed to keep track of HIPC Initiative resources will also be employed to the country’s oil revenue. First, it will be up to the national authority responsible for strategic monitoring of the poverty reduction programs – working with the operational monitoring units in the various ministries, particularly those in charge of the priority sectors – to draw up a report every six months on implementation of the PRSP, to be presented by the Minister of Planning, Development, and Cooperation to an Interministerial Council chaired by the Prime Minister. The first Interministerial Council of the year to discuss the PRSP should be used to review execution of the PRSP in the year just ended and to make sure that the necessary resources are in place for activities falling due in the course of the year. The second Interministerial Council of the year on the PRSP should make it possible to draw up a list of urgent measures required to carry out activities scheduled for the year and to update the PRSP paper, including the annexes, above all for the preparation of the Budget Law. Representatives of the private sector and of civil society will also be invited to attend the meetings of the Interministerial Council on the PRSP (for consultation purposes) either to inform them or because these two sets of partners will be involved in the implementation of parts of the PRSP Action Plan. It will also be sound practice for the Minister of Planning, Development, and Cooperation to meet, after each Interministerial Council on the PRSP, with the representatives of development partners in N’Djaména to keep them abreast of the overall picture with respect to implementation of the PRSP and to hear what they have to say. Between the two meetings of the Interministerial Council on the PRSP, the national authority responsible for strategic monitoring of the PRSP helps the Minister of Planning, Development, and Cooperation to keep the authorities, the people, and development partners informed regarding implementation of the PRSP. To that end, it will be able to tap information provided spontaneously by the operational monitoring units set up by the various ministerial departments involved in executing the activities mentioned in the PRSP Action Plan. 1.2 Presentation of the participatory process 1.2.1 The Steering Committee in charge of the strategy preparation process The PRSP was drawn up by a steering committee installed by the government in April 2000. It is a joint committee which consists of 33 members: 15 representatives of the public sector, 16 representatives of civil society organizations and the private sector, and 2 members of parliament. The representatives of international institutions and of Chad’s development partners take part in the work of the committee as observers. The committee has a permanent secretariat, which is the technical body in charge of preparing the PRSP. The work of the steering committee is validated by the Technical Committee and the High Interministerial Committee for the Structural Adjustment Program.

16
1.2.2 The strategy preparation process The process of drafting the Poverty Reduction Strategy Paper began with an inaugural seminar held in N’Djaména on April 25-27, 2000, which was attended by 200 invitees from all parts of Chad and representing all social and occupational strata: public administration, the private sector, local government, religious communities, and civil society organizations (NGOs, women’s associations, young people’s associations, the government-owned and private media, etc. ). This seminar determined what activities were needed to complete the drafting of the strategy and established a timetable for them. The following activities were carried out: a) A survey of people’s perceptions of well-being and poverty (EPEP) was conducted in April-July 2000. It yielded data on the extent of poverty, the dynamics of poverty, and the perception of well-being by the poor. The purpose of gathering this information was to enhance the relevance of the priority actions to be proposed for the PRSP. b) Ten thematic and sectoral reviews were carried out in May-July, 2000, and addressed the
following topics: • Poverty and rural development; • Poverty and employment; • Poverty, microfinance, and entrepreneurship; • Poverty, health, nutrition, and population; • Poverty and education; • Poverty, safe water, and sanitation; • Poverty, housing, urban development, and transportation; • Poverty and vulnerable groups; • Poverty and macroeconomic environment; and • Poverty and governance. The aim was to gather information that could explain the relations between poverty and activities, situations, and parameters that represent a degree of access to opportunities, assets, skills, and social services. c) A civil society forum was held in November 2000. This was an opportunity for associations and other NGOs to propose ideas to government and to suggest optimal ways to combat poverty. d) A countrywide participatory consultation process called Macro Participation was conducted in December 2000 and January 2001. Including all categories of participants, across the whole country, they involved 7,796 people. The purpose of these participatory consultations is to provide the government with qualitative data on how the associations, groups, traditional and religious authorities, etc. perceive poverty and the ways and means they advocate to improve their standard of living. e) An evaluation of standard programs which took place in February was carried out in March, 2001. The idea was to become acquainted with development micro-projects and to draw

17
lessons from them that could prove useful for implementing the PRSP. To that end, six projects in different fields were selected and examined in depth with respect to their approach to the target populations and their impact on poverty reduction. These projects were:
1) The Savings and Loans Club at Bissi Mafou (Léré) ; 2) Cooperative markets in Koumra (capacity-building for the local population) ; 3) Community health in Bébalem ; 4) Vocational training in N’Djaména ; 5) Oases farming project for Kanem (nutrition); 6) Environmental protection project in Abéché.
The outcome of the evaluation highlighted the positive impact of these kinds of programs on the living conditions of the population involved, as well as their limits. f) A national seminar was held in N’Djaména on May 8-12, 2001 to define strategic approaches and priority actions. Some 150 participants from N’Djaména and other parts of Chad represented the different social strata and, based on the diagnostic assessment findings, contributed amendments to the proposals put forward by the Steering Committee regarding the strategic approaches, national goals, specific targets, and priority actions aimed at reducing poverty in Chad. These strategic approaches and priority actions were then re-discussed at regional seminars held simultaneously in Abéché, Bongor, Mao and Moundou on March 19-21, 2002. For each priority action, performance indicators were established for monitoring and evaluation purposes. A monitoring and evaluation mechanism was also developed and adopted. All these factors led to progressive improvements in the various drafts of the PRSP, which was also enriched by contributions from Chad’s development partners at meetings organized in Washington, D.C. in December 2001 by the World Bank and the IMF, and by the European Union in Brussels in May 2002.

18
Chapter 2 Diagnostic assessment of poverty in Chad Although the available data on poverty in Chad are patchy, they provide a fairly clear picture of the situation in 1995-96, 1997 and 1998, a period during which the economy grew at an annual average rate of 4.7 percent. The subsequent recession in 1999 and 2000 can be expected to have shaped the opinions expressed by persons interviewed for the Survey on Perceptions of Well-Being and Poverty (EPBEP), which was conducted in the first half of 2000. Data for 1999 suggest that at that time almost as many as six out of every 10 Chadians suffered from one or more types of deprivation causing or caused by markedly low levels of life expectancy, health, education, and well-being, particularly in rural areas. The existence of such a large proportion of the population suffering conditions synonymous with poverty requires that a vast program be put in place to enable those affected, throughout the country, to cope with such harsh living conditions and to develop their own ability to tackle and improve them. Stable consumption habits, low productivity in the primary and tertiary sectors which account for the income of almost 80 percent of the population, the downturn in output in 1999 and 2000, and the exogenous nature of the strong growth in 2001 and 2002, mean that the incidence of poverty will undoubtedly not have fallen. Moreover, despite the new oil sector, and barring any new initiatives, there is no reason to expect this situation simply to disappear by itself in the foreseeable future. The statistical data gathered so far in Chad do not directly estimate the degree of inequality in income distribution, which would make it possible to establish a more relevant link between changes in per capita GDP and changes in the standard of living of the bulk of the population. It suffices, instead, to link the large share of the rural population in the total population (80 percent), on the one hand, to the share of the rural economy in GDP, on the other, and to observe the share of the informal sector (which includes the rural economy and the poorest segment of the urban economy) in GDP (70 percent), to reach the conclusion that poverty is a very pervasive phenomenon in Chad. Living above the poverty line constitutes even more of a privilege for a minority, when one considers that quantification of that line according to the data available is lower than the income of a one-dollar per person per day household used for international comparisons. With respect to income-generating activities, poverty is both rural and urban. However, given the large proportion of the population living in rural areas, rural development constitutes a priority. This finding underscores the importance of primary activities, especially agriculture and livestock farming, and hence water management, in the PRSP. Nevertheless, the historical contribution of industrialization to modernization of economy and of society, justifies already attempting to create the conditions required for a major development of manufacturing activities within at most ten years. It emerges from the findings of the various activities undertaken in the participatory process that poverty – regardless of whether it is understood in terms of income, standard of living, capacities, or risks incurred -- is a multidimensional phenomenon. Low productivity characterizes most market-based economic activities in Chad, reflecting a shortage or even lack of capacities due to deficiencies in the health and education systems.

19
Access to education, health care, safe water, a healthy environment, and housing are key factors in any enhancement of well-being. The same is true of employment and income-generating activities, which were identified as appropriate means of ensuring improved household living conditions, especially in an urban environment. In rural areas, people stressed the importance of farming equipment in raising both productivity and output, and the need to develop road networks in order to put an end to the isolation of production centers and of the country as a whole and to allow households to tap the economic opportunities arising in a much larger area. At the same time, mention must be made of the adverse impact of the climate of insecurity and impunity that has been fed for too long by the excessive frequency and scope of armed conflicts in Chad. Undoubtedly, a conflict-ridden environment encourages hoarding in safe havens as much as, if not more than, a peacetime culture encourages investment in productive activities. That is why the PRSP covers not only production and living conditions, but also the institutional environment in general. 2.1 Profile of poverty in Chad
2.1.1 Quantitative analysis of poverty Quantitative analysis of poverty looks at three aspects: i) the poverty profile, ii) the characteristics of poor households, and iii) the characteristics of high-risk social groups. It is based on data from three main surveys: the 1995-1996 Survey on Consumption and the Informal Sector in Chad (ECOSIT), which only covered four of the 14 prefectures in the country, the 1997 Demography and Health Survey (EDST), and the 1998 nationwide Migration Survey (EMT). Supplementing these data are Human Development Index (HDI) data for the different regions. Food-related and overall poverty lines For quantitative analysis purposes, two poverty lines were set: the food-related poverty line, which shows the minimum expenditure on food needed to cover an adult’s calorie requirements1 and the overall poverty line, which covers, in addition to food needs, minimum nonfood consumption needs. According to Table 1, poverty lines are generally lower in rural areas than they are in urban areas. The same is true of other towns compared to N’Djaména. That reflects price differentials and changes in the composition of the consumption basket.
1 For Chad, the daily calorie requirement used (FAO, 1985) is 2,095 kilogram calories in urban areas and 2,175 in rural areas.

20
Table 1 : Food-related and overall poverty lines in 1995-96 per capita and per day in CFA francs2 Rural areas N’Djaména Other towns ECOSIT3 zone Food-related poverty line 151 (0.303) 311 (0.623) 213 (0.43) 194 (0.39)Overall poverty line 195 (0.39) 414 (0.83) 276 (0.55) 253 (0.51)Source : Directorate of Statistics, and Economic and Demographic Studies (DSEED), 1997. For the whole of the area covered by the ECOSIT survey, the food-related poverty line is estimated at CFAF 194 per head per day and the overall poverty line at CFAF 253, that is to say, US$0.39 and US$0.51, respectively. Nationwide, the food-related and overall poverty lines are estimated as CFAF 173 and CFAF 218 per person per day. It should be pointed out that all these lines are well below the international standard poverty line of one dollar per person per day (about CFAF 700). In absolute terms, the difference between the two lines is slight in rural areas and more marked in N’Djaména. In relation to the food-related poverty line, this difference is 22.6 percent in rural areas and 33 percent in N’Djaména, while in other towns the difference is greater (39 percent), a finding to be verified and, if need be, explained on the basis of the findings of the nationwide survey currently being carried out, which will also permit dynamic comparative analysis of poverty in rural and in urban areas. This survey was launched in January 2003, so that in December 2004 the lessons will be drawn from it and taken into account in the annual review of the PRSP. Incidence and depth of poverty The incidence of poverty is that proportion of households spending less than the poverty line; it measures the percentage of poor households. The depth (or severity) of poverty is equal to the difference between the poverty line and the average income of poor households, in relation to the poverty line; it measures the percentage by which the average poor household falls short of the poverty line. Table 2 shows poverty incidence and depth estimates based on the foregoing poverty lines and household consumption outlays in 1995-1996. Table 2 : Incidence and depth of poverty in Chad in 1995-1996 (ECOSIT I)
Poverty indicator by zone Rural areas N’Djaména Other towns Total
Incidence of food-related poverty 46.2 33.8 38.0 41.6 Incidence of overall poverty 48.6 35.0 39.3 43.4 Depth of overall poverty 26.3 30.0 28.3 27.5
Source : DSEED, 1997 Tables 2 and 3 show that in the zone covered by ECOSIT rural areas have the lowest poverty line and, nevertheless, the highest percentage of poor persons and less severe poverty.
2 The figures in parenthesis are in US dollars at US$1= CFAF 499 in 1995. 3 The whole of the area covered by ECOSIT.

21
Conversely, the country’s capital, N’Djaména, has the highest poverty line; but, it also shows the lowest percentage of poor persons and the most severe poverty. This finding is true for both food-related poverty and overall poverty. Moreover, as regards incidence, there is no great distance between these two types of poverty. Furthermore, the more urban the zone studied is, the smaller the apparent difference. Tables 1 and 2 establish a scale, with one end related to the rural nature of the zone under study and the other to the urban nature of that zone. All along that scale, standard rural areas show a lower poverty line and less severe poverty, while both these are higher in urban areas. Thus, the incidence of poverty is more marked in rural areas than in urban areas, for the total zone covered by ECOSIT. However, the difference in living standards between the poor and their neighbors is more visible in urban areas than it is in rural areas. Inequalities are more marked in the towns than in the countryside. Poverty is therefore more widespread in rural areas but poses more of a threat of exclusion to the poor in an urban environment. In conclusion, it is necessary to attempt to reduce poverty in rural areas and also to mitigate the effects of inequalities in urban areas. In absolute terms, the nationwide incidence and depth of poverty might be higher than the above-mentioned levels for two principal reasons:
a) ECOSIT covered only 4 prefectures (Chari Baguirmi, Logone Occidental, Moyen Chari, and Ouaddaï)4. These prefectures, however, are at the top of the list in terms of sustainable human development (Table 3). The poverty is likely to be more widespread in the other prefectures and the incidence of poverty at the national level is likely to be higher than that estimated by ECOSIT I;
b) The poverty line was calculated on the basis of calorie needs of 2,163 kilogram
calories per day per person, instead of the 2,400 kilogram calories per day per person, which is the currently accepted standard for countries in the sub-region. Adopting the new calorie standard would result in higher poverty lines and a higher incidence of poverty.
Thus, if all prefectures were included and the 2,400 kilogram calories per person per day standard adopted, the estimated incidence of poverty would be higher. This possibility could be verified in the aforementioned nationwide survey; meanwhile, it appears to be corroborated by the human poverty index. Human development indicators Poverty is experienced throughout Chad, albeit with substantial differences between regions. The qualitative analysis below illustrates this diversity in perceptions of poverty from one region to another, thereby confirming the quantitative analysis.
4 The term “prefecture” in this paper refers to the old administrative division.

22
According to the UNDP country report on human development in Chad (2000)5, in 1999 the human development index was estimated to be 0.403. The human poverty index (HPI)6 in Chad was estimated at 57 percent, meaning that in 1999 almost six out of every 10 Chadians suffered deprivation in terms of life expectancy, health, education, and well-being. Indeed, approximately 36 percent of Chadians were at risk of dying before they were 40 years old; only one third of the population had access to basic health care; and almost eight out of 10 people lacked access to safe water. A regional breakdown of the human development index (Table 3) shows quite substantial disparities between the different prefectures in Chad. The prefectures that contain the three largest cities: Chari-Baguirmi (N’Djaména), Logone Occidental (Moundou), and Moyen Chari (Sarh) each have an HDI that is higher than the national average. That indicates that the presence of large development pole towns/cities raises the average HDI for the prefecture concerned, although, as noted above, at the cost of more marked inequality. The prefectures with the lowest HDI are Salamat and Lac. Salamat has the lowest life expectancy at birth (approximately 40 years), that is to say 10 years fewer that the national average, and one of the lowest gross school enrollment ratio: 21 percent compared to the national average of 65 percent. The prefecture with the lowest enrollment ratio (17 percent) is Lac. Table 3: HDI estimates, by region
Prefecture HDI Prefecture HDI
Chari-Baguirmi 0.430 Logone Oriental 0.379 Logone Occidental 0.422 Biltine 0.378 Moyen Chari 0.413 Batha 0.368 Tandjilé 0.396 Kanem 0.356 Ouaddaï 0.395 Guéra 0.350 B.E.T. 0.388 Lac 0.319 Mayo Kebbi 0.383 Salamat 0.259 National : 0.406
Source : Country report on human development in Chad, 2000 Existing statistics do not permit an in-depth analysis of poverty by social and occupational categories. However, it can be said that those working in the primary sector (peasant farmers, herdsmen, fishermen) head the poorest households because they make up 78 percent of the population but account for only 38 percent of GDP. Next come households headed by persons working in the urban informal sector, who, while not making up more than 20 percent of the population, account, in conjunction with the primary sector, for 70 percent of GDP, of which their part is therefore 32 percent. 5 In addition to monetary aspects, this index includes other dimensions of poverty, especially life expectancy and level of education. 6The methods used to calculate these figures are described in the sustainable human development report on Chad for 2000.

23
Another angle on how the different social and occupational categories experience poverty emerges from the participatory consultations carried out in all the regions. Participants in those consultations expressed concerns which went beyond direct access to credit and basic social services, insecurity, and the isolation of certain regions, and addressed water management, the need for farming equipment, extension work, and support for local initiatives, as well as the dearth of processing of local products and the lack of means of production. The PRSP integrates rural development policy with urban development policy in order to respond to these concerns felt, inter alia, by people working in the primary sector in rural areas and by informal sector operators in urban areas.
2.1.2 Qualitative analysis of poverty
The methodology applied to qualitative analysis aims principally at hearing the views of individuals without necessarily seeking consensus. It relies on verbal communication in the participants’ native language. Thus, these are group interviews, which were first recorded and then transcribed. The procedure consists of getting together 10-15 people together, chosen on the basis of certain social and occupational criteria in such a way as to form a relatively homogenous group. Under the supervision of an outreach worker, participants are invited to discuss a specific topic. The outreach worker guides the discussions with the help of a partly pre-established interview crib (grille d’interview). Qualitative surveys do not necessarily yield definitive findings and the size of the universe sampled in these surveys is not as important as it is in quantitative studies. The idea is to grasp what people perceive in relation to the subject being studied, which in this case is the poverty they live with and the strategies they intend to apply to combat it. The poverty-related factors and issues raised in the course of this analysis are some, but not necessarily all, the determinants involved. 2.1.2.1 Poverty and well-being as perceived by the population The survey of perceptions of well-being and poverty, based on interviews with segments of the population selected according to social and demographic criteria (poor, nonpoor, young, and old, by gender), made it possible to discern the principal economic and social concerns of the different segments of the population. Underprivileged households have few material goods to enable them to ease the tedium of domestic tasks and their production (especially agricultural) activities. In this sense, households identified individual savings or access to financial services (microcredit) as the means to acquire the material goods that would help improve their living conditions. Most of them established a link between their financial capacity, the cost of living, and income-generating activities that could help them emerge from poverty. For these households, possession of an asset is considered a means to elicit financing or as collateral for a loan that will enable them to exercise income-generating activities.

24
Table 4 : Summary of the issues raised by people, by zone, according to priorities.
Urban area Rural areas N'Djamena Sahara Area Sahel Area Sahel-Sudanese Area Sudanese Area
Health Transportation Agricultural equipment Agricultural equipment Transportation Education Agricultural
equipment Credit Transportation Agricultural equipment
Environment Health Safe water Road infrastructure Health
Credit Education Health Health Education Housing Food Livestock Safe water Food Safe water Safe water Education Credit Safe water 2.1.2.2 Lessons drawn from participatory consultations Participatory consultation interviews were conducted separately with the following social and occupational groups: young people by gender, stockbreeders’ associations, farmers’ associations, women’s groups, widows, orphans, the disabled, the retired, civil servants, heads of NGOs, members of parliament, and local heads of religious confessions . The purpose of the participatory consultations was to expand and refine the picture that emerged from the survey on perceptions of well-being and poverty and to enhance familiarity with specific regional aspects of the nature and causes of poverty. In fact, the consultations revealed a wide range of perceptions that are listed in detail below. Moreover, it was through these consultations that governance concerns emerged. These regional specificities definitely need to be taken into account in the strategies devised. Guéra-Salamat For people in these two prefectures, poverty in their region is linked to the lack of safe water, health structures, education, and a road network. In addition, they cite:
• the lack of microfinance facilities; • the absence of peace and security; • the lack of adequate premises for government departments as well as extremely
unstable housing; • the lack of facilities to support local development initiatives; • the unavailability of means of communication; • the lack of production and processing units for local products; • poor governance; • the lack of agricultural equipment; • the sanitation problems in the area; • the poor state of the roads and rural paths linking the different villages; • the continuous environmental degradation; • the underdevelopment of land and subsoil in the region; • the lack of trained teachers; • the shortage of health personnel; • the occasional famines;

25
• the large number of orphans and widows living in the area. The absence of a social safety net greatly exacerbates the already precarious situation of these vulnerable groups;
• the lack of clothing is also a major consideration in the perception of poverty; • the irregular payment of civil servants’ wages;
Mayo-Kebbi/Tandjilé In this area, poverty is defined as the status of an individual without physical or financial means. Poverty is also perceived as the status of:
• persons with no possessions, who cannot enroll their children in school and have no means of getting around. It is the lack of well-being, the lack of everything that is useful for life, namely, health, education, housing, food, and clothing;
• a country unable to provide well trained teachers in its learning institutions. There are many causes of poverty, in particular drought, the lack of means of production, ignorance (illiteracy), the poor quality of the soil, the isolation of villages, low prices for agricultural products, nonpayment of retirement pensions, alcoholism, parasitism, the lack of jobs for young people, the lack of people’s initiatives and organizations, insufficient health centers, the lack of safe water, late rains, the lack of technical support for peasants, and poor management of the national resources. Opinions differed on one issue -- the status of women. Many people think that women should enjoy freedom so as to be responsible for the management of their activities. However, others prefer the status quo, which requires that women remain submissive to their husbands. The second special issue is that of governance, especially as relates to the conflict between farmers and stockbreeders. People want to have their say in political decisions; they see themselves as constantly being victims of conflicts (farmers vs. stockbreeders) or of discrimination by the political, administrative, and military authorities. Accordingly, they define poverty in terms of a lack of freedom of action, security, and equity. To fight against poverty in this region, people also suggest rehabilitating the OMVSD (Office to Develop the Satégui-Déréssia Plain) and the creation of other hydro-agricultural developments, the reopening of the Cotontchad (Bongor, Guidari) factories, and the sensitization of parents to the need to educate their daughters. Borkou Ennedi Tibesti (B.E.T.) For the people of this region, poverty is the status of those who cannot eat their fill, who do not have the means to obtain care if they are sick, who cannot educate or clothe their children, who lack decent housing, and who have no security in their homes. Additional factors are:
• the problem of a lack of safe water for people and livestock; • illiteracy as a scourge and a major impairment to any development initiative; • the lack of technical training for adults who have already grasped the point of
becoming organized to fight against poverty in their region;

26
• the inadequacy of health services and of qualified health personnel exacerbates an already unstable health situation;
• the inability of oasis farmers to be productive because of the lack of training and appropriate equipment;
• the lack of maintenance of existing road infrastructures; • the unavailability of an access road to Libya; • the unavailability of banking and agricultural credit institutions; • the failure to supply ONC (National Grains Office) shops with grain products; • the shortage of wells near pastures; • the lack of dams for river water reservoirs; • the unavailability of animal health care service structures in Fada; and • the lack of security caused by the existence of mines everywhere.
Kamen-Lac The interviews with the people of this region show that poverty is perceived in terms of the lack or shortage of resources to meet vital needs for food, housing, clothing, and health care, and especially to ensure the safety of one’s property and person. People described the following factors as causes of poverty in their region:
• the region’s isolated location; • the lack of a credit scheme to enable farmers to procure the means of production
(automatic pumps, tractors, carts, etc.), for traders to increase their capital, and for stockbreeders to reconstitute their livestock;
• illiteracy, the lack of school infrastructures, shortage of teaching personnel, the lack of equipment (tables/desks, blackboards, etc.), the lack of school canteens to encourage girls to attend school;
• the lack of sensitization of the traditional and religious chiefs to sending children to school and especially to allowing girls to pursue their studies; and
• the lack of adequate birth centers and laboratories for medical analyses, the lack of ambulances for emergency evacuation of the sick, the shortage of competent medical personnel, and the lack of activities to heighten awareness regarding personal and environmental hygiene.
Chari-Baguirmi and Batha Poverty is defined by the people of Massakory as an absence of the resources necessary to meet basic needs, such as health care, food, access to safe water, etc. Poverty is also evidenced by occasional famine, water-related diseases, and the myriad social problems that people do not manage to solve. To these must be added drought, the numerous civil wars, the isolation of the villages because of the poor state of roads, and poor governance of the country. In Bousso, the main determinant of poverty is the lack of adequate school infrastructure, resulting in greater ignorance among the people. In addition, health and road infrastructure is

27
inadequate, there is no social safety net, and the water is not safe (the people drink river water). Ouaddai-Biltine In this region, poverty is defined as the lack of access to physical and financial resources. Among the causes identified are poor governance, a lack of security, lack of rain, low wages, the lack of means of production, ignorance, insufficient wells in pasture lands and villages, nonpayment of the pensions of civilian and military senior citizens, and the absence of support structures such as NGOs and public utilities. The population also points out that “the lawlessness of bandit camel-drivers has struck fear into the heart of the population living in the rural area of Ouaddaï-Biltine. Besieged in their communities by cruel roadblock bandits and living like prisoners, the inhabitants cannot venture into the bush, even to collect gum arabic". They also named the following as causes of poverty:
• war and the conflicts between farmers and stockbreeders; • degradation of the environment; • illiteracy and laziness; • poor governance, corruption, embezzlement…; • the lack of work materials and tools, and road connections; • impunity and declining moral standards; • the lack of water; • the lack of extension work; • the lack of health structures, especially for mothers and infants. On the other hand,
women refuse to be examined or even interviewed by a male doctor; • the lack of educational structures: the few schools lack teachers and schoolbooks; • the lack of modern agricultural equipment and archaic cultivation techniques.
Moyen-Chari and the two Logones Poverty is perceived in this area as an inability to meet the basic needs of people for food, health care and education for their children. The principal determinants of poverty identified by the people are:
• the poor state of the roads; • the lack of agricultural and financial credit; • increasing insecurity created by roadblock bandits and stockbreeders; • injustice as a result of poor management of the numerous conflicts between
farmers and stockbreeders; • the theft of yoking oxen and the arbitrary fines imposed by the military and
administrative authorities; • the depletion and impoverishment of arable land; • mismanagement of public property; • the isolation of production centers; • alcoholism, which is now a scourge in the region; • the lack of school and training infrastructure;
28
• the shortage of teaching staff; • widespread inflation, in particular with respect to the prices of essential goods; and • low purchasing power.
To stamp out poverty, the priority actions to be taken should be focused on:
• education and vocational training; • good governance with a view to creating an environment conducive to
development; • peace and security as a prerequisite of development and sufficient output; • money/credit as a basis for autonomy; and • road infrastructures for trade and for increasing agricultural production.
N’Djaména In the capital city of N’Djaména, the Steering Committee organized several meetings with the major administration, civil society, and private sector groups. According to the people in N’Djaména, poverty in Chad is the result of bad governance. Eradicating it, they say, will require a change of mentality and of behavior in public administration as well as sustained growth focused on sectors that can improve the lot of the poor. Conclusion In conclusion, it can be said that poverty is to be found in the overwhelming majority of Chadian households, in both rural and urban areas. However, the data available appear to underestimate the pervasiveness of the problem. The percentage of poor households is likely to be in the region of 60 percent or more. In both percentage and absolute terms, the problem is worse in rural areas, because the population of Chad is largely (approximately 80 percent) rural. Certain socio-economic groups are at high risk. These are above all women and children needing special protection, the disabled, demobilized military personnel, senior citizens, and persons living with HIV.
2.1.3 Typification of poor households The analysis in this section is based on an indirect method that, in the absence of income and consumption data, enables the level of well-being of a household to be inferred from its capital goods and other factors, such as the quality of the water it drinks. In effect, the principal component analytical technique makes it possible to classify households in ascending order from the first that possesses none of these goods or fewer than the others to the last, which possesses all of them or more than the others. For analytical purposes, the households are divided into five groups (quintiles) from the poorest to the most well-off, with each group representing 20 percent of the household in the sample. Between the Very Poor and the Well-Off, on the national scale, there are the Poor, the Average, and the Fairly Well-Off. Level of education of the head of household

Chart 1 shows a positive correlation between the level of education of the head of household and the standard of living of the household. In quintile) households, the head of household isoff (last quintile) households. That suggest ability to seize socio-economic opportunitie dependents of suffering the deprivations th mother’s level of education is decisive in de members of the households, especially the chi
Source : Migration Survey for Chad, 1998. Extent of access to safe water Chart 2 shows that poor households have ppercent). They use almost exclusively water from various kinds of contamination and washare with animals. On the other hand, 62 pesafe water. However, if one takes into accounin a series of steps taken to transport and cactually using safe water is likely to be low. Thus, a very high percentage of the populatiosuch as typhoid and cholera which stem from b
0% 20% 40%
Very Poor
Well Off
Total
CDistribution (%) of househol
and level of educatio
Illiterate Primary school enrollm
0
10
20
30
40
50
60
70
Very Poor Poor Average Fairl
Chart 2: Distribution of housepotable water (tap, public fountai
standard of liv
S
approximately 85 percent of the very poor (first illiterate, compared to 56.4 percent in the best-s that education, which develops individuals’s, limits the risk of an individual and his/herat go with poverty. Thus, the impact of thetermining the degree of hygiene and health of
ldren.
60% 80% 100%
hart 1ds according to standard of livingn of the head of household
ent Secondary school enrollment
29
ractically no access to safe water (only 0.12 from traditional wells that are poorly protected ter from marshlands and ponds that they often rcent of nonpoor households do have access to t the fact that this water might be contaminated onserve it, the percentage of nonpoor houses
n is at risk for water-related epidemic diseases ad quality of drinking water.
y Well-Off Well-Off Total
holds with access to n, well) by household ing

30
In rural areas in Chad in 2000, 17 percent of the population has permanent access to safe water and 7 percent practice some form of sanitation. In towns that have a potable water conveyance network, 9.7 percent of the population have a connection to it, 27.5 percent fetch their water from the public fountain, and the rest (62.8 percent) use often traditional wells. Altogether only 23 percent of the population has permanent access to safe water. As regards sanitation, no town has a functioning waste water evacuation system: collection networks are dilapidated. Less than two percent of the inhabitants of towns and cities have lavatories with running water while latrines are practically nonexistent in rural areas. As a result, the poor are frequently exposed to chronic diseases related to poor living conditions and lack of access to water and sanitation. Moreover, water-related chores (which take four to five hours a day in certain areas) may, among other things, shorten the time spent on more productive and fulfilling activities. Poverty and gender According to Chart 3, households headed by a women are more prone to poverty than those in which the head of household is a man: 54 percent and 34 percent, respectively. This is partly to be explained by the fact that most women heads of household are widows or divorcees with dependent children and scant resources. Moreover, their principal occupations are in the informal sector, in which income is low and irregular. Women heads of household usually lack a professional qualification that could open the door to better-paid employment. In rural areas, most lack regular access to fertile land7 and live off minor food processing activities, the sale of firewood, or community transfers.
7 Generally speaking, inheritage practices favor the sons, who divide their deceased parents’ land among themselves. Moreover, in some regions the social hierarchy is such that first the head of the canton and the rual headman (chef de terre) help themselves, followed by the others. In developed areas, rent has to be paid, which the poor can generally not afford.
Chart 3: National distribution of householdsby standard of living and gender of the head of household
19.5 25.14 20
18.57
28.8220
20.62
13.72
20
20.7116.06
20
20.6 16.26 20
0%10%20%30%40%50%60%70%80%90%
100%
Male Female Total
Well-Off
Fairly Well-OffAverage
Poor
Very Poor
\

Nutritional deficiencies Data for 1997 (EDST, 1997) show that 40 pe chronic malnutrition (insufficient weight), hal 4, this ratio is higher in very poor household percent). On the other hand, the infant morta and nonpoor households. The same is true of indicate that the level of income is not the on In fact, the parents’ level of education, access important as monetary resources in ensuring th Nutritional deficiencies stem above all fromamong those that do have the resources, geneaverage daily calorie intake is estimated at 1,7Saharan Africa and 2,480 for all developing care underweight at birth. Fifty-five percent ofmonths suffer from delayed growth. The figuurban areas (32 percent). Twenty-one percenmass index. Fifty-five percent of households u
one of
in the
05
101520253035404550
Very Poor Poor Average FaiWel
Chart 4: Percentage of childreof age suffering from malnutri
weight)
Moderate Severe
Source : EDST, 1997
0
50
100
150
200
250
Very poor Poor Average
Chart 5:Infant and child morta
by households' standard of li
Infant mortality Child mo
Source : EDST, 1997
rcent of children under the age of 5 suffer fromf of them in a severe form. According to Charts (46 percent) than in nonpoor households (34lity rate (Chart 5) is roughly the same for poor the child mortality rate. That would appear toly factor determining infant and child mortality. to quality health care, breast-feeding, etc. are ase right living conditions for infants.
rlyl-Off
Well-Off Total
n under 5 years rion (insufficient
31
eating habits. Most Chadian households, even rally eat food with little nutritional value. The 20, compared with an average of 2,160 for Sub-ountries. Approximately 15 percent of children
children between the ages of 24 months and 35 re is higher (42 percent) in rural areas than in t of mothers are estimated to have a low body se iodized salt; that explains why statistics once
showed Chad with the highest incidences of goiter world.
FairlyWell-Off
Well-Off
lity rates ving (per 1000)
rtality

Access to health services Chart 6 shows that very few (less than 5 perce health center, compared with approximately 2 Giving birth at home, women run a greater ri complications. The low use made of health fac to be due either to the lack of such facilities in tradition. Since the percentage of women from at home is relatively high (63.7 percent), the s plausible reason for the nonuse of health s services, which the poor cannot afford, should Housing and urban development As regards housing, over 90 percent of Chadwith no garbage disposal facilities. In rural artowns, promiscuity and poor hygiene regulendemic diseases (cholera, typhoid, meningidifficulty of obtaining legal title to land and The inability of government departments to reland to build on has led most inhabitants of anarchic fashion, even though some of t(subsidence, swamps). 2.2 Vulnerable social groups
Chart Distribution (%) of chi
and households' stan
0%
10%
20%
30%
40%
50%
60%
70%
80%
90%
100%
Very Poor Poor Aver
Health facility
Source : EDS
nt) women from poor households give birth at a0 percent of women from nonpoor households.sk of them or their infant dying in the event ofilities by women from poor households is likely the vicinity and/or the cost involved, or else to well-off (last quintile) households giving birth
hortage of such facilities appears to be the mostervices, although the problem of the cost of not be underestimated.
6 ldbirths by place dard of living
32
ians live in houses built of unstable materials, eas, the figure exceeds 98 percent. In the major arly expose the inhabitants to epidemics and tis, etc.). This situation is perpetuated by the the high cost of quality construction materials. spond to demands from townspeople for plots of the towns to occupy land on the outskirts in an he land may be unsuitable for construction
age Nonpoor Well-Off
At home
T, 1997

33
- Certain social groups in Chad have a higher propensity to be poor than the rest of the population: these are the vulnerable (or at-high-risk) groups.
-
a) Women in particularly dire straits (WPDS) These are mainly widows, divorcees, and single mothers, whose precarious socio-economic circumstances place a huge constraint on their human development. In addition, women in general suffer other forms of discrimination that impair their well-being, such as premature or forced marriage, exclusion from inheritance, and excision. With respect to premature marriage, positive law establishes 13 years of age as the minimum for a marriage to be considered valid, which concurs with common law (the findings of the 1993 census showed the average age for first marriages as 15.8 years). As for forced marriages, 30 percent of the women surveyed (in 1999) stated that they were either married or were victims of an attempt to make them marry against their will during their youth. As regards inheritance, 33.9 percent of urban women declared that they were unable to inherit from their parents because of their uncles (1999 survey). While the Civil Code has provisions favoring the right of women to inherit, animistic common law has established an unjust treatment of women in this regard. Muslim customs treat women better in the sense of allowing them a portion of what their parents and next of kin leave them, even though they discriminate in favor of boys. As for inheriting from a husband, only 5.8 percent of the married women interviewed think they will be able to inherit or have actually obtained an inheritance for themselves, as opposed to 29.7 percent thanks to their children. A number of women (4.3 percent) think they cannot inherit because they are sterile and 14.1 percent think it is impossible because of opposition from the husband’s relatives. The Family and Individual Persons Code, which is currently being drafted, should aim at restoring gender equality in this area. Excision, which is an obligatory rite of passage for girls in several ethnic groups, is another form of violence against women that damages their health. The justifications given for this practice are both cultural (above all, the quest for purity) and social, in the sense that it provides an opportunity for accelerated education and apprenticeship with regard to conjugal life and femininity. b) Children needing special protection (CNSP) These are children who have difficulty adapting or being re-inserted into family or social life. They lack access to basic services, and physical, moral, or legal protection. UNICEF estimates that there are 10,802 “children needing special protection.” Of them, about 10 percent are under supervision. The “CNSP” are divided into several subgroups, including: ! “children of and on the street.” This is the largest group and comprises approximately
10,000 children; ! “child combatants,” of which there are some 600; ! “orphans and abandoned children,” numbering approximately 590; ! “children who are victims of crimes and political repression,” who are estimated to
number 110, most of them located in the capital.

34
c) The disabled The number of disabled people, including all categories of disability, was estimated in 2000 as at least 487,0008 (Table 5). Most of the disabled are illiterate or unskilled and are therefore unemployed or reduced to begging. Nevertheless, they have formed several associations, which facilitate their reintegration into economic life, especially in rural areas in which there tends to be greater solidarity. Table 5 : Distribution of the disabled, by disability
Nature of the disability Number of disabled Physical (poliomyelitis) 163 000 Visual (river blindness, trachoma) 130 000 Hearing (meningitis, otitis) 70 000 Mental 16 000 Senility 108 000 Total 487 000
Source : ILO, Mission Report to Chad, July 17, 1995 d) Retired persons The number of retired persons in Chad rose from 4,500 in 1993 to 13,438 in 2000. The retiree problem essentially consists of failure to pay their pensions on a regular basis. Current fiscal constraints have prevented a solution to this problem, which, nevertheless, needs to ironed out as soon as possible. e) Demobilized military personnel The number of demobilized military personnel is currently estimated at 27,046. With help from its partners abroad,9 the government has put in place a program to reintegrate this group into the economy. Its pilot phase, which began in January 1999 in five of the old prefectures (Chari-Baguirmi, BET, Ouaddaï, Mayo-Kebbi and Moyen-Chari) has just concluded with some clearly discernible results: 399 projects funded for 2,777 reintegrated demobilized military personnel (out of a projected total of 3,500). However, the low level of education of the demobilized personnel (approximately 80 percent have had no schooling at all) makes it difficult to envisage their swift reintegration into society and the economy. The risk posed by this group for national peace and security requires a more resolute commitment to the
8 Ibrahima N’Daye, Mission Report to Chad, June 18 to July 17, 1995, ILO. 9 The World Bank and German Cooperation.

35
implementation of a rehabilitation and skills development program for the group to facilitate their integration. f) Victims of HIV/AIDS The challenges to Chad’s health services, which were already difficult to tackle in the short term, have been compounded by the worryingly rapid spread of HIV/AIDS. Indeed, the number of confirmed cases of AIDS has risen from 10 in 1989 to 1,010 in 1993, to 1,343 in 1996, and to over 12,000 cases in 2000. The percentage of people testing positive for HIV/AIDS in rural and urban areas ranges between 4 and 10 percent. The speed with which this disease spreads and the social and economic havoc it wreaks make it a development, as well as health, problem. According to World Bank report No.16567-CD (1997), approximately 8,000 pregnant women per year test positive for HIV, and 30 to 40 percent of them transmit the disease to their child. This pandemic directly impairs economic growth because it mainly affects the economically active population: 56 percent of detected cases are in the 15-49 year old population, in which women of child-bearing age account for 31 percent and men in the same age group 32 percent. According to the Population and Fight against AIDS Program (Programme Population et Lutte contre le SIDA), the incidence of HIV/AIDS is approximately 4 percent. In some regions, the figure is 6 percent, or even 10 percent. There are approximately 55,000 AIDS orphans (up from 38,000 in 1997. However, the statistics are dubious, inasmuch as surveillance of the disease is deficient due to the shortage of equipment, reagents, and qualified staff. AIDS leads to marginalization. Its victims become a burden on their families and those who die of it leave children that society has to take care of. Actions so far taken by the government, with assistance from external partners, aim to contain the spread of HIV/AIDS; community-based and public care for AIDS victims and orphans is still rudimentary. The speed with which this disease spreads and the social and economic havoc it wreaks make it a development, as well as health, problem.

36
Chapter 3 Determinants of poverty and opportunities in Chad The poverty described in the foregoing Chapter reflect Chad’s modest and poorly distributed economic growth over the past four decades, and bad governance. Analysis of these two broadly inter-related factors makes it possible to highlight the underlying causes, and hence the constraints on poverty reduction. 3.1 Determinants of poverty
3.1.1 Governance The modest economic growth is the result of malfunctioning government on the one hand, civil society, and private sector institutions on the other hand, which in turn reflects a lack of good governance. That lack is evidenced by the difficulty the state has in ensuring sustained security for people and property by means of a reliable justice system and responsible defense and security forces, capable of guaranteeing an environment that provides incentives for business and encourages the development of the private sector; and by shortcomings in planning and macroeconomic management that explain the dearth of public infrastructure described above. In addition, the temporary accumulation of government arrears following the payment problems places a constraint on business activities. As perceived by the people of Chad, shortcomings include: ! A government apparatus that needs to be improved and currently suffers from
qualitative and quantitative human resource deficiencies, as well as a lack of infrastructure and operational tools;
! A poorly managed, ill-equipped, and ineffective administration, which pays little attention, in its human resource management system, to civil servants’ qualifications and therefore demoralizes them. In addition to that, the Chadian government suffers from quantitative and qualitative human resource shortcomings, compared to some African countries. It also works under inappropriate physical conditions in run-down and ill-equipped premises. The government lacks the ability to devise social and economic policies.
Despite the reforms embarked upon, the National Good Governance Strategy (SNBG) points to the persistence of numerous forms of inertia related to the working conditions and behavior of government officials and civil servants, especially corruption, influence-peddling, and unfair competition practices. Daily violations of human rights are justified on the grounds that those rights are not observed by the government officials responsible for enforcing the laws and because of the lack of a democratic culture. Biased management of the farmer-stockbreeder conflict by local governments and political authorities is a case in point. According to grass roots groups, the lack of tools provided for the national mediator actually casts doubt on the authorities’ real intentions with regard to settlement of conflicts. At the same time, the people pointed out in no uncertain fashion that the government had failed to guarantee their safety and that of their property in such a way as to allow them to devote themselves to increasing their wealth without fear of having it taken away from them. For that reason they listed reform of the security and defense forces among the priority actions

37
needed to restore conditions conducive to a normal life. That reform should be coupled with reform of the judiciary in order to restore the justice system’s credibility for those under its jurisdiction: an achievement that would also have a positive effect on the development of the private sector. After several decades of armed conflict, the defense and security forces are disorganized and constitute, rather, a threat to the security of persons and property. Discriminatory treatment of these forces has led to a lack of discipline within the different units made up of both trained and untrained soldiers. The difficulties of reintegrating demobilized military personnel and the irregularity with which pensions are paid are a source of insecurity in the country. The uneven distribution of basic social services between the capital and other towns, and between rural and urban areas, is also a result of institutional and human shortcomings, as well as poor political choices. The Administration needs to re-establish trust between it and citizens as the only means by which the Government’s political and economic signals can be correctly evaluated by the different players in national life. In the health sector, most doctors practice in urban areas, especially the capital. The same concentration is found in public health facilities. The percentage of the population theoretically covered by first tier health centers is 71 percent, but it should be noted that in 1996/1997 only 43 percent of households lived within five kilometers of a health center and 31 percent lived more than 15 kilometers away. In urban areas, 97 percent of households were within the five-kilometer radius, compared to 40 percent in rural areas. Over half all rural women need two hours or more to reach the nearest health post and 70 percent of them need to travel at least 70 kilometers to reach the nearest hospital. It is not hard to imagine what that means for a peasant farmer required to travel so far to obtain medical care for himself or a member of his family. Furthermore, despite the shortage of physical and financial resources with which to make the infrastructure operational, 40 percent of the budget and 20 percent of foreign aid are spent on N’Djaména and its surroundings, an area that is home to approximately 20 percent of the total population. Telephone services and electricity, water mains, courts, prisons, etc., are only to be found in urban areas. In the education and training sector, with the exception of the centers of higher education (universities, technical institutes, and colleges), buildings are put up in certain regions where there are no pupils, while in others where there is a huge demand for education pupils are on the floor in makeshift classrooms built by their parents. The community teachers issue mentioned earlier applies to only a part of the country, so that certain communities are more sought after than others as regards participation. The difficulties women face in obtaining loans and other resources, the low enrollment ratio for girls, and the modest number of women in government and civil service and decision-making bodies constitute further examples of uneven distribution.

38
Box 1. A civil society keen to participate fully in national life but without the required skills The emergence of a proactive civil society is one of the most pleasing facets of democratic progress in Chad. In areas as essential as productive activities, above all in rural areas, the defense of social rights, and the press, the Chadian civil society has shown its commitment to working with the people. Unfortunately, it is undergoing financial and material strains and a shortage of human resources that hamper its actions. It is encountering major obstacles in its attempts to collaborate with administrative and political authorities. Since it plays a vital part in social mobilization, boosting its capabilities plays an important part in any poverty reduction strategy. That will, among other things, help foster the entrepreneurial spirit. Box 2. An incipient private sector facing a regulatory framework offering it few incentives and bereft of financial support Chad’s private sector is incipient and consists mainly of small traders. The abovementioned lack of a sense of initiative is compounded by an unfavorable business environment and a banking and financial system incapable of serving the private sector. Indeed, the banking system in Chad boils down to five commercial banks and an agricultural bank with offices in only five towns. Moreover, it grants very few loans to the productive sector, and those that it does grant are mostly (72.5 percent) short-term. Long-term loans account for only 2.2 percent of the banking system portfolio. In short, easing the major constraint on development of the private sector involves: i) improving the regulatory and tax framework; ii) developing initiative; iii) developing a banking and financial system in support of investment; and iv) guaranteeing long-term political stability to safeguard future investments and to attract private, and especially foreign, capital.
3.1.2 Modest economic growth Economic growth since independence has always been modest: the available data show real GDP per capita growing by only 1.4 percent per annum since the start of the 1980s. Since 1995, real GDP has grown on average by 3.2 percent a year, that is to say by 0.7 percent per capita per year. This low rate of economic growth reflects low productivity in the economy, failure to create an appropriate institutional framework, a weak workforce, and the shortage of basic economic infrastructure. The low level of productivity, in turn, is a feature of the primary sector in which almost 80 percent of the economically active population works. It reflects the nonexistence of any real processing, the fragmented nature of the services sector, and the fact that economic agents are not engaged in developing Chadian agriculture. 3.1.2.1 Low productivity in the primary sector Low productivity in the primary sector reflects the use of extensive farming and stockbreeding techniques, lack of agricultural equipment, the whimsical nature of the climate, poor organization in rural areas, and environmental degradation. A low ratio of equipment and input supplies due to the lack of financial resources

39
Farming methods have barely evolved in Chad, in either agriculture or stockbreeding, since the introduction of the plow at the end of the 1950s and of modern agricultural inputs (fertilizers and pesticides) in the 1960s. Most farmers still use hoes. This is partly the result of failure to sensitive farmers to the usefulness of more modern techniques, because of the low level of peasant farmers’ education and training, and partly also a reflection of the high cost of using those techniques. The fact is: without an appropriate credit system, farmers cannot afford to acquire agricultural equipment. Currently, the most widespread form of credit takes the form of provision of agricultural machinery by the National Office for Rural Development, some NGOs, and development projects and of inputs provided on credit by Contontchad, which sometimes imposes difficult repayment terms. Noteworthy, too, is the noninvolvement of Chadian economic agents in agricultural activities. Failure to employ modern technology and lack of equipment prevent productivity from increasing, thereby limiting access to adequate funding. That creates a vicious circle because it diminishes the ability of farmers to acquire modern equipment. It is also worth pointing out that the lack of equipment and reliance on rudimentary farming methods means that the population in rural areas spends the bulk of its time working the land, leaving little opportunity to diversify into activities that could become sources of additional income. As for stockbreeders, extensive pasturing and herding remain the norm and remain heavily dependent on the weather. Some specialists consider that there has not yet been a change in mentality toward more productive livestock farming, geared not only to the satisfaction of needs but also to raising income. Again it is worth noting the only modest ability of the rural training system (training and rural outreach centers, extension services) to reach the majority of producers and disseminate new techniques. Another constraint affecting farmers, stockbreeders, and mobility in general is the existence of explosive remnants of war (mines and ammunition) in certain parts of the country, as indicated below. Over-dependence of output and hence income on the vagaries of the weather and on continuous degradation of the environment. Primary sector productivity is also a function of climatic shifts. This dependence is exacerbated by lack of control over water resources and impotence vis-à-vis pests and continuous degradation of the environment. Irrigation techniques and rational water resource management (collection and preservation of water for subsequent use when it is scarce) are practically unknown in Chad, even though they are widely used in certain countries at a similar stage of development. That means that farm output is heavily dependent on rainfall patterns. Primary sector output is also vulnerable to pests: rodents, locusts, granivorous birds, as well as plant and animal diseases. The inhabitants of rural areas are frequently powerless against these “enemies” for lack of the products or appropriate technology needed to combat them. Finally, the continuous degradation of the environment in the form of impoverishment of the soil, desertification, and erosion from wind and water contributes to low productivity in the primary sector.

40
It must be said that, on the whole, the people of Chad have not yet really grasped the need for rational management of the environment. The fact that there are still areas that have not been developed creates the illusion that there is still substantial room for maneuver; so much so that they are not concerned for the time being about the long-term impact of their activities on natural resources and on the fate of future generations. The scope of the environmental problems exceeds the real capacity of the departments concerned to solve them. The sheer size of the country, the complexity of the phenomenon, and the modest resources at the disposal of the Ministry of the Environment are daunting challenges to be overcome by any attempt to provide effective protection of natural resources. Existing laws and regulations on the environment are old, ill-adapted to reality, or simply not applied, even when amended. Interdiction, exclusion, and repression are the favorite instruments used by the departments responsible for managing the environment to the detriment of a participatory, reasoned approach accepted by all the players. Actions taken so far to combat desertification are more like improvements to the environment (green belts) or efforts to promote agricultural and forestry output (gum arabic and shea nuts) and they are too limited in scope and time to have a significant impact on the desertification process. Until environmental issues are grasped in their entirety, not just in terms of natural resource management but also in terms of economic growth and hence as a way to improve the standard of living of the population, it will not be possible to be rid of this constraint. 3.1.2.2 A practically nonexistent processing sector Low productivity in the primary sector is accompanied by a lack of processing facilities. The industrial sector is extremely limited and consists mainly of the Chadian Cotton Company (Cotontchad), the Chadian Sugar Company (Compagnie Sucrière du Tchad - CST), the Breweries of Logone (Brasseries du Logone - BdL), the Chadian Cigarette Manufacturer’s (Manufacture des Cigarettes du Tchad - MCT), the Chadian Water and Electricity Company (Société Tchadienne d’Eau et d’Electricité - STEE), and the Chadian Soft Drinks and Coolers Company (Boissons et Glacières du Tchad - BGT). The rest of the sector comprises above all small poorly controlled informal units that generate very little value added. Food processing lines are barely developed, there being no industrial unit to process meat, milk, animal skins and hides, or eggs, so much so that the main line in this sector is exports of live cattle. Of a huge range of agricultural products, only the cotton and sugar industries are relatively well developed, while the textile mill has closed down. Thus many other lines remain to be developed to expand the productive base of the country and exploit the subregional market for exports of manufactured goods, a field in which Chad is totally inactive today. The development of a processing industry would generate both jobs and income. Moreover, being less vulnerable to the vagaries of the weather, this sector would be a more reliable source of steady growth, provided that other hurdles are overcome, especially regulatory problems, the lack of basic economic infrastructure, and so on. The weakness of the processing sector has to do with that of a private sector more inclined toward trade than toward productive activities. Chad’s private sector labors under a still unattractive regulatory and legal framework, despite efforts already made to improve them. More entrepreneurial spirit is still needed to take full advantage of existing opportunities.

41
The Chamber of Commerce, Industry, Agriculture, Mining and Crafts (CCIAMA), which ideally should act as the interface with the authorities, lacks the human, material, and financial resources it needs to fulfill its mission effectively. It rarely participates in major economic decisions. 3.1.2.3 A largely unproductive tertiary sector Tertiary sector activities also suffer from low productivity because they comprise very small units in the informal sector that are essentially engaged in commerce and transportation. The sector’s productivity is heavily constrained by the narrowness of the domestic market due to the modest purchasing power of the population, the difficulty of marketing goods and services throughout such a vast country, and the dearth of roads and other connections, which increases costs. The development of services is also hampered by contraband imports, which penalizes economic agents in the formal sector, who are heavily taxed in comparison with informal sector operators. 3.1.3 Highly deficient human resources and living conditions 3.1.3.1 Education, training, and literacy classes The modest economic growth also reflects the weakness of Chad’s human resources, whose productivity is limited by the fact that over 80 percent of the population is illiterate and only a small percentage of people over 15 years of age has received an education. This creates a barrier to assimilation of new technology that could improve working conditions and thereby improve the standard of living of the people. It also partly explains why ancestral methods continue to be used in the primary sector. A vast literacy campaign is therefore urgently needed to raise the general level of the population and induce changes in behavior and mentality, and to ease the constraint imposed by the very high percentage of illiteracy. The human resource weakness is also manifest in the almost complete absence of the skills which form the basis for economic development; these are basic skills in the construction and public works sector, in crafts, clothes-making, carpentry, and as auxiliary personnel working in companies, etc. This reflects the fact that technical training and vocational training are still incipient. Qualified instructors are few and far between (for technical and services branches), infrastructure and equipment is falling into neglect, and few scientific materials are available. Only the recently renovated industrial technical college in Sahr and the industrial technical school and apprenticeship centers in N'Djaména, Moundou, Abéché, provide acceptable working conditions for students and trainers. The shortage of such skills deprives the country of the qualified labor force that is crucial for development of the private sector and free enterprise. Enhancement of Chad’s human capital will therefore necessarily imply reorienting the educational system and adapting it to labor market needs. At the same time, a disorderly boom in vocational training centers is harmful when what is taught in them is not supervised by the various parent bodies. Such oversight bodies must establish a coordination mechanism that allows them to define the objectives, contents, and

42
training methods for the courses, as well as the professional standards required for staff at all levels. The principal barrier to the development of education in Chad is the shortage of educational facilities: there are on average 70 pupils per classroom and at least as many per teacher. The dilapidated and precarious state of school infrastructure and equipment is a serious issue: 65 percent of the shelters used provisionally as schools are made of rudimentary (“secco” and “poto-poto”) materials. They have a useful life of one school year. These makeshift classrooms, often built by the communities themselves, are bereft of classroom furniture. The pupils sit on the ground and teachers do without a chair or table. Ccommunities teachers, who are paid both by the Parents Associations (APE) and the communities, make up 56.31 percent of the totals number of teachers (school year 1999/2000). Generally speaking, these teachers have very little training compared to professional teachers and the risk of them passing on their own shortcomings to the future players in Chad’s development is considerable, unless something is done to enhance their skills. Curricula are ill-adapted to the circumstances and need to be updated. Supplies of schoolbooks and teaching materials are insufficient: one reading book for every three students, one math books for every five, and one scientific textbook per dozen pupils. In higher education, the main constraints are: ! lack of infrastructure, equipment, and materials; ! shortage of qualified full-time teachers; ! a predominance of general subjects that are insufficiently geared to the jobs offered by
private economic agents, with teaching programs that need to be checked as regards conformity to international standards;
! the lack of facilities for student life (campus, canteen, accommodation, sports equipment, workrooms, etc.).
3.1.3.2 Inadequate health care coverage and hypothetical nutrition Another aspect underlying Chad’s modest economic growth is the state of health of the population: a healthy labor force is more productive than one that is not. In the absence of a morbidity rate, the mortality rate may serve as an indicator of the health status of the population. The mortality rate in Chad in 1993 was 16.3 per thousand (18.6 per thousand for men and 14.2 per thousand for women). Infant mortality, estimated at 160 per thousand in 1964 (175 per thousand for boys and 144 per thousand for girls), declined to 103 per thousand in 1997 (119.7 per thousand for boys and 99.8 per thousand for girls). The maternal mortality rate is estimated at 827 deaths per 100,000 births. This health scenario is the outcome of several factors: a largely non-nutritious diet, inadequate personal and environmental hygiene, and a shortage of quality health care services As regards nutrition, the deficiencies are above all related to eating habits, which, for lack of education, disregard nutritional considerations. Most Chadian households, even among those that do have the resources, generally eat food with little nutritional value. The average daily calorie intake is estimated at 1,720, compared with an average of 2,160 for Sub-Saharan
43
Africa and 2,480 for all developing countries. Data (EDST, 1997) show that 40 percent of children under the age of 5 suffer from chronic malnutrition (insufficient weight), half of them in a severe form. According to Ministry of Health data (DSIS 1998), the principal diseases recorded at health centers are: malaria (18.6 of new cases), diarrhea (7.7 percent), acute infections of the lower respiratory tract (7.2 percent), and conjunctivitis (3.9 percent), almost all of which are contracted as a result of poor food hygiene or lack of sanitation. In that connection, it is worth noting that only 27 percent of households in Chad have access to safe water. Only 7 percent have adequate toilet facilities or improved latrines, while 73 percent have no such facilities. Approximately 21 percent of households have access to sanitary means of human waste removal.
To these, certain local endemic diseases have to be added (iodine deficiencies, leprosy, tuberculosis, river blindness, trypanosomiasis, dracunculosis, cholera), that persist despite implementation of several programs aimed at eradicating them. Finally, the very poor state of health of the population stems above all from a national health system with a number of shortcomings, including the following: ! insufficient and poor quality health services. Theoretically coverage is 71.2 percent of
the population, 64.2 percent with respect to first-tier facilities (“responsibility zones” for basic services delivery), and 78.8 percent for district hospitals (second- tier). There is one hospitalization facility per 165,000 inhabitants and 51 beds/places per 100/000 inhabitants, with marked disparities from one region to another.
! the low number and poor distribution of qualified health personnel over the country as a whole: one doctor per 36,000 inhabitants (compared with an average of one doctor per 9,000 inhabitants in Sub-Saharan Africa and the WHO standard of one for every 5,000 to 10,000), whereby 17 percent of those doctors are assigned to administrative work; one State-certified nurse per 28,502 inhabitants (Sub-Saharan Africa average: 1 per 2,000 inhabitants; WHO standard 1 per 3,000 inhabitants); and one qualified midwife per 13,692 women aged 15 to 49 (compared to the WHO standard of 1 per 3,000). Only one-third of doctors’ positions and one-quarter of nurse vacancies are filled. Despite the new medical staff (doctors and technicians) graduating each year, the shortfall is only gradually being reduced;
! insufficient public health expenditure per inhabitant. The share of public health expenditure in total government expenditure increased from 3 percent in 1986 to 11.2 percent in 2000;
! poor geographical distribution of physical and financial resources. Annual operating expenditure not counting personnel ranges, for instance, from CFAF 145 per inhabitant in Salamat to CFAF 1,890 in Chari Baguirmi;
! little coordination in the management of the department. It is highly concentrated and short on planning;
! the embryonic state of partnership with the private sector; ! the ineffectiveness of the areas responsible for fighting epidemics; ! shortages of medicine in some health centers related to non-recovery of the costs of
their mismanagement.

44
3.1.3.3 HIV/AIDS The real constraint with respect to HIV/AIDS is the lack of awareness campaigns/prevention and hence of protection. Over 72 percent of the population continues to believe that they run no risk of contracting the disease, so that only few people use condoms. Only three percent of women and 13 percent of men say they have used them. Illiteracy, poverty, and certain beliefs are among the principal factors helping to spread this disease. 3.1.3.4 Status of women in Chad As a result, above all, of socio-cultural inertia, women are still largely regarded as mothers, spouses, and housewives and therefore barely participate in decision-making at either the household or the national level. According to the survey on violence against women (October 1999), 30.5 percent of housewives explain their situation by saying their husband prefers to have them at home; 21.1 percent say they cannot work because their husband refuses to allow it. This vision of society leads parents to discriminate in favor of boys when it comes to enrolling their children in school. Most women therefore lack a modern education and, as a result, have a low level of productivity. Since they make up a large part of the labor force, that depresses national income. Gender-based discrimination also hampers women’s access to employment and to economic, political, and social resources and opportunities, and in general their incorporation into socio-economic life. Discriminatory cultural practices prevent women owning land in their own right, so that the division of land among members of a family – an increasingly common practice as land becomes scarce – is often done at their expense. Nevertheless, one thing is clear: given the social and economic importance of women, Chad will never be able to develop until it raises the average level of education of Chadian women. 3.1.3.5 Lack of social protection The vulnerable groups identified in Chapter 2 consist of individuals at greater risk than others or who are less equipped to deal with those risks. They are disadvantaged with respect to access to sources of income and/or human capital formation. Their vulnerability is interpreted as a certain sensitivity or insufficient ability to cope with life’s hazards, income shocks, or a sharp decline in living standards.
3.1.4 Inappropriate and dilapidated basic economic infrastructure 3.1.4.1 The road network The road network in Chad comprises 40,000 kilometers of roads and tracks, 6,200 kilometers of which are classified as priority, and approximately 33,000 kilometers of rural roads. In the whole of the country only 583 kilometers of roads, between cities, are paved. Nonpriority roads are usable for 6-8 months a year and are inadequately or never maintained. The northern, desert region has few links with the rest of the country. The eastern and southern-eastern parts of the country are cut off during the rainy season, for lack of permanent roads. Even within regions, transportation links between towns and the surrounding areas are

45
unpredictable, although these roads and tracks do not include the rural paths linking one village to another. The poor state of the roads means that vehicles are used mainly on the trunk roads linking N’Djaména to certain large towns or else only inside towns and cities. This means that the inhabitants of rural areas face real difficulties in obtaining access to social and economic goods and services and are restricted in their mobility. The lack of transportation strategies in rural areas hampers the development of Intermediate Means of Transport (I.M.T.), such as carts, bicycles, and animals, as well as transportation infrastructure that could make it easier for the population to get around. One of the consequences of this state of affairs for poverty is that isolated pockets of famine persist even though the harvest might be good for the country as a whole. Transporting products from regions where there is a surplus to regions where there is a shortage is relatively costly, so that the price of transported products becomes prohibitive, not to mention the risk of loss, deterioration, or destruction of the merchandise or raw materials. To mitigate any shortages that might arise under these circumstances, enterprises are forced to stock up on raw materials, which raises their costs and therefore pushes up market prices. On top of that, Chad is also isolated from other countries (the nearest sea port is 1,700 km away). This is a substantial economic handicap, given the extra cost of importing and exporting. The competitiveness of domestic products vis-à-vis foreign markets is thus impaired. 3.1.4.2 Energy Energy resources are vital for a country’s development, since they are a major production factor. Unlike most Sahelian countries, Chad uses only electric energy, apart from traditional sources, such as firewood and kerosene. Electricity is not available for most of the population (only 1 percent of total population, and 9 percent of the households in N’Djaména, have access to it) because of its exorbitant cost, poor management of the electricity producer and distributor, STEE, and the lack of a proactive policy in the sector, especially as regards rural electrification, which is a powerful means of improving the lot of the inhabitants of rural areas. The aforementioned poor management of electricity supplies severely penalizes the few enterprises that exist in Chad. Nevertheless, alternative sources of energy do exist and could ease the reliance on electricity: notably solar and wind-based energy. Moreover, promotion of these sources of energy could halt deforestation for firewood, increase access to energy for productive purposes, especially for farmers, and, at the same time, limit dependence on petroleum products, for which prices tend to be very volatile in international markets. 3.1.4.3 Telecommunication Development and, therefore, poverty reduction are impossible to achieve without efficient telecommunication infrastructure. Chad is very poorly endowed in this area and the little it has is inadequately distributed. In 1998, Chad had fewer than 9,000 main telephone lines, 83 percent of which were in N’Djaména, with the rest distributed in nine other towns. The recent development of mobile phones, while laudable, cannot change the underlying picture and the

46
country’s vast needs remain to be met. The establishment of an attractive environment for the private sector and the dissemination of information and technology necessarily require telecommunication infrastructure. It would be a mistake, therefore, to think that developing the internet is a luxury for Chad. On the contrary, that powerful vehicle for the transmission of knowledge represents an extraordinary opportunity. Properly used it could ease numerous constraints and lead, for instance, to the replacement of age-old farming methods. 3.1.4.4 The banking system and microfinance As mentioned above, the banking system in Chad consists of five commercial banks and one agricultural bank with offices in only five towns. That is one reason why even the modest level of domestic savings is under-mobilized. From the point of view of economic growth, a banking system’s primary advantage is usually to be able to finance the investment opportunities. However, in Chad, the terms governing access to credit are such that they restrict the demand for it to customers of a certain standing. The bulk (72.5 percent) of the credit granted is short-term and does not therefore finance long-term investments. To make up for that shortcoming, microfinance has developed on the basis of a number of experiments, especially those relying on a savings and loan association philosophy, or others that stress distribution of credit, and those that promote credit distribution as an auxiliary or supportive activity. However, there are a number of impediments to promoting these pilot schemes: ! the low level of professionalism; ! the lack of coordinated and consistent rules and practices; ! the difficulty of progressing to financial and technical autonomy; ! the lack of bridges between these experiments and the traditional banking system; and ! the lack of a framework for consultation/cooperation among these institutions.
The state has not yet entirely fulfilled its role as the guarantor of the common good The shortcomings with respect to infrastructure are the result of inappropriate economic policies, which for many years failed to generate increased revenue to be allocated to infrastructure. Indeed, the need to endow the country with collective infrastructure never really emerged as a priority when it came to resource allocation. The poverty reduction strategy should lead to a better balance in the levels of regional development by settling young people on the land and narrowing the development gaps between regions and social strata.

47
3.1.5 Other obstacles to poverty reduction 3.1.5.1 Debt In 1998, Chad’s outstanding external debt totaled CFAF 592 billion], equivalent to 65 percent of GDP. Multilateral external debt accounted for 75 percent of the total. In the same year, external debt servicing was equal to 10 percent of exports and 31.4 percent of tax revenue. The external debt servicing burden is therefore what makes Chad’s indebtedness unsustainable. With respect to the domestic debt, there is still a major payment arrears component, which needs to be rescheduled, above all in order to make the retirement pensions system financially viable. Part of the domestic payment arrears penalizes Chad’s private sector, which would at least like to be able to rely on a realistic timetable for settlement of these arrears. 3.1.5.2 Demographic factors The 1993 general census of the population and housing estimated the population as 6.28 million, with a natural growth rate of 2.5 percent per annum, based on a synthetic fertility rate of 5.6 children per woman of child-bearing age. That demographic profile means that the population will have doubled by 2020 compared to 1997, with a high proportion of young (48 percent of the population was under 15 years of age in 1993, and 50.3 percent in 1997). Strong economic growth is therefore needed to allow the productive apparatus to absorb each year’s new contingent of persons seeking jobs. They also have had to be given an education, training, and access to sports facilities. To combat poverty, a robust growth strategy will have to be complemented by policies favoring the redistribution of the fruits of growth in favor of the least privileged segments of society. The second general demographic and housing census, scheduled for 2005, will make it possible to gauge with greater accuracy the natural rate of growth of the population and geographical mobility and thereby help to fine-tune programs associated with implementation of the PRSP. 3.1.5.3 Explosive remnants of war, factors exacerbating poverty The findings of the socio-economic survey of the impact of explosive remnants of war on Chadian communities, carried out by Handicap International, a nongovernmental organization, in 2000-2001, showed that 23 out of Chad’s 28 departments were affected. The problem: # covers 1,081 Km2; # affects 24910 localities in 51 sub-prefectures (including 91 in Borkou Ennedi11) with
417 distinct “polluted” zones; 10 49 (20%) are classified as severely impacted, 52 (21%) as moderately impacted and 148 (59%) as less severely affected.

48
# affects the lives of 284,435 inhabitants, who live permanently threatened by mines and explosive remnants of war (ERW);
# had caused, by the time of the impact study and not counting Tibesti, at least 1,688 known victims (339 over the previous 24 months12);
# prevents access, in the regions affected, to pasture land (51%), farmland (46%), roads and tracks (39%), watering places (37%), and dwellings (14%);
# comprises an additional 135 dangerous zones13 and 25 abandoned ammunition dumps; and
# is responsible for maintaining the atmosphere of insecurity that prevails throughout the affected areas, since it is possible that certain evil-minded persons could recover the mines and place them in areas previously considered safe.
The impact study also shows that there are marked differences among the regions surveyed in terms of the number of localities affected. The most striking case is the Northern region, in which just the departments of Borkou and Ennedi contain more than one third of all the localities affected and one quarter of the country’s total population affected by this problem. At the other end of the scale, only 20 localities are affected in the Southern region, where a majority of the Chadian population lives. Only 51 sub-prefectures are safe. According to the official national population estimate for 2000, 3,363,996 people live in the affected sub-prefectures and 4,216,733 live in the safe sub-prefectures. One can therefore conclude that a little less than half the population of Chad lives in a sub-prefecture polluted by mines and other ERW. At the same time, in the affected zones, especially in BET, numerous mined roads have been abandoned. Certain areas have become isolated as a result; others have opened up new roads which are now used instead and do not appear on any map, which means that guides have to be used to move around the mined areas. Any foray into these areas using the map would end up taking vehicles straight to the mined roads. This situation calls for two complementary actions: # Demining of the mined roads at least in areas in which this pollution prevents access
to certain villages or forces travelers to make long and costly detours, which reinforce the isolation of the regions concerned, increase the prices of purchased foodstuffs, and makes it harder to sell local produce.
# Surveying and mapping of the new roads used, followed up by actual road marking and signposting of those roads.
# The least privileged segments of society and poorest communities are those that bear the brunt of the risks posed by mines and other explosive remnants of war and of the consequences they bring. This factor exacerbating poverty must be taken into account and everything possible should be done to keep vulnerable groups safe from this scourge. It is a question, in fact:
11 For security reasons, HI did not survey Tibesti. 12 110 were children or adolescents handling or playing with the ERW. 13 That is to say, areas that are mined or polluted, but which had no direct impact on the life of the communities at the time of the survey or were located in uninhabited areas.

49
# Of preventing those who have nothing from losing their life, or being maimed, or losing their autonomy, or else losing members of their family or seeing them maimed and turned into a new burden on their family and community. What is at stake is also avoiding the loss of a domestic animal, being able to travel, to obtain medical care, to access pasture land, water, education, or international aid – all of which are impossible when the routes are dangerous or impassable because they are sown with landmines.
# Of making it possible to carry out rehabilitation, reconstruction, or development projects in areas currently out of bounds because of the presence of mines and explosive remnants of war.
# Of enabling the inhabitants of the polluted areas to: o move freely along reopened and safe roads and tracks (an end to isolation, access to
medical care, education, and markets in which to sell their products… ); o go to their fields, grazing grounds, and watering places, without risk; o live without the slaughter of children, adults, and domestic animals, which are often all
these people have; o return to their place of origin; and o live a normal life and avoid an exodus to more hospitable areas.
# Of ending the cost of medical expenses resulting from accidents caused by the mines and other explosive remnant of war. Such accidents cripple the meager health budgets in the affected areas.
# And, finally, of clearing and destroying the mines and other ERW placed or abandoned on the ground or in dumps, in areas without surveillance, from where they can be recovered by evil-minded individuals. These mines and other ERW aggravate the insecurity prevailing in the polluted areas, so that destroying them will reduce the insecurity and consolidate peace.
The National Strategic Plan to Combat Mines and ERW, aimed at freeing Chad from all the negative impacts of pollution of this kind, fits in perfectly with the national poverty reduction strategy. The negative effects of these remnants exacerbate poverty, so that efforts to clear them, which in most cases will have to precede the implementation of new projects in the mined areas, constitute one of the cross-cutting axes of the poverty reduction strategy. 3.2 Chad’s strengths 3.2.1 Opportunities Chad has considerable potential, above all in connection with its natural resources (water, farmland, stockbreeding, minerals, etc.), but it is the upcoming exploitation of its oil resources that could bring a major poverty reduction breakthrough. Another major contribution will come from resources resulting from the Heavily Indebted Poor Countries (HIPC) Initiative. Under-exploited land and water resources Almost one third (30 percent) of Chad, or 39 million hectares, could be used to grow crops. However, each year, only approximately 2.2 million hectares (5.6 percent) are used for that purpose. Some 5.6 million hectares could be irrigated, but today only 7,000 hectares are. In other words, the country’s farmland resources are hugely under-exploited.

50
Chad’s water resources consist of permanent and semi-permanent waterways, groundwater, and surface water. Almost three-quarters of the country consist of sedimentary basins with several layers of groundwater. The volume of subterranean water ranges between 263 and 455 billion cubic meters per year, with a replacement volume of 20.6 billion cubic meters. So Chad has, unlike other Sahelian countries, sufficient water resources, although harnessing them is still a problem. Judicious use of that water would help secure agricultural production. Abundant mineral resources Chad’s underground has an abundance of minerals: salt, natron , uranium, gold, diamonds, kaolin , etc., most of which are not exploited, but the most important is oil. Indeed, oil production will generate substantial revenue for the Treasury: during the life of the project, Chad will earn, on average, CFAF 50 billion a year. These funds will be allocated to the different economic sectors, especially to priority areas in order to raise the standard of living of the population. The petroleum era will provide numerous opportunities for the private sector, via subcontracting and the development of service industries. Spin-offs from the oil investments can already be seen in the transportation and catering sectors. There is likely to be considerable diversification in the economy and a substantial increase in household income. With respect to oil revenue, it is worth noting the – in terms of governance – unique arrangement made regarding management of the funds, which is another strong point. In order to guarantee that future revenue is wisely spent, on November 30, 1998 the National Assembly adopted a law on management of oil revenue (Law No. 001/PR/99). This law provides that 10 percent of the revenue from royalties and dividends will be earmarked for a fund for future generations; that 80 percent of the balance will be assigned to the priority sectors, which are health, and social services, education, rural development (agriculture and stockbreeding), infrastructure, the environment, and water resources; and that 5 percent of the royalties will be assigned to development of the productive region (on top of that region’s share of budgetary outlays). The law on management of the oil revenue also contemplates the establishment of a committee to monitor it called the “Collège de Contrôle et de Surveillance des Ressources Pétrolières (CCSRP)” and comprised of representatives of the government, parliament, the judiciary, and civil society. An international community willing to support the country The international community has become convinced that only a concerted effort by donors and creditors will make it possible to combat poverty effectively through government development aid and the promotion of private investment. Greater synergies have to be sought in the contributions of the various partners to the National Poverty Reduction Strategy. One of the instruments with which to finance that strategy is the HIPC initiative. Other programs under way in specific sectors and involving several donors offer further financing opportunities for those sectors, especially for rural development and transportation, provided that they are well coordinated and complementary to one another. Increasingly organized segments of the population, keen to participate in development

51
The accountability of local people for the choice and execution of development activities is becoming increasingly essential. In Chad, that trend has become palpable with the emergence and expansion of associations and movements, especially in rural areas. These organized movements have helped to embed the notion of participation, so much so that in all spheres of action the population appears to be manifestly interested in taking part in development activities. Thus, on the training side, one can cite the spectacular growth of community schools, the dynamic activities of Teachers and Parents’ Associations (PTAs), and so on. Communities teachers, who are paid by the PTAs, account for 54 percent of the total number of teachers. In the health sector, people have shown their readiness to “own” health facilities through the cost recovery system, an experiment that has yielded fairly convincing results, This is a great opportunity that, extended over the rest of the country, would provide a means of supplying medicine to health centers and making them financially viable. At the same time, the deconcentration/decentralization process under way in the Ministry of Public Health (decentralized budgetary planning, delegation of budgetary decisions to the prefecture level, the training center for health professionals, the expectation that hospitals are to be autonomous) provides an opportunity to expedite decisions and enhance the efficiency of the correct health care system.
3.2.2 The long-term outlook for growth and development
The national poverty reduction strategy (PRSP) for the next 12 years begins at a time when the government has decided to continue efforts to restore macroeconomic stability that began with the 1995-1998 Structural Adjustment Program (SAP) combined with an Enhanced Structural Adjustment Facility (ESAF). While this approach has brought some major gains, the impact on the living conditions of the population as a whole, and of the poor, in particular, has been modest. Nonetheless, it is worth pointing out that the latest developments, especially exploitation of Chad’s oil resources and the willingness of the international community to help the country attains the millennium development goals (MDG), as well as the Heavily Indebted Poor Countries (HIPC) Initiative, offer real grounds for hope that poverty can be reduced. 3.2.2.1 The oil boom era The oil boom opens up the possibility of enormous growth in GDP per capita. The macroeconomic framework projections show oil revenue projections by 2015, on the conservative assumption that no more oil finds occur. The principal goal in relation to oil exploitation consists of devising policies and actions that maximize the impact of growth on poverty reduction. Oil revenue will indeed provide the government with the resources it needs to carry out the actions listed in the PRSP, which will in turn improve conditions for production, especially in rural areas. Likewise, the creation of a favorable environment for the private sector will help to diversify the economy. 3.2.2.2 The Highly Indebted Poor Countries (HIPC) Initiative

52
Chad has been eligible for the HIPC since June 2001 and that year received CFAF 8.7 billion in interim assistance. The debt relief itself will follow evaluation of one year’s implementation of the PRSP. The net present value of the total debt relief under the HIPC Initiative is US$260 million, which will serve to finance the actions envisaged in the PRSP.

53
Chapter 4 The overall outlook for development through 2015 A landlocked country, Chad has three large geo-climatic areas:
• a Sahara area of 780,000 km2 covering the whole northern part of the country, with hardly any rainfall, almost continuous dry winds, and high temperatures during the day. The main activities are farming near watering places and camel breeding. This is date palm country;
• a Sahelian area of 374,000 km2 in the center of the country, with between 300 mm and 650 mm of rain per year. People earn a living by growing cereals (millet) and oleaginous plants (groundnuts), and from extensive livestock farming. This is where Chad’s gum Arabic comes from and the region has a long-established merchant trade. Because of the climate, Sahel area farmers face two constraints: the range of rain-based crops is limited and more intensive farming requires irrigation;
• a Sudanese area covering 130,000 km2 in the south, with between 650 mm and 1,000 mm of rain per year. The climate in this region is “tropical.” It allows for intensive and diversified rain crops: cotton is cultivated on 200,000 hectares, oleaginous and vegetable plants (groundnuts, cowpea, sesame, voandzeia, and, more recently, soya) on 200,000 to 300,000 hectares, cereals (millet) on 450,000 to 800,000 hectares, tubers (cassava, sweet potato, yam, taro), and vegetable crops. Low-water level crops (cultures de décrue) are grown on 100,000 hectares. The inhabitants of this area also practice small animal breeding. This zone also serves as an area where cattle come from the center of Chad as they migrate to summer pastures.
Chad’s principal oilfield is at Doba, in the Sudanese area. Production is expected to come on stream in 2003 and to last at least 25 years, during which time a billion barrels of crude oil are to be extracted. Doba oil offers the country a real opportunity but also poses a developmental challenge for the Sudanese area and for the country as a whole. Taking up this challenge, the outlook for Chad through to 2015 envisages halving the incidence of extreme poverty and the creation of a diversified and competitive post-oil boom economy.
4.1 An integrated vision of poverty reduction combined with the preparation of the post-oil boom era
In circumstances such as those described in the foregoing paragraphs, in which everything is urgent in every sector, defining a “vision” boils down to formulating a shared response to three challenges. • First, an ecological challenge, the protection of the environment prerequisite, without
which Chad’s strength in terms of its abundance of still under-exploited land and water resources, animals and pastures would not in fact become a major asset.
• Then there is the political challenge, identified as the consolidation of democracy, peace, and security. Given civil society’s commitment to playing a part in the running of the country, effective decentralization of power will help build a new balance

54
between the representative democracy organized by republican institutions and the direct participation of the people in the affairs that concern them.
• Finally there is the economic challenge, in the form of the sustainable development imperative, without which social progress can only be ephemeral. Growth will be sustainable because it will go hand in hand with protection of the environment and because the form it takes will be accepted by a population hungering for security of both property and persons, better governance, and multifaceted support for grassroots initiatives.
The oil boom opportunity rounds off this scenario with a developmental challenge. By 2015, the public sector, the private sector, civil society, and the people have to have halved the poverty that existed in 1997 and to have consolidated the foundations of an economy diversified enough to withstand the shock of the end of the oil boom as well as the foundations of a society reconciled unto itself in which each individual has an opportunity and grasps it. For this to materialize, the PRSP relies on an integrated sectoral policies approach aimed at reducing poverty. This approach is expected to have a swift and lasting impact on the incidence and depth of poverty.
At the start of this millennium, farming, stockbreeding, and fishing account for 40 percent of GDP, employ 80 percent of the active population, generate over 59 percent of household income in rural areas, and provide 80 percent of export revenue. Spin-offs from the oil economy will allow these three sectors to exploit their still considerable room for expansion, as they respond, in competition with imports, to a more solvent domestic market. They will therefore be called upon to substantially boost their currently modest productivity. Moreover, in order to compete in a more openly competitive national, subregional, and international environment the post-oil boom economy must be able to rely on more qualified labor given the wage component in the local products on the different markets. Technical education and vocational training centers for skilled workers in the diversification sectors must be in a position to enhance the knowledge and skills developed at the basic education level. Hence the emphasis on adapting curricula to meet human capital development needs. Increased exploitation of the potential in existing branches of activity and the introduction of new lines will undoubtedly require mobility by economic agents over even vaster tracts of the country. The road network infrastructure will have to adapt to these trends in the context of growing demands for comfort and quality services. In the social sector, it will be a question of focusing on: # expediting and implementing social policies (health, education, social protection), with
a view to rapidly extending coverage in basic services, raising the quality of those services, and narrowing current gaps;
# intense cross-cutting programs (training, labor intensive activities, support for cooperatives, etc) and sectoral initiatives (agriculture, stockbreeding, transportation), which would form part of an overall attack on poverty and share the goal of increasing productivity and employment;
# implementation of specific actions, especially in the areas of nutrition, food security, hygiene, and social protection, geared to improving the lot of the most vulnerable segments of the population.

55
At the political and institutional level, the focus will be on: # consolidating the foundations of democracy by completing the establishment of the
institutions contemplated in the Constitution; implementing decentralization; strengthening the judiciary and parliament; and developing access to information and mechanisms to reach social consensus.
# Consolidating national unity and at the same time seeking better ways to exploit the potential of each social and economic opportunity the country affords;
# strengthening domestic capabilities in government institutions and among the representatives of civil society.
In the economic and financial sphere, efforts will focus on: # sustainability and less vulnerability to shocks of domestic output; # increasing mobilization of domestic resources to finance development and manage it
rationally; # National skill-building in both the private sector and in government departments
dealing directly with economic agents; # Integration and internal organization of the productive system, including overcoming
the country’s isolation and the promotion of domestic trade; and # Cutting back on military expenditure and reintegrating demobilized military personnel
(and their dependents) into civilian life.
The participatory and comprehensive approach pursued in drafting the PRSP and the development strategies of the priority sectors allows for simultaneous consideration and appropriate weighting of the resources to be managed or needs to be satisfied, human and institutional resources, and economic, technological, and ecological aspects, along with social and cultural factors. 4.2 Poverty reduction targets from 2003 to 2015 The PRSP revolves around five principal strategies, namely:
(i) Promoting good governance (ii) Ensuring strong and sustained economic growth (iii)Improving human capital (iv) Improving the living conditions of vulnerable groups (v) Restoring and safeguarding ecosystems
These strategies aim to generate an overall momentum for poverty reduction in all spheres of the public administration and civil society, while highlighting a nucleus of priority sectors based on the poverty profile and its determinant, namely the health sector, rural development (including water resources and the environment), infrastructure, and the education and training sector
4.2.1 Promote good governance This strategy lends support to all the actions designed to meet the political challenge in all its dimensions. To that end, these actions target a number of national objectives: consolidation of the rule of law, promotion of an efficient, motivated, and more capable public administration, decentralization of power and deconcentration, promotion of efficient and transparent

56
management of public affairs, strengthening of the capacity of the private sector and of civil society, security for property and individuals, the fight against corruption and impunity, and judicial reform. The National Good Governance Strategy (SNBG) adopted in August 2002 defines good governance as transparent and participatory management of economic and social development, based on the primacy of law and accountability. This definition combines responsibility, the quest for efficiency, effective action, and justice for all. It addresses both central and decentralized government, but also the private sector and civil society. As defined above, good governance supports the fight against poverty inasmuch as it involves people in the making of decisions that affect them and their environment, while raising citizens’ awareness of and trust in the legal provisions that safeguard their rights and in the fairness of the obligations imposed upon them. Thus good governance ensures that the interests of the population are taken into account to a greater degree and creates the conditions for greater participation by the people in efforts to develop the country. Since the “sovereign national conference” held in 1993, an institutional framework has been gradually built up through a series of laws on supervision and surveillance, economic liberalization, public security, decentralization, and the promotion of fundamental freedoms and human rights. Nevertheless, there is still a long way to go before the rule of law is consolidated and much remains to be done to strengthen the civil service, increase efficiency and transparency in the management of public affairs, and boost capabilities in the private sector and in civil society, as they serve as intermediaries of the people in enhancing governance. 4.2.1.1 Consolidation of the rule of law Under the rule of law, as opposed to dictatorship, the state forces itself to define the laws that will govern its behavior and that of individuals and to respect those laws in order to set an example. Thus, the focus is on strengthening parliament as an institution, reforming the judiciary, and promoting human rights. To increase participation by public debate stakeholders, steps have been taken to strengthen partnership among them, such as the preliminary project to strengthen human rights and governance, as well as launching the project related to the strengthening of the economic and financial analytical capacity of the National Assembly. In addition, the Action Program adopted by the Ministry of Justice is geared to promoting the rule of law, access to justice, and justice as a factor in development. Concerning human rights, new initiatives are needed with respect to the status of women, protection of children, national mediation and settlement of conflicts, security for people and property, and the public and private media. 4.2.1.2 Role of the state, the private sector, and civil society In the current context of political and economic liberalization, governance of a country relies on a division of roles between the state, the private sector, and civil society. The state is delegated political power by the people on terms established in the Constitution. The private

57
sector generates wealth, and therefore holds economic power. Civil society acts as the intermediary of the people. Each of these entities seeks to improve its economic well-being, the free exercise of its freedoms, observance of the rights guaranteed under the Constitution, and fairness in the obligations imposed upon it. Role of the State
In the aforementioned division of roles, as the political power counterpart, the State’s mission is to defend the general interest; which means that it is under the obligation to protect constitutional freedoms and to guarantee the conditions required for ongoing consolidation of the economic power of the nation as a whole while safeguarding a balance among the interests of the members of that national collective entity. To that end, since the end of the 1970s, the State as strategist (l’Etat stratège) has gradually replaced the state as Provider (l’Etat-Providence), while the aspirations of the people for a Constitutional State have been manifested with increasing clarity since the end of the 1980s. Finally, since the end of the 1990s, the worldwide consensus in favor of combating poverty has established a purpose for a conjunction of the State as strategist and the State as provider: sustainable human development. As a result, it has become increasingly important to strengthen the capacity of the state to define, for each strategic period, an overall approach, priority sectors, and appropriate policies, and to intervene effectively and efficiently. In particular, if poverty is to be reduced, there has to be not only an efficient allocation of public funds, but also a use of such funds that can be verified by the people themselves or their duly authorized representatives.
The situation described above testifies to a widespread lack of capacity of the public administration to fulfill its mandates, particularly as regards the allocation and planned use of human resources, but also in other spheres. With a view to creating the best possible conditions for a successful PRSP, capacity-building needs already shape the human capital development programs (especially education, training, and literacy campaigns). However, such programs will be complemented by an overall capacity-building program, especially in the ministries responsible for the priority sectors. The idea is to develop both institutional and individual capabilities in the ministerial departments and in the directorates and technical units attached to each ministry. The civil service reform program aims to promote, at both the central and the decentralized level, a professional, better motivated public administration, endowed with the necessary theoretical knowledge and technical skills it needs. The integrated vision through 2015 on which the PRSP is based indicates that Chad now has the opportunity to overcome in 10 years a 30-year lag in its development. For that to happen, however, the state and the civil service have to prove their commitment not only to a more deep-seated democracy but also to a strengthening of capabilities in all spheres of economic and social life. In particular, special attention needs to be paid to the priority sectors already established in the law on management of oil revenues, to good governance, and the oil sector itself.

58
The oil boom poses a development challenge that can be met by proven ability to manage an economy driven, in terms of expansion, by one sector. In this case, it is important to ensure effective and appropriate absorption of the resources at the social and environmental level, in the oil-producing region itself and at the national level. The ministries responsible for the priority sectors need to strengthen their own technical and general coordination skills, as well as their ability to coordinate the steps they take to:
• bear in mind the impact of oil extraction on the surrounding areas and communities, particularly as regards health, sanitation, and water resources;
• establish a specific program to support development activities in the oil-producing region in order to involve the local people directly, through their grassroots communities and NGOs, in bringing about the spin-offs that they rightly expect from the exploitation of oil resources. Within the framework of efforts to combat poverty, a local development fund will be set up in the oil-producing region, fed by a part of the oil revenue and co-managed by the people of the area;
• include a specific development program for the oil-producing region in a national development plan, in such a way as to limit migration to the oil-producing areas and to plan the development of those areas as well as urbanization in nearby towns;
• strengthen the capabilities of the competent government departments to handle the legal, technical, and financial implications of oil extraction, in addition to the ability of the Finance and Planning Ministries to guarantee macroeconomic management tailored to absorption of both the oil and the HIPC Initiative revenues, without a disrupting effect on fiscal management, control of inflation, and preservation of a competitive non-oil economy;
• establish an information and communication system covering all impacts of the oil project, that may serve as an example for all other mining projects.
Particularly in the case of the oil project, it will be necessary to develop legal, institutional, and individual skills to manage the environmental impact of oil exploration and extraction activities. There are several dimensions to the state’s responsibilities in developing mineral resources:
• monitoring and controlling the negative impact of mining exploration and production on the environment and on the population;
• monitoring and supervising the health and safety of persons exposed to the direct and indirect effects of mining projects;
• putting in place programs for relocating people displaced by mining exploration or extraction activities;
• maintaining, as far as possible, access to hunting, farming, and forestry areas; • protecting the environment.
To meet these responsibilities, it will be necessary to: (i) Strengthen the capabilities of the staff in the competent departments, at both the
central government and decentralized levels; (ii) Draw up and periodically test emergency rescue plans in the event of an oil leak or
other oil industry-related accidents; (iii) Apply the provisions of the Environmental Code in practice; (iv) Endow the National Technical Monitoring and Control Committee (CTNSC) with
all the legal, technical, material, logistical, and financial facilities it needs to carry out its mandates to monitor and control the social and environmental impacts of the

59
Doba and any other oil project in Chad. To that end, a study will be carried out aimed at eventually replicating the experience acquired by the CTNSC through a permanent entity.
(v) Monitor migration flows attracted by the revenue generated by the Doba project and put in place a rapid response plan based on any need to expand social and economic infrastructure (schools and health posts, centers to combat HIV/AIDS, sanitation and water supply systems, procurement facilities, electricity) and to protect the environment of the area, which is already subject to intense demographic pressure;
(vi) Use the Doba region and the oil revenue assigned to it to test a coordinated and integrated regional development approach, especially one using a participatory approach to define priorities for the Local Initiatives Concerted Action Fund (FACIL) and financial and technical mechanisms to support micro development activities.
The coordinated and integrated regional development approach should enable central government, the deconcentrated and decentralized agencies, grassroots communities, NGOs, and the local population to combine their efforts to carry out a regional project through participatory preparation and implementation of a regional development plan that incorporates the investment programs of communes or rural communities.
The preparation and implementation of this regional project will provide an opportunity to reproduce, at the regional level, all the stages built into the PRSP. The first objective will be to organize “ownership” of the PRSP in its current version by the people, then to update it shortly thereafter on the basis of regional experiences. National priorities will thereby be reflected at the regional level, especially in the health, education, transportation and public works, and safe water and sanitation sectors. Preparation and implementation of the regional project will also provide an opportunity to re-launch implementation of decentralization policy.
Once regional institutions have been put in place and responsibility has been handed over to the representatives of the people, participatory management of the local development Fund will provide an opportunity to promote consensual rules and arrangements with the active participation of local interest groups with a view to:
• expanding access to basic infrastructure and services; • promoting employment and income-generating activities; • strengthening the capacities of micro and small-scale enterprises; • coordinating actions taken by the government and development partners at the regional
level.
Role of deconcentration and decentralization
In the PRSP framework, decentralization acts as a catalyst for local initiatives and deconcentration aims to make government activities more effective at the grassroots level. As provided for in the 1996 Constitution, decentralization enables democracy to be practiced right down to the level of small communities. Apart from being enshrined in Chad’s Constitution, decentralization will play a part in good governance through: i) the accountability of local governments, with autonomous budgets; and ii) election of local officials by the people. Decentralization policy is expected to make a substantial contribution

60
to civil peace, strengthen the people’s direct involvement in efforts to combat poverty on the basis of local initiatives. For the population concerned, local government constitute an appropriate framework for participation in development activities, first because they are small and, second, because their proximity tends to make them more inclined to respect the obligation to account locally for their management of public funds. The fact that they have their own bylaws expedites the mobilization of funds for the provision of services to the people, in addition to the fact that they are better informed than central government regarding the difficulties people face.
Despite the administrative divisions created in 1999 and 2002, the country is under-administered because of the size of certain administrative districts, administrative arrangements that have not been adapted to local circumstances, the lack of competent officials and working tools. In regional administration, instability in executive positions and the absence of a master plan are hampering decentralization of the state. To remedy these defects, it is expected to:
• strengthen the human and institutional capacity of the central and deconcentrated departments responsible for steering decentralization efforts;
• draw up a decentralization master plan; • draw up and adopt the regulations needed to implement the already validated bill; • draw up and complete the various laws and regulations allowing local governments to
become financially autonomous; • ensure that officials and the personnel responsible for decentralization are properly
trained for the job; • seek an appropriate solution to land ownership issues in the decentralization
framework; • strengthen the resources of deconcentrated outside agencies in order to enable them to
operate in support of the future decentralized governments; and • strengthen the technical and logistical capabilities of Chad’s land registry to enable it
to perform its task of building and analyzing a landowner data base. Role of the private sector
The private sector acts as the intermediary of the people when it comes to looking with the government at the conditions required to expand economic opportunities and wealth. It therefore questions the government, in particular, about trade, industrial, and privatization policies. It must, in particular, be able to express its point of view and advise the government in international negotiations, in the context of African economic integration and in connection with bilateral and multilateral cooperation, whenever the development and strength of the national economy is at stake. For its part, in order to encourage investment and jobs in the public interest, and specifically in order to foster the goal of diversification of primary activities over the next 10 years in Chad, the government must be able to question the private sector. Thus, what is needed is a consensus-building framework that, institutionally speaking, need go no further than that offered by the CCIAMA, which has the legal means but is bereft of all other resources.

61
Role of civil society As mentioned above, the emergence of civil society has facilitated social movements calling for economic and social development. However, civil society also plays an important part in galvanizing support for good governance, the fight against corruption and impunity, deeper respect for the rule of law and the foundations of democracy, transparency, and accountability, all of which makes it a healthy countervailing power to the public and private sectors and one that aims for a fairer distribution of the fruits of growth promised in the PRSP. Thus, public administration must be prepared to accept the role of civil society, which, for its part, must strengthen its ability to perform this role professionally, impartially, and with a high degree of responsibility. Strengthening the capacity of civil society involves:
• drafting a reference guide on the participatory approach for grassroots communities; • preparing a communication strategy in connection with the PRSP; • strengthening the technical skills of government officials in applying a participatory
approach and developing a culture of participation; • strengthening the technical and organizational skills in civil society organizations.
4.2.1.3 Efficient and transparent management of public affairs For the past ten years or so, the government has been directing its efforts to a number of sectors. Thus, it has identified four priority sectors, namely health and social services, education, rural development, and infrastructure. Funds have been channeled to these sectors via 20 percent annual increases in their operating budgets. Nevertheless, these efforts have fallen short of what is needed, partly because of debt servicing, which rose from CFAF 17 billion in 1995 to CFAF 28.3 billion in 2001, an annual increase of approximately nine percent. Substantial efforts must be made in the priority sectors, the list of which will be expanded in order to bring about an effective reduction of poverty in Chadian households. The lifting of financial constraints as a result of the upcoming oil boom, Chad’s eligibility for the HIPC Initiative, and international assistance in general, must be accompanied and sustained by an improvement in governance, implementation of a skills-building program, and, also, efforts to combat corruption.
4.2.2 Ensure strong and sustained economic growth
This strategy concerns the economic challenge, in which the four national objectives are: exploitation of growth-generating mineral deposits; promotion of the private sector, development of the priority infrastructure sector; and creation of the conditions needed to trigger a self-sustaining development momentum. As regards fiscal policy, the strategy for the coming years will be geared to:
• keeping strictly to the budget, especially the 1993 budget, so as to get through this transitional year in good shape and avoid any slippage that might place a strain on future economic management;

62
• prudent management of oil revenue in order to contain the negative impact of fluctuations in these funds on public finance and the economy;
• using the oil revenue as specified in the PRSP and the provisions of Law 001/PR/99 on management of oil resources, which assigns the bulk of oil revenue to the priority sectors;
• continuing to strengthen the fiscal mechanisms and tools for scheduling and monitoring expenditure in order to ensure that the oil revenue earmarked for the priority sectors is used effectively;
• increasing non-oil revenue in order to protect the economy from excessive dependence on petroleum, which is a resource subject to volatile prices and to be able to devote sufficient funds to ensure that government departments operate efficiently.
4.2.2.1 Exploitation of the sources of growth As mentioned earlier, exploitation of its oil fiends constitutes an important opportunity for Chad. The commencement of oil exports in 2003 will radically alter the structure of the Chadian economy. Nevertheless, agriculture and stockbreeding will remain the principal sources of medium and long-term growth. The challenge facing Chad is to make the most of the oil revenue to diversify the national economy. The secondary sector is also expected to benefit from this opportunity, especially the cotton, construction and public works, and mining-related subsectors. The tertiary sector will also benefit, especially in transportation, commerce, and services. 4.2.2.2 Promotion of the private sector The regulatory and legal framework, which is still unappealing despite efforts to improve it, will be revised in response to demands for reform expressed by national and foreign investors, especially in order to elicit and support the development of the entrepreneurial spirit called up to diversify the productive apparatus beyond the bounds of the services sector. The focus will be on South-South cooperation to promote business initiatives, while a study on the obstacles facing investors will make it possible to identify and lift the major barriers to private investment. Assistance will be sought for efforts to boost the capabilities of the Chamber of Commerce, Industry, Agriculture, Mining and Crafts (CCIAMA) so that it can act as the interface between the government and the private sector. So far it is not playing as active a part in the making of key economic decisions as had been expected. Within the overall goal of increasing incomes, and parallel to sectoral policies, the government intends to embark on a policy of support for promotion of the private and cooperative sector, backed by consolidation and diversification of activities that generate productive employment. To that end, the strategies and specific objectives of the government in promoting the private sector come under three components, according to the revised 1998-2005 Guideline Plan. The first component involves improving the legal and administrative framework for enterprises. Here, the priorities are: streamlining of administrative procedures for establishing private companies; implementation of all the rules adopted at the regional level under the treaty establishing the Organization for the Harmonization of Business Law in Africa

63
(OHADA) and in accordance with the harmonization of the rules in force in the Central African Economic and Monetary Community (CAEMC); expediting judicial reform; reducing labor market rigidities, and so on. The second component concerns direct support for the development of local enterprises. It addresses above all issues related to the financing of enterprises thanks to the setting up of a guarantee fund, the opening of lines of credit for long-term funds, the promotion of microfinance, economic and tax incentives in connection with the training and hiring of young people, etc. Also part of this component are: strengthening of the technical facilities for (public and private) specialized training of economic agents and civil servants involved in promoting the private sector, and support for consular agencies to develop technical assistance capabilities for SMEs. The third component comprises actions designed to develop information for economic agents and consensus building between them and the authorities. It includes, inter alia, developing mechanisms tailored for different types of economic agent for detecting and seizing market opportunities, costs and technologies, the economic and financial situation, business regulations, and development of the potential to be found in different branches of the economy, etc. In the PRSP framework, promotion of the private sector is based on the following principles:
• give more importance to the managerial staff and representatives of the private sector;
• pay all due attention to training and know-how; • promote dialogue and consensus-building between the private sector and the public
sector; • combine initiatives and coordinate assistance to the private sector in order to
strengthen synergies and act consistently; • strengthen the capacity of the private sector to be in control of its role; • integrate promotion of the sector in the process of regional and subregional
integration and encourage it, and through it the national economy, to compete in an increasingly competitive environment;
• consolidate gains and develop new initiatives; and • establish an agile system for coordinating actions and activities with
representatives of the private sector.
4.2.2.3 Development of basic infrastructure and support for growth
Transportation
The government has drafted a National Transportation Program (PNT) for 2000-2009, the main purpose of which is to contribute to economic growth and poverty reduction. The strategy adopted consists of:
• overcoming Chad’s domestic and external isolation; • lowering the costs of transportation, both for traveling abroad and in international
trade;
64
• maintaining minimum access to all parts of the country, especially in the rainy season;
• achieve a sufficient number of roads that can be used all year round and link the major towns;
• continue liberalization of the sector and streamlining of management; • assist communities to develop rural transportation infrastructure and local forms of
transportation.
Safe water and energy The Master Plan for Water and Sanitation, drafted for 2003-2020, follows the recommendations made at the United Nations Conference on integrated management of water resources Harare, 1998), which were confirmed at the World Summit on Sustainable Development (Johannesburg, 2002). In its participatory, comprehensive, and integrated approach, and in its focus on local activities, this plan fits in with the PRSP in relying on:
• a national consensus regarding a proactive but realistic policy of expanded, efficient, fair, and affordable access to safe water and basic sanitation;
• information, education, and sensitization of groups of stakeholders, be they public or private, cooperative, national, regional or local, men or women, young or adult, to the need for sustainable management of water resources;
• strategies, activities, and basic investments with a lasting impact on other concerns of the people and of the authorities, such as safeguarding the health of the people and of the ecosystems needed to preserve biodiversity and enable a major part of the productive sector to operate.
The safe water strategy revolves around expanding access to water in both urban and rural areas, and raising people’s accountability for its management. As regards energy, the strategy chosen consists of promoting alternative sources, such as solar and wind-based energy, in order to lessen the impact of firewood cutting on the rehabilitation of forestry resources and in order to expand the use of energy for productive activities, especially in agriculture and industry. The goal of government policy is to satisfy the whole of the Chadian population’s energy needs, to the extent possible, and in particular to make electricity available at the lowest possible cost. Thus a policy and strategy framework for the electricity subsector in Chad (2002-2006) is currently being implemented. An STEE emergency program to rehabilitate essential water and electricity services is currently being implemented. There are also others, especially:
• The national rural and periurban electrification program currently under way; • The electricity grid interconnection program with Cameroon, which aims to bring
electricity to Bongor, Pala, Léré, Fianga, Gounougaya and Binder, for which financing is being sought;
• The program to bring electricity to 20 secondary schools, for which studies are at an advanced stage;
• Promotion and exploitation of solar and wind-based energy, for which the government is seeking financing, etc.
65
Postal and telecommunication services
In the postal and telecommunication services sector, the aim is to guarantee coverage of both urban and rural areas, especially by developing mobile telephony.
4.2.2.4 Achieve a sustainable increase in rural output The government has prepared a national rural development strategy, which was presented to development partners at the time of the sectoral consultations in June 1999. The core objective of this strategy is to find a sustainable way of increasing output in the rural economy while protecting the environment and strengthening human and institutional capacities. To achieve that goal, the government has opted for the following:
• to induce and maintain sustainable growth in farm output; • to support rural organizations; • to develop emerging sub-sectors; • to improve natural resource management; • to decentralize the provision of agricultural services; • to enhance public sector effectiveness; and • to increase access to basic services for the rural population and the rural economy.
At the root of this strategy, therefore, is an increase in the productivity of primary sector activities and in rural incomes, along with preservation of natural resource capital. A sustainable increase in farm output presupposes diversification of crops and an increase in agricultural productivity; diversification of production systems and increased security in livestock farming; diversification of agro-forestry products; and an increase in environmentally sound fishing and wildlife output. This increase in output remains dependent upon the ease with which producers can access the productive factors (agricultural equipment, seeds, fertilizers, and pesticides, etc. in the case of agriculture; animal husbandry inputs and veterinary products and animal feed in the case of stockbreeding; fish farming inputs and equipment for the environment) as well as on water resource management. As part of the strategy aimed at diversifying sources of income, the introduction of new vegetable or animal species will be the subject of studies and research, along with the processing and marketing of farm produce or livestock products. The aim is to increase the rate of exploitation of arable land and of land that could be irrigated, as well animal and pasture resources. Studies and research will be carried out, regarding: the improvements to agricultural inputs and the way they are used; the need for new cultivation techniques in the targeted areas; the establishment of viable agricultural services centers; and the introduction of specific financial instruments for the rural sector, particularly instruments based on an overall approach to the financing requirements of rural households.
As regards farmers’ organizations, a comprehensive capacity-building program should provide producers with further information about the participatory approach, modern management techniques, and the importance of accountability. Other activities for farmers’ organizations could involve sharing experiences with farmers in other countries as well as

66
training in performing representation functions in the steering committees set up by the government and civil society organizations.
Community development and extension on topics of interest to farmers may require the development of training programs and a rural communication system, such as a rural radio network or a farmers’ newsletter (lettre paysanne).
Like the farmers’ organizations, government officials involved in rural development should benefit from appropriate capacity building programs at both the central government and decentralized levels. In particular, it would be useful to boost the ability of the technical staff in the competent ministerial departments to present study reports that would facilitate decisions regarding research topics identified in consultation with farmers’ organizations or specialized private sector studies. The ministries responsible for rural development should, in particular, develop their ability to coordinate their efforts to establish a reliable information system for monitoring and evaluating implementation of the PRSP. Gathering the required information, analyzing and disseminating it on a regular basis are prerequisites for good governance in respect of rural development issues. Increasing output also means developing lines of activity. That will come about by processing products; strengthening negotiation, organization, and management skills; increasing the availability of credit; and facilitating national and international trade. Regarding the emergence of competitive lines of activity, the challenge is to develop marketing and the competitiveness of agricultural, forestry, and pastoral products by strengthening infrastructure and supporting institutions and by streamlining the legal framework. That will be achieved by facilitating exchanges of information with respect to both logistics and the way markets operate, by adding value to products by processing and packaging them, and by actively promoting the economic activities providing forward and backward linkages. The emergence of these lines of activity is closely linked to promotion of the private sector and to the strengthening of the role of women, as economic agents active in these new lines. Special attention is currently being paid to cotton, which is one of the key sectors in Chad’s socio-economic development. As part of the reform of this branch of activity, the government is determined to divest itself of its oil and soap activities and will concentrate on installing effective management in Cotontchad and developing farmers’ institutional and organizational capacities. To that end, in December 1999, the government adopted a reform strategy for the sector, aimed principally at raising the income of cotton growers. This strategy involves an institutional change geared to increasing the cotton growers’ bargaining potential by (i) strengthening the role of the cotton grower’s associations, and (ii) having the state withdraw from cotton growing and revamping the structure of the cotton industry. As part of the plan to boost the role of the cotton growers’ organizations, the strategy involves the following:
• strengthening the institutional and organizational capabilities of cotton growers. • Improving access by cotton growers to information and knowledge regarding the
economic situation, particularly as it affects cotton;

67
• easier access of cotton growers to inputs and management services; • active participation by cotton growers in preparing and monitoring the process of the
state’s withdrawal from the cotton industry and the institutional reform of the industry. Given the state’s withdrawal, the reform strategy advocates:
• a legal separation between Cotontchad and its oil and soap products division (DHS), followed by privatization of the autonomous HS;
• carrying out a study to identify and analyze scenarios with respect to the privatization of Cotontchad activities;
• carrying out an ex-ante social impact analysis, including the impact on poverty of the privatization scenarios;
• organizing a cotton growers’ forum and an investors forum to make sure that their points of view are taken into consideration;
• selection and implementation of a final privatization scenario; • initiating an ex-post follow-up on the impact of the reform program.
4.2.3 Improving human capital
This strategy directly addresses the two priority sectors of health and education and training as national objectives. It also covers national goals with respect to combating HIV/AIDS. 4.2.3.1 Education, training, and literacy campaigns In line with the strategic guidelines set at the time of the sectoral consultations in January 2000 for the 2000 – 2004 period, the government aims to ensure broader, fairer, and more effective access to the educational system. To that end, it proposes to adapt school infrastructure, curricula, and teaching methods and materials as well as pedagogical supervision, based on concerns regarding feasibility, sustainability, and efficiency. The national education strategy fits in with the goal of universal education by 2015. At present, there are 3,653 primary schools, including 3,100 in rural areas, 209 junior high schools, and 36 higher secondary school (lycées). The net enrollment rate is 57 percent for children aged between 6 and 11. Fifty-six percent of the teachers are also heads of communities and there are 2,700 literacy centers. Increasing access to education with cost control involves rationalizing the supply side, , promoting the enrollment of girls, the development of community schools, promotion of bilingual education, and establishing short education courses. To improve both the teaching and learning experiences, education and training programs will be revamped, new schoolbooks will be issued, teacher skills will be enhanced and evaluation systems strengthened. Finally, strengthening institutional capabilities in administration, planning, management and direction will mean: ! reinforcing deconcentration and decentralization of the educational system; ! strengthening the information system, human resource management, and
communication; ! boosting supervisory, control, and monitoring and evaluation capabilities.

68
The first year admission rate is expected to reach 90 percent for boys and 75 percent for girls by 2005-06 (compared with 82 percent for boys in 2000) and 96 percent for boys and 85 percent for girls by 2009-10. The improvements in the quality and effectiveness of teaching will make it possible to achieve a retention rate in sixth grade of 63 percent by 2006 and of 82 percent by 2010. At the same time, the teacher-pupil ratio should reach one teacher per 50 pupils in 2010 in elementary school (compared with 1 per 74 today) and 1 teacher per 40 pupils in 2005 and 35 pupils in 2010 in secondary school (compared with an average of 1 teacher per 85 pupils at the present time). A series of steps will also be taken to improve the qualifications and motivation of teachers. However, improving access to education and the teacher-pupil ratios presupposes the hiring of a substantial number of teachers. Thus, public expenditure on education will be kept under control at the primary school level by using more community heads. The proportion of such teachers in the total teaching corps will increase from 56 percent in 2000 to 70 percent in 2,006, and 80 percent in 2010. Greater equity in access to education will be sought by supporting community initiatives and through their participation in the management and financing of education, as well by targeted interventions in underprivileged geographical areas and social groups (girls, nomad children). To achieve universal quality education by 2015, pursuant to the Geneva IV Roundtable, a ten-year program to support the educational system was adopted by the government and its partners in March 2002. It aims at: ! a marked improvement in the retention rate at the primary level; ! developing national curricula, training most community teachers, and drafting Chadian
schoolbooks; ! developing innovative programs to combat illiteracy; ! improving the quality of learning; ! experimenting with innovations in school health and meals, pre-school education, and
distance education; ! a strong effort to promote the enrollment of girls.
To achieve this, the government has committed itself to taking the following key policy measures:
a) A substantial increase of the share of GDP allocated to education, with a goal of at least 4 percent by 2015.
b) Earmarking of at least 50 percent of the education budget for basic education.
c) An annual increase of at least 20 percent in the operating budget of the education
sector, throughout the program.

69
d) Registration each year in the national budget and against HIPC resources of the funds to be transferred to the FAIC account for the heads of community and setting up of the Agency to Support Community Initiatives in Education (APICED);
e) Establishment of the National Curricula Center to develop bilingual national
programs, leading to the production of Chadian schoolbooks distributed free of charge to all children by 2011.
4.2.3.2 Health The overall objective pursued by national health policy is “to ensure that the population has access to quality basic health care services,” in keeping with the World Health Organization’s Health for All philosophy, in as short a timeframe as possible. The principal strategies in National Health Policy are: i) develop quality basic health care services for the population; ii) seek urgently for qualified human resources; iii) improve management of the health system; iv) continue to combat endemic diseases and epidemics. The intermediate goals are:
• Guarantee health coverage; • Develop a pharmaceuticals policy; • Continue and develop efforts to increase the frequency of visits to health centers; • Train human resources; • See that the health system is well-managed; • Put in place contractual arrangements governing the provision of health services by
private providers; • Make every effort to reduce the impact of endemic and epidemic diseases; and • Strengthen surveillance and early warning systems with respect to potentially epidemic
diseases (cholera, meningitis, tuberculosis). 4.2.3.3 HIV/AIDS With regard to HIV/AIDS, actions to be taken will, in particular, address awareness campaigns for high-risk groups but also children from primary school onwards. Arrangements will be made for pregnant women to be systematically screened and for victims of HIV to be treated. In fact, in addition to awareness campaigns, the government undertakes to take steps to care for patients and victims of HIV/AIDS, including the provision of antiretroviral drugs.
4.2.4 Improving the living conditions of vulnerable groups
This strategy targets the least privileged groups and thereby recognizes that general policies to promote economic growth are not enough to improve the lot of the poor. In that sense, the PRSP is based on integrated policies aimed at establishing the basic conditions for a continuous expansion of economic opportunities and at ensuring equal access to those opportunities by opening markets and strengthening skills. Thus, given the poverty profile in Chad, the national goals identified in connection with this strategy are integrated urban

70
development, support for microenterprises and SME, employment, and the setting up of a social protection system.
4.2.4.1 Integrated urban development Consolidating democracy, reducing poverty, and diversifying the non-oil economy are the basic pillars of the PRSP, which focus during implementation on policies that include promoting the sectors in which the poor are active and target poor areas. Analysis of the spatial dimensions of poverty in Chad justify geographic targeting of all parts of the country by developing infrastructure and promoting direct involvement of the rural population in implementation of the PRSP. In urban areas the PRSP :
• will support an approach that seeks to see that medium-size towns are interconnected by a road network that can be used all year round and can be accessed from any satellite settlements;
• will support national and regional development plans, which will be complemented by urban development plans;
• will help to draft an appropriate regulatory framework; • will concentrate on developing infrastructure and urban services.
4.2.4.2 Support for microenterprises, SME, and employment Support for microenterprises, SME, and employment will consist of:
• supporting the management and emergence of professional service providers. Support for the management of small enterprises is the key to sustainable development of the few really dynamic enterprises. To continue reducing the predominance of informal activities, a mechanism will be gradually introduced to support the development of a supply of professional services for formal sector enterprises that will assist them at various stages in their activities;
• the resumption of the activities of ATETIP (Chad Agency for the Execution Work of Public Interest), 14 which reconciles the distribution of income and the maintenance of basic and/or social infrastructure;
• rehabilitating technical training and apprenticeship centers by anticipating training needs and, to that end, regularly collecting information from companies;
• creating a documentation and economic and technological information center. • stimulating the financial system by establishing and developing financial instruments
with a view to: (i) mobilizing local savings based on investment and placement schemes; (ii)grouping together mutual insurance and micro-credit institutions; (iii) encouraging innovative projects: risk capital; (iv) facilitating equipment for small enterprises, via leasing; and (v) financing the productive cycle;
• disseminating educational programs to promote business culture and sensitize young people to the advantages of participating in programs offered by the technical training and apprenticeship centers, as well as young people involved in micro-projects, micro-
14 Enterprise in charge of implementing highly labor-intensive construction projects fot the central government and local entities.

71
activities, or microenterprises. The aim is to encourage creativity and facilitate insertion into the production circuit.
• improving cooperation and coordination of actions to support MFIs working in the field.
4.2.4.3 Social protection Social protection measures may be institutional (laws, regulations…) and/or programs and projects. Their function is to lessen vulnerability and ease the poverty of vulnerable groups. To that extent, they help to contain the excessive inequality and disparities between different social strata and to mitigate the possible negative impact of social and economic policy decisions and choices or of social unrest. In fact, an efficient social protection system must rely on a system providing exhaustive data on risks, vulnerable groups, actions taken, and the players involved. Thus a comprehensive social protection strategy should be based on three types of intervention: prevention, foresight, and remedies, should risks materialize. As regards risk prevention, the social protection strategy merges with the PRSP in as much as the latter aims for strong, sustained, and employment-generating growth, sound monetary and fiscal policies, and an adequate supply of basic social services. Priority actions with regard to risk prevention revolve around three areas:
• outreach (IEC) campaigns on key measures to prevent risks, mainly to health, and education regarding hygiene, nutrition, and the environment;
• a review of family law and land ownership laws in connection with improvements in the status of women;
• consolidation of the cooperation between the government and grassroots communities aimed at increasing access to social services.
With respect to foreseeing risks, where informal mechanisms are more numerous and more effective, the role of the public sector should consist of:
a) supporting existing and efficient informal mechanisms, such as mutual insurance of risks and response mechanisms developed by communities to deal with disasters or chronic dangers;
b) adjusting social security and the retirement pensions system. With respect to remedies, the aim is to:
a) mitigate the pernicious effects of informal mechanisms for responding to crises by discouraging the worst forms of child labor;
b) guarantee government assistance in the event of a major disaster, and to do so by rethinking: (i) the assignment of tasks among the different government departments; (ii) budgetary procedures for allocating emergency funds in the event of a disaster; (iii) the criteria governing eligibility for government aid and their enforcement; and (iv) the ways in which social assistance is provided.
4.2.5 Restoring and safeguarding ecosystems

72
In order to permit integrated treatment of the rural development priority area, which includes water and the environment, the fifth strategy is addressed through the national goal of integrated rural development. The aim is to address all environmental issues in the form of an integrated program, not only with respect to natural resource management, but also as a determinant of economic growth and hence of improvements in the living conditions of the population. 4.2.5.1 Strengthen the regulatory framework and natural resource management
capabilities Given the outdated nature of the laws and the lack of human, physical, and financial resources that characterizes the departments responsible for the environment, strengthening the regulatory framework and capabilities is a prerequisite for any actions to be carried out with respect to the environment. The Information for the Environment Training Program (PFIE), which aims to instill in primary school children habits designed to protect and preserve the environment, has been taken over by the government following the end of its funding by the European Union. Over the next 15 years, the actions to be taken to reinforce capabilities are:
• promulgate the laws transferring some natural resource management prerogatives to the users;
• install local natural resource management committees; • strengthen the capacities of the institutions responsible for natural resource
management ; • establish an environmental information system; • draft a national program to galvanize the population in defense of the environment.
4.2.5.2 Improvement of household energy management
Within the PRSP framework, an evaluation is to be carried out of the detailed action plan adopted in 1993 following a participatory seminar on the subject of domestic energy in connection with global environmental protection objectives. It is important to update and consolidate existing initiatives aimed at: (i) promoting viable production of firewood in rural areas surrounding the principal towns and cities, especially around N’Djaména ; (ii) making forestry a source of income for the rural population; (iii) further involving the rural population in natural resource management; (iv) use the taxation of wood and products derived from it as an incentive-based regulation system; and (v) enhancing the efficiency of domestic energy consumption by promoting stoves and other more efficient domestic energy-generating instruments.

73
Chapter 5 Macroeconomic Framework This chapter examines the factors underlying the growth projections set forth in the medium- and long-term macroeconomic framework for the poverty reduction strategy. It also examines the various conditions affecting the achievement and maintenance of the envisaged growth rates, particularly as regards macroeconomic stability and the economic policies whereby it can be guaranteed.
5.1 Sources of economic growth Oil sector. The development of the Doba oil fields, which began in 2001 with the construction of the Chad-Cameroon pipeline, is modifying the structure of the Chadian economy, which until 2000 was dominated by farming and grazing activity and the services sector. Preparation of the project triggered a spectacular increase in foreign direct investment (FDI). This investment has had a positive impact on the secondary and tertiary sectors, especially because of their impact on the construction and public works sector and the trade sector, where annual growth in real terms is projected at 29 percent and 13 percent, respectively, over the 2001–03 period. Consequently, real GDP is expected to grow by about 11 percent a year in 2001–03, after an annual average of 2.7 percent between 1995 and 2000. The beginning of actual oil production toward the summer of 2003 would boost GDP growth that year to 11.2 percent. Most of this production will be used to fill the pipeline to the Cameroon coast as well as the storage and export facilities at Kribi. For this reason, the projections show a sharp—but temporary—increase in the rate of growth of national income, reflecting an increase in the national saving rate. The startup of oil exports projected for early 2004 will bring about a temporary surge in GDP growth. In 2004, initial production will represent 36 percentage points of total GDP growth, boosting it to 42.4 percent. However, using the conservative assumption that no other oil fields will be discovered, nearly 80 percent of the existing reserves at Doba—estimated at 917 million barrels—will be extracted by 2015 (see Figure 1). In the present scenario, after the initial peak of 2004, oil production is expected to decline by 0.7 percent a year between 2005 and 2009 before dropping significantly by 14 percent a year thereafter. Accordingly, the share of oil in GDP would decline rapidly, from 31 percent in 2004–09 to 11 percent in 2010-15. In addition to the Doba project, which is run by private operators, the government is currently developing a small oil field in the Sédigui region where the reserves, estimated at 20 million barrels, are expected to last about 13 years starting in 2004. The crude oil from Ségigui will be refined by a private company that has yet to be identified; it will be building a refinery whose output is expected to cover almost 50 percent of the country’s need for petroleum products. The government is also considering various options to exploit also the natural gas associated with Sédigui oil, with a view to increasing further the domestic supply of energy products. The direct contribution of oil production to poverty reduction is expected to be limited, as this highly capital-intensive activity creates few jobs. In addition, a large share of the income from the oil sector will go to the private international consortium, which would repatriate most of it. This explains the fact that, despite the 42.4 percent expansion of real GDP in 2004 after oil production comes on stream, real GNP (which takes net flows of factor income into account) will rise by only 8.9 percent. Nevertheless, the indirect impact of oil activity on growth and poverty reduction will be significant, first because of the increase in public spending in

74
priority sectors made possible by oil revenue, and also owing to the increased demand for the products of other sectors by the oil industry and its employees. The government’s oil revenue will make it possible to increase services to the poor, in particular in education and health, thereby contributing to the development of human capital. Furthermore, the use of oil revenue to develop infrastructures conducive to increased productivity will stimulate private investment and, in consequence, growth and employment in the non-oil sectors, which will benefit the poor. These factors should contribute to a lasting improvement in the living conditions of the majority of the population. Non-oil sectors. The major economic challenge of the oil era will be to diversify and impart dynamism to all sectors of activity by taking the appropriate macroeconomic and structural measures so as to avoid the all too frequent problem of the emergence of a dual economy, in which the oil sector appears to be a rich and technologically advanced enclave alongside in the midst of a non-oil sector that is lagging behind and stagnant, in a context of widespread poverty. One of the primary causes of this dualization is the loss of competitiveness resulting from an unsought appreciation in the real exchange rate triggered by an unsterilized inflow of foreign exchange in the form of oil revenue. Measures that will make it possible to avert this situation, and which the authorities intend to introduce, are examined below. At the same time, the government intends to: (i) apply the strategies envisaged in each sector, focusing in particular on improving infrastructure (roads, communications, energy, and water resource management) and human capital; and (ii) accelerate the structural reforms in order to create incentives for the development of the private sector and to promote diversification of the economy. On these assumptions, non-oil GDP (that is, the value added produced by all sectors other than the oil industry) would grow at an average annual rate of 8.9 percent during the 2003–15 period. Primary sector GDP growth is projected at 4.2 percent a year between 2003 and 2015. At the same time, the value added in the food crops subsector is expected to grow at a 5.6 percent pace thanks to improvements in infrastructure and services and improved access to inputs and modern production techniques. These factors should raise productivity and enhance diversification in the production of food crops (mostly fruits and vegetables), as well as the use of underutilized arable land that has good potential. The production of cash crops is projected to increase by 4.6 percent a year on average between 2003 and 2015, in particular because of the positive impact of the ongoing reform of the cotton sector. In addition, these factors favorable to food crop agriculture, as well as the maintenance of external competitiveness, should stimulate the expansion of other cash crops, in particular gum arabic and shea nut. Livestock production should increase at a slower pace—averaging 2.9 percent a year between 2003 and 2015—and remain extensive for the most part. Nevertheless, productivity gains are expected in this area, especially because of infrastructure improvements, the expansion of veterinary services, and the gradual development of short-cycle livestock rearing. The GDP of the secondary sector is projected to expand at an annual average of 10.1 percent between 2003 and 2015, as oil production constitutes part of this sector. With oil production excluded, this sector is expected to grow by 7.2 percent a year in real terms over the same period. This good performance will result from: (i) the increased production of cotton ginning plants, oil mills, and soap factories using cotton subproducts, thanks to the anticipated increase in the production of seed cotton; (ii) the improved productivity of all industrial units

75
owing to the reduction in production costs arising from infrastructure improvements and the development of human resources; (iii) the sustained growth of the construction and public works subsector resulting from the envisaged public and private investment in infrastructure; (iv) the development of new industries, especially the processing of agricultural products and other manufacturing activities, thanks to an environment more conducive to private sector development and the increase in demand following the increase in household incomes; and (v) the anticipated development of the mining subsector, in particular for gold, diamonds, and kaolin. The GDP of the tertiary sector is projected to grow by 6.5 percent a year on average in the 2003–15 period owing to the combined impact of the following factors: (i) sustained growth in the primary and secondary sectors; (ii) significant productivity gains in transportation and trade thanks to the anticipated infrastructure improvements; (iii) the “catch-up” of the financial sector, which at present is relatively underdeveloped; and (iv) increased value added from public administration through the expansion of public services, especially in the priority sectors. Saving-investment equilibrium. The growth projections set forth in the macroeconomic framework depend upon an increase in investment as a percentage of GDP. In this scenario, gross total investment (excluding petroleum project investment) is projected to increase from 17.4 percent of GDP in 2003 to 18.5 percent of GDP in 2015, and would be distributed almost equally between the public and private sectors. National saving is expected to grow more rapidly than investment, in a context marked by increased incomes and improved prospects for sustainable growth and macroeconomic stability. In a consistent manner, the balance of current transactions would gradually improve thanks to the dynamic of exports and imports (see annex below). Accordingly, national saving should increase from 6.5 percent of GDP in 2003 to 13.6 percent of GDP in 2015. Of this percentage, 6.5 points would be attributable to improved fiscal performance during this period. 5.2 Conditions necessary to growth and poverty reduction Several measures will be essential to achieving strong economic growth: (i) preserving macroeconomic stability and external competitiveness; (ii) enhancing good governance; (iii) successfully completing the necessary structural reforms; (iv) improving the country’s infrastructure; and (v) improving the quality of the labor supply through the development of human resources.
With a view to enhancing good governance, in August 2002 the government adopted a good governance strategy annexed to the PRSP. As regards infrastructure improvement, the initiatives envisaged are set forth in Chapter 4 of the PRSP and are consistent with the fiscal policy discussed below in this chapter. Chapter 4 also presents the government's intentions with regard to education, health, and other social services which constitute the basis of the human resources development strategy, as well as the other structural reforms. The remainder of this chapter will be devoted primarily to the last condition to be fulfilled in order to promote sustainable economic growth, namely macroeconomic stability and the measures needed to achieve it.

76
5.2.1 Macroeconomic stability
5.2.1.1 Objectives Macroeconomic stability is characterized by: (i) low inflation; (ii) an appropriate real effective exchange rate; (iii) sustainable indebtedness; and (iv) adequate exchange reserves.
Low and stable inflation will create a favorable environment for economic growth by reducing the uncertainty surrounding price developments, thereby facilitating long-term planning and, as a result, investment. Moreover, it will create an environment conducive to the growth of private sector saving, as it makes the real return on financial assets less uncertain. The macroeconomic framework targets an inflation rate of about 3 percent a year over the 2003–15 period. A low rate of inflation is also essential in order to maintain external competitiveness, especially in the case of a country like Chad that has a fixed exchange rate owing to its participation in the French franc zone.
A higher inflation rate than that of trading partners and competitors would induce an appreciation of the real exchange rate and gradually reduce the competitiveness of existing sectors while impeding the emergence of new ones. In contrast, a favorable real exchange rate will encourage rational resource allocation in favor of the production of tradable goods and will make it possible to develop existing and new activities in the non-oil sector. In addition, a low inflation rate will have the effect of directly protecting the poor, most of whom have incomes that are defined in nominal terms and who hold their financial assets, should they have any at all, in the form of cash.
Hence a low inflation rate will make it possible to avoid a redistribution of purchasing power or wealth to the detriment of the poor. Furthermore, a low and predictable inflation rate makes it possible to avoid the shrinkage in real terms of the budgetary appropriations that benefit the poor. Finally, because many of the poor earn their subsistence from the production of tradable agricultural goods—especially cotton and livestock—a deterioration in the real exchange rate would reduce their incomes and worsen poverty.
External debt that is high in relation to the country’s capacity to repay would discourage potential national and foreign investors, who could be apprehensive about tax increases to finance debt service or about a financial crisis that would be harmful to the economy. The poor would suffer from excessive indebtedness not only because of the effect on incomes that insufficient private investment would have, but also because of reduced public expenditure in the priority sectors for combating poverty. In effect, it would be necessary to allocate more to debt service, the amount of which would be affected by the high level of indebtedness and the excessive interest rates that creditors would impose on the country to cover the risk of default.
In the macroeconomic framework of the poverty reduction strategy, the debt sustainability indicators should improve considerably in the medium term thanks to oil production and exports and to debt relief under the HIPC Initiative. Total net external borrowing (disbursements minus amortizations) should gradually decline from US$172 million in 2003 to US$90 million in 2015, owing to the aforementioned improvement in the saving-investment balance. Over the same period, the ratio of the net present value (NPV) of debt to exports is projected to decline from 266 percent to about 50 percent in 2005–09, a period in

77
which oil exports will be on the rise, before climbing back gradually to 120 percent in 2015. The ratio of debt service to exports would have the same profile, dropping from 15.3 percent in 2003 to about 2.6 percent in 2004–09, and subsequently climbing back up to 7.2 percent in 2015.
A comfortable level of official foreign exchange reserves will enhance the country’s ability and credibility to cope with possible external shocks, especially since currently and for a number of years to come the export base of the country will be limited to a few products traded in volatile international markets, and because of the vulnerability of Chad’ food production to adverse weather developments. Building a cushion in the form of reserves will have a salutary effect on both foreign and domestic private investment, as investors will be more confident that temporary adverse developments in the areas mentioned above will not severely affect macroeconomic stability and economic activity. These considerations imply that Chad will have to aggressively build up its foreign exchange reserves in the coming years, especially in the context of the longer-term macroeconomic projections. As the country’s oil resources will dwindle in the middle of the second decade of the century, and before many export and import substituting sectors have an opportunity to fully take hold and mature, Chad will need to draw for some years on its accumulated foreign exchange reserves to maintain an adequate rate of growth of imports, which would be essential for continuing growth and poverty reduction. In order to permit these future outlays while always maintaining a level of reserves that is adequate for confronting possible shocks, it will have to accumulate substantial reserves during the initial years of the oil era. Thus the level of reserves should increase from 5.2 months’ imports of goods and services excluding factor income in 2003 to 11.9 months of such imports in 2010. Subsequently, it is projected to decline gradually to 7.4 months at the 2015 horizon or thereabouts.
In keeping with the aforementioned objectives for the external debt and reserves, the current deficit (excluding current official transfers) should be brought down from the current high level of 46.7 percent of GDP in 2002–03, largely attributable to the high level of imports for the oil project, to 8.6 percent of GDP in 2004 when oil production will begin. In 2005–09, the current deficit is projected at 3.4 percent of GDP on average, which would be more than offset by inflows of private and official capital, thus favoring the accumulation of gross official external reserves referred to earlier. The current external deficit is then expected to increase as oil exports decline, reaching 5.2 percent by 2015. As no comparable increase in capital flows is anticipated, reserves should gradually decline as noted above.
Throughout the 2004–15 period, the volume of non-oil exports is expected to increase by 4.3 percent a year in keeping with the above-mentioned sectoral projections. In particular, traditional exports (cotton and livestock) are projected to increase by 3 percent a year on average over the period. The poverty reduction strategy also depends upon export growth in other areas, as noted above, assuming the anticipated maintenance of an adequate real exchange rate, infrastructure and human capital improvements, and the pursuit of good governance and other structural reforms. According to the macroeconomic framework, exports excluding oil, cotton, and livestock are projected to increase from US$52 million in 2003 to US$100 million in 2010 and US$202.8 million in 2015 (or about 39 percent of total exports that year). Following an annual drop of 30 percent a year on average in 2004–05, explained by the winding up of the investments in the Doba project, import volume is expected to increase by 4.6 percent a year in 2006–15. This corresponds to a gradual decline in the share of imports in non-oil GDP as the Chadian import substitution sectors expand in

78
the primary and secondary sectors, which is likely in view of the extremely low level of development of these areas at present, and of the high level of dependence on imports.
5.2.1.2 Economic policies 5.2.1.2.1 Fiscal policy
As Chad is a member of the Central African Economic and Monetary Community (CEMAC), which has a fixed nominal exchange rate, fiscal policy will of necessity play the main role in achieving macroeconomic stability and equitably distributed growth. Fiscal policy will thus have to meet the challenges inherent not only of a small, low-income, open economy that is a member of a monetary zone, but also those arising from an oil windfall which, while substantial, is relatively limited over time.
Analysis of the specific fiscal policy constraints induced by the existence of oil revenues yields the following findings:
• It is necessary to ensure the stability of expenditure, in particular in the priority sectors, in view of the hypervolatility of oil revenues. Large and frequent changes in public expenditure would negatively affect demand conditions in general, as well as specific current and capital fiscal expenditures which may be crucial to the growth of the non-oil sector. Moreover, service delivery to the poor and investment in human capital would be disrupted. All this would negatively affect the poverty reduction effort.
• It is necessary to avoid any pronounced budgetary imbalance which might be triggered by excessively optimistic projections of petroleum prices and the intrinsic volatility thereof. Imbalances of this kind could engender excess indebtedness, with the negative effects described above.
• In view of the pronounced increase in budgetary revenue associated with the period of oil production, it will be necessary to ensure the optimal utilization of these temporary resources so that they can be applied in a way that does the most to promote sustainable growth and poverty reduction while avoiding any waste. Special arrangements needs to be made to ensure that oil resources are used to increase only allocations in priority sectors beyond the level that would be achieved without the presence of oil receipts.
• Careful planning is essential in order to ensure an adequate level of budgetary expenditure after the oil era is over, as income derived from petroleum is by definition nonrenewable. This is necessary in order to maximize the effect of oil revenues on growth and poverty reduction, as well as to preserve equity across generations.
The problems referred to above have been observed in other oil-producing countries, in Africa in particular. Chad will be facing the same challenges, in particular as regards the projected timing of oil revenues (Box 1, Chart 1) characterized by sizable resource inflows beginning in 2004, followed by a sharp decrease starting in 2010, with a two-year bulge in the middle of the second decade of the millennium and a steep drop-off thereafter.

79
Box 3—Oil revenues, 2004–15 projections Based on projections for oil extraction and a world market price on the order ofUS$17 per barrel for Chadian crude, the revenue accruing to the government from oiloperations would amount to CFAF 118 billion annually (approximately US$180 million) over the 2004–15 period, of which CFAF 4 billion would be from theSédigui field. The Doba receipts include production royalties, the tax on oil extractioncompanies, the tax on the company operating the pipeline over the portion in Chad (TOTCO), and the dividends paid by that company and COTCO, its Camerooniancounterpart, in which Chad is a shareholder. However, the substantial amortizationpayments that the extraction companies and TOTCO will be facing should more than exceed their taxable income during the initial years of operation. This factor, inconjunction with the production profile, means that the revenue the government willderive from oil operations will vary significantly from one year to the next, even if oil prices are stable.
To remedy the potential problems associated with oil production referred to above, Chad should pursue the following fiscal strategy:
a. First, public oil revenues, which will flow in their entirety into the annual budget, will be the subject of cautious estimation based on conservative price and exchange rate assumptions. Prudent projections of available resources will make it possible, in periods of declining oil prices, substantial budget deficits and the resulting macroeconomic disruptions, as well as the harmful and difficult substantial adjustments in public spending levels.
b. Second, public expenditure programming will be carried out as part of the medium-term expenditure framework that will take the economy's absorptive capacity into account. Any surplus of revenue over expenditure will be saved. Aligning the level of programmed expenditure with the government’s capacity to implement projects, and with the economy’s capacity to effectively use the goods and services provided,15 will contribute to reducing the risk of any decline in the quality and effectiveness of public expenditure, and hence of resource waste.
c. Third, in order to ensure that oil revenues have a maximum impact on growth and poverty reduction, and to contain the risk of massive unproductive capital expenditure or consumption expenditure, Chad will enforce the law on the management of oil revenues (LGRP) passed in 1999, which stands as an unprecedented legislative provision in an oil-producing country. This law mandates the inclusion of all oil revenues into the general budget and the earmarking of direct receipts (royalties and
15 This entails, for example, avoiding constructing schools without taking into account the time required for teacher training, or building roads without first attending to maintenance arrangements or without taking the steps necessary to prevent water runoff which could damage them during the rainy season.
80
dividends) to the following expenditures: (i) 10 percent to the Fund for Future Generations (FGF); (ii) the remaining 90 percent is distributed as follows: 72 percent for operating and capital expenditure in the priority sectors (health, education, infrastructure, and rural development), 13.5 percent for general operating and capital expenditure, and 4.5 percent for expenditure relating to the Doba basin oil project. The Oil Revenue Control and Surveillance Board will play an active role in controlling the proper use of oil revenues.
d. Fourth, to ensure equity between generations, the resources of the FGF will: (i) be used exclusively for the objectives targeted by the creation of that Fund, namely, the accumulation of financial assets for future generations; (ii) be invested in low-risk assets of sufficient liquidity; (iii) not be mortgaged against loans to finance budgetary expenditure; (iv) be efficiently managed by having recourse as necessary to international expertise; and (v) only be used after the country’s oil reserves have been depleted.
The precise modalities for using oil revenues consistent with these strategic principles will be finalized in the near future. To this end, a medium-term framework for current and capital expenditure is being prepared for all the ministries in the priority sectors. The preparation and implementation of the aforementioned fiscal strategy will require intensifying the sizable effort to strengthen the capacities involved,16 in particular as regards forecasting oil revenues and budget preparation and planning.
During the oil era, the government will also have to ensure the continuance of the efforts to strengthen the underlying budget position and, in so doing, assure macroeconomic stability as well as adequate levels of financing for priority expenditures in the post-oil era. In this context, a significant reduction in the overall budget deficit (excluding grants) is projected from 14.1 percent of GDP in 2002–03 to about 3.5 percent of GDP on average over the 2004–15 period. The primary base balance17 is also expected to improve, from a deficit of 2.7 percent of GDP in 2002–03 to a surplus of 1.6 percent of GDP over the 2004–15 period. This is consistent with the gradual increase in the share of capital expenditure financed with domestic resources, in accordance with projections of gradually reducing Chad’s dependence on external assistance.
The inflow of massive amounts of oil revenue could potentially obscure the direction of the underlying fiscal policy stance. As a consequence, during the period of oil revenue inflows, it will be useful to use as the guiding instrument for formulating fiscal policy the primary balance excluding oil revenues, defined as the overall balance of budgetary operations minus oil revenues and net interest income. The primary budget balance excluding oil revenues could thus be assessed as a function of non-oil GDP and hence related to the tax base. The macroeconomic framework of the poverty reduction strategy calls for gradual improvement in the non-oil primary balance as a percentage of non-oil GDP, from a deficit of 1.7 percent in
16 This effort has been initiated with support from the World Bank, in the form of an immense capacity building program launched in 1999, but additional technical assistance could prove necessary in these areas. 17 Total government revenue (excluding grants) minus total public expenditure (excluding debt service payments and externally financed capital expenditure).

81
2004 to a surplus of 0.6 percent in 2015. The surplus would be maintained in subsequent years.
This budgetary orientation would contribute in many respects to affirming macroeconomic stability and, in consequence, economic growth and the efforts to combat poverty. First, through its effect on moderating aggregate demand, it will help to maintain the annual inflation rate at a low level as desired, at around3 percent in the medium and long term. Second, an improvement in the fiscal position will facilitate the recovery of the external accounts and permit the desired accumulation of foreign exchange reserves. Third, the reduction in fiscal deficits will limit domestic and external borrowing and thereby make it possible to perpetuate the improvement in debt sustainability resulting from the startup of oil exports, even after oil resources are depleted. Fourth, the reduced dependence on aid will build confidence on the part of investors, who will appreciate its fruits in terms of macroeconomic stability (in particular as regards the volatility and unpredictability of aid flows). Finally, this fiscal strategy will contribute to protecting priority expenditures and keeping them at stable levels, given that it will be easier to absorb short-term economic shocks by permitting temporary higher deficits in a context in which the underlying budget deficit is small.
The projected improvements in the underlying budget position will result from maintaining the increase in non-oil revenue, in particular through the strengthening of tax administration and broadening the tax base. Accordingly, receipts from domestic taxes and levies would increase from 3.1 percent of non-oil GDP in 2002 to 7.9 percent of non-oil GDP in 2015. At the same time, receipts from taxes on foreign trade are expected to increase in the medium term thanks to the introduction of the customs administration reform plan recently adopted by the government, which could increase these receipts from 2.6 percent of non-oil GDP in 2002 to 5.1 percent in 2015. Revision of the current system of exemptions and ad hoc waiver of duties, as well as the exemptions granted under the investment code, will constitute an important aspect of these efforts. In this connection, Chad may wish to request technical assistance from the IMF and other development partners. By virtue of these efforts in the medium term and their continuance in the long term, total budgetary revenue is projected gradually to increase from 8 percent of non-oil GDP in 2002 to 15.2 percent of non-oil GDP by 2015. Although ambitious, this target is achievable. Moreover, the target level is lower than the current average revenue-toGDP ratio in the countries of Sub-Saharan Africa (18 percent).
Consistently with the budgetary orientation and revenue trend described above, total expenditure is expected to increase by an annual average of 6.8 percent in real terms over the 2004–15 period. The macroeconomic scenario envisages an annual increase in the government’s civilian wage bill of about 8.3 percent in real terms. This should not only allow government employees to receive adequate compensation, and thereby reduce embezzlement, but also should constitute a decisive factor in improving the delivery of public services, in particular by increasing public employment in the priority sectors. Budget appropriations for the procurement of goods and services for nonmilitary purposes and for transfer outlays are expected to increase in real terms by 12.9 percent a year on average over the 2004–15 period. Public investment financed by domestic resources is projected to increase by 18.2 percent in real terms over the same period, offsetting the virtual stagnation in real terms of externally financed investment, thereby making it possible for total public investment to grow by 5.2 percent a year in real terms. The virtual stagnation of externally financed investment is

82
dictated by the need to preserve debt sustainability in the long term, in an environment in which it is unlikely that the degree of concessionality of the aid extended will increase given the projected improvement in the fiscal situation. Over the same 2004–15 period, expenditure in the priority sectors is projected to increase on average by 15 percent a year in real terms. Accordingly, the share of priority expenditure in total public expenditure is expected to rise from 44 percent in 2003 to 68 percent in 2015. This distribution of budgetary expenditure will constitute an important measurement of the achievement of sustainable growth and equitable use of oil revenues benefiting disadvantaged social groups. In order best to guarantee this achievement, it will be advisable to continue the ongoing effort to strengthen budget preparation and the monitoring of budget execution, in particular in respect of expenditure aimed at reducing poverty (see Box 2).
Box 4. Principal actions underway to strengthen the monitoring of expenditure in the priority sectors
Enhanced budget preparation
• Introduction in 2003 of the medium-term expenditure framework and program budgets in the health, education, public works, rural development, and justice sectors
• Budget preparation by nature, by function, and gradually, by geographical distribution
Enhanced budget execution
• Implementation of the streamlined expenditure circuit, and the temporary but full computerization of this circuit as from 2003
• Development of the integrated expenditure circuit, via a single computerized sequence (Burkinabé system), for implementation in 2004
• Gradual inclusion of civil servants in the banking system
Improved monitoring of budget execution
• Half-yearly preparation and publication of reports on expenditure in the priority sectors for poverty reduction
• Monthly production of detailed tables delineating budget execution in the four stages of the expenditure process
• Annual review of public expenditure in the priority sectors, the conclusions of which will contribute, inter alia, to updating the medium-term expenditure frameworks
• Implementation of a short-term action plan for monitoring expenditure operations up until their usage in the health and education sectors
• Half-yearly audit by the Audit Office of the Supreme Court of the expenditure financed by the resources stemming from the HIPC Initiative
• Submission to Parliament of the budget execution law for year n-1 prior to submission of the draft finance and budget law for year n+1

83
In the short and medium term, oil revenues will substantially exceed the absorptive capacities of the priority sectors. Expenditure in these sectors is projected to increase by nearly 29 percent a year between 2004 and 2006.18 In accordance with the law on the management of oil revenue (LGRP), oil revenue will finance only the share of such expenditure which exceeds the level planned under the 2002 budget. In keeping with the principles referred to earlier, surplus oil revenues will be placed in reserves, largely for stabilization purposes. Over a three-year period (2004–06), these reserves would build up to about CFAF 100 billion. In 2004, expenditure in the nonpriority sectors will be constrained, as in 2003, by the amount of financing available (non-oil revenues, external budgetary support, and domestic bank and nonbank financing), which will also finance expenditure in the priority sectors up to the level projected in the 2002 budget. Despite an increase of about 17 percent in non-oil revenues in nominal terms, the projected reduction in external budgetary support will limit the growth of expenditure in the nonpriority sectors to 5.9 percent in nominal terms.
In 2005 and beyond, the gradual easing of the constraints limiting nonpriority expenditure will make it possible for them to be increased in nominal terms by about 10 percent a year on average in 2005 and 2006. The overall fiscal deficit excluding grants is projected to remain stable at about 3.5 percent of GDP from 2004 to 2006, a substantial improvement over the three preceding years during which it averaged 12.8 percent of GDP. This deficit would be financed by external grants and loans in the context of investment projects, growing by 4 percent in 2004 and by 1 percent in 2005 and 2006, and in 2004 by continued budgetary support, in particular that from the European Union, which is projected to come to €24 million.
As indicated above, the envisaged budget orientation in the medium and long term is consistent with the objective of keeping inflation low and preserving external competitiveness in a context of a fixed exchange rate. It is not possible, however, to rule out the possibility that the acceleration of aggregate demand might sometimes exceed the projections in this macroeconomic framework for reasons that are independent from fiscal policy. For example, it is conceivable that there could be a massive inflow of private capital associated with positive expectations about Chad’s economy. This could result in inflation that exceeds the level projected in this scenario and therefore an appreciation in the real exchange rate. The same result could be induced by less elasticity in the supply of certain nontradable goods, in response to the increase in public expenditure or in household expenditure that exceeds current projections. In these cases, fiscal policy will have to be more restrictive in order to moderate the rate of expansion of aggregate demand and contribute to containing losses in competitiveness and avoiding triggering “Dutch disease.” While it is difficult to determine in advance the degree of tightening that would be required, the fact remains that there is a political commitment to do so. Failure to act in this manner could prove harmful to the long-term prospects for economic growth and poverty reduction in Chad.
18 At this stage, the rates are indicative. They are currently being finalized in the context of preparing the medium-term expenditure frameworks, for which one of the objectives is to develop an accurate estimate of the absorptive capacities of each sector.

84
2003 2004 2005 2006Spending, excluding debt service 307.9 338.3 375.4 414.9
Of which: domestically financed 176.4 190.1 223.3 261.2Priority sectors 87.9 102.2 120.9 148.3Other sectors 88.5 87.9 102.4 112.9
Total domestically-financed spending 176.4 190.1 223.3 261.2
Priority spending for poverty reduction 87.9 102.2 120.9 148.3Health and social affairs 22.9 26.6 31.4 38.6Education 32.9 38.3 45.3 55.6Rural development 16.9 19.7 23.3 28.5Infrastructure 10.2 11.9 14.0 17.2Good governance 5.0 5.8 6.8 8.4
Nonpriority spending 88.5 87.9 102.4 112.9Nonpriority civilian spending 65.8 64.1 76.4 83.5Military spending 22.7 23.8 26.0 29.5
Current spending 133.8 146.4 168.6 197.0
Priority spending for poverty reduction 60.1 70.7 83.1 103.0Health and social affairs 17.0 20.0 23.5 29.2Education 30.0 35.2 41.4 51.3Rural development 7.2 8.4 9.9 12.3Infrastructure 2.9 3.4 4.0 5.0Good governance 3.1 3.6 4.2 5.2
Nonpriority spending 73.7 75.7 85.5 94.0Nonpriority civilian spending 51.9 52.7 60.6 65.7Military spending 21.7 23.0 24.9 28.3
Investment spending 42.6 43.7 54.7 64.3
Priority spending for poverty reduction 27.8 31.5 37.8 45.4Health and social affairs 5.8 6.6 7.9 9.5Education 3.0 3.4 4.0 4.9Rural development 9.7 11.1 13.3 15.9Infrastructure 7.3 8.3 10.0 12.0Good governance 1.9 2.2 2.6 3.1
Nonpriority spending 14.9 12.2 16.9 18.9Nonpriority civilian spending 13.9 11.4 15.8 17.7Military spending 0.9 0.8 1.1 1.2
Foreign-financed investment 131.5 148.2 152.1 153.6Priority sectors 130.5 147.0 150.9 152.4Other sectors 1.0 1.2 1.2 1.2
Table 6: Public Spending by Sectors, 2003-06(in billions of CFA francs)
Note: In this table, the level of foreign-financed investment is the projection of disbursements in 2003, and the desired level of financing in 2004-06. A detailed breakdown in expected disbursements by sectors and by programs, and financing to be sought for new programs or projects yet to be taken into account is being prepared for 2004-06. Annex 2 contains a partial relating list of such new programs/projects.

85
5.2.1.2.2 Monetary and financial sector policies
The use of monetary policy instruments may help fiscal policy keep inflation low and preserve external competitiveness. First, maintaining prudent monetary conditions within the CEMAC, of which Chad is a member, will make it possible to contain demand throughout the zone and will significantly contribute to controlling demand within Chad itself. Second, there may be some scope for monetary policy operations within each country if there exists some—albeit partial—segmentation by country of the market for money and credit, as well as the market for goods and services. In the absence of such segmentation, there would be little risk that inflation in Chad would deviate on a lasting basis from that in the other countries of the zone.
In current circumstances, inflation in Chad could deviate from the CEMAC average because a substantial proportion of Chad’s output is nontradable and the single price law does not apply to such products. Furthermore, Chad's credit market is not completely integrated with that of the other CEMAC countries. Hence, the supply of bank credit in Chad cannot easily be used to meet the financing requirements of bank or nonbank entities in other CEMAC countries. As a consequence, possible massive capital inflows to Chad resulting in an excess supply of credit and an excess liquidity situation in the country would not be propagated throughout the region, triggering excess demand and inflation in the country. If the effect is limited to the country because the markets are not integrated, then monetary policy may have an impact at the country level.
In these circumstances, monetary operations limited to the country will be actively used in order to keep inflation low and preserve external competitiveness in the period ahead. This could prove necessary, particularly in light of the sizable amounts of anticipated oil revenue which could, if not sterilized, result in surplus credit and excess liquidity in the country. While it is true that the foreign exchange flows intended to finance the Fund for Future Generations will make it possible to do this in part, this sterilization will not be sufficient on its own in view of the magnitude of the expected inflows. The difficulty arises from the fact that, for the time being, it is planned to retain the residual oil revenues in the form of deposits with commercial banks, which would generate substantial excess liquidity in Chadian banks.
For this reason, the government is examining with the BEAC the various measures that could be used to counter the negative effects of the foreign exchange inflow. The simplest and least costly of these would consist in the government holding the unused oil revenues in domestic currency accounts opened with the BEAC, and not with commercial banks. This would have the automatic effect of sterilizing the funds and preventing the negative impact of excess liquidity. However, that would require an amendment to the LGRP, which stipulates that the government is to deposit oil revenues in accounts opened with Chadian commercial banks. Along the line of thinking within the monetary zone, other measures could include: (i) raising the required reserves ratios set for Chadian banks; and (ii) having the BEAC issue securities directly to Chad in order to absorb the liquidity of its banks. The first approach would be costly for banks, however, if the reserves are not remunerated, while the second would in all likelihood be onerous for the BEAC. An alternative approach would be for the government to

86
issue its own securities to absorb the excess liquidity and thereby directly cover the costs of sterilization.19,20
The macroeconomic framework aligned with the poverty reduction strategy calls for money supply expansion of 11.7 percent a year on average over the 2004–15 period. This rate of expansion is compatible with the rate of growth of gross national disposable income (GNDI), a better measure of national income than GDP given the substantial transfers of income abroad that will be made by foreign firms. The rate of growth of broad money should nevertheless be slightly greater than the rate of growth of GNDI, owing to the anticipated gradual monetization of the Chadian economy. As indicated above, the monetary program contemplates the building up of exchange reserves during the peak oil production years, namely 2004–10, followed by a gradual slowdown in this coverage. This would allow for an adequate rate of growth in domestic credit and imports, and help maintain high economic growth rates as oil exports decline. During the 2004–15 period, credit to the private sector is therefore expected to increase at an average rate of 10.5 percent a year, which should be sufficient to boost economic activity and domestic investment to the projected levels.
Chad’s banking system is still underdeveloped. The country currently has only five commercial banks and one agricultural bank that have branches in only five cities. This is one of the causes of the low mobilization of domestic saving and investment financing. It is anticipated that the business opportunities presented in the long-term macroeconomic scenario described above will enable the financial sector to grow and gradually expand its activities throughout the national territory, thus making it possible to promote saving and investment financing. A growing number of bank branches throughout the country will facilitate greater monetization of the economy in line with the gradual reduction in the velocity of circulation of the currency as projected in the macroeconomic scenario.
As observed earlier, the level of development of the financial sector will depend upon the speed with which the government, in consultation with the BEAC, will take concrete measures aimed at introducing financial instruments (treasury bills, government bonds, and shares in enterprises) and the development of the interbank market for these securities. Indeed, while making it possible to sterilize the sizable inflows of foreign exchange, these new instruments will make it possible to mobilize domestic saving; this will also be strengthened by the planned reform of the retirement system to improve its financial soundness and by the development of the insurance sector. Financial sector development will also benefit from the establishment of a legal framework promoting the development of the private sector, in particular in the area of collecting guarantees. The combination of all these actions with a stable macroeconomic framework characterized by low inflation rates should enable the banks to extend long-term loans for financing investments. The financial soundness of Chad’s
19 This is possible in the process of gradually eliminating BEAC financing of public expenditure and replacing it by bond issues or Treasury bills, which is in progress throughout the BEAC zone. 20 In theory, Chad might also consider the possibility of accelerating the pace of repaying its external debt, in accordance with the degree of concessionality of the debt in question. However, such a solution would permanently reduce the amount of reserves accumulated for stabilization purposes and would also run the risk of being inconsistent with the regulations on the advance earmarking of oil revenues.

87
banking sector is rather good at present; however, in light of the anticipated increase in liquidity in the economy, bank supervision will have to be strengthened in order to prevent the granting of high-risk loans which would make the financial system as a whole fragile. Finally, following the government’s recent adoption of the legal framework to govern microfinance activities, the development of this subsector will be accelerated in order to ensure that rural populations will have access to the saving and credit infrastructures.

88
Chapter 6 Implementation of the PRSP
Year 2003 will be the first year of the PRSP implementation. However, a number of ongoing activities in he context of the implementation of the sectoral programs resulting from the Geneva IV Roundtable will be taken into account, as well as the reforms proposed by the World Bank in its report on public expenditure for poverty reduction. The same holds true for the “good governance” actions in the political and financial spheres. PRSP implementation will be entrusted to each ministry concerned, each within its own purview, but other partners such as NGOs and the private sector will be involved in the implementation of actions in their respective areas and sectors of intervention and will take care to draw the attention of the authorities and the general public to requirements as well as problems, in particular as regards respecting human rights. PRSP implementation will therefore call for close cooperation between the government and civil society, at both the national and local levels. The PRSP will also require strengthening the institutional capacities of the government and its nongovernmental partners. Indeed, one of the causes for the failure of previous programs has been the inadequate capacity of technical and financial entities to implement the actions planned within prescribed deadlines and in the sectors and locations selected in advance. Accordingly, this raises the problem of strengthening the capacities of both public and private structures that are expected to be involved in PRSP implementation. The actions programmed in the National Good Governance Strategy should contribute to the gradual solution of these problems, so long as that strategy is pursued with resolve. 6.1. Stages of implementation The Poverty Reduction Strategy can only be carried out gradually and in stages. The first period, that of the effective launching of the strategy, will cover 2003–05. It will be marked by the initial exploitation of oil resources as well as the initial availability of funds from the HIPC Initiative. It should make it possible to:
• launch preliminary priority actions by mobilizing the available resources (so long as they are allocated in such a way as to provide an effective response to the poverty reduction objectives);
• initiate or move forward the essential institutional and organizational reforms; • mobilize and strengthen the capacities necessary for implementation of the program,
while ensuring greater coordination and consistency between those managing and carrying out activities;
• provide steering for the program, assessing its adequacy and functionality, and identifying and correcting the problems encountered;
• prepare during 2005, while taking due account of the lessons learned from activities already carried out, the program for the Second Period (2006–10).
The second period (2006–10) will coincide with the increase in oil revenues, as well as the continued availability of HIPC funding. In addition, this period will take advantage of the

89
reforms initiated since 2002 as regards three-year budgeting (of both current and operating expenditure), government procurement and strengthened government-private sector-civil society cooperation, as well as decentralization. The third period (2011–15) will be programmed on the basis of accumulated experience during the second period and an in-depth assessment, and will also take account of developments and changes nationally, regionally, and globally. A matrix of the priority actions corresponding to each of these subperiods is annexed hereto, and prepared on the basis of:
• diagnostic components; • programs drawn up by the key sectoral ministries; and • partners’ commitments (or announced commitments) of support.
6.2. Monitoring PRSP implementation implies the introduction of systematic and regular monitoring of each focus (and action) selected, starting with the first year. This implies in particular that:
• the necessary resources are available for carrying out the priority actions selected; • the planned activities are carried out satisfactorily; and • the actions not carried out or for which there are problems are revised and corrected.
The monitoring effort is intended in particular to track outcome trends over time and for particular groups and zones, to gather information that will make it possible to assess the factors that determine or prevent outcomes, and to provide decision makers with information on the effectiveness or inadequacy of the measures taken and on the corrections needed in order to achieve certain objectives. Monitoring will be conducted by activity and by strategic focus, using monitoring indicators determined in advance and accepted by all stakeholders. The sources of quantitative data are:
• Administrative data and data from other institutions • Population censuses • Household surveys, namely:
o living conditions surveys o spending and income surveys o employment surveys o population and health surveys o pinpoint observation and requirements satisfaction surveys o targeted surveys and topic-based surveys.
The key concepts used in poverty comparisons, such as the relative poverty and absolute poverty thresholds, poverty incidence, the spread of poverty, and the severity of poverty, may only be defined on the basis of quantitative data. Qualitative data cover the following subjects:
• the priorities the poor attach to improving their situation—disaggregated by gender and other characteristics of importance to the community;
• the perceptions of the poor as to the causes and consequences of poverty;

90
• the opportunities the poor have to improve their destiny; • the constraints and obstacles to be overcome in order to improve the situation of the
poor; • differences between localities—differences between districts and between urban
centers and rural areas; • the perceptions of the poor regarding access to and the quality of services,
infrastructure, and governance at the local level. Monitoring the poverty reduction strategy therefore requires a combination of the quantitative and qualitative methods. At the current stage of programming, it is planned to conduct the following surveys:
• Second Survey on Consumption and the Informal Sector in Chad (2003) • Survey of village-level energy supply (2003) • Survey of users of customs services (2003) • Population and health survey of Chad (2004) • Tracking of public expenditure through delivery—health sector (2003) • Monitoring of the cotton sector (2003) • Second general population census (2005).
National statistical system The national statistical system, coordinated by the National Institute for Statistics and Economic and Demographic Studies Research (INSEED), will be requested for data gathering purposes.21 This said, some qualitative surveys will be headed up by the Steering Committee in order to hear the opinions of the population regarding their perception of poverty. The macroparticipation type of information-gathering instruments will be used to enable the Steering Committee to hear the perceptions of the people and of organized groups (producers’ organizations, women’s groups, NGOs, traditional chiefdoms, etc.). Particular emphasis should be placed on information on regional inequalities and cross-cutting problems (AIDS, war, environment, etc.). 6.3. Assessment PRSP appraisal will consist in comparing the results obtained with the objectives first established, explaining any gaps identified, and proposing corrective measures. It will contribute to improving the effectiveness of programs and policies while providing information and proposals for adjustments and improvements. The first PRSP appraisal is scheduled for late 2004. This still summary appraisal will make it possible to measure the major trends identified by the indicators and vouch for the appropriateness or inadequacy of the actions programmed and launched. As reference points, this appraisal will use the quantitative objectives and data from the flash surveys conducted in
21 Reference might also be made to the Multiyear Activities Program for 2002-07 prepared by INSEED (November 28, 2001), which in particular includes a program on “sociodemographic and statistical data for monitoring household living conditions and poverty.”

91
2002 and 2003. As for any appraisal, it would be desirable for it to be conducted by an independent team so as to ensure objectivity. 6.3.1 Preparation of the Program for 2006–10 Following the appraisal, and beginning in 2004, it will be necessary to prepare the Program for the Second Period (2006–10) on the basis of:
• lessons learned in the appraisal; • developments and possible changes nationally, regionally, and globally; • the increase in national resources thanks to oil revenues (and the application of the law
mandating that 80 percent thereof be used for the sectors essential to poverty reduction), as well as the impact of the HIPC Initiative and the improvements in the public expenditure management system recommended by the World Bank;
• progress and requirements as regards capacity building and good governance; • the effective strengthening of the partnership between government, members of
Parliament, and civil society, as well as the coordination of external assistance. 6.3.2 Updating The PRSP was prepared on the basis of partial and relatively outdated quantitative data. It will be updated annually in order to reflect the availability of the data emerging from the various surveys programmed by the national statistical system. This updating will also relate to reframing the objectives in light of the results obtained. 6.4.Institutional framework The institutional framework to be established for monitoring and evaluation purposes will be based to the greatest extent possible on existing structures. Accordingly, the institutional framework for the PRSP provides for:
• a High Interministerial Committee for PRSP Supervision; • a Government/Donors Committee; • a Steering Committee; • sectoral units; and • departmental and subprefectural committees.
6.4.1. The High Interministerial Committee for PRSP Supervision; The High Interministerial Committee for PRSP Supervision (HCI) is responsible for supervising the PRSP. It comprises members of the government and is chaired by the Prime Minister. Its mission is to ensure the observance of the policy guidelines for the program and to provide new orientations in response to the results obtained during the period. It meets once each half-year to monitor SNRP developments reported by the Steering Committee.
92
6.4.2. The Government/Donors Committee This structure is made up of members of the government and bilateral or multilateral donors and lenders. It is chaired by the Minister of Planning, Development, and Cooperation. It meets once each quarter to evaluate the performance of the activities carried out to reduce poverty, on the basis of the progress report prepared by the PRSP Steering Committee, and if need be to resolve any problems associated with the financing of these activities.
6.4.3. The Steering Committee The PRSP Steering Committee is tasked with producing the PRSP and ensuring the monitoring and evaluation of its implementation. It comprises representatives of the various ministries, the National Assembly, and nongovernmental stakeholders. The Steering Committee is placed under the supervision of the Minister of Planning, Development, and Cooperation (Decree No. 331 of July 26, 2002). It has a Permanent Secretariat staffed by one Coordinator and six experts. The Permanent Secretariat is the Steering Committee's technical organ. Given that implementation will be carried out sector by sector, the Steering Committee will work in close cooperation with the sectoral monitoring units in order to ensure better coordination. In addition, based on the quarterly reports of the sectoral units, the results of qualitative field surveys conducted by ad hoc groups, and the general data produced by the national statistical system, the Steering Committee proposes corrective measures to the HCI with a view to overcoming any deviations and weaknesses identified. There is no direct hierarchical connection between the Steering Committee and the sectoral monitoring units. This said, there are less formal interconnections between these structures. The Steering Committee will prepare a communication strategy that will allow it to broadly disseminate information on the implementation and monitoring of the PRSP, making use of media such as radio communiqués, including on rural stations, as well as newspapers, the Internet, etc. Annual evaluation forums with participation by the various stakeholders, including associations of the poor and development partners, are also planned.
6.4.4. Sectoral monitoring and evaluation units As part of the sectoral meetings associated with the Geneva IV Roundtable, monitoring units have been created in the priority sectors. Such structures may be created within ministries, and their mission will be enhanced by adding the “poverty reduction” aspect. Accordingly, their mission will be to ensure the relevance of PRSP activities in their respective sector, the proper execution of these activities in the field, the availability of the budget allocated to the sector, and its conformity with poverty reduction objectives. Each unit will provide guidelines on the utilization of that budget.

93
The units will submit quarterly reports to the relevant minister and the Steering Committee, clearly indicating the obstacles encountered and proposing appropriate solutions.
6.4.5. Regional, Departmental, and subprefectural units The mission of these local structures, composed similarly to the Steering Committee, is to monitor the implementation of the PRSP at the level of each region. They prepare quarterly progress reports on the implementation status of the various actions called for in the strategy. These reports are forwarded to the Steering Committee In the future, this monitoring arrangement will be extended to the canton and village levels in order to ensure that beneficiaries of the strategy are more thoroughly involved in its monitoring and evaluation. This will require strengthening the capacities of the people in these decentralized localities.

93
Annex 1: Matrix of Priority Actions of Phase I of the PRSP
Focus/Objective Actions Timetable Responsible parties Monitoring indicators Partners I. Promotion of good governance
A. Make public administration effective and efficient
Continuation of civil service reform
Perform organizational and staffing audits of the priority ministries
2003 CESRAP Number of priority ministries audited IDA
Audit other ministries 2004 CESRAP Number of other ministries audited Apply audit results 2003–04 CESRAP Number of measures taken and applied Introduce an employment regime compatible with the
PRSP 2003–05 CESRAP Law instituting employment framework enters into
force
Apply the principle of merit-based promotion 2003 CESRAP Law establishing merit-based promotion enters into force
Apply the system for motivating government employees, in particular in priority sectors
2003–05 CESRAP Revision of wage scale for education, health, and other sectors
Strengthening of capacity building of stakeholders in public sector, private sector, and civil society
Strengthened institutional capacities of the ministries involved in implementing reforms as well as other ministries
2003–05 SENAREC and ministries
Number of ministries whose new organization charts have been adopted and implemented
IDA
Enhancing the professional qualifications of civil service, private sector, and civil society employees
2003–05 SENAREC and ministries
Initial and in-service training programs for government employees defined and implemented
Introduce a manual of procedures for public expenditure execution
2003 MEF Manual prepared and disseminated in ministries
Build capacities of Inspectorate General of Finance and Audit Office
2003–05 Office of the Prime Minister, MEF, SENAREC
Number of personnel trained and provided with adequate working tools
Fight against corruption Create and make operational a structure for investigating corruption cases
2003–05 Office of the Prime Minister, MJ
Number of corruption cases investigated
Introduce a manual of procedures for public expenditure execution
2003 MEF Manual prepared and disseminated in ministries
Build capacities of Inspectorate Generale of Finance and Audit Office
2003–05 Office of the Prime Minister, MEF, SENAREC
Annual publication of a report from the IGF and a report from the Audit Office
Create and make operational a structure for investigating corruption cases
2003–05 Office of the Prime Minister
Functional anticorruption structure
Have ethics codes drawn up by profession or by sector 2003–05 Office of the Prime Minister
Codes prepared and disseminated for sensitive sectors

94
Focus/Objective Actions Timetable Responsible parties Monitoring indicators Partners B. Improve legal environment Credibility of court apparatus Conduct an expenditure review of the justice sector 2003 Ministry of Justice Report on the review of justice sector expenditure
available IDA
In a participatory manner, prepare a justice sector program (after States General)
2003–04 Ministry of Justice Sectoral program adopted
Initiate the implementation of the justice sector program 2003–05 Ministry of Justice Seminar on program launch Guarantee personal and property security
Outreach to the people and to the forces of order on the fundamental principles of human rights
2003 Ministries of Defense and Security, HCND, human rights associations
Frequency of and support provided for outreach campaigns
Carry out the program to disarm the civilian population 2003 Ministries of Defense and Security
Number of disarmament campaigns organized and of cities disarmed
UNDP
Implement the National Strategic Plan for Combating Mines and Unexploded Ordnance
2003–05 MPDC, HCND Land areas (km2) demined and cleared of ordnance
Germany, Canada, Italy, Japan, UNDP, Switzerland, UK, USA
Strictly apply the regulations on bearing arms 2003–05 Ministry of Territorial Administration
Amount of illegally borne arms recovered
Introduce a code of conduct for mediating conflicts between farmers and livestock breeders
2003–05 Ministry of Territorial Administration, Mediation Office, human rights associations
Code developed and disseminated among traditional chiefs
Make the national army more professional and transform it into a development army
Continue implementing the demobilization and re-employment policy
2003–05 Ministry of Defense, MPDC
Number of soldiers demobilized and number of soldiers re-employed
Complete decentralization and deconcentration
Build the human and institutional capacities of the units responsible for decentralization and deconcentration
2004–06 Office of the Prime Minister, Ministry of Decentralization (MD)
Prepare a master plan for decentralization 2004–06 Office of the Prime Minister, MD
Prepare and adopt implementing provisions for the previously validated draft law
2004–06 Office of the Prime Minister, MD
Draft and finalize the various legislative and regulatory provisions giving financial autonomy to local governments
2004–06 Office of the Prime Minister, MD
Provide personnel training and in-service training for 2004–06 Office of the Prime

95
Focus/Objective Actions Timetable Responsible parties Monitoring indicators Partners elected officials Minister, MD

96
Focus/Objective Actions Timetable Responsible parties Monitoring indicators Partners II. Ensure strong and sustainable growth A. Stabilize the macroeconomic framework
Sustainably increase the growth rate of real GDP
Implement the agreed institutional and structural reforms (PRGF, CAS, etc.)
2003–05 Government Observe implementation timetables
Increase public investment in infrastructure and in training of human capital
2003–05 MEF, MPDC
Level of domestic resources allocated to investment and to social sectors
Fiscal policies favorable to the poor
Increase the revenue level by improvement the efficiency of the assessment, settlement, and collection units
2003–05 MEF Tax revenue/GDP ratio of …
Conduct review of public expenditure in the priority sectors
2003 MEF, sectoral ministries, CP(Steering Committee)/PRSP
Broaden public expenditure review to the other sectors 2004–05 MEF, sectoral ministries, CP/PRSP
Build on program budgeting experiment in priority sectors
2003–04: Education, Health, Infrastructure, Rural development
MEF, sectoral ministries, CP/PRSP
Integration of program budgets into Budget Law
Generalize program budgets through Medium-Term Expenditure Framework (MTEF)
2005–08 MEF sectoral ministries, CP/PRSP
Draft budget law prepared in accordance with MTEF recommendations (in particular, allocation of resources in light of sectoral priorities)
Effectively apply the oil revenue management law (LGRP)
2004–15 MEF, CCSRP, CP/PRSP, Parliament, Audit Chamber
Increased budget allocations for priority sectors in keeping with LGRP: Education, 20% Health and Social Affairs, 20% Rural Development (agriculture and livestock), 12% Infrastructure, 12% Environment and Water, 10%
Introduce a mechanism for the computerized monitoring and evaluation of the use of oil revenues
2003 MEF, CCSRP
Mechanism discussed with spending and functional ministries
Introduce a mechanism for the computerized monitoring 2003 MEF, Mechanism discussed with spending and

97
Focus/Objective Actions Timetable Responsible parties Monitoring indicators Partners and evaluation of HIPC resources CCSRP, CP/PRSP, functional ministries
Eliminate domestic debt arrears 2003–05 MEF, CNRT
Pensions regularly paid to retirees, Debts to suppliers paid in their entirety
African economic integration and integration into world economy
Participate in advancing African economic integration, in particular within the framework of CEMAC and NEPAD
2003–05 Office of the Prime Minister, MEF Ministry of Foreign Affairs and African Integration
Application at the national level of the directives negotiated within the economic integration structures
Conduct a balance of payments policy compatible with preserving the economy's competitiveness
2003–05 MEF, MPDC, sectoral ministries
Increase in non-oil exports, Improvement in balance of payments
B. Promote the private sector Promotion of and support for enterprise creation
Create a one-stop shop and locate it at the CCIAMA 2003–05 CCIAMA, MEF, MICA
Create a guarantee fund 2003–05 CCIAMA, Banks
Improve relations between enterprises and the public administration
Create commercial tribunals 2003–05 Ministry of Justice Number of commercial tribunals created and in operation
Development of financial sector and microfinance
Extend banking and insurance network throughout the national territory
2003–05 MEF, BEAC Banks and financial institutions, Association of Banking Professionals
Number of banking and insurance agencies created
Improve access to microfinance
Increase number of microfinance structures 2003–05 MEF, MICA, CELIAF REPAFEM
Number of microfinance structures created
Diversify banking and insurance products and services 2003–05 MEF, BEAC Banks and financial institutions, Association of Banking Professionals
Number of new products created
Export promotion Prepare and implement the integrated trade framework paper
2003–05 MICA, MEF, CCIAMA, Economic promoters
Framework paper adopted and implemented
C. Develop basic infrastructure Strengthening of institutional, technical, and human capacities
Send to refresher courses and train an adequate number of supervisors, engineers, and other technicians involved in basic infrastructure planning and management
2003–05 Sectoral ministries concerned
Number of supervisors, engineers, and other technicians reassigned or trained
Establishment of a basic grid of roads for domestic and external access to isolated areas that are usable in all seasons
Complete the ongoing rehabilitation and construction of the roads for domestic and external access to isolated areas: Kélo-Moundou, Moundou-Bolarobou (Chad-Cameroon border), Massaguet-Ngoura
2002–04 MTPT
Length of roads refurbished Length of roads paved for accessing remote areas

98
Focus/Objective Actions Timetable Responsible parties Monitoring indicators Partners Finalize the studies and let contracts by 2005 for
paving of Ngoura-Bokoro, Bokoro-Mongo, Mongo-Abéché, Abéché-Adré-Sudan border, Moundou-Doba, Doba-Sarh, and Massaguet-Massakory roads
2003–05 MTPT
Effective startup of construction on roads mentioned
Continued rehabilitation of dirt roads in permanent national network
2003–05 MTPT FER
Introduce a program for the rehabilitation and development of the rural road network
2003–05 MTPT, decentralized territorial governments
National rural transportation strategy adopted Program for completing rural roads adopted
Maintenance of transportation infrastructure
Consolidate financial resources of the Road Maintenance Fund (FER) and build its capacities for programming maintenance work
2003–05 MTP, MEF, FER Linear length of national roads in good condition, Resources devoted to road maintenance
Create a Road Maintenance Agency 2005 MTPT Agency created and operational Improvement of road security Prepare and implement a passenger and goods
transportation code MTPT
Outreach to the people (IEC on prevention) regarding road security
MTPT, Ministry of the Interior
Support for the development of local transport modalities
Implement the rural transportation strategy 2004–05 MTPT, Ministry of Agriculture
Effective implementation of the rural transportation strategy
Improved access to water in rural areas
Build or rehabilitate 800 tube wells and 50 large diameter wells per year
2003–05 Ministry of Environment and Water (MEE)
Number of tube wells and wells built or rehabilitated
Make the population accountable for managing water access points
2003–15 MEE Percentage of villages with a water access point management committee
Sanitation of major urban centers
Provide urban centers (N’djamena, Sarh, Apache, Moundou, Kilo, Koura, Pale, Mao) with integrated system for production of safe drinking water and sanitation
2003–05 Ministry of Territorial Development, Urban Planning, and Housing, MEE, Mayors’ offices, Sanitation Committee, NGOs
Create sewer and drainage systems (VRDs) Evacuate household trash, industrial and commercial waste, and human waste
2003–05 MATUH , MEE, MD MAT
VRDs created in major urban centers Household trash Industrial and commercial waste Waste water and human waste evacuated and recycled
Energy Perform a stock-taking of the regional solar energy program with a view to optimizing its contribution to a national program on new and renewable energy sources
2003–05 Ministry of Mining and Energy (MMED), STEE
Stock-taking of solar energy program available National program on new and renewable energy sources adopted
Implement the emergency program of the water and

99
Focus/Objective Actions Timetable Responsible parties Monitoring indicators Partners electrrcity company (STEE)
Post and telecommunications Continue deregulating the value-added services subsector (mobile telephony, data transmission, internet access)
2003–05 MPT Deregulated access to value-added services
Develop and implement a pilot rural telephony project SOTEL Chad, mobile telephony companies
Project designed and implemented
Make postal and financial services autonomous 2003–05 MPT Autonomous postal and financial services Improved administrative and financial management of basic infrastructure
Select a strategic partner for the development of each basic infrastructure subsector (Chad airports management, energy, posts, telecommunications)
2003–04 Competent ministries, units responsible for privatization
Strategic partners selected for each subsector
Place the development of each basic infrastructure subsector under the supervision of an autonomous regulatory institution
2003–04 Office of the Prime Minister, competent ministries
Regulatory institution in place
Reach agreement with strategic partner, under the supervision of the regulatory institution, on specifications which incorporate the definition of universal service
2005 Office of the Prime Minister, competent ministries, regulatory institutions, strategic partners
For each subsector: universal service defined, specifications adopted
D. Sustainably increase rural production Carry out the agricultural water supply and pastoral water supply components of the master plan for water
2004–06 MEE, MA Decentralized territorial governments
Agricultural water supply improvements available Increased investment in agricultural and pastoral water supply improvements
Carry out other agricultural water supply and pastoral improvements
2004–06 MA Land areas improved
Extended access to high quality agricultural materials and inputs
Extension work on composting techniques
2003–05 MA MFE
Programs defined and disseminated, compost available
UNDP, FAO AFD, EU, UNICEF ADB, Saudi Arabia
Locally produce agricultural materials and inputs 2003–05 MA, MICA Quantity of material and inputs produced Increase agricultural equipment coverage ratio and the
level of agricultural input use
Extend access to high quality support services for farmers and livestock breeders
Deconcentrate support structures toward agricultural and pastoral areas
2004–05 Office of the Prime Minister MA, ME MEF, human rights associations
Number of deconcentrated support structures in agricultural and pastoral areas
Create storage structures 2003–05 MA Community silos, warehouses, granaries Introduce a rural communication system 2003–05 MC Rural radio, small farmer letters Extend access to credit and appropriate financial services
Create and install credit and financial services structures
2003–15 MFE BEAC
Number of structures created and installed in urban and rural areas

100
Focus/Objective Actions Timetable Responsible parties Monitoring indicators Partners Other banks MFIs, CELIAF
Diversify agricultural production
Introduce new plant and animal species 2003–05 MA Number of new subsectors
Improved functioning of distribution channels and markets for major products
Strengthen capacities of rural producers 2003–05 MA, ME MEE, ONDR COTONTCHAD
AFD, FAO ADB, Others to be identified
Strengthen support services for agricultural sector 2003–05 MA Develop emerging subsectors Complete the reform of the cotton subsector 2003 MCIA
COTONTCHAD Reform completed
Rehabilitate and continue support for rice subsector 2004–06 MA Initiate studies with a view to identifying promising
subsectors 2003–05 MA, MEE, MICA, Number of studies conducted
Continue support for gum arabic subsector 2003–05 MEE AFD Develop short-cycle livestock rearing 2003–05 Ministry of Livestock
Combat major migrating pests 2004–06 MA Protect plant health Combat endemic pests (rodents and grasshoppers) 2004–06 MA
III. Develop human capital A. Introduce an adequate health system Access to high quality health services throughout the territory
Build or rehabilitate and equip 50 health centers, 5 district hospitals or prefecture hospitals, and 15 district offices
2003–05 MSP Good quality health services available
Provide training to health officers and 600 COSANs/COGES for 600 health centers in community participation and the management of health services
2003–05 MSP Number of health centers having received community participation training
Make 10 district hospitals or prefecture hospitals autonomous
2003–05 MSP Number of autonomous health centers with the technical support and resources they need
Improve health sector indicators
Encourage the creation of health mutual associations among less advantaged population groups
2002–05 MSP Number of health mutual associations created
Strengthen the protection of children and pregnant women against diseases preventable by vaccination and against malnutrition
2003–05 MSP Increase of 20 percentage points in rate of anti-antigen vaccination coverage
Strengthen the system for monitoring and early warning against endemic diseases (polio, neonatal tetanus, measles) or potentially epidemic diseases (cholera, meningitis, tuberculosis)
2002–05 MSP Number of outreach campaigns carried out in high-risk zones
Equip 600 health centers with equipment for monitoring pregnancies and childbirth
2003–05 MSP Number of health centers equipped, pregnancies monitored, and childbirths attended
Ensure postnatal consultation in all health centers and 2003–05 MSP Number of postnatal consultations by health

101
Focus/Objective Actions Timetable Responsible parties Monitoring indicators Partners all maternity clinics structures
Equip 25 district hospitals or prefectural hospitals for obstetric emergencies
2003–05 MSP Number of district or prefectural hospitals equipped
Assign one surgeon, one anesthetist, and one midwife per district or prefectural hospital
2003–05 MSP Number of district or prefectural hospitals suitably staffed by qualified personnel
Introduce programs for spacing births at 600 health centers and 25 hospitals
2003–05 MSP Contraceptive usage ratio
Improved utilization of resources allocated to health sector
Strengthen the capacities of management bodies in 43 districts
2003–05 MSP, MFE, CCSRP
Number of management bodies receiving training
Develop a three-year action plan for the development of health districts
2003–05 MSP Action plan available
Provide supervision and monitoring of 43 health districts
2003–05 MSP Number of districts regularly monitored
Fight against HIV/AIDS Continue and broaden programs for early detection, prevention (particularly among those age 15 to 49, pregnant women, or seropositive women), and treatment
2003–05 Ministry of Public Health, Ministry of Social Action and the Family, PNLS, PPLS, CELIAF human rights associations
Rate of introduction of AIDS units in health facilities Annual number of condoms distributed and annual number of outreach campaigns
Fight against malaria Continue and broaden prevention and treatment programs
2005–05 MSP Use of treated mosquito netting Number of health structures with malaria units
Fight against malnutrition Continue and extend programs to provide micronutrient supplements, promote breast-feeding, and promote healthy foods
2003–05 MSP Rate of use of iodized salt Number of breast-feeding outreach campaigns
B. Ensure appropriate development of the education sector Promote equity in access to education and primary school attendance
Build 3,772 classrooms, rehabilitate 3,000, and equip all of them in the target zones, in particular in the disadvantaged rural areas
2002/3–05/6 MEN PTA
Number of students per classroom Proportion of qualified instructional staff Proportion of community teachers
Train at least 7,000 community teachers on the instructional staff
2002/3–05/6 MEN PTA
Number of community teachers trained
Reduce by 15 percentage points the gap in school access between girls and boys
2002/3–05/6 MEN PTA
Gaps between school access by girls and boys in each region
Improved effectiveness and quality of the educational system
Create a National Curriculum Center responsible for developing education programs that are specifically Chadian and bilingual, as well as special curricula for experimental programs
2002/3–05/6 MEN PTA
National Curriculum Center functional in 2002/03 Experimentation with new programs beginning in 2005/6
Make new textbooks for reading, mathematics, and science available in the primary and secondary schools
2002/3–05/6 MEN PTA
One reading text, one mathematics text, and one science text per student in primary school One book in each subject for every three students in midsecondary

102
Focus/Objective Actions Timetable Responsible parties Monitoring indicators Partners Provide initial training for 2,000 community teachers in
normal schools (ENIs), 6,400 teachers, 480 teacher trainers, and supervisory personnel
2002/3–05/6 MEN PTA
Number of teachers, trainers, community teachers, and supervisory personnel trained
Strengthened capacities for planning, managing, and steering the development of the educational system
Develop and implement procedures manuals on planning, management, evaluation, and monitoring the performance of the educational system
2002/3–05/6 MEN PTA
Procedures manual applied
Train at least 2,000 managers at the National Education Ministry and provide 30 high-level supervisors with long-term training
2002/3–05/6 MEN PTA
Number of managers trained Number of high-level supervisors trained
Make 29 departmental delegations in national education (DDENs) operational in the areas of management, administration, and planning
2003 MEN PTA
Number of DDENS operational in the areas of management, administration, and planning
Introduce a permanent mechanism for the annual review of expenditure and the preparation of a medium-term program budget
2003 MEN PTA
Mechanism operational
C. Labor market Special actions to adapt the profile of graduates to the needs of the labor market
Increase technical education and professional training (ETFP) capacities in the areas of greatest relevance, using trained and properly equipped instructors
2005–06 MEN PTA
Number of students able to receive ETFP
Increase the basic knowledge of 15,000 youths aged 8 to 14 by means of EBNF
2005–06 MEN PTA
Number of youths aged 8 to 14 enrolled in EBNF
Provide literacy training to at least 50,000 persons age 15 to 50, of whom 60 percent are women
2002/3–05/6 MEN ? PTA
Number of literacy training recipients Number of female literacy training recipients
Experiment with bilingual curricula in CP classes 2005/6 MEN, PTA Experiments with bilingual curricula conducted Study supply of and demand for trades and labor 2003–05 Ministry of Civil
Service Study report
Prepare and implement a professional training strategy 2003–05 Ministry of Civil Service, MEN, private sector
Strategy adopted
IV. Improve living conditions of vulnerable groups Integrated urban development
Develop urban infrastructure and services 2003–05 MAT, MTPT Develop and implement territorial development plans
and urban development plans 2003–05 MAT Plans developed and implemented
Support for microenterprise, SMEs, and employment
Support for the management and emergence of professional service providers
2003–05 MEF, MCIA Number of professionals
Resume ATETIP activities 2003–05 MPDC

103
Focus/Objective Actions Timetable Responsible parties Monitoring indicators Partners Rehabilitate the technical training and apprenticeship
centers 2003–05 MEN, MFPTME Number of centers rehabilitated
Create an economic and technological documentation and information center
2004–05 MEF, MCIA Center in operation
Outreach educational programs to promote the entrepreneurial culture
2003–05 MCIA, CCIAMA
Enhanced concertation and coordination of support activities at MEE
2003 MEF, MCIA
Social protection Conduct IEC campaigns on the key steps involved in risk prevention
2003–05 MC, MASF Number of campaigns conducted
Revise family law and land tenure law 2003–05 MASF, MJ Revision of rights
Adapt the social security and retirement pensions systems
2003–05 MFPTME, MEF Social security and retirement pensions systems adapted
Support existing informal mechanisms for crisis response
2003–05
Guarantee government assistance in the event of major catastrophes
2003–05 MEF
V. Restore and safeguard ecosystems Strengthen the regulatory framework and management capacities for natural resources Promulgate legal provisions transferring certain natural
resource management prerogatives to users 2003–05 MEE Legislative and regulatory texts adopted and entered
into force
Introduce local natural resource management committees
2003–05 MEE Number of committees, groups, and associations created
Strengthen the capacities of the institutions responsible for managing natural resources
2003–05 MEE Number of supervisors and employees trained, resources allocated, number of groups and associations trained
Introduce an environmental information system
2003–05 MEE Environmental database available
Develop a national program for mobilizing the people on environmental issues
2003–05 MEE
Improved management of household energy sources
Promote viable firewood production in the rural areas surrounding the major cities
2003–05 MEE, Ministry of Agriculture
Land area devoted to firewood production
Make forest exploitation an income source for rural populations
2003–05 MEE, Ministry of Agriculture
Ensure that rural populations are more involved in natural resource management
2003–05 MEE, Ministry of Agriculture
Legal provisions on monitoring forest lands developed for the local groups
Ensure that the tax system applicable to wood and wood derivative products has a regulatory role
2003–05 MEE
Promote furnaces and other high performance 2003–05 MEE Outreach regarding furnaces and other instruments

104
Focus/Objective Actions Timetable Responsible parties Monitoring indicators Partners instruments for producing household energy
VI. Ensure the monitoring and periodic evaluation of PRSP implementation A. Monitoring and evaluation role Assess the extent to which PRSP objectives are achieved
Conduct quantitative and qualitative surveys 2003–05 INSEED, national statistical system, Steering Committee
Survey and appraisal reports
Update the PRSP 2005 Steering Committee Updated PRSP B. Institutional framework for monitoring and evaluation Role of non-state organizations
Participate in PRSP implementation monitoring and evaluation mechanisms
2003–05 Civil society Number of poverty reduction activities approved by civil society
Role of decentralization Make decentralized local government accountable by granting them financial autonomy and ensuring the democratic election of their leaders
2003–04 MAT and Office of the Prime Minister
Number of decentralized territorial governments with autonomous budgets and democratically elected leaders
Strengthen the role of local assemblies for the self-promotion of decentralized territorial governments and peoples
Office of the Prime Minister MAT
Local assemblies with decision-making authority
Reintroduce specifications for municipal activities (infrastructure and common equipment efforts)
2003–05 Office of the Prime Minister MAT
Municipal specifications available
Permit decentralized cooperation between local municipalities and foreign municipalities (twin cities programs)
2003–05 Office of the Prime Minister MAT
Number of agreements signed for cooperation between local municipalities and foreign municipalities
Protection of HIPC resources and oil revenues against corruption
Revise Law No. 001/PR on the management of oil revenues to include HIPC Initiative resources Control and monitor the use of HIPC Initiative resources and oil revenues
2003–05 MFE, CCSRP, Audit Chamber, Supreme Court, Parliament
Law amended Audit missions and sessions carried out
Resource allocation mechanisms
Prepare resource allocation ceilings annually 2003–05 Office of the Prime Minister, MFE
Ceiling on resources available annually
C. Dissemination of monitoring and evaluation results Disseminate monitoring and evaluation reports
Use the media 2003–05 CP/PRSP MC Private sector press
Frequency of radio and television broadcasts Number of newspaper articles
Create a website 2003–05 CP/PRSP Website created and operational
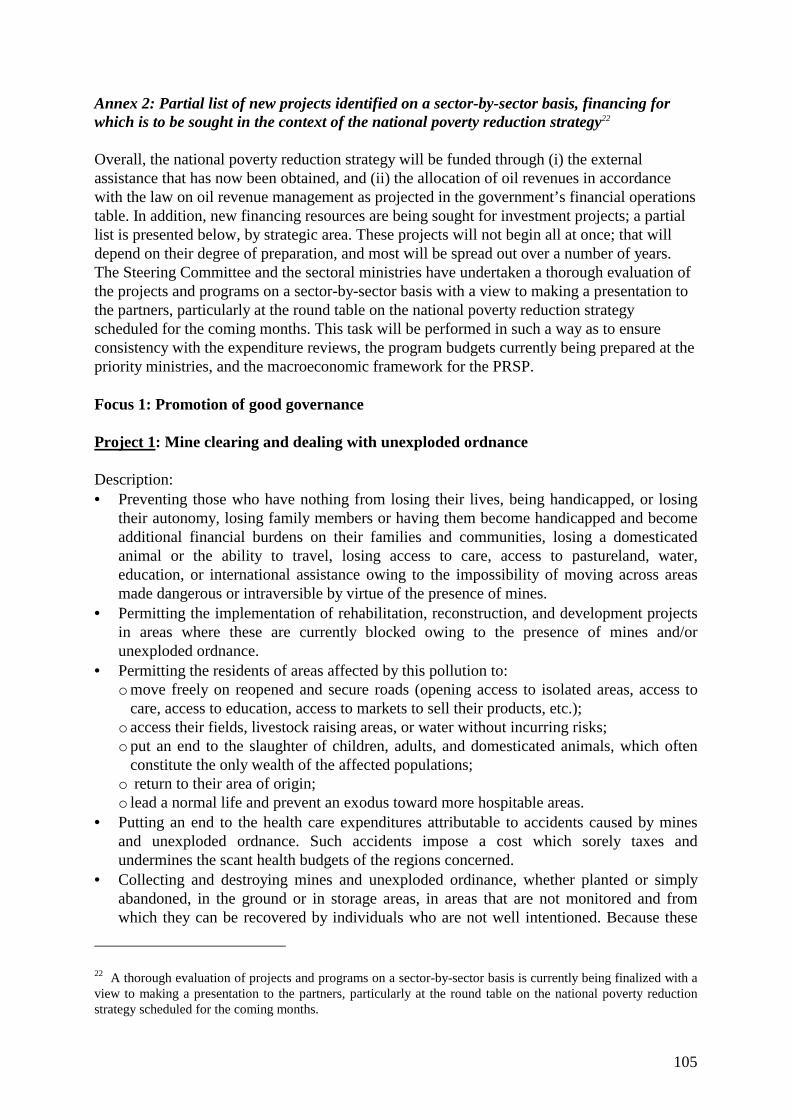
105
Annex 2: Partial list of new projects identified on a sector-by-sector basis, financing for which is to be sought in the context of the national poverty reduction strategy22 Overall, the national poverty reduction strategy will be funded through (i) the external assistance that has now been obtained, and (ii) the allocation of oil revenues in accordance with the law on oil revenue management as projected in the government’s financial operations table. In addition, new financing resources are being sought for investment projects; a partial list is presented below, by strategic area. These projects will not begin all at once; that will depend on their degree of preparation, and most will be spread out over a number of years. The Steering Committee and the sectoral ministries have undertaken a thorough evaluation of the projects and programs on a sector-by-sector basis with a view to making a presentation to the partners, particularly at the round table on the national poverty reduction strategy scheduled for the coming months. This task will be performed in such a way as to ensure consistency with the expenditure reviews, the program budgets currently being prepared at the priority ministries, and the macroeconomic framework for the PRSP. Focus 1: Promotion of good governance Project 1: Mine clearing and dealing with unexploded ordnance Description: • Preventing those who have nothing from losing their lives, being handicapped, or losing
their autonomy, losing family members or having them become handicapped and become additional financial burdens on their families and communities, losing a domesticated animal or the ability to travel, losing access to care, access to pastureland, water, education, or international assistance owing to the impossibility of moving across areas made dangerous or intraversible by virtue of the presence of mines.
• Permitting the implementation of rehabilitation, reconstruction, and development projects in areas where these are currently blocked owing to the presence of mines and/or unexploded ordnance.
• Permitting the residents of areas affected by this pollution to: o move freely on reopened and secure roads (opening access to isolated areas, access to
care, access to education, access to markets to sell their products, etc.); o access their fields, livestock raising areas, or water without incurring risks; o put an end to the slaughter of children, adults, and domesticated animals, which often
constitute the only wealth of the affected populations; o return to their area of origin; o lead a normal life and prevent an exodus toward more hospitable areas.
• Putting an end to the health care expenditures attributable to accidents caused by mines and unexploded ordnance. Such accidents impose a cost which sorely taxes and undermines the scant health budgets of the regions concerned.
• Collecting and destroying mines and unexploded ordinance, whether planted or simply abandoned, in the ground or in storage areas, in areas that are not monitored and from which they can be recovered by individuals who are not well intentioned. Because these
22 A thorough evaluation of projects and programs on a sector-by-sector basis is currently being finalized with a view to making a presentation to the partners, particularly at the round table on the national poverty reduction strategy scheduled for the coming months.

106
mines and ordnance, simply by being where they are, contribute to a worsened climate of insecurity in the affected regions, their destruction will contribute to reducing the lack of security and consolidating peace.
Duration: 14 years Project cost: CFAF 57,724,000,000 Project 2: Demobilization and reinsertion Description: Reinsertion of 4,000 demobilized military personnel per year Duration: 5 years Project cost: CFAF 15,000,000,000 Project 3: Collecting light weapons and enhancing the security of the Chadian people. Description:
• Promoting a culture of peace and non-violence; • Strengthening the government’s capacity to meet the challenge posed by
the proliferation of small arms and light weapons. Duration: 2 years. Cost of the project: CFAF 162,400,000. Focus 2: Ensure strong and sustainable growth Develop basic infrastructure Project 4: Road paving, maintenance, and feasibility studies Description:
• Pave 314 kilometers of national roads • Periodically maintain 940 kilometers of dirt roads • Build five civil engineering works (bridges) • Conduct technical and feasibility studies for 791 kilometers of roads • Air transport (construction of northern parking lot and BRETELLE, study of southern
parking lot, study of light plane parking area, and study of ICAO standards conformance for Faya, Moundou, Sarh, and Abéché).
Duration: 3 years Program cost: CFAF 101,320,000,000 Sustainably increase rural production Project 5: Surveillance and preventive fight against crop pests Description:

107
• Contribution to increased agricultural productivity through the reduction of losses induced by pests;
• Decrease in economic and environmental impact of damage attributable to invasions of migrant pilgrim locusts;
• Reduction of recrudescence risk; • Improved organization of the effort thanks to early warning and bio-ecological
knowledge of major migrant pests; • Creation of a national unit to combat migratory birds, based in N’Djaména and
working in close collaboration with the phytosanitary bases affected by these pests, namely small farmers, projects, agencies, development companies, and NGOs.
Duration: 5 years Project cost: CFAF 3,101,000,000 Project 6: Small farmer support with agricultural equipment and inputs Description:
• Creation of a center for the large-scale production of previously tested light materials • Provision of agricultural equipment to small farmers on credit • Ensuring food self-sufficiency • Increasing crop yield and income per unit of surface area • Training small farmers in the upkeep, repair, and maintenance of their agricultural
equipment Duration: 6 years Project cost: CFAF 35,827,317,600 Project 7: Seeds Description:
• Introduction of the structures, infrastructure, and equipment necessary to ensure the gradual and sustainable development of seed production for the major crops
• Enhanced human, material, and technical resources of the seed production centers • Introduction of a central structure for leadership, coordination, programming, and
quality control of seed • Initial and in-service training of staff, both in the seed production area and in the
promotion of improved seed usage. Duration: 5 years Project cost: CFAF 4,000,000,000 Project 8: Rehabilitation and organizational support for Nya irrigated rice Casier C Description:
• Rehabilitation of water supply infrastructure • Organizing producers to improve management of the casier • Support for rice farmers in structuring the subsector.

108
Duration: 5 years Project cost: CFAF 1,290,000,000 Project 9: Rural development of Kanem Description:
• Support for promoting the rural environment • Establishment of the Kanem Development Fund • Grassroots financial services • Coordination and project management.
Duration: 9 years Project cost: CFAF 10,800,000,000 Project 10: Creation of small irrigated perimeters in the Chari Baguirmi, Moyen Chari, Salamat, Logone Oriental, Tangilet, and Mayo Kebbi regions Description:
• Feasibility study (topographic studies, socioeconomic studies, and studies of improvements necessary to develop perimeters manageable by small farmers)
• Construction of water supply works, connecting roads, and storage warehouses • Support for subsector structuring.
Duration: 3 years Project cost: CFAF 12,775,000,000 Project 11: Construct and equip water collection and storage facilities adapted to the Sahelian zone of the country Description:
• Increase the availability of water in rural areas • Ensure the sustainable operation of water supply works.
Duration: 5 years Project cost: CFAF 3,250,000,000 Project 12: Development of 14 ponds in the Departments of Batha Ouest and Dababa Description:
• Provide affected populations with ample water for livestock and humans • Improvement of animal health • Permit persons living nearby to engage in small-scale agricultural activities around the
ponds. Duration: 3 years Project cost: CFAF 1,215,306,300 Project 13: Extension and advisory services in rural areas

109
Description: • Improvement of extension services • Enhanced professionalism in agriculture • Support for research and development • Support for professional agricultural organizations • Redeployment and strengthening of structures.
Duration: 5 years Project cost: CFAF 9,950,000,000 Project 14: Strengthening capacities of central and decentralized agricultural services Description:
• Support for capacity building in the design, control, and monitoring of central services • Strengthened capacities in the data gathering, analysis, and dissemination by the
Agricultural Production Directorate • Enhanced capacities for the design and monitoring of the water control policy • Support for the Agricultural Education, Training, and Rural Promotion Directorate in
the design, implementation, and monitoring of training policies and programs • Support for the Plant Protection and Conditioning Directorate • Support for structuring research • Capacity building in the Regional Agricultural Delegations.
Duration: 3 years Project cost: CFAF 8,773,632,510 Project 15: Improved cotton production Description:
• Enhancing the technical knowledge of cotton producers • Availability and accessibility of agricultural inputs and other production factors
important to cotton producers • Enhancing the professionalism of cotton producer organizations.
Duration: 5 years Project cost: CFAF 7,500,000,000 Project 16: Implementation of the village-level water supply component of the master plan for water and sanitation Description:
• Improvement of water supply at the village level • Strengthening of institutional, legislative, and regulatory frameworks, and of national
capacities • Rehabilitation of water supply works
Duration: 20 years Project cost: CFAF 103,043,000,000

110
Project 17: Implementation of the rural sanitation component of the master plan for water and sanitation Description:
• Improvement of basic infrastructures for rural sanitation • Preparation and dissemination of campaigns on sanitation techniques in the village-
level environment and on the interrelationships between water, hygiene, and health • Preparation of guides on sanitation techniques in rural areas • Strengthening national capacities, in particular at the artisanal level.
Duration: 20 years Project cost: CFAF 15,050,000,000 Project 18: Implementation of the agricultural water supply component of the master plan for water and sanitation Description:
• Agricultural water supply improvements, support for small farmer organizations • Enhancing the knowledge base of the sector • Strengthening of institutional, legislative, and regulatory frameworks • Building of national capacities.
Duration: 20 years Project cost: CFAF 410,975,000,000 Project 19: Implementation of the water resources component of the master plan for water and sanitation Description:
• Improved knowledge and monitoring of surface water and its relationship with groundwater
• Improved knowledge and monitoring of surface water • Strengthening of institutional, legislative, and regulatory frameworks, and of national
capacities • Study and implementation of a warning system for accidental oil pollution incidents • Enhanced capacities for monitoring oil production
Duration: 20 years Project cost: CFAF 14,575,000,000 Project 20: Sustainable management of trypanosomiasis (sleeping sickness), gastro-intestinal parasites, and tick-borne diseases in Chad Description:
• Determine the effects of the various livestock-rearing methods on the health and productivity of cattle and camel breeding
• Identify the major vectors of trypanosomiasis and ticks

111
• Identify the major factors responsible for disease transmission in the various agricultural and ecological environments
• Develop less costly systems for disease control and controlling disease vectors which are adaptable to rural communities
• Build national capacities for better adapting such technologies. Duration: 3 years Project cost: CFAF 1,891,750,000 Project 21: Capacity building at the Veterinary Research and Zootechnology Laboratory (LRVZ) Description:
• Rehabilitation of technical buildings • Rehabilitation and revamping of animal space • Upgrading and revamping of autopsy room • Construction of subbranches (4) • Equipping laboratory and subbranches • Construction of conference room • Upgrading staffing, training, and specialization.
Duration: 3 years Project cost: CFAF 1,780,000,000 Project 22: Establishment of a unit responsible for improving the sanitary and hygienic quality of foodstuffs Description:
• Modernization of the legislative framework and regulations applicable to animal health and veterinary public health
• Modernization of the analytical control structure for animal health and foodstuff hygiene
• Upgrading of the skills and capacities of the Ministry of Livestock staff responsible for control inspections of animal food products
• Modernization of production and marketing structures for animal food products • Increase the incomes of Chadian professionals working in the animal food product
processing and marketing sectors • Marketing Chadian products, going to the market with products that meet international
requirements in terms of trade and exchange. Duration: 3 years Project cost: CFAF 729,100,000

112
Project 23: Strengthened live animal health coverage Description:
• Conduct a census and evaluation of the livestock rearing personnel already trained in previous projects
• Identification of new stock farmers to be trained • Initial and in-service training of livestock rearing personnel • Training the trainers • Monitoring of livestock rearing personnel • Technical monitoring of livestock rearing personnel • Technical monitoring of the distribution of veterinary medicines and poultry vaccines • Providing livestock rearing personnel via the distribution networks for veterinary
medicines and poultry vaccines. Duration: 3 years Project cost: CFAF 4,045,000,000 Project 24: Carry out the pastoral water supply component of the master plan for water Description:
• Improvement of knowledge and of databases • Construction of PEPast and enhancing the security of transhumance • Strengthening the institutional, legislative, and regulatory frameworks • National capacity building.
Duration: 20 years Project cost: CFAF 84,115,000,000 Focus 4: Improve household living conditions Integrated urban development Project 25: Carry out the urban water supply component of the master plan for water and sanitation Description:
• Improvement of water supply to sector not currently served • Improvement of knowledge of sector not currently served • Strengthening the institutional, legislative, and regulatory frameworks and national
capacities. Duration: 20 years Project cost: CFAF 113,030,000,000 Focus 5: Restore and safeguard ecosystems Strengthen the regulatory framework and management capacities for natural resources
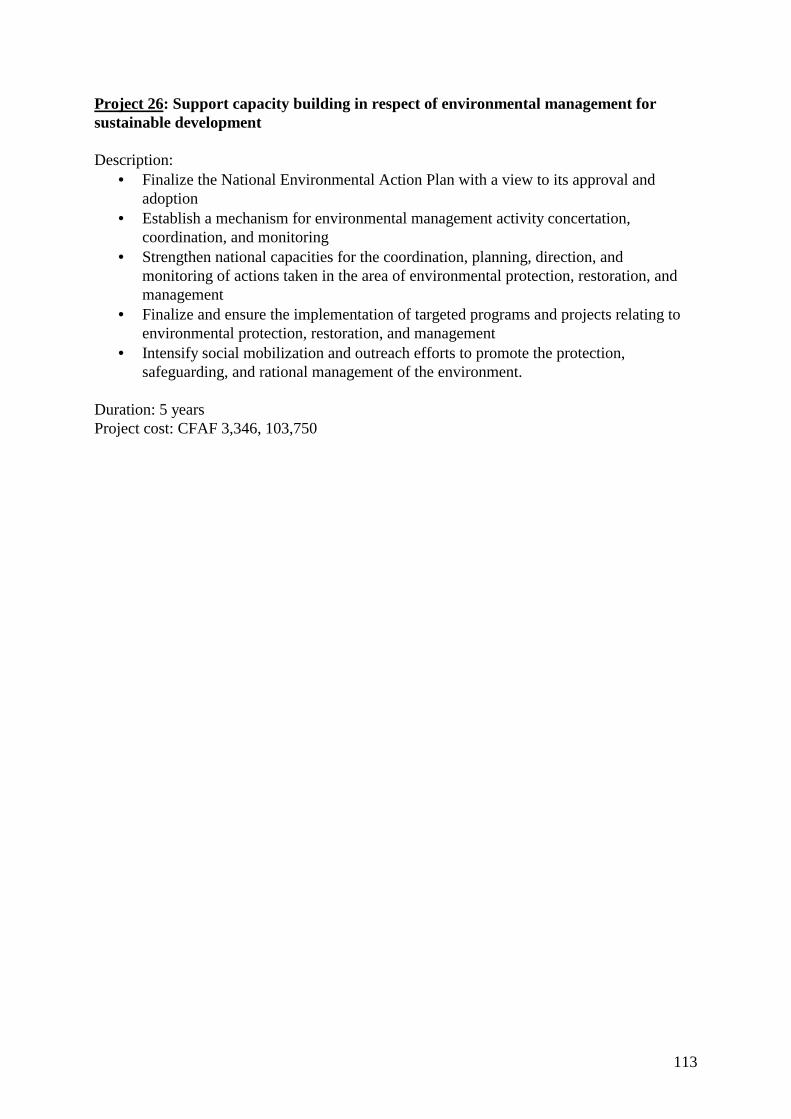
113
Project 26: Support capacity building in respect of environmental management for sustainable development Description:
• Finalize the National Environmental Action Plan with a view to its approval and adoption
• Establish a mechanism for environmental management activity concertation, coordination, and monitoring
• Strengthen national capacities for the coordination, planning, direction, and monitoring of actions taken in the area of environmental protection, restoration, and management
• Finalize and ensure the implementation of targeted programs and projects relating to environmental protection, restoration, and management
• Intensify social mobilization and outreach efforts to promote the protection, safeguarding, and rational management of the environment.
Duration: 5 years Project cost: CFAF 3,346, 103,750

114
Annex 3: Quantitative Poverty Reduction Objectives
Levels reached Indicator Frequency Source entity Disaggregation Production method Year Figure
Objective for 2006
1. Poverty and social inequality HDI Annual UNDP National Study 2000 0.365 0.600 Food poverty threshold (CFAF per capita per day)
Five years INSEED National Survey 1995 194 1$EU
Overall poverty threshold (CFAF per capita per day)
Five years INSEED National Survey 1997 253 1000
Incidence of food poverty Five years INSEED National Survey 1997 41.6% 38% Incidence of overall poverty Five years INSEED National Survey 1997 43.4% 40% Depth of overall poverty Five years INSEED National Survey 1997 27.5 25 Consumption per adult equivalent Five years INSEED National Survey 1995 1,720 2,160 Proportion of population not reaching minimum caloric intake
Five years INSEED National Survey 1995 44.2% 30%
2. Economic and political governance Capital expenditure/total expenditure Annual MEF National Administrative gathering 2001 50% 53% Public investment (excluding Doba project) to GDP ratio
Annual MEF National Administrative gathering 2001 6.5% 17.5%
Rate of growth of domestically-financed investment
Annual MEF National Administrative gathering 2001 0.07% 0.10%
Change in external arrears Annual MEF National Administrative gathering 2001 -2.4 0.0 Share of education expenditure in current budget
Annual MEF National Administrative gathering 2001 13.1% 20%
Share of health expenditure in current budget Annual MEF National Administrative gathering 2001 14.8% 20% Share of military current expenditure in total government budget
Annual MEF National Administrative gathering 2001 8.7% 6.6%
Number of political parties represented in Parliament
Four years National Assembly
National Administrative gathering 2002 15 15
Land area polluted by mines and unexploded ordnance, in km2
Annual HCND National Administrative gathering 2002 1,081 1,00023
23 The conduct of a socioeconomic survey planned for 2003 is expected to increase the land area of Chad regarded as polluted significantly. On the other hand, this figure is expected to be reduced substantially thanks to the conduct of a technical survey covering the entire national territory.

115
Levels reached Indicator Frequency Source entity Disaggregation Production method Year Figure
Objective for 2006
3. Economic growth GDP at constant 1995 prices (in billions of CFA francs), broken down by sector
Annual INSEED National Administrative gathering 2001 907.4 1,870
Rate of growth Annual INSEED National Administrative gathering 2001 8.5% 4.4% Current per capita GDP in CFA francs Annual MEF,
INSEED National Administrative gathering 2001 153,037 352,464
Per capita growth rate Annual INSEED National Administrative gathering 2001 1.2% 4.4% Grain production, in metric tons Annual MA National Survey 2002 1,123,000 1,600,000 Live animal herd Annual ME National Survey Fish production, in metric tons Annual MEE National Survey 2002 144,000 Gum arabic production, in metric tons Annual MEE National Administrative gathering 2002 2,200 Rate of mechanization of farms Annual MMA National Survey/admin. gathering 2000 24% 26% 4. Education, training, and literacy Gross enrollment ratio, primary (boys) Annual MEN National Administrative gathering 1998/1999 80% 90% Gross enrollment ratio, primary (girls) Annual MEN National Administrative gathering 1998/1999 50% 60% Net enrollment ratio, primary (boys)
Annual MEN National Administrative gathering 1999/2000 56.6% 65%
Net enrollment ratio, primary (girls)
Annual MEN National Administrative gathering 1999/2000 42% 50%
Net enrollment ratio, secondary (boys) Annual MEN National Administrative gathering 1998 29% 35% Net enrollment ratio, secondary (girls) Annual MEN National Administrative gathering 1998 3% 5% Literacy ratio of women age 15 to 24 Annual EIMT National Administrative gathering 2001 31% 40% Literacy ratio of men age 15 to 24 Annual EIMT National Administrative gathering 2000 59.4% 70% Adult literacy ratio Annual EIMT National Administrative gathering 1999/2000 25.5% 35% Student/teacher ratio, primary Annual MEN National Administrative gathering 2001 74 65 Student/teacher ratio, secondary Annual MEN National Administrative gathering 2001 85 40 5. Health sector, fight against HIV/AIDS, and nutrition
Maternal mortality ratio per 100,000 live births Annual MSP National Administrative gathering 2000 827 700 Infant/child mortality ratio per 1,000 Five years MSP/INSEED National Survey 2000 222 150 Vaccination rate of children under age 1 Five years EIMT National Survey 2000 15.2% 23% HIV/AIDS prevalence ratio Annual PNLS National Administrative gathering 2001 5-12% 3-10% Number of children orphaned by AIDS Annual INSEED
MSP National Administrative gathering 2002 55000 44,000
Malaria prevalence ratio Annual MSP/DSIS National Administrative gathering 2001 20.7% 15%

116
Levels reached Indicator Frequency Source entity Disaggregation Production method Year Figure
Objective for 2006
Tuberculosis prevalence ratio Annual MSP/DSIS National Administrative gathering 2000 0.02% 0.01% Ratio of inhabitants per physician Annual MSP/DSIS National Administrative gathering 2000 36,000 34,186 Ratio of inhabitants per FDI Annual MSP/DSIS National Administrative gathering 2000 28,502 15,517 Ratio of women of childbearing age per SFDE Annual MSP/DSIS National Administrative gathering 2000 13692 13000 Percentage of childbirths assisted by medical personnel
Annual MSP/INSEED National Survey/admin. gathering 1997 11.2% 20%
Percentage of children under 5 suffering from malnutrition
Five years INSEED/ MSP
National Survey 1999 40% 30%
Proportion of children under 5 who are underweight
Five years INSEED (EDST, EIMT)
National Survey 2000 27.6% 20%
6. Social affairs and protection of vulnerable groups
Proportion of women in government Government shake-up
Office of the Prime Minister
National Administrative gathering 2002 7.7% 20%
Proportion of seats in National Parliament held by women
Four years National Assembly
National Administrative gathering 2002 5.8% 5.8%
Number of handicapped with training in trades Five years INSEED National Survey 2002 36 100 Number of fitting and readaptation centers created
Five years INSEED National Survey 2002 7 15
Number of education centers for street children Five years UNICEF National Survey 1999 7 15 Proportion of handicapped persons Five years ILO National Study, Survey 1995 7.3% 7. Housing and urban planning Proportion of households living in modern housing
Five years INSEED National Survey 1993 3.9% 10%
Proportion of households with latrines Annual DSIS National Administrative gathering 1998 7% 20% Proportion of households with access to safe drinking water
Five years DSIS National Survey 1998 27% 30%
Proportion of population with access to an improved sanitation system
Five years INSEED National Survey 2000 1.4% 3%
8. Basic economic infrastructures Length of paved national roads Annual MTPT National Administrative gathering 2002 557 km 900 km Length of rehabilitated national dirt roads Annual MTPT National Administrative gathering 2002 2,990 km 3,000 km
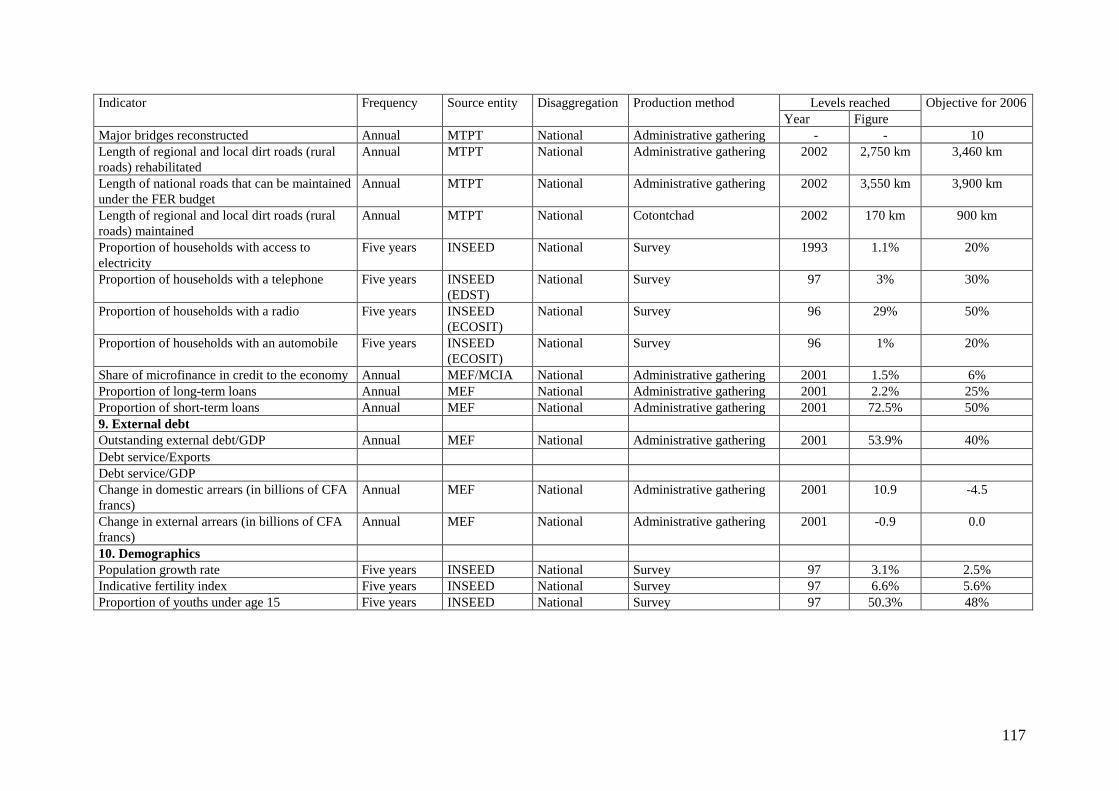
117
Levels reached Indicator Frequency Source entity Disaggregation Production method Year Figure
Objective for 2006
Major bridges reconstructed Annual MTPT National Administrative gathering - - 10 Length of regional and local dirt roads (rural roads) rehabilitated
Annual MTPT National Administrative gathering 2002 2,750 km 3,460 km
Length of national roads that can be maintained under the FER budget
Annual MTPT National Administrative gathering 2002 3,550 km 3,900 km
Length of regional and local dirt roads (rural roads) maintained
Annual MTPT National Cotontchad 2002 170 km 900 km
Proportion of households with access to electricity
Five years INSEED National Survey 1993 1.1% 20%
Proportion of households with a telephone Five years INSEED (EDST)
National Survey 97 3% 30%
Proportion of households with a radio Five years INSEED (ECOSIT)
National Survey 96 29% 50%
Proportion of households with an automobile Five years INSEED (ECOSIT)
National Survey 96 1% 20%
Share of microfinance in credit to the economy Annual MEF/MCIA National Administrative gathering 2001 1.5% 6% Proportion of long-term loans Annual MEF National Administrative gathering 2001 2.2% 25% Proportion of short-term loans Annual MEF National Administrative gathering 2001 72.5% 50% 9. External debt Outstanding external debt/GDP Annual MEF National Administrative gathering 2001 53.9% 40% Debt service/Exports Debt service/GDP Change in domestic arrears (in billions of CFA francs)
Annual MEF National Administrative gathering 2001 10.9 -4.5
Change in external arrears (in billions of CFA francs)
Annual MEF National Administrative gathering 2001 -0.9 0.0
10. Demographics Population growth rate Five years INSEED National Survey 97 3.1% 2.5% Indicative fertility index Five years INSEED National Survey 97 6.6% 5.6% Proportion of youths under age 15 Five years INSEED National Survey 97 50.3% 48%

118
Annex 4: Detail of macroeconomic framework
2003 2004 2005 2006 2007 2008 2009 2010 2011 2012 2013 2014 2015
National income GDP at current prices 16.5 58.1 12.9 7.0 6.4 6.3 3.5 0.9 4.2 3.9 6.8 7.0 7.7 GDP at constant prices 11.2 42.4 15.3 4.4 4.3 4.1 1.1 -2.1 1.1 0.5 3.7 3.8 4.5
Excluding oil production 3.7 6.5 6.8 6.7 6.6 6.1 6.2 6.2 6.3 5.9 5.7 5.8 5.9Oil production … 539.0 34.7 0.0 0.0 0.0 -10.4 -24.0 -18.1 -25.3 -9.9 -12.6 -9.2
GNDI at current price 11.3 16.7 13.4 10.4 9.4 10.1 12.3 6.0 7.6 8.3 8.0 8.5 8.4 Consumer price index (average) 4.3 4.0 4.0 3.0 3.0 3.0 3.0 3.0 3.0 3.0 3.0 3.0 3.0
Money and credit Net foreign assets 1/ 20.3 36.4 36.1 30.3 21.6 24.7 41.9 17.1 8.5 5.4 2.5 0.3 -1.6 Net domestic assets 1/ -8.9 -25.2 -20.4 -14.2 -7.8 -11.2 -27.2 -7.9 3.0 3.5 4.3 6.7 9.2 Of which: Domestic credit 1/ -7.8 -24.6 -19.9 -13.7 -7.0 -11.1 -26.8 -7.6 3.5 3.6 4.5 6.9 9.6
Net claims on central government -12.5 -29.1 -24.4 -18.1 -10.9 -14.7 -31.3 -10.7 0.4 0.0 1.0 2.3 3.0Credit to nongovernment sector 4.7 4.5 4.5 4.4 3.9 3.6 4.4 3.1 3.1 3.6 3.6 4.6 6.6
Broad money 10.3 11.3 15.7 16.1 13.8 13.4 14.8 9.2 11.5 8.9 6.8 7.0 7.6GNDI/broad money 2/ 7.4 7.8 7.6 7.3 7.0 6.8 6.6 6.4 6.2 6.2 6.2 6.3 6.4
External sector (valued in CFA francs) Exports, f.o.b. 67.8 388.6 13.8 0.8 0.9 1.0 -7.8 -18.3 -12.2 -16.0 -3.4 -4.1 -1.0 Imports, f.o.b. -21.7 -25.4 -18.6 8.6 5.1 8.0 9.3 10.0 8.5 7.2 6.6 6.2 6.0 Export volumes 37.0 244.8 26.0 1.0 1.1 1.0 -7.3 -17.1 -11.3 -14.8 -3.3 -4.0 -1.3 Import volumes -29.9 -30.6 -17.8 6.9 3.3 6.3 7.5 8.3 6.7 5.3 4.8 4.3 4.1
Basic ratios Gross investment 42.1 18.2 13.1 13.6 13.3 13.7 14.6 16.1 17.1 18.0 18.4 18.8 19.1
Central government 10.9 7.6 7.2 7.1 7.2 7.3 7.8 8.4 9.0 9.5 9.7 9.9 10.0Private sector 31.2 10.6 5.9 6.5 6.1 6.4 6.8 7.7 8.1 8.4 8.7 8.9 9.1
Of which : oil sector 22.8 5.8 0.7 0.8 0.2 0.2 0.2 0.2 0.1 0.1 0.1 0.1 0.1 Gross domestic savings 10.5 37.0 38.1 36.2 34.2 32.7 29.1 23.6 20.4 16.8 15.8 14.6 14.1
Central government -0.8 2.9 3.5 3.2 3.5 4.4 7.1 5.6 4.9 5.5 5.8 6.0 6.3Private sector 11.3 34.1 34.6 32.9 30.8 28.2 22.0 18.0 15.5 11.3 9.9 8.6 7.8
Gross national savings 6.7 8.1 9.4 9.7 9.9 11.0 14.1 13.0 12.7 13.1 13.1 13.3 13.5Central government -0.2 3.3 3.8 3.5 3.7 4.7 7.3 5.9 5.2 5.8 6.0 6.1 6.3Private sector 6.9 4.8 5.6 6.2 6.2 6.3 6.8 7.1 7.6 7.3 7.1 7.2 7.2
Central government finance Revenue 8.3 9.2 9.9 10.1 10.7 11.8 15.2 14.5 14.3 15.3 15.6 16.2 16.7 Of which: oil revenue 0.5 3.2 3.5 3.2 3.2 3.7 6.3 4.4 3.2 3.1 2.6 2.5 2.3 Total expenditure 20.0 13.9 13.6 14.0 14.4 14.8 15.9 17.3 18.4 19.3 19.5 20.1 20.4 Current primary balance (- =deficit) 3/ -0.1 3.4 3.9 3.7 3.9 4.8 7.5 6.0 5.3 5.9 6.2 6.3 6.6
Primary base balance, excluding oil revenue 3/ 4/ 5/ -3.4 -2.3 -2.2 -2.5 -2.4 -2.4 -2.8 -2.8 -2.9 -2.6 -2.1 -2.1 -1.9Primary base balance 3/ 4/ -2.8 1.7 2.0 1.6 1.5 2.0 4.1 2.1 0.7 0.8 0.7 0.6 0.5
Overall fiscal deficit (commitment basis) 3/ -11.7 -4.7 -3.8 -3.9 -3.7 -2.9 -0.7 -2.8 -4.1 -4.0 -3.9 -3.9 -3.8 Overall fiscal deficit (cash basis) 3/ -12.5 -4.9 -3.9 -3.9 -3.8 -2.9 -0.7 -2.8 -4.1 -4.0 -3.9 -3.9 -3.8 Domestic financing -0.3 -1.8 -1.4 -1.0 -0.8 -1.3 -3.4 -1.3 0.1 0.0 0.1 0.3 0.4 External financing 12.9 6.4 5.3 5.0 4.5 4.2 4.1 4.1 4.1 4.0 3.8 3.6 3.3 Financing gap (-) 0.0 -0.3 0.0 0.0 0.0 0.0 0.0 0.0 0.0 0.0 0.0 0.0 0.0 Overall fiscal deficit (com.basis, including grants) -7.0 -1.6 -1.0 -1.3 -1.3 -0.6 1.6 -0.5 -1.9 -1.8 -1.8 -1.9 -1.9External sector Current account (- deficit) Excluding official transfers -36.1 -10.5 -4.0 -4.1 -3.7 -3.0 -0.7 -3.4 -4.6 -5.1 -5.4 -5.7 -5.6 Excluding official transfers and oil-related imports -13.3 -4.7 -3.3 -3.3 -3.5 -2.8 -0.6 -3.2 -4.5 -5.0 -5.3 -5.5 -5.5
NPV of debt-to-exports ratio 6/ 221.9 86.7 53.0 40.3 40.9 43.1 46.7 53.8 65.2 80.9 94.9 107.7 115.1Gross official reserves in months of imports (excl. pipeline) 7/
6.3 7.5 9.2 10.6 11.3 12.4 15.0 15.3 15.2 14.8 14.2 13.3 12.4
Nominal GDP 2,654.6 4,200.5 4,751.2 5,096.6 5,431.2 5,779.2 5,983.5 6,034.9 6,285.7 6,528.7 6,976.0 7,463.4 8,035.5Nominal GDP (in billions of CFA francs) 1,600.1 2,529.1 2,856.0 3,056.6 3,251.2 3,456.6 3,578.8 3,609.5 3,759.5 3,904.9 4,172.4 4,464.0 4,806.1 Of which: oil GDP (in billions of CFA francs) 104.5 862.9 1,007.5 1,005.2 1,003.3 1,002.5 898.5 682.4 559.0 417.5 376.0 328.6 298.4CFA francs per U.S. dollar ( period average) 602.8 602.1 601.1 599.7 598.6 598.1 598.1 598.1 598.1 598.1 598.1 598.1 598.1CFA francs per U.S. dollar (end of period) 668.0 665.5 663.4 ... ... ... ... ... ... ... ... ... ...Population (midyear; in millions) 8.1 8.3 8.5 8.7 8.9 9.1 9.3 9.6 9.8 10.1 10.3 10.6 10.8Nominal GDP per capita 329.6 508.9 561.6 587.7 611.0 634.3 640.7 630.4 640.6 649.2 676.7 706.3 741.9Nominal GNP per capita 315.9 360.7 399.6 430.9 460.7 495.3 542.2 560.4 587.2 620.7 654.8 693.4 734.2Nominal GNP 2,544.3 2,977.2 3,380.8 3,737.0 4,095.4 4,512.8 5,063.6 5,364.3 5,761.7 6,242.7 6,750.3 7,326.8 7,951.9
1/ Changes as percent of broad money stock at beginning of period.2/ Ratio in percent.3/ Excluding grants.4/ The primary base balance is the overall fiscal deficit excluding debt-service payments and foreign-financed investment.5/ In percent of non-oil GDP.6/ Based on the three-year, backward-looking average of exports of goods and nonfactor services.7/ In months of imports of goods and nonfactor services.
(Annual percentage change, unless otherwise specified)
(In percent of GDP, unless otherwise specified)
(In millions of U.S. dollars, unless otherwise specified)
Annex 4 -Table 1: Selected Economic and Financial Indicators, 2003-15

119
2001-03 2004-10 2011-15 2003-15
Primary sector 2.9 4.2 4.1 4.2 Agriculture 3.2 5.5 5.2 5.4 Food crops 2.0 5.6 5.5 5.6 Industrial crops 8.7 4.9 4.0 4.6 Livestock 2.8 2.9 3.0 2.9 Fishing and mining 2.0 1.1 1.1 1.1
Secondary sector 26.2 16.4 -2.4 10.1Secondary sector, excluding oil production 12.6 7.8 8.7 7.2 Manufacturing 6.5 7.7 8.3 8.0 Of which: cotton processing -1.1 5.2 4.0 4.9 Handicrafts 8.3 6.0 6.0 5.9 Electricity and water 13.0 7.8 5.0 6.9 Construction and public works 31.2 8.8 10.6 6.7 Oil production ... 28.7 -15.2 ...
Tertiary sector 8.2 7.1 5.9 6.5 Commerce, transport 8.1 5.6 6.0 5.6 Commerce 8.1 5.6 6.0 5.6 Transport 8.1 5.6 6.0 5.6 General government 8.6 10.3 5.8 8.2 Other 8.2 6.6 6.0 6.6 Total GDP at market prices 9.8 9.1 2.7 6.8GDP at market prices, excl. oil production 7.3 6.5 5.9 6.1
Primary sector 34.7 21.9 25.6 24.0 Agriculture 21.8 14.4 17.7 16.1 Food crops 19.1 12.6 15.6 14.2 Industrial crops 2.7 1.8 2.1 2.0 Livestock 10.3 6.1 6.5 6.4 Fishing and mining 2.6 1.4 1.4 1.4
Secondary sector 17.0 40.1 25.7 32.7Secondary sector, excluding oil production 14.5 11.2 16.4 13.7 Manufacturing 7.6 6.2 8.9 7.5 Of which: cotton processing 1.1 0.8 0.9 0.9 Handicrafts 2.5 1.8 2.4 2.1 Electricity and water 0.6 0.5 0.6 0.6 Construction and public works 3.7 2.6 4.5 3.5 Oil production 2.5 28.9 9.4 19.0
Tertiary sector 45.1 34.8 45.6 40.2 Commerce, transport 25.0 17.9 22.9 20.5 Commerce 21.8 15.6 19.9 17.8 Transport 3.2 2.3 3.0 2.7 General government 11.0 9.8 13.5 11.5 Other 9.1 7.2 9.2 8.2 Duties and taxes on imports 3.1 3.1 3.1
Total GDP at market prices 100.0 100.0 100.0 100.0GDP at market prices, excl. oil production 97.5 71.1 90.6 81.0
(Annual growth rate, in percent)
Annex 4 - Table 2: Gross Domestic Product by Sector, 2001-15
(In percent of total GDP)

120
2003 2004 2005 2006 2007 2008 2009 2010 2011 2012 2013 2014 2015
Total revenue and grants 207.9 310.1 359.0 387.8 425.0 488.9 625.5 607.0 621.8 682.3 735.7 812.8 888.8Total revenue 132.2 233.6 281.4 309.6 346.3 409.2 544.8 524.6 537.6 595.7 649.8 723.8 801.6
Tax revenue 110.5 133.9 158.7 186.1 215.5 247.9 284.6 326.0 372.9 424.4 481.6 545.9 618.4Tax on revenue 40.2 47.6 56.7 66.4 77.0 88.5 101.7 116.4 133.2 151.6 172.0 195.0 220.8Tax on goods and services 29.2 34.1 36.6 42.9 49.7 57.2 65.6 75.1 86.0 97.8 111.0 125.8 142.5Tax on international trade 39.5 49.9 62.8 73.7 85.3 98.2 112.7 129.0 147.6 168.0 190.6 216.1 244.8Other 1.6 2.3 2.6 3.1 3.6 4.1 4.7 5.4 6.1 7.0 7.9 9.0 10.2
Oil revenue 7.2 81.5 99.5 98.9 102.6 129.2 223.8 157.6 118.5 119.6 110.4 113.4 111.3Nontax revenue 14.5 18.2 23.1 24.7 28.2 32.1 36.4 41.0 46.2 51.8 57.8 64.5 72.0
Total grants 75.6 76.5 77.7 78.2 78.6 79.7 80.7 82.4 84.2 86.6 85.9 89.0 87.2Current grants 0.0 0.0 0.0 0.0 0.0 0.0 0.0 0.0 0.0 0.0 0.0 0.0 0.0HIPC Initiative assistance 10.5 8.8 9.3 9.1 8.9 9.2 9.5 9.8 9.4 9.5 6.1 6.3 1.4Project grants 65.1 67.7 68.4 69.1 69.8 70.5 71.2 72.6 74.8 77.2 79.8 82.7 85.8
Total expenditure 319.5 351.5 388.5 428.2 467.5 510.0 569.6 625.8 692.4 752.6 811.6 898.8 982.5Current expenditure 145.4 159.6 181.8 210.4 234.1 257.0 292.1 321.1 353.0 380.4 406.7 456.9 501.2
Current primary expenditure 133.8 146.4 168.6 197.0 220.4 243.1 277.9 306.6 338.2 365.4 391.3 441.2 485.2Wages and salaries 57.6 65.4 74.3 84.4 96.0 106.8 118.3 128.6 142.6 155.4 167.6 185.9 206.1Goods and services 29.8 39.7 47.6 58.0 65.3 72.2 85.5 95.8 105.5 113.5 120.4 140.9 156.7Transfers 17.9 18.3 21.8 26.3 29.2 32.4 38.3 42.5 47.2 51.0 55.1 62.2 67.2Defense 21.7 23.0 24.9 28.3 30.0 31.8 35.9 39.8 43.0 45.6 48.3 52.1 55.2
Salaries 14.0 15.0 16.2 18.8 19.9 21.1 23.8 26.4 28.5 30.2 32.1 34.6 36.7Goods and services 7.8 8.1 8.8 9.5 10.1 10.7 12.0 13.4 14.4 15.3 16.2 17.5 18.6
Peace accord implementation 3.1 0.0 0.0 0.0 0.0 0.0 0.0 0.0 0.0 0.0 0.0 0.0 0.0Contingent current expenditure 3.7 0.0 0.0 0.0 0.0 0.0 0.0 0.0 0.0 0.0 0.0 0.0 0.0
Interest 11.6 13.2 13.1 13.4 13.6 13.9 14.2 14.4 14.7 15.0 15.4 15.7 15.9Domestic 1.9 1.9 1.9 1.9 1.9 1.9 1.9 1.9 1.9 1.9 1.9 1.9 1.9External 9.7 11.3 11.2 11.5 11.7 12.0 12.2 12.5 12.8 13.1 13.4 13.8 14.0
Current balance -13.1 74.0 99.6 99.3 112.3 152.2 252.7 203.5 184.7 215.3 243.1 266.9 300.4
Investment expenditure 174.1 191.9 206.8 217.9 233.4 253.0 277.6 304.7 339.5 372.2 404.9 441.9 481.3Domestically financed 42.6 43.7 54.7 64.3 78.2 96.3 119.3 143.3 173.2 200.6 227.5 258.1 290.5Foreign financed 131.5 148.2 152.1 153.6 155.2 156.7 158.3 161.4 166.3 171.6 177.4 183.8 190.8
Primary base balance (commitment basis, excl. grants) 2/ -44.2 43.5 58.1 48.4 47.7 69.9 147.6 74.6 26.2 29.7 30.9 24.6 25.9Overall deficit (commitment basis, excl. grants) -187.3 -117.9 -107.1 -118.6 -121.1 -100.8 -24.8 -101.2 -154.8 -156.9 -161.9 -175.0 -180.9Overall deficit (commitment basis, incl. grants) -111.6 -41.4 -29.5 -40.5 -42.5 -21.1 55.9 -18.8 -70.6 -70.3 -75.9 -86.0 -93.6
Change in payments arrears -10.5 -5.0 -4.0 -2.0 -1.0 -1.0 -1.0 -1.0 -1.0 -1.0 -1.0 -1.0 -1.0External ( interest) -0.4 0.0 0.0 0.0 0.0 0.0 0.0 0.0 0.0 0.0 0.0 0.0 0.0Domestic -10.0 -5.0 -4.0 -2.0 -1.0 -1.0 -1.0 -1.0 -1.0 -1.0 -1.0 -1.0 -1.0
Float, errors, and omissions -2.7 0.0 0.0 0.0 0.0 0.0 0.0 0.0 0.0 0.0 0.0 0.0 0.0
Overall balance (cash basis, excluding grants) -200.4 -122.9 -111.1 -120.6 -122.1 -101.8 -25.8 -102.2 -155.8 -157.9 -162.9 -176.0 -181.9Overall balance (cash basis, including grants) -124.8 -46.4 -33.5 -42.5 -43.5 -22.1 54.9 -19.8 -71.6 -71.3 -76.9 -87.0 -94.6
Total financing 124.8 40.0 33.5 42.5 43.5 22.1 -54.9 19.8 71.6 71.3 76.9 87.0 94.6External financing, excl. exceptional financing (net) 46.8 62.9 65.7 66.7 66.3 65.4 64.1 64.8 67.6 69.4 69.1 69.6 71.5
Loans 63.4 80.5 83.7 84.5 85.4 86.2 87.1 88.8 91.5 94.4 97.6 101.2 105.0Amortization due -17.0 -17.6 -18.0 -17.9 -19.1 -20.8 -23.0 -24.0 -23.9 -25.0 -28.6 -31.6 -33.5Change in external arrears (principal) -1.5 0.0 0.0 0.0 0.0 0.0 0.0 0.0 0.0 0.0 0.0 0.0 0.0Rescheduling / debt relief 2.0 0.0 0.0 0.0 0.0 0.0 0.0 0.0 0.0 0.0 0.0 0.0 0.0
Domestic financing (net) -5.2 -45.4 -39.1 -30.8 -24.4 -45.0 -120.8 -46.8 2.1 -0.1 5.8 15.2 20.9Banking system 3/ -19.9 -45.4 -39.1 -30.8 -24.4 -45.0 -120.8 -46.8 2.1 -0.1 5.8 15.2 20.9
Central bank -25.8 -45.4 -39.1 -30.8 -24.4 -45.0 -120.8 -46.8 2.1 -0.1 5.8 15.2 20.9Of which: stabilization account -4.2 -37.3 -18.7 -9.9 -7.1 -28.6 -106.2 -34.8 12.0 8.9 14.8 21.7 27.3
Fund for Future Generations -0.7 -8.2 -9.9 -10.2 -10.5 -10.9 -10.3 -8.8 -7.9 -7.1 -6.9 -6.5 -6.4Commercial bank 5.9 0.0 0.0 0.0 0.0 0.0 0.0 0.0 0.0 0.0 0.0 0.0 0.0
Nonbanking system -6.5 0.0 0.0 0.0 0.0 0.0 0.0 0.0 0.0 0.0 0.0 0.0 0.0
Sale of assets 21.1 0.0 0.0 0.0 0.0 0.0 0.0 0.0 0.0 0.0 0.0 0.0 0.0Expected additional financing 74.5 17.3 1.8 1.5 1.6 1.7 1.7 1.8 1.9 2.0 2.1 2.1 2.2
World Bank 39.0 0.0 0.0 0.0 0.0 0.0 0.0 0.0 0.0 0.0 0.0 0.0 0.0European Union 23.9 11.8 0.0 0.0 0.0 0.0 0.0 0.0 0.0 0.0 0.0 0.0 0.0African Development Bank 6.7 3.3 0.0 0.0 0.0 0.0 0.0 0.0 0.0 0.0 0.0 0.0 0.0Bilateral donors 2.6 0.0 0.0 0.0 0.0 0.0 0.0 0.0 0.0 0.0 0.0 0.0 0.0HIPC Initiative exceptional financing 4/ 2.3 2.2 1.8 1.5 1.6 1.7 1.7 1.8 1.9 2.0 2.1 2.1 2.2Other 0.0 0.0 0.0 0.0 0.0 0.0 0.0 0.0 0.0 0.0 0.0 0.0 0.0
Fund disbursement 8.6 5.2 5.2 5.1 0.0 0.0 0.0 0.0 0.0 0.0 0.0 0.0 0.0Financing gap 0.0 6.3 0.0 0.0 0.0 0.0 0.0 0.0 0.0 0.0 0.0 0.0 0.0
1/ Excluding public contract taxation.2/ Overall fiscal balance, excluding debt-service payments and foreign-financed investment.3/ Includes net use of government deposits in the banking system, and repayment to the IMF. Starting in 2003, includes also money saved for stabilization purposes.
(In billions of CFA francs)
4/ HIPC Initiative assistance from bilateral creditors.
Annex 4 -Table 3: Consolidated Government Operations, 2003-15 1/

121
2003 2004 2005 2006 2007 2008 2009 2010 2011 2012 2013 2014 2015
Current account, incl. official current transfers -566.4 -257.1 -106.0 -117.5 -111.2 -94.0 -17.3 -114.1 -165.2 -189.9 -220.4 -246.4 -269.4Current account, excl. official current transfers -576.9 -265.9 -115.3 -126.6 -120.1 -103.2 -26.8 -123.9 -174.7 -199.4 -226.5 -252.7 -270.8Current account, excl. pipeline imports -201.6 -109.2 -85.9 -93.2 -104.7 -87.7 -10.9 -107.5 -159.8 -184.7 -214.2 -240.9 -264.8
Trade balance, incl. oil sector -268.7 653.1 858.4 842.6 837.0 822.2 697.8 459.6 314.9 156.7 101.4 42.8 3.1Trade balance, excl. oil sector -102.1 -112.0 -119.7 -130.3 -145.9 -160.0 -180.3 -202.3 -224.5 -241.3 -254.4 -266.1 -276.1
Exports, f.o.b. 206.1 1,007.1 1,146.5 1,155.6 1,166.0 1,177.6 1,086.2 887.0 778.7 653.8 631.6 605.7 599.6Of which: oil exports 74.7 862.9 991.3 989.0 987.2 986.4 882.3 666.3 542.9 401.4 359.9 312.5 282.3
Imports, f.o.b. 474.8 354.0 288.2 313.0 329.0 355.4 388.4 427.4 463.8 497.1 530.2 562.9 596.5Formal imports 412.1 288.3 217.3 236.5 246.7 267.0 293.5 325.4 354.1 379.3 403.6 427.0 450.4
Of which : pipeline-related imports 241.3 97.8 13.3 16.1 4.3 4.2 4.2 4.4 3.6 3.5 4.1 3.6 3.0Informal 62.7 65.7 70.8 76.5 82.3 88.4 95.0 102.1 109.8 117.9 126.5 135.9 146.1
Services, incl. oil sector (net) -237.1 -177.9 -146.2 -152.5 -157.6 -168.3 -179.0 -190.0 -191.9 -201.5 -210.9 -232.3 -243.6Services, excl. oil sector (net) -113.6 -127.9 -139.4 -144.3 -155.4 -166.1 -176.8 -187.8 -190.1 -199.7 -208.8 -230.5 -242.1
Credit 41.1 51.1 55.4 59.4 63.6 67.8 72.0 76.1 81.1 86.4 92.3 98.8 107.1Debit 278.2 229.0 201.5 211.9 221.2 236.1 250.9 266.1 273.0 287.9 303.2 331.1 350.7
Of which : pipeline related 123.5 50.0 6.8 8.2 2.2 2.1 2.1 2.2 1.8 1.8 2.1 1.8 1.5Factor income (net) -66.5 -736.5 -823.8 -815.4 -799.6 -757.5 -550.3 -401.1 -313.4 -171.1 -135.0 -81.7 -50.0
Of which : oil-related debit -54.9 -722.2 -817.1 -817.6 -812.1 -780.3 -583.1 -442.2 -363.4 -226.8 -196.0 -147.7 -120.7Current transfers (net) 5.9 4.2 5.6 7.8 9.0 9.5 14.1 17.4 25.1 26.0 24.1 24.9 21.1
Official (net) 10.5 8.8 9.3 9.1 8.9 9.2 9.5 9.8 9.4 9.5 6.1 6.3 1.4 Of which: HIPC Initiative grants 1/ 10.5 8.8 9.3 9.1 8.9 9.2 9.5 9.8 9.4 9.5 6.1 6.3 1.4Private (net) -4.6 -4.5 -3.7 -1.3 0.2 0.3 4.6 7.6 15.7 16.6 17.9 18.6 19.7
Capital and financial account 524.9 297.8 182.9 189.9 177.9 179.9 183.0 192.7 208.7 219.7 233.7 246.1 256.2Long- and medium-term capital 529.5 309.9 189.3 197.5 181.4 183.9 185.8 190.6 198.8 208.9 218.7 228.8 241.2
Public 114.6 130.6 134.1 135.8 136.1 135.9 135.3 137.4 142.4 146.6 148.9 152.3 157.3Project grants 65.1 67.7 68.4 69.1 69.8 70.5 71.2 72.6 74.8 77.2 79.8 82.7 85.8Project loans 49.4 62.9 65.7 66.7 66.3 65.4 64.1 64.8 67.6 69.4 69.1 69.6 71.5
Drawings 66.4 80.5 83.7 84.5 85.4 86.2 87.1 88.8 91.5 94.4 97.6 101.2 105.0Repayments -17.0 -17.6 -18.0 -17.9 -19.1 -20.8 -23.0 -24.0 -23.9 -25.0 -28.6 -31.6 -33.5
Private 414.9 179.3 55.2 61.7 45.4 48.0 50.5 53.2 56.4 62.2 69.8 76.5 83.9Direct investment 412.5 176.2 51.6 57.2 40.4 41.5 43.0 45.4 48.1 53.0 59.7 65.3 71.6
Of which : direct oil project investment 389.4 150.5 20.4 24.7 6.6 6.4 6.5 6.7 5.5 5.3 6.3 5.6 4.7Other investments 2.4 3.1 3.6 4.5 5.0 6.5 7.5 7.8 8.4 9.2 10.1 11.2 12.3
Short-term capital -4.6 -12.1 -6.4 -7.5 -3.5 -4.0 -2.8 2.1 9.8 10.9 15.1 17.3 14.9Private sector 2.4 2.6 3.0 3.4 3.8 4.2 5.6 7.1 12.3 11.9 15.6 17.3 14.9Banking sector -7.0 -14.7 -9.5 -10.9 -7.3 -8.2 -8.4 -5.0 -2.5 -1.0 -0.5 0.0 0.0
Net errors and omissions 0.0 0.0 0.0 0.0 0.0 0.0 0.0 0.0 0.0 0.0 0.0 0.0 0.0Overall balance -41.5 40.7 76.9 72.4 66.7 85.8 165.7 78.6 43.4 29.8 13.3 -0.3 -13.2Financing -33.0 -64.4 -78.7 -73.9 -68.3 -87.5 -167.4 -80.4 -45.3 -31.8 -15.4 -1.8 11.0
Change in official net reserves -31.2 -60.9 -73.9 -70.0 -59.8 -78.8 -159.4 -73.7 -40.1 -29.2 -14.5 -1.8 11.0Of which: Fund for Future Generations -0.7 -8.2 -9.9 -10.2 -10.5 -10.9 -10.3 -8.8 -7.9 -7.1 -6.9 -6.5 -6.4
Change in arrears -2.0 0.0 0.0 0.0 0.0 0.0 0.0 0.0 0.0 0.0 0.0 0.0 0.0Rescheduling of public debt and arrears 2/ 2.0 0.0 0.0 0.0 0.0 0.0 0.0 0.0 0.0 0.0 0.0 0.0 0.0Use of Fund resources (net) -1.9 -3.5 -4.8 -3.9 -8.5 -8.7 -8.0 -6.7 -5.2 -2.6 -0.9 0.0 0.0
Financing need 74.5 23.7 1.8 1.5 1.6 1.7 1.7 1.8 1.9 2.0 2.1 2.1 2.2Identified financing 74.5 17.3 1.8 1.5 1.6 1.7 1.7 1.8 1.9 2.0 2.1 2.1 2.2
European Union 23.9 11.8 0.0 0.0 0.0 0.0 0.0 0.0 0.0 0.0 0.0 0.0 0.0 World Bank 39.0 0.0 0.0 0.0 0.0 0.0 0.0 0.0 0.0 0.0 0.0 0.0 0.0 African Development Bank 6.7 3.3 0.0 0.0 0.0 0.0 0.0 0.0 0.0 0.0 0.0 0.0 0.0 Projected HIPC Initiative assistance 2.3 2.2 1.8 1.5 1.6 1.7 1.7 1.8 1.9 2.0 2.1 2.1 2.2 Other donors 2.6 0.0 0.0 0.0 0.0 0.0 0.0 0.0 0.0 0.0 0.0 0.0 0.0Financing gap 0.0 6.3 0.0 0.0 0.0 0.0 0.0 0.0 0.0 0.0 0.0 0.0 0.0
Memorandum items:Nominal GDP (in billions of CFA francs) 1,600 2,529 2,856 3,057 3,251 3,457 3,579 3,610 3,760 3,905 4,172 4,464 4,806Current account balance (incl. official current transfers)/GDP 3/ -33.7 -9.7 -3.7 -3.8 -3.4 -2.7 -0.5 -3.2 -4.4 -4.9 -5.3 -5.5 -5.6Current account balance (excl. official current transfers)/GDP -36.1 -10.5 -4.0 -4.1 -3.7 -3.0 -0.7 -3.4 -4.6 -5.1 -5.4 -5.7 -5.6Current account balance (excl. off. transfers and oil sector)/GDP -13.3 -4.7 -3.3 -3.3 0.0 0.0 0.0 0.0 0.0 0.0 0.0 0.0 0.0Gross official reserves (in billions of CFA francs) 170 231 305 375 435 513 673 747 787 816 830 832 821Gross official reserves (in months of imports (incl. pipeline)) 4/ 3.0 5.4 8.7 10.0 11.1 12.2 14.8 15.1 15.1 14.7 14.1 13.2 12.3Gross official reserves (in months of imports (excl. pipeline)) 4/ 6.3 7.5 9.2 10.6 11.3 12.4 15.0 15.3 15.2 14.8 14.2 13.3 12.4Debt outstanding (in billions of CFA francs) 5/ 1,027 1,102 1,173 1,244 1,311 1,376 1,440 1,505 1,573 1,642 1,711 1,781 1,852Debt outstanding /GDP 5/ 57.2 38.6 36.1 35.5 35.0 34.5 34.8 36.1 36.3 36.6 35.8 35.0 33.9Debt service/exports of goods and services 6/ 9.8 2.5 2.3 2.4 2.5 2.6 3.0 3.8 4.3 5.1 5.8 6.4 6.7NPV of debt-to-exports ratio 7/ 221.9 86.7 53.0 40.3 40.9 43.1 46.7 53.8 65.2 80.9 94.9 107.7 115.1
1/ HIPC interim assistance from multilateral creditors is recorded as current transfers in the current presentation.2/ Includes only traditional debt relief.3/ Assuming that the budgetary support expected from European Union and bilateral donors from 2003 onward will materialize.4/ In months of imports of goods and services.5/ Before stock-of-debt operation.6/ Debt service due, before HIPC Initiative assistance.7/ Based on the three-year, backward-looking average of exports of goods and nonfactor services.
Annex 4 - Table 4: Balance of Payments, 2003-15 (In billions of CFA francs)

122
2004 2005 2006 2007 2008 2009 2010 2011 2012 2013 2014 2015
Net foreign assets 119.5 195.1 278.5 359.4 426.5 513.6 681.4 760.1 802.7 832.9 847.9 849.8 838.8 Central bank 102.8 163.7 237.6 307.6 367.4 446.2 605.7 679.4 719.5 748.7 763.2 765.0 754.0 Commercial banks 16.7 31.4 40.9 51.8 59.1 67.3 75.8 80.8 83.3 84.3 84.8 84.8 84.8
Medium- and long-term liabilities -2.4 -2.4 -2.4 -2.4 -2.4 -2.4 -2.4 -2.4 -2.4 -2.4 -2.4 -2.4 -2.4
Net domestic assets 90.4 38.2 -8.9 -46.9 -71.0 -110.6 -219.4 -255.7 -240.5 -220.7 -194.5 -150.9 -87.1Domestic credit 134.6 83.5 37.6 0.9 -21.0 -60.2 -167.6 -202.6 -184.9 -164.7 -136.9 -91.7 -25.2
Claims on the government (net) 1/ 46.6 -13.8 -70.2 -118.6 -152.4 -204.4 -329.6 -378.8 -376.7 -376.8 -371.0 -355.7 -334.9Treasury (net) 56.7 -3.8 -60.2 -108.6 -142.4 -194.3 -319.6 -368.8 -366.7 -366.8 -360.9 -345.7 -324.8
Banking sector -12.7 -65.6 -113.4 -153.0 -182.1 -230.6 -353.6 -401.6 -399.5 -399.6 -393.8 -378.6 -357.7Fund position 69.4 61.8 53.2 44.4 39.7 36.2 34.0 32.8 32.8 32.8 32.8 32.8 32.8
Other nontreasury -10.0 -10.0 -10.0 -10.0 -10.0 -10.0 -10.0 -10.0 -10.0 -10.0 -10.0 -10.0 -10.0Credit to the economy 88.0 97.4 107.8 119.5 131.5 144.2 162.0 176.2 191.8 212.2 234.1 264.1 309.7
Other items (net) -44.2 -45.4 -46.6 -47.8 -50.1 -50.4 -51.7 -53.1 -55.6 -56.1 -57.6 -59.2 -61.9
Money and quasi money 207.5 230.9 267.2 310.2 353.1 400.6 459.7 502.0 559.9 609.8 651.0 696.5 749.3 Currency outside banks 120.3 117.5 131.6 149.0 169.8 187.9 215.4 234.9 268.7 288.2 304.6 318.2 326.1 Demand deposits 71.7 93.3 111.5 132.5 150.8 174.9 200.9 219.6 239.4 264.5 284.8 311.1 348.0 Time and savings deposits 15.5 20.1 24.1 28.6 32.6 37.8 43.4 47.4 51.7 57.1 61.5 67.2 75.2
Net foreign assets 20.3 36.4 36.1 30.3 21.6 24.7 41.9 17.1 8.5 5.4 2.5 0.3 -1.6Net domestic assets -8.9 -25.2 -20.4 -14.2 -7.8 -11.2 -27.2 -7.9 3.0 3.5 4.3 6.7 9.2
Domestic credit -7.8 -24.6 -19.9 -13.7 -7.0 -11.1 -26.8 -7.6 3.5 3.6 4.5 6.9 9.6Claims on the government (net) 1/ -12.5 -29.1 -24.4 -18.1 -10.9 -14.7 -31.3 -10.7 0.4 0.0 1.0 2.3 3.0
Of which: Treasury (net) -12.6 -29.1 -24.4 -18.1 -10.9 -14.7 -31.3 -10.7 0.4 0.0 1.0 2.3 3.0Credit to the economy 4.7 4.5 4.5 4.4 3.9 3.6 4.4 3.1 3.1 3.6 3.6 4.6 6.6Credit to the economy (annual change) 11.2 10.7 10.8 10.8 10.0 9.6 12.4 8.8 8.9 10.6 10.3 12.8 17.3
Money and quasi money 10.3 11.3 15.7 16.1 13.8 13.4 14.8 9.2 11.5 8.9 6.8 7.0 7.6 Currency outside banks 1.8 -1.4 6.1 6.5 6.7 5.1 6.9 4.3 6.7 3.5 2.7 2.1 1.1 Demand deposits 6.3 10.4 7.9 7.9 5.9 6.8 6.5 4.1 3.9 4.5 3.3 4.0 5.3 Time and savings deposits 2.1 2.2 1.7 1.7 1.3 1.5 1.4 0.9 0.9 1.0 0.7 0.9 1.1
Memorandum items:Nominal GDP (in billions of CFA francs) 1,600 2,529 2,856 3,057 3,251 3,457 3,579 3,610 3,760 3,905 4,172 4,464 4,806Money multiplier (M2 as a fraction of base money) 1.4 1.6 1.6 1.7 1.7 1.7 1.7 1.7 1.7 1.7 1.7 1.7 1.8Money velocity (GDP relative to M2) 7.7 11.0 10.7 9.9 9.2 8.6 7.8 7.2 6.7 6.4 6.4 6.4 6.4Gross reserves (in percent of M2) 82.0 100.1 114.1 120.9 123.1 128.2 146.4 148.7 140.5 133.8 127.6 119.5 109.61/ Including net use of Fund resources.
2003
Annex 4 - Table 5: Monetary Survey, 2003-15
(In billions of CFA francs)
(In percent of beginning-of-period money stock)