Mali: Poverty Reduction Strategy Paper · Mali: Poverty Reduction Strategy Paper Poverty Reduction...
226
© 2008 International Monetary Fund April 2008 IMF Country Report No. 08/121 [Month, Day], 2001 August 2, 2001 January 29, 2001 [Month, Day], 2001 August 2, 2001 Mali: Poverty Reduction Strategy Paper Poverty Reduction Strategy Papers (PRSPs) are prepared by member countries in broad consultation with stakeholders and development partners, including the staffs of the World Bank and the IMF. Updated every three years with annual progress reports, they describe the country’s macroeconomic, structural, and social policies in support of growth and poverty reduction, as well as associated external financing needs and major sources of financing. This country document for Mali, dated December 20, 2006, is being made available on the IMF website by agreement with the member country as a service to users of the IMF website. Copies of this report are available to the public from International Monetary Fund • Publication Services 700 19 th Street, N.W. • Washington, D.C. 20431 Telephone: (202) 623-7430 • Telefax: (202) 623-7201 E-mail: [email protected] • Internet: http://www.imf.org Price: $18.00 a copy International Monetary Fund Washington, D.C.
Transcript of Mali: Poverty Reduction Strategy Paper · Mali: Poverty Reduction Strategy Paper Poverty Reduction...
© 2008 International Monetary Fund April 2008 IMF Country Report No. 08/121
[Month, Day], 2001 August 2, 2001 January 29, 2001 [Month, Day], 2001 August 2, 2001
Mali: Poverty Reduction Strategy Paper
Poverty Reduction Strategy Papers (PRSPs) are prepared by member countries in broad consultation with stakeholders and development partners, including the staffs of the World Bank and the IMF. Updated every three years with annual progress reports, they describe the country’s macroeconomic, structural, and social policies in support of growth and poverty reduction, as well as associated external financing needs and major sources of financing. This country document for Mali, dated December 20, 2006, is being made available on the IMF website by agreement with the member country as a service to users of the IMF website.
Copies of this report are available to the public from
International Monetary Fund • Publication Services 700 19th Street, N.W. • Washington, D.C. 20431
Telephone: (202) 623-7430 • Telefax: (202) 623-7201 E-mail: [email protected] • Internet: http://www.imf.org
Price: $18.00 a copy
International Monetary Fund
Washington, D.C.


20 December 2006
2nd Generation PRSP 2007 – 2011
MMAALLII
Growth and Poverty Reduction Strategy Paper
DDOOCCUUMMEENNTT AADDOOPPTTEE PPAARR LLEE CCOONNSSEEIILL DDEESS MMIINNIISSTTRREESS LLEE 2200//1122//22000066


GPRSP 2007 – 2011 Page 3 of 224
Table of Contents FOREWORD 12 1 EXECUTIVE SUMMARY 13
1.1 EVALUATION OF PRSP I 14 1.2 LONG-TERM STRATEGIC VISION 14 1.3 OVERALL GOALS AND MACRO-ECONOMIC FRAMEWORK 14 1.4 STRATEIC ORIENTATIONS 15 1.5 PRIORITY AREAS OF INTERVENTION 16 1.6 IMPLEMENTATION, MONITORING AND EVALUATION 16 1.7 PRESENTATION OF PRSP II 16
2 INTRODUCTION 17 3 TREND OF POVERTY IN MALI 18 4 EVALUATION OF THE PRSP 19
4.1 EvALUATION OF THE PRSP PILLARS 19 4.1.1 Macro-economic Framework 19 4.1.2 Institutional Development, Governance and Participation 20 4.1.3 Human Resource Development and Access to Basic Services 21 4.1.4 Development of Basic Infrastructure and Productive Sectors 23
4.2 LINKS BETWEEN THE PRSP AND BUDGET INSTRUMENTS 25 4.3 LINKS BETWEEN THE PRSP AND THE MDGS 25 4.4 LINKS BETWEEN THE PRSP AND THE NATIONAL PROSPECTIVE STUDY MALI 2025 26 4.5 LINKS BETWEEN THE PRSP AND SUPPORT FROM TECHNICAL AND FINANCIAL PARTNERS 26 4.6 LESSONS FROM THE PRSP MONITORING AND EVALUATION 26
5 GPRSP OBJECIVES AND EXPECTATIONS 27 5.1 OVERALL GOAL 27 5.2 SPECIFIC OBJECTIVES 27 5.3 EXPECTATIONS 27
6 STRATEGIC ORIENTATIONS 27 6.1 PRODUCTIVE SECTOR DEVELOPMENT 28 6.2 CONSOLIDATION OF PUBLIC SECTOR REFORMS 29 6.3 STRENGTHENING OF THE SOCIAL SECTOR 31
7 MACRO-ECONOMIC AND BUDGETARY FRAMEWORK 2007 – 2011 33 7.1 ASSUMPTIONS OF FRAMEWORK FORECASTS 33 7.2 MAIN RESULTS OF THE FRAMEWORK 34 7.3 PUBLIC FINANCE 35 7.4 PUBLIC DEBT 38 7.5 BALANCE OF PAYMENTS AND MONETARY SITUATION 38 7.6 EXTERNAL AID 39 7.7 INCIDENCE ON POVERTY 40
8 PRIORITY AREAS OF INTERVENTION 41 8.1 FOOD SECURITY AND RURAL DEVELOPMENT 41
8.1.1 Food Security 41 8.1.2 Rural Development 41
8.2 DEVELOPMENT OF SME- SMI 43 8.3 MANAGEMENT OF THE ENVIRONMENT AND NATURAL RESOURCES 43 8.4 CONSOLIDATION OF PUBLIC ADMINISTRATION REFORMS 44
8.4.1 Decentralization and Deconcentration 44 8.4.2 Improvement and Modernization of Public Finance Management 46
8.5 PURSUANCE OF BUSINESS ENVIRONMENT REFORMS 46 8.6 FINANCIAL SECTOR DEVELOPMENT 46 8.7 DEVELOPMENT OF INFRASTRUCTURE 47
GPRSP 2007 – 2011 Page 4 of 224
8.8 PROMOTION OF DEMOCRATIC GOVERNANCE AND PUBLIC FREEDOMS 48 8.9 CAPACITY BUILDING FOR THE CIVIL SOCIETY 49 8.10 STRENTHENING OF REGIONAL AND SUB-REIONAL INTEGRATION INITIATIVES, CONSTANT SUPPORT TO ACHIEVEMENT OF AFRICAN UNITY 50 8.11 CREATION AND PROMOTION OF SUSTAINABLE JOBS 51 8.12 DEVELOPMENT OF ACCESS TO BASIC SOCIAL SERVICES 51
8.12.1 Education 51 8.12.2 Health and Social Development 52 8.12.3 Drinking Water and Sanitation 53 8.12.4 Employment and Vocational Training 54 8.12.5 Housing 54
8.13 HIV/AIDS CONTROL 55 8.14 INTEGRATION INTO MULTILATERAL TRADE SYSTEM 55
9 ACCELERATED GROWTH STRATEGY 56 9.1 GROWTH-ORIENTED SECTORS 57
9.1.1 Rural Sector 57 9.1.2 Mining 58
9.2 NEW POSSIBILITIES 59 9.2.1 Industries 59 9.2.2 Trade 59 9.2.3 Tourism 59 9.2.4 Fruits, Vegetables, Oilseed Corps and Commodities 60 9.2.5 Handicraft 60 9.2.6 Culture 61 9.2.7 Youth and Sports 62
9.3 GROWTH-ORIENTED INFRASTRUCTURE 62 9.3.1 Energy 63 9.3.2 Transport 64 9.3.3 Telecommunications/ICT and Posts 65
9.4 CROSS-CUTTING ISSUES 65 9.4.1 Gender 65 9.4.2 Territorial Development 69 9.4.3 Population Issues 69 9.4.4 Peace and Security Issues 70
10 COORDINATION AND MONITORING-EVALUATION MECHANISMS 70 10.1 INSTITUTIONAL MONITORING AND EVALUATION MECHANISM 71 10.2 STRENTHENING OF THE NATIONAL STATISTICS SYSTEM (SSN) 72 10.3 MONITORING AND EVALUATION INDICATORS 73
11 IMPLEMENTATION OF THE PARIS DECLARATION 80 12 PRSP II FINANCING PLAN 80
13 PRSP II LOGICAL FRAMEWORK 84 14 CONCLUSION 93

GPRSP 2007 – 2011 Page 5 of 224
List of Tables TABLE 1: INDICATORS OF MACRO-ECONOMIC PERFORMANCE AND DECISION-MAKING CRITERIA ..........34 TABLE 2: CONSOLIDATED BUDGET OF PUBLIC FINANCE AND ITS FINANCING (GFFT).............................36 TABLE 3: SECTOR BREAKDOWN OF EXPENDITURES 2007-2011 (IN CFAF BILLION) ................................37 TABLE 4: SECTORAL BREAKDOWN OF EXPENDITURE 2007-2011 IN % OF TOTAL ....................................37 TABLE 5: EXTERNAL AID REQUIRED (IN CFAF BILLION)..........................................................................39 TABLE 6: FINANCING GAP ..........................................................................................................................40 TABLE 7: TREND OF GDP AND GROWTH RATE..........................................................................................56 TABLE 8: OVERALL INDICATORS PRSP II..................................................................................................74 TABLE 9: PRSP II SECTORAL MONITORING INDICATORS..........................................................................77 TABLE 10: PRSP FINANCING PLAN............................................................................................................82 TABLE 11: LOGICAL FRAMEWORK .............................................................................................................84
NB. The core document of PRSP II is accompanied by three separate Annexes Annex I Macro-economic Framework 2007 – 2011 Annex II Medium Term Expenditure Framework 2007 – 2011 Annex III Priority Actions Matrix for 2007 - 2009

GPRSP 2007 – 2011 Page 6 of 224
List of Abbreviations and Acronyms
ADB African Development Bank
AGETIER Infrastructure and Rural Utilities Works Implementation Agency
AGOA African Growth Opportunity Act
AMADER Agence Malienne de Développement l’Energie Rurale
AMM Association of Malian Municipalities
ANICT National Local Authorities Investment Agency
APCAM Assemblée Permanente des Chambres d’Agricultures du Mali
APCMM Assemblée Permanente des Chambres de Métiers du Mali
ARV Anti Retro Viral Drugs
BCEAO Central Bank of West African States
BD Board of Directors
BDM Banque de Développement du Mali (Development Bank of Mali)
BHM Banque de l’Habitat du Mali (Housing Bank of Mali)
BIM Banque Internationale du Mali (International Bank of Mali)
BIT International Labour Office
BRVM Regional Stock Exchange
CAF Functional Literacy Centre
CAN African Cup of Nations
CAS/SFD Decentralized Financial Systems Support and Supervision Unit
CCC Centre de Conseil Communal
CCIM Chambre de Commerce et d’Industrie du Mali (Chamber of Commerce and Industry of Mali)
CDC Caisse des Dépôts et Consignations
GPRSP 2007 – 2011 Page 7 of 224
CED Development Education Centre
CEN SAD Community of Sahel-Saharan States
CENTIF National Financial Information Processing Unit
CET Common External Tariff
CFAF Franc of the African Financial Community
CILSS Permanent Inter-State Committee on Drought Control in the Sahel
CLPD Local Development Planning Committee
CM Mining Code
CMDT Compagnie Malienne de Développement des Textiles
CNPM Conseil National du Patronat du Mali
CNSC National Civil Society Council
CPM Forecasts and Modelling Committee
CPS Planning and Statistics Unit
CRM Caisse de Retraites du Mali (Pension Fund of Mali)
CRPD Regional Development Planning Committee
CSCOM Community Health Centre
DAF Department of Administration and Financial Affairs
DBB Directorate General of the Budget
DGDP Directorate General for Public Debt
DNCC National Directorate for Trade and Competition
DNPD National Directorate for Development Planning
DNSI National Directorate for Statistics and Information Technology
DTC3 Vaccine against Diphtheria, Tetanus and Whooping Cough
EBC Budget Consumption Survey
EBES Child with Special Education Needs

GPRSP 2007 – 2011 Page 8 of 224
ECOWAS Economic Community of West African States
EDM Energie du Mali (Energy Corporation of Mali)
EDS Health Demographic Survey
EDSM Health Demographic Survey in Mali
EID Espace d’Interpellation Démocratique
ELIM Light Integrated Household Survey
EMEP Poverty Evaluation Survey in Mali
ENP National Prospective Study
FAO Food and Agriculture Organization
FDE Economic Development Fund
FGHM Fonds de Garantie Hypothécaire du Mali
GAFI Financial Action Group
GDP Gross Domestic Product
GER Gross Enrolment Rate
GFFT Government Flow of Funds Table
GIABA Inter-Governmental Action Group against Money Laundering in Africa
GPRSP Growth and Poverty Reduction Strategy Paper
HCCT Local Authorities High Council
HCNLS National AIDS Control High Council
HIPC Heavily Indebted Poor Countries
HUICOMA Huilerie Cotonnière du Mali
IDA International Development Agency
IDHD Sustainable Human Development Index
IMF International Monetary Fund
INPS National Social Insurance Institute

GPRSP 2007 – 2011 Page 9 of 224
IPC Council Poverty Index
LOA Agriculture Orientation Law
LPDSC Cotton Sector Development Policy Letter
LPDSP Private Sector Development Policy Letter
MCA Millennium Challenge Account
MDG Millennium Development Goals
MDRI Multilateral Debt Relief Initiative
MEF Ministry of the Economy and Finance
MFI Micro Finance Institution
MME_DNPD Modèle Macro-Economique du Mali de la DNPD
MPAT Ministry of Planning and Territorial Development
MTBF Medium Term Budgetary framework
MTEF
NBA
Medium Term Expenditure Framework
Niger Basin Authority
NEPAD New Partnership for Africa’s Development
NICT New Information and Communication Technologies
ODHD Sustainable Human Development Observatory
OHADA Organization for the Harmonization of Business Law in Africa
OMH Office Malien de l’Habitat (Malian Housing Authority)
OMVS Senegal River Development Organization
ONAP National Petroleum Products Supply Authority
PACD Retailers Development Project
PAGAMGFP Government Action Plan for the Improvement and Modernization of Public Finance Management
PAGIRE Integrated Water Resources Management Action Plan
PASAOP Agricultural Sector and Farmer Organizations Support Programme
GPRSP 2007 – 2011 Page 10 of 224
PASC Growth Sources Support Project
PCIME Integrated Management of Children’s Diseases
PDI Institutional Development Programme
PDSA Handicraft Sector Development Programme in Mali
PDSF Financial Systems Development Programme
PDSS Ten-Year Health and Social Development Programme
PISE Education Sector Investment Project
PNE National Employment Policy
PNIR National Rural Infrastructure Programme
PNL National Housing Programme
PNP National Population Policy
PNPE National Environmental Protection Policy
PPIP Priority Population Investment Programme
PRODEC Ten-Year Education Programme
PRODEJ Ten-Year Justice Programme
PRODESS Health and Social Development Programme
PROSEPA Drinking Water and Sanitation Sector Programme
PRSP Poverty Reduction Strategy Paper
PTI Three-Year Investment Programme
REM Pupil Teacher Ratio
SBI Special Investment Budget
SDA Supply Master Plans (energy wood)
SDDR Rural Development Master Plan
SDS Statistics Master Plan
SDU Town Planning Master Plan

GPRSP 2007 – 2011 Page 11 of 224
SFD Decentralized Financial Systems
SIG Geographical Information System
SME Small and Medium Size Enterprises
SMI Small and Medium Size Industries
SOTELMA Société des Télécommunication du Mali
SSN National Statistics System
SYSCOA West African Accounting System
TFP Technical and Financial Partners
UGP-CI Integrated Framework for Project Management Unit
UNDP United Nations Development Programme
VAT Value Added Tax
WAEMU West African Economic and Monetary Union
WFP World Food Programme
WTO World Trade Organization

GPRSP 2007 – 2011 Page 12 of 224
FOREWORD The Ministry of the Economy and Finance is pleased to make available to the development stakeholders in Mali (public administration, civil society, private sector, Decentralized Authorities, technical and financial partners, Institutions of the Republic), the final version of the 2nd Generation Poverty Reduction Strategy Paper (PRSP II) adopted by Cabinet Meeting on 20 December 2006. This document, known as Growth and Poverty Reduction Strategy Paper, which will henceforth be the only frame of reference for development policies and strategies in Mali, has been prepared following a broad participatory process at the national, regional and local levels.
The document is the outcome of this long process, which covered nearly one year. It brings together all the sector policies. To a large extent, it draws on lessons learnt from PRSP I 2002-2006 evaluation, the MDGs and the National Prospective Study for Mali 2025 (ENP Mali 2025) conducted from 1997 to 1999 throughout the country and which recorded Malians’ perception and vision of their society within a generation.
PRSP II has given an opportunity to review all sectoral, national and thematic policies in light of the main goal of growth and poverty reduction. The reflection helped to underscore, not only the major causes and obstacles to poverty reduction, but also the key economic and social benefits that guarantee strong growth and sustainable development.
Furthermore, I think it is important to point out that the PRSP process is an ongoing process. Consequently, improvements will be made to the document, as relevant information and analyses become available. The aim is that the PRSP should serve as a permanent framework for dialogue between all the stakeholders, and that it should at all times be the best possible response to the problem of poverty reduction.
The process of preparing this document has generated a series of intermediate documents that the Ministry of the Economy and Finance will make available to all users; the documents include ad hoc group reports, as well as PRSP review and workshop reports.
Lastly, I wish to thank all stakeholders for their active involvement in the PRSP preparation process which can still be improved and is open to all because, over and above the production of a reference document, the major challenge remains its implementation and monitoring-evaluation which, if successful, would guarantee achievement of the objectives sought. The success of the PRSP depends on this.
Abou-Bakar TRAORE Minister of the Economy and Finance

GPRSP 2007 – 2011 Page 13 of 224
1. EXECUTIVE SUMMARY 1. The new generation Poverty Reduction Strategy Paper (PRSP), which could
be defined as the Growth and Poverty Reduction Strategy Paper, describes the policies and programmes which the country intends to implement at the macro-economic, structural and social levels, so as to promote growth and reduce poverty over the 2007-2011 period. It also presents the financing plan and related external financing requirements for the period.
2. The PRSP also provides the basis for assistance from technical and financial partners, as well as debt relief under the Heavily Indebted Poor Countries (HIPC) Initiative and the Multilateral Debt Reduction Initiative (MDRI), two initiatives from which Mali benefits.
3. The first PRSP for Mali, the final version of which was adopted in May 2002, drew on the Interim PRSP (I-PRSP). It covered the 2002-2006 period. In all, eleven working groups, with representatives from the central administration, the civil society, the private sector and external development partners, played a key role in its preparation. The preparation process also involved regional consultations.
4. As it henceforth provides the single medium-term frame of reference for the development policy of Mali, and the main reference document for all TFPs in their support operations for the country, the PRSP has helped to implement several programmes in each of the proposed priority areas, namely: (i) institutional development and improvement of governance and participation, (ii) human development and reinforcement of access to social services, and (iii) development of infrastructures and support to key productive sectors.
5. The reports on PRSP implementation and review conducted in June 2006 underscored the achievements and weaknesses in PRSP preparation and implementation. Justifications for the preparation of a new generation PRSP therefore lie in the weaknesses of PRSP I, in particular: (i) inadequacy of results obtained in relation to the set overall goals, (ii) weak link between the PRSP and the State budget, operational weakness of the institutional monitoring-evaluation mechanism, and weakness of the various working instruments (indicators, statistics).
6. It is within this context that the new generation PRSP, presented in this document, was prepared.
7. The work drew on the results of evaluations of the 2002-2006 PRSP, specific work by the ad hoc working groups, and conclusions of the first PRSP review.
8. Following preparations at end of 2005, the process was launched in January 2006, and the initial documents were presented in July 2006. Consultations were held with all the stakeholders throughout the preparation process, and a national workshop in September 2006 put together the views of all the stakeholders. This document is the outcome of the consultations.
9. The guiding principles of PRSP II preparation are as follows:
• consolidation of the achievements of PRSP I;
• acceleration of growth by eliminating major constraints;
• implementation of new sources of growth; and
• integration of MDGs.
GPRSP 2007 – 2011 Page 14 of 224
Evaluation of PRSP I 10. The implementation of PRSP I helped to reduce the level of monetary
poverty from 68.3% in 2001 to 59.2% in 2005, on the basis of an updated poverty line of CFAF 153,310. The goal of reducing poverty by one-quarter over the 2001-2006 period, and bringing down the level to 47.5% in 2006 was therefore not achieved. The analysis shows a significant gap between rural areas (73.0%) and urban areas (20.1%). On the other hand, poverty in urban areas has reduced, with urban poverty incidence dropping from 26.2% in 2001 to 20.12% in 2005, representing a decline of more than 6 points. In rural areas, the incidence of poverty has remained virtually stable, moving from 73.8% in 2001 to 73.0% in 2005. Lastly, the other two indicators, depth and severity of poverty, are improving slightly, but insufficiently and less than expected by the first PRSP project.
11. In conclusion, it should be noted that the low level of poverty reduction during PRSP I is due to poor control of population growth, inadequate growth rate of the Malian economy, unequal distribution of the fruits of growth, and limited access to basic services.
Long-term Strategic Vision 12. Like PRSP I, PRSP II is based on the vision defined in the National
Prospective Study Mali 2025. This consensual vision on the country’s future by the year 2025 is built around the aspirations of individuals. It expresses what the majority of the Malian population, including the poor, want: “a nation that is united around a diversified and rehabilitated cultural base; a democratic political and institutional organization that guarantees development and social peace; a strong, diversified and open economy; poverty reduction and social progress affecting all the regions and categories of the population”.
13. Such a vision is voluntarist. It calls for a proactive attitude, which consists in not being subject to events, but rather acting to cause them. It also entails the mobilization of minds and energies for poverty reduction and sustainable development. It is an extension of international commitments made at various world summits, in particular the Millennium Development Goals for 2015.
Overall Goals and Macro-economic Framework
Overall Goal 14. Promote redistributive growth and poverty reduction by boosting productive
sectors and consolidating public sector reforms. The main objective of the macro-budgetary framework is to maintain macro-economic and budgetary balances, taking into account the real potential of the Malian economy, as well as the overall and sector goals of the PRSP. Following consideration of several variants based on diverse public investments and tax pressure assumptions, a voluntarist scenario of strong growth was adopted, reflecting the political will to accelerate overall growth driven by rapid private sector development. The average estimated GDP growth rate for the 2007-2011 period will be + 7%. In public finance, efforts will be made towards mobilization of internal resources, with a tax pressure of 17% as from 2008, in accordance with Mali’s commitments concerning the WAEMU convergence criteria. The Government’s budget and financial policy will be supported by activities proposed in the Government’s Action Programme for the Improvement and Modernization of Public Finance Management

GPRSP 2007 – 2011 Page 15 of 224
(PAGAMGFP). During PRSP II, total revenue and expenditure estimates (including net loans) are consistent with the macro-economic framework and Medium-Term Budgetary framework. The total revenue (excluding grants) would stand at CFAF 884 billion in 2011 as against CFAF 540 billion in 2007. Tax revenue will increase at an average annual rate of 10.3%. Total expenditure and net loans would increase at an average annual rate of 7.1% to CFAF 1,217 billion in 2011. These estimates include the financing programmes, as well as evaluations of internal and external financing requirements for the period.
Specific Objectives • Accelerate growth: + 7% per year over the 2007-2011 period.
• Improve the well-being of the Malian populations.
Strategic Orientations 15. To achieve these objectives, PRSP II proposes three strategic orientations,
which reinforce each other to attain the core objective of strong and sustainable growth that would reduce poverty:
• Development of infrastructures and the productive sector;
• Pursuance and consolidation of structural reforms; and
• Strengthening of the social sector.
OS1: Development of infrastructures and productive sectors 16. This first strategic orientation aims at improving the productive environment
to ensure better productivity of factors of production and economic growth.
OS2: Pursuance and consolidation of structural reforms 17. This second strategic orientation aims at pursuing the implementation of
reforms relating to the structure and functioning of the Government and its institutions. To that end, the Government will place the concerns of users at the core of institutional reforms that will be undertaken by the Institutional Development Programme (PDI) to ensure good management of public affairs, peace and social stability. The Programme aims at making profound changes in public management. The reforms, some of which were initiated several years ago, need to be strengthened during PRSP II implementation. In addition to consolidation of the decentralization process, several equally fundamental aspects will be given priority in PRSP II, namely: strengthening of the rule of law and improvement of the judicial system and organization, capacity building for the civil society, and the fight against corruption.
OS3: Strengthening of the Social Sector 18. This strategic orientation focuses on better delivery of key basic social
services, in particular education, health, drinking water and sanitation, and housing. Employment-training and HIV/AIDS control will be priority areas of intervention.

GPRSP 2007 – 2011 Page 16 of 224
19. For each of the strategic orientations, emphasis is laid on the need for specific and corrective actions to protect the rights of the poor in decision-making and reduce disparities between regions, between councils, between urban and rural areas, and between the sexes.
Priority Areas of Intervention 20. The three strategic orientations are detailed out in thirteen priority areas,
which cover all activities relating to the administration, the civil society, the private sector, and the productive sector: (1) Food security and rural development; (2) development of small and medium size enterprises; (3) protection and sustainable management of natural resources; (4) consolidation of public administration reform; (5) pursuance of reform of the business environment; (6) development of the financial sector; (7) development of infrastructures; (8) promotion of democratic governance and public freedoms; (9) capacity building for the civil society; (10) strengthening of regional and sub-regional integration initiatives; (11) creation and promotion of long-term jobs; (12) development of access to basic services; (13) HIV/AIDS control; and (14) integration into the Multilateral Trade System.
Implementation, Monitoring and Evaluation 21. It is necessary to clarify and simplify the institutional mechanism. The PRSP
institutional mechanisms will comprise: (i) a Policy Committee, (ii) a Mali -Development Partners Joint Commission, (iii) a National Steering Committee, and (iv) a PRSP Technical Unit, which will be strengthened. The PRSP process will be conducted and coordinated by the Ministry responsible for the Economy.
22. As regards methods, the PRSP evaluation calls for a review of the number and nature of the proposed indicators by component or thematic area for better legibility and greater relevance.
Presentation of PRSP II 23. This document presents the results of the work done by the central and
deconcentrated administration, in constant collaboration with all partners: civil society, private sector and technical and financial partners. It comprises about ten chapters which cold be divided into five main parts:
• Presentation of the poverty situation in Mali and the results of the first PRSP 2002- 2006;
• Presentation of the key objectives and general framework within which the new PRSP will be implemented: the macro-economic framework and the budgetary framework for 2007 to 2011;
• Presentation of strategies and policies through the strategic orientations, priority areas and details of sector policies;
• Accelerated growth strategy including cross-cutting issues (population, gender, and territorial development); and
• Lastly, presentation of coordination and monitoring-evaluation mechanisms, with monitoring-evaluation indicators, implementation of the Paris Declaration, the Financing Plan, and the Logical Framework of the 2nd Generation PRSP.

GPRSP 2007 – 2011 Page 17 of 224
2. INTRODUCTION 24. The challenge which Mali has to take up to reduce poverty is first that of
creation of wealth through strong and sustained growth. This growth is a prerequisite for the redistribution of wealth for the welfare of the Malian population.
25. Consequently, the 2nd generation PRSP 2007–2011 is known as the “Growth and Poverty Reduction Strategy Paper (GPRSP)” and has two major objectives:
• promote strong annual growth of 7.0%, by generating wealth and creating jobs in growth-oriented sectors of the national economy, such as rural production (agriculture, livestock, fisheries, agro-forestry, fruits and vegetables), the mining and energy sector, and the goods and services sector (trade, tourism, culture and NICT). These growth-oriented sectors require explicit energy strategies that consider all forms of energy (motive force, pumping, new and renewable sources of energy, etc). Real control of population growth and better redistribution of the created wealth will help to reduce inequalities and distortions of access to basic social services, which are the main causes of growing poverty.
• improve the functioning of public services by pursuing, consolidating and deepening reforms initiated at the institutional level (decentralization and deconcentration), democratic governance (democracy, fight against corruption and establishment of the rule of law), the economic level (micro-finance and the private sector) and improvement of the social sector (in particular, education, health, drinking water, employment and training, and HIV/AIDS control).
26. During PRSP I, priority was given to allocation of budgetary resources to social sectors, in general. In PRSP II, while continuing with these sectors, emphasis will be laid on the implementation of structural reforms and investments to support growth-oriented sectors, such as rural production, mining, infrastructure and the environment.
27. To ensure sustained growth and sustainable poverty reduction, development should be anchored on the decentralization of government action to the local level and on territorial development which will help to tap the existing economic, human and environmental potential, mitigate constraints and territorial imbalances, and revitalize local economies.
28. Ensuring consistency between national (Government) strategies and local (Local Authorities) priorities and improving production conditions in rural areas should help to create attractive development poles to reduce rural exodus of youths, particularly to urban centres. Poverty reduction also requires real control of population growth and specific attention to the redistribution of wealth by social and spatial category.
GPRSP 2007 – 2011 Page 18 of 224
3. TREND OF POVERTY IN MALI 29. Previous studies conducted in Mali revealed three forms of poverty:
• Poverty in terms of living conditions or mass poverty, which reflects a situation of lack of food, education, health care and housing.
• Monetary or income poverty, which reflects inadequate resources, leading to insufficient consumption.
• Potentiality poverty, which is defined as the lack of capital (access to land, equipment, loans and employment). This form of poverty is not well evaluated in Mali. However, the Sustainable Human Development and Poverty Reduction Observatory (OOHD) has provided indications on this form of poverty in its Development Report (2003 edition). Furthermore, the Observatory has calculated the Community Poverty Index based on the basic infrastructures of 703 municipal councils.
30. PRSP I was based on the “living conditions” approach, using the Budget Consumption Survey of 1998. On this basis, the 2002 estimate of the incidence of poverty was 64% of poor people, while the results of the Malian Poverty Evaluation Survey in 2001, based on a monetary approach, indicated 68% of poor people.
The various PRSP I evaluations show that:
31. implementation of the PRSP helped to reduce the level of poverty from 68.3% in 2001 (income base) to 59.2% in 2005, on the basis of an updated poverty line of CFAF 153,310. The goal of reducing poverty by one-quarter over the 2001-2006 period and bringing down the level to 47.5% in 2006 was therefore not achieved. The analysis shows a wide gap between rural areas (73.04%) and urban areas (20.12%). Furthermore, poverty in urban areas was reduced, since the incidence of poverty in these areas declined from 26.2% in 2001 to 20.12% in 2006, representing a decline of more than 6 points. On the other hand, in rural areas, the incidence of poverty has remained virtually stable, from 73.8% in 2001 to 73.04% in 2005. The preceding analyses therefore show that in Mali poverty is essentially a rural phenomenon;
32. the degree of poverty stood at 24.1% in 2005 as against 31.4% in 2001, which indicates some progress. This shows that the gap between the incomes of the poor and the poverty line is reducing.
33. In the same connection, the severity of poverty has reduced, from 17.6% in 2001 to 12.6% in 2005, representing a decline by 5 points.
34. The Gini index was 0.401 in 2001. The current available information does not provide a reliable indication of the trend of inequalities since implementation of the PRSP.
35. To make the PRSP process credible, it is necessary to fine-tune the analysis and measurement of poverty so as to better anchor the objectives of the second generation, particularly the trend of inequality and level of access to basic social services. Ongoing surveys (ELIM II, in particular) will help to provide more information on these aspects.

GPRSP 2007 – 2011 Page 19 of 224
36. In conclusion, it should be noted that the low level of poverty reduction during the PRSP is due to inadequate growth rate of the Malian economy, and to unequal distribution of the fruits of growth, limited access to basic services, and poor control of population growth.
4. EVALUATION OF THE PRSP 37. Adopted on 29 May 2002 following broad consultations with all the
stakeholders of the Malian society (Government administration services, the private sector, the civil society, decentralized local authorities and technical and financial partners), the first generation (2002-2006) of the Poverty Reduction Strategy Paper (PRSP) has come to an end. The PRSP evaluation presented below has contributed to better preparation for the second generation known as the “Growth and Poverty Reduction Strategy Paper (GPRSP)”, which covers the 2007-2011 period.
4.1 Evaluation of the PRSP Pillars 38. The first PRSP review, conducted on 8 and 9 June 2006, helped to assess
the trend of the macro-economic situation and sectors in terms of the various PRSP pillars.
39. During the period under review, the Malian economy was hit by exogenous factors: the conflict in Côte d’Ivoire, the upsurge in oil prices, the locust invasion and early stoppage of rainfall in 2002 and 2004. Côte d’Ivoire, Mali’s first trade partner in the sub-region, is the country through which 70% of trade transits. The conflict forced Mali to go through far-away ports like Lomé or Cotonou to obtain supplies, particularly hydrocarbons. This significantly increased the recurrent costs of transportation of imported goods, and reduced the budget revenue.
4.1.1 Macro-economic Framework 40. It was estimated that the Malian economy would record an average annual
increase of 6.7% over the 2002-2005 period. The increase was expected to reduce the incidence of poverty from 63.8% in 2001 to 47.5% in 2006. The average real GDP growth stood at 5.2% over the 2002-2005 period. A breakdown of this indicator shows a growth rate of 4.7% for the primary sector (as against 7.3% estimated), 5.3% for the secondary sector (as against 6.2%), and 4.8% for the tertiary sector (as against 5.9%). As a result, the growth objective could not be achieved.
41. Significant progress has been made in the management of public finance and macro-economic planning through: (i) implementation of programme budgets and sectoral MTEFs; (ii) application of expenditure implementation procedures manuals; (iii) interconnection of the computer networks of administrative services responsible for preparation and implementation of the State Budget; (iv) establishment of a new budget nomenclature and strengthening of controls; and (v) setting up of a Forecasts and Modelling Committee (CPM) in 2003.
42. The average inflation rate was 1.9% over the 2002-2005 period, thereby remaining below the tolerable level of 3%.

GPRSP 2007 – 2011 Page 20 of 224
43. The total external financing of the development programme recorded a significant gap, and stood at 78.4% (estimates of CFAF 1,043.6 billion). Furthermore, it should be noted that 2002 recorded the highest level of mobilization in comparison to the estimates, as a result of efforts to organize CAN 2002.
44. With respect to public expenditure, stringent management helped to maintain a budget position consistent with the objectives of the IMF staff-monitored programme. Current and capital expenditures were maintained within the limits of the programme. Delays in the disbursements of external aid led to a decline in the implementation volume and rate of the Special Investment Budget (BSI). However, in the past few years, the BSI implementation rate has been improving.
45. Over the PRSP I period, Mali complied with most of the WAEMU convergence criteria, with the exception of the base budget balance and tax ratio.
4.1.2 Institutional Development, Governance and Participation 46. With respect to improvement of the performance of public administration,
the activities concern in particular, the preparation of the Institutional Development Programme (PDI), and its Operational Plan. As regards strengthening national planning and development management capacities, the services and organs responsible for planning, statistics, macro-economic forecasts, territorial development and population have been restructured, and development management policies, tools, instruments and methods have been formulated. Furthermore, the strengthening of deconcentration, which should accompany decentralization, is a major State commitment. The financial component of this commitment is being implemented with the Government Action Plan for the Improvement and Modernization of Public Finance Management (PAGAMGFP) through budgetary deconcentration actions, deconcentration of public procurement procedures, and operational establishment of deconcentrated organization charts and organic frameworks.
47. The organization and conduct of democratic elections (presidential, legislative and municipal), within a consensual and peaceful political climate, have helped to consolidate the democratic process. The installation of the “Haut Conseil des Collectivités Territoriales” (HCCT) (Local Authorities High Council), the creation of an Inter-Ministerial Steering Committee for the Transfer of Government Powers and Resources to Local Authorities, and the establishment of a technical and financial support mechanism (CCC and ANICT) for local authorities show that decentralization has become effective. Furthermore, a National Decentralization Policy Framework Paper has been prepared and submitted to the partners. Implementation of the paper will help to consolidate the achievements of this reform.
48. Common understanding of the concept of civil society, the identification of its strengths and weaknesses, mastery of its role and responsibilities within the democratic context of Mali, and establishment of the National Civil Society Council (CNSC) are some of the factors that have helped to strengthen the capacities of this important stakeholder in the Malian society. This importance was demonstrated throughout the PRSP II preparation process by its numerous initiatives, in particular the organization of consultation workshops for the six council of Bamako and eight regions of Mali.

GPRSP 2007 – 2011 Page 21 of 224
49. In order to effectively fight against corruption, the Ministry of Justice, through PRODEJ, has taken important measures to strengthen transparency in the processing of court files and reinforce control structures. In 2003, the Government appointed prosecutors to manage economic and financial poles. In 2004, the Office of the Auditor General and judicial police officers was established. Efforts to train and recruit judicial staff, as well as control information systems for human resource management, judicial files and financial resources have helped to strengthen the capacities and credibility of the justice sector. The other control structures, namely the Accounts Section of the Supreme Court and the General Control of Public Services have also been strengthened.
50. The introduction of the culture of peace into teaching programmes, the development of traditional conflict prevention and management mechanisms, the conduct of democratic discussion forums (“Espaces d’Interpellation Démocratiques” (EID) and preservation of the secular nature of the State have helped to establish peace and security.
51. Actions have been taken to restore and rehabilitate historic sites, promote the national heritage, as well as train cultural stakeholders and staff of the Ministry of Culture. Furthermore, as a factor of economic development, the cultural sector has helped to fight against poverty in terms of creating jobs and wealth through the organization of cultural events and activities for the development of industries and cultural undertakings (music, concerts, publishing, plastic arts, and photography).
4.1.3 Human Resource Development and Access to Basic Services 52. As regards basic education, significant progress has been made in opening
schools. From 2002 to 2005, the mixed Gross Enrolment Rate recorded an increase of 9.66% (from 64.4% to 74%), and the girls enrolment rate increased by 9.70% (from 53.7% to 63.4%). The boys literacy rate has remained much higher than that of girls, due to socio-cultural constraints. The Pupil/Teacher Ratio remained constant between 2002 and 2004 (57 pupils/teacher). In 2005, it declined by 3 points, reaching a ratio of 54 pupils to a teacher. This positive development came as a result of huge investments in school infrastructure and significant recruitment of contractual teachers.
53. The achievement of PRSP objectives in health and population has been satisfactory. The extension of DTCP3 vaccination coverage for children below one year old (from 75% in 2002 to 91% in 2005) was strong during the period, and the proportion of the population living within 5 km of a functional health centre increased from 44% in 2002 to 50% in 2005. The key constraints on PRODESS implementation II are, in particular, delays in the operationalization of the Decree on transfer of Government powers and resources to local authorities, inadequate qualified staff and equipment in CSCOMs, as well as lack of a formal framework for the maintenance of equipment and infrastructure.
54. Interventions in the water sector helped to improve drinking water supply. The rate of access to drinking water increased from 57% in 2002 to 66.1% in 2005. The major problems encountered consists mainly in the non- finalization of the Drinking Water Sanitation Sector Programme (PROSEPA), the non-mobilization of adequate financing to support emergency programmes for Bamako and other areas, and the non-establishment of the Drinking Water and Sanitation Agency.

GPRSP 2007 – 2011 Page 22 of 224
55. In order to improve access to housing, the Government adopted a town planning and housing policy, leading to the formulation of a Town Planning Master Plan (SDU) and the National Housing Programme (PNL) as well as the creation of three referral institutions: (i) the “Banque de l’Habitat du Mali” (BHM) specialized in the financing of housing; (ii) the “Office Malien de l’Habitat” (OMH) (Housing Authority of Mali), a financing mechanism for assisting BHM in its policy to reduce the cost of housing, and (iii) the “Fonds de Garantie Hypothécaire du Mali” (FGHM) (Mortgage Guarantee Fund of Mali) responsible for granting mortgages and refinancing banks and financial institutions that operate in the housing sector.
56. With respect to the promotion of youth employment, 2 000 volunteers have been accepted on internship in public services. However, the primary sector continues to be the greatest provider of jobs with 83.4% of the working population, and the secondary and tertiary sectors employ 4.1% and 12.5% respectively. The employment situation in Mali, particularly youth employment, remains a major cause for concern for the Government. The high population growth (about 2.2% per year) accelerates the inflow of youths to the labour market, while growing urbanization, fuelled by rural exodus and the return of emigrants, creates a high demand for jobs.
57. As regards social development, significant efforts have been made in the establishment of structures, equipment, as well as laws and regulations for the disabled. Support to old people for access to basic social services (health care, social security) is given through the implementation of a national action plan. Significant initiatives have been taken for underprivileged persons, in particular the financing of income-generating activities, as well as providing medical care and schooling for children in difficult situations. Important reforms have been made in social security and economy. There are currently 75 mutual health insurance societies, 64 of which have been approved. The societies provide coverage for about 160,150 persons (about 1.3% of the population), all benefits included, with about 144,729 persons for sickness risk (about 1.2% of the population). As for cooperative societies, about 4,197 cooperative societies are currently registered, and are mainly in the handicraft, multifunctional, agro-pastoral, agricultural, production, consumption, housing, services, promotion of culture, and fisheries sectors.
58. As regards gender, significant efforts still need to be made to ensure the presence of women in policy-making institutions; this area has not recorded any significant development so far.
59. In Mali, the HIV/AIDS prevalence rate remains low (1.7% in 2001, according to EDSM III). However, HIV-positive cases are increasing, especially among the risk groups. The major causes of the epidemic in Mali are risky sexual behaviour, high migration flows, the extent of poverty, the very high economic and social vulnerability of women, stigmatization and marginalization of affected persons and families, and lastly risky socio-cultural practices (levirate).
60. The HIV/AIDS epidemic affects all sectors of the economy negatively through reduction of work time, loss of skilled labour, and increase in direct and indirect costs. The pandemic also has repercussions on social practices, traditions and customs. In order to significantly reduce the

GPRSP 2007 – 2011 Page 23 of 224
HIV/AIDS prevalence rate, Mali has undertaken many institutional reforms to intensify the fight against the pandemic. These efforts have resulted in: (i) the creation of an Executive Secretariat responsible for implementing, monitoring and evaluating national policy through multisector coordination; (ii) the adoption of a policy statement; (iii) the creation of a National AIDS Control High Council (HCNLS) ; (iv) the creation of sector and regional AIDS control committees; (v) modification of the composition of the National AIDS Control High Council (HCNLS) to ensure the participation of all segments of the society and attachment of HCNLS to the Presidency of the Republic of Mali; (vi) the adoption of the National Strategic Framework (CNS) for HIV/AIDS Control; (vii) the commitment to provide free Anti Retrovirals (ARV) to all AIDS patients, and (viii) the enactment of a law on HIV/AIDS on 26 July 2006.
4.1.4 Development of Basic Infrastructure and Productive Sectors 61. The results achieved in road infrastructure are significant in terms of
construction and maintenance. There were 136 kilometres (km) of rehabilitated tarred roads in 2002, 282 km in 2003, 160 km in 2004 and a provisional construction of 103 km in 2005. 246 km of roads were constructed in 2003, 232 km in 2004 and 130 km in 2005. As for modern earth roads, 5,976 km were maintained in 2002, 6 012 km in 2003, 6 059 in 2004, and 8 880 km in 2005. The priority actions under PACT concern: (i) organization and competition on the transport market, (ii) sanitation and modernization of the public transport vehicle fleet, (iii) improvement of road safety, (iv) improvement in the collection of road infrastructure charges, and (v) mainstreaming of environmental and social aspects, as well as the problem of HIV/AIDS and transport.
62. As regards airport and railway infrastructures, serious difficulties and shortcomings are still noted. The granting of concession for the railway and “Aéroports du Mali” is under way.
63. With respect to the energy policy, the overall objective was to contribute to the sustainable development of the country by providing services accessible to the greatest number of people at the least cost and by promoting socio-economic activities. This objective can be achieved only by improving the management and regulation of the energy sector and reinforcing the means of preventing energy shortages. It also requires adequate responses to the energy needs of the other sectors (particularly health and education) and populations in rural and semi-rural areas. The energy policy should meet the needs of the Ten-Year Health and Social Development Programme (PRODESS) with respect to health, of PRODEC with respect to education, or again of the 2nd Rural Development Sector Master Plan.
64. Over the 2002-2005 period, the overall access rate to electricity increased from 12% to 15.03%, and butane gas consumption increased from 2,740 tonnes in 2002 to 4,084 tonnes in 2005.
65. As regards the primary sector, positive results have been achieved in the implementation of the Government Development Programme for 50,000 hectares, the implementation of the Agricultural Sectors and Farmer Organizations Support Programme (PASAOP), the implementation of the National Rural Infrastructure Programme (PNIR), and the creation and installation of the Rural Infrastructure and Utilities Works Implementation Agency (AGETIER).
GPRSP 2007 – 2011 Page 24 of 224
66. The adoption, by Cabinet Meeting, of a National Food Security Strategy in November 2002 and a food security management institutional framework in April 2003, as well as the creation of a Food Security Commission attached to the President of the Republic and responsible for formulating and implementing food security policy show the priority given by the authorities to the issue. After a difficult year in 2004 due to drought and locust invasion, which reduced cereal production to 2,845,000 tonnes, the said production increased in 2005 to 3,399,000 tonnes, and reached its record level in 2003 (3,402,000 tonnes). In 2005, cereal production recorded a 24% increase in comparison to the average for the past five years.
67. After increasing between 2002 and 2003 (+75%), the developed areas under total control remained relatively stable at about 5,000 ha per year, representing nearly half of the development target. The overall development programme is 64,279 ha, comprising 50,000 ha under total control and 14,279 ha under partial control. The financing obtained was used in developing 70% of the areas, or 44,710 ha. On the whole, the completion rate of the proposed actions is 78%.
68. Concerning the secondary sector, the Government in 2004 adopted the industrialization policy to facilitate industrial development. The policy laid emphasis on a strategy based on incentives for investment and development of private enterprise. To that end, a number of priority actions were defined, and their implementation evaluated. The actions included:
- implementation of the Integrated Programme of Mali (PIM phase II) ; - adoption of the restructuring and upgrading programme for industrial
enterprises.
69. Interventions in the mining sector over the 2002-2005 period led to gold production of 63.7 t in 2002, 51.6 t in 2003, 44.6 t in 2004, and 52.1 t in 2005.
70. The initiatives taken to promote trade concerned: (i) support for the promotion of exports of some targeted agricultural products, (ii) support for the restructuring of the sector, (iii) improvement of the business climate, and (iv) involvement of economic operators in decisions concerning them. Sector initiatives launched by four African countries, including Mali, for the attention of WTO were aimed at eliminating all forms of subsidies for cotton and obtaining compensation of victim countries. The formulation and implementation of the Support Project for Retailers (PACD) and of the pilot project of the trade-related technical assistance integrated process helped to support retail operators.
71. Significant developments were made in micro-finance during the period. The number of local structures or service points increased by nearly 10% from 730 to more than 800. Furthermore, the number of members and/or beneficiaries of these structures increased from 522,000 to more than 820,000 persons, representing a 57% increase. One Malian out of every six of the working population benefits from local financial services, and 35% of the women are members of micro-finance structures. However, despite the favourable trends, financial exclusion remains high (82% of the working population do not have access to financial services). Decentralized Financial Systems (DFS) are still concentrated in areas with relatively high economic potential, such as Sikasso, Ségou, Mopti, Kayes and Bamako District, while the less privileged regions of the North (Gao, Timbuktu and Kidal) have

GPRSP 2007 – 2011 Page 25 of 224
limited coverage by these services. The DFS distribution by administrative region is as follows: Ségou (27%), Sikasso (20%), Bamako District (18%), Koulikoro (17%), Kayes (8%), Mopti (6%), Timbuktu (2%), Gao (1.5%), and Kidal (0.5%).
72. In order to ensure better development of the private sector, which is the engine of economic growth, the Government on 12 January 2005 adopted the Private Sector Development Policy Letter (LPDSP) on improving the investment framework and climate, and developing growth-oriented sectors such as mining, handicraft and tourism, and telecommunications. Special emphasis was laid on the development of growth-oriented infrastructures, such as industrial zones and airport facilities, as well as on the development of financial and non-financial services for Small and Medium Size Enterprises. Serious efforts have been made towards capacity building and restructuring in the private sector, with the creation of a database (Websites) on economic and trade issues in the National Employers’ Council of Mali (CNPM), the establishment, in partnership with the International Labour Office (ILO), of a programme to support competitiveness and productivity of enterprises, the creation of consular chambers comprising the Chamber of Commerce and Industry of Mali (CCIM), the Permanent Assembly of Chambers of Agriculture of Mali (APCAM), the Permanent Assembly of Chambers of Trades of Mali (APCMM), as well as the creation of an enterprises services development agency and a national sub-contracting and partnership exchange.
73. In order to tap its tourism potential, Mali has developed a cultural policy which aims at structuring the cultural heritage, so as to make it the engine of economic and social development. The Government has also updated some texts relating to the organization of the profession of travel organizers and guides; in addition, it has developed activities for the promotion of tourism. Between 2002 and 2005, Mali recorded an increase of 83% of its tourism inflow.
4.2 Links between the PRSP and Budget Instruments 74. It is accepted by all development stakeholders that the PRSP is the single
frame of reference for medium-term development policies and strategies, as well as the main instrument for negotiation with technical and financial partners. However, the various PRSP evaluations show weak links between the PRSP process and short and medium-term budgetary instruments (programme budget, overall MTBF, sector MTEFs). Efforts will be made to ensure greater harmonization between these instruments, and also between the PRSP, the Three-Year Investment Programme (PTI) and its annual tranches (BSI). There is also lack of explicit coherence between the PRSP, the sector/thematic strategies, and the State Budget. Furthermore, there is poor synergy between the PRSP and other sector policy documents as regards identification of actions for the most vulnerable groups of the population.
4.3 Links between the PRSP and the MDGs 75. Similarly, the absence of explicit links between the PRSP and the
Millennium Development Goals (MDG) weakens the intention of making the PRSP a medium-term action plan to achieve these goals. Consequently, it is

GPRSP 2007 – 2011 Page 26 of 224
necessary to closely align the Government’s priority actions with the MDGs. The formulation of an MDG-oriented national development strategy should therefore form an integral part of the planning and budgeting process. Such closer links also requires an inventory of previous and existing strategic planning documents, and evaluation of the quality of monitoring and evaluation tools for measuring progress in the achievement of the MDGs.
4.4 Links between the PRSP and the National Prospective Study Mali 2025
76. The operationalization of the National Prospective Study (ENP Mali 2025), adopted by the Government in 2000 and aimed at mobilizing all stakeholders around achievement of the development goals, requires that it should be taken into account in the preparation and monitoring of medium-term development strategic frameworks. ENP Mali 2025 showed that the perception of Malians on poverty issues could be summarized as follows: very low incomes, unfavourable natural conditions, difficulties of access to basic public services, poor management of national resources and corruption, as well as the landlocked position of the country. The study also showed that only sustained investments in agriculture, the creation of new jobs, reinforced solidarity and mutual help, and better management of resources will help to reduce poverty significantly.
77. ENP Mali 2025 also shows that by 2025, Malians will be aspiring for development of the country based on the primary sector, the development of agro-food industries, textiles and mining, the decentralization of public management, internal and external accessibility of country and more balanced development of the territory. These concerns and aspirations should therefore be taken into consideration when preparing and implementing the 2nd generation PRSP.
4.5 Links between the PRSP and support from Technical and Financial Partners
78. Predictability of assistance should be a key indicator in the PRSP process. With respect to harmonization of procedures, donors have made efforts to better coordinate joint monitoring and evaluation procedures, as well as strengthen co-financing agreements. Some studies, as well as measures relating to conditionalities, monitoring and evaluation have been conducted jointly, or at least in a coordinated manner. Despite these attempts, harmonization of procedures has not gone a long way since adoption of the PRSP. To ensure alignment of aid and harmonization of practices, a general framework arrangement for budget support and sector agreements were signed in 2006.
4.6 Lessons from the PRSP Monitoring and Evaluation 79. Analyses showed: low operationalization of the institutional monitoring-
evaluation mechanism and the need to strengthen the PRSP Unit and build institutional capacities with respect to the methods, tools, instruments and indicators used. They also showed the poor quality of basic statistics. The PRSP analyses show that the information system used is still incapable of accurately measuring the performance indicators.

GPRSP 2007 – 2011 Page 27 of 224
5. GPRSP OBJECTIVES AND EXPECTATIONS
5.1 Overall Goal 80. Drawing on the achievements and lessons of PRSP I implementation, the
2nd generation, known as the Growth and Poverty Reduction Strategy Paper (GPRSP), has the overall goal of giving impetus to strong and sustained growth (about 7% per year) and significant poverty reduction. Monetary poverty should also reduce by 5 percentage points over the five-year period. To achieve this level of growth, special attention will be paid to revitalization of the productive sectors and consolidation of the public sector reform process, which will be based on administrative decentralization and promotion of private sector initiatives. Through public sector reform, PRSP II will also consolidate economic and political good governance.
5.2 Specific Objectives 81. More specifically, the GPRSP aims at:
• accelerating economic growth, mainly through development of rural and mining production sectors;
• improving the well-being of the Malian populations by pursuing efforts in social sectors, and enhancing them through reforms towards achievement of the Millennium Development Goals (MDG).
5.3 Expectations 82. The major expectations, as drawn from the evaluation of PRSP
implementation and which can affect the achievement of PRSP II objectives, mainly concern the following points:
• continued stability of the macro-economic environment and consistency between macro-economic and budgetary forecasts, as well as external financing;
• continued peace and security throughout the national territory;
• better adaptation of the strategies, priorities and budget programming of the overall MTBF goal to those of the sectoral MTEFs (particularly in detailed sectoral action and financing plans);
• significant reduction of poverty and hunger, especially in rural areas;
• significant improvement of access by the populations, especially the poorest, to basic social services (in terms of quantity and quality) ;
• creation of a conducive environment for private sector development and pursuance of structural reforms, such as privatizations (CMDT, SOTELMA) ;
• pursuance and acceleration of Government reform in terms of decentralization, deconcentration and public finance.
6. STRATEGIC ORIENTATIONS 83. In order to achieve the overall goal and specific objectives of PRSP II, three
strategic orientation pillars were defined: (i) development of the productive sector, (ii) pursuance and consolidation of structural reforms, and (iii) strengthening of the social sector. These objectives will be divided into areas of intervention that would ensure coherence between the key choices
GPRSP 2007 – 2011 Page 28 of 224
in terms of medium-term development objectives and annual and multi-year strategies to be defined and implemented at the sectoral and inter-sectoral levels. Furthermore, achievement of PRSP II objectives requires a stable macro-economic framework, as well as sound and transparent management of public resources, which depends on economic and judicial good governance.
6.1 Development of the Productive Sector 84. This pillar comprises the following priority areas of intervention:
• Food security and rural development;
• Development of small and medium size enterprises;
• Protection and sustainable management of the environment and natural resources;
• Development of infrastructure;
• Pursuance of reform of the business environment; and
• Development of the financial sector.
85. The last two areas of intervention form part of the structural reforms to be pursued to enable the private sector to better play its role in boosting growth.
86. The creation of wealth, which will help to reduce the poverty, will come from acceleration of economic growth. In Mali, the bases for such growth are mainly: rural production sub-sectors (agriculture, livestock, fisheries, fruits and vegetables, and agro-forestry), mining, trade, tourism, handicraft and culture. These sub-sectors, which constitute the basic elements of the national economy, should play a more important role in the achievement of food security and contribution to wealth creation. It should be noted that the cross-cutting role of energy in all these rural production sub-sectors is fundamental to ensuring sustainable growth in rural areas. The same applies to telecommunications, as well as information and communication technologies (ICT), which have, in the past two years, played a key role in economic activity at all levels, and boosted GDP growth.
87. Promotion of growth through the productive sector will depend on efforts in structural reforms implementation, especially the quality of the business environment, increased private investment, and success of the ongoing privatizations. The Growth Sources Support Project (PASC) will contribute to it by improving the business climate, supporting the establishment of a new investment promotion agency, and providing assistance for the privatization of SOTELMA. Emphasis on the productive sectors will be reflected by the budget allocations of the proposed PTI.
88. In the past, the privatization of public enterprises encountered difficulties due to weaknesses in the preparation of files, problems in negotiation and looking for partners, and delays in the transfer of assets. A guarantee fund and the National Investment Fund still have to be established to meet the financing needs of the private sector.

GPRSP 2007 – 2011 Page 29 of 224
89. Competitiveness of the private sector is hampered by: (i) the high cost of transport and infrastructures (nearly 40% of the cost of an investment project is used for land development alone), and (ii) logistic constraints due to the fact that trade facilitation is not adapted to transport services. National and regional legal instruments will be applied equitably, in particular Regulation No. 14/2005/CM/UEMOA relating to the size and axle load of transport vehicles. Poor management, lack (very often) of quality policy for manufactured products, ignorance of the markets of developed countries and opportunities offered by multilateral and bilateral agreements, and the production equipment which is often dilapidated and poorly maintained are some of the major obstacles for the private sector. Consolidation of the outputs of the WAEMU Programme for the “Establishment of a Quality Accreditation, Standardization and Promotion System” will help to remedy these weaknesses. The same applies to the enhancement of productive capacities through the development of Securities Chains.
90. The Agricultural Orientation Law (LOA) will serve as basis for the general rural development policy of the country by 2025. It will be the guiding and single instrument for policies relating to agriculture, livestock, fisheries and forestry. The overall goals mainly concern the country’s food self-sufficiency or the country’s choice to produce the bulk of its food products on its territory by opting for sustainable methods of production, modernization of family farming, development of agro-industry, environmental protection and natural resource management for sustainable development.
91. The private sector needs financial assistance to be effective, and to fully play its role. All poverty reduction policies should take into account the need to broaden access to financial services so as to eliminate one of the major constraints on the economic and social development of the poorest population, namely financial capital. The PDSF should improve the viability of the financial sector, make it more efficient and competitive so that it can sustain diversified growth of the private sector.
92. Concerning the other sectors (trade, handicraft, tourism and culture), efforts will be made to improve productivity levels by establishing industrial, transport and communication facilities, diversifying them and pursuing the gradual transfer of some functions to the private sector within an enabling environment for investment.
6.2 Consolidation of Public Sector Reforms 93. This pillar comprises the following priority areas of intervention:
• Consolidation of public administrative reform;
• Pursuance of reform of the business environment;
• Development of the financial sector;
• Promotion of democratic governance and public freedoms;
• Capacity building for the civil society; and
• Strengthening of regional and sub-regional integration initiatives.

GPRSP 2007 – 2011 Page 30 of 224
94. In order to achieve the development goals, the Republic of Mali will pursue the implementation of reforms on the structure and functioning of the Government and its institutions. To that end, the Government will place the concerns of users at the core of institutional reforms that will be conducted by the Institutional Development Programme (PDI). This Programme seeks to carry out profound changes in public management. The reforms, some of which were initiated several years ago, should be reinforced during PRSP II implementation. Concrete results were achieved in terms of institutional change by the end of PRSP I, but major difficulties were noted in the ensuring consistency between the choices for reforms and their implications on the strategies and programmes of productive and social sectors.
95. In PRSP I, “institutional development, improvement of governance and participation” appears as the primary strategic pillar to achieve the poverty reduction objective. This option, which paved the way for profound change in public management, can, in view of the outputs, focus on the following pillars: (i) decentralization and deconcentration of administrative services to bring the administration closer to the people, and therefore make it more efficient; (ii) reform of justice to reinforce the rule of law, (iii) fight against corruption, (iv) improvement and modernization of public finance management, and (v) reform of the financial sector to enhance efficiency in the business environment. In addition to these pillars, mention should also be made of regional and sub-regional integration, which is a choice made by Mali since its independence.
96. In public finance, more particularly, many measures were taken during PRSP I: (i) harmonization of the salary scales of all public service corps, and review of the retirement age, (ii) significant increase of some items contrary to initial trends (particularly, communication and energy expenses) so as to take into account the real level of consumption of public services and avoid outstanding payments prejudicial to SOTELMA and EDM, (iii) internal resources-financed capital expenditure has increased significantly because of the start of projects and programmes totally financed with national resources, and the youth employment and low-cost housing programme. The structure of budget allocations has, however, remained consistent with the guidelines of the Poverty Reduction Strategy Paper, despite coverage of (i) the deficit of the cotton sub-sector, (ii) the payment of extra-budgetary arrears audited with the agreement of development partners, (iii) exceptional subsidy to EDM, and (iv) reimbursement of VAT credits and tax expenditure relating to exemptions for hydrocarbons, particularly for mining companies.
97. In the PRSP II macro-economic framework, the budget policy will continue with adjustment efforts to improve revenue, control public expenditure and search for external financing in accordance with budget support modalities and commitments of the Geneva Round Table of 30-31 March 2004.
98. Budgetary aid is the instrument for financial cooperation between the Government of Mali and TFPs which makes it possible to: (i) better coordinate their activities and gradually substitute the multiple donor procedures with national procedures, and (ii) examine concrete ways of harmonizing programmes and procedures, so as to prepare gradual reorientation of part of international aid in the form of programme aid through the budget.

GPRSP 2007 – 2011 Page 31 of 224
99. As regards the mining sector, a single Mining Code will be adopted to control tax assessment and ad valorem tax rate, as well as fine-tune the conditions for paying dividends. Improvement of revenue necessarily requires closer monitoring of the State portfolio, review of existing texts for better definition of land revenues, determination of an ad valorem rate for all mining companies. It also requires effective representation of the Government in the Boards of Directors, and timely communication of the conclusions of these boards.
100. During PRSP II, the salary policy will remain unchanged, and will, through a systematic approach, be integrated into the budget process on the basis of some key indicators (available resources, cost of living, comparisons with the private sector, productivity and priority objectives). The scope of these salary increases should be linked to structural reform efforts. To that end, incentive structures will be established to: (i) promote merit rather than seniority, (ii) streamline bonuses and allowances, (iii) relax salary scales so as to offer appropriate motivation to qualified staff, and (iv) mainstream poverty reduction objectives, such as services in remote areas.
6.3 Strengthening of the Social Sector 101. This pillar comprises the following priority areas of intervention:
• creation and promotion of long-term jobs;
• development of access to basic social services; and
• HIV/AIDS control.
102. Economic development requires sustained social development and achievement of the MDGs, which mainly implies continuation of the efforts made during PRSP I in education, health, solidarity, social protection and well-being of the Malian populations. The MDGs cannot be achieved without making a link between the indispensable contribution of energy (lighting, cooking, refrigeration, communication, motive force, pumping) and all rural productive sectors.
103. Creation and access to jobs, especially for the youths, as well as job security are major concerns for all Malian families. Implementation of the National Employment Policy (PNE) will help to solve the problem of unemployment. A long-term solution for this problem requires that training should be tailored to labour market needs.
104. The consolidation of peace and security throughout the country, along with pursuance of dialogue with social partners under the Solidarity Pact for Growth and Development (see Box 1) is a top priority for the Government in its efforts to achieve the objective of decent work in Mali.

GPRSP 2007 – 2011 Page 32 of 224
Box 1 : Solidarity Pact for Growth and Development
The administrative reform in Mali from 1969 to 1990 was aimed primarily at reducing the recurrent costs of the Administration in the State Budget. This approach, which was praiseworthy in itself, was implemented by reducing the number and size of public services, introducing organizational frameworks, liquidating structurally deficit public enterprises, etc. The main criticism against the reform process in Mali is that it ignores the human aspect. Indeed, the reform never really addressed the issue of motivation for Government employees. Essential notions, such as management of rare skills that remained in the public sector after the voluntary separations, were never clearly addressed.
Indeed, the salaries of Malian government employees (despite efforts made by the Government since 1991) have remained low, and are among the lowest in the sub-region. In addition, with the support of powerful trade unions or under the guise of special factors, some categories of Government employees were granted very attractive salary scales or bonuses and allowances of amounts often above the salaries of their counterparts in other sectors. These iniquities were coupled with widespread demotivation.
The Government of Mali, in the social dialogue precedent to implementation of the National Economic Development Programme, proposed the preparation of a Solidarity Pact for Growth and Development to social partners in its General Policy Statement of 6 May 2000. The Pact, adopted following discussions, is designed as a programme of action and contains the following elements:
1. In order to improve living and working conditions, the Government proposes to develop a single salary scale for all civil servants, except special status for certain corps (Magistrates, Army, and Police) and higher education.
2. Furthermore, in implementing the organizational frameworks, the Government undertakes to: (i) recruit an adequate number of civil servants; (ii) provide training and further training to staff of the administration; and (iii) prepare a career plan for each corps of civil servants.
3. As regards social security, measures will be taken to establish a real social security plan for civil servants, review texts relating to coverage of medical expenses for old people, improvement of the level of pensions, and stabilization of the financial situation of organizations responsible for paying social benefits.
4. To ensure safety for employees at work, the Pact provides a series of measures to protect workers against aggressions by users and risks of occupational accident.
5. The trade unions undertake to take measures to increase the output and quality of service by workers.
All the commitments made in the Pact will be implemented within a multi-year programme according to a schedule, updated each year. These measures are intended to improve the quality of remuneration within a context of sub-regional integration and fight against corruption.
GPRSP 2007 – 2011 Page 33 of 224
105. Studies show that limited access to basic public services is one of the main causes of the situation of poverty. Improved access to basic social services (education, health, drinking water, and decent housing) will help to strengthen the social sector. It is also important to note that decentralization and support for institutional devolution to the local level are conditions for achievement of the MDGs. The MDGs should have quantified targets as regards access to energy and telecommunication services (Television, Radio, Telephone, Internet, and Post Office).
106. The fight against HIV/AIDS and the worst forms of child labour, the promotion of gender through greater empowerment of women in public management, and the promotion of solidarity with the underprivileged social groups are conditions for equitable, harmonious and sustainable development.
107. Under PRSP I, several actions were proposed to integrate demographic variables, which would allow for achievement of the objectives of the national population policy, namely issues relating to HIV/AIDS, the needs and rights of youths, the needs and rights of old people, the vulnerable groups of the population, and access to basic services. On the other hand, some issues relating to population trends were not developed. PRSP II provides for better mainstreaming of: (i) control of population growth with advocacy to policy makers and opinion leaders, (ii) the crucial problem of external and internal migratory flows, as well as transfers of funds by Malians from abroad, (iii) gender equity and equality, (iv) the role of communities in PRSP II implementation, (v) the issue of inequalities between the regions, (vi) environmental issues, and (vii) the territorial development policy.
108. Since 2006, Mali has a National Programme for combating the worst forms of child labour. The programme, which covers the 2006-2010 period, includes measures to prevent the involvement of children in actions identified as one of the worst forms, as well as measures intended to withdraw, protect and ensure the socio-economic reintegration of children. The programme seeks to establish a link between the strategic orientations of the fight against child labour, PRSP II and the various sector policies, such as those for education, health and justice.
7. MACROECONOMIC AND BUDGETARY FRAMEWORK 2007 – 2011
7.1 Assumptions of Framework Estimates 109. The main objective of the macro-economic and budgetary framework
is to maintain macro-economic and budget balances, taking into account the real potential of the Malian economy, as well as PRSP overall and sector goals.
110. To that end, a voluntarist scenario was selected to guide the preparation of sector policies and implementation of the country’s development policies by 2011. This voluntarist scenario (known as PRSP II scenario) makes assumptions of highest growth for growth-oriented sector, namely 7% per year on average, and enhanced tax system complying with the target of WAEMU tax pressure rate of 17% at least as from 2008.
111. The macro-economic framework was prepared by the Forecasts and Modelling Committee (CPM). The modelling and macro-economic framework was based on the Macro-economic Model of Mali (MME) and the

GPRSP 2007 – 2011 Page 34 of 224
medium and long-term forecast and simulation model Threshold 21 (T21). Details of the macro-economic framework are presented in ANNEX I.
112. The overall Medium-Term Budgetary framework (MTBF) was based on the results of the macro-economic framework (ref. ANNEX II).
113. The macro-economic and budgetary frameworks take into account the strengths and weaknesses of the first PRSP, and are based on the real productive capacity of the national economy, as well as internal and external potential risks. They also take into account the major international and regional development objectives, in particular, Mali’s commitments to the MDGs and WAEMU.
114. The assumptions of the macro-economic framework on the international environment, regarding commodity prices, world inflation, and exchange rates, refer to IMF projections.
115. The analysis between economic growth and poverty using model T21 shows that with the current structure of the Malian economy, an average growth rate of 6.5% (in terms of GDP at factor costs) in five years would help to reduce the rate of monetary poverty by 6 percentage points by 2011, representing an annual decline of 1.2%.
7.2 Main Results of the Framework The Table below presents the major results (voluntarist scenario). Table 1: Indicators of Macro-economic Performance and Decision-making Criteria Average
2002-2005
2006 2007 2008 2009 2010 2011 Average 2007-2011
Resources and Appl. of Funds for Goods & services
GDP at market prices (current CFAF billion) GDP at market prices (current $ billion)
2550.3 4.5
3205.8 6.1
3419.4 6.7
3653.0 7.0
3895.0 7.7
4196.9 8.3
4493.8 9.0
3931.6 7.8
GDP at market prices (current € billion) 3.9 Contribution of informal sector to GDP (in % GDPf) 39.9% 38.0% 38.0% 38.0% 39.0% 39.0% 39.0% 38.6% Real growth rate of GDP at market prices 5.2.% 3.6% 7.0% 6.6% 6.5% 7.8% 7.1% 7.0% Real growth rate of GDP at factor costs 4.6% 4.4% 6.5% 6.1% 6.2% 6.7% 6.8% 6.5% - Primary sector GDP - Secondary sector GDP - Tertiary sector GDP
4.7% 5.3% 4.8%
5.0% 5.9% 2.9%
5.5% 7.1% 7.2%
5.6% 6.0% 6.8%
5.6% 6.4% 6.7%
5.7% 6.7% 7.7%
5.9% 7.0% 7.5%
5.7% 6.6% 7.2%
Total GFCF ( current CFAF billion) 443.8 671.6 659.1 717.8 780.8 851.9 937.6 789.4 -Private GFCF (current CFAF billion) -Public GFCF (current CFAF billion)
255.9 188.0
351.7 319.9
376.7 282.5
400.7 317.2
425.9 354.9
454.4 397.6
505.2 432.4
432.5 356.9
Gross investment rate (I/GDPm) 21.4% 21.4% 19.7% 20.1% 20.5% 20.7% 21.2% 20.4% Fixed investment rate (GFCF/GDPm) 17.6% 20.9% 19.3% 19.7% 20.0% 20.3% 20.9% 20.0% Public GFCF in % of GDPm Private GFCF in % of GDPm
7.4% 10.2%
10.0% 11.0%
8.3% 11.0%
8.7% 11.0%
9.1% 10.9%
9.5% 10.8%
9.6% 11.2%
9.0% 11.0%
Marginal capital coefficient 14.5 2.0 3.2 2.9 3.0 2.6 2.9 2.9 Internal savings rate (in % of GDPm) External savings rate (= balance of BP/GDPm res.) Gross national savings rate (in % of GDPm)
15.2% 6.2%
14.8%
15.9% 5.5%
17.1%
13.9% 5.8%
15.1%
14.4% 5.7%
15.2%
15.0% 5.4%
15.7%
14.5% 6.1%
15.3%
14.1% 7.1%
14.8%
14.4% 6.0%
15.2% Consumption rate (in % of GDPm) 84.8% 84.1% 86.1% 85.6% 85.0% 85.5% 85.9% 85.6% -Private consumption rate -Public consumption rate
73.4% 11.4%
71.2% 12.9%
73.4% 12.7%
73.5% 12.1%
73.0% 12.0%
73.4% 12.0%
73.7% 12.2%
73.4% 12.2%
Per capita Gross National Product in current CFAF Per capita Gross National Product in constant CFAF (1987) Per capita real growth rate of Gross National Product Per capita Gross National Product in US $
225096
112020 2.6%
395
269324
119061 2.5%
516
279650
123426 3.7%
548
289717
127589 3.4%
571
300315
132145 3.6%
595
315076
138647 4.9%
627
328400
144573 4.3%
656
302632
133276 4.0%
599 Balance of Payments Import rate (in % of GDPm) current prices Export rate (in % of GDPm) current prices Trade deficit (fob) in % of GDPm Balance of resources (X-Mcaf) in % of GDPm Current account (excl. off. Transf) in % of GDPm
33.7% 27.5% -0.3% -6.2% -8.6% -6.6%
32.4% 26.9% -1.1% -5.5% -7.4% -4.3%
33.6% 27.8% -1.1% -5.8% -7.3% -4.6%
33.6% 28.0% -1.1% -5.7% -7.0% -4.9%
33.7% 28.2% -1.1% -5.4% -6.7% -4.7%
33.5% 27.3% -1.7% -6.1% -7.3% -5.4%
33.5% 26.4% -2.5% -7.1% -8.2% -6.4%
33.6% 27.5% -1.5% -6.0% -7.3% -5.2%
Net reserves in months of import caf Gross reserves in months of imports caf
5.5 8.3
5.7 7.8
5.6 7.6
5.6 7.5
5.4 7.2
5.3 6.9
5.3 6.9
5.4 7.2
Debt service ratio in % of exports B & SNF 8.1% Public Finance Tax pressure rate (=Tax revenue/GDPm) Tax rate (current revenue, excl. grants, in % of GDP)
14.6% 17.2%
14.7% 16.8%
14.9% 17.0%
17.0% 19.7%
17.0% 19.7%
17.0% 19.7%
17.2% 19.9%
16.6% 19.2%

GPRSP 2007 – 2011 Page 35 of 224
Average 2002-2005
2006 2007 2008 2009 2010 2011 Average 2007-2011
Tax rate (current revenue in % of GDP formal sector) Total expenditure and net loans, in % of GDP Balance of current operations (national public savings) in % of GDP Balance of current operations (own savings) in % of GDP Primary balance (=own public savings excl. interests) in % of GDPm Primary budget balance (IMF) in % of GDP Primary budget balance (WAEMU) in % of GDP Tot. balance (commit. base) excl. grants in % of GDP Tot. balance (commit. base) incl. grants in % of GDP Total balance (cash base) in % of GDP
47.7% 23.8%
7.3%
3.9%
4.6%
1.4 0.2%
-6.7% -2.6% -2.5%
49.0% 27.0% 40.5%
3.5% 4.2% 0.6%
-0.6% -10.2% 27.3% 27.3%
49.5% 27.3% 8.1% 3.6% 4.0% 0.2%
-1.3% -10.2%
-5.3% -5.3%
57.5% 27.0% 10.6%
6.4% 6.7% 2.9% 1.3%
-7.3% -2.8% -2.8%
56.3% 26.9% 10.5%
6.5% 6.8% 2.9% 1.4%
-7.2% -2.9% -2.9%
56.9% 26.9% 10.6% 6.5% 6.8% 3.0% 1.5%
-7.1% -2.8% -2.8%
57.7% 27.1% 10.7% 6.6% 6.9% 3.1% 1.6%
-7.1% -2.9% -2.9%
55.6% 27.0% 10.1% 5.9% 6.2% 2.4% 0.9%
-7.8% -3.4% -3.4%
Monetary Situation Treasury debt (growth rate) Economy debt (growth rate) Growth of money supply
35.8% 11.4% 15.2%
280.6% 3.2% 1.5%
-36.1% -3.3% 5.3%
117.4% 17.2%
5.4%
62.6% 19.6%
5.3%
51.6% 20.5% 6.2%
38.2% 17.6% 5.6%
46.7% 14.3% 5.5%
Money circulation velocity (GDP/MS, end of period) Liquidity rate (MS/GDPm)
3.4 29.4%
3.8 26.6%
3.8 26.3%
3.9 25.9%
3.9 25.6%
4.0 25.2%
4.0 24.9%
3.9 25.6%
Prices and exchange rate World inflation (MUV) Consumer price index of Bamako households GDP deflator (growth rate) Terms of trade (1987=100) Exchange rate CFAF/SDR (end of period) Exchange rate CFAF/US$ (end of period) Exchange rate CFAF/US$ (mid period) Exchange rate CFAF/€ (mid period)
3.5% 1.8% 1.9% 69.2
787.4 547.0 582.2 656.0
1.6% 2.4% 6.3% 73.8
756.7 522.3 522.3 656.0
1.2% 0.2% 0.2% 78.2
738.9 509.9 509.9 656.0
1.2% 0.5% 0.2% 81.7
734.9 507.2 507.2 656.0
1.2% 0.3% 0.1% 85.3
731.7 505.0 505.0 656.0
1.2% 0.2% 0.0% 86.6
728.6 502.9 502.9 656.0
1.2% 0.2% 0.0% 86.7
725.7 500.8 500.8 656.0
1.2% 0.3% 0.1% 83.7
732.0 505.2 505.2 656.0
Real exchange rate index (IP_M/IP_GDP; + devaluation)
126.7 125.9 123.5 122.9 122.7 122.5 122.4 122.8
External Aid External aid (gross) in % of GDP External aid (net) in % of GDP External aid (gross) in US$ million External aid (net) in US$ million External aid (gross) in US$ per capita External aid (net) in US$ per capita
9.2% 7.2% 407.0 319.3
36.0 28.2
46.5% 12.7% 2853.8
778.9 236.8 64.6
10.5% 9.6% 706.7 643.2
57.1 52.0
10.1% 9.2% 728.6 660.5
57.3 52.0
10.0% 9.0% 769.3 696.0 58.9 53.3
10.0% 9.0% 834.0 754.2
62.2 56.2
10.0% 9.0% 896.6 809.9
65.0 58.8
10.1% 9.2% 787.0 712.8
60.1 54.4
WAEMU Convergence Criteria First rank criteria Ratio
2006 2007 2008 2009 2010 2011
Base budget balance/GDPm ratio Inflation rate (IHPC Bamako) Outstanding internal and external debt/GDPm ratio Incl. outstanding external debt/GDPm Variation of internal arrear payments (in CFAF billion) Variation of external arrear payments (in CFAF billion)
0.2% 1.8% 0.0% 64.3% 0.0 0.0
-0.6% 2.4% 0.0% 23.3% 0.0 0.0
-1.3% 0.2% 0.0% 24.9% 0.0 0.0
1.3% 0.5% 0.0% 25.2% 0.0 0.0
1.4% 0.3% 0.0% 23.6% 0.0 0.0
1.5% 0.2% 0.0% 21.1% 0.0 0.0
1.6% 0.2% 0.0% 18.2% 0.0 0.0
0.9% 0.3% 0.0% 22.6% 0.0 0.0
Second rank criteria Wage bill/tax revenue ratio Public investments financed with internal resources/tax revenue ratio Current external deficit excl. public transfers/GDPm ratio Tax pressure rate (=Tax revenue/GDPm)
30.7% 21.9% -8.6% 14.6%
31.7% 25.8% -7.4% 14.7%
31.5% 22.5% -7.3% 14.9%
28.1% 22.5% -7.0% 17.0%
28.2% 22.5% -6.7% 17.0%
28.8% 22.5% -7.3% 17.0%
28.8% 22.5% -8.2% 17.2%
29.1% 22.5% -7.3% 16.6%
1) Revenue (excl. grants) less total expenditure (incl. net loans) (excl. capital expenditure with ext. financing and excl. HIPC)/GDPm 2) Here only BSI investment Source: DNPD, MME-DNPD model
7.3 Public Finance 116. Public finance programming for 2007 corresponds to that of Finance
Law 2007. The estimates of the Government Flow of Funds Table (GFFT) for 2008-2011 by the MME model correspond to MTBF projection.
117. The results of the macro-economic framework show significant improvement of tax pressure that ensures achievement of Community standards in public finance, particularly the tax pressure rate of 17% as from 2008. To comply with this last Community standard and support the assumptions of increased investments, the Government should make more efforts in collecting tax revenues.

GPRSP 2007 – 2011 Page 36 of 224
118. With respect to public finance, Government policy would be boosted in the medium term by activities proposed in the Government Action Plan for the Improvement and Modernization of Public Finance Management (PAGAMGFP). This would enhance public finance adjustment efforts through control of expenditure and greater mobilization of internal revenue.
Table 2: Consolidated Budget of Public Finance and its Financing (GFFT)
Average 2002-2005
2006 2007 2008 2009 2010 2011 Average 2007-2011
Total revenue and grants 542.6 1740.0 749.4 881.4 935.6 1008.0 1088.3 932.6 Total revenue 438.5 540.0 582.4 718.6 768.6 828.5 896.3 758.9 Budgetary revenue 398.7 497.5 535.4 663.5 708.5 765.9 829.5 700.6 Tax revenue Non-tax revenue
373.7 25.1
469.9 27.6
509.5 25.9
621.0 42.5
662.2 46.4
713.5 52.4
773.6 55.9
655.9 44.6
Sp. Fd & suppl. Budgets Revenue 39.1 42.5 47.0 55.0 60.0 62.6 66.8 58.3 Grants 104.1 1200.0 167.0 162.9 167.1 179.5 191.9 173.7 Grants for projects 67.5 81.3 93.0 102.4 110.1 119.5 129.3 110.9 Budgetary grants 36.6 35.8 24.8 25.0 25.2 25.3 25.5 25.2 Sectoral budget support 47.2 49.2 35.5 31.8 34.7 37.1 37.7 MDRI debt restructuring 1035.7 0.0 0.0 0.0 0.0 0.0 0.0 Expenditure and net loans 608.5 865.6 932.3 984.5 1048.0 1127.6 1216.7 1061.8 Budgetary expenditures 567.5 828.7 890.9 933.5 992.4 1069.3 1153.9 1008.0 Current expenditures 338.8 427.0 459.5 484.7 515.5 555.0 598.6 522.7 Salaries 114.8 149.0 160.5 174.2 186.4 205.4 222.6 189.8 Goods and services 123.5 161.1 181.8 189.9 204.8 221.7 244.3 208.5 Transfers and subsidies 81.4 96.8 103.7 109.0 113.0 117.1 121.6 112.9 Interests due 19.0 20.1 13.5 11.6 11.3 10.8 10.1 11.5 Internal debt External debt
2.3 16.8
2.6 17.5
1.7 11.8
1.6 10.0
1.5 9.8
1.4 9.4
1.4 8.7
1.5 9.9
Capital expenditure 228.7 401.7 431.4 448.8 476.9 514.3 555.3 485.3 External financing Borrowings Overall grants Sectoral budget support Internal financing 1)
146.6 79.1 67.5
0.0 82.1
280.7 152.2
81.3 47.2
121.0
295.1 152.9
93.0 49.2
136.3
303.9 166.0 102.4
35.5 144.9
322.1 180.2 110.1
31.8 154.8
351.9 197.7 119.5
34.7 162.4
382.4 216.0 129.3
37.1 172.9
331.1 182.6 110.9
37.7 154.3
Sp. Fd & Suppl. Budgets Expend. 39.8 42.5 47.0 55.0 60.0 62.6 66.8 58.3 Net loans 1.2 -5.6 -5.6 -4.0 -4.4 -4.3 -4.0 -4.5 Primary budget balance (IMF 2) Overall balance (commits, excl. grants)
-23.4 -170.0
-44.9 -325.6
-54.8 -
349.9
37.9 -266.0
42.6 -279.5
52.8 -291.1
62.0 -320.4
28.1 -303.0
Overall balance (commitments) -165.9 874.4 -182.9
-103.1 -112.4 -119.6 -128.4 -129.3
Adjustment 1.8 0.0 0.0 0.0 0.0 0.0 0.0 0.0 Overall balance (cash base & excl. grants)
-168.3 -325.6 -349.9
-266.0 -279.5 -299.1 -291.1 -303.0
Overall balance (cash base) -64.2 874.4 -182.9
-103.1 -112.4 -119.6 -119.6 -129.3
FINANCING 64.2 -874.4 182.9 103.1 112.4 119.6 119.6 129.3 Net external financing 89.3 -845.1 159.2 172.3 185.3 201.9 201.9 186.9 Borrowings Projects Budgetary loans Amortization Debt/HIPC settlement
100.6 79.1 21.4
-39.0 27.7
200.7 152.2
48.5 -1071.7
25.9
182.9 152.9
30.0 -34.2 10.5
196.0 166.0
30.0 -34.4 10.7
210.2 180.2
30.0 -36.1 11.2
227.7 197.7
30.0 -37.9 12.1
227.7 197.7
30.0 -37.9 12.1
212.6 182.6
30.0 -36.8 11.1
Net internal financing -25.2 -43.1
23.7
-69.2 -72.9 -82.4 -82.4 -57.6
Bank (net) Privatization revenue Other financing
-3.0 10.3
-32.5
-34.0 8.1
-17.2
36.3 8.1
-20.7
-76.3 4.0 3.1
-88.3 4.0
11.4
-118.1 4.0
31.7
-118.1 4.0
31.7
-75.7 4.8
13.3 Gov’t financing gap (+=deficit) 0.0 13.8 0.0 0.0 0.0 0.0 0.0 0.0
1) Banking sector and private sector 2) Revenue (excl. grants) less total expenditure (incl. net loans) (excl. capital expenditure with external financing Source: DNPD, MME-DNPD model

GPRSP 2007 – 2011 Page 37 of 224
119. The results of the voluntarist scenario put total revenues (excluding grants) at CFAF 896.3 billion in 2011 as against 540.0 billion in 2006, representing an annual increase rate of 10.7% (as against 13.0% in 2002-2005). Tax revenues would increase at an annual average of 10.5%. In view of the average annual tax pressure rate of 14.6% in 2002-2005, this indicator would improve significantly; the Community standard would be respected as from 2008 when the tax pressure rate would be 17.0% and remain at that level until 2011.
120. Effective implementation of the measures contained in PAGAMGFP remains a prerequisite for achievement of this objective.
121. Estimates for total expenditure and net loans are also fully consistent in the macroeconomic framework and the overall MTBF. The macro-budgetary framework provides for an increase in total expenditure and net loans at the average annual rate of 7.0% to CFAF 1,216.7 billion in 2011.
122. As for the wage bill, it would increase from CFAF 149 billion in 2006 to CFAF 222.6 billion in 2011, representing an average growth rate of 8.4% as against 12.6% in 2002-2005. It would, on average, stand at 29.1% of tax revenue between 2007 and 2011, as against 30.7% between 2002 and 2005. Indeed, the WAEMU target of less than 35% has been amply attained. This also applies to the basic budget balance target, which should be positive. The balance in relation to GDP stands at 0.9% annual average for 2007-2011 as against 0.2% between 2002 and 2005. The third WAEMU criterion is also observed, namely the ratio of public investments financed with internal resources to GDP, whose minimum threshold is fixed at 20%. The budget estimates give a ratio of 22.6% on average for the 2007-2001 period as against 21.9% in 2002-2005.
123. The tables below show the sectoral breakdown of budget expenditure in CFAF billion and percentage. It should be noted that this functional breakdown of the DGB and Finance Law is different in certain respects from the GFFT nomenclature; hence the total expenditures (and revenues) are not the same1.
Table 3: Sector Breakdown of Expenditures 2007-2011 (in CFAF billion) SECTORS OF ACTIVITY 2006 2007 2008 2009 2010 2011
PUBLIC AUTHORITIES AND GENERAL ADMINISTRATION
115695 117318 128993 133177 142494 153243
DIPLOMACY AND FOREIGN AFFAIRS 16714 20265 20300 21778 23706 25455 NATIONAL DEFENCE AND INTERNAL SECURITY
68920 75633 77290 83323 93860 101587
BASIC EDUCATION 119322 122629 135451 138575 145436 159035 SEC. HIGHER EDUCATION & SCIENTIFIC RESEARCH
39169 41494 44171 47763 52004 56805
CULTURE YOUTH AND SPORTS 13051 13668 14780 115758 17150 18126 HEALTH 72684 65307 70146 72299 79797 87417 SOCIAL SECTORS 27849 36620 38799 38976 41126 43342 EMPLOYMENT 7636 7876 7698 7045 7996 8785 AGRICULTURE 118283 131192 132908 145563 158222 170297 MINING WATER RESOURCES AND INDUSTRY 53859 68353 72882 79626 85120 91030 TOWN PLANNING AND PUBLIC WORKS 99217 115376 119051 131830 140332 150908 TRANSPORT 10570 13749 14580 15969 18133 19982 COMMUNICATION 9100 10845 11945 12775 13579 14487 DOMESTIC DEBT 1637 1748 1603 1520 1446 1373 FOREIGN DEBT 61522 34239 34410 36103 37852 41513 INTEREST FOREIGN DEBT 17531 11769 10042 9783 9385 8671 UNALLOCATED FUNDS 83002 88522 79335 83189 85711 89688 TOTAL 935759 976602 1014385 1075052 1153349 1241745 Source: DGB
1 However, DGB has made reconstitution efforts to present the overall MTBF under the GFFT nomenclature (ref. ANNEX II, Tables 6, 7 and 9).

GPRSP 2007 – 2011 Page 38 of 224
Table 4: Sectoral Breakdown of Expenditure 2007-2011 in % of Total
SECTORS OF ACTIVITY 2006 2007 2008 2009 2010 2011 PUBLIC AUTHORITIES AND GENERAL ADMINISTRATION
12.4 12.0 12.7 12.4 12.4 12.3
DIPLOMACY AND FOREIGN AFFAIRS 1.8 2.1 2.0 2.0 2.1 2.0 NATIONAL DEFENCE AND INTERNAL SECURITY 7.4 7.7 7.6 7.8 8.1 8.2 BASIC EDUCATION 12.8 12.6 13.4 12.9 12.6 12.8 SEC. HIGHER EDUCATION & SCIENTIFIC RESEARCH
4.2 4.2 4.4 4.4 4.5 4.6
CULTURE YOUTH AND SPORTS 1.4 1.4 1.5 1.5 1.5 1.5 HEALTH 7.8 6.7 6.9 6.7 6.9 7.0 SOCIAL SECTORS 3.0 3.7 3.8 3.6 3.6 3.5 EMPLOYMENT 0.8 0.8 0.8 0.7 0.7 0.7 AGRICULTURE 12.6 13.4 13.1 13.5 13.7 13.7 MINING WATER RESOURCES AND INDUSTRY 5.8 7.0 7.2 7.4 7.4 7.3 TOWN PLANNING AND PUBLIC WORKS 10.6 11.8 11.7 12.3 12.2 12.2 TRANSPORT 1.1 1.4 1.4 1.5 1.6 1.6 COMMUNICATION 1.0 1.1 1.2 1.2 1.2 1.2 DOMESTIC DEBT 0.2 0.2 0.2 0.1 0.1 0.1 FOREIGN DEBT 6.6 3.5 3.4 3.4 3.3 3.3 INTEREST FOREIGN DEBT 1.9 1.2 1.0 0.9 0.8 0.7 UNALLOCATED FUNDS 8.9 9.1 7.8 7.7 7.4 7.2 TOTAL 100.00 100.00 100.00 100.00 100.00 100.00 Source: DGB
7.4 Public Debt 124. The Multilateral Debt Relief Initiative (MDRI), which entered into force
on 2 January 2006, has a stock estimated at CFAF 64.7 billion under the IMF. Contributions from the World Bank and ADB Group to the same initiative, effective since July 2006, are CFAF 706 billion and about CFAF 265 billion respectively. Indeed, Mali’s total multilateral debt has been cancelled; the cancelled debt is estimated at CFAF 1,035.7 billion. The outstanding public debt/ GDP ratio would be 22.6% on average for the 2007-2011 period as against 64.3% in 2002-2005.
125. Thus the average debt service/exports ratio would stand at 4.4% between 2007 and 2011, as against 8.1% between 2002 and 2005.
126. As for the Treasury, savings from the restructuring of MDRI debt amount to about CFAF 34 billion per year between 2007 and 2011, which is an annual gain of about 3.4% of budget expenditure (excluding external debt service).
7.5 Balance of Payments and Monetary Situation 127. The macro-economic framework provides for an average annual
growth rate of 6.6% for exports and 7.7% of imports, along with production trends for the major exports (gold and cotton) and their world market prices. Indeed, the average trade deficit would represent 1.5% of GDP as against 0.3% over the 2002-2005 period.
128. The balance of current transactions, excluding public transfers, is expected to be an average of 7.3% of GDP, as against 8.6% between 2002 and 2005. This trend would tie in with the improvement in the balance of factor services (decline in payments as interest of debt servicing and repatriations of revenue from investments) and deficit of non-factor services as a result of dynamism of the tourism sector. The balance of current transactions, including grants, would amount to an average of 5.2% in 2007-2011 as against 6.6% in 2002-2005.
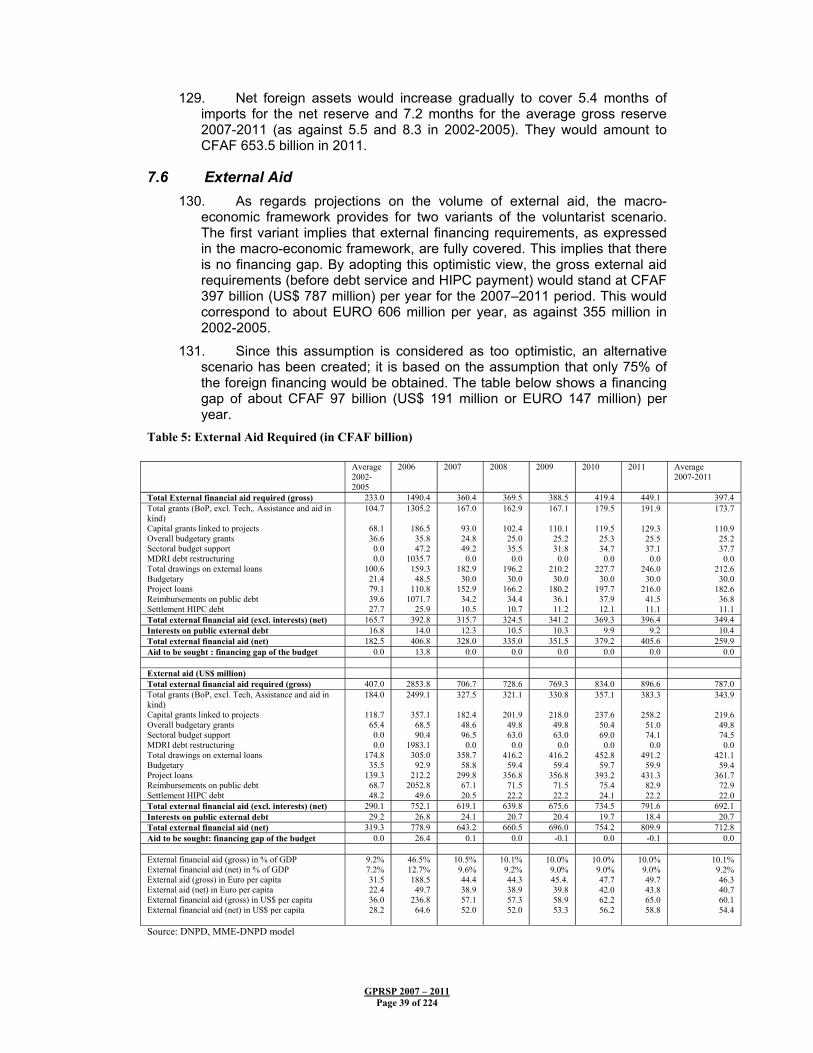
GPRSP 2007 – 2011 Page 39 of 224
129. Net foreign assets would increase gradually to cover 5.4 months of imports for the net reserve and 7.2 months for the average gross reserve 2007-2011 (as against 5.5 and 8.3 in 2002-2005). They would amount to CFAF 653.5 billion in 2011.
7.6 External Aid 130. As regards projections on the volume of external aid, the macro-
economic framework provides for two variants of the voluntarist scenario. The first variant implies that external financing requirements, as expressed in the macro-economic framework, are fully covered. This implies that there is no financing gap. By adopting this optimistic view, the gross external aid requirements (before debt service and HIPC payment) would stand at CFAF 397 billion (US$ 787 million) per year for the 2007–2011 period. This would correspond to about EURO 606 million per year, as against 355 million in 2002-2005.
131. Since this assumption is considered as too optimistic, an alternative scenario has been created; it is based on the assumption that only 75% of the foreign financing would be obtained. The table below shows a financing gap of about CFAF 97 billion (US$ 191 million or EURO 147 million) per year.
Table 5: External Aid Required (in CFAF billion) Average
2002-2005
2006 2007 2008 2009 2010 2011 Average 2007-2011
Total External financial aid required (gross) 233.0 1490.4 360.4 369.5 388.5 419.4 449.1 397.4 Total grants (BoP, excl. Tech,. Assistance and aid in kind) Capital grants linked to projects Overall budgetary grants Sectoral budget support MDRI debt restructuring Total drawings on external loans Budgetary Project loans Reimbursements on public debt Settlement HIPC debt
104.7
68.1 36.6 0.0 0.0
100.6 21.4 79.1 39.6 27.7
1305.2
186.5 35.8 47.2
1035.7 159.3 48.5
110.8 1071.7
25.9
167.0
93.0 24.8 49.2 0.0
182.9 30.0
152.9 34.2 10.5
162.9
102.4 25.0 35.5 0.0
196.2 30.0
166.2 34.4 10.7
167.1
110.1 25.2 31.8
0.0 210.2 30.0
180.2 36.1 11.2
179.5
119.5 25.3 34.7
0.0 227.7
30.0 197.7
37.9 12.1
191.9
129.3 25.5 37.1 0.0
246.0 30.0
216.0 41.5 11.1
173.7
110.9 25.2 37.7 0.0
212.6 30.0
182.6 36.8 11.1
Total external financial aid (excl. interests) (net) 165.7 392.8 315.7 324.5 341.2 369.3 396.4 349.4 Interests on public external debt 16.8 14.0 12.3 10.5 10.3 9.9 9.2 10.4 Total external financial aid (net) 182.5 406.8 328.0 335.0 351.5 379.2 405.6 259.9 Aid to be sought : financing gap of the budget 0.0 13.8 0.0 0.0 0.0 0.0 0.0 0.0 External aid (US$ million) Total external financial aid required (gross) 407.0 2853.8 706.7 728.6 769.3 834.0 896.6 787.0 Total grants (BoP, excl. Tech, Assistance and aid in kind) Capital grants linked to projects Overall budgetary grants Sectoral budget support MDRI debt restructuring Total drawings on external loans Budgetary Project loans Reimbursements on public debt Settlement HIPC debt
184.0
118.7 65.4 0.0 0.0
174.8 35.5
139.3 68.7 48.2
2499.1
357.1 68.5 90.4
1983.1 305.0 92.9
212.2 2052.8
49.6
327.5
182.4 48.6 96.5 0.0
358.7 58.8
299.8 67.1 20.5
321.1
201.9 49.8 63.0 0.0
416.2 59.4
356.8 71.5 22.2
330.8
218.0 49.8 63.0
0.0 416.2 59.4
356.8 71.5 22.2
357.1
237.6 50.4 69.0
0.0 452.8
59.7 393.2
75.4 24.1
383.3
258.2 51.0 74.1 0.0
491.2 59.9
431.3 82.9 22.2
343.9
219.6 49.8 74.5 0.0
421.1 59.4
361.7 72.9 22.0
Total external financial aid (excl. interests) (net) 290.1 752.1 619.1 639.8 675.6 734.5 791.6 692.1 Interests on public external debt 29.2 26.8 24.1 20.7 20.4 19.7 18.4 20.7 Total external financial aid (net) 319.3 778.9 643.2 660.5 696.0 754.2 809.9 712.8 Aid to be sought: financing gap of the budget 0.0 26.4 0.1 0.0 -0.1 0.0 -0.1 0.0 External financial aid (gross) in % of GDP External financial aid (net) in % of GDP External aid (gross) in Euro per capita External aid (net) in Euro per capita External financial aid (gross) in US$ per capita External financial aid (net) in US$ per capita
9.2% 7.2% 31.5 22.4 36.0 28.2
46.5% 12.7% 188.5 49.7
236.8 64.6
10.5% 9.6% 44.4 38.9 57.1 52.0
10.1% 9.2% 44.3 38.9 57.3 52.0
10.0% 9.0% 45.4. 39.8 58.9 53.3
10.0% 9.0% 47.7 42.0 62.2 56.2
10.0% 9.0% 49.7 43.8 65.0 58.8
10.1% 9.2% 46.3 40.7 60.1 54.4
Source: DNPD, MME-DNPD model

GPRSP 2007 – 2011 Page 40 of 224
Table 6: Financing Gap Average
2002-2005
2006 2007 2008 2009 2010 2011 Average 2007-2011
Total external financial aid required (gross) 233.0 1490.4 272.9 279.8 294.2 317.6 339.6 300.8 Total grants (BoP, excl. Tech,. Assistance and aid in kind) Capital grants linked to projects Overall budgetary grants Sectoral budget support MDRI debt restructuring Total drawings on external loans Budgetary Project loans Reimbursements on public debt Settlement HIPC debt
104.7 68.1 36.6 0.0 0.0 100.6 21.4 79.1 39.6 27.7
1305.2 186.5 35.8 47.2 1035.7 159.3 48.5 110.8 1071.7 25.9
125.3 69.8 18.6 36.9 0.0 137.2 22.5 114.7 34.2 10.5
122.1 76.8 18.7 26.6 0.0 147.0 22.5 124.5 34.4 10.7
125.3 82.6 18.9 23.9 0.0 157.7 22.5 135.2 36.1 11.2
134.7 89.6 19.0 26.0 0.0 170.8 22.5 148.3 37.9 12.1
144.0 97.0 19.2 27.8 0.0 184.5 22.5 162.0 41.5 11.1
130.3 83.1 18.9 28.2 0.0 159.4 22.5 136.9 36.8 11.1
Total external financial aid (excl. interests) (net) 165.7 392.8 228.2 234.7 246.8 267.5 287.0 252.9 Interests on public external debt 16.8 14.0 12.3 10.5 10.3 9.9 9.2 10.4 Total external financial aid (net) 149.0 378.8 215.9 224.2 236.5 257.6 277.8 242.4 Aid to be sought: financing gap of the budget (CFAF billion)
0.0 0.0 87.5 89.7 94.3 101.8 109.5 96.6
Aid to be sought: financing gap of the budget (US$ million)
0.0 0.0 171.5 176.9 186.8 202.5 218.6 191.3
Aid to be sought: financing gap of the budget (EURO million)
0.0 0.0 133.4 136.8 143.8 155.2 166.9 147.2
Source: DNPD, MME-DNPD model
7.7 Incidence of Poverty 132. Based on a structural analysis of the Malian economy using the T21
Model, the results of the PRSP II macro-economic framework show that with an average annual GDP economic growth rate at factor cost of 6.5%, the proportion of the population living below the monetary poverty line (CFAF 72,011 at 1987 prices per person and per year) would decline from 56.0% in 2007 to about 51.2% in 2011, representing a decline of 5 percentage points in 5 years. This represents an average annual decline of 1.2 point. It should be noted that the monetary poverty rate according to the EMEP was 68.3% in 2002.
133. This analysis on poverty presupposes an improvement in the distribution of incomes and control of population growth.
134. In view of population growth and taking into account foreign contributions to the national income (current transfers and factor services), the per capita national income would increase on average and in real terms by 4.0% between 2007 and 2011 as against 2.6% between 2002 and 2005, to a level of about CFAF 328,400 at current prices (US$ 656.) in 2011.
GPRSP 2007 – 2011 Page 41 of 224
8. PRIORITY AREAS OF INTERVENTION
8.1 Food Security and Rural Development
8.1.1 Food Security 135. The achievement of food security requires guarantee of supply of
foodstuffs to the entire population from domestic production or commercial imports. It is based on a number of key factors such as: (i) availability to facilitate supplies to areas experiencing shortages, (ii) geographic accessibility by opening up production areas, or (iii) stability of production, and (iv) optimum use of foodstuffs in accordance with the millennium goals and the world food summit objectives. It also provides for the inclusion of aspects relating to increase, diversification, and processing of products. Food security will be sought primarily through:
• significant reduction of the impact of major food crises by enhancing and broadening the food crises prevention and management system;
• promotion of sub-sectors relating to agricultural products of plant origin, livestock and animal sub-sectors, fisheries and aquaculture, silviculture, as well as promotion of farm mechanization.
136. As for implementation of the food security strategy, the two programmes below have been prepared in consultation with the technical and financial partners:
• the National Food Security Programme, which aims primarily at enhancing food security in the most vulnerable 166 municipal councils, through small development works, as well as intensification and diversification of production, improvement of the marketing, processing and conservation of products and their better use, and the prevention and management of food crises;
• the Programme to strengthen the National Food Risks Control System, which aims at consolidating and adapting the Cereal Market Restructuring Programme to the new objectives and institutional environment, a successful cooperation experience in the prevention and management of the emergency situations in food security.
8.1.2 Rural Development 137. As regards the rural development sectors (agriculture, livestock,
fisheries, agro-forestry), the challenges could be summarized as follows:
• reduction of the number of vulnerable municipal councils;
• water availability and control;
• the financing of agriculture ;
• accessibility to factors of production (farm machinery, pest control products, seeds and inputs) ;
• processing, diversification and better marketing of rural produce;
• protection of plants;
• environmental protection and preservation (urban and rural) ;
GPRSP 2007 – 2011 Page 42 of 224
• technical supervision and empowerment of rural producers; and
• access to land.
138. The rural development objective is to increase, secure and diversify food production through: (i) development of water control (irrigated agriculture through irrigation schemes, small dams, shallow water, management of pasturelands and water points), along with associated energy services (water drainage, pumping for the irrigation of farm areas, mechanization of agriculture) and (ii) adoption of intensification techniques through:
• facilitation of access to equipment and inputs (mechanization, animal draught, improved seeds, fertilizers, pest control products, animal feed, fodder, as well as agricultural and agro-industrial by-products) ;
• development of access to financing for producers and operators of the sub-sectors by increasing the availability of financial services (Rural Development Fund, National Agricultural Risks and Disasters Fund, specific lines of credit, guarantee funds, loan refinancing, incentive aid programmes, etc.) and local loan networks;
• opening up of production areas and large rural markets; and
• reinforcement of measures to prevent or control crop pests, major epizootic diseases among cattle, and poultry.
139. Under the MCA, the agricultural planning and farming in the Kouroumari water system of 16 000 ha for private farms, and the construction of the Niono-Goma Coura road covering a distance of eighty-one (81) kilometers will help to put in place a pilot framework for promoting innovative farming and investment models. This reinforcement of production capacities in the Niger Authority zone, in cooperation with MCC, will help to reduce poverty and improve the living environment of the populations. The objective of this component is to increase the incomes of farmers in Alatona through extension of irrigation schemes, land security, increased farm areas, diversification, intensification, and reduced transport costs.
140. The promotion of rural employment and fight against youth unemployment as defined in the LOA remain a common basic objective for all agricultural and food sector policies and strategies. The objective will be achieved in the agricultural, animal, piscicultural and forestry sub-sectors, which absorb job-seekers, and fruitful points of convergence between them and all categories of job-seekers will be established.
141. The rural development sectors, which are the real engines of economic growth in Mali, should, during the 2007-2011 period, contribute to the achievement of food security and increased incomes for rural producers, and therefore better living conditions for the rural population. To that end, the Government recently adopted an Agricultural Orientation Law (LOA), in addition to the Rural Development Master Plan (SDDR).
142. In addition to these orientation tools, the priority areas selected to ensure that the rural development sector contributes to the achievement of PRSP II objectives, are:
• the development of agricultural, pastoral, piscicultural and forestry production sub-sectors;
• the promotion of appropriate farm mechanization;
• the protection and management of natural resources and wildlife;
GPRSP 2007 – 2011 Page 43 of 224
• pursuance of programmes for small schemes, intensification, diversification of production, improvement of marketing and processing, conservation and better use of products, as well as prevention and management of food crises; and
• promotion of rural jobs and fight against youth unemployment.
143. The measures accompanying these priority areas concern: (i) creation of a legal and institutional framework conducive to development of the rural sector, (ii) development of access to the financing of family farm producers and sub-sector operators, (iii) assistance to the sub-sectors through research/dissemination geared towards the demands of producers and the market, and in an environment-friendly manner, and (iv) opening up of production areas and large rural markets.
8.2 Development of SMEs and SMIs 144. SME-SMIs will be developed by creating and promoting efficient and
competitive handicraft and industrial plants for the processing and marketing of agricultural and mining products. The objective of this area of intervention should be to create or increase the value added of these products, which are mainly exported as primary products. The availability of energy is a prerequisite for the competitiveness of SME-SMIs. The development of national markets and the conquest of new markets abroad should be the objectives in this area. This will make it possible to create and promote many stable jobs for youths, and contribute to integrating women more into the national economy. The new basins for creating SME-SMIs are in NICTs, tourism and telephony trades. The preparation of a real Ten-year Private Sector Development Programme and adoption of a SME-SMI Charter in Mali will offer a coherent framework for private sector development, and particularly SME-SMIs.
8.3 Management of the Environment and Natural Resources 145. Environmental protection and better management of natural resources
require the implementation of decentralized and participatory management of renewable natural resources.
146. This would consist in: (i) creating stations for the purification or depollution of liquid, solid and gaseous waste from industrial and handicraft plants in major towns, (ii) promoting the restoration and reclamation of deteriorated areas and sites, (iii) laying emphasis on the preparation of Natural Resource Management Plans, as well as local agreements for decentralized management, (iv) strengthening the control, monitoring and continued supervision mechanisms for the environment, and (v) capacity building for intervention, analysis, and communication.
147. To achieve sustainable development, the major challenges for Mali as regards the environment are:
• mainstreaming of the environment in all sectoral policies and development planning at all levels (national, regional and local) ;
• control of desertification and silting of waterways, in particular the Niger river; and
• protection of wildlife and aquatic species.

GPRSP 2007 – 2011 Page 44 of 224
148. PRSP II should contribute to achievement of the objective of the National Environmental Protection Policy, which aims at ensuring sustainable economic and social development of the country through food security, as well as the fight against all forms of pollution or nuisance, deterioration of natural resources, and desertification.
149. The strategic pillars of this national policy are: (i) preservation and strengthening of technical and methodological outputs in environmental protection, (ii) promotion of an overall and multisectoral approach to environmental issues, and (iii) promotion, restoration and reclamation of deteriorated areas and sites.
150. The attendant measures proposed for this policy are: (i) strict implementation and close monitoring of legal instruments relating to environmental management, (ii) capacity building for institutions and stakeholders in environmental management, and (iii) information and sensitization.
151. Over the next five years, efforts need to be made to ensure coherent implementation of priority programmes and actions identified through the PNAE, as well as to give the legal framework for managing environmental issues the means to carry out its missions, namely coordination of activities, systematic capacity building for stakeholders in environmental protection, and the fight against desertification and land degradation.
8.4 Consolidation of Public Administration Reforms
8.4.1 Decentralization and Deconcentration 152. In opting for decentralization, Malians decided to embark on profound
reform of public administrations through the establishment of local and regional administrative authorities (decentralized local authorities) and empowering them through elected organs to design and manage the structures, thereby giving them ownership of regional and local development.
153. Although a review of the implementation of the decentralization process since the installation of local authorities in 1999 and 2000 shows some indisputable progress, there are also persistent difficulties. These difficulties are mainly related to: (i) delays in the transfer of ownership of local and regional development to the local authorities; in fact, these delays hamper the transfer of powers, property and resources (human and financial) despite the political will expressed in all the laws and regulations adopted; (ii) difficulties in ensuring consistency between the sectoral strategies at the national level and the choices and priorities of the local and regional authorities; (iii) difficulties of the supervisory authorities, especially at the decentralized level, to appropriately carry out their missions of advisory support services, monitoring and control for the decentralized local authorities; (iv) the low capacity of human resources and low mobilization of human and financial resources at the local level; (v) excessive concentration, at the central level, of human resources and decisions for implementation of public expenditure, (vi) inadequate involvement of the civil society, as custodian of rights and duties towards Local Authorities and representative of local authorities (HCCT, AMM, ACCRM) and as defender and negotiator with the Government on the challenges of decentralization.

GPRSP 2007 – 2011 Page 45 of 224
154. Operationalization of decentralization through the installation of elected local administrations thus offer opportunities for deepening the democratic process, strengthening local governance, ensuring better mainstreaming of gender in public management, and in particular, improving coverage of the basic needs of the populations, especially the poorest groups. PRSP II implementation offers the opportunity for focusing on difficulties that hamper the decentralization process, and therefore achievement of its objectives, namely: deepening of the democratization process and boosting of local economies, which form the basis of sustainable economic and human development.
155. The decentralization and deconcentration of public management and greater empowerment of local administrations are conditions to be fulfilled at the strategic level to accelerate achievement of the MDGs. Empowerment of the organs and authorities of the decentralized administrations will create enabling conditions indispensable for the achievement of seven of the eight millennium goals. To that end, emphasis will be laid on:
• consolidation of the achievements of decentralization through effective transfer of ownership of regional and local development to the decentralized local authorities (regions, districts and councils);
• effective deconcentration of the central administrations to make Government interventions more effective and more efficient;
• improvement of the territorialization of sectoral strategies through formulation and effective implementation of the territorial development policy;
• improvement of technical and financial support mechanisms for local authorities, and their sustainability and/or transformation ;
• deconcentration and decentralization of the management of human resources and public expenditure. The challenges remain: (i) local taxes and increased resources for the local authorities, (ii) consolidation of their financial support, and (iii) monitoring/control of financial transfers. Actions towards budget deconcentration, deconcentration of public procurement procedures, and operational establishment of deconcentrated organization charts and organic frameworks will be carried out through the PDI, which centres on six components: (i) reorganization of the central Government, (ii) improvement of the public affairs management process, procedures and methods, (iii) enhancement of deconcentration, (iv) consolidation of decentralization, (v) strengthening and development of human resources, and (vi) communication and relations with users.
156. With decentralization, the Government has decided to share its responsibilities in the design and conduct of territorial development with the decentralized authorities. The Government has therefore decided, through concerted intervention on the territory, to coproduce development, that is define new territorial policies with the local and regional authorities. The deconcentration of management will help to decongest the central structures, and therefore make public decision-making more efficient; it will also give the elected officials of decentralized authorities mandated representatives with recognized responsibilities. Consequently, horizontal consistencies could make up for inadequacies of strictly vertical logical frameworks in public management.
GPRSP 2007 – 2011 Page 46 of 224
8.4.2 Improvement and Modernization of Public Finance Management 157. In April 2005, the Government adopted a Government Action Plan for
the Improvement and Modernization of Public Finance Management (PAGAMGFP). Under this Action Plan, the following activities will be carried out: (i) adaptation and modernization of the General Public Finance Framework, (ii) enhancement of governance and transparency, (iii) enhancement of the efficiency of tax and financial administrations, (iv) improvement of the quality of budget preparation and implementation, (v) inclusion of external financing in national budget procedures, (vi) interconnection of computerized public expenditure management systems, (vii) enhancement of the performance of Departments of Administrative and Financial Affairs (DAF), (viii) increasing the efficiency of public procurements, and (ix) implementation of continuous training for financial employees.
8.5 Pursuance of Reform of the Business Environment 158. Severe constraints hamper private sector development in Mali. There
is a structural weakness as a result of the exogenous character of growth. An evaluation of the business environment lays emphasis on: (i) constraints relating to corruption (for 48.7% of the enterprises), (ii) inadequate infrastructure (drainage of wastes, inadequate rail and road transport), (iii) rigidity of the labour market (problematic dismissals, low level of education and vocational training, and absenteeism due to the prevalence of endemic diseases), (iv) inconsistencies in regulations and the judicial system, and (v) limited access to bank financing.
159. Legal uncertainties and difficulties of access to land are also major obstacles. In view of these weaknesses, solutions are required to revitalize investments through: (i) the fight against corruption, (ii) improvement of the regulatory framework, (iii) making the judicial system credible, (iv) reinforcement of infrastructures, (v) improvement of the functioning of markets of factors of production, and (vi) significant improvement of bank financing.
160. It is also necessary to underscore the annual meetings of the President of the Republic with the representatives of the private sector. The Presidential Council for Investment has called for: (i) the establishment of an action plan to reduce transaction costs in creating enterprises, (ii) simplification of procedures for awarding licences, (iii) reduction of restrictions on recruitments and dismissals, and (iv) simplification of taxes. By the end of December 2006, a single window will be created for all administrative procedures relating to new investments. Similarly, tripartite Government/Private sector/Banks consultation days are organized each year by the Government to discuss issues relating to bank financing of economic activities.
8.6 Financial Sector Development 161. The Government of Mali intends to pursue and consolidate reforms
and actions aimed at improving the viability, performance and competitiveness of the financial sector. To that end, periodic meetings have been initiated by the President of the Republic and the Prime Minister with economic operators, bankers and micro-finance stakeholders, leading to the adoption of action plans which will facilitate access by the private sector and populations to financing.
GPRSP 2007 – 2011 Page 47 of 224
162. Strengthening of the banking sector and capital markets will require: (i) the development of new financial products, and in particular leasing, (ii) the establishment of an investment fund for financing that could be in the form of lines of credit or budget allocations repayable (or not), (iii) the creation of a risk capital company and/or investment company with equity funds, (iv) the development of mechanisms to facilitate access by SMEs to loans, (v) improvement of banking facilities and modernization of payment instruments, and (vi) supervision and assistance to enterprises for quotation on the Regional Stock Exchange (BVRM).
163. Micro-finance development will be supported by: (i) implementation of the 2005-2008 action plan, (ii) consideration of the operational action plan of the conclusions of the meeting of the Head of State with all the stakeholders of the micro-finance sector in March 2006, and (iii) establishment of a sectoral working group to monitor the implementation of micro-finance aspects.
164. The reform initiatives taken by the Financial Sector Development Programme (PDSF) should be supported by the strengthening of non-banking financial institutions, namely insurance companies, and restructuring of social security.
8.7 Development of Infrastructure 165. The basic infrastructure and utilities are inadequate, dilapidated and in
poor state, and constitute obstacles to the economic and social development of Mali.
166. As regards transport, the Government will depend mainly on the following key strategies: (i) introduction of fair competition between the various means of transport, and between the transport enterprises, (ii) extension and better management of the feeder road network, and (iii) restructuring of public enterprises of the transport sector, including the concessioning of “Aeroports de Mali”.
167. With respect to communication, the Government will implement the following strategies: (i) finalization of the privatization of SOTELMA before the end of 2007, (ii) development of human resource skills, (iii) promotion of universal access to information and communication through the computerization of public services and decentralized local authorities, as well as modernization and automation of postal services in rural centres, (iv) facilitation of private investment in cyber centres and Multipurpose Community TeleCentres, and (v) exemption of computer equipment from duties and taxes.
168. In the area of energy, the strategies to be implemented will concern: (i) development and supply of profitable sources of energy (hydroelectricity and new and renewable energies), (ii) rehabilitation of the existing infrastructure, (iii) development of a sub-regional cooperation policy, (iv) sensitization of the populations on the use of sources of energy to substitute wood, and (v) exemption of new and renewable energy equipment from duties and taxes.
169. Industrial development aims at facilitating access by investors to developed spaces by providing developed plots, so as to make the sector attractive and promote industrial investments. The key strategy will consist in rehabilitating the existing industrial zone and creating new zones in Bamako and in the regions. As regards Bamako, an economic growth pole will be developed in the Senou airport area. This will consist in improving the passenger airport, rehabilitating the freight terminal, and developing a new

GPRSP 2007 – 2011 Page 48 of 224
industrial zone of up to 200 ha. The PASC and Millennium Challenge Account will contribute to the creation of this growth pole in Sénou.
170. The objective of the “Bamako-Sénou Airport” component is to increase the added value of freight and passenger activities. The investment, which aims at developing the airport facilities of Bamako-Sénou airport, will:
- rehabilitate and modernize the airport facilities to bring them to international standards and increase their competitiveness;
- increase the country’s export capacity through the new facilities offered to air traffic, particularly the freight traffic;
- increase the capacities of the facilities for better use of its modernization to ensure safe, comfortable and efficient reception of passenger and freight traffic.
Indeed, better infrastructure will reduce the operating costs of aircraft and the airport, and thereby enable it to contribute to boosting activities, such as the export of fruits and vegetables.
8.8 Promotion of Democratic Governance and Public Freedoms 171. The establishment of the rule of law and promotion of democratic
governance, initiated during PRSP I, will be pursued. To that end, the reform of the justice sector, started since 2000 and supported by several bilateral and multilateral partners, should be pursued.
172. PRODEJ, which is aimed at consolidating the rule of law, guaranteeing social peace and promoting the country’s development, has recorded positive results in the following areas: (i) increase in the number and capacity of staff and budget of the justice sector, (ii) creation of an enabling environment for the promotion of human rights and public freedoms, (iii) fight against corruption, and (iv) construction and rehabilitation of infrastructure throughout the country.
173. As regards creation of an enabling environment for the promotion of human rights and the fight against corruption, PRSP II should help to consolidate the outputs of PRODEJ and other public initiatives on the following points: (i) providing courts with adequate staff, infrastructure, logistics and equipment, (ii) continuing to reinforce the capacity of staff, (iii) reorganization of the justice public service to make it more accessible and more efficient, (iv) revision of the rules and regulations governing the legal and judicial professions, and preparation of codes of ethics for the said professions, (v) capacity building for technical services and control structures, (vi) development of the capacities and abilities of the Government and civil society organizations in detecting and preventing corruption, and (vii) enhancement of transparency in the management of public procurements.
174. It will also be necessary to make the texts known and understood by highlighting the rights of women, children and handicapped persons. To that end, a large-scale information and sensitization campaign should be organized to ensure proper implementation of the provisions of human rights. Our codes should also be reviewed and translated into national languages.
175. PRSP II will strive to build a public administration that is republican and credible to all stakeholders of the public space. The capacities of civil society organizations will be strengthened to enable these important stakeholders of public life to play a key role in the debate on the definition and conduct of public policies. Initiatives to maintain and strengthen peace

GPRSP 2007 – 2011 Page 49 of 224
and security, which are conditions for tranquility of the populations, should be sustained. The proposed NEPAD peer review exercise and implementation of these conclusions can help to reinforce the credibility of the democratic governance process in Mali.
176. With respect to the fight against corruption and financial delinquency, actions will focus on the relevant international guidelines, namely implementation of the recommendations of the Financial Action Group on the laundering of capital, as well as the Basel Declaration made by the Bank for International Settlements. Mali carries out the activities of the Inter-Governmental Action Group against Money Laundering in Africa (GIABA) under ECOWAS, as well as the WAEMU Directive of 19 September 2002 against capital laundering. The Uniform Law on the fight against capital laundering which provides, in particular, for the establishment of a National Financial Information Processing Unit (CENTIF), an administrative service with financial autonomy and responsible for collecting and processing information on the fight against capital laundering, will be created.
8.9 Capacity Building for the Civil Society 177. To complement the enhancement of democracy and decentralization,
the civil society should be effectively involved in the definition, implementation and monitoring of development policies so as to eventually be a credible partner and real counter-power that can influence actions and decisions in a constructive manner at the national and local levels. The process initiated under the PRSP has, first of all, facilitated involvement of the civil society in defining the pillars and priorities of the strategy.
178. However, in order to consolidate creative and responsible participation of the civil society in the design and implementation of development and poverty reduction policies, the Government, in collaboration with the various components of the society, intends to put in place a vast capacity building programme for the civil society as a key component of PRSP II.
179. Reflection has already been initiated on the programme; its key areas are:
• training of civil society stakeholders to strengthen their technical skills, as well as their material and management capacities;
• greater organization of member institutions to increase their representation;
180. exchange of information and experience between member organizations, with government services and the other development stakeholders;
181. and the establishment of consultation frameworks at the national level with the Government and the strengthening of sectoral frameworks at the local and regional levels with the local authorities;
182. The development of networking at the sub-regional and international levels ;
• The development of efficient systems for information and communication between the local, regional and national levels.

GPRSP 2007 – 2011 Page 50 of 224
8.10 Strengthening of Regional and Sub-regional Integration Initiatives, Constant Support to Achievement of African Unity
183. Since its independence, Mali has been constantly working for the promotion and establishment of regional and sub-regional integration. Indeed, it is member of about twenty regional integration and cooperation organizations, the most important of which are: ECOWAS, WAEMU, OMVS, CEN-SAD, NBA and LIPTAKO-GOURMA and CILSS.
184. In view of its geographic location and human composition, Mali constantly works for the formation of large regional units. The choice of integration and going beyond the administrative borders has been proclaimed in all Constitutions since independence as follows: “The Republic of Mali can conclude, with any African State, partnership or community agreements comprising partial or total abandonment of sovereignty to achieve African unity”.
185. However, this commitment is hampered by some constraints, the most important of which are: (i) the non-preparation of national economic operators for competition that will arise from the integration of markets and liberalization of regional trade, (ii) apprehensions concerning reduction in tax revenue due to complete dismantling of tariff restrictions and the Common External Tariff (CET), (iii) non-compliance of some member States with Community decisions, particularly those relating to the free movement of people and goods and the right of residence and establishment, and (iv) the financial expenses required for compliance with commitments on contributions and other financial payments to inter-Governmental organizations. Despite these difficulties, the major political choice of regional integration is constantly reaffirmed by the creation of a Ministry responsible for African integration.
186. The major conclusions of a study on integration policies show that: (i) information and sensitization on the ideals of African integration should be pursued, (ii) advocacy for the effective implementation of the free movement of people and goods, as well as the right of establishment should be strengthened, (iii) efforts towards the creation of a sub-regional and regional common market should be pursued, (iv) commitment to the harmonization of laws and multilateral surveillance should be maintained, and (v) it is necessary to implement common and joint approaches in strategic sectors such as agriculture, as well as road, air and telecommunications infrastructure, as well as higher education and scientific research.
187. The strengthening of sub-regional and regional integration policies requires the country’s continued commitment to WAEMU, ECOWAS and NEPAD. Special attention should be paid to initiatives within the framework of OMVS, whose membership will be extended to the Republic of Guinea, as well as NEPAD in the implementation of the major regional infrastructure programmes.
188. The country should ensure compliance with and implementation of international agreements and better organization of bilateral and multilateral trade agreements (European Union/Africa Caribbean Pacific, and in particular future economic partnership agreements, AGOA, World Trade Organization, FAO, and WFP).
GPRSP 2007 – 2011 Page 51 of 224
8.11 Creation and Promotion of Sustainable Jobs 189. The priority area of intervention in employment is ensuring that training
meets the needs of the labour market, establishing an enabling framework for job creation, and ensuring job security.
190. Job creation will help to: (i) promote local employment through decentralization, (ii) implement labour intensive works through big projects, and (iii) develop SME/SMIs. Special emphasis will be laid on vocational and technical training; the Youth Employment Project (PEJ), which is ongoing, should reinforce apprenticeship and qualifying training, the development of entrepreneurship for youths and access by young business promoters to loans.
8.12 Development of Access to Basic Social Services
8.12.1 Education 191. The objective of the Ten-year Education Development Programme
(PRODEC) by 2015 is that “All Malian children complete quality basic education, and the education sector provides the country with the human resources required for its development”.
192. To achieve this objective, the challenges in the sector are: (i) improvement of the quality of education, (ii) increase and improvement of education opportunities, (iii) education should meet the needs of the labour market, and (iv) definition and good management of priority actions for each PISE II component.
193. The strategic pillars for implementation of choices made in the education policy are the four (4) components of PISE II:
• development of quality basic education;
• support to general, technical and vocational secondary education, and vocational training through apprenticeship;
• implementation of a sustainable development policy for higher education and scientific and technological research; and
• establishment of deconcentrated and decentralized management of the education system, which will facilitate the participatory and concerted planning of initiatives in the sector.
194. The attendant measures of the education policy are presented in detail in the Ten-year Education Development Programme. However, the most important measure remains the effective transfer of power and resources as provided for in decentralization.
195. With respect to education, the priority area of intervention is the development of the various cycles of education (basic education, general, technical and vocational secondary education, higher education and scientific and technological research) as well as the establishment of deconcentrated and decentralized management for transparent and participatory planning of the education system.
196. In compliance with the decentralization process, control of the construction of school facilities will be effectively transferred to the local authorities. School furniture, as well as supplies and teaching aids will be provided by the school management committees under the responsibility of the councils. PISE II will support, in particular: (i) the construction and
GPRSP 2007 – 2011 Page 52 of 224
equipment of classrooms for primary and secondary education, with delegation of project ownership to the local authorities, (ii) the rehabilitation of about 200 classrooms each year and the fitting up of about 200 classrooms for children who need special education, (iii) construction of latrines in all public and community schools, and (iv) increase in the number of school canteens on the initiative of Local Authorities to improve access to school, especially for girls.
197. The importance of transport facilities in accessibility to basic public services wiIl be taken into account; so also the need for an adequate transport network to establish the Government’s presence on the territory and enhance national cohesion and security.
8.12.2 Health and Social Development 198. The challenges of PRSP II in the health sector are those defined in the
Ten-year Health and Social Development Plan (PDDSS) and the ongoing second Five-year Health and Social Development Programme (PRODESS II). These include: (i) improvement of geographic access to essential health services and availability of qualified human resources, (ii) continued availability of quality drugs, vaccines and consumables at low costs throughout the country, (iii) reduction of health expenses for the poor, particularly for vaccination, prenatal consultation, family planning, the prices of Integrated Management of Children’s Diseases (PCIME) services, (iv) reform of hospital and other research institutions, and (v) institutional capacity building of the Ministry of Health and all health structures.
199. Achievement of the objectives of this programme will help to: (i) extend life expectancy, (ii) reduce maternal and infant mortality rate, and (iii) increase prenatal consultations and reduce mortality and morbidity due to priority diseases.
200. The strategies for implementing PDDSS are: (i) geographic access to health services, (ii) improvement of the availability and management of human resources, (iii) improvement of the use, performance and quality of health services, and (iv) protection of household incomes and availability of essential drugs.
201. The attendant measures which should help the health sector to contribute to the achievement of PRSP II expectations are described in detail in the Ten-year Health and Social Development Plan.
202. As regards health and social development, the priority area of focus concerns capacity building for socio-health structures (availability of qualified human resources and essential drugs) and the basis of a systematic response capacity to the energy needs of the said structures (conservation of drugs and vaccines, sterilization of health care equipment, operation of equipment and lighting) and their geographic and financial accessibility through decentralization, in particular.
203. For that, it should be noted that in PRODESS II, the health guidelines concern : (i) the extension of primary health care coverage to the poorest areas (constructions, rehabilitations, revitalization of non-functional Community Health Centres (CSCOM), (ii) the development of partnerships with partners of the private sector, (iii) the development of alternative

GPRSP 2007 – 2011 Page 53 of 224
strategies (advanced strategy, mobile teams and community relays, promotion of family practices) in remote and low-populated areas, (iv) multisectoral, decentralized and participatory approaches targeting mainly the poor and marginalized populations, (v) strengthening of control of infant and maternal diseases and malaria, (vi) free care for cesarean births, (vii) consideration of unsatisfied needs in family planning, and (viii) free malaria treatment for children.
204. The Social Development Plan adopted by the Government in 2005 was aimed mainly at contributing to the well-being of the populations by reducing the key sources of distress and social instability in order to ensure sustainable human development.
205. The challenges in this sector are many, and lead to the following major problems:
• effective management of persons and social categories in difficult situations. These are mainly old people, handicapped persons, destitute people, women and children in difficult situations, victims of social evils (alcoholism, prostitution, addiction to smoking, HIV/AIDS) and natural and social disasters (floods, drought, fires, epidemics, famine, wars and various social conflicts, forced repatriation) ;
• capacity building for communities to facilitate better access to basic social services and increase the incomes of the poorest populations; and
• gradual extension of social security to the entire population through effective mechanisms.
206. The achievement of PRSP II objectives in this sector should result in: (i) more solidarity with the most destitute and most underprivileged groups, (ii) better social security coverage for the entire population, (iii) better access by the most destitute to basic social services and micro-finance, (iv) social mobilization, and (v) promotion of community health.
8.12.3 Drinking Water and Sanitation 207. PRSP II objective in the water sector for the 2007-2011 period is to
contribute to the development of the country by providing appropriate solutions to problems relating to availability of water and ensuring sustainable management of water resources. This will mainly consist in satisfying the water needs of the populations (quality and quantity), reducing diseasing relating to the consumption of unclean water, and improving the quality of life.
208. With respect to drinking water supply, the access rate should increase in rural areas from 64.4% in 2005 to 68.4% in 2007 and 73.2% in 2011, and in urban areas from 70.2% in 2005 to 74.2% in 2007 and 79.3% in 2011. The sanitation coverage rate will increase from 4.4% in 2004 to 20% in 2010.
209. To achieve these objectives, which include decentralization and Government disengagement from ownership in favour of the local authorities, the challenges to be met concern pursuance of transfer of powers and resources to the decentralized authorities in water management, as well as improvement of geographic coverage of the national territory in drinking water points.

GPRSP 2007 – 2011 Page 54 of 224
210. The proposed accompanying measures are: (i) promotion of techniques for the mobilization of non-sustainable surface water resources in order to meet the needs of social sectors that affect the most underprivileged groups, (ii) effective implementation of the Water Code and related statutory texts, (iii) adoption of measures for monitoring and controlling water resources, (iv) strengthening of the deconcentrated technical services, (v) implementation of the sanitation strategy and measures to protect water resources, and (vi) promotion of the private sector.
211. In this regard, the Drinking Water and Sanitation Sector Programme (PROSEPA) has been prepared. The Action Plan for the Integrated Management of Water Resources (PAGIRE) and a National Liquid Waste Drainage Strategy will be adopted in December 2006.
212. With respect to the water sector, the national water policy has the following key objectives : (i) satisfy water needs in terms of quantity and quality for a growing population, as well as those of various sectors of the developing national economy, (ii) contribute to the development of agro-sylvo-pastoral activities by protecting them against the vagaries of the weather, so as to actively participate in poverty reduction and food security efforts, (iii) protect people and goods against the aggressive actions of water and protect water resources against the various pollutions, (iv) reduce the burden of the water sector on public finance through sharing of expenses between Government authorities, local authorities and users, and (v) promote regional cooperation for the management of cross-border waters so as to avoid conflicts relating to the use of water resources.
8.12.4 Employment and Vocational Training 213. The objective to be achieved through the National Employment Policy
(PNE) is to find solutions for job security, reduction of unemployment and under-employment, adaptation of training to the needs of the market, and improvement of employment conditions.
214. To achieve this objective, the strategy to be implemented in PRSP II will consist in creating a legal framework conducive to the promotion of the private sector, and establishing a public service for local authorities.
215. This strategy should be accompanied by measures relating to: (i) pursuance of SME/SMI development, (ii) development of local financing, (iii) reinforcement and improvement of vocational and technical training, (iv) development of private services market to support contractors, and (v) organization of the informal sector.
8.12.4 Housing 216. The challenges in this sector are: (i) implementation of the programme
for 12 000 low-cost housing units as from 2007, (ii) the management of house rents in urban centres, (iii) the rapid and uncontrolled extension of towns, (iv) uncontrolled management of lands, and (v) sanitation of urban centres and control of the quality of buildings.
217. The housing policy to be implemented under PRSP II should contribute to facilitating access to housing for many low-income people, the harmonious development of towns, and improvement of the living environment in urban and rural areas.
218. The major guidelines for housing are: (i) control of the development of towns, (ii) development of the local building industry, (iii) land and real

GPRSP 2007 – 2011 Page 55 of 224
estate promotion, (iv) establishment of a housing refinancing institution, and (v) strengthening and improvement of the Government/Local Authorities/Private Sector Partnership Framework.
8.13 HIV/AIDS Control 219. In July 2006, Mali adopted a National Strategic Framework (CSN) for
HIV/AIDS control, which covers the 2006-2010 period. This instrument provides strategic guidelines for HIV/AIDS control in synergy with PRSP II in aspects of sector reforms, as well as development and capacity building mechanisms for local authorities. The new national strategic framework defined three (3) major pillars: (i) promote an environment conducive for ownership, sustainability and good governance of the control efforts, (ii) reduce the risks and vulnerability to the pandemic, and (iii) mitigate the social, economic and cultural impacts of the epidemic, in particular those affecting children and women.
220. The National Strategic Framework defines the key strategic guidelines for HIV/AIDS control for all public, private and civil stakeholders. Through a multisector response framework, coordinated by the National High Council for AIDS Control (HCNLS), Mali ensures massive intensification and extension of programmes and interventions that promote:
• the prevention of HIV/AIDS;
• care and assistance to persons infected or affected by HIV/AIDS; and
• mitigation of the social, economic and cultural impacts of HIV/AIDS.
221. The strategic guidelines pay special attention to socio-cultural and institutional realities so as to foster the defence and protection of human rights and prerogatives of each person. In this respect, it should be noted that:
• the gender aspect is given priority everywhere;
• legislative and statutory reforms, as well as sensitization actions are introduced to protect persons infected or affected by the pandemic against stigmatization and discrimination;
• legislative and statutory reforms, as well as sensitization actions are introduced to fight against harmful physical and psychosocial practices;
• participation and involvement of institutions, persons, structures and organizations that influence HIV/AIDS control are encouraged;
• local authorities are empowered to develop sustainable local response.
8.14 Integration into the Multilateral Trade System 222. This consists in implementing the recommendations of the national
validation workshop for the diagnostic study on the integration of trade so as to draw utmost benefit from the multilateral trade system and contribute to achievement of the MDGs.
223. It requires greater liberalization of the economy (liberalization of prices and competition) through: (i) the creation of an environment conducive to private sector development, (ii) development of the gold, rice, sugar, meat, hides and skins, fruits and vegetables, shea, Arabic gum and groundnuts sub-sectors, (iii) capacity building for support structures for trade promotion, and (iv) organization of the distribution trade.
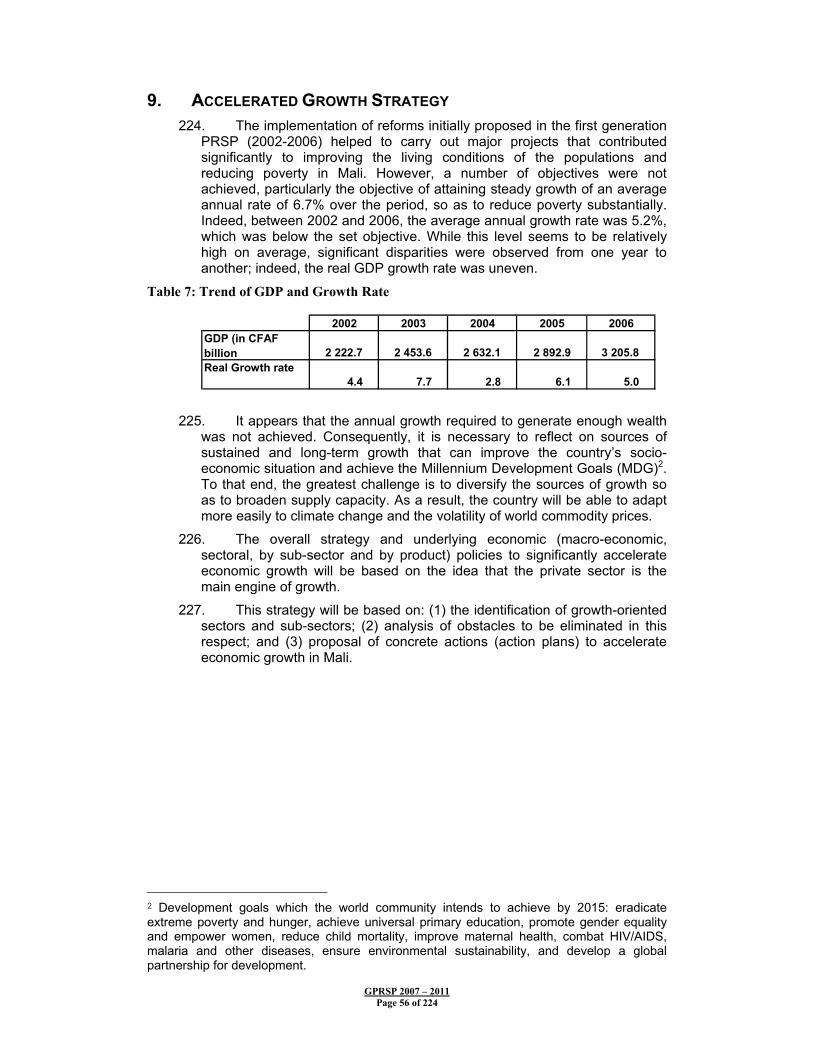
GPRSP 2007 – 2011 Page 56 of 224
9. ACCELERATED GROWTH STRATEGY 224. The implementation of reforms initially proposed in the first generation
PRSP (2002-2006) helped to carry out major projects that contributed significantly to improving the living conditions of the populations and reducing poverty in Mali. However, a number of objectives were not achieved, particularly the objective of attaining steady growth of an average annual rate of 6.7% over the period, so as to reduce poverty substantially. Indeed, between 2002 and 2006, the average annual growth rate was 5.2%, which was below the set objective. While this level seems to be relatively high on average, significant disparities were observed from one year to another; indeed, the real GDP growth rate was uneven.
Table 7: Trend of GDP and Growth Rate
225. It appears that the annual growth required to generate enough wealth
was not achieved. Consequently, it is necessary to reflect on sources of sustained and long-term growth that can improve the country’s socio-economic situation and achieve the Millennium Development Goals (MDG)2. To that end, the greatest challenge is to diversify the sources of growth so as to broaden supply capacity. As a result, the country will be able to adapt more easily to climate change and the volatility of world commodity prices.
226. The overall strategy and underlying economic (macro-economic, sectoral, by sub-sector and by product) policies to significantly accelerate economic growth will be based on the idea that the private sector is the main engine of growth.
227. This strategy will be based on: (1) the identification of growth-oriented sectors and sub-sectors; (2) analysis of obstacles to be eliminated in this respect; and (3) proposal of concrete actions (action plans) to accelerate economic growth in Mali.
2 Development goals which the world community intends to achieve by 2015: eradicate extreme poverty and hunger, achieve universal primary education, promote gender equality and empower women, reduce child mortality, improve maternal health, combat HIV/AIDS, malaria and other diseases, ensure environmental sustainability, and develop a global partnership for development.
2002 2003 2004 2005 2006 GDP (in CFAF billion 2 222.7 2 453.6 2 632.1 2 892.9 3 205.8 Real Growth rate 4.4 7.7 2.8 6.1 5.0

GPRSP 2007 – 2011 Page 57 of 224
Growth-oriented Sectors
9.1.1 Rural Sector 228. Growth will be achieved in the rural sector through maximum
development of the agro-ecological potential and agro-pastoral skills of the country, as well as through the creation of an enabling environment for the development of a structured agricultural sector, particularly through revitalization and creation of SME/SMIs. Emphasis will be laid on the development of dry cereals, rice, cotton, fruits and vegetables, and beef.
229. As regards the growth-oriented sectors, the growth of agricultural production will be achieved through : (i) control of water and better management of natural resources (in particular, soils) to minimize vulnerability to the vagaries of the weather; (ii) more availability of energy services for the rural services; (iii) better access to markets; (iv) supply and use of information on markets and technological progress; (v) creation of a coherent and attractive institutional framework to facilitate the professionalization of stakeholders of the sector and coordination of activities in the sub-sector.
230. Cotton will continue to be an important sector during PRSP II. The National Development Strategic Framework for the cotton sector will contribute to increasing the productivity of the sector. The option of privatizing the “Compagnie Malienne de Développement des Textiles (CMDT)” by opening up the capital to national and foreign individuals and controlling production costs are factors that will stimulate growth.
231. The new principles, which will guide the Government-CMDT-Producers Memorandum of Understanding, are in particular : (i) producer prices of unginned cotton determined in such manner as to promote sustainable development of the Malian cotton sub-sector, and calculated on the basis of distribution of the gross income of the sub-sector between the producers and CMDT (60% and 40% respectively), (ii) the creation of a support fund for flexibility in determining the initial price, and (iii) the establishment of mechanisms to correct fluctuations in the market in favour of CMDT (in a favourable situation) or the producers (in an unfavourable situation).
232. In pursuing the reform of the cotton sector, the revised schedule of the reform process for the sector adopted in November 2005 provides for the option of privatizing CMDT by transfer of shares of CMDT subsidiaries to be created. To that end, the measures adopted will concern, in particular: (i) the definition of organizational and regulatory frameworks within which the stakeholders of the sub-sector will operate, (ii) the establishment of a cotton stock exchange, (iii) the establishment of structures responsible for carrying out statutory functions (classification of unginned cotton and cotton lint, seed policy, cotton research, etc.), (iv) opening of the capital of CMDT subsidiaries to producers, (v) completion of the structuring of farmer organizations, and (vi) implementation of a vast and intense producer information and training programme.

GPRSP 2007 – 2011 Page 58 of 224
233. Furthermore, a national cotton development strategy paper has been prepared, with the objective of increasing the contribution of the cotton sub-sector to the county’s economic and social development. This objective will be achieved through the following strategic pillars: (i) pursuance of the fight against the practice of subsidies in certain countries (USA, EU), (ii) reinforcement of the competitiveness of the sector, (iii) securing the income generated by the cotton sector against the adverse effects of the volatility of world prices, (iv) the presence of new segments of markets (biological and equitable trade), (v) increase in the processing rate of national production, (vi) the development of private sector participation in the cotton sector, and (vii) improvement of concerted management of the cotton sub-sector.
9.1.2 Mining 234. The mining sector will also continue to be a driving force in the
economy. Gold is the sector in which growth was highest in Mali over the 1994-2005 period, standing at 22%. It is the first export product, and second source of foreign exchange for Mali. The Government’s voluntarist policy in this sector has led to substantial investments in infrastructure, cartography, research, exploration, evaluation and exploitation of mining reserves. Similarly, as regards tax incentives, the operators benefit from exemptions from: (i) VAT for three years; (ii) tax on profits for five years; and (iii) custom duties on import of capital goods. Establishment conventions offer the possibility of opening off-shore accounts in which operators can keep part of their resources.
235. Upstream the hydrocarbons sub-sector, special emphasis will be laid on oil research and exploration. Downstream the sub-sector, the challenge consists in reducing the cost of oil supplies and procurement. The strengthening of ONAP will increase storage capacities and improve distribution channels of the products to the populations.
236. The expectations from the mining sector are as follows: (i) increase in State revenue through substantial contribution of mining products to GDP, (ii) job creation, particularly for youths in the production areas, (iii) increase in the incomes of traditional exploiters, and (iv) development of the gold exploitation areas.
237. The challenges to be met by the sector in the medium and long term are: (i) environmental protection, and its restoration in gold exploitation areas, (ii) protection of the populations and animals living in the gold exploitation areas, and protection of the purchasing power of the populations during increases in the cost of living, and (iii) establishment of financing facilities adapted to the activities of the sector.
238. The strategy adopted by the Government is its gradual withdrawal from the sector in favour of private individuals so as to concentrate on its fundamental missions of establishment of basic infrastructure, creation of an environment conducive to investment, as well as promotion, regulation and control of the sector.

GPRSP 2007 – 2011 Page 59 of 224
239. To that end, the proposed attendant measures are: (i) capacity building for the stakeholders of the sector, (ii) improvement of the legal, regulatory and institutional framework, (iii) environmental management to minimize the negative impacts on the populations and ecological environment, (iv) support to grassroots communities in the mining zones, and (v) promotion and assistance to small-scale mining and mines handicraft.
9.2 New Possibilities 240. There are many sectors with strong potential to accelerate GDP
growth, if the necessary attendant measures are taken:
9.2.1 Industries 241. In Mali, the industrial sector faces enormous challenges, particularly:
(i) the fight against fraud, counterfeiting and unfair competition, (ii) difficulties of emerging industrial enterprises in the processing of local products, (iii) quality control of imported equipment to avoid polluting technologies, and the fight against pollution caused by factories.
242. However, this sector is expected to contribute to the country’s economic growth by processing products of the rural sector, such as fruits and vegetables, oilseed crops, cattle and meat, hides and skins, and textile fibres (cotton and others). The development of the industrial sector will create jobs and increase the national value added of the products, which will be exported and will thereby contribute to improving the living conditions of the populations.
243. The attendant measures to be taken in this sector include: (i) creation of an investment promotion fund, (ii) development of viable industrial zones based on an operational industrial development plan, (iii) development of road infrastructure for the distribution of national production, (iv) intensification of the fight against unfair competition and counterfeiting, (v) restructuring and upgrading of industrial enterprises, (vi) promotion of quality and standards, and (vii) development of new industrial centres.
9.2.2 Trade 244. As a result of the predominance of trade in the Malian economy, the
challenges to trade are many: (i) the fight against fraud so as to clean up the domestic market, (ii) quality assurance for import and export products, (iii) development of the sector by preparing and implementing a national policy harmonized with that of WAEMU, (iv) protection of the purchasing power of consumers in price liberalization, and (v) supervision of informal trade.
245. The objective under PRSP II is to strengthen the role of trade in economic and social development through better integration of the country into the regional and international market (supply of high quality Malian products on the international market, diversification of markets, compliance with standards, as well as with health and pest control rules, and capacity building for the stakeholders). This will consist in promoting, by a sub-sector approach, products whose increased exports will have a direct impact on the incomes of producers.
9.2.3 Tourism 246. Considered as one of the surest sectors in the fight against poverty,
because it affects all sectors of the economy, the tourism sector faces
GPRSP 2007 – 2011 Page 60 of 224
enormous challenges, in particular: (i) coherence between the actions of the different stakeholders in the sector, including the private sector, (ii) introduction of control of tourism and hotel trades, (iii) development of touristic sites, (iv) creation of trust between private sector professionals and representatives of the public sector, and (v) professionalization of employees in the sector.
247. To take up these challenges and make tourism one of the engines of growth, the Government in 2004 adopted a report defining strategic guidelines to promote the development of tourism, which could help to create jobs and increase public revenue (Government and Local Authorities).
248. The strategy in the sector will centre on: (i) strengthening of the institutional mechanism, (ii) diversification of the products offered, and (iii) assistance for better control of the activity by the stakeholders.
249. The attendant measures to support the sector are: (i) strengthening of the institutional mechanism and building the capacities of all the stakeholders, (ii) diversity of supply and development of touristic sites, restaurants and hotels, (iii) better coordination between investment programmes for road and security infrastructure, and organization of tourism events, and (iv) improvement of the quality of tourism products.
9.2.4 Fruits, Vegetables, Oilseed Crops and Basic Products 250. The fruits and vegetables sub-sector is promising, and has developed
considerably for over ten years. Mali produces several exotic fruits or out-of-season vegetables (mangoes, green beans, sweet peas) for which there is high demand in Europe. Consequently, important measures will be taken to organize this sub-sector, and facilitate the sale of its products, especially on the foreign market. Indeed, since competition is keen for these products, efforts need to be made to ensure the good quality of fruits and vegetables proposed on the markets, which must meet the commercial and regulatory requirements (international pest control standards, presentation in packing materials, etc).
251. As regards basic products, Mali abounds in products such as Arabic gum, shea, and cashew nut, the development of whose markets will contribute to increasing the incomes of the rural populations.
9.2.5 Handicraft 252. The Handicraft Master Plan was prepared in 2003. The handicraft
sector, though potentially a great provider of jobs, nevertheless has some weaknesses which impede its development. Even though the tendency is to lay emphasis on art handicraft with the sole objective of promoting exports and supporting tourism, the potential lies more in utilitarian handicraft of products and services for the local market.
GPRSP 2007 – 2011 Page 61 of 224
253. To ensure the emergence of a growth-oriented handicraft sector, it is necessary not only that its needs be identified and taken into account, but also that the various stakeholders of the sector (Ministry, apex structures, development partners, etc.) define, in a consensual manner, a long-term strategic vision for handicraft.
254. The Ministry responsible for handicraft will play a uniting role, through the National Handicraft Promotion Centre, so as to make this sector a pole of economic growth and achieve the objectives of growth, poverty reduction and MDGs.
255. To that end, the following strategies are proposed:
• active advocacy to refocus the role of handicraft on achievement of the various sector objectives of growth and poverty reduction;
• availability of information on the evolution of handicraft and actions to improve visibility of contribution by the sector;
• preparation of a sector policy for handicraft development, including a strategic action plan for capacity building and infrastructure ;
• preparation of the Medium-Term Expenditure Framework (MTEF) for Handicraft;
• promotion of the emergence of professional and competitive handicraft industry, by laying emphasis on the interactive role of the industry and its contribution to the achievement of the objectives of other economic sectors;
• promotion of a handcraft industry that produces goods and services, with a strategic development policy adapted to the realities and potential of micro and small enterprises ;
• ensuring the emergence of a professional handicraft industry;
• provide capacity building for stakeholders and infrastructure ;
• collection and consolidation of information on the evolution of the handicraft industry.
256. The attendant measures will include: (i) establishment of a mechanism for controlling, monitoring and evaluating activities, and increased empowerment of professionals of the sector, (ii) establishment of an incentive legislative, regulatory and fiscal framework, (iii) creation of an enabling environment for the financing of investments in the sector, and (iv) mobilization of local initiatives.
9.2.6 Culture 257. Culture, a factor of social cohesion, is considered as an approach to
poverty reduction. In order to promote the cultural values of our country and create a climate of peace and stability, the Government of Mali adopted the key orientations of the cultural policy, with the following main objectives: (i) promotion and development of a culture rooted in the values of the Malian society and universal civilization, (ii) protection, conservation and development of the national cultural and artistic heritage, and (iii) promotion of culture as a factor of economic development, peace, and stability.

GPRSP 2007 – 2011 Page 62 of 224
258. This cultural policy aims at addressing challenges relating to: (i) the restructuring of cultural sites, (ii) respect for and development of our customs and traditions, (iii) building on the positive aspects of cultures, (iv) organization and control of the culture sector, and (v) fight against piracy.
259. Consequently, it is expected that the implementation of this policy under PRSP II will: (i) develop cultural tourism sites, (ii) increase income from cultural activities, (iii) enhance the creativity of artists, and (iv) develop cultural events.
260. The proposed attendant measures are: (i) preservation of historic places and sites, (ii) training of cultural stakeholders and senior staff of the Ministry of Culture, (iii) promotion of cultural enterprises, (iv) protection of creative art, and (v) promotion of cultural exchanges.
9.2.7 Youth and Sports 261. Mali, like most African countries, has a population which is mostly
young, hence the scope of challenges relating to: (i) the creation of jobs for the integration of youths into socio-economic and professional life, (ii) adequate education and development of civic spirit, and (iii) the fight against social evils, such as prostitution, pedophilia, banditry, and in particular the protection of youths against HIV/AIDS.
262. The objectives sought in PRSP II as regards the youths are better integration of youths into social life and development of job-seeking aptitudes.
263. These objectives should contribute to: (i) reduction of youth unemployment rate in urban and rural areas, (ii) settlement of youths, and consequently reducing rural exodus and migrations, (iii) an appeased social climate, and (iv) reduction of distress and frustrations.
264. The strategy, which will help to achieve the objectives, is based on the creation of the legal framework and conditions for the development of youths and, the proposed attendant measures are: (i) socio-educational supervision for youths, (ii) the socio-economic integration of youths, (iii) capacity building for associations in mobilization, citizenship and participation in public life, and (iv) institution building of youth supervision structures.
265. As regards sports, the objectives are to: (i) improve sports results at the national and international level, (ii) develop sports activities by organizing many team sports competitions, (iii) work towards the socio-economic integration of sports men and women, (iv) promote the development of sports men and women by constructing sports infrastructure, and (v) provide training to youth and sports senior staff.
9.3 Growth-Oriented Infrastructure 266. Growth will be boosted through: (i) the development of viable industrial
zones; (ii) the availability of water and electricity at better costs, (iii) the construction of transport infrastructure, and (iv) accessibility to more substantial financing. It is therefore necessary to improve the business climate. For industries that process raw materials produced in the country (meat, milk, hides and skins, and fruits and vegetables), the public sector could facilitate a commercial partnership between the large modern private units and the micro and small enterprises in the handicraft and informal sector.

GPRSP 2007 – 2011 Page 63 of 224
9.3.1 Energy 267. The traditional energy sub-sector is characterized by shortage of
domestic fuel made up of firewood and charcoal. The provision of these needs depends, in more than 80% of the cases, on wood resources and puts great pressure on the forest cover. The preparation of Wood Energy Supply Master Plans (SDA) should help to initiate gradual renewal of the resources, and make it possible to tap the national potential of the agricultural and animal biomass.
268. The major challenges to be addressed by the strategies and policies in the energy sector, which aims at making energy services accessible to the greatest number (population and industrial units) and throughout the country at least cost, are:
• search for an alternative to firewood so as to preserve plant species and stop the abusive felling of trees for wood ;
• introduction of sound management of EDM SA ;
• reduction of water and electricity rates;
• sustainability of public lighting in towns in Mali ; and
• search for financing required for the implementation of priority projects and programmes of the next five years.
269. The intervention proposed by Government in this sector is defined in the Electricity and Drinking Water Sector Policy Letter adopted on 10 November 1999. This letter provides for attendant which centre on:
• strengthening of the institutional and regulatory framework of the energy sector;
• development of domestic energy and rural electrification;
• promotion of alternative sources of energies to traditional fuels;
• constitution of a national buffer stock for hydrocarbons;
• development of the National Interconnected Network;
• development of renewable energies; and
• promotion of the exploration of hydrocarbons, and solid and gaseous fuels.
270. With respect to the management and efficiency of the electrical energy sector, the objective is to improve the productivity of activities of the company “Energie du Mali” (EDM) (Mali Electricity Corporation) in urban areas through a programme to reduce technical and non-technical losses and to reduce electricity rates. It is also recommended that production infrastructure be developed through an appropriate investment programme to increase electricity supply and benefit from economies of scale to reduce electricity costs for the industrial sector.

GPRSP 2007 – 2011 Page 64 of 224
9.3.2 Transport 271. The central position of Mali in the middle of West Africa subjects this
sector to enormous challenges, namely: (i) continued improvement of the efficiency and sustainability of the means and infrastructure of transport (road, railway, air and river), (ii) reduction of transport costs, particularly in rural areas, (iii) improvement in the operation of transport corridors, (iv) implementation of the railway and “Aéroports du Mali” concession, (v) monitoring of compliance with road traffic rules, and (vi) operationalization of the environmental unit for road projects.
272. The transport sector should therefore contribute to the internal and external accessibility of the country through efficient and sustainable management of means of transport, and periodic maintenance of priority highways. Consequently, it is indispensable to prepare a transport infrastructure network development master plan for Mali.
273. The proposed strategy consists in the promotion of private public transport companies. The role of the Government will be limited to formulating the national transport policy and monitoring its implementation.
274. The proposed attendant measures include: (i) capacity building for stakeholders of the transport sector, (ii) cleaning up and modernization of the public transport vehicle fleet, and (iii) strict implementation of the laws in force on transport and safety.
275. The needs identified during the sectoral consultation on the development of transport infrastructure in Mali (2008-2015) comprised 87 priority projects. The key objectives are to: (i) construct the lacking sections of the international corridors, (ii) connect all the chief towns of districts with a tarred or modern earth road, and (iii) connect all the chief towns of councils with an improved feeder road that is motorable throughout the year.
276. Consequently, the action matrix for the integrated trade framework proposes: (i) the reduction, by WAEMU, of the CET for the import of commercial vehicles, (ii) promotion of competition between the various corridors, (iii) at the national level, the adoption of a single tax system for transport companies, (iv) the creation of dry ports; (v) the creation of a national freight exchange, and (vi) reinforcement of the technical regulations of transport vehicles.
277. With respect to air transport, the following measures are proposed: (i) security of air freight according to international standards, (ii) abolition of airport export duties for red meat, fruits and vegetables, (iii) evaluation of the adequacy of the refrigeration logistic chain, and (iv) provision of refrigeration facilities in airports.
278. As for railway transport, measures will be taken to improve Malian warehouses in general, and that of Dakar port in particular, and to ensure compliance with the concession contract clauses for the Dakar-Niger railway.

GPRSP 2007 – 2011 Page 65 of 224
9.3.3 Telecommunications/ICT and Posts 279. In light of observation of the telecommunications sector since 1999
and implementation of the laws in force, it would be necessary to improve the legal framework so that private investment and use of private sector skills is encouraged, that the competitiveness of SMEs is improved, and that the objectives of social progress are achieved.
280. Detailed studies will be conducted on the postal sector so as to better regulate it and give fresh impetus for growth.
281. Concerning the extension of telecommunications network and ICTs to rural areas, the proposed actions relate to: (i) the formulation of a strategy for access to communication in rural or remote areas; (ii) the formulation of legal/regulatory instruments required for the creation of a universal access fund, for the management and functioning of the fund, and for defining telecommunication services considered as part of service and/or universal access, (iii) an evaluation of the required subsidies, and (iv) the implementation of pilot projects based on the ICT strategy adopted by the Government. The results will help to extend the ICT universal access programme to the national level.
9.4 Cross-Cutting Issues
9.4.1 Gender 282. The key challenges in the area of gender are:
• the socio-cultural factors, which still weigh on the status of women and reduce their chances of education, thereby limiting their capacities to participate in the socio-economic life of the community;
• gender disparities in education, at all levels of education. These disparities affect the capacities of women, jeopardize their productivity, and limit their access to development opportunities;
• precariousness of the health of women and young girls, leading to a high maternal death rate (582 per 100,000 life births), high fertility (total fertility 6.8) and limited access to modern contraceptive methods (overall contraceptive prevalence rate of 12.7%, and 5% in rural areas) ;
• high contribution of women to the household and market economy, and yet low visibility of their work in the economic aggregates and limited access to the benefits of development;
• unequal distribution of roles and responsibilities in the division of labour, unequal access to economic opportunities, which accounts for the low economic power of women and feminization of poverty. Women are under-represented in the modern private and public sectors. There, they occupy inferior positions and income gaps discriminate against them. Despite the progress made in the micro-finance sector through credit unions, access by women to financial services is still limited, and this hampers real feminine entrepreneurship;
GPRSP 2007 – 2011 Page 66 of 224
• different rights and duties for the man and the woman within the family and society despite the notion of equal rights enshrined in the Constitution. This largely accounts for the under-representation and low participation of women in decision-making organs. As a result of poor mainstreaming of gender in the decentralization process, the gender dimension remains very limited in local and council management; and
• limited consideration of gender in the PRSP, which admittedly posed the problem of gender but still shows analysis weaknesses and limits in the capacity to measure the feminization of poverty. The analysis of poverty is based mainly on the poverty of living conditions and does not take into account the impacts which are different for men and women.
283. The recommendations and strategic orientations arising from the analysis of the status of gender, and which should guide GPRSP implementation activities are:
284. Concerning the establishment of a gender strategic framework, proposals are made to:
• provide the country with a gender specific reference framework,
• conduct an institutional review of equity-equality implementation structures,
• put in place a gender information system for the various structures which prepare quantitative data at the national, regional and local levels (DNSI, CPS, PRSP),
• ensure optimum donor interventions by revitalizing the Technical and Financial Partners consultation framework for gender in order to harmonize the interventions (COFED),
• adopt the gender approach as a strategic factor in each development sector and at all levels,
• take measures to ensure recognition of GED Units of the sectoral ministries in the institutional mechanism, and make them operational, and
• review, in terms of gender, the policies and programmes of each sector.
285. Concerning gender and socio-cultural practices, the difficult and slow change will require intense dialogue with the various social groups. To that end, the following actions need to be taken:
• advocacy on gender with policy-makers (Government, National Assembly, Local Authorities) ;
• implementation of a vast information and social mobilization programme on gender issues for the society and opinion leaders ; and
• conduct of supplementary studies to better understand socio-cultural problems and their evolution.
GPRSP 2007 – 2011 Page 67 of 224
286. With respect to gender and education, proposals for improving the situation concern:
• capacity building in gender issues for education workers,
• preparation of methodology tools for the planning, budgeting and monitoring-evaluation of gender operations in education sectors,
• increasing the enrolment of girls and reversing the current girls/boys parities,
• abolition of any gender discrimination in school curricula, and assist in the review of school curricula in terms of gender (review the image given of the girl/woman, message on HIV/AIDS).
287. As concerns gender and health, the proposals centre on:
• capacity building in gender issues for health workers,
• preparation of methodology tools for the planning, budgeting and monitoring/evaluation of gender operations in health sectors,
• strengthening information and sensitization programmes on family planning, STI/AIDS, and practices detrimental to women’s health for men and women,
• adoption of a population policy consistent with the development projections of the country, and
• greater representation of women in the governing organs of health associations.
288. With respect to gender and the economy, the proposals are:
• improvement of women’s economic visibility,
• review of national programmes so as to better integrate the specific needs of women (PCDA, AMADER, PASAOP),
• preparation and implementation of measures to promote equal access by women and men to productive resources, particularly in farming schemes (ORS, ON, ORM PIV), and
• support for the emergence of a female entrepreneurship and the consolidation of income-generating capacities through special measures that foster access by women to loans.
289. As regards gender and the law, the proposals are:
• implementation of international conventions on women’s rights, which have already been ratified by Mali,
• finalization of the consultation process and adoption of the new Family Code, and its implementation,
• establishment of a national observatory for women’s and girls’ rights,
• implementation of a vast programme of information, sensitization and mobilization on women’s rights,
• systematic training in gender issues for all staff of the justice sector, and
• legal assistance for all women, and the most underprivileged population.

GPRSP 2007 – 2011 Page 68 of 224
290. Concerning gender and participation in governance, women’s participation remains low ; consequently, it is important to:
• develop a sensitization programme for the various stakeholders in the society to promote equal exercise of citizenship by men and women,
• provide capacity building for decentralized structures and local authorities for better consideration of the gender dimension, and
• reinforce women’s civil society organizations.
291. With respect to gender and decentralization, in order to improve consideration of gender in the decentralization process, it is necessary to:
• encourage women’s participation in the preparation of plans, take into account their specific needs as well as their involvement in the implementation of these plans. See to the quality of women’s representation in orientation and decision-making organs at the local level,
• see to the integration of the specific needs of grassroots women in service delivery, and include them in the ANICT financing list,
• take into account gender equity in the allocation of resources at the council level,
• improve the capacity of LAs in gender, and provide methodology and tools for mainstreaming gender in local planning,
• create a strong link between vertical programmes and gender horizontal planning at the level of local authorities, and
• monitor and evaluate gender to assess the indicators for results, effects and impacts of the level of poverty reduction in terms of gender at the council level.
292. Lastly, to ensure effective consideration of gender in PRSP II, it is necessary to: (i) strengthen coordination with MPFEF and further involve the civil society, particularly women’s associations and organizations, in the formulation process and in poverty and gender monitoring mechanisms, (ii) provide capacity building in gender issues to members of the Poverty Monitoring Unit and develop existing national skills, (iii) adopt the gender approach as a strategic element in each development sector and at all levels, (iv) review national and sectoral development policies and programmes to highlight the needs and potentials of men and women, and to enhance the inclusion of gender in the formulation, monitoring and evaluation of PRSP II, (v) deepen gender-oriented analysis in the preparation of poverty profiles to ensure better knowledge of the real situation of women and vulnerable groups at the national, regional and local levels, (vi) institutionalize a system for targeting/locating the poorest population in separate data (men and women, girls and boys) and (vii) include relevant gender indicators in the poverty monitoring system.

GPRSP 2007 – 2011 Page 69 of 224
9.4.2 Territorial Development 293. The territorial development policy adopted by the Government has the
following objectives:
• balanced distribution of the population and activities throughout the national territory;
• coherence of public and private activities, which contribute to the economic development of the country;
• reduction of inter-regional and intra-regional disparities in development;
• facilitate the emergence of economic regions based on development poles;
• better coordination of the development actions of stakeholders at the different territorial levels;
• promotion of peaceful and traditional land management;
• coherence of national, community and African sectoral policies; and
• strengthening of integration within WAEMU space.
294. This policy will help Mali to cope with major challenges, namely: (i) sustainable development through better territorial balance, (ii) promotion of national solidarity, and (iii) environmental protection.
295. The overall strategy for achieving the objectives of the national territorial development strategy will centre on:
• the establishment of a geographic information system;
• the preparation of development plans for the various territorial levels;
• revision of sector and/or regional and local plans and programmes prior to the adoption of the national territorial development policy;
• training and sensitization of stakeholders of territorial development; and
• establishment of partnership relations with sub-regional organizations/institutions engaged in the promotion of territorial development (WAEMU, CILSS).
296. The proposed attendant measures to support the national territorial development policy concern: (i) improvement of the legal and regulatory framework for territorial development, (ii) ensuring consistency between initiatives from the private sector, local authorities as well as technical and financial partners, and (iii) a good distribution of national resources.
9.4.3 Population Issues 297. The incorporation of demographic variables in the preparation of
development plans and programmes should be envisaged within the larger perspective of growing appreciation of the significance of mutual relations between the social, the economic and the demographic sectors. Consequently, the challenges at this level centre on the following points:
• advocacy with policy makers for better awareness of interrelations between population and development ;
• social mobilization around PNP objectives;
• capacity building for better visibility of interrelations between population and development ;
GPRSP 2007 – 2011 Page 70 of 224
• support to local authorities and sectors for better mainstreaming of population variables in development plans and programmes;
• studies and research on the various aspects of the domain (population) ;
• harmonization of population concepts; and
• implementation of the PNP coordination and monitoring-valuation mechanism (adopted by the Government).
9.4.4 Peace and Security Issues 298. In view of the direct link between peace-security and development, the
priority actions of PRSP II concern:
• Incorporation of peace and security aspects in all development projects and programmes and in sector policies;
• preparation of the security sector policy;
• inclusion of the peace and security cross-cutting theme in the various civil society interventions.
299. Seven key priorities should today form the basis of our security policy: (i) give priority to prevention; (ii) lay the bases for a police of proximity; (iii) clarify and coordinate security responsibilities; (iv) adopt a rational use of resources; (v) consolidate and reinforce openness to the outside world; (vi) adopt an appropriate communication strategy; and (vii) include the gender dimension in all security development strategies.
300. The strategic pillars in this area are as follows:
• capacity building for internal security and civil protection forces;
• design of a security coverage mechanism more adapted to the territory;
• improvement of road and river safety;
• reinforcement of the prevention and management of community conflicts;
• reinforcement of the disaster management strategy;
• establishment of good governance of internal security and civil protection;
• strengthening of bilateral and multilateral cooperation.
10 COORDINATION AND MONITORING-EVALUATION MECHANISMS 301. Analyses show low operationalization of the monitoring-evaluation
institutional mechanism, low capacity of the PRSP Unit, low institutional capacity with respect to methods, tools, instruments and indicators used. Consequently, the information system is still incapable of accurately measuring the performance indicators. The reliability and consistency of the information and statistics obtained from various sources remain a serious problem. The poor quality of basic statistics was also noted.

GPRSP 2007 – 2011 Page 71 of 224
302. It has become necessary, at the level of the institutional mechanism, to clarify and simplify the mechanism. As regards the methods, tools, instruments and indicators used, PRSP evaluation requires harmonization with the Three-year Programme and Special Investment Budget, as well as programme budgets. It also requires a review of the number and type of indicators by component or thematic area for better understanding and greater relevance.
10.1 Institutional Monitoring-Evaluation Mechanism 303. The PRSP institutional mechanisms comprise: (i) a Policy Committee,
(ii) a Mali-Development Partners Joint Committee, (iii) a National Steering Committee, and (iv) a Technical Secretariat. The PRSP process is conducted and coordinated by the Ministry responsible for the Economy.
304. The Policy Committee is the policy and decision-making organ of the PRSP preparation and monitoring process. To that end, it is responsible for: (i) defining policy with respect to the conduct of the process for growth and poverty reduction under the PRSP, (ii) considering issues and proposals submitted by the Technical Secretariat for decision, and (iii) submitting, if necessary, the final documents to the Government for approval.
305. The Policy Committee comprises: (i) the Prime Minister, (ii) the members of Government, (iii) the President of the High Council for Local Authorities, (iv) the President of the National Employers’ Council of Mali, (v) the President of the Chamber of Commerce and Industry of Mali, (vi) the President of the Permanent Assembly of the Chambers of Agriculture of Mali, (vi) the President of the National Federation of Craftsmen of Mali, (vii) the President of the National Civil Society Council, (viii) the Federation of NGO Associations, (ix) Secretaries-General of the National Workers’ Unions of Mali, and (x) the President of the Association of Municipal Councils of Mali. The Minister responsible for the Economy will provide secretarial services.
306. The Mali-Development Partners Joint Committee is the organ for consultation between the Government and all TFPs in the preparation and monitoring of the Poverty Reduction Strategy Paper. In this capacity, it is responsible for: (i) considering issues and proposals submitted to it by the Steering Committee for opinion, (ii) giving opinions on the said issues and proposals before submission to the Policy Committee, and (iii) monitoring the development of cooperation in key areas for better coordination of aid.
307. The Mali-Development Partners Joint Committee comprises: (i) the Minister responsible for the Economy (Chair), (ii) the Minister responsible for the Plan and Territorial Development, (iii) the Minister responsible for Foreign Affairs and International Cooperation, (iv) the Minister responsible for Territorial Administration and Local Authorities, (v) the Minister responsible for the Public Service, State Reform and Relations with the Institutions, sectoral Ministers (if necessary), and (vi) the Heads of Aid and Cooperation Agencies, and Ambassadors.
308. A coordination organ has been set up with the Minister of the Economy and Finance, known as the Steering Committee. It is responsible for: (i) promoting synergies between the various stakeholders (Government, civil society, technical and financial partners), (ii) carrying out the technical activities of the PRSP process, (iii) initiating, boosting and coordinating all activities relating to the preparation, monitoring and evaluation of the PRSP, (iv) facilitating consultations between the different parties, (v) seeing to the

GPRSP 2007 – 2011 Page 72 of 224
technical quality of the documents produced, and (vi) seeing to the publication and dissemination of documents. The Steering Committee is chaired by the Secretary-General of the Ministry responsible for the Economy.
309. The National Technical Committee is organized into working groups on strategic orientation areas of focus: (i) Macro-economic and Financial Framework, (ii) Consolidation of Structural Reforms, (iii) Infrastructure and Development of the Productive Sector, and (iv) Strengthening of the Social Sector.
310. A Regional Committee is set up in each region and in Bamako District to conduct the PRSP process at the regional level. The Regional Committee is chaired by the Governor. It comprises representatives of the regional technical services, the civil society and decentralized authorities. The technical secretarial services are provided by DRPSIAP.
311. A Local Committee is set up in each regional district (“cercle”) and each council in Bamako District to conduct the PRSP process at the local level. The Local PRSP Committee is chaired by the Prefect in the regions and by the Council Mayor in Bamako District. It comprises representatives of the district council, technical services, the civil society and mayors of the districts or Bamako District.
312. The Technical Coordination Unit of the Poverty Reduction Strategy Paper (CCSLP) provides technical secretarial services to the institutional mechanisms of the Poverty Reduction Strategy Paper. The Technical Secretariat is responsible for: (i) monitoring the normal conduct of thematic groups within which it plays the role of secretariat and leadership, (ii) preparing a summary of the discussions in thematic groups, (iii) ensuring coherence between the discussions of thematic groups, (iv) preparing the documents to be submitted to the Steering Committee, the National Technical Committee, the Mali-Development Partners Joint Committee or the Policy Committee, and (v) organizing and conducting national and regional seminars/workshops.
10.2 Strengthening of the National Statistics System (SSN) 313. The National Statistics System (SSN), comprising, in particular, the
National Statistics and Data Processing Directorate and its regional agencies, as well as Planning and Statistics Units (CPS) of the sectoral ministries, is not currently capable of providing the information required for monitoring and evaluating poverty reduction programmes and projects. To remedy this situation, the SSN prepared a Statistics Master Plan 2006-2010 (SDS), including an action plan.
314. The Master Plan (SDS), adopted by the Government in January 2006, makes a diagnosis of the SSN. The diagnosis reveals the major problems encountered by the SSN: (i) existence of serious institutional shortcomings, (ii) lack of a concerted strategy, making coordination difficult, (iii) lack of a real human resources policy, (iv) inadequate utilization of existing data, and (v) inadequate financial resources.
315. In order to guarantee better monitoring and evaluation of MDGs and PRSP II, the SDS proposes solutions centred on the following points: (i) development of statistics production, (ii) development of the utilization of statistics, and (iii) institutional development.

GPRSP 2007 – 2011 Page 73 of 224
The main activities selected for the 2007 - 2001 period are as follows:
316. Pillar 1 : (i) preparation of procedures manuals for the various surveys (consultancy fees, validation workshop, pilot surveys), (ii) application of the methodology in preparing national accounts according to international standards, (iii) application of the methodology in preparing regional accounts, (iv) preparation of nomenclatures, (v) preparation of national accounts in accordance with SCN93, (vi) preparation of regional accounts, (vii) production of business activity indices, (viii) conduct of several nationwide surveys and census (ELIM 2009, RGPH 2008, EMEP 2011, Survey 1-2-3 /Democracy and good governance survey (2007), Basic infrastructure/water point), (ix) implementation of sectoral statistic operations (basic surveys: Informal gold production, Annual EAC, Production of fruits and vegetables, fisheries, private investment, transport, communication, industry, trade, EDS V 2010, Tourism/handicraft, water points), and (x) establishment of information systems in the various CPS.
317. Pillar 2 : (i) analyses and research based on survey and census data (10 studies), (ii) research on modelling of the national economy, (iii) research on modelling of the national economy, (iv) economic and financial studies on sub-sectors (rice, cattle, meat, fisheries, poultry, shea), (v) a study on the use of statistics, (vi) preparation of a dissemination plan for each CPS, (vii) opening of a digital library in each CPS, (viii) opening of a digital library in the DNSI, (ix) creation of a Website for each CPS, (x) preparation and implementation of a plan for communication with the public and private press, (xi) opening of the Malikunnafoni database in DNSI and in DRPSIAPs, and (xii) organization of information and sensitization seminars.
318. Pillar 3 : (i) establishment of an incentive system for staff employed in the national statistics system (special rules and regulations, career plan, allowances, etc.), (ii) organization of further training courses, (iii) granting of scholarships to students admitted to statistics schools, (iv) preparation of a plan for the recruitment of statisticians into the Public Service, (v) organization of seminars for the training of users in statistics methods and language, (vi) creation and establishment of CCSI Permanent Secretariat, (vii) creation of the National Statistics and Data Processing Institute, (viii) construction and equipment of a head office for the National Institute, and (ix) equipment of CPS.
10.3 Monitoring and Evaluation Indicators 319. For PRSP II, a limited number of indicators were selected to serve as
an instrument panel. These indicators facilitate global monitoring of the progress made. At the sectoral level, a more detailed range of indicators will be monitored.

GPR
SP 2
007
– 20
11
Page
74
of 2
24
Tab
le 8
: Ove
rall
Indi
cato
rs P
RSP
II
IND
ICA
TO
R
TY
PE3
RE
F.
MD
G
2015
G
PRSP
OB
JEC
TIV
ES
IN F
IGU
RE
S PE
RIO
DIC
ITY
SO
UR
CE
2007
20
08
2009
20
10
2011
POV
ER
TY
AN
D F
OO
D S
EC
UR
ITY
In
cide
nce
of p
over
ty
I 68
.3%
In
200
1 34
%
56
.0
54.8
53
.6
52.4
51
.2
Ever
y 5
year
s/
Ann
ual s
ampl
e O
DH
D/
DN
SI
Inci
denc
e of
pov
erty
in ru
ral a
reas
I
75.9
%
In 2
001
38%
72
70
67
63
61
Ev
ery
5 ye
ars/
A
nnua
l sam
ple
OD
HD
/ D
NSI
SUST
AIN
ED
AC
CE
LE
RA
TE
D G
RO
WT
H
Rea
l GD
P g
row
th ra
te
I
7.
0 6.
3 6.
5 7.
8 7.
1 A
nnua
l D
NPD
FIN
AN
CIA
L S
TA
BIL
ITY
B
asic
bud
get
bala
nce
(as
perc
enta
ge o
f G
DP
) R
-1
.1
1.3
1. 4
1.
5 1.
4 A
nnua
l D
NSI
Ave
rage
ann
ual
infla
tion
rate
(W
AE
MU
C
onve
rgen
ce C
riter
ion)
I
<=3%
0.2
0.5
0.3
0.2
0.2
Ann
ual
DN
SI
Tax
pres
sure
(W
AE
MU
C
onve
rgen
ce
Crit
erio
n)
R
> 17
%
14
.9
17.0
17
.0
17.0
17
.0
Ann
ual
DG
I/DN
PD
GO
VE
RN
AN
CE
R
anki
ng
of
Mal
i in
th
e C
orru
ptio
n P
erce
ptio
ns
Inde
x
repo
rt by
Tr
ansp
aren
cy In
tern
atio
nal
I 2.
94 (8
8 ou
t of
158)
in
2005
3.
2 3.
5 3.
9 4.
2 4.
6 A
nnua
l TI
/OD
HD
Rat
e of
N
atio
nal
Bud
get
effe
ctiv
ely
trans
ferr
ed to
Loc
al A
utho
ritie
s A
Ann
ual
DN
T/M
EF
3 A
: A
ctiv
ities
, R :
Res
ults
, I :
Impa
ct
4 http
://w
ww
.dip
low
eb.c
om/g
raph
ique
s/co
rrup
tion0
5060
22.h
tm

GPR
SP 2
007
– 20
11
Page
75
of 2
24
IND
ICA
TO
R
TY
PE3
RE
F.
MD
G
2015
G
PRSP
OB
JEC
TIV
ES
IN F
IGU
RE
S PE
RIO
DIC
ITY
SO
UR
CE
2007
20
08
2009
20
10
2011
RU
RA
L D
EV
EL
OPM
EN
T
Are
as (h
a) re
fore
sted
A
20
05
4 60
2
6 89
4 7
763
8 48
6 9
089
1210
2A
nnua
l M
EA
ED
UC
AT
ION
N
et e
nrol
men
t rat
e in
firs
t cyc
le (M
DG
) by
gend
er
R
10
0%
78.3
82
.2
86.4
88
.2
90.4
A
nnua
l C
PS/
MEN
Pup
il/te
ache
r rat
io in
prim
ary
educ
atio
n A
20
05
54
53
52
51
50
50
A
nnua
l C
PS/
MEN
HE
AL
TH
AN
D N
UT
RIT
ION
D
eath
rate
am
ong
child
ren
belo
w 5
yea
rs
old
(MD
G)
I 22
9.05
In 2
001
21
1
A
nnua
l SN
IS
Mat
erna
l dea
th ra
te (M
DG
) I
5826
in 2
001
291
574
Ann
ual
SNIS
Per
cent
age
of p
opul
atio
n liv
ing
with
in 5
km
from
a fu
nctio
nal h
ealth
cen
tre
A
44%
in
2002
52%
54
%
56%
A
nnua
l C
PS/H
ealth
HIV
/AID
S p
reva
lenc
e ra
te
I 1.
7 %
in
2001
1.3%
5-
year
per
iod
CPS
/Hea
lth
Per
cent
age
of
unde
rwei
ght
child
ren
belo
w 5
yea
rs (M
DG
) I
38%
7 in
200
1 19
%
28%
A
nnua
l sam
ple
CPS
Hea
lth
DR
INK
ING
WA
TE
R
Pro
porti
on o
f ur
ban
and
rura
l pop
ulat
ion
with
su
stai
nabl
e ac
cess
to
a
bette
r so
urce
of w
ater
(MD
G)
A
61.6
%
In 2
001
100%
68
.1
Rur
al
72.9
ur
ban
69.7
74
.1
71.2
75
.2
72.5
76
.1
73.8
R
ural
77
.8
urba
n
Ann
ual
DN
H
5 C
PS
/Hea
lth: I
ndic
ator
s of
PR
OD
ES
S a
nd P
rogr
amm
e B
udge
ts
6 CP
S/H
ealth
: Ind
icat
ors
of P
RO
DE
SS
and
Pro
gram
me
Bud
gets
7 C
PS
/Hea
lth: I
ndic
ator
s of
PR
OD
ES
S a
nd P
rogr
amm
e B
udge
ts

GPR
SP 2
007
– 20
11
Page
76
of 2
24
IND
ICA
TO
R
TY
PE3
RE
F.
MD
G
2015
G
PRSP
OB
JEC
TIV
ES
IN F
IGU
RE
S PE
RIO
DIC
ITY
SO
UR
CE
2007
20
08
2009
20
10
2011
EM
PLO
YM
EN
T
Num
ber o
f new
jobs
cre
ated
A
20
00
In 2
005
20
00
2000
20
00
2000
20
00
Ann
ual
MEF
P
GE
ND
ER
EQ
UIT
Y
Girl
s/bo
ys
ratio
in
pr
imar
y ed
ucat
ion
(MD
G)
R
0.65
8 In
200
1 1
0.69
0.
73
0.75
0.
79
0.84
A
nnua
l C
PS
Educ
atio
n/C
ND
IFE
TR
AN
SPO
RT
INFR
AST
RU
CT
UR
E
Num
ber o
f km
of t
arre
d ro
ads
mai
ntai
ned
A
2005
3
418
3
840
4 07
1 4
315
4 57
4 4
818
Ann
ual
DN
R
8 C
PS
/Edu
catio
n: In
dica
tors
of P
RO
DE
C a
nd P
rogr
amm
e B
udge
ts.
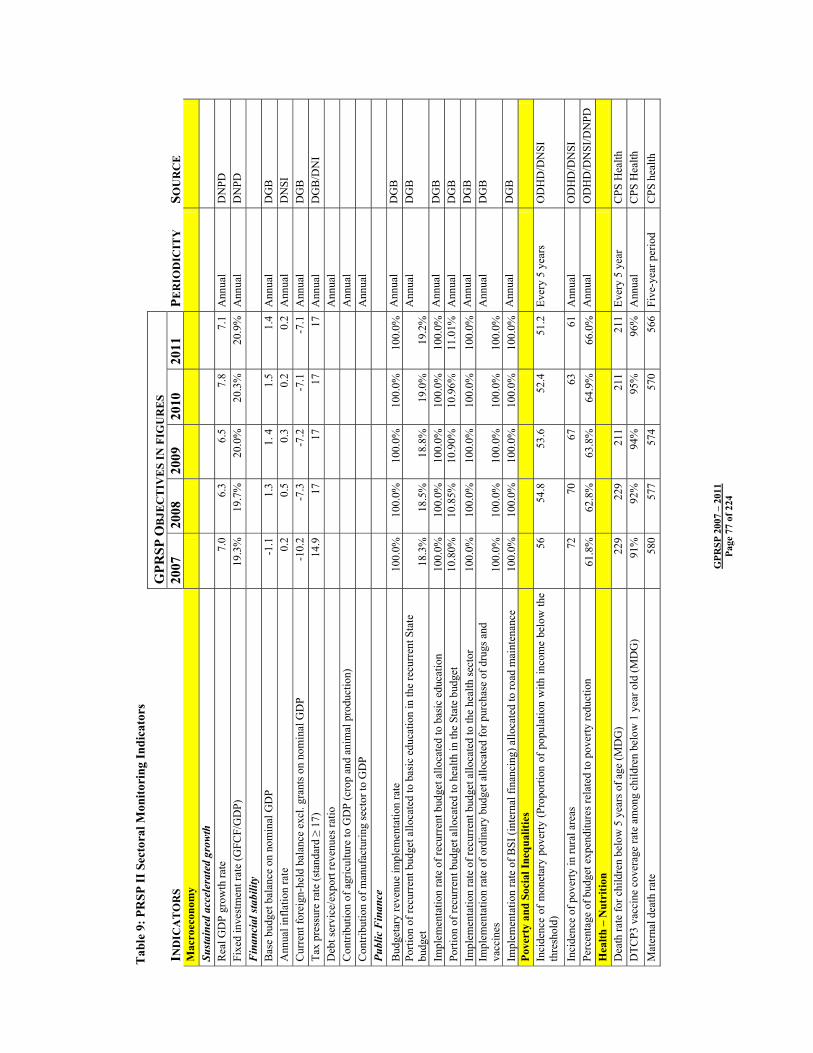
GPR
SP 2
007
– 20
11
Page
77
of 2
24
Tab
le 9
: PR
SP II
Sec
tora
l Mon
itori
ng In
dica
tors
GPR
SP O
BJE
CT
IVE
S IN
FIG
UR
ES
IND
ICA
TO
RS
2007
20
08
2009
20
10
2011
PE
RIO
DIC
ITY
SO
UR
CE
M
acro
econ
omy
Su
stai
ned
acce
lera
ted
grow
th
R
eal G
DP
grow
th ra
te
7.0
6.3
6.5
7.8
7.1
Ann
ual
DN
PD
Fixe
d in
vest
men
t rat
e (G
FCF/
GD
P)
19.3
%19
.7%
20.0
%
20.3
%20
.9%
Ann
ual
DN
PD
Fin
anci
al st
abili
ty
B
ase
budg
et b
alan
ce o
n no
min
al G
DP
-1.1
1.3
1. 4
1.
51.
4A
nnua
l D
GB
A
nnua
l inf
latio
n ra
te
0.2
0.5
0.3
0.2
0.2
Ann
ual
DN
SI
Cur
rent
fore
ign-
held
bal
ance
exc
l. gr
ants
on
nom
inal
GD
P
-10.
2-7
.3-7
.2
-7.1
-7.1
Ann
ual
DG
B
Tax
pres
sure
rate
(sta
ndar
d ≥
17)
14.9
1717
17
17A
nnua
l D
GB
/DN
I D
ebt s
ervi
ce/e
xpor
t rev
enue
s rat
io
A
nnua
l
Con
tribu
tion
of a
gric
ultu
re to
GD
P (c
rop
and
anim
al p
rodu
ctio
n)
A
nnua
l
Con
tribu
tion
of m
anuf
actu
ring
sect
or to
GD
P
Ann
ual
Pu
blic
Fin
ance
Bud
geta
ry re
venu
e im
plem
enta
tion
rate
10
0.0%
100.
0%10
0.0%
10
0.0%
100.
0%A
nnua
l D
GB
Po
rtion
of r
ecur
rent
bud
get a
lloca
ted
to b
asic
edu
catio
n in
the
recu
rren
t Sta
te
budg
et
18.3
%18
.5%
18.8
%
19.0
%19
.2%
Ann
ual
DG
B
Impl
emen
tatio
n ra
te o
f rec
urre
nt b
udge
t allo
cate
d to
bas
ic e
duca
tion
100.
0%10
0.0%
100.
0%
100.
0%10
0.0%
Ann
ual
DG
B
Porti
on o
f rec
urre
nt b
udge
t allo
cate
d to
hea
lth in
the
Stat
e bu
dget
10
.80%
10.8
5%10
.90%
10
.96%
11.0
1%A
nnua
l D
GB
Im
plem
enta
tion
rate
of r
ecur
rent
bud
get a
lloca
ted
to th
e he
alth
sect
or
100.
0%10
0.0%
100.
0%
100.
0%10
0.0%
Ann
ual
DG
B
Impl
emen
tatio
n ra
te o
f ord
inar
y bu
dget
allo
cate
d fo
r pur
chas
e of
dru
gs a
nd
vacc
ines
10
0.0%
100.
0%10
0.0%
10
0.0%
100.
0%A
nnua
l D
GB
Impl
emen
tatio
n ra
te o
f BSI
(int
erna
l fin
anci
ng) a
lloca
ted
to ro
ad m
aint
enan
ce
100.
0%10
0.0%
100.
0%
100.
0%10
0.0%
Ann
ual
DG
B
Pove
rty
and
Soci
al In
equa
litie
s
Inci
denc
e of
mon
etar
y po
verty
(Pro
porti
on o
f pop
ulat
ion
with
inco
me
belo
w th
e th
resh
old)
56
54.8
53.6
52
.451
.2Ev
ery
5 ye
ars
OD
HD
/DN
SI
Inci
denc
e of
pov
erty
in ru
ral a
reas
72
7067
63
61A
nnua
l O
DH
D/D
NSI
Pe
rcen
tage
of b
udge
t exp
endi
ture
s rel
ated
to p
over
ty re
duct
ion
61
.8%
62.8
%63
.8%
64
.9%
66.0
%A
nnua
l O
DH
D/D
NSI
/DN
PD
Hea
lth –
Nut
ritio
n
Dea
th ra
te fo
r chi
ldre
n be
low
5 y
ears
of a
ge (M
DG
) 22
922
921
1 21
121
1Ev
ery
5 ye
ar
CPS
Hea
lth
DTC
P3 v
acci
ne c
over
age
rate
am
ong
child
ren
belo
w 1
yea
r old
(MD
G)
91%
92%
94%
95
%96
%A
nnua
l C
PS H
ealth
M
ater
nal d
eath
rate
58
057
757
4 57
056
6Fi
ve-y
ear p
erio
d C
PS h
ealth

GPR
SP 2
007
– 20
11
Page
78
of 2
24
G
PRSP
OB
JEC
TIV
ES
IN F
IGU
RE
S
IN
DIC
AT
OR
S 20
07
2008
20
09
2010
20
11
PER
IOD
ICIT
Y
SOU
RC
E
Rat
e of
ass
iste
d bi
rths,
incl
udin
g A
TR
53%
56%
60%
63
%65
%A
nnua
l C
PS H
ealth
%
of p
opul
atio
n liv
ing
with
in 5
km
of a
func
tiona
l hea
lth c
entre
52
%54
%56
%
58%
60%
Ann
ual
CPS
hea
lth
Ave
rage
num
ber o
f pre
nata
l con
sulta
tions
per
wom
an
2.60
2.80
3.00
3.
153.
30A
nnua
l C
PS H
ealth
Pe
rcen
tage
of c
hild
ren
belo
w 5
yea
rs w
ith re
tard
ed g
row
th (c
hron
ic m
alnu
tritio
n)
32%
29%
28%
25
%23
%Ev
ery
5 ye
ars
CPS
Hea
lth
CPN
cov
erag
e ra
te
72%
76%
80%
83
%86
%A
nnua
l C
PS H
ealth
H
IV/A
IDS
prev
alen
ce ra
te a
mon
g pr
egna
nt w
omen
age
d 15
to 2
4 ye
ars
1.7%
1.5%
1.3%
1.
3%1.
2%Ev
ery
5 ye
ars
CPS
H
ealth
/Sur
veill
ance
R
epor
t E
duca
tion
G
ross
enr
olm
ent r
ate
in p
rimar
y ed
ucat
ion
by g
ende
r 77
.3%
79.7
%82
.1%
84
.6%
87.2
%A
nnua
l C
PS/M
EN
- Girl
s 66
.8%
68.6
%70
.5%
72
.4%
74.3
%A
nnua
l C
PS/M
EN
- Boy
s 86
.6%
88.2
%89
.8%
91
.4%
93.1
%A
nnua
l C
PS/M
EN
Tran
sitio
n ra
te fr
om B
asic
1 to
Bas
ic 2
72
.2%
69.5
%66
.8%
64
.0%
61.3
%A
nnua
l C
PS/M
EN
Prim
ary
educ
atio
n co
mpl
etio
n ra
te
52.0
%56
.4%
59.3
%
61.9
%64
.2%
Ann
ual
CPS
/MEN
Pe
rcen
tage
of r
epea
ters
in p
rimar
y ed
ucat
ion
14.9
%13
.7%
12.4
%
11.2
%9.
9%A
nnua
l C
PS/M
EN
- Girl
s 16
.4%
15.6
%14
.9%
14
.1%
13.4
%A
nnua
l C
PS/M
EN
- Boy
s 15
.6%
14.5
%13
.6%
12
.7%
11.8
%A
nnua
l C
PS/M
EN
Pupi
l/tea
cher
ratio
in p
rimar
y ed
ucat
ion
5352
51
5050
Ann
ual
CPS
/MEN
Li
tera
cy ra
te o
f per
sons
age
d 15
yea
rs a
nd a
bove
26
.2%
28.4
%30
.8%
33
.4%
36.2
%Ev
ery
5 ye
ars
DN
SI
Em
ploy
men
t
Num
ber o
f new
jobs
cre
ated
20
0020
0020
00
2000
2000
Ann
ual
AN
PE
Gen
der
Equ
ity
G
irls/
boys
ratio
in p
rimar
y ed
ucat
ion
0.69
0.73
0.75
0.
790.
84A
nnua
l C
PS/E
duca
tion
Wat
er -
Ene
rgy
– M
inin
g
Prop
ortio
n of
the
popu
latio
n w
ith a
cces
s to
a so
urce
of d
rinki
ng w
ater
70
.4%
72.7
%75
.0%
77
.5%
80.0
%A
nnua
l C
PS/M
inin
g - U
rban
74
.3%
76.5
%78
.7%
81
.0%
83.3
%A
nnua
l C
PS/M
inin
g - R
ural
66
.4%
67.4
%68
.4%
69
.4%
70.5
%A
nnua
l C
PS/M
inin
g Pr
opor
tion
of th
e po
pula
tion
with
acc
ess t
o el
ectri
city
16
.56%
17.3
8%18
.24%
19
.14%
20.0
9%A
nnua
l C
PS/M
inin
g - U
rban
54
.85%
57.5
6%60
.42%
63
.41%
66.5
5%A
nnua
l C
PS/M
inin
g - R
ural
3.
00%
3.83
%4.
90%
6.
26%
8.00
%A
nnua
l C
PS/M
inin
g
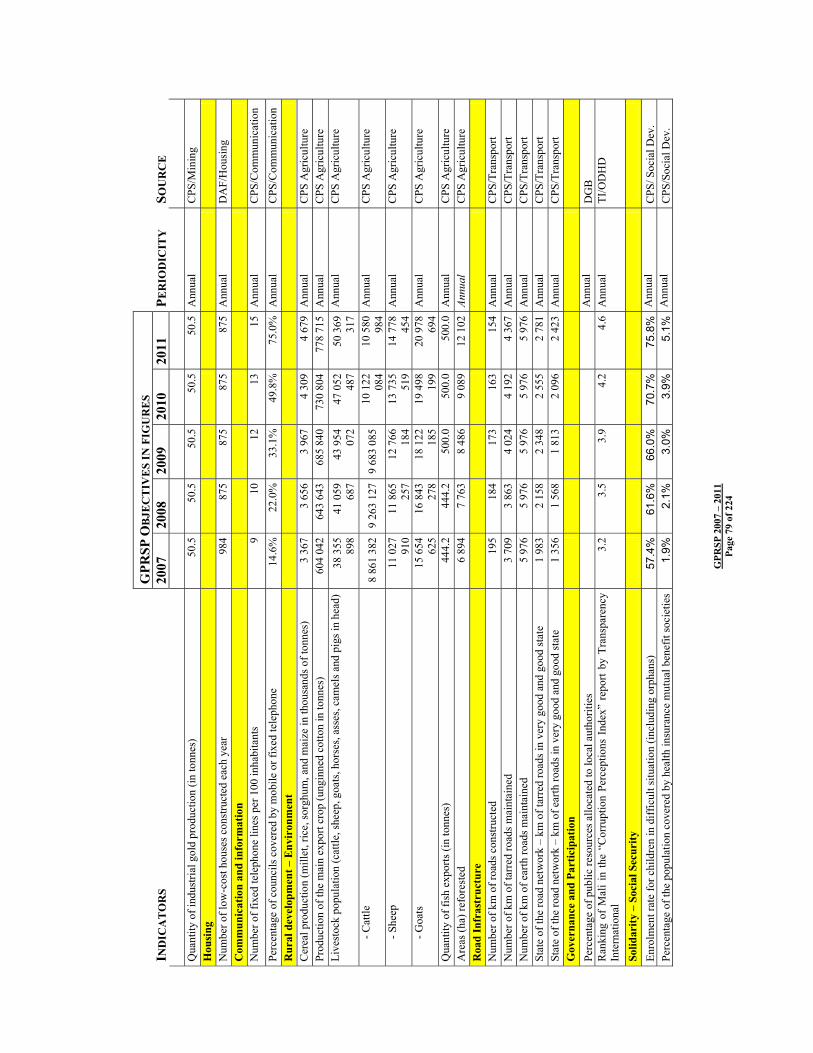
GPR
SP 2
007
– 20
11
Page
79
of 2
24
G
PRSP
OB
JEC
TIV
ES
IN F
IGU
RE
S
IN
DIC
AT
OR
S 20
07
2008
20
09
2010
20
11
PER
IOD
ICIT
Y
SOU
RC
E
Qua
ntity
of i
ndus
trial
gol
d pr
oduc
tion
(in to
nnes
) 50
.550
.550
.5
50.5
50.5
Ann
ual
CPS
/Min
ing
Hou
sing
Num
ber o
f low
-cos
t hou
ses c
onst
ruct
ed e
ach
year
98
487
587
5 87
587
5A
nnua
l D
AF/
Hou
sing
C
omm
unic
atio
n an
d in
form
atio
n
Num
ber o
f fix
ed te
leph
one
lines
per
100
inha
bita
nts
910
12
1315
Ann
ual
CPS
/Com
mun
icat
ion
Perc
enta
ge o
f cou
ncils
cov
ered
by
mob
ile o
r fix
ed te
leph
one
14.6
%22
.0%
33.1
%
49.8
%75
.0%
Ann
ual
CPS
/Com
mun
icat
ion
Rur
al d
evel
opm
ent –
Env
iron
men
t
Cer
eal p
rodu
ctio
n (m
illet
, ric
e, so
rghu
m, a
nd m
aize
in th
ousa
nds o
f ton
nes)
3 3
67
3
656
3 9
67
4 30
9
4 67
9 A
nnua
l C
PS A
gric
ultu
re
Prod
uctio
n of
the
mai
n ex
port
crop
(ung
inne
d co
tton
in to
nnes
) 60
4 04
264
3 64
368
5 84
0 73
0 80
477
8 71
5A
nnua
l C
PS A
gric
ultu
re
Live
stoc
k po
pula
tion
(cat
tle, s
heep
, goa
ts, h
orse
s, as
ses,
cam
els a
nd p
igs i
n he
ad)
38 3
55
898
41 0
59
687
43 9
54
072
47 0
52
487
50 3
69
317
Ann
ual
CPS
Agr
icul
ture
- Cat
tle
8 86
1 38
29
263
127
9 68
3 08
5 10
122
08
410
580
98
4A
nnua
l C
PS A
gric
ultu
re
- She
ep
11 0
27
910
11 8
65
257
12 7
66
184
13 7
35
519
14 7
78
454
Ann
ual
CPS
Agr
icul
ture
- Goa
ts
15 6
54
625
16 8
43
278
18 1
22
185
19 4
98
199
20 9
78
694
Ann
ual
CPS
Agr
icul
ture
Qua
ntity
of f
ish
expo
rts (i
n to
nnes
)
444
.2
4
44.2
50
0.0
50
0.0
50
0.0
Ann
ual
CPS
Agr
icul
ture
A
reas
(ha)
refo
rest
ed
6 89
47
763
8 48
6 9
089
12 1
02An
nual
C
PS A
gric
ultu
re
Roa
d In
fras
truc
ture
Num
ber o
f km
of r
oads
con
stru
cted
19
518
417
3 16
315
4A
nnua
l C
PS/T
rans
port
Num
ber o
f km
of t
arre
d ro
ads m
aint
aine
d 3
709
3 86
34
024
4 19
24
367
Ann
ual
CPS
/Tra
nspo
rt N
umbe
r of k
m o
f ear
th ro
ads m
aint
aine
d 5
976
5 97
65
976
5 97
65
976
Ann
ual
CPS
/Tra
nspo
rt St
ate
of th
e ro
ad n
etw
ork
– km
of t
arre
d ro
ads i
n ve
ry g
ood
and
good
stat
e 1
983
2 15
82
348
2 55
52
781
Ann
ual
CPS
/Tra
nspo
rt St
ate
of th
e ro
ad n
etw
ork
– km
of e
arth
road
s in
very
goo
d an
d go
od st
ate
1 35
61
568
1 81
3 2
096
2 42
3A
nnua
l C
PS/T
rans
port
Gov
erna
nce
and
Part
icip
atio
n
Perc
enta
ge o
f pub
lic re
sour
ces a
lloca
ted
to lo
cal a
utho
ritie
s
Ann
ual
DG
B
Ran
king
of
Mal
i in
the
“Cor
rupt
ion
Perc
eptio
ns I
ndex
” re
port
by T
rans
pare
ncy
Inte
rnat
iona
l 3.
23.
53.
9 4.
24.
6A
nnua
l TI
/OD
HD
Solid
arity
– S
ocia
l Sec
urity
Enro
lmen
t rat
e fo
r chi
ldre
n in
diff
icul
t situ
atio
n (in
clud
ing
orph
ans)
57
.4%
61.6
%66
.0%
70
.7%
75.8
%A
nnua
l C
PS/ S
ocia
l Dev
. Pe
rcen
tage
of t
he p
opul
atio
n co
vere
d by
hea
lth in
sura
nce
mut
ual b
enef
it so
ciet
ies
1.9%
2.1%
3.0%
3.
9%5.
1%A
nnua
l C
PS/S
ocia
l Dev
.

GPRSP 2007 – 2011 Page 80 of 224
11. IMPLEMENTATION OF THE PARIS DECLARATION 320. The Government of Mali has made budget support a choice instrument of its
financial cooperation. Accordingly, it has initiated very close dialogue with Technical and Financial Partners (TFP) leading to the signing of Framework Arrangements on general and sectoral budget support. All these activities contribute to the implementation of the Paris Declaration on Aid Effectiveness.
321. To give fresh impetus to the alignment and harmonization process at the national level, it is necessary to immediately assume ownership of the 12 indicators of progress of the Paris Declaration and agree on the monitoring process with the TFPs so as to analyze the progress made. Consequently, the 2008 and 2010 targets should be met. To that end, the preparation of an action plan by the Government of Mali for the implementation of the 12 indicators is a priority.
322. A Joint Government –TFP Secretariat will be established to prepare the action plan for implementing and monitoring the Paris Declaration.
12. PRSP II FINANCING PLAN 323. The PRSP implementation strategy is based on a significant increase in
domestic financing through greater mobilization of domestic resources (tax pressure rate of at least 17% in 2008).
Overview of Some Principles 324. The PRSP is a common framework for all the economic and social
development policies, programmes and projects in Mali. Consequently, PRSP financing cannot a priori be distinct from the State budget.
325. For 2007, the modelling work helped to harmonize expenditure projections of the macro-economic framework with those of the budgetary framework. This harmonization was obtained by exogenously basing the forecasts of the macro-economic framework on those of the budgetary framework by putting in place a conversion scale to make the two expenditure nomenclatures compatible. On the other hand, for 2008-2011, the data are those from the macro-economic framework corresponding to the voluntarist growth scenario adopted for PRSP (7% of average annual growth, and achievement of tax pressure rate of 17% as from 2008).
326. The PRSP actions matrix developed in recent weeks was based on the programme budgets for the 2007-2009 three-year period (which contain lists of actions, but not costs) and on various sector programmes and projects from the Ministries concerned (which contain information on costs). The information on costs is very heterogeneous for the different projects and sectors of activities, and is not directly comparable. Furthermore, there are areas for which cost estimates in figures for scheduled activities or action programmes are not available.
PRSP Financing Table 327. The table selected for PRSP financing is identical with the GFFT projections
made by DGB for the 2007-2011 period. However, this table may under-estimate the GFFT financing gaps. Indeed, the implicit assumptions underlying the GFFT projections made by the Directorate General of the Budget for 2008-2011 are, a priori, more conservative than those from the implementation of the voluntarist scenario.
328. A more detailed financing plan will be prepared on the basis of the MDG-PRSP action plan, and will indicate the financing gap, as well as the financing acquired not only through budget support from TFPs but also through the large
GPRSP 2007 – 2011 Page 81 of 224
projects and programmes arising from bilateral and multilateral cooperation (10th EDF, CASRP/BM, IMF, ADB, etc).
Future Activities 329. PRSP implementation is an ongoing process, involving gradual improvement
of methods used in GFFT preparation. Furthermore, some activities to be carried out in the short term and which should be taken into consideration during the next PRSP review in 2007, are as follows:
• improvement of evaluation of the costs of actions proposed in the PRSP, under the normal budget process, since the Directorate General of the Budget alone is authorized and competent to carry out the work;
• prioritization and finalization of proposed actions in close collaboration with the sectoral services concerned;
• joint preparation of costs by the Departments of Financial Affairs of Ministries in MTEFs, and the Directorate General of the Budget;
• identification of net financing gaps at the sectoral level;
• putting together the net financing gaps for the entire Malian economy;
• search for external resources from TFPs to meet financing requirements, at least for activities considered as of priority;
• finalization and consistency between MDG action plan and PRSP II;
• preparation of a financing plan for PRSP II;
• mainstreaming of the results of ongoing surveys in poverty analyses;
• finalization of the institutional mechanism and list of monitoring-evaluation indicators;
• preparation of the PRSP II communication plan; and
• preparation of the PRSP II logical framework.

GPR
SP 2
007
– 20
11
Page
82
of 2
24
Tab
le 1
0: P
RSP
Fin
anci
ng P
lan
RES
OU
RC
ES B
Y TY
PE/S
OU
RC
E 20
0620
0720
08
2009
2010
2011
TOTA
L
TAX
REV
ENU
E 48
7,52
353
4,48
258
0,17
1 63
0,09
689,
993
755,
739
3677
,998
NO
N-T
AX
RE
VE
NU
E
41,2
3439
,568
46,9
43
49,7
7957
,373
53,2
628
8,15
7
NO
N-R
EC
UR
RE
NT
REC
EIP
TS
25,9
0710
,472
10,6
6 11
,225
12,1
4111
,125
81,5
30
SU
PPL.
BU
DG
ETS
OF
SPEC
. AC
CO
UN
TS &
FU
ND
S 5,
387
5,67
26,
091
5,99
26,
785
7,20
437
,131
TO
TAL
INTE
RN
AL
FIN
AN
CIN
G
560,
051
590,
194
643,
865
697,
086
766,
292
827,
328
4084
,816
EX
TER
NAL
FIN
AN
CIN
G B
SI
233,
465
245,
899
268,
4 29
0,3
317,
234
5,3
1700
,564
BU
DG
ET S
UPP
OR
T 47
,224
49,2
2735
,503
31
,751
34,7
0237
,145
235,
552
TOTA
L EX
TER
NA
L FI
NA
NC
ING
28
0,68
929
5,12
630
3,90
3 32
2,05
135
1,90
238
2,44
519
36,1
16
TOTA
L B
UD
GET
RES
OU
RC
ES
840,
7488
5,32
947,
768
1019
,137
1118
,194
1209
,773
6020
,932
A
DD
ITIO
NA
L R
ESO
UR
CE
REQ
UIR
EMEN
TS
95,0
1991
,281
66,6
17
55,9
1535
,155
31,9
7337
8,96
0 TO
TAL
RES
OU
RC
ES R
EQU
IRED
FO
R P
RSP
IM
PLEM
ENTA
TIO
N
935,
759
976,
601
1014
,385
10
75,0
5211
53,3
4912
41,7
4663
99,8
92
EXPE
ND
ITU
RE/
TYPE
20
0620
0720
08
2009
2010
2011
TOTA
L C
urre
nt e
xpen
ditu
re
513,
711
524,
533
544,
468
576,
673
617,
295
664,
757
3444
,437
Ca
pital
expe
nditu
re (in
terna
l fina
ncing
) 13
5,97
215
1,27
159,
923
169,
787
177,
367
187,
945
982,
264
Cap
ital e
xpen
ditu
re (e
xter
nal f
inan
cing
) 23
3,46
524
5,89
926
8,4
290,
331
7,2
345,
317
00,5
64
Supp
lem
enta
ry b
udge
ts o
f spe
cial
acc
ount
s an
d fu
nds
5,38
75,
672
6,09
1 6,
541
6,78
56,
599
37,0
75
Bud
get s
uppo
rt 47
,224
49,2
2735
,503
31
,751
34,7
0237
,145
235,
552
Tota
l Exp
endi
ture
93
5,75
997
6,60
110
14,3
85
1075
,052
1153
,349
1241
,746
6399
,892
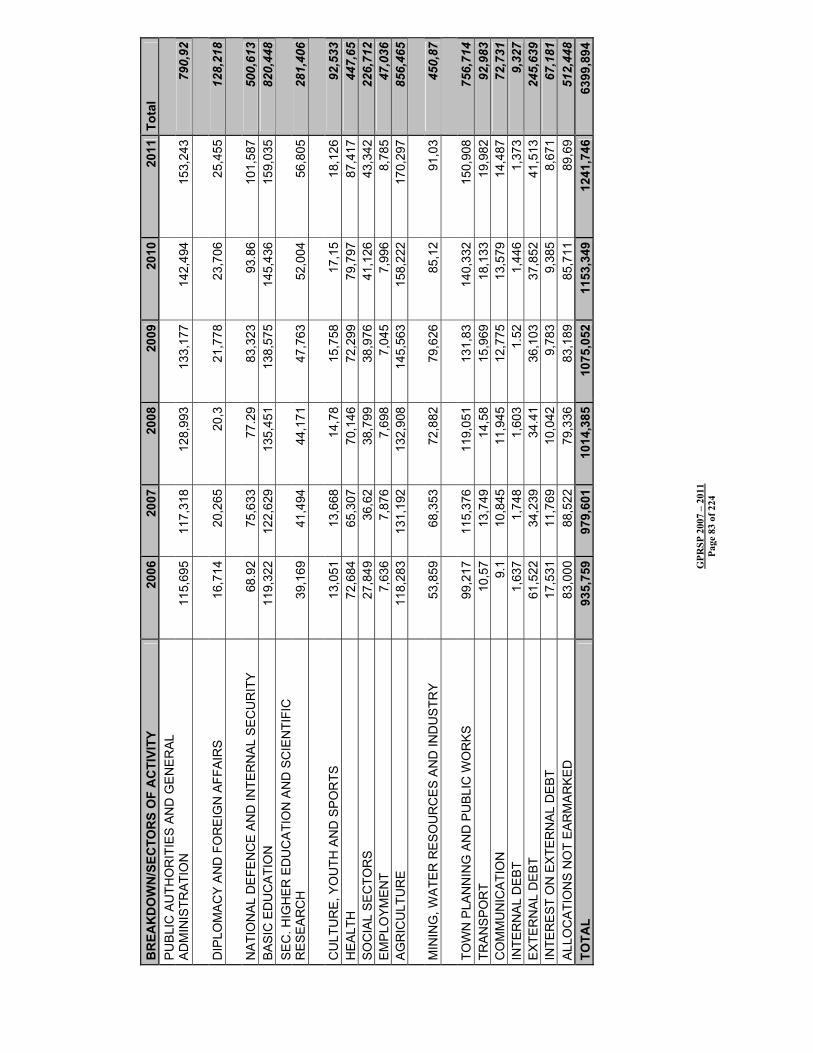
GPR
SP 2
007
– 20
11
Page
83
of 2
24
BR
EAK
DO
WN
/SEC
TOR
S O
F A
CTI
VITY
20
0620
0720
08
2009
2010
2011
Tota
l P
UB
LIC
AU
THO
RIT
IES
AND
GE
NE
RAL
A
DM
INIS
TRA
TIO
N
115,
695
117,
318
128,
993
133,
177
142,
494
153,
243
790,
92
DIP
LOM
AC
Y A
ND
FO
RE
IGN
AFF
AIR
S
16,7
1420
,265
20,3
21
,778
23,7
0625
,455
128,
218
NAT
ION
AL D
EFE
NC
E A
ND
INTE
RN
AL S
EC
UR
ITY
68.9
275
,633
77.2
9 83
,323
93.8
610
1,58
750
0,61
3 B
AS
IC E
DU
CA
TIO
N
119,
322
122,
629
135,
451
138,
575
145,
436
159,
035
820,
448
SEC
. HIG
HER
ED
UC
ATI
ON
AN
D S
CIE
NTI
FIC
R
ESEA
RC
H
39,1
6941
,494
44,1
71
47,7
6352
,004
56,8
0528
1,40
6
CU
LTU
RE,
YO
UTH
AN
D S
POR
TS
13,0
5113
,668
14,7
8 15
,758
17,1
518
,126
92,5
33
HE
ALT
H
72,6
8465
,307
70,1
46
72,2
9979
,797
87,4
1744
7,65
S
OC
IAL
SE
CTO
RS
27
,849
36,6
238
,799
38
,976
41,1
2643
,342
226,
712
EMP
LOYM
ENT
7,63
67,
876
7,69
8 7,
045
7,99
68,
785
47,0
36
AG
RIC
ULT
UR
E
118,
283
131,
192
132,
908
145,
563
158,
222
170,
297
856,
465
MIN
ING
, WAT
ER R
ESO
UR
CE
S A
ND
IND
UST
RY
53,8
5968
,353
72,8
82
79,6
2685
,12
91,0
345
0,87
TOW
N P
LAN
NIN
G A
ND
PU
BLIC
WO
RKS
99
,217
115,
376
119,
051
131,
8314
0,33
215
0,90
875
6,71
4 TR
AN
SP
OR
T 10
,57
13,7
4914
,58
15,9
6918
,133
19,9
8292
,983
C
OM
MU
NIC
ATI
ON
9.
110
,845
11,9
45
12,7
7513
,579
14,4
8772
,731
IN
TER
NA
L D
EB
T 1,
637
1,74
81,
603
1.52
1,44
61,
373
9,32
7 EX
TER
NAL
DE
BT
61,5
2234
,239
34.4
1 36
,103
37,8
5241
,513
245,
639
INTE
RE
ST
ON
EX
TER
NA
L D
EB
T 17
,531
11,7
6910
,042
9,
783
9,38
58,
671
67,1
81
ALL
OC
ATI
ON
S N
OT
EA
RM
AR
KE
D
83,0
0088
,522
79,3
36
83,1
8985
,711
89,6
951
2,44
8 TO
TAL
935,
759
979,
601
1014
,385
10
75,0
5211
53,3
4912
41,7
4663
99,8
94

GPR
SP 2
007
– 20
11
Page
84
of 2
24
13.
PRSP
II L
OG
ICA
L FR
AM
EWO
RK
33
0.
This
logi
cal f
ram
ewor
k pr
esen
ts th
e ac
tiviti
es p
ropo
sed
in th
e PR
SP
und
er th
ree
stra
tegi
c or
ient
atio
n pi
llars
and
the
14 p
riorit
y ar
eas
of in
terv
entio
n. I
n th
e lo
gica
l fra
mew
ork,
the
exp
ecte
d re
sults
in t
he a
reas
of
inte
rven
tion
and
the
rela
ted
indi
cato
rs a
re f
irst
pres
ente
d. F
ollo
wed
by
the
activ
ities
requ
ired
to a
chie
ve th
e sa
id re
sults
. The
se a
ctiv
ities
are
pre
sent
ed in
a g
loba
l man
ner,
and
they
of
ten
refe
r to
the
exis
ting
sect
oral
pro
gram
mes
and
thei
r spe
cific
indi
cato
rs.
Tab
le 1
1: L
ogic
al F
ram
ewor
k
IN
TER
VEN
TIO
N L
OG
ICA
L FR
AM
EWO
RK
IN
DIC
ATO
RS
SOU
RC
ES
OF
VER
IFIC
ATI
ON
ASS
UM
PTIO
NS
OVE
RA
LL G
OA
LS
Stro
ng a
nd
sust
aine
d gr
owth
Ann
ual G
DP
gro
wth
ra
te
DN
SI
Mai
nten
ance
of w
orld
gr
owth
. Sta
biliz
atio
n of
do
llar r
ate
of e
xcha
nge
and
oil p
rices
Po
vert
y re
duct
ion
In
cide
nce
of
pove
rty
Dep
th o
f pov
erty
Sev
erity
of p
over
ty
OD
HD
G
ood
leve
l of c
otto
n an
d ric
e pr
ices
SPEC
IFIC
O
BJE
CTI
VES
A
ccel
erat
e gr
owth
th
roug
h ag
ricul
tura
l sub
-se
ctor
s
A
gric
ultu
ral
prod
uctio
n in
dice
s C
PS
ag
ricul
ture
S
atis
fact
ory
leve
l of
rain
fall
Im
prov
e w
ell-
bein
g th
roug
h th
e so
cial
sec
tors
S
ocia
l situ
atio
n in
dice
s (e
duca
tion,
he
alth
, em
ploy
men
t, et
c.)
CP
S
sant
é,
Edu
catio
n…
Abs
ence
of l
ocus
t-typ
e cr
ises
or g
reat
ec
onom
ic re
cess
ion

GPR
SP 2
007
– 20
11
Page
85
of 2
24
I. D
EVEL
OPM
ENT
OF
THE
PRO
DU
CTI
VE S
ECTO
R
1.1
Res
ults
In
crea
sed
food
se
curit
y
Con
trol
of f
ood
cris
es
Incr
ease
d ag
ricul
tura
l pr
oduc
tion
Le
vels
of b
uffe
r st
ocks
.
Agr
icul
tura
l pr
oduc
tion
indi
ces
(cot
ton,
rice
, oth
er
cere
als…
) and
ex
ports
of l
ives
tock
pr
oduc
ts.
Con
tribu
tion
of
agric
ultu
re to
GD
P
CS
A
CP
S
agric
ultu
re
Sat
isfa
ctor
y le
vel o
f rai
nfal
l
Abs
ence
of l
ocus
t-typ
e cr
ises
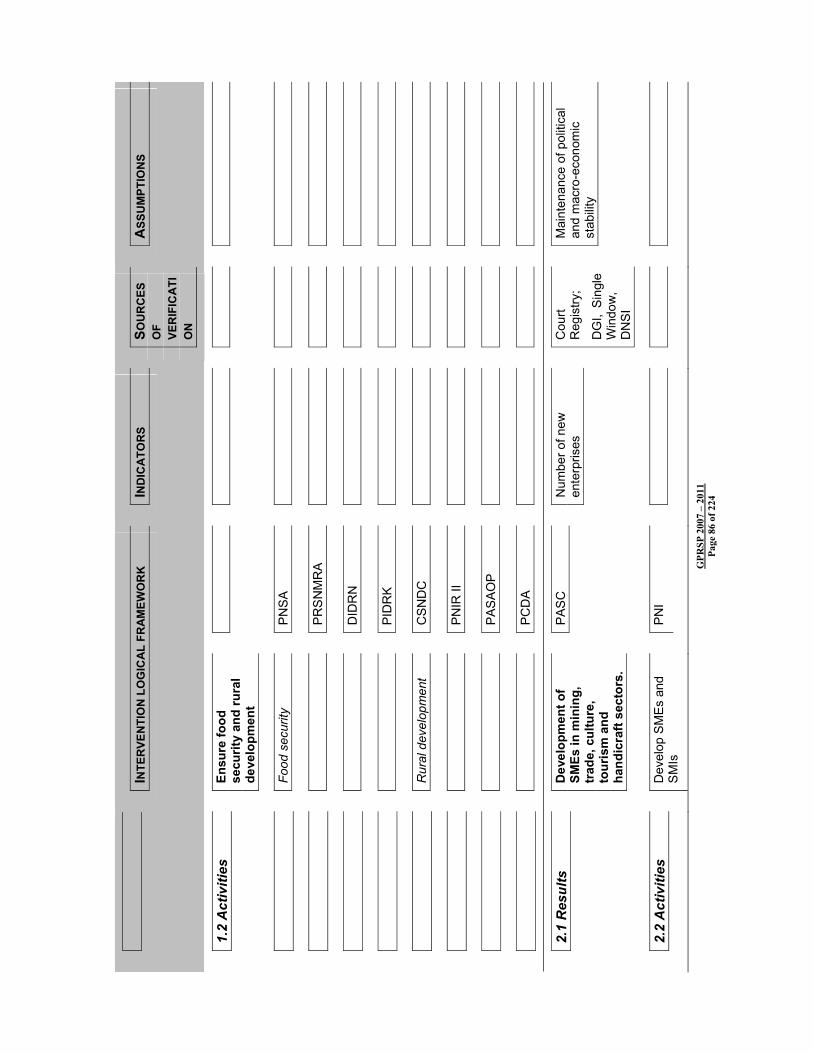
GPR
SP 2
007
– 20
11
Page
86
of 2
24
IN
TER
VEN
TIO
N L
OG
ICA
L FR
AM
EWO
RK
IN
DIC
ATO
RS
SOU
RC
ES
OF
VER
IFIC
ATI
ON
ASS
UM
PTIO
NS
1.2
Act
iviti
es
Ensu
re fo
od
secu
rity
and
rura
l de
velo
pmen
t
Fo
od s
ecur
ity
PN
SA
PR
SN
MR
A
DID
RN
PID
RK
R
ural
dev
elop
men
t C
SND
C
PN
IR II
PAS
AO
P
PC
DA
2.1
Res
ults
D
evel
opm
ent o
f SM
Es in
min
ing,
tr
ade,
cul
ture
, to
uris
m a
nd
hand
icra
ft se
ctor
s.
PAS
C
Num
ber o
f new
en
terp
rises
C
ourt
Reg
istry
;
DG
I, S
ingl
e W
indo
w,
DN
SI
Mai
nten
ance
of p
oliti
cal
and
mac
ro-e
cono
mic
st
abilit
y
2.2
Act
iviti
es
Dev
elop
SM
Es a
nd
SM
Is
PN
I

GPR
SP 2
007
– 20
11
Page
87
of 2
24
Ref
orm
taxa
tion.
PA
SC
3.1
Res
ults
R
educ
tion
of a
ny
form
of p
ollu
tion,
de
grad
atio
n of
na
tura
l res
ourc
es,
and
dese
rtifi
catio
n
P
ursu
ance
of r
egio
nal
dese
rtific
atio
n co
ntro
l pr
ogra
mm
es
Com
plet
ion
of A
PE
nego
tiatio
ns
3.2
Act
iviti
es
Pro
tect
and
su
stai
nabl
y m
anag
e na
tura
l res
ourc
es
PN
PE
PEA
LCD
4.1
Res
ults
Ex
tens
ion
of th
e ro
ad n
etw
ork
and
rura
l roa
ds
Incr
ease
d co
mpe
titio
n be
twee
n m
eans
of
tr
ansp
ort
Dev
elop
men
t of
te
leco
mm
unic
atio
ns
N
umbe
r of k
m o
f ro
ads
cons
truct
ed
Num
ber o
f km
of
tarre
d ro
ads
mai
ntai
ned
Sta
te o
f the
road
ne
twor
k
TSP
Indi
cato
r
CP
S M
TP
Pur
suan
ce o
f reg
iona
l ro
ad a
nd ra
ilway
ac
cess
ibilit
y pr
ogra
mm
es
4.2
Act
iviti
es
Dev
elop
infra
stru
ctur
e
Pro
vide
inte
rnal
and
ex
tern
al a
cces
s to
M
ali
PST
PAC
T
INTE
RVE
NTI
ON
LO
GIC
AL
FRA
MEW
OR
K
IND
ICA
TOR
S SO
UR
CES
O
F VE
RIF
ICA
TIO
N
ASS
UM
PTIO
NS
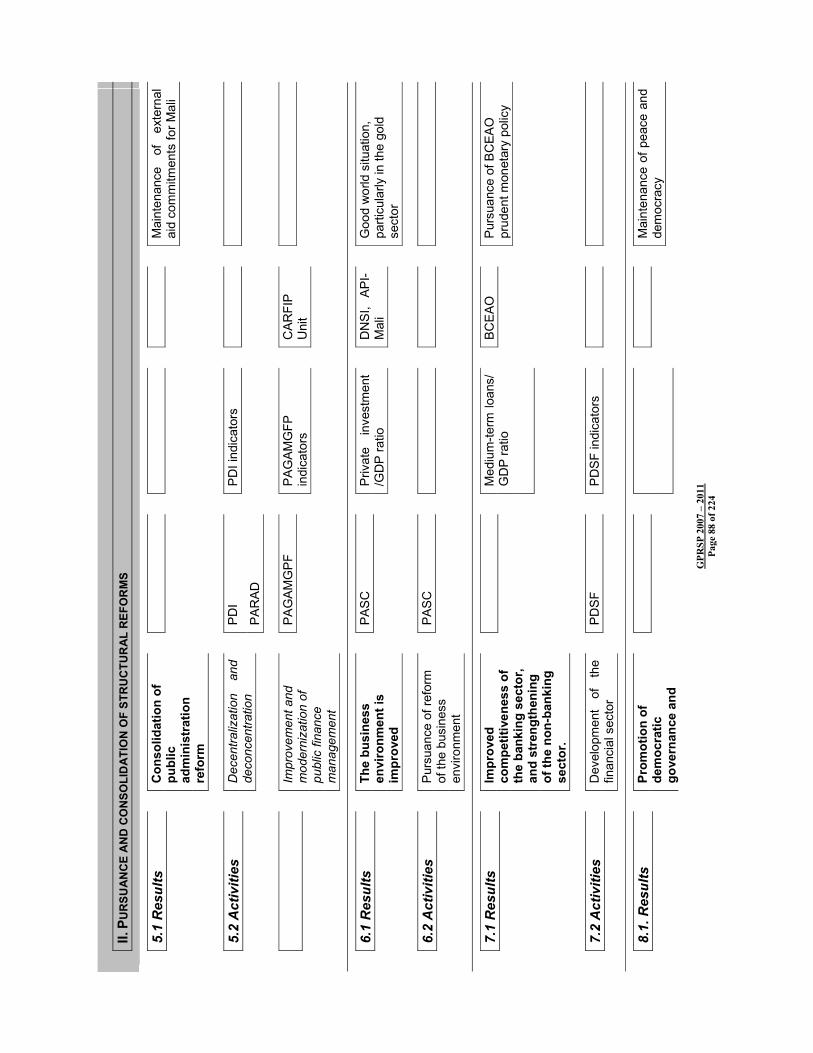
GPR
SP 2
007
– 20
11
Page
88
of 2
24
II. P
UR
SUA
NC
E A
ND
CO
NSO
LID
ATI
ON
OF
STR
UC
TUR
AL
REF
OR
MS
5.1
Res
ults
C
onso
lidat
ion
of
publ
ic
adm
inis
trat
ion
refo
rm
M
aint
enan
ce
of
exte
rnal
ai
d co
mm
itmen
ts fo
r Mal
i
5.2
Act
iviti
es
Dec
entra
lizat
ion
and
deco
ncen
tratio
n P
DI
PAR
AD
PD
I ind
icat
ors
Im
prov
emen
t and
m
oder
niza
tion
of
publ
ic fi
nanc
e m
anag
emen
t
PAG
AM
GP
F P
AG
AM
GFP
in
dica
tors
C
AR
FIP
U
nit
6.1
Res
ults
Th
e bu
sine
ss
envi
ronm
ent i
s im
prov
ed
PAS
C
Priv
ate
inve
stm
ent
/GD
P ra
tio
DN
SI,
API-
Mal
i G
ood
wor
ld s
ituat
ion,
pa
rticu
larly
in th
e go
ld
sect
or
6.2
Act
iviti
es
Pur
suan
ce o
f ref
orm
of
the
busi
ness
en
viro
nmen
t
PAS
C
7.1
Res
ults
Im
prov
ed
com
petit
iven
ess
of
the
bank
ing
sect
or,
and
stre
ngth
enin
g of
the
non-
bank
ing
sect
or.
M
ediu
m-te
rm lo
ans/
G
DP
ratio
BC
EAO
P
ursu
ance
of B
CEA
O
prud
ent m
onet
ary
polic
y
7.2
Act
iviti
es
Dev
elop
men
t of
th
e fin
anci
al s
ecto
r P
DS
F P
DSF
indi
cato
rs
8.1.
Res
ults
Pr
omot
ion
of
dem
ocra
tic
gove
rnan
ce a
nd
M
aint
enan
ce o
f pea
ce a
nd
dem
ocra
cy

GPR
SP 2
007
– 20
11
Page
89
of 2
24
publ
ic fr
eedo
ms
8.2
Act
iviti
es
P
RO
DE
J,
impl
emen
tatio
n of
G
IABA
m
easu
res
and
crea
tion
of
CE
NTI
F
PD
I
PR
OD
EJ in
dica
tors
PD
I ind
icat
ors
9.1
Res
ults
C
apac
ity b
uild
ing
for t
he c
ivil
soci
ety
9.2
Act
iviti
es
10.1
Res
ults
St
reng
then
ing
of
regi
onal
inte
grat
ion
initi
ativ
es
Min
istry
of
Fo
reig
n Af
fairs
an
d M
EF
Mai
nten
ance
of
peac
e in
th
e re
gion
and
in A
frica
.
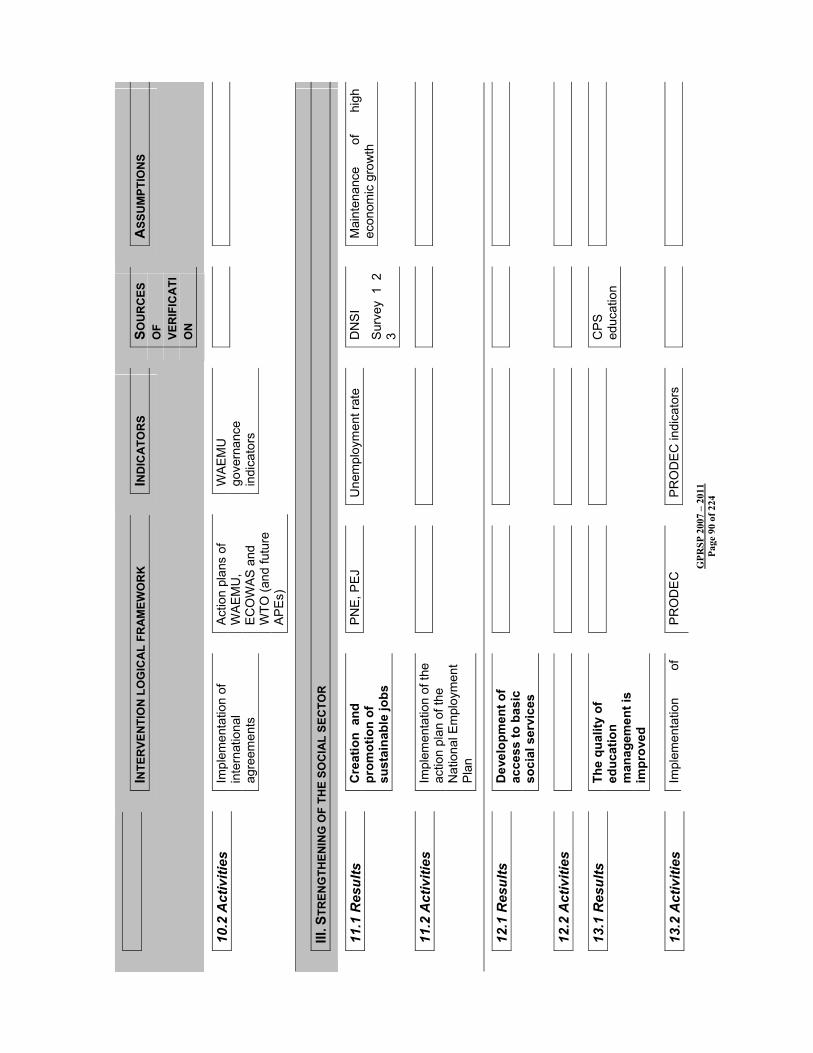
GPR
SP 2
007
– 20
11
Page
90
of 2
24
IN
TER
VEN
TIO
N L
OG
ICA
L FR
AM
EWO
RK
IN
DIC
ATO
RS
SOU
RC
ES
OF
VER
IFIC
ATI
ON
ASS
UM
PTIO
NS
10.2
Act
iviti
es
Impl
emen
tatio
n of
in
tern
atio
nal
agre
emen
ts
Actio
n pl
ans
of
WAE
MU
, E
CO
WA
S an
d W
TO (a
nd fu
ture
AP
Es)
WA
EM
U
gove
rnan
ce
indi
cato
rs
III. S
TREN
GTH
ENIN
G O
F TH
E SO
CIA
L SE
CTO
R
11.1
Res
ults
C
reat
ion
and
pr
omot
ion
of
sust
aina
ble
jobs
PN
E, P
EJ
Une
mpl
oym
ent r
ate
DN
SI
Sur
vey
1 2
3
Mai
nten
ance
of
hi
gh
econ
omic
gro
wth
11.2
Act
iviti
es
Impl
emen
tatio
n of
the
actio
n pl
an o
f the
N
atio
nal E
mpl
oym
ent
Pla
n
12.1
Res
ults
D
evel
opm
ent o
f ac
cess
to b
asic
so
cial
ser
vice
s
12.2
Act
iviti
es
13.1
Res
ults
Th
e qu
ality
of
educ
atio
n m
anag
emen
t is
impr
oved
CP
S
educ
atio
n
13.2
Act
iviti
es
Impl
emen
tatio
n of
PR
OD
EC
P
RO
DE
C in
dica
tors

GPR
SP 2
007
– 20
11
Page
91
of 2
24
PR
OD
EC a
ctio
n pl
an
PISE
14.1
Res
ults
B
asic
hea
lth
cove
rage
is
impr
oved
CP
S h
ealth
DN
SP
14.2
Act
iviti
es
Impl
emen
tatio
n of
P
RO
DES
S ac
tion
plan
s
PR
OD
ESS
PD
S
PR
OD
ESS
and
PD
S
indi
cato
rs
15.1
Res
ults
Sa
tisfa
ctio
n of
wat
er
need
s in
term
s of
qu
ality
and
qua
ntity
CPS
min
es
and
ener
gy
and
wat
er
15.2
Act
iviti
es
Impl
emen
tatio
n of
the
actio
n pl
an o
f Wat
er
and
hydr
aulic
s P
lans
PN
AEP
an
d P
RO
SEP
A
PAG
IRE
Pro
ject
indi
cato
rs
16.1
Res
ults
Fa
cilit
ate
acce
ss t
o ho
usin
g fo
r the
poo
r
ELI
M
indi
cato
rs,
surv
eys
1.2.
3 C
PS
H
ousi
ng
DN
SI
16.2
Act
iviti
es
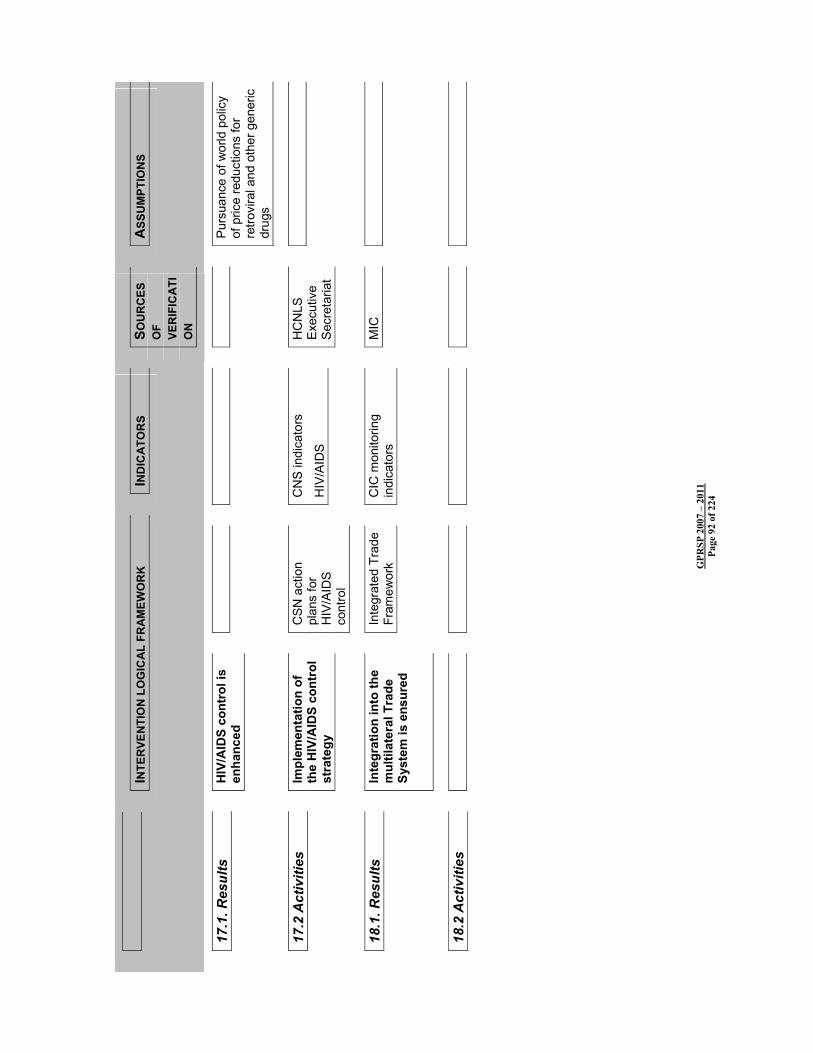
GPR
SP 2
007
– 20
11
Page
92
of 2
24
IN
TER
VEN
TIO
N L
OG
ICA
L FR
AM
EWO
RK
IN
DIC
ATO
RS
SOU
RC
ES
OF
VER
IFIC
ATI
ON
ASS
UM
PTIO
NS
17.1
. Res
ults
H
IV/A
IDS
cont
rol i
s en
hanc
ed
P
ursu
ance
of w
orld
pol
icy
of p
rice
redu
ctio
ns fo
r re
trovi
ral a
nd o
ther
gen
eric
dr
ugs
17.2
Act
iviti
es
Impl
emen
tatio
n of
th
e H
IV/A
IDS
cont
rol
stra
tegy
CSN
act
ion
plan
s fo
r H
IV/A
IDS
co
ntro
l
CN
S in
dica
tors
HIV
/AID
S
HC
NLS
E
xecu
tive
Sec
reta
riat
18.1
. Res
ults
In
tegr
atio
n in
to th
e m
ultil
ater
al T
rade
Sy
stem
is e
nsur
ed
Inte
grat
ed T
rade
Fr
amew
ork
CIC
mon
itorin
g in
dica
tors
M
IC
18.2
Act
iviti
es
GPRSP 2007 – 2011 Page 93 of 224
14. CONCLUSION 331. This PRSP II document has incorporated the key observations and comments
proposed and validated by the participants of the National Workshop on the Preparation and Monitoring-Evaluation of the 2nd generation PRSP 2007 – 2001 from 11 to 13 September 2006. Some information is still lacking; it will be included in this report as soon as the respective activities are completed. The information comprises: (i) information on the recent state of poverty as shown by an analysis of the ELIM survey, (ii) selection of key indicators for PRSP monitoring and evaluation, and (iii) presentation of the action plan, which will incorporate actions concerning the Millennium Development Goals (MDG).
332. The 2nd generation PRSP, in its current version, is therefore still evolving, portraying the desire of the authorities to associate all development stakeholders and take into account all the problems of the Malian society. The new generation PRSP is not yet complete and is intangible, but in comparison to PRSP I, it has made significant progress that should be consolidated through implementation and monitoring, which have also made significant progress.
333. The PRSP I implementation period faced constraints due to vagaries of the weather, fluctuation of the prices of major exports (cotton and gold) and imports (increase in the prices of hydrocarbons, building materials), and consequences of conflicts in the sub-region. Ways and means should be found to mitigate the impact of the exogenous factors.
334. Although external constraints have undoubtedly slowed down growth and therefore poverty reduction, endogenous factors remain significant. The growth rate of 6.7% was not achieved due to inadequacies and delays in the implementation of structural measures. With respect to public finance, the overall goal to curb the deficit of the Government’s financial operations is hampered mainly by: (i) the failure to achieve target tax pressure rate (this requires new and bold measures to broaden the tax base, such as taxing the informal sector, land and the agricultural sector), (ii) the difficulty of curbing public expenditure (domestic debt, additional social expenditures), and (iii) delays in the mobilization of external resources. Similarly, severe constraints limit the business environment and slow down growth and poverty reduction. These constraints include corruption, high costs of water, electricity and telephone, as well as deficiencies in transport infrastructure. The enhancement of deconcentration, which should accompany decentralization, has not reached the critical level that shows improvement of living conditions in Local Authorities.
335. The challenges of PRSP II concern acceleration of growth and improvement of economic and political governance, a prerequisite for development.
336. Inadequate mobilization of external financing poses the problem of appropriate solutions for the multiple policies and procedures of the Technical and Financial Partners (TFP). In this connection, it is recommended that the Paris Declaration on Aid Effectiveness should be implemented. In addition to the problem of direct budget support, efforts to effectively implement budget support should be more explicit and pursued.
337. With respect to sectoral measures, PRSP II should lay emphasis on: (i) completion of reform of the cotton sector, (ii) reduction of production cost with, in particular, reform of the water and electricity sector, (ii) extension of the transport and telecommunication infrastructure, and (iv) human, institutional and organizational capacity building.

GPRSP 2007 – 2011 Page 94 of 224
338. It is recommended in PRSP II that the relative proportion of tax revenue in the State budget should be increased through: (i) broadening and diversification of taxation basis, (ii) proper identification of taxpayers, (iii) drastic reduction of exemptions, (iv) improvement of the efficiency of collection services with the modernization of tax administration through the use of computers, (v) adaptation of the tax laws reviewing the causes of loss and strengthening the tax system, as well as reorganizing the tax administration. It will also consist in establishing a tax system conducive to better redistribution of incomes and mobilization of savings.
339. To eliminate constraints that undermine the proper implementation of PRSP II and achievement of its objectives, the Government should accelerate the implementation of institutional reforms, particularly the Action Plan for the Improvement and Modernization of Public Finance Management, aimed at obtaining direct budget assistance from the TFPs. It should also determine the main driving force behind accelerated growth, by identifying the growth-oriented sub-sectors and sectors, as well as their diversification, elimination of obstacles, and action plan for accelerating economic growth. It is recommended that efforts be made to build capacities, especially those of DAFs, CPS and Central departments of the Administration, so as to optimize the programming, implementation and monitoring of actions under PRSP II implementation.
340. Furthermore, it is recommended that the institutional monitoring-evaluation mechanism of PRSP I should be clarified and simplified. It is also necessary to harmonize the methods, tools, instruments and indicators with those of PTI/BSI and programme budgets.
341. The PRSP evaluation also calls for a review of the number and type of indicators selected by component or thematic area to ensure better legibility and greater relevance.
342. The uniqueness of PRSP II, the single frame of reference, requires greater ownership by all the stakeholders. It calls for greater integration of all the ongoing major sectoral studies in Mali. The participatory process also calls for the gradual search for regionalization of PRSP II as well as for better determination of the contribution by civil society, NGOs and communities to its implementation.
343. Lastly, the Government gives top priority to two exercises which commit it to the international community: the Ten-Year Action Plan to achieve the MDGs and the preparation of an action plan for the implementation of the Paris Declaration.

GPRSP 2007 – 2011 Page 95 of 224
December 20, 2006
2nd Generation PRSP 2007 – 2011
MMAALLII
Annex I Macroeconomic Framework
2007 - 2011
Table of Contents 1. CONTEXT............................................................................................................................................99
1.1 OBJECTIVE...............................................................................................................................99 1.2 METHODOLOGY: TOOLS AND PROCESS ...................................................................................99
2 PREPARATION OF THE MACROECONOMIC FRAMEWORK.....................................101 2.1 INTERNATIONAL ENVIRONMENT ...........................................................................................101 2.2 MALI’S RECENT ECONOMIC SITUATION (ACHIEVEMENTS OF THE 2002-2005 PERIOD).........102
2.2.1 Real sector .......................................................................................................................102 2.2.2 Prices and inflation .........................................................................................................103 2.2.3 Investment ........................................................................................................................103 2.2.4. Government finance.........................................................................................................103 2.2.5 Public debt .......................................................................................................................104 2.2.6 Balance of payments........................................................................................................105 2.2.7 Convergence ....................................................................................................................105
2.3 PROJECTION ASSUMPTIONS ...................................................................................................106 2.3.1 General assumptions .......................................................................................................106 2.3.2 Specific assumptions........................................................................................................107
2.4 MAIN RESULTS OF THE MACROECONOMIC FRAMEWORK (AMBITIOUS SCENARIO) ...............109 2.4.1 Overview..........................................................................................................................109 2.4.2 Growth .............................................................................................................................111 2.4.3 Investment ........................................................................................................................112 2.4.4 Government finance.........................................................................................................114 2.4.5 Public debt .......................................................................................................................115 2.4.6 Balance of payments and monetary survey.....................................................................115 2.4.7 External aid .....................................................................................................................117
2.5 IMPACT ON POVERTY.............................................................................................................119 CONCLUSIONS ....................................................................................................................................120 3. OUTPUT TABLES (MME_DNPD)...........................................................................................121 TABLE 1: GENERAL ASSUMPTIONS 106 TABLE 2: EXTERNAL AID ASSUMPTIONS 108 TABLE 3: MACROECONOMIC PERFORMANCE INDICATORS AND POLICY CRITERIA 110 TABLE 4: SUPPLY AND USE OF GOODS AND NONFACTOR SERVICES IN CFAF BILLION 112 TABLE 5: CONSOLIDATED GOVERNMENT FINANCE BUDGET AND ITS FINANCING (TOFE) (CFAF BILLION
CURRENT) 114 TABLE 6: BALANCE OF PAYMENTS (CFAF BILLION) 116 TABLE 7: MONETARY SITUATION (CFAF BILLION; END OF PERIOD) 117 TABLE 8: EXTERNAL AID NEEDS (CFAF BILLION) 118 TABLE 9: FINANCING GAP (CFAF BILLION) 118 TABLE 10: PROJECTION ASSUMPTIONS FOR THE BASIC SCENARIO 121 TABLE 11: PROJECTION ASSUMPTIONS FOR THE AMBITIOUS SCENARIO 122 TABLE 12: MACROECONOMIC PERFORMANCE INDICATORS AND POLICY CRITERIA 123 TABLE 13: SUPPLY AND USE OF GOODS AND NONFACTOR SERVICES (CFAF BILLION CONSTANT) 124 TABLE 14: SUPPLY AND USE OF GOODS AND NONFACTOR SERVICES (CFAF BILLION CURRENT) 124 TABLE 15: SAVINGS AND INVESTMENT (CFAF BILLION CURRENT) 125 TABLE 16: CONSOLIDATED GOVERNMENT FINANCE BUDGET AND ITS FINANCING (TOFE) (CFAF BILLION
CURRENT) 126 TABLE 17: STRUCTURE OF GOVERNMENT EXPENDITURE 127 TABLE 18: BALANCE OF PAYMENTS (CFAF BILLION) 128 TABLE 19: MONETARY SURVEY (CFAF BILLION; END OF PERIOD) 129 TABLE 20: PRICE INDICES AND EXCHANGE RATE (1987 = 100) 129 TABLE 21: PRICE INDICES BY ECONOMIC SECTOR (1987 = 100) 130 TABLE 22: GDP BY SECTOR (CFAF BILLION AT 1987 PRICES) 130 TABLE 23: SECTORAL CONTRIBUTION TO GROWTH (IN PERCENT) 131 TABLE 24: GDP BY SECTOR (CFAF BILLION CURRENT) 132 TABLE 25: EXPORTS OF MERCHANDISE (BILLION OF CFAF CURRENT) 133
TABLE 26: IMPORTS OF MERCHANDISE (CFAF BILLION PRICES CURRENT) 133 TABLE 27: EXTERNAL AID 134 TABLE 28: PRIVATE SECTOR DISPOSABLE INCOME (CFAF BILLION CURRENT) 134 TABLE 29: PUBLIC SECTOR DISPOSABLE INCOME (CFAF BILLION CURRENT) 135
List of Figures FIGURE 1: TRENDS IN REAL GDP GROWTH 102 FIGURE 2: TRENDS IN RATE OF INFLATION (HICP) 103 FIGURE 3: TRENDS IN PUBLIC AND PRIVATE INVESTMENT 103 FIGURE 4: TRENDS IN GOVERNMENT FINANCE INDICATORS (IN BILLIONS OF CFAF AND IN PERCENT) 104 FIGURE 5: TRENDS IN PUBLIC DEBT IN PERCENT OF GDP 105 FIGURE 6: TRENDS IN FOREIGN TRADE INDICATORS (IN CFAF BILLION AND PERCENT) 105 FIGURE 7: TRENDS IN ECONOMIC GROWTH AND MONETARY POVERTY 119

List of acronyms and abbreviations ACN African Cup of Nations AMADER Malian Agency for the Development of Rural Electricity BCEAO Central Bank of West African States BSI Special Capital Budget CACEM Société d’Exploitation des Phosphates of Tilemsi CFAF African Financial Community franc CPM Forecasting and Modeling Committee DGB National Budget Directorate DGDP National Public Debt Directorate DNGM National Directorate of Geology and Mining DNPD National Planning and Development Directorate GDP Gross Domestic Product (at market prices) GDPf Gross Domestic Product at factor cost GFCF Gross Fixed Capital Formation HIPC Heavily Indebted Poor Countries IMF International Monetary Fund LOA Agricultural Policy Law MDGs Millennium Development Goals MDRI Multilateral Debt Relief Initiative MEF Ministry of Economy and Finance MME_DNPD DNPD Macroeconomic Model for Mali MPAT Ministry of Planning and Land Use Management MS Ministry of Health MTBF Medium Term Budgetary Framework MTEF Medium Term Expenditure Framework OMVS Organization for the Development of the Senegal River PADEPECHE Inland Fisheries Development Support Project PAGAMGFP Government Fiscal Management Improvement and Modernization Action
Program PRSP Poverty Reduction Strategy Paper PST Transport Sector Program PTF Technical and financial partners PTI Three-year Investment Program T21 Threshold 21 Model TOFE Central Government Consolidated Fiscal Operations WAEMU West African Economic and Monetary Union WACEM West African Cement
1. CONTEXT 1. The government of Mali has, since 2002, expressed its firm commitment to making the
fight against poverty the main priority of all its development actions. This commitment manifested itself in the preparation, adoption, and implementation of the Poverty Reduction Strategy Paper (PRSP) covering the period 2002-2006.
2. The macroeconomic framework sets forth the broad goals of the government’s medium-term policies and facilitates preparation of optimal sectoral policies consistent with the development goals.
3. Less than one year from the end of the 2002-2006 PRSP, it became apparent that it would be difficult to achieve average economic growth of 6.7 percent over the 2002/2006 period and reduce the incidence of poverty from 63.8 percent to 47.5 percent in 2006, because of a number of shocks that had not been taken into account in the basic assumptions, namely the Ivoirien crisis sparked in 2002, the 2004 locust invasion, the 2005 food crisis, and the upward spiral in oil prices.
4. This macroeconomic framework report forms part of the preparation exercise for the second generation PRSP and is aimed at producing realistic macroeconomic indicators consistent with the true potential of the Malian economy.
5. It presents the context and environment in which the first phase of the PRSP was implemented, and its main achievements, as well as the findings and recommendations of the working group on the PRSP-II macroeconomic framework.
6. For the purpose of conducting multisectoral and pluridisciplinary modeling, harmonizing the national statistics, and performing theoretical and methodological research to manage development in Mali, a Forecasting and Modeling Committee (CPM) was established by Decree 03–366/PM-RM of August 29, 2003 and placed under the responsibility of the Ministry of Planning. The working group on the PRSP-II macroeconomic framework, chaired by the National Planning and Development Directorate, conducted its work under the aegis of this committee.
1.1 Objective 7. The overarching policy objective is to maintain macroeconomic stability taking account of
the true potential of the Malian economy and the overall and sectoral goals of the PRSP.
8. With this in mind, two scenarios—a basic scenario and an ambitious scenario—were chosen to guide the formulation of sectoral policies and the implementation of national development strategies through 2011.
1.2 Methodology: tools and process 9. Macroeconomic planning and modeling is carried out under the responsibility of the
National Planning and Development Directorate (DNPD) using various tools. These include the Macroeconomic Model for Mali (MME_DNPD) and the Threshold 21 medium and long-term forecasting and simulation model, T21-Mali (which refers to standing on the threshold of the 21st century).
10. Work on the framework began in April 2005. A preliminary version was produced and amended on several occasions.

11. With the official launch of the preparation of the second generation PRSP in February 2006, the CPM focused its work on producing a macroeconomic framework for the PRSP-II.
12. To that end, the Technical Secretariat used the two modeling tools to prepare the framework. The tables were produced with the MME_DNDP and the analyses, on poverty in particular, were fine-tuned taking account of the conclusions of the structural analysis of the Malian economy conducted with the T21 in March 2006.
13. The exercise was further intensified with the launch of the PRSP-II ad hoc working groups. The CPM tasked its Technical Secretariat with producing a technical report by May 20, 2006 at the latest. The report was discussed and unanimously adopted by the committee on July 6, 2006. As the budget forecasts for 2006 and 2007 had not yet been revised by the Ministry of Economy and Finance (MEF) and discussed with the IMF, the macroeconomic framework had to be adjusted in September 2006 to ensure its compatibility with the overall Medium Term Budgetary Framework (MTBF).
14. On the basis of assumptions regarding the international environment and promising sectors of the Malian economy, two scenarios, taking account of the country’s actual economic potential, were produced. Specifically, these were a basic (trend) scenario that forecasts economic development based on existing policies, and an ambitious scenario (the PRSP-II scenario) that makes assumptions of strong growth in the promising sectors and provides for a broader tax base so as to meet the WAEMU tax ratio target by 2008 and ensure coherence with the overall MTBF in terms of spending.

2. PREPARATION OF THE MACROECONOMIC FRAMEWORK 15. The macroeconomic framework was prepared taking account of the strengths and
weaknesses of the first PRSP, on the one hand, and of the real productive capacity of the national economy and potential domestic and external risks, on the other. The framework also takes account of major international and regional development goals, in particular the MDGs and those of the WAEMU.
2.1 International environment 16. The international economic environment is characterized by the price instability of Mali’s
export products, the upward trend in oil prices, and the geopolitical crises in Iraq, Iran, and Côte d’Ivoire, among others.
17. Oil importing countries have been very much affected by the high level of oil prices. Growth has, however, remained sustained as a result of favorable financial market conditions (low interest rates) and controlled inflation.
18. The tense situation in the oil market, the threat of new fuel price hikes, and the possibility of higher interest rates constitute major downside risks to economic expansion.
19. Global GDP grew by 4.8 percent9 in 2005 versus 5.3 percent in 2004, while estimates put growth at 4.9 percent in 2006. Petroleum products price volatility and global current account imbalances were key factors impacting on growth.
20. Thus, Europe continued to record below par growth. In Japan and the Unites States, on the other hand, despite the slowdown in economic activity, performance remained close to the maximum sustainable growth rate.
21. Among the major developing countries, GDP growth continued apace in China and India, which posted figures of 9.0 percent and 7.0 percent, respectively. Growth slowed in Russia, however, following a flattening of production levels in the oil sector.
22. For oil importing developing countries, growth is estimated to have fallen from 6.9 percent to 6.1 percent driven by the combined effect of higher oil prices, domestic capacity constraints and a slowdown in the demand for imports in high-income countries. The fall is even more pronounced in real income terms, dropping from 6.4 percent to 3.7 percent.
23. For oil exporting developing countries, despite the steady increase in oil revenues, reduced capacity to increase production in the oil sector resulted in a decline from 6.6 percent to 5.6 percent.
24. For sub-Saharan Africa, growth firmed up in 2005 mainly as a result of higher commodity prices, greater political stability, favorable climatic conditions, and higher oil and gas production in countries such as Angola, Chad and Equatorial Guinea. Economic activity grew by 5.5 percent in 2005, compared to 4.2 percent in 2004, and is expected to reach 5.8 percent10 in 2006.
25. In the WAEMU zone, economic growth is heavily dependent on the vagaries of the climate. With good rainfall levels in 2005, growth accelerated to 4.3 percent in 2005 versus 3.0 percent in 2004. In 2006, growth is projected to be 4.0 percent11.
9 IMF, World Economic Outlook, April 2006. 10 African Economic Outlook, OECD, May 2005. 11 WAEMU half-yearly progress report on multilateral surveillance, JUNE 2006.

26. As a result of the international economic climate, prices rose in all regions of the world.
• In the Unites States, inflation reached 3.4 percent in 2005 compared to 2.7 percent in 2004.
• In Europe, inflation edged up to 2.2 percent in 2005 from below 2.1 percent in 2004.
• In Asia, even with oil price subsidies, inflation was up in most countries, rising from 4.4 percent in 2004 to 7.2 percent in 2005.
• In sub-Saharan Africa, the year 2005 saw a rapid rise in inflation. Strong increases in food prices resulting from significant reductions in subsistence crops fed through to double-digit consumer price inflation in Chad, and considerable overruns of government targets in countries such as Niger, Togo, Benin, Burkina Faso, and Mali. The rate of inflation in this region was much higher than in the other regions of the world, at 10.6 percent versus 9.7 percent in 2004.
• In the WAEMU zone, the average annual inflation rate stood at 4.3 percent in 2005 compared to 0.6 percent in 2004.
Mali’s recent economic situation (achievements of the 2002-2005 period) 27. In recent years, the economic climate in Mali has been difficult. It has been marked by the
Ivoirien crisis (which has been causing economic disruption since September 2002), declining gold production since 2003, the locust invasion of 2004, and poor rainfall in the 2004/2005 crop season, which led to serious food shortages and unprecedented levels of inflation in 2005.
28. Despite the challenging economic climate, in the first four years of implementation of the PRSP, Mali made significant progress on the political, social and economic fronts. Political and social stability and progress in respect for human rights facilitated the implementation of poverty alleviation policies while helping to strengthen the climate of confidence which Mali currently enjoys with the international community.
1.1.1 Real sector 29. The Malian economy is heavily influenced by climatic conditions. Economic performance
is uneven and growth proceeds by fits and starts. The basic components of the economy are the agriculture-led primary sector, the gold-led secondary sector, and the tertiary sector, which is currently seeing the start of a boom led by the transport, telecommunications, and tourism sectors.
30. Between 2002 and 2005, growth averaged 5.1 percent. Since starting to implement the PRSP, Mali has posted positive growth, with 4.3 percent in 2002, 7.6 percent in 2003, 2.3 percent in 2004, and 6.1 percent in 2005.
Figure 1: Trends in real GDP growth
(Source: DNSI/MME_DNPD)
6.1%
2.3%
7.6%
4.3%
0.0% 1.0% 2.0% 3.0% 4.0% 5.0% 6.0% 7.0% 8.0%
2002 2003 2004 2005Years

1.1.2 Prices and inflation 31. As a result of vigorous price control efforts, the average inflation rate—measured by the
annual change in the Harmonized Index of Consumer Prices (HICP) in Bamako—was 1.8 percent between 2002 and 2005. After reaching 5.1 percent in 2002, negative inflation growth was achieved in 2003 and 2004, with -1.3 percent and -3.1 percent, respectively. Inflation rebounded to 6.4 percent in 2005, however, as a result of the shortage of food supplies following the poor 2004/2005 crop season.
Figure 2: Trends in rate of inflation (HICP)
(Source: DNSI/MME_DNPD)
1.1.3 Investment 32. The period was marked by huge private and public investment flows. Private investments
were channeled essentially into the building of gold mines, the development of mobile telephony and major real estate developments. Average annual net foreign direct investment flows amounted to CFAF 87.9 billion, rising to an exceptional CFAF 168.8 billion in 2002, as a result of the financing of infrastructure development for ACN 2002. Public investment, in turn, focused mainly on infrastructure development for ACN 2002, major road projects, and real estate and irrigated agriculture programs.
33. These public investment efforts were supported by technical and financial partners and saw the gross investment rate increase from 16.0 percent in 2002 to 21.4 percent in 2005.
Figure 3: Trends in public and private investment
(Source: DNSI/MME_DNPD)
2.2.4. Government finance 34. One of the major pillars of the government’s economic and financial reform strategy has
been ensuring the viability of its financial operations. Official policy in this regard has
6.4% 5.1%
-3.1%
-1.3%
-4.0% -2.0%
0.0% 2.0% 4.0% 6.0% 8.0%
2002 2003 2004 2005years
0,00 50,00
100,00 150,00 200,00 250,00 300,00
2002 2003 2004 2005Années
0,0% 5,0% 10,0% 15,0% 20,0% 25,0% 30,0%
- Private GFCF (CFAF billion current) - Public GFCF (CFAF billion current s)
Gross investment (I/GDPm)
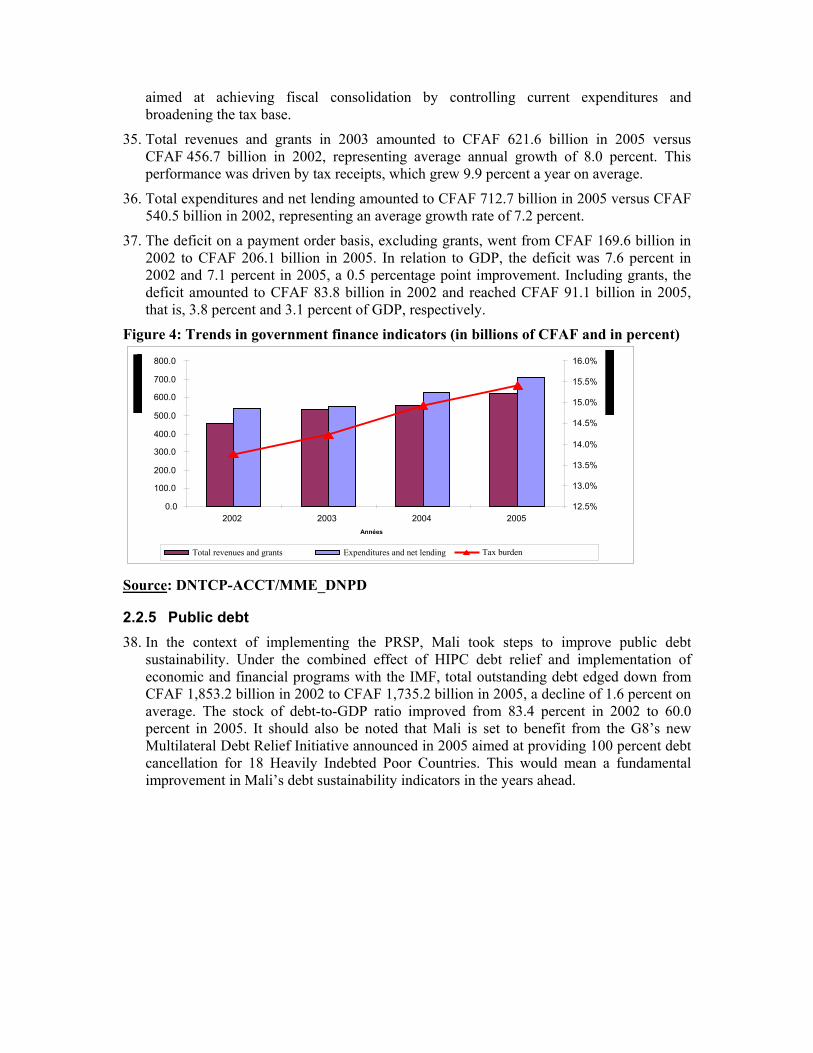
aimed at achieving fiscal consolidation by controlling current expenditures and broadening the tax base.
35. Total revenues and grants in 2003 amounted to CFAF 621.6 billion in 2005 versus CFAF 456.7 billion in 2002, representing average annual growth of 8.0 percent. This performance was driven by tax receipts, which grew 9.9 percent a year on average.
36. Total expenditures and net lending amounted to CFAF 712.7 billion in 2005 versus CFAF 540.5 billion in 2002, representing an average growth rate of 7.2 percent.
37. The deficit on a payment order basis, excluding grants, went from CFAF 169.6 billion in 2002 to CFAF 206.1 billion in 2005. In relation to GDP, the deficit was 7.6 percent in 2002 and 7.1 percent in 2005, a 0.5 percentage point improvement. Including grants, the deficit amounted to CFAF 83.8 billion in 2002 and reached CFAF 91.1 billion in 2005, that is, 3.8 percent and 3.1 percent of GDP, respectively.
Figure 4: Trends in government finance indicators (in billions of CFAF and in percent)
Source: DNTCP-ACCT/MME_DNPD
2.2.5 Public debt 38. In the context of implementing the PRSP, Mali took steps to improve public debt
sustainability. Under the combined effect of HIPC debt relief and implementation of economic and financial programs with the IMF, total outstanding debt edged down from CFAF 1,853.2 billion in 2002 to CFAF 1,735.2 billion in 2005, a decline of 1.6 percent on average. The stock of debt-to-GDP ratio improved from 83.4 percent in 2002 to 60.0 percent in 2005. It should also be noted that Mali is set to benefit from the G8’s new Multilateral Debt Relief Initiative announced in 2005 aimed at providing 100 percent debt cancellation for 18 Heavily Indebted Poor Countries. This would mean a fundamental improvement in Mali’s debt sustainability indicators in the years ahead.
0.0 100.0 200.0 300.0 400.0 500.0 600.0 700.0 800.0
2002 2003 2004 2005Années
12.5%
13.0%
13.5%
14.0%
14.5%
15.0%
15.5%
16.0%
Total revenues and grants Expenditures and net lending Tax burden
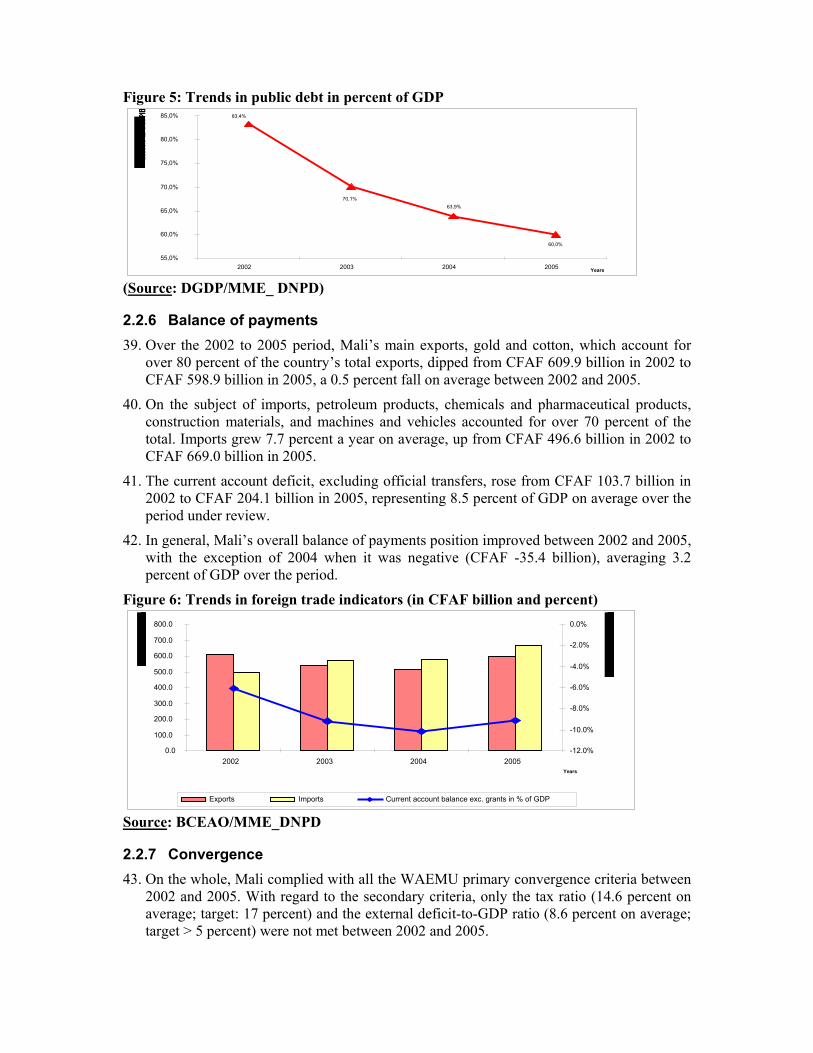
Figure 5: Trends in public debt in percent of GDP
(Source: DGDP/MME_ DNPD)
2.2.6 Balance of payments 39. Over the 2002 to 2005 period, Mali’s main exports, gold and cotton, which account for
over 80 percent of the country’s total exports, dipped from CFAF 609.9 billion in 2002 to CFAF 598.9 billion in 2005, a 0.5 percent fall on average between 2002 and 2005.
40. On the subject of imports, petroleum products, chemicals and pharmaceutical products, construction materials, and machines and vehicles accounted for over 70 percent of the total. Imports grew 7.7 percent a year on average, up from CFAF 496.6 billion in 2002 to CFAF 669.0 billion in 2005.
41. The current account deficit, excluding official transfers, rose from CFAF 103.7 billion in 2002 to CFAF 204.1 billion in 2005, representing 8.5 percent of GDP on average over the period under review.
42. In general, Mali’s overall balance of payments position improved between 2002 and 2005, with the exception of 2004 when it was negative (CFAF -35.4 billion), averaging 3.2 percent of GDP over the period.
Figure 6: Trends in foreign trade indicators (in CFAF billion and percent)
Source: BCEAO/MME_DNPD
2.2.7 Convergence 43. On the whole, Mali complied with all the WAEMU primary convergence criteria between
2002 and 2005. With regard to the secondary criteria, only the tax ratio (14.6 percent on average; target: 17 percent) and the external deficit-to-GDP ratio (8.6 percent on average; target > 5 percent) were not met between 2002 and 2005.
70,1%63,9%
60,0%
83,4%
55,0% 60,0% 65,0% 70,0% 75,0% 80,0% 85,0%
2002 2003 2004 2005 Years
0.0 100.0 200.0 300.0 400.0 500.0 600.0 700.0 800.0
2002 2003 2004 2005Years
-12.0% -10.0% -8.0% -6.0% -4.0% -2.0% 0.0%
Exports Imports Current account balance exc. grants in % of GDP

44. In 2005, only one country in the Union, Senegal, complied with the four primary criteria, while, in 2002, two countries, Senegal and Benin satisfied these criteria.
45. This means that the conditions for access to the stability phase as defined in the Pact have not yet been met. Thus, in order to strengthen macroeconomic stability and meet the convergence criteria, a new convergence timeline has been set for December 31, 2008.
46. In the final analysis, despite the challenges of an unfavorable international environment and domestic shocks, Mali achieved economic growth of 5.2 percent on average over the first four years of implementation of the PRSP. This performance is attributable to the government’s efforts to rationalize government finance and to the support of technical and financial partners in the area of investment financing. With sustained efforts along these lines, performance could continue to improve. However, there are still potential risks arising from the present upward trend in international oil prices.
2.3 Projection assumptions 47. The assumptions of the macroeconomic framework are based on those of the IMF World
Economic Outlook and on the promising sectors of the Malian economy over the 2007-2011 period.
48. A distinction is made between general assumptions, which are the same for the two scenarios (the basic scenario and the ambitious scenario) and specific assumptions, which vary from one scenario to another.
49. The detailed forecast assumptions for the two scenarios can be found in Tables 10 and 11 below.
2.3.1 General assumptions 50. For the international environment, the assumptions indicate continuous improvement
gold and cotton prices between 2007 and 2011 and a slight decline in oil prices starting in 2008.
51. Indeed, gold prices, which reached 443.5 dollars an ounce in 2005, are expected to continue their gradual rise up to 775 dollars in 2011.
52. Cotton prices are also expected to continue rising from 55.2 cents/lb in 2005 to 63 cents/lb in 2011.
Table 12: General assumptions
53. Global inflation, measured by the export price index for manufactured products of the five
major industrialized countries (Manufactured Unit Value - MUV), is expected to show annual growth of 1.2 percent between 2007 and 2011 as against an average of 3.5 percent between 2002 and 2005.
54. A regular depreciation of around 0.8 percent a year of the dollar against the CFA franc is forecast over the 2007 to 2011 period.
General assumptions Average estim forecast forecast forecast forecast Average2002-2005 2006 2007 2008 2009 2010 2011 2007-2011
Global inflation rate (measured by the MUV) 3.5% 1.6% 1.2% 1.2% 1.2% 1.2% 1.2% 1.2%Cotton Prices (Cents/lb) 57.0 58.5 60.5 63.0 63.0 63.0 61.6Gold Prices ($/ounce) 618.0 670.0 710.0 750.0 770.0 775.0 735.0Oil Prices ($/barrel) 66.5 69.8 68.5 67.5 66.8 66.0 67.7Ratio US$/Euro 1.14106 1.25600 1.28635 1.29339 1.29895 1.30446 1.30971 1.29857CFAF/US$ Exchange rate (period average) 582.2 522.3 509.9 507.2 505.0 502.9 500.8 505.2 US$/CFAF (Change) -7.7% -0.8% -2.4% -0.5% -0.4% -0,4% -0.4% -0.8%CFAF/EURO Exchange rate 656.0 656.0 656.0 656.0 656.0 656.0 656.0 656.0
forecast

55. In terms of net foreign assets, the forecasts include an average annual target of 5.4 months of imports.
2.3.2 Specific assumptions 56. The specific assumptions on the national economy are defined for the basic scenario and
the optimistic scenario separately (see Section 4.1 below).
57. The main differences between the two scenarios relate to growth in the promising sectors, such as rice, cotton, agrofood, textiles, livestock farming, gold, water/electricity, and private services, as well as to the tax ratio.
Basic scenario assumptions 58. The average annual growth rate for food crop farming, excluding rice, is projected to be
5.6 percent based on trends of the past six years.
59. For rice, projections put growth at 7.3 percent in 2007 and at 7 percent for the rest of the period.
60. Cotton production, in turn, is expected to remain constant at 2006 levels over the entire period, hence a zero growth projection.
61. Livestock production is expected to grow by 3 percent over the forecast period.
62. Projections for gold production are drawn from the DNGM, with growth of 0.7 percent and -10.5 percent forecast for 2007 and 2008, respectively. For the rest of the period, mining production should grow by 0.7 percent in 2009, -4.8 percent in 2010, and -2.7 percent after 2010. This forecast can be explained by the fact that most of the existing mines are ageing and their reserves are low.
63. Electricity and water production is projected to grow at 10.2 percent a year over the whole period. This projection reflects the commitment to boost electricity supplies through ongoing investment in rural electrification.
64. Growth in private services is an endogenous variable of the macroeconomic model (MME). The rate of growth of the related branches follows the pace of development of the so-called “modern” branches of the primary and secondary sectors.
65. The growth of non-market services mirrors the growth, in real terms, of civil service wages paid by the government. Wages are projected by the MEF in the overall MTBF.
66. In sum, real GDP growth at market prices is estimated at 5.0 percent a year on average (5.2 percent for 2002 – 2005).
67. Public investment is projected to grow in line with the Special Capital Budget (BSI) prepared by the MPAT in conjunction with the overall MTBF of the MEF. On that basis, the rate of public investment (in percent of GDP at factor cost, GDPfc) is estimated at 9.9 percent a year on average over the forecast period (versus 7.7 percent for the 2002–2005 period).
68. Private investments are projected on the basis of past trends, namely 10.4 percent of GDPfc in 2002 – 2005, and taking into account the major projects listed in Section 2.4.3 below. The result is an estimated annual average rate of investment of 12.1 percent between 2007 and 2011.
69. Regarding taxation, forecasts of direct and indirect duties and taxes as well as other fiscal revenues are based on individual growth rates resulting from econometric tests of past

series and independent estimates. Given the annual tax ratio (= tax revenue in percent of nominal GDP) of 14.6 percent on average between 2002 and 2005, the tax ratio for the basic scenario is set to increase gradually from 15.1 percent in 2007 to 17.0 percent in 2011.
70. Public debt service is expected to drop sharply in the wake of the massive external debt restructuring of mid-2006 to the tune of CFAF 1,035.7 billion. The DGDP’s forecasts were adopted.
71. The volume of external financial and budget support was projected essentially on the basis of the Three-year Investment Program (PTI) and other expenditures contained in the national budget within the framework of the overall MTBF. The following ratios of the various forms of aid to total expenditure are the result of that exercise.
Table 13: External aid assumptions
Ambitious scenario assumptions 72. As mentioned above, the main differences between the two scenarios relate to the growth
assumptions for the promising sectors and taxation.
73. The national program for the supply of farm and irrigation equipment to rural farmers (Programme national pour la fourniture de matériel agricole et d’irrigation au bénéfice des producteurs ruraux) is to be started up and executed under the Team-9 Initiative. A line of credit has been made available to Mali by the Government of India. Two Indian companies have been contracted to supply the following equipment and materials: 395 tractors (50-60 HP) with standard kit and spare parts, 300 disk plows, and a plant for equipment assembly, start-up and training of beneficiaries.
74. Further, the sectoral consultation on rural development and irrigated farming held in Bamako in May 2006 identified financing needs totaling CFAF 364 billion, out of which pledges were made for CFAF 335 billion by the PTF. Implementation of the new agricultural policy law (LOA) is also expected to transform the sector and usher in progress by facilitating the modernization of the agricultural sector and its reorientation towards commercial farming as well as promoting land tenure security and sustainable food sovereignty.
75. Initial implementation of the national policy for the development of livestock farming is due to be launched through projects such as i) the Support Project for Livestock Development in Northeast Mali, ii) the Livestock Development Project in Liptako Gourma, and iii) the Tsetse Fly Eradication Project. Intensive campaigns will be organized from 2006 to 2011 to improve vaccination coverage against major epizootic diseases. The surveillance follow-up and intervention mechanism will provide a watch on avian flu in Mali.
76. In addition, Mali will soon be launching an intensive artificial insemination program aimed at genetic improvement of local breeds, industrial meat production and increased milk production.
77. The national fisheries and fish farming development policy is expected to focus heavily on the promotion of fish farming infrastructure. This strategy will be achieved through the
External aid assumptions Average estim forecast Average2002-2005 2006 2007 2008 2009 2010 2011 2007-2011
Ratio: project-related capital grants/total publ. expenditure 19.5% 41.3% 19,6% 20.5% 20.8% 21.1% 21.2% 20.6%Ratio: overall budgetary grants/tot. pbl. exp. 10.6% 7.9% 5,2% 5.0% 4.8% 4.5% 4.2% 4.7%Ratio: sectoral budget support/tot. pbl. exp 0,0% 10.4% 10.4% 7,1% 6.0% 6.1% 6.1% 7.1%Ratio: external loan drawings (budgetary)/tot. pbl. exp 6.1% 10.7% 6.3% 6.0% 5.7% 5.3% 4.9% 5.6%Ratio: external loan drawings (projet loans)/tot. pbl. exp 22.5% 24.5% 32.2% 33.2% 34.0% 34.9% 35.4% 34.0%
forecast forecast forecast forecast
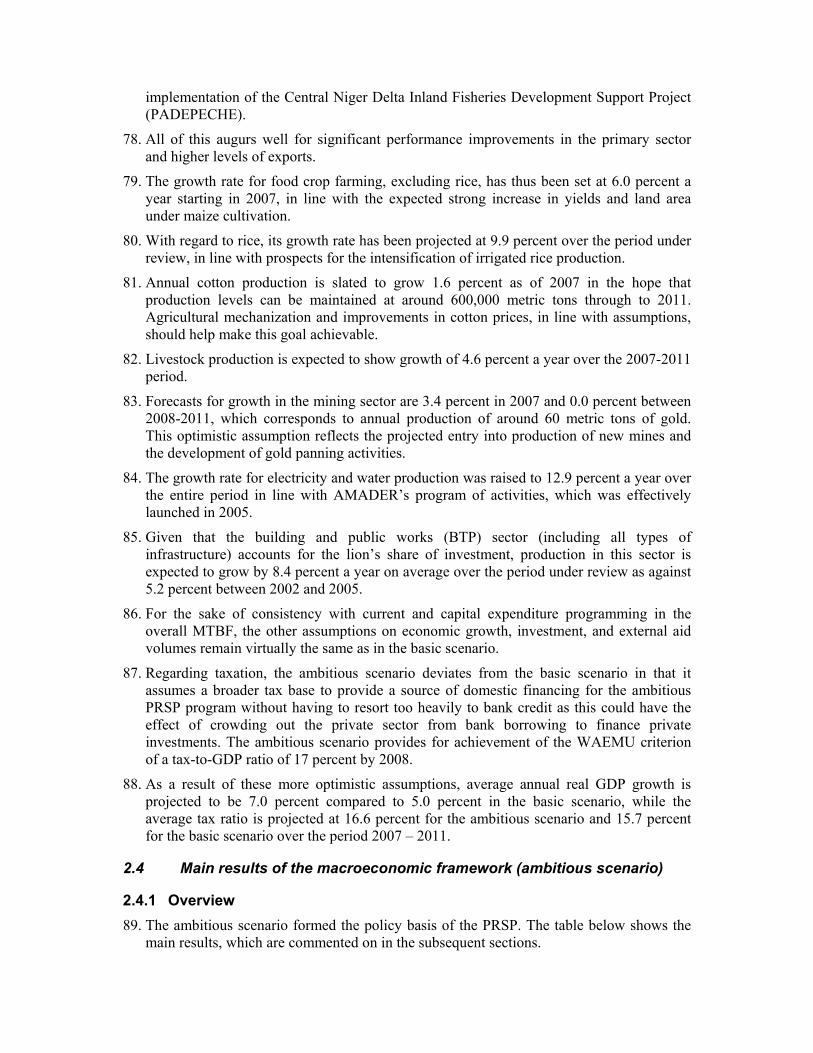
implementation of the Central Niger Delta Inland Fisheries Development Support Project (PADEPECHE).
78. All of this augurs well for significant performance improvements in the primary sector and higher levels of exports.
79. The growth rate for food crop farming, excluding rice, has thus been set at 6.0 percent a year starting in 2007, in line with the expected strong increase in yields and land area under maize cultivation.
80. With regard to rice, its growth rate has been projected at 9.9 percent over the period under review, in line with prospects for the intensification of irrigated rice production.
81. Annual cotton production is slated to grow 1.6 percent as of 2007 in the hope that production levels can be maintained at around 600,000 metric tons through to 2011. Agricultural mechanization and improvements in cotton prices, in line with assumptions, should help make this goal achievable.
82. Livestock production is expected to show growth of 4.6 percent a year over the 2007-2011 period.
83. Forecasts for growth in the mining sector are 3.4 percent in 2007 and 0.0 percent between 2008-2011, which corresponds to annual production of around 60 metric tons of gold. This optimistic assumption reflects the projected entry into production of new mines and the development of gold panning activities.
84. The growth rate for electricity and water production was raised to 12.9 percent a year over the entire period in line with AMADER’s program of activities, which was effectively launched in 2005.
85. Given that the building and public works (BTP) sector (including all types of infrastructure) accounts for the lion’s share of investment, production in this sector is expected to grow by 8.4 percent a year on average over the period under review as against 5.2 percent between 2002 and 2005.
86. For the sake of consistency with current and capital expenditure programming in the overall MTBF, the other assumptions on economic growth, investment, and external aid volumes remain virtually the same as in the basic scenario.
87. Regarding taxation, the ambitious scenario deviates from the basic scenario in that it assumes a broader tax base to provide a source of domestic financing for the ambitious PRSP program without having to resort too heavily to bank credit as this could have the effect of crowding out the private sector from bank borrowing to finance private investments. The ambitious scenario provides for achievement of the WAEMU criterion of a tax-to-GDP ratio of 17 percent by 2008.
88. As a result of these more optimistic assumptions, average annual real GDP growth is projected to be 7.0 percent compared to 5.0 percent in the basic scenario, while the average tax ratio is projected at 16.6 percent for the ambitious scenario and 15.7 percent for the basic scenario over the period 2007 – 2011.
2.4 Main results of the macroeconomic framework (ambitious scenario)
2.4.1 Overview 89. The ambitious scenario formed the policy basis of the PRSP. The table below shows the
main results, which are commented on in the subsequent sections.
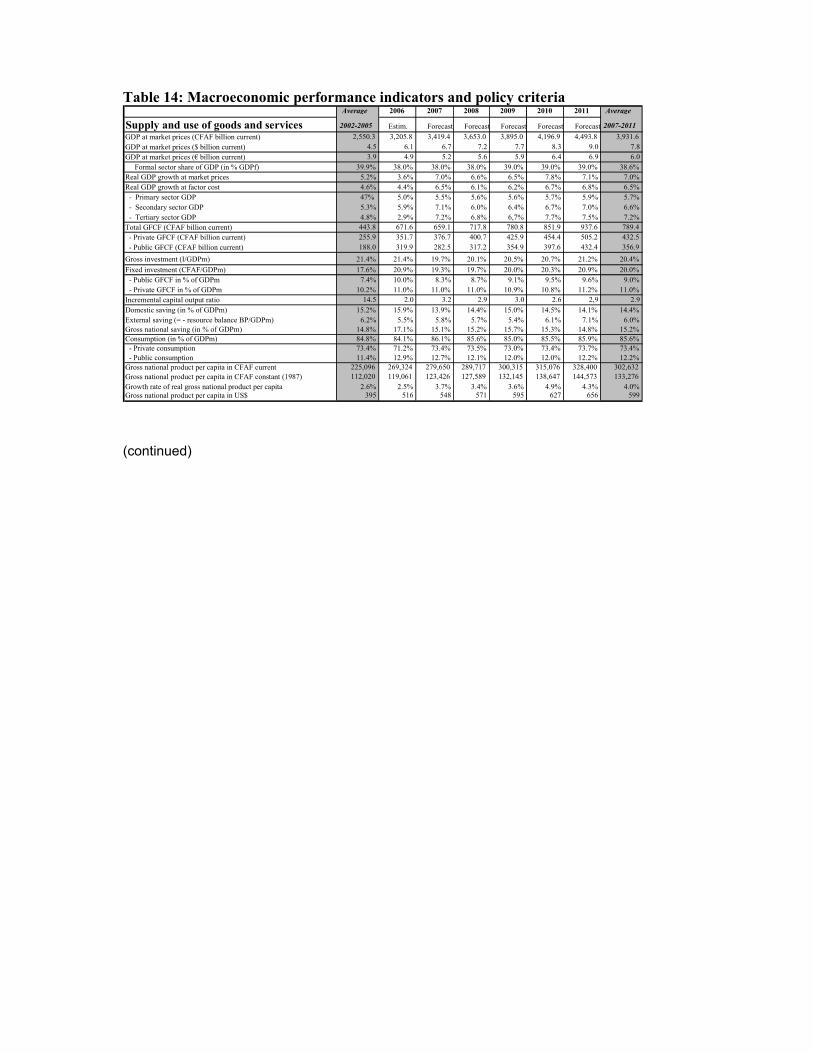
Table 14: Macroeconomic performance indicators and policy criteria
(continued)
Average 2006 2007 2008 2009 2010 2011 Average Supply and use of goods and services 2002-2005 Estim. Forecast Forecast Forecast Forecast Forecast 2007-2011 GDP at market prices (CFAF billion current) 2,550.3 3,205.8 3,419.4 3,653.0 3,895.0 4,196.9 4,493.8 3,931.6 GDP at market prices ($ billion current) 4.5 6.1 6.7 7.2 7.7 8.3 9.0 7.8 GDP at market prices (€ billion current) 3.9 4.9 5.2 5.6 5.9 6.4 6.9 6.0 Formal sector share of GDP (in % GDPf) 39.9% 38.0% 38.0% 38.0% 39.0% 39.0% 39.0% 38.6%Real GDP growth at market prices 5.2% 3.6% 7.0% 6.6% 6.5% 7.8% 7.1% 7.0% Real GDP growth at factor cost 4.6% 4.4% 6.5% 6.1% 6.2% 6.7% 6.8% 6.5% - Primary sector GDP 47% 5.0% 5.5% 5.6% 5.6% 5.7% 5.9% 5.7% - Secondary sector GDP 5.3% 5.9% 7.1% 6.0% 6.4% 6.7% 7.0% 6.6% - Tertiary sector GDP 4.8% 2.9% 7.2% 6.8% 6,7% 7.7% 7.5% 7.2% Total GFCF (CFAF billion current) 443.8 671.6 659.1 717.8 780.8 851.9 937.6 789.4 - Private GFCF (CFAF billion current) 255.9 351.7 376.7 400.7 425.9 454.4 505.2 432.5 - Public GFCF (CFAF billion current) 188.0 319.9 282.5 317.2 354.9 397.6 432.4 356.9Gross investment (I/GDPm) 21.4% 21.4% 19.7% 20.1% 20.5% 20.7% 21.2% 20.4%Fixed investment (CFAF/GDPm) 17.6% 20.9% 19.3% 19.7% 20.0% 20.3% 20.9% 20.0% - Public GFCF in % of GDPm 7.4% 10.0% 8.3% 8.7% 9.1% 9.5% 9.6% 9.0% - Private GFCF in % of GDPm 10.2% 11.0% 11.0% 11.0% 10.9% 10.8% 11.2% 11.0%Incremental capital output ratio 14.5 2.0 3.2 2.9 3.0 2.6 2,9 2.9 Domestic saving (in % of GDPm) 15.2% 15.9% 13.9% 14.4% 15.0% 14.5% 14.1% 14.4%External saving (= - resource balance BP/GDPm) 6.2% 5.5% 5.8% 5.7% 5.4% 6.1% 7.1% 6.0% Gross national saving (in % of GDPm) 14.8% 17.1% 15.1% 15.2% 15.7% 15.3% 14.8% 15.2%Consumption (in % of GDPm) 84.8% 84.1% 86.1% 85.6% 85.0% 85.5% 85.9% 85.6% - Private consumption 73.4% 71.2% 73.4% 73.5% 73.0% 73.4% 73.7% 73.4% - Public consumption 11.4% 12.9% 12.7% 12.1% 12.0% 12.0% 12.2% 12.2%Gross national product per capita in CFAF current 225,096 269,324 279,650 289,717 300,315 315,076 328,400 302,632 Gross national product per capita in CFAF constant (1987) 112,020 119,061 123,426 127,589 132,145 138,647 144,573 133,276 Growth rate of real gross national product per capita 2.6% 2.5% 3.7% 3.4% 3.6% 4.9% 4.3% 4.0% Gross national product per capita in US$ 395 516 548 571 595 627 656 599

2.4.2 Growth 90. Based on the assumptions of the ambitious scenario, growth of GDP at factor cost is
expected to average 6.5 percent over the 2007-2011 period and 7.0 percent at market prices (the latter includes a strong increase in indirect taxes in line with the aim of achieving compliance with the WAEMU tax ratio criterion by 2008).
91. Over the whole 2007-2011 period, growth in the primary sector (5.7 percent on average as against 4.7 percent between 2002 and 2005) is projected to be driven by food crop framing
Balance of payments Average 2006 2007 2008 2009 2010 2011 Average 2002-2005 Estim. Forecast Forecast Forecast Forecast Forecast 2007-2011 Imports (in % of GDPm), current prices 33.7% 32.4% 33.6% 33.6% 33.7% 33.5% 33,5% 33,6%Exports (in % of GDPm), current prices 27.5% 26.9% 27.8% 28.0% 28.2% 27.3% 26,4% 27,5%Trade deficit (fob) in % of GDPm -0.3% -1.1% -1.1% -1.1% -1.1% -1.7% -2,5% -1,5% Balance des ressources (X-Mcaf) in % of GDPm -6.2% -5.5% -5.8% -5.7% -5.4% -6.1% -7,1% -6,0% Current account (excluding off. transf.) in % of GDPm -8.6% -7.4% -7.3% -7.0% -6.7% -7.3% -8,2% -7,3% Current account (including off. transf.) in % of GDPm -6.6% -4.3% -4.6% -4.9% -4.7% -5.4% -6,4% -5,2% Net reserves in months of imports c.i.f. 5.5 5.7 5.6 5.6 5.4 5.3 5,3 5,4 Gross reserves in months of imports c.i.f. 8.3 7.8 7.6 7.5 7.2 6.9 6,9 7,2 Debt service ratio in % of exports B&SNF 8.1% 125.9% 4.9% 4.4% 4.2% 4.2% 4,3% 4,4%
Public finance Average 2006 2007 2008 2009 2010 2011 Average 2002-2005 Estim. Forecast Forecast Forecast Forecast Forecast 2007-2011 Tax ratio (= tax revenue/GDPm) 14.6% 14.7% 14.9% 17.0% 17.0% 17.0% 17,2% 16,6%Tax level (recurrent revenue, exc. grants, in % of GDP) 17.2% 16.8% 17.0% 19.7% 19.7% 19.7% 19,9% 19,2%Tax level (recurrent revenue in % of GDP formal sector) 47.7% 49.0% 49.5% 57.5% 56.3% 56.9% 57,7% 55,6%Total expenditures and net lending, in % of GDP 23.8% 27.0% 27.3% 27.0% 26.9% 26.9% 27,1% 27,0%Current account balance (nat. publ. savings) in % of GDP 7.3% 40.5% 8.1% 10.6% 10.5% 10.6% 10,7% 10,1%Current account balance (own savings) in % of GDP 3.9% 3.5% 3.6% 6.4% 6.5% 6.5% 6,6% 5,9%Primary balance (=own publ.savings exc. interest) in % of GDPm 4,6% 4,2% 4.0% 6.7% 6.8% 6.8% 6,9% 6,2%Primary balance (IMF), in % of GDP 1.4% 0.6% 0.2% 2.9% 2.9% 3.0% 3,1% 2,4%Primary balance (WAEMU), in % of GDP 0.2% -0.6% -1.3% 1.3% 1.4% 1.5% 1,6% 0,9%Overall balance (commitment basis), exc. grants, % of GDP -6.7% -10.2% -10.2% -7.3% -7.2% -7.1% -7,1% -7,8% Overall balance (commitment basis), inc. grants, % of GDP -2.6% 27.3% -5.3% -2.8% -2.9% -2.8% -2,9% -3,4% Overall balance (cash basis), in % of GDP -2.5% 27.3% -5.3% -2.8% -2.9% -2.8% -2,9% -3,4% Monetary survey Average 2006 2007 2008 2009 2010 2011 Average 2002-2005 Estim. Forecast Forecast Forecast Forecast Forecast 2007-2011 Claims on the Treasury (growth rate) 35.8% 280.6% -36.1% 117.4% 62.6% 51.6% 38,2% 46,7%Claims on the economy (growth rate) 11.4% 3.2% -3.3% 17.2% 19.6% 20.5% 17,6% 14,3%Increase in the money supply (M2) 15.2% 1.5% 5.3% 5.4% 5.3% 6.2% 5,6% 5,5%Velocity of circulation (GDP/M2, end of period) 3.4 3.8 3.8 3.9 3.9 4.0 4,0 3,9 Liquidity ratio (M2/GDPm) 29.4% 26.6% 26.3% 25.9% 25.6% 25.2% 24,9% 25,6% Prices and exchange rates Average 2006 2007 2008 2009 2010 2011 Average
2002-2005 Estim. Forecast Forecast Forecast. Forecast Forecast 2007-2011 Global inflation (MUV) 3.5% 1.6% 1.2% 1.2% 1.2% 1.2% 1.2% 1.2%Increase in CPI-Bamako households 1.8% 2.4% 0.2% 0.5% 0.3% 0.2% 0.2% 0.3%GDP deflator (growth rate) 1.9% 6.3% 0,2% 0.2% 0.1% 0.0% 0.0% 0.1%Terms of trade (1987 = 100) 69.2 73.8 78.2 81.7 85.3 86.6 86.7 83.7 CFAF/SDR exchange rate (end of period) 787.4 756.7 738.9 734.9 731.7 728.6 725.7 732.0 CFAF/US$ exchange rate (end of period) 547.0 522.3 509.9 507.2 505.0 502.9 500.8 505.2 CFAF/US$ exchange rate. (period average) 582.2 522.3 509.9 507.2 505.0 502.9 500.8 505.2 CFAF/€ exchange rate (period average) 656.0 656.0 656.0 656.0 656.0 656.0 656.0 656.0 Real exchange rate index (IP_M/IP_GDP; + devaluation) 126.7 125.9 123.5 122.9 122.7 122.5 122.4 122.8 External aid Average 2006 2007 2008 2009 2010 2011 Average
2002-2005 Estim. Forecast Forecast Forecast Forecast Forecast 2007-2011 External aid (gross) in % of GDP 9.2% 46.5% 10.5% 10.1% 10.0% 10.0% 10.0% 10.1%External aid (net) in % of GDP 7.2% 12.7% 9.6% 9.2% 9.0% 9.0% 9.0% 9.2%External aid (gross) in US$ million. 407.0 2,853.8 706.7 728.6 769.3 834.0 896.6 787.0 External aid (net) in US$ million 319.3 778.9 643.2 660.5 696.0 754.2 809.9 712.8 External aid (gross) US$ per capita 36.0 236.8 57.1 57.3 58.9 62.2 65.0 60.1 External aid (net) US$ per capita 28.2 64.6 52.0 52.0 53.3 56.2 58.8 54.4 WAEMU convergence criteria Average 2006 2007 2008 2009 2010 2011 Average Primary criteria: Ratio 2002-2005 Estim. Forecast Forecast Forecast Forecast Forecast 2007-2011 Ratio: basic fiscal balance/GDPm 1/ >=0% 0.2% -0.6% -1.3% 1.3% 1.4% 1.5% 1.6% 0.9%Inflation (HICP Bamako) <=3% 1.8% 2.4% 0.2% 0.5% 0.3% 0.2% 0.2% 0.3%Ratio: outstanding domestic and external debt/GDPm <=70% 0.0% 0.0% 0.0% 0.0% 0.0% 0.0% 0.0% 0.0% of which: outstanding external debt/GDP m 64.3% 23.3% 24.9% 25.2% 23.6% 21.1% 18.2% 22.6%Change in domestic payments arrears (in CFAF billion) <=0 0.0 0.0 0.0 0.0 0.0 0.0 0.0 0,0 Change in external payments arrears (in CFAF billion) <=0 0.0 0.0 0.0 0.0 0.0 0.0 0.0 0,0 Secondary criteria: Ratio: wage bill to tax revenue <=35% 30.7% 31.7% 31.5% 28.1% 28.2% 28.8% 28.8% 29.1%Ratio: public invest. financed by domestic res. from tax. rev. 2/>=20% 21.9% 25.8% 22.5% 22.5% 22.5% 22.5% 22.5% 22.5%Ratio: ext. curr. account deficit exc. public transfers/PIB m <=5% -8.6% -7.4% -7.3% -7.0% -6.7% -7.3% -8.2% -7.3% Tax ratio (= Tax revenue/GDP m) >=17% 14.6% 14.7% 14.9% 17.0% 17.0% 17.0% 17.2% 16.6%1/ Income (exc. grants) less total spending (inc. net lending) (exc. externally financed capital spending and exc. HIPC)/GDPm 2/ BSI investments onlySource: DNPD, MME-DNPD model

(rice, maize, etc.) and industrial farming excluding cotton (groundnuts, wheat, etc.), reflecting the spinoff effects of the implementation of major agricultural development projects.
92. In the secondary sector, average growth is forecast to be 6.6 percent versus 5.3 percent in the first four years of implementation of the PRSP. The main drivers are set to be the agrofood, water and electricity, and BTP sectors as well as the textile industry to a lesser extent. These performance projections take account of planned investment in rural electrification and the cement and sugar industries. Furthermore, the stated commitment to step up cotton processing activities should also give the textile industries a boost, despite the quite limited increase in cotton production.
93. As for the tertiary sector, average growth is expected to reach 7.2 percent, up from 4.8 percent between 2002 and 2005, driven essentially by the transport and telecommunications industries as well as by trade, buoyed by stronger performance in the primary and secondary sectors. In addition, public services (non-market) consisting mainly of civil service wages, are poised for strong growth consistent with the overall MTBF.
94. Taking account of population growth and external contributions to national income (current transfers and factor services), average real per capita national income is expected to grow by 4.0 percent between 2007 and 2011, as against 2.6 percent between 2002 and 2005, to around CFAF 328,400 current (US$656) in 2011.
Table 15: Supply and use of goods and nonfactor services in CFAF billion
2.4.3 Investment 95. The fixed investment rate (GFCF/GDP) is expected to improve gradually over the 2007-
2011 period, edging up to 20.0 percent on average, from the 17.6 percent recorded between 2002 and 2005. This increase is attributable to an improvement in the average annual rate of public investment, which is projected to be 9.0 percent versus 7.4 percent in 2002-2005. Private investment, in turn, should reach 11.0 percent in 2007-2011, up from 10.2 percent in 2002-2005.
96. Public investment levels will be supported by a number of major initiatives under the following project and program areas:
• The Kayes-Bafoulabé road, 2006-2010, for an amount of CFAF 17.8 billion;
• The Kita-Saraya road, 2007-2011, for an amount of CFAF 52 billion;
• Transport corridor improvements, 2005-2008, for an amount of CFAF 31.9 billion;
Average 2006 2007 2008 2009 2010 2011 Average 2002-2005 Estim. Prév. Prév. Prév. Prév. Prév. 2007-2011
GDP at market prices 2,550.3 3,205.8 3,419.4 3,653.0 3,895.0 4,196.9 4,493.8 3,931.6 Annual change 7.0% 10.8% 6.7% 6.8% 6.6% 7.7% 7.1% 7.0%Imports of nf goods and services 858.0 1,040.2 1,149.0 1,228.6 1,311.6 1,405.4 1,506.8 1,320.3 Annual change 3.3% 9.2% 10.5% 6.9% 6.8% 7.2% 7.2% 7.7%Total resources 3,408.3 4,246.0 4,568.5 4,881.6 5,206.6 5,602.3 6,000.6 5,251.9 Exports of nf goods and services 695.5 862.6 949.8 1,021.1 1,100.1 1,147.7 1,186.7 1,081.1 Annual change 4.2% 16.4% 10.1% 7.5% 7.7% 4.3% 3.4% 6.6%Gross investment 548.5 687.4 675.2 734.0 796.9 868.0 953.7 805.6 Gross fixed capital formation 443.8 671.6 659.1 717.8 780.8 851.9 937.6 789.4 Annual change 1.5% 50.3% -1.9% 8.9% 8.8% 9.1% 10.1% 7.0% Change in stocks 104.6 15.8 16.1 16.1 16.1 16.1 16.1 16.1 Final consumption 2,164.2 2,696.1 2,943.5 3,126.5 3,309.6 3,586.5 3,860.2 3,365.3 Annual change 7.4% 8.5% 9.2% 6.2% 5.9% 8.4% 7.6% 7.4% Public consumption 291.2 415.1 433.6 442.0 465.7 504.8 547.4 478.7 Annual change 10.8% 22.3% 4.5% 1.9% 5.4% 8.4% 8.4% 5.7% Household consumption 1,873.0 2,281.0 2,509.9 2,684.6 2,843.9 3,081.7 3,312.9 2,886.6 Annual change 6.9% 6.4% 10.0% 7.0% 5.9% 8.4% 7.5% 7.8%Source: DNPD, MME-DNPD model

• The Gao-Ansongo-Labezenga road, 2005-2008, for an amount of CFAF 38 billion;
• Kayes airport expansion for an amount of CFAF 6.6 billion;
• The Niono-Tonka road;
• The Transport Sector Program PST-2, 2008-2013;
• The accelerated economic growth program, 2004-2013, for a cost of CFAF 62.7 billion;
• The investment and rural development program for the northern regions (2006-2012) for CFAF 17.8 billion
• The Liptako-Gourma livestock development project (2005-2011) for CFAF 6.6 billion;
• The Mopti region development support program (2003-2010) for a cost of CFAF 14 billion;
• The agricultural competitiveness and diversification program, 2006-2011, estimated at CFAF 23.8 billion;
• The Baguineda rehabilitation project phase-II, 2007-2012, the cost of which has been estimated at CFAF 11.0 billion;
• The central delta inland fisheries development support project, 2005-2010, for an estimated CFAF 14.5 billion;
• The food security program for an amount of CFAF 113 billion;
• The artificial rain program for a cost of around CFAF 5 billion over the next five years;
• The rural communities support program (2006-2012) for an amount of CFAF 33.0 billion;
• The growth support project (2006-2011) for an amount of CFAF 35.7 billion;
• The Taoussa development project (2009-2013) for CFAF 104 billion;
• Construction of the Kenie hydroelectric power plant for an amount of CFAF 75 billion;
• Oil prospecting;
• Construction of the Felou hydroelectric power plant (see OMVS);
• The investment program of Mali’s electric utility, EDM.
97. Over the 2007-2011 period, private investments will flow mainly to the mining, textiles (cotton processing), agro-industry, and infrastructure development sectors. Thus, the main private efforts will focus on:
• Cement works: West Africa Cement (WACEM) plans to invest CFAF 55 billion in Diamou;
• Sugar industry: the Markala and Sukala-III factories will be financed by the Americans and Chinese, respectively. The financing cost of Sukala-III has been estimated at 103.8 million dollars;
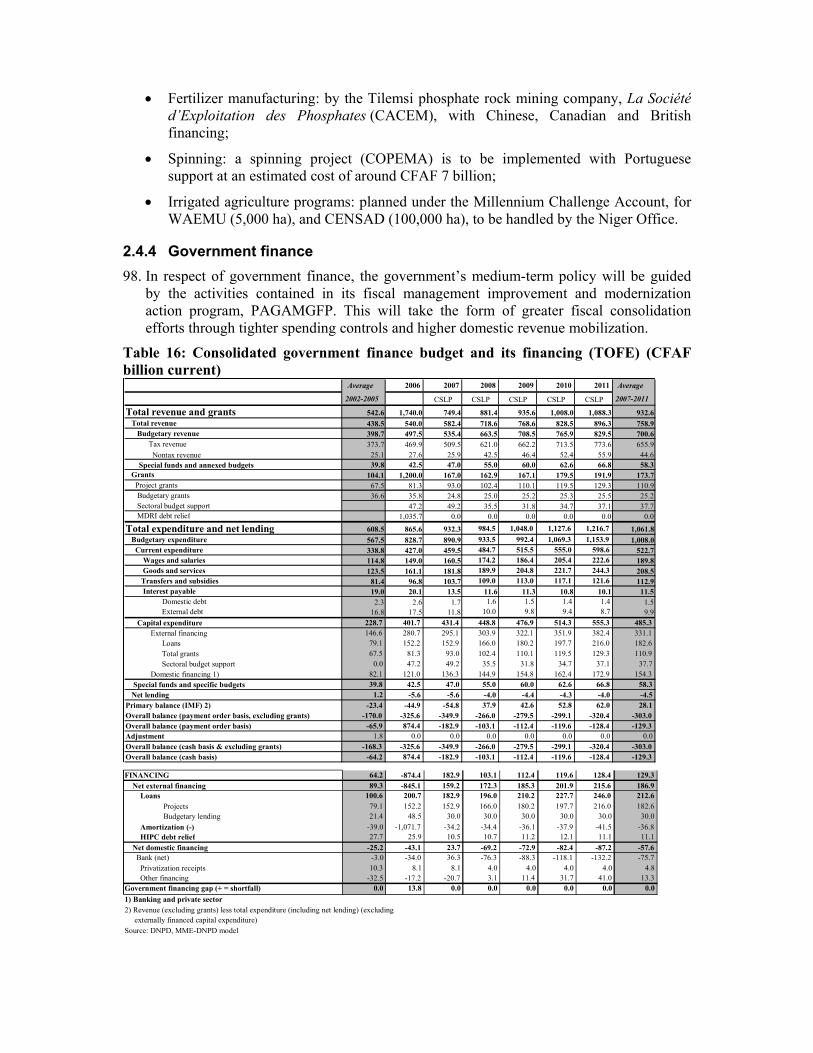
• Fertilizer manufacturing: by the Tilemsi phosphate rock mining company, La Société d’Exploitation des Phosphates (CACEM), with Chinese, Canadian and British financing;
• Spinning: a spinning project (COPEMA) is to be implemented with Portuguese support at an estimated cost of around CFAF 7 billion;
• Irrigated agriculture programs: planned under the Millennium Challenge Account, for WAEMU (5,000 ha), and CENSAD (100,000 ha), to be handled by the Niger Office.
2.4.4 Government finance 98. In respect of government finance, the government’s medium-term policy will be guided
by the activities contained in its fiscal management improvement and modernization action program, PAGAMGFP. This will take the form of greater fiscal consolidation efforts through tighter spending controls and higher domestic revenue mobilization.
Table 16: Consolidated government finance budget and its financing (TOFE) (CFAF billion current) Average 2006 2007 2008 2009 2010 2011 Average
2002-2005
CSLP CSLP CSLP CSLP CSLP 2007-2011 Total revenue and grants 542.6 1,740.0 749.4 881.4 935.6 1,008.0 1,088.3 932.6 Total revenue 438.5 540.0 582.4 718.6 768.6 828.5 896.3 758.9 Budgetary revenue 398.7 497.5 535.4 663.5 708.5 765.9 829.5 700.6 Tax revenue 373.7 469.9 509.5 621.0 662.2 713.5 773.6 655.9 Nontax revenue 25.1 27.6 25.9 42.5 46.4 52.4 55.9 44.6 Special funds and annexed budgets 39.8 42.5 47.0 55.0 60.0 62.6 66.8 58.3 Grants 104.1 1,200.0 167.0 162.9 167.1 179.5 191.9 173.7 Project grants 67.5 81.3 93.0 102.4 110.1 119.5 129.3 110.9 Budgetary grants 36.6 35.8 24.8 25.0 25.2 25.3 25.5 25.2 Sectoral budget support 47.2 49.2 35.5 31.8 34.7 37.1 37.7 MDRI debt relief 1,035.7 0.0 0.0 0.0 0.0 0.0 0.0
Total expenditure and net lending 608.5 865.6 932.3 984.5 1,048.0 1,127.6 1,216.7 1,061.8 Budgetary expenditure 567.5 828.7 890.9 933.5 992.4 1,069.3 1,153.9 1,008.0 Current expenditure 338.8 427.0 459.5 484.7 515.5 555.0 598.6 522.7 Wages and salaries 114.8 149.0 160.5 174.2 186.4 205.4 222.6 189.8 Goods and services 123.5 161.1 181.8 189.9 204.8 221.7 244.3 208.5 Transfers and subsidies 81.4 96.8 103.7 109.0 113.0 117.1 121.6 112.9 Interest payable 19.0 20.1 13.5 11.6 11.3 10.8 10.1 11.5 Domestic debt 2.3 2.6 1.7 1.6 1.5 1.4 1.4 1.5 External debt 16.8 17.5 11.8 10.0 9.8 9.4 8.7 9.9 Capital expenditure 228.7 401.7 431.4 448.8 476.9 514.3 555.3 485.3 External financing 146.6 280.7 295.1 303.9 322.1 351.9 382.4 331.1 Loans 79.1 152.2 152.9 166.0 180.2 197.7 216.0 182.6 Total grants 67.5 81.3 93.0 102.4 110.1 119.5 129.3 110.9 Sectoral budget support 0.0 47.2 49.2 35.5 31.8 34.7 37.1 37.7 Domestic financing 1) 82.1 121.0 136.3 144.9 154.8 162.4 172.9 154.3 Special funds and specific budgets 39.8 42.5 47.0 55.0 60.0 62.6 66.8 58.3 Net lending 1.2 -5.6 -5.6 -4.0 -4.4 -4.3 -4.0 -4.5 Primary balance (IMF) 2) -23.4 -44.9 -54.8 37.9 42.6 52.8 62.0 28.1 Overall balance (payment order basis, excluding grants) -170.0 -325.6 -349.9 -266.0 -279.5 -299.1 -320.4 -303.0 Overall balance (payment order basis) -65.9 874.4 -182.9 -103.1 -112.4 -119.6 -128.4 -129.3 Adjustment 1.8 0.0 0.0 0.0 0.0 0.0 0.0 0.0 Overall balance (cash basis & excluding grants) -168.3 -325.6 -349.9 -266.0 -279.5 -299.1 -320.4 -303.0 Overall balance (cash basis) -64.2 874.4 -182.9 -103.1 -112.4 -119.6 -128.4 -129.3 FINANCING 64.2 -874.4 182.9 103.1 112.4 119.6 128.4 129.3 Net external financing 89.3 -845.1 159.2 172.3 185.3 201.9 215.6 186.9 Loans 100.6 200.7 182.9 196.0 210.2 227.7 246.0 212.6 Projects 79.1 152.2 152.9 166.0 180.2 197.7 216.0 182.6 Budgetary lending 21.4 48.5 30.0 30.0 30.0 30.0 30.0 30.0 Amortization (-) -39.0 -1,071.7 -34.2 -34.4 -36.1 -37.9 -41.5 -36.8 HIPC debt relief 27.7 25.9 10.5 10.7 11.2 12.1 11.1 11.1 Net domestic financing -25.2 -43.1 23.7 -69.2 -72.9 -82.4 -87.2 -57.6 Bank (net) -3.0 -34.0 36.3 -76.3 -88.3 -118.1 -132.2 -75.7 Privatization receipts 10.3 8.1 8.1 4.0 4.0 4.0 4.0 4.8 Other financing -32.5 -17.2 -20.7 3.1 11.4 31.7 41.0 13.3Government financing gap (+ = shortfall) 0.0 13.8 0.0 0.0 0.0 0.0 0.0 0.01) Banking and private sector 2) Revenue (excluding grants) less total expenditure (including net lending) (excluding externally financed capital expenditure) Source: DNPD, MME-DNPD model
99. The results of the ambitious scenario (see Annex II for details on public finance forecasts) put total income, excluding grants, at CFAF 896.3 billion in 2011 versus CFAF 540.0 in 2006, that is, an average annual progression of 10.7 percent, compared to 13.0 percent in 2002-2005. Tax revenue is projected to grow by an annual average of 10.5 percent. As the tax ratio in 2002-2005 stood at 14.6 percent a year on average, this indicator is poised to grow considerably, with compliance with the community standard of 17.0 percent expected to be met in 2008 and maintained through to 2011.
100. Effective implementation of the measures contained in the PAGAMGFP is a necessary pre-condition for achieving this objective.
101. The forecasts for total expenditure and net lending are fully in line with the macroeconomic framework and the overall MTBF. The macro-fiscal framework provides for a 7.0 percent average annual increase in total expenditure and net lending to CFAF 1,216.7 billion in 2011.
102. For its part, the wage bill is set to increase from CFAF 149 billion in 2006 to CFAF 222.6 billion in 2011, up by 8.4 percent on average as against 12.6 percent in 2002-2005. This represents an average of 29.1 percent of tax revenue between 2007 and 2011, down from 30.7 percent between 2002 and 2005, thus complying with the WAEMU criterion of less than 35 percent. The latter is also true for the basic fiscal balance criterion, which should be positive. In relation to GDP, the average annual ratio is 0.9 percent in the 2007-2011 period versus 0.2 percent in 2002-2005. The third WAEMU criterion is also expected to be met, namely that the ratio of public investment financed from domestic resources must be at least 20 percent of GDP. The budget forecasts project a ratio of 22.6 percent on average for the period 2007-2001 compared to 21.9 percent in 2002-2005
2.4.5 Public debt 103. The IMF Multilateral Debt Relief Initiative (MDRI), which entered into force on
January 2, 2006, covers an estimated debt stock of CFAF 64.7 billion. The World Bank and AfDB group contributions to the Initiative, with effect from July 2006, total around CFAF 706 billion and CFAF 265 billion, respectively. Mali has, therefore, benefited from 100 percent cancellation of its estimated CFAF 1,035.7 billion multilateral debt, bringing its stock of public debt-to-GDP ratio down to 22.6 percent on average for the period 2007-2001 from 64.3 percent in 2002-2005.
104. The debt service to exports ratio will, thus, drop to 4.3 percent on average in 2007-2011 from 8.1 percent in 2002-2005.
105. For the Treasury, MDRI debt relief represents savings of around CFAF 34 billion a year between 2007 and 2011, that is, a gain of around 3.4 percent of annual budgetary expenditure, excluding external debt service.
2.4.6 Balance of payments and monetary survey 106. The macroeconomic framework provides for average annual growth of 6.6 percent in
exports and 7.7 percent in imports, in line with production trends and international market prices for Mali’s main export products, gold and cotton. In that context, the average trade deficit is expected to widen to 1.5 percent of GDP from 0.3 percent over the 2002-2005 period.
107. The current account balance, excluding official transfers, is projected to be 7.3 percent of GDP on average versus 8.6 percent between 2002 and 2005. This development is

attributable to the improvement in the trade balance and in the deficit in respect of nonfactor services, spurred by the booming tourism sector. The current account balance, including grants, is, thus, forecast to be 5.2 percent on average in 2007-2011, as against 6.6 percent in 2002-2005.
108. In terms of net foreign assets, from 5.5 months and 8.3 months, respectively in 2002-2005, over the 2007-2011 period, net reserves have been estimated at 5.4 months, and gross reserves at 7.2 months, of import coverage on average, with total net foreign assets amounting to CFAF 653.5 billion in 2011.
Table 17: Balance of payments (CFAF billion)
109. Money supply (M2) is projected in relation to trends in real GDP (7.0 percent) and inflation (0.1 percent) which will make it possible to maintain a liquidity ratio (M2/GDP) of 25.6 percent on average.
110. In addition, credit to the economy is forecast at CFAF 1,022 billion in 2011, amply covering all the private sector’s financing needs.
111. The government should see its net position improve from CFAF -64.1 billion in 2007 to around CFAF -475 billion in 2011, bolstered in large measure by the broader tax base.
Average 2006 2007 2008 2009 2010 2011 Average2002-2005 Estim. Prév. Prév. Prév. Prév. Prév. 2007-2011
Balance commerciale (marchand. fob) -13.4 -33.9 -36.4 -41.1 -42.8 -70.8 -111.0 -60.4 Exportations (fob) 566.0 714.4 772.2 823.5 880.1 918.1 949.4 868.6 Coton fibre 151.2 154.5 154.3 161.3 170.0 172.0 174.1 166.3 Or 347.4 487.9 534.3 563.1 592.3 605.5 607.0 580.5 Elevage 24.4 22.7 24.2 26.2 28.4 30.7 33.3 28.5 Autres 43.0 49.3 59.4 72.9 89.5 109.9 134.9 93.3 Importations (fob) -579.3 -748.3 -808.5 -864.5 -922.9 -988.9 -1,060.3 -929.1Services non-facteurs (net) -149.1 -143.7 -162.9 -166.4 -168.6 -186.9 -209.2 -178.8 Crédit 129.6 148.2 177.6 197.6 220.0 229.5 237.3 212.4 Débit -278.6 -291.9 -340.5 -364.1 -388.7 -416.5 -446.5 -391.2Services facteurs (net) -118.4 -111.2 -99.3 -98.0 -98.5 -98.8 -98.8 -98.7
Rémunérations des salaries 3.3 4.0 4.0 4.0 4.0 4.0 4.1 4.0 Revenus des investissements -121.8 -115.2 -103.2 -102.0 -102.5 -102.8 -102.8 -102.7
- Intérêts sur la dette publique -16.8 -14.0 -12.3 -10.5 -10.3 -9.9 -9.2 -10.4 - Autres revenus des investissements -105.0 -92.0 -90.9 -91.5 -92.2 -92.9 -93.6 -92.2Transferts courants 110.5 151.0 141.2 128.1 125.1 128.7 131.9 131.0 Transferts du secteur privé (net) 58.1 50.0 49.4 49.7 50.1 50.5 50.9 50.1 Transferts officiels 52.4 101.0 91.8 78.4 75.0 78.2 81.0 80.9 Balance des ressources (X - M) -162.4 -177.6 -199.2 -207.5 -211.5 -257.7 -320.1 -239.2Solde des transactions courantes (hors transferts officiels) -222.8 -238.8 -249.1 -255.8 -259.8 -306.0 -368.0 -287.8Solde des transactions courantes (y.c. transferts officiels) -170.3 -137.8 -157.3 -177.4 -184.9 -227.8 -287.0 -206.9Compte de capital et financier 188.2 187.2 173.6 202.6 192.5 246.2 313.1 225.6 Compte de capital 74.5 191.5 95.5 105.1 113.1 122.7 132.8 113.8 Compte financier 113.6 -4.3 78.2 97.5 79.4 123.5 180.4 111.8 Financier (net) 52.7 -127.6 -70.5 -64.1 -94.7 -66.3 -24.1 -63.9 Officiel (net) 61.0 123.3 148.7 161.6 174.1 189,8 204.5 175.7 Tirages 100.6 159.3 182.9 196.0 210.2 227.7 246.0 212.6 Budgétaires 21.4 48.5 30.0 30.0 30.0 30.0 30.0 30.0 Prêts-projets 79.1 110.8 152.9 166.0 180.2 197.7 216.0 182.6 Restructuration dette IADM 0.0 1 035.7 0.0 0.0 0.0 0.0 0.0 0.0 Remboursements dus sur dette publique -39.6 -1 071.7 -34.2 -34.4 -36.1 -37.9 -41.5 -36.8Erreurs et omissions 5.6 0.0 0.0 0.0 0.0 0.0 0.0 0.0 Balance globale 23.5 49.4 16.3 25.2 7.6 18.5 26.1 18.7 Financing -23.5 -49.4 -16.3 -25.2 -7.6 -18.5 -26.1 -18.7 Avoirs extérieurs nets (- = augmentation) -51.2 -75.3 -26.8 -35.9 -18.8 -30.6 -37.2 -29.9 PPTE assistance 27.7 25.9 10.5 10.7 11.2 12.1 11.1 11.1 Financing gap 0.0 0.0 0,0 0.0 0.0 0.0 0.0 0.0 Source: DNPD, MME-DNPD model

Table 18: Monetary situation (CFAF billion; end of period)
2.4.7 External aid 112. With regard to projections of external aid volumes, the macroeconomic framework
provides for two variants of the ambitious scenario. The following table shows the forecasts (based on the balance of payments) assuming full coverage of the external financing needs as expressed in the macroeconomic framework and, thus, a financing gap of zero. In adopting this optimistic view, gross external aid needs (before debt servicing and HIPC debt relief) would amount to CFAF 397 billion (US$787 million) a year for the 2007–2011 period, which corresponds to around EUR 606 million a year versus 355 million in 2002-2005.
Fin d'année Average 2006 2007 2008 2009 2010 2011 Average2002-2005 Estim. Prév. Prév. Prév. Prév. Prév. 2007-2011
Avoirs extérieurs bruts 556.4 693.8 718.3 755.4 775.7 807.8 846.5 780.7 Engagements extérieurs 186.0 189.6 187.3 188.6 190.0 191.5 193.0 190.1 Avoirs extérieurs nets 370.4 504.2 530.9 566.8 585.6 616.3 653.5 590.6 BCEAO 330.1 468.1 477.8 510.1 527.1 554.7 588.2 531.6 Banques commerciales 40.3 36.1 53.1 56.7 58.6 61.6 65.4 59.1 Avoirs intérieurs nets 434.3 432.0 450.5 463.5 494.5 525.1 547.3 496.2 Créances sur l'Etat, nettes -47.1 -100.4 -64.1 -139.4 -226.7 -343.8 -475.0 -249.8 Créances sur l'économie 481.5 532.4 514.6 602.9 721.2 868.9 1,022.2 746.0 Ressources = emplois 804.5 936.2 981.4 1,030.3 1,080.1 1,141.4 1,200.8 1,086.8 Masse Monétaire (M2) 749.1 852.6 897.7 946.4 996.2 1,057.5 1,116.9 1,003.0 Circulation fiduciaire 296.5 347.5 362.7 379.1 395.7 415.9 435.3 397.7 Dépôts à vue et à terme 452.6 505.2 530.7 553.6 576.7 605.0 632.0 579.6 Autres postes, nets 55.5 83.5 83.7 83.9 83.9 83.9 83.9 83.9 Ressources = emplois 804.5 936.2 981.4 1,030.3 1,080.1 1,141.4 1,200.8 1,086.8 Pour mémoire:
Produit intérieur brut aux prix du marché 2,550.3 3,205.8 3,419.4 3,653.0 3,895.0 4,196.9 4,493.8 3,931.6 Taux de liquidité (M2/PIBm) 29.4% 26.6% 26.3% 25.9% 25.6% 25.2% 24.9% 25.6%Vitesse de circulation (PIBm/M2) 3.4 3.8 3.8 3.9 3.9 4.0 4.0 3.9 Source: DNPD, modèle MME-DNPD

Table 19: External aid needs (CFAF billion)
113. In the event that this assumption might be considered too optimistic, an alternative
scenario has been established based on the assumption that only 75 percent of the external financing needs would be met. The table below, thus, shows a financing gap of around CFAF 97 billion (U$191 million or EUR 147 million) a year.
114. To this gap should be added a domestic financing gap of around CFAF 27 billion a year should the assumptions of the basic scenario be realized, which would mean, inter alia, achieving a 17 percent tax ratio by 2011 only.
Table 20: Financing gap (CFAF billion) Aide extérieure (mrd. FCFA) Moyenne Moyenne
Scénario alternatif 2002-2005 2006 2007 2008 2009 2010 2011 2007-2011Total Aide extérieure financière requise (brut) en mrd. FCFA 233,0 1.494,8 272,9 279,8 294,2 317,6 339,6 300,8Total des Dons (BdP, hors Ass.technique et aide en nature) 104,7 1.309,6 125,3 122,1 125,3 134,7 144,0 130,3 Dons en capital liés aux projets 68,1 186,5 69,8 76,8 82,6 89,6 97,0 83,1 Dons budgétaires globaux 36,6 35,8 18,6 18,7 18,9 19,0 19,2 18,9 Appui budgétaire sectoriel 0,0 47,2 36,9 26,6 23,9 26,0 27,8 28,2 Restructuration dette IADM 0,0 1040,1 0,0 0,0 0,0 0,0 0,0 0,0Total des tirages sur emprunts extérieurs 100,6 159,3 137,2 147,0 157,7 170,8 184,5 159,4 Budgétaires 21,4 48,5 22,5 22,5 22,5 22,5 22,5 22,5 Prêts-projets 79,1 110,8 114,7 124,5 135,2 148,3 162,0 136,9Remboursements dus sur dette publique 39,6 1076,1 34,2 34,4 36,1 37,9 41,5 36,8Régulation dette/PPTE 27,7 25,9 10,5 10,7 11,2 12,1 11,1 11,1Total Aide extérieure financière (hors intérêts) (net) en mrd. FCFA 165,7 392,8 228,2 234,7 246,8 267,5 287,0 252,9Intérêts sur la dette extérieure publique 16,8 14,0 12,3 10,5 10,3 9,9 9,2 10,4Total Aide extérieure financière (net) en mrd. FCFA 149,0 378,8 215,9 224,2 236,5 257,6 277,8 242,4Aide à rechercher: gap de financement du Budget (mrd. FCFA) 0,0 13,8 87,5 89,7 94,3 101,8 109,5 96,6Aide à rechercher: gap de financement du Budget (millions $ E.U.) 0,0 26,4 171,5 176,9 186,8 202,5 218,6 191,3Aide à rechercher: gap de financement du Budget (millions EURO) 0,0 21,0 133,4 136,8 143,8 155,2 166,9 147,2
Average 2006 2007 2008 2009 2010 2011 Average 2002-2005 Estim. Prév. Prév. Prév. Prév. Prév. 2007-2011
Total Aide extérieure financière requise (brut) 233.0 1,490.4 360.4 369.5 388.5 419.4 449.1 397.4Total des Dons (BdP, hors Ass.technique et aide en nature) 104.7 1,305.2 167.0 162.9 167.1 179.5 191.9 173.7 Dons en capital liés aux projets 68.1 186.5 93.0 102.4 110.1 119.5 129.3 110.9 Dons budgétaires globaux 36.6 35.8 24.8 25.0 25.2 25.3 25.5 25.2 Appui budgétaire sectoriel 0.0 47.2 49.2 35.5 31.8 34.7 37.1 37.7 Restructuration dette IADM 0.0 1,035.7 0.0 0.0 0.0 0.0 0.0 0.0 Total des tirages sur emprunts extérieurs 100.6 159.3 182.9 196.0 210.2 227.7 246.0 212.6 Budgétaires 21.4 48.5 30.0 30.0 30.0 30.0 30.0 30.0 Prêts-projets 79.1 110.8 152.9 166.0 180.2 197.7 216.0 182.6Remboursements dus sur dette publique 39.6 1,071.7 34.2 34.4 36.1 37.9 41.5 36.8 Régulation dette/PPTE 27.7 25.9 10.5 10.7 11.2 12.1 11.1 11.1 Total Aide extérieure financière (hors intérêts) (net) 165.7 392.8 315.7 324.5 341.2 369.3 396.4 349.4Intérêts sur la dette extérieure publique 16.8 14.0 12.3 10.5 10.3 9.9 9.2 10.4 Total Aide extérieure financière (net) 182.5 406.8 328.0 335.0 351.5 379.2 405.6 359.9Aide à rechercher: gap de financement du Budget 0.0 13.8 0.0 0.0 0.0 0.0 0.0 0.0
Average Average
Aide extérieure (millions $ E.U.) 2002-2005 2006 2007 2008 2009 2010 2011 2007-2011 Total Aide extérieure financière requise (brut) 407.0 2,853.8 706.7 728.6 769.3 834,0 896,6 787,0 Total des Dons (BdP, hors Ass.technique et aide en nature) 184.0 2,499.1 327.5 321.1 330.8 357,1 383,3 343,9 Dons en capital liés aux projets 118.7 357.1 182.4 201.9 218,0 237,6 258,2 219,6 Dons budgétaires globaux 65.4 68.5 48.6 49.2 49,8 50,4 51,0 49,8 Appui budgétaire sectoriel 0.0 90.4 96.5 70.0 63,0 69,0 74,1 74,5 Restructuration dette IADM 0.0 1,983.1 0.0 0.0 0,0 0,0 0,0 0,0 Total des tirages sur emprunts extérieurs 174.8 305.0 358.7 386.5 416,2 452,8 491,2 421,1 Budgétaires 35.5 92.9 58.8 59.2 59,4 59,7 59,9 59,4 Prêts-projets 139.3 212.2 299.8 327.3 356,8 393,2 431,3 361,7 Remboursements dus sur dette publique 68.7 2052.0 67.1 67.8 71,5 75,4 82,9 72,9 Régulation dette/PPTE 48.2 49.6 20.5 21.0 22,2 24,1 22,2 22,0 Total Aide extérieure financière (hors intérêts) (net) 290.1 752.1 619.1 639.8 675,6 734,5 791,6 692,1 Intérêts sur la dette extérieure publique 29.2 26.8 24.1 20.7 20,4 19,7 18,4 20,7 Total Aide extérieure financière (net) 319.3 778.9 643.2 660.5 696,0 754,2 809,9 712,8 Aide à rechercher: gap de financement du Budget 0.0 26.4 0.1 0.0 -0,1 0,0 -0,1 0,0 Aide extérieure financière (brut) en % du PIB 9.2% 46.5% 10.5% 10.1% 10,0% 10,0% 10,0% 10,1% Aide extérieure financière (net) en % du PIB 7.2% 12.7% 9.6% 9.2% 9,0% 9,0% 9,0% 9,2% Aide extérieure (brut) Euro par tête de la population 31.5 188.5 44.4 44.3 45,4 47,7 49,7 46,3 Aide extérieure (net) Euro par tête de la population 22.4 49.7 38.9 38.9 39,8 42,0 43,8 40,7 Aide extérieure financ. (brut) $ E.U. par tête de la population 36.0 236.8 57.1 57.3 58,9 62,2 65,0 60,1 Aide extérieure financ. (net) $ E.U. par tête de la population 28.2 64.6 52.0 52.0 53,3 56,2 58,8 54,4 Source: DNPD, modèle MME-DNPD
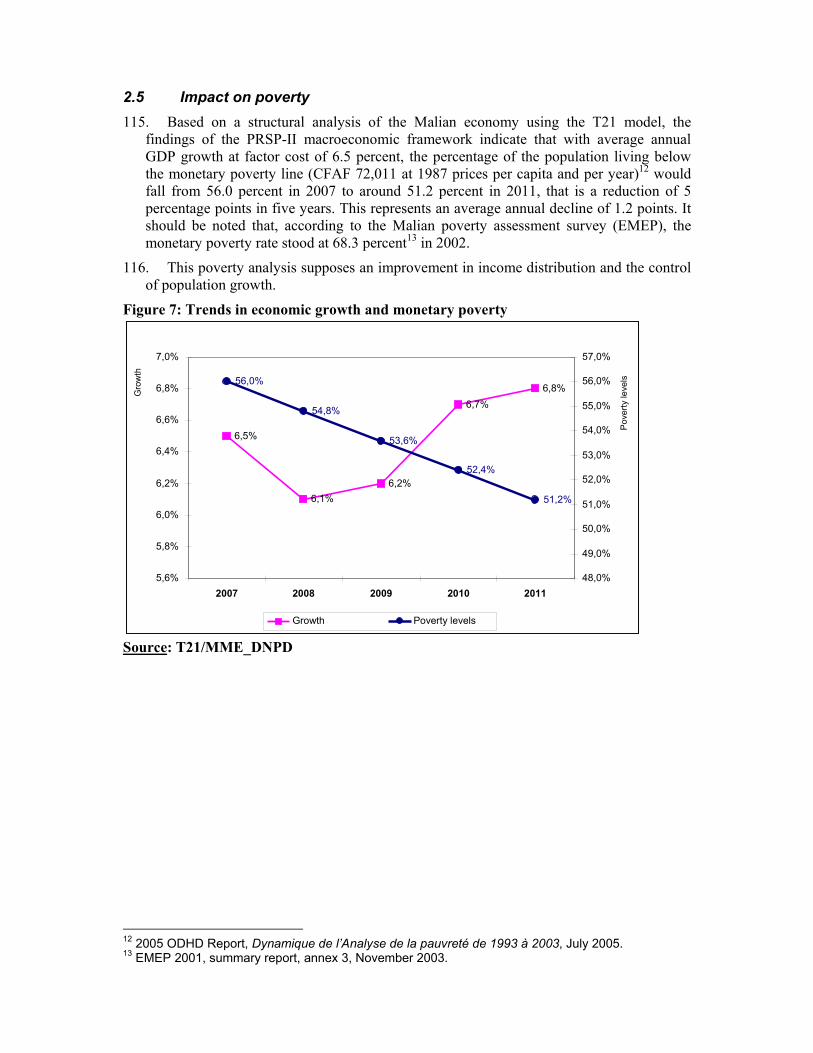
2.5 Impact on poverty 115. Based on a structural analysis of the Malian economy using the T21 model, the
findings of the PRSP-II macroeconomic framework indicate that with average annual GDP growth at factor cost of 6.5 percent, the percentage of the population living below the monetary poverty line (CFAF 72,011 at 1987 prices per capita and per year)12 would fall from 56.0 percent in 2007 to around 51.2 percent in 2011, that is a reduction of 5 percentage points in five years. This represents an average annual decline of 1.2 points. It should be noted that, according to the Malian poverty assessment survey (EMEP), the monetary poverty rate stood at 68.3 percent13 in 2002.
116. This poverty analysis supposes an improvement in income distribution and the control of population growth.
Figure 7: Trends in economic growth and monetary poverty
Source: T21/MME_DNPD
12 2005 ODHD Report, Dynamique de l’Analyse de la pauvreté de 1993 à 2003, July 2005. 13 EMEP 2001, summary report, annex 3, November 2003.
6,5%
6,1%6,2%
6,7%6,8%
56,0%
54,8%
53,6%
52,4%
51,2%
5,6%
5,8%
6,0%
6,2%
6,4%
6,6%
6,8%
7,0%
2007 2008 2009 2010 2011
Gro
wth
48,0% 49,0%
50,0% 51,0%
52,0% 53,0%
54,0% 55,0%
56,0% 57,0%
Pov
erty
leve
ls
Growth Poverty levels

CONCLUSIONS 117. The macroeconomic framework of the PRSP was produced at a time when the
department in charge of planning and development was updating its working tools, particularly those used for macroeconomic modeling and forecasting. The Forecasting and Modeling Committee was set up for that purpose and the planning exercise was entrusted to it.
118. Assumptions regarding the international environment contained in the framework, related to commodity prices, global inflation and exchange rates, were based on IMF projections.
119. In addition, specific assumptions were made for the promising sectors of the national economy, in particular, rice, cotton, agrofood, textiles, livestock farming, gold, water and electricity, BTP, and taxation.
120. On the basis of these assumptions, two scenarios, taking account of the country’s actual economic potential, were produced. A basic (trend) scenario that forecasts economic development based on existing policies and an ambitious scenario (called the PRSP-II scenario) that makes assumptions of strong growth in the promising sectors of the economy and of major efforts to strengthen government revenues.
121. Projections were made over the 2007-2011 period. The results of the exercise show the economy growing by 5 percent on average over the period, a tax ratio of 15.7 percent on average and a financing gap of CFAF 27 billion a year (4.4 percent of fiscal revenue) for the basic scenario. Regarding the ambitious scenario, these indicators project economic growth of 7.0 percent and a tax ratio of 17 percent as of 2008. The annual financing gap would be around US$191 million if only 75 percent of external aid needs were to be met.
122. The results of the ambitious exercise show a marked improvement in the tax ratio, bringing Mali into compliance with community criteria for government finance, in particular the 17 percent tax ratio, from 2008. In order to achieve the latter minimum community objective and fulfill the assumptions of increased investment, the government will need to make even greater efforts to strengthen tax revenue collection.
123. Analysis of the relationship between economic growth and poverty using the T21 model shows that with the current structure of the Malian economy, average GDP growth of 6.5 percent at factor cost over five years will contribute to lowering the monetary poverty rate by 5 percentage points by 2011, that is, an annual reduction of 1.2 percent.

3. OUTPUT TABLES (MME_DNPD) Table 10: Projection assumptions for the basic scenario
Hypothèses générales Average estim prév prév prév prév prév Average2002-2005 2006 2007 2008 2009 2010 2011 2007-2011
Taux d'inflation mondiale (mesuré par le MUV) 3,5% 1,6% 1,2% 1,2% 1,2% 1,2% 1,2% 1,2% Prix Coton (Cents/lb) 0,0 57,0 58,5 60,5 63,0 63,0 63,0 61,6 Prix Or ($/once) 0,0 618,0 670,0 710,0 750,0 770,0 775,0 735,0 Prix Petrole ($/baril) 0,0 66,5 69,8 68,5 67,5 66,8 66,0 67,7 Ratio US $ / Euro 1,14106 1,25600 1,28635 1,29339 1,29895 1,30446 1,30971 1,29857 Tx de change FCFA/US $ (moyenne de période) 582,2 522,3 509,9 507,2 505,0 502,9 500,8 505,2 US $/FCFA (Variation) -7,7% -0,8% -2,4% -0,5% -0,4% -0,4% -0,4% -0,8%Tx de change FCFA/EURO 656,0 656,0 656,0 656,0 656,0 656,0 656,0 656,0 Hypothèses secteur réel Average estim prév prév prév prév prév Average
2002-2005 2006 2007 2008 2009 2010 2011 2007-2011 TC réel PIB Agriculture vivrière 8,7% 8,3% 3,8% 6,0% 6,0% 6,0% 6,0% 5,6% TC réel PIB branche consolidé du riz 2,7% 7,3% 7,3% 7,0% 7,0% 7,0% 7,0% 7,1% TC réel PIB Agriculture industrielle hors coton 14,3% 2,1% 6,3% 6,3% 6,3% 6,3% 6,3% 6,3% TC réel PIB branche consolidé coton 1,1% -0,4% 0,0% 0,0% 0,0% 0,0% 0,0% 0,0% TC réel PIB Elevage 4,1% 2,5% 3,0% 3,0% 3,0% 3,0% 3,0% 3,0% TC réel PIB Pêche 2,2% 3,8% 4,5% 4,5% 4,5% 4,5% 4,5% 4,5% TC réel PIB Produits de la forêt 2,9% 3,8% 4,2% 4,2% 4,2% 4,2% 4,2% 4,2% TC réel PIB Produits de l'extration 2,0% 10,6% 0,7% -10,5% 0,7% -4,8% -2,7% -3,3%TC réel PIB Agroalimentaires 9,4% 0,6% 8,0% 8,0% 8,0% 8,0% 8,0% 8,0% TC réel PIB Industries textiles 9,5% 0,2% 2,0% 2,0% 2,0% 2,0% 2,0% 2,0% TC réel PIB Autres branches manufacturières 9,5% 0,2% 9,7% 9,7% 9,7% 9,7% 9,7% 9,7% TC réel PIB Electricité eau 12,0% 8,3% 10,2% 10,2% 10,2% 10,2% 10,2% 10,2% TC réel PIB Batiments, Travaux publics 5,2% 5,7% 7,5% 5,8% 7,9% 7,5% 8,9% 7,5% FBCF publique en % du PIB coût d.fact. (prix const.) 7,7% 8,0% 9,0% 9,5% 10,0% 10,5% 10,7% 9,9% FBCF privée en % du PIB coût d.fact. (prix const.) 10,4% 10,0% 12,0% 12,0% 12,0% 12,0% 12,5% 12,1% Hypothèses Finances Publiques Average estim prév prév prév prév prév Average
2002-2005 2006 2007 2008 2009 2010 2011 2007-2011 Ratio TVA intérieure / PIB Sect. moderne 5,9% 7,6% 8,0% 8,0% 8,5% 9,5% 10,3% 8,9% Ratio Autres droits et taxes / PIB Sect. moderne 7,0% 8,1% 8,0% 8,2% 8,4% 8,8% 9,2% 8,5% Mesures supplémentaires (mrd. FCFA) 0,0 0,0 0,0 70,0 56,8 15,0 0,0 28,4 Recettes non fiscales par rapport au PIB Sect.mod. 2,9% 2,5% 3,0% 3,2% 3,4% 3,6% 3,8% 3,4% Recettes fonds spéc. et budgets annexes /PIB Sect. mod. 4,3% 3,9% 4,0% 4,2% 4,4% 4,5% 4,6% 4,3% Ratio Salaires/Recettes totales 26,1% 27,6% 27,6% 27,7% 27,4% 28,1% 28,4% 27,8% Ratio Matériel/Recettes totales 9,4% 10,7% 11,2% 11,9% 11,9% 12,3% 12,8% 12,0% Ratio Communication - énergie/Recettes tot. 5,4% 6,0% 5,5% 5,8% 5,9% 6,1% 6,3% 5,9% Ratio Déplacem., entret. et carburants/Rec. tot. 5,3% 5,5% 5,8% 5,8% 5,7% 5,7% 5,7% 5,7% Ratio Bourses/Recettes totales 1,3% 1,0% 1,0% 0,9% 0,8% 0,8% 0,7% 0,8% Ratio Autres transferts et subventions/Rec.tot. 9,0% 10,8% 11,4% 11,2% 10,9% 10,7% 10,6% 11,0% Intérêts sur dette extérieure 16,8 17,5 11,8 10,0 9,8 9,4 8,7 9,9 Remboursements sur dette extérieure 39,0 1076,1 34,2 34,4 36,1 37,9 41,5 36,8 Hypothèses secteur extérieur Average estim prév prév prév prév prév Average
2002-2005 2006 2007 2008 2009 2010 2011 2007-2011 TC Importations des textiles (aux prix constants) -12,8% 11,4% 2,2% 2,2% 2,2% 2,2% 2,2% 2,2% TC Autres Importations (aux prix constants) 2,5% 0,2% 0,5% 0,5% 0,5% 0,5% 0,5% 0,5% TC réel Exportation Coton fibre 19,8% -5,3% -0,4% 0,0% 0,0% 0,0% 0,0% -0,1%TC réel Exportation Elevage -14,8% -14,6% 6,7% 6,7% 6,7% 6,7% 6,7% 6,7% TC réel Exportations Or 4,8% 8,1% 0,7% -10,5% 0,7% -4,8% -2,7% -3,3%TC réel Autres exportations -1,8% -7,4% 20,5% 21,0% 21,0% 21,0% 21,0% 20,9% Ratio Export. Services non-facteurs/Exportations 23,0% 20,7% 23,0% 24,0% 25,0% 25,0% 25,0% 24,4% Réserves de dev. nettes en mois d'importation caf 5,5 5,8 5,7 5,7 5,6 5,5 5,4 5,6 Réserves de dev. brutes en mois d'importation caf 8,3 8,0 7,8 7,7 7,5 7,3 7,1 7,5 Hypothèses aide extérieure Average estim prév prév prév prév prév Average
2002-2005 2006 2007 2008 2009 2010 2011 2007-2011 Ratio Dons en capital liés aux projets / Dépenses publ. totales 19,5% 41,3% 19,6% 20,6% 20,9% 21,1% 21,2% 20,7% Ratio Dons budgétaires globaux / Dép.pbl.tot. 10,6% 7,9% 5,2% 5,0% 4,8% 4,5% 4,2% 4,7% Ratio Appui budgétaire sectoriel / Dép.pbl.tot. 0,0% 10,4% 10,4% 7,1% 6,0% 6,1% 6,1% 7,2% Ratio Tirages emprunts extérieur (budgétaire) / Dép.pbl.tot. 6,1% 10,7% 6,3% 6,0% 5,7% 5,3% 4,9% 5,7% Ratio Tirages emprunts extérieurs (prêts projets) / Dép.pbl.tot. 22,5% 24,5% 32,2% 33,4% 34,2% 34,9% 35,5% 34,0% Source: DNPD, modèle MME-DNPD
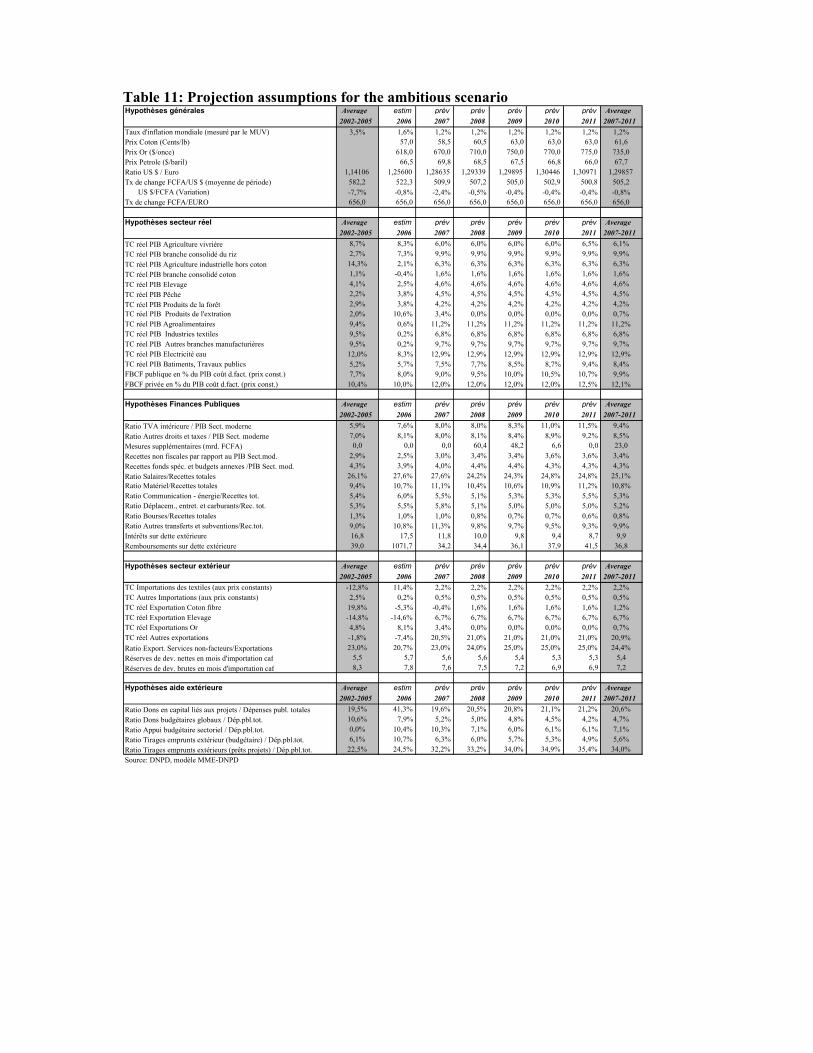
Table 11: Projection assumptions for the ambitious scenario
Hypothèses générales Average estim prév prév prév prév prév Average 2002-2005 2006 2007 2008 2009 2010 2011 2007-2011
Taux d'inflation mondiale (mesuré par le MUV) 3,5% 1,6% 1,2% 1,2% 1,2% 1,2% 1,2% 1,2% Prix Coton (Cents/lb) 57,0 58,5 60,5 63,0 63,0 63,0 61,6Prix Or ($/once) 618,0 670,0 710,0 750,0 770,0 775,0 735,0 Prix Petrole ($/baril) 66,5 69,8 68,5 67,5 66,8 66,0 67,7Ratio US $ / Euro 1,14106 1,25600 1,28635 1,29339 1,29895 1,30446 1,30971 1,29857Tx de change FCFA/US $ (moyenne de période) 582,2 522,3 509,9 507,2 505,0 502,9 500,8 505,2 US $/FCFA (Variation) -7,7% -0,8% -2,4% -0,5% -0,4% -0,4% -0,4% -0,8% Tx de change FCFA/EURO 656,0 656,0 656,0 656,0 656,0 656,0 656,0 656,0 Hypothèses secteur réel Average estim prév prév prév prév prév Average
2002-2005 2006 2007 2008 2009 2010 2011 2007-2011 TC réel PIB Agriculture vivrière 8,7% 8,3% 6,0% 6,0% 6,0% 6,0% 6,5% 6,1% TC réel PIB branche consolidé du riz 2,7% 7,3% 9,9% 9,9% 9,9% 9,9% 9,9% 9,9% TC réel PIB Agriculture industrielle hors coton 14,3% 2,1% 6,3% 6,3% 6,3% 6,3% 6,3% 6,3% TC réel PIB branche consolidé coton 1,1% -0,4% 1,6% 1,6% 1,6% 1,6% 1,6% 1,6% TC réel PIB Elevage 4,1% 2,5% 4,6% 4,6% 4,6% 4,6% 4,6% 4,6% TC réel PIB Pêche 2,2% 3,8% 4,5% 4,5% 4,5% 4,5% 4,5% 4,5% TC réel PIB Produits de la forêt 2,9% 3,8% 4,2% 4,2% 4,2% 4,2% 4,2% 4,2% TC réel PIB Produits de l'extration 2,0% 10,6% 3,4% 0,0% 0,0% 0,0% 0,0% 0,7% TC réel PIB Agroalimentaires 9,4% 0,6% 11,2% 11,2% 11,2% 11,2% 11,2% 11,2% TC réel PIB Industries textiles 9,5% 0,2% 6,8% 6,8% 6,8% 6,8% 6,8% 6,8% TC réel PIB Autres branches manufacturières 9,5% 0,2% 9,7% 9,7% 9,7% 9,7% 9,7% 9,7% TC réel PIB Electricité eau 12,0% 8,3% 12,9% 12,9% 12,9% 12,9% 12,9% 12,9% TC réel PIB Batiments, Travaux publics 5,2% 5,7% 7,5% 7,7% 8,5% 8,7% 9,4% 8,4% FBCF publique en % du PIB coût d.fact. (prix const.) 7,7% 8,0% 9,0% 9,5% 10,0% 10,5% 10,7% 9,9% FBCF privée en % du PIB coût d.fact. (prix const.) 10,4% 10,0% 12,0% 12,0% 12,0% 12,0% 12,5% 12,1% Hypothèses Finances Publiques Average estim prév prév prév prév prév Average
2002-2005 2006 2007 2008 2009 2010 2011 2007-2011 Ratio TVA intérieure / PIB Sect. moderne 5,9% 7,6% 8,0% 8,0% 8,3% 11,0% 11,5% 9,4% Ratio Autres droits et taxes / PIB Sect. moderne 7,0% 8,1% 8,0% 8,1% 8,4% 8,9% 9,2% 8,5% Mesures supplémentaires (mrd. FCFA) 0,0 0,0 0,0 60,4 48,2 6,6 0,0 23,0Recettes non fiscales par rapport au PIB Sect.mod. 2,9% 2,5% 3,0% 3,4% 3,4% 3,6% 3,6% 3,4% Recettes fonds spéc. et budgets annexes /PIB Sect. mod. 4,3% 3,9% 4,0% 4,4% 4,4% 4,3% 4,3% 4,3% Ratio Salaires/Recettes totales 26,1% 27,6% 27,6% 24,2% 24,3% 24,8% 24,8% 25,1% Ratio Matériel/Recettes totales 9,4% 10,7% 11,1% 10,4% 10,6% 10,9% 11,2% 10,8% Ratio Communication - énergie/Recettes tot. 5,4% 6,0% 5,5% 5,1% 5,3% 5,3% 5,5% 5,3% Ratio Déplacem., entret. et carburants/Rec. tot. 5,3% 5,5% 5,8% 5,1% 5,0% 5,0% 5,0% 5,2% Ratio Bourses/Recettes totales 1,3% 1,0% 1,0% 0,8% 0,7% 0,7% 0,6% 0,8% Ratio Autres transferts et subventions/Rec.tot. 9,0% 10,8% 11,3% 9,8% 9,7% 9,5% 9,3% 9,9% Intérêts sur dette extérieure 16,8 17,5 11,8 10,0 9,8 9,4 8,7 9,9 Remboursements sur dette extérieure 39,0 1071,7 34,2 34,4 36,1 37,9 41,5 36,8
Hypothèses secteur extérieur Average estim prév prév prév prév prév Average 2002-2005 2006 2007 2008 2009 2010 2011 2007-2011
TC Importations des textiles (aux prix constants) -12,8% 11,4% 2,2% 2,2% 2,2% 2,2% 2,2% 2,2% TC Autres Importations (aux prix constants) 2,5% 0,2% 0,5% 0,5% 0,5% 0,5% 0,5% 0,5% TC réel Exportation Coton fibre 19,8% -5,3% -0,4% 1,6% 1,6% 1,6% 1,6% 1,2% TC réel Exportation Elevage -14,8% -14,6% 6,7% 6,7% 6,7% 6,7% 6,7% 6,7% TC réel Exportations Or 4,8% 8,1% 3,4% 0,0% 0,0% 0,0% 0,0% 0,7% TC réel Autres exportations -1,8% -7,4% 20,5% 21,0% 21,0% 21,0% 21,0% 20,9% Ratio Export. Services non-facteurs/Exportations 23,0% 20,7% 23,0% 24,0% 25,0% 25,0% 25,0% 24,4% Réserves de dev. nettes en mois d'importation caf 5,5 5,7 5,6 5,6 5,4 5,3 5,3 5,4 Réserves de dev. brutes en mois d'importation caf 8,3 7,8 7,6 7,5 7,2 6,9 6,9 7,2 Hypothèses aide extérieure Average estim prév prév prév prév prév Average
2002-2005 2006 2007 2008 2009 2010 2011 2007-2011 Ratio Dons en capital liés aux projets / Dépenses publ. totales 19,5% 41,3% 19,6% 20,5% 20,8% 21,1% 21,2% 20,6% Ratio Dons budgétaires globaux / Dép.pbl.tot. 10,6% 7,9% 5,2% 5,0% 4,8% 4,5% 4,2% 4,7% Ratio Appui budgétaire sectoriel / Dép.pbl.tot. 0,0% 10,4% 10,3% 7,1% 6,0% 6,1% 6,1% 7,1% Ratio Tirages emprunts extérieur (budgétaire) / Dép.pbl.tot. 6,1% 10,7% 6,3% 6,0% 5,7% 5,3% 4,9% 5,6% Ratio Tirages emprunts extérieurs (prêts projets) / Dép.pbl.tot. 22,5% 24,5% 32,2% 33,2% 34,0% 34,9% 35,4% 34,0% Source: DNPD, modèle MME-DNPD

Table 12: Macroeconomic performance indicators and policy criteria
Average 2006 2007 2008 2009 2010 2011 Average Ressources et emplois des biens & services 2002-2005 Estim. Prév. Prév. Prév. Prév. Prév. 2007-2011 PIB aux prix du marché (mrd. FCFA courants) 2 550,3 3 205,8 3 419,4 3 653,0 3 895,0 4 196,9 4 493,8 3 931,6 PIB aux prix du marché (mrd. $ courants) 4,5 6,1 6,7 7,2 7,7 8,3 9,0 7,8 PIB aux prix du marché (mrd. € courants) 3,9 4,9 5,2 5,6 5,9 6,4 6,9 6,0 Part du PIB du secteur formel (en % PIBf) 39,9% 38,0% 38,0% 38,0% 39,0% 39,0% 39,0% 38,6%Taux de croissance réelle du PIB aux prix du marché 5,2% 3,6% 7,0% 6,6% 6,5% 7,8% 7,1% 7,0%Taux de croissance réelle du PIB au coût des facteurs 4,6% 4,4% 6,5% 6,1% 6,2% 6,7% 6,8% 6,5% - PIB secteur primaire 4,7% 5,0% 5,5% 5,6% 5,6% 5,7% 5,9% 5,7% - PIB secteur secondaire 5,3% 5,9% 7,1% 6,0% 6,4% 6,7% 7,0% 6,6% - PIB secteur tertiaire 4,8% 2,9% 7,2% 6,8% 6,7% 7,7% 7,5% 7,2%FBCF total (mrd. FCFA courants) 443,8 671,6 659,1 717,8 780,8 851,9 937,6 789,4 - FBCF privée (mrd. FCFA courants) 255,9 351,7 376,7 400,7 425,9 454,4 505,2 432,5 - FBCF publique (mrd. FCFA courants) 188,0 319,9 282,5 317,2 354,9 397,6 432,4 356,9 Taux d'investisssements bruts (I/PIBm) 21,4% 21,4% 19,7% 20,1% 20,5% 20,7% 21,2% 20,4%Taux d'investissement fixe (FBCF/PIBm) 17,6% 20,9% 19,3% 19,7% 20,0% 20,3% 20,9% 20,0% - FBCF publique en % du PIBm 7,4% 10,0% 8,3% 8,7% 9,1% 9,5% 9,6% 9,0% - FBCF privée en % du PIBm 10,2% 11,0% 11,0% 11,0% 10,9% 10,8% 11,2% 11,0%Coefficient marginal de capital 14,5 2,0 3,2 2,9 3,0 2,6 2,9 2,9 Taux d'épargne intérieure (en % PIBm) 15,2% 15,9% 13,9% 14,4% 15,0% 14,5% 14,1% 14,4%Taux d'épargne extérieure (= - balance des ressources BP/PIBm) 6,2% 5,5% 5,8% 5,7% 5,4% 6,1% 7,1% 6,0%Taux d'épargne nationale brute (en % PIBm) 14,8% 17,1% 15,1% 15,2% 15,7% 15,3% 14,8% 15,2%Taux de consommation (en % PIBm) 84,8% 84,1% 86,1% 85,6% 85,0% 85,5% 85,9% 85,6% - Taux de consommation privée 73,4% 71,2% 73,4% 73,5% 73,0% 73,4% 73,7% 73,4% - Taux de consommation publique 11,4% 12,9% 12,7% 12,1% 12,0% 12,0% 12,2% 12,2%Produit national brut par tête en FCFA courants 225 096 269 324 279 650 289 717 300 315 315 076 328 400 302 632 Produit national brut par tête en FCFA constants (1987) 112 020 119 061 123 426 127 589 132 145 138 647 144 573 133 276 Taux de croissance réel du Produit national brut par tête 2,6% 2,5% 3,7% 3,4% 3,6% 4,9% 4,3% 4,0%Produit national brut par tête en $ E.U. 395 516 548 571 595 627 656 599 Balance des paiements Average 2006 2007 2008 2009 2010 2011 Average 2002-2005 Estim. Prév. Prév. Prév. Prév. Prév. 2007-2011 Taux d'importation (en % du PIBm), prix cour. 33,7% 32,4% 33,6% 33,6% 33,7% 33,5% 33,5% 33,6%Taux d'exportation (en % du PIBm), prix cour. 27,5% 26,9% 27,8% 28,0% 28,2% 27,3% 26,4% 27,5%Déficit commercial (fob) en % du PIBm -0,3% -1,1% -1,1% -1,1% -1,1% -1,7% -2,5% -1,5% Balance des ressources (X-Mcaf) en % du PIBm -6,2% -5,5% -5,8% -5,7% -5,4% -6,1% -7,1% -6,0% Compte courant (hors transf. off.) en % du PIBm -8,6% -7,4% -7,3% -7,0% -6,7% -7,3% -8,2% -7,3% Compte courant (y compris transf. off.) en % du PIBm -6,6% -4,3% -4,6% -4,9% -4,7% -5,4% -6,4% -5,2% Réserves nettes en mois d'importations caf 5,5 5,7 5,6 5,6 5,4 5,3 5,3 5,4 Réserves brutes en mois d'importations caf 8,3 7,8 7,6 7,5 7,2 6,9 6,9 7,2 Ratio du service de la dette en % des exportations B&SNF 8,1% 125,9% 4,9% 4,4% 4,2% 4,2% 4,3% 4,4%
Finances publiques Average 2006 2007 2008 2009 2010 2011 Average 2002-2005 Estim. Prév. Prév. Prév. Prév. Prév. 2007-2011 Taux de pression fiscale (= Recettes fiscales / PIB m) 14,6% 14,7% 14,9% 17,0% 17,0% 17,0% 17,2% 16,6%Taux de fiscalité (recettes courantes, hors dons, en % du PIB) 17,2% 16,8% 17,0% 19,7% 19,7% 19,7% 19,9% 19,2%Taux de fiscalité (recettes courantes en % du PIB sect.formel) 47,7% 49,0% 49,5% 57,5% 56,3% 56,9% 57,7% 55,6%Total des dépenses et prêts nets, en % du PIB 23,8% 27,0% 27,3% 27,0% 26,9% 26,9% 27,1% 27,0%Solde opérations courantes (épargne publ. nat.) en % du PIB 7,3% 40,5% 8,1% 10,6% 10,5% 10,6% 10,7% 10,1%Solde opérations courantes (épargne propre) en % du PIB 3,9% 3,5% 3,6% 6,4% 6,5% 6,5% 6,6% 5,9%Solde primaire (=épargne publ. propre hors intérêts) en % du PIBm 4,6% 4,2% 4,0% 6,7% 6,8% 6,8% 6,9% 6,2%Solde budgétaire primaire (FMI), en % du PIB 1,4% 0,6% 0,2% 2,9% 2,9% 3,0% 3,1% 2,4%Solde budgétaire primaire (UEMOA), en % du PIB 0,2% -0,6% -1,3% 1,3% 1,4% 1,5% 1,6% 0,9%Solde global (base engagements), hors dons, en % du PIB -6,7% -10,2% -10,2% -7,3% -7,2% -7,1% -7,1% -7,8% Solde global (base engagements), dons compris, en % du PIB -2,6% 27,3% -5,3% -2,8% -2,9% -2,8% -2,9% -3,4% Solde global (base caisse) , en % du PIB -2,5% 27,3% -5,3% -2,8% -2,9% -2,8% -2,9% -3,4% Situation monétaire Average 2006 2007 2008 2009 2010 2011 Average
2002-2005 Estim. Prév. Prév. Prév. Prév. Prév. 2007-2011 Créances sur le trésor (taux de croissance) 35,8% 280,6% -36,1% 117,4% 62,6% 51,6% 38,2% 46,7%Créances sur l'économie (taux de croissance) 11,4% 3,2% -3,3% 17,2% 19,6% 20,5% 17,6% 14,3%Croissance de la masse monétaire (M2) 15,2% 1,5% 5,3% 5,4% 5,3% 6,2% 5,6% 5,5%Vitesse de circulation de la monnaie (PIB/M2, fin de période) 3,4 3,8 3,8 3,9 3,9 4,0 4,0 3,9 Taux de liquidité (M2/PIBm) 29,4% 26,6% 26,3% 25,9% 25,6% 25,2% 24,9% 25,6% Prix et taux de change Average 2006 2007 2008 2009 2010 2011 Average
2002-2005 Estim. Prév. Prév. Prév. Prév. Prév. 2007-2011 Inflation mondiale (MUV) 3,5% 1,6% 1,2% 1,2% 1,2% 1,2% 1,2% 1,2%TC Indice des prix à la consommation des ménages de Bamako 1,8% 2,4% 0,2% 0,5% 0,3% 0,2% 0,2% 0,3%Déflateur du PIB (taux de croissance) 1,9% 6,3% 0,2% 0,2% 0,1% 0,0% 0,0% 0,1%Termes de l'échange (1987 = 100) 69,2 73,8 78,2 81,7 85,3 86,6 86,7 83,7 Taux de change FCFA/DTS (fin de période) 787,4 756,7 738,9 734,9 731,7 728,6 725,7 732,0 Taux de change FCFA/$ E.U. (fin de période) 547,0 522,3 509,9 507,2 505,0 502,9 500,8 505,2 Taux de change FCFA/$ E.U. (moyenne de période) 582,2 522,3 509,9 507,2 505,0 502,9 500,8 505,2 Taux de change FCFA/€ (moyenne de période) 656,0 656,0 656,0 656,0 656,0 656,0 656,0 656,0 Indice du taux de change réel (IP_M/IP_PIB; + dévaluation) 126,7 125,9 123,5 122,9 122,7 122,5 122,4 122,8
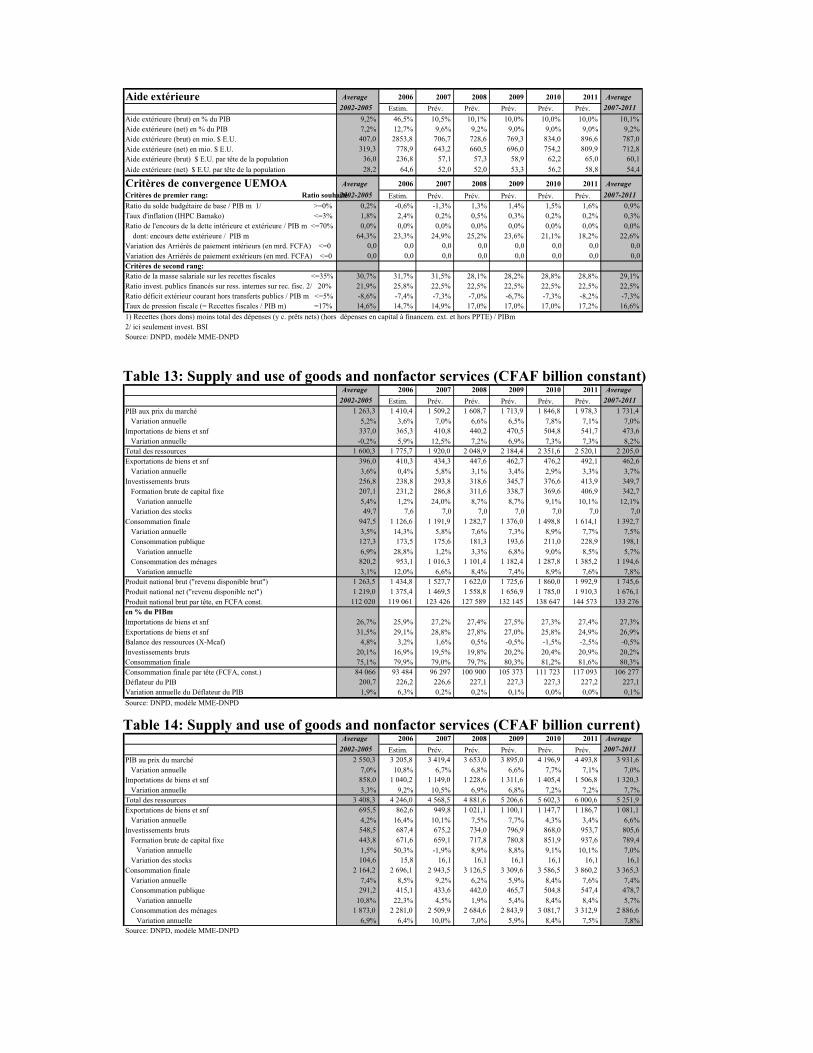
Table 13: Supply and use of goods and nonfactor services (CFAF billion constant)
Table 14: Supply and use of goods and nonfactor services (CFAF billion current)
Aide extérieure Average 2006 2007 2008 2009 2010 2011 Average2002-2005 Estim. Prév. Prév. Prév. Prév. Prév. 2007-2011
Aide extérieure (brut) en % du PIB 9,2% 46,5% 10,5% 10,1% 10,0% 10,0% 10,0% 10,1%Aide extérieure (net) en % du PIB 7,2% 12,7% 9,6% 9,2% 9,0% 9,0% 9,0% 9,2%Aide extérieure (brut) en mio. $ E.U. 407,0 2853,8 706,7 728,6 769,3 834,0 896,6 787,0 Aide extérieure (net) en mio. $ E.U. 319,3 778,9 643,2 660,5 696,0 754,2 809,9 712,8 Aide extérieure (brut) $ E.U. par tête de la population 36,0 236,8 57,1 57,3 58,9 62,2 65,0 60,1 Aide extérieure (net) $ E.U. par tête de la population 28,2 64,6 52,0 52,0 53,3 56,2 58,8 54,4 Critères de convergence UEMOA Average 2006 2007 2008 2009 2010 2011 AverageCritères de premier rang: Ratio souhaité2002-2005 Estim. Prév. Prév. Prév. Prév. Prév. 2007-2011 Ratio du solde budgétaire de base / PIB m 1/ >=0% 0,2% -0,6% -1,3% 1,3% 1,4% 1,5% 1,6% 0,9%Taux d'inflation (IHPC Bamako) <=3% 1,8% 2,4% 0,2% 0,5% 0,3% 0,2% 0,2% 0,3%Ratio de l'encours de la dette intérieure et extérieure / PIB m <=70% 0,0% 0,0% 0,0% 0,0% 0,0% 0,0% 0,0% 0,0% dont: encours dette extérieure / PIB m 64,3% 23,3% 24,9% 25,2% 23,6% 21,1% 18,2% 22,6%Variation des Arriérés de paiement intérieurs (en mrd. FCFA) <=0 0,0 0,0 0,0 0,0 0,0 0,0 0,0 0,0 Variation des Arriérés de paiement extérieurs (en mrd. FCFA) <=0 0,0 0,0 0,0 0,0 0,0 0,0 0,0 0,0 Critères de second rang: Ratio de la masse salariale sur les recettes fiscales <=35% 30,7% 31,7% 31,5% 28,1% 28,2% 28,8% 28,8% 29,1%Ratio invest. publics financés sur ress. internes sur rec. fisc. 2/ 20% 21,9% 25,8% 22,5% 22,5% 22,5% 22,5% 22,5% 22,5%Ratio déficit extérieur courant hors transferts publics / PIB m <=5% -8,6% -7,4% -7,3% -7,0% -6,7% -7,3% -8,2% -7,3% Taux de pression fiscale (= Recettes fiscales / PIB m) =17% 14,6% 14,7% 14,9% 17,0% 17,0% 17,0% 17,2% 16,6%1) Recettes (hors dons) moins total des dépenses (y c. prêts nets) (hors dépenses en capital à financem. ext. et hors PPTE) / PIBm 2/ ici seulement invest. BSI Source: DNPD, modèle MME-DNPD
Average 2006 2007 2008 2009 2010 2011 Average2002-2005 Estim. Prév. Prév. Prév. Prév. Prév. 2007-2011
PIB aux prix du marché 1 263,3 1 410,4 1 509,2 1 608,7 1 713,9 1 846,8 1 978,3 1 731,4 Variation annuelle 5,2% 3,6% 7,0% 6,6% 6,5% 7,8% 7,1% 7,0%Importations de biens et snf 337,0 365,3 410,8 440,2 470,5 504,8 541,7 473,6 Variation annuelle -0,2% 5,9% 12,5% 7,2% 6,9% 7,3% 7,3% 8,2%Total des ressources 1 600,3 1 775,7 1 920,0 2 048,9 2 184,4 2 351,6 2 520,1 2 205,0 Exportations de biens et snf 396,0 410,3 434,3 447,6 462,7 476,2 492,1 462,6 Variation annuelle 3,6% 0,4% 5,8% 3,1% 3,4% 2,9% 3,3% 3,7%Investissements bruts 256,8 238,8 293,8 318,6 345,7 376,6 413,9 349,7 Formation brute de capital fixe 207,1 231,2 286,8 311,6 338,7 369,6 406,9 342,7 Variation annuelle 5,4% 1,2% 24,0% 8,7% 8,7% 9,1% 10,1% 12,1% Variation des stocks 49,7 7,6 7,0 7,0 7,0 7,0 7,0 7,0 Consommation finale 947,5 1 126,6 1 191,9 1 282,7 1 376,0 1 498,8 1 614,1 1 392,7 Variation annuelle 3,5% 14,3% 5,8% 7,6% 7,3% 8,9% 7,7% 7,5% Consommation publique 127,3 173,5 175,6 181,3 193,6 211,0 228,9 198,1 Variation annuelle 6,9% 28,8% 1,2% 3,3% 6,8% 9,0% 8,5% 5,7% Consommation des ménages 820,2 953,1 1 016,3 1 101,4 1 182,4 1 287,8 1 385,2 1 194,6 Variation annuelle 3,1% 12,0% 6,6% 8,4% 7,4% 8,9% 7,6% 7,8%Produit national brut ("revenu disponible brut") 1 263,5 1 434,8 1 527,7 1 622,0 1 725,6 1 860,0 1 992,9 1 745,6 Produit national net ("revenu disponible net") 1 219,0 1 375,4 1 469,5 1 558,8 1 656,9 1 785,0 1 910,3 1 676,1 Produit national brut par tête, en FCFA const. 112 020 119 061 123 426 127 589 132 145 138 647 144 573 133 276 en % du PIBm
Importations de biens et snf 26,7% 25,9% 27,2% 27,4% 27,5% 27,3% 27,4% 27,3%Exportations de biens et snf 31,5% 29,1% 28,8% 27,8% 27,0% 25,8% 24,9% 26,9%Balance des ressources (X-Mcaf) 4,8% 3,2% 1,6% 0,5% -0,5% -1,5% -2,5% -0,5% Investissements bruts 20,1% 16,9% 19,5% 19,8% 20,2% 20,4% 20,9% 20,2%Consommation finale 75,1% 79,9% 79,0% 79,7% 80,3% 81,2% 81,6% 80,3%Consommation finale par tête (FCFA, const.) 84 066 93 484 96 297 100 900 105 373 111 723 117 093 106 277 Déflateur du PIB 200,7 226,2 226,6 227,1 227,3 227,3 227,2 227,1 Variation annuelle du Déflateur du PIB 1,9% 6,3% 0,2% 0,2% 0,1% 0,0% 0,0% 0,1%Source: DNPD, modèle MME-DNPD
Average 2006 2007 2008 2009 2010 2011 Average2002-2005 Estim. Prév. Prév. Prév. Prév. Prév. 2007-2011
PIB au prix du marché 2 550,3 3 205,8 3 419,4 3 653,0 3 895,0 4 196,9 4 493,8 3 931,6 Variation annuelle 7,0% 10,8% 6,7% 6,8% 6,6% 7,7% 7,1% 7,0%Importations de biens et snf 858,0 1 040,2 1 149,0 1 228,6 1 311,6 1 405,4 1 506,8 1 320,3 Variation annuelle 3,3% 9,2% 10,5% 6,9% 6,8% 7,2% 7,2% 7,7%Total des ressources 3 408,3 4 246,0 4 568,5 4 881,6 5 206,6 5 602,3 6 000,6 5 251,9 Exportations de biens et snf 695,5 862,6 949,8 1 021,1 1 100,1 1 147,7 1 186,7 1 081,1 Variation annuelle 4,2% 16,4% 10,1% 7,5% 7,7% 4,3% 3,4% 6,6%Investissements bruts 548,5 687,4 675,2 734,0 796,9 868,0 953,7 805,6 Formation brute de capital fixe 443,8 671,6 659,1 717,8 780,8 851,9 937,6 789,4 Variation annuelle 1,5% 50,3% -1,9% 8,9% 8,8% 9,1% 10,1% 7,0% Variation des stocks 104,6 15,8 16,1 16,1 16,1 16,1 16,1 16,1 Consommation finale 2 164,2 2 696,1 2 943,5 3 126,5 3 309,6 3 586,5 3 860,2 3 365,3 Variation annuelle 7,4% 8,5% 9,2% 6,2% 5,9% 8,4% 7,6% 7,4% Consommation publique 291,2 415,1 433,6 442,0 465,7 504,8 547,4 478,7 Variation annuelle 10,8% 22,3% 4,5% 1,9% 5,4% 8,4% 8,4% 5,7% Consommation des ménages 1 873,0 2 281,0 2 509,9 2 684,6 2 843,9 3 081,7 3 312,9 2 886,6 Variation annuelle 6,9% 6,4% 10,0% 7,0% 5,9% 8,4% 7,5% 7,8%Source: DNPD, modèle MME-DNPD

Table 15: Savings and investment (CFAF billion current)
Average 2006 2007 2008 2009 2010 2011 Average2002-2005 Estim. Prév. Prév. Prév. Prév. Prév. 2007-2011
INVESTISSEMENTS bruts 548,5 687,4 675,2 734,0 796,9 868,0 953,7 805,6 Formation brute de capital fixe 443,8 671,6 659,1 717,8 780,8 851,9 937,6 789,4 publique 1) 188,0 319,9 282,5 317,2 354,9 397,6 432,4 356,9 privée 255,9 351,7 376,7 400,7 425,9 454,4 505,2 432,5 Variation des stocks 104,6 15,8 16,1 16,1 16,1 16,1 16,1 16,1 Total emplois (invest.) 548,5 687,4 675,2 734,0 796,9 868,0 953,7 805,6 EPARGNE INTERIEURE BRUTE 386,1 509,7 476,0 526,5 585,5 610,3 633,6 566,4 Epargne publique 59,9 70,5 75,9 178,8 193,0 210,9 230,9 177,9 Epargne privée 326,2 439,2 400,1 347,6 392,4 399,5 402,6 388,4 EPARGNE EXTERIEURE (= - balance des ressources BP) 162,4 177,6 199,2 207,5 211,5 257,7 320,1 239,2 Total ressources (= Epargne intérieure et extérieure) 548,5 687,4 675,2 734,0 796,9 868,0 953,7 805,6 Pour mémoire:
Service facteurs (nets) -118,4 -111,2 -99,3 -98,0 -98,5 -98,8 -98,8 -98,7 Epargne nationale brute 378,1 549,5 517,9 556,5 612,1 640,3 666,6 598,7 publique 96,5 153,5 149,9 239,3 250,0 270,9 293,6 240,7 privée 281,6 396,0 368,0 317,2 362,1 369,4 373,1 357,9 Taux d'investissement, y compris var. stocks (Inv/PIB) 21,4% 21,4% 19,7% 20,1% 20,5% 20,7% 21,2% 20,4%Taux d'épargne intérieure (Ep/PIB) 15,2% 15,9% 13,9% 14,4% 15,0% 14,5% 14,1% 14,4%Taux d'épargne extérieure 2) 6,2% 5,5% 5,8% 5,7% 5,4% 6,1% 7,1% 6,0% Taux d'épargne nationale (Ep nat/PIB) 14,8% 17,1% 15,1% 15,2% 15,7% 15,3% 14,8% 15,2%Taux d'épargne nationale publique 3,7% 4,8% 4,4% 6,6% 6,4% 6,5% 6,5% 6,1% Taux d'épargne nationale privée 11,1% 12,4% 10,8% 8,7% 9,3% 8,8% 8,3% 9,2% Epargne intér. en % des investissem. 72,3% 74,2% 70,5% 71,7% 73,5% 70,3% 66,4% 70,5%Epargne extér. en % des investissem. 27,7% 25,8% 29,5% 28,3% 26,5% 29,7% 33,6% 29,5%1) y compris la FBCF des entreprises publiques 2) Solde des ressources / PIB Source: DNPD, modèle MME-DNPD

Table 16: Consolidated government finance budget and its financing (TOFE) (CFAF billion current)
Average 2006 2007 2008 2009 2010 2011 Average
2002-2005
CSLP CSLP CSLP CSLP CSLP 2007-2011 Total des recettes et dons 542,6 1 740,0 749,4 881,4 935,6 1 008,0 1 088,3 932,6 Recettes totales 438,5 540,0 582,4 718,6 768,6 828,5 896,3 758,9 Recettes budgétaires 398,7 497,5 535,4 663,5 708,5 765,9 829,5 700,6 Recettes fiscales 373,7 469,9 509,5 621,0 662,2 713,5 773,6 655,9 Impôts directs 72,4 89,9 106,2 112,3 122,5 131,1 141,3 122,7 Impôts indirects 301,3 380,0 403,3 448,4 491,5 575,8 632,3 510,3 TVA 156,2 216,2 240,0 256,2 280,0 341,1 375,4 298,5 TVA intérieure 54,9 84,0 93,0 100,1 113,3 160,1 178,7 129,0 TVA sur importations 101,3 132,2 147,0 156,2 166,7 181,0 196,7 169,5 Taxe intérieure sur produits pétroliers 31,1 25,0 27,0 28,7 30,5 33,0 35,7 31,0 Taxe sur les importations 61,5 71,9 75,0 79,2 84,5 91,8 99,7 86,0 Autres droits et taxes 64,2 88,9 87,3 101,3 114,6 129,6 142,9 115,1 Remboursement de taxes exonérées -11,3 -15,0 -16,0 -17,0 -18,1 -19,7 -21,4 -18,5 Mesures supplémentaires 0,0 0,0 0,0 60,4 48,2 6,6 0,0 23,0 Recettes non fiscales 25,1 27,6 25,9 42,5 46,4 52,4 55,9 44,6 Recettes fonds spéc. et budgets annexes 39,8 42,5 47,0 55,0 60,0 62,6 66,8 58,3 Dons 104,1 1 200,0 167,0 162,9 167,1 179,5 191,9 173,7 Dons pour projets 67,5 81,3 93,0 102,4 110,1 119,5 129,3 110,9 Dons budgétaires 36,6 35,8 24,8 25,0 25,2 25,3 25,5 25,2 Appui budgétaire sectoriel 47,2 49,2 35,5 31,8 34,7 37,1 37,7 Restructuration dette IADM 1 035,7 0,0 0,0 0,0 0,0 0,0 0,0 Dépenses et prêts nets 608,5 865,6 932,3 984,5 1 048,0 1 127,6 1 216,7 1 061,8 Dépenses budgétaires 567,5 828,7 890,9 933,5 992,4 1 069,3 1 153,9 1 008,0 Dépenses courantes 338,8 427,0 459,5 484,7 515,5 555,0 598,6 522,7 Salaires 114,8 149,0 160,5 174,2 186,4 205,4 222,6 189,8 Fonctionnaires 105,5 129,9 138,9 150,1 159,8 176,3 191,1 163,2 Contractuels (HIPC) 9,4 19,1 21,6 24,1 26,6 29,1 31,5 26,6 Biens et services 123,5 161,1 181,8 189,9 204,8 221,7 244,3 208,5 Matériel 41,5 57,9 64,9 74,5 81,3 89,9 100,1 82,1 Communication - énergie 23,9 32,6 32,1 36,3 40,4 44,3 49,1 40,4 Déplacements, entretien et carburants 23,1 29,9 33,7 36,6 38,7 41,6 45,1 39,1 Elections 4,4 3,0 15,0 4,0 2,0 2,0 2,0 5,0 Autres dépenses sur biens et services 30,7 37,7 36,1 38,5 42,4 43,9 48,0 41,8 Transferts et subventions 81,4 96,8 103,7 109,0 113,0 117,1 121,6 112,9 Bourses 5,6 5,6 5,6 5,6 5,6 5,6 5,6 5,6 Filet social 9,8 10,0 10,0 10,0 10,0 10,0 10,0 10,0 Subvention eau-énergie 1,8 0,0 0,0 0,0 0,0 0,0 0,0 0,0 Subvention secteur coton 6,8 0,0 0,0 0,0 0,0 0,0 0,0 0,0 Subvention CRM 13,0 18,0 21,0 18,0 18,0 18,0 18,0 18,6 Plans sociaux 5,1 5,0 1,0 5,0 5,0 5,0 5,0 4,2 Dépenses PAGE 0,0 0,0 0,0 0,0 0,0 0,0 0,0 0,0 Autres transferts et subventions 39,4 58,2 66,1 70,4 74,4 78,5 83,0 74,5 Intérêts dus 19,0 20,1 13,5 11,6 11,3 10,8 10,1 11,5 Dette intérieure 2,3 2,6 1,7 1,6 1,5 1,4 1,4 1,5 FMI 0,5 0,5 0,0 0,0 0,0 0,0 0,0 0,0 BCEAO (avance stat. et BDM) 0,6 0,5 0,0 0,0 0,0 0,0 0,0 0,0 Autres intérieurs 1,2 1,6 1,7 1,6 1,5 1,4 1,4 1,5 Dette extérieure 16,8 17,5 11,8 10,0 9,8 9,4 8,7 9,9 Dépenses en capital 228,7 401,7 431,4 448,8 476,9 514,3 555,3 485,3 Financement extérieur 146,6 280,7 295,1 303,9 322,1 351,9 382,4 331,1 Emprunts 79,1 152,2 152,9 166,0 180,2 197,7 216,0 182,6 Dons globaux 67,5 81,3 93,0 102,4 110,1 119,5 129,3 110,9 Appui budgétaire sectoriel 0,0 47,2 49,2 35,5 31,8 34,7 37,1 37,7 Financement intérieur 1) 82,1 121,0 136,3 144,9 154,8 162,4 172,9 154,3 Dépenses fds.spéc. et budgets annexes 39,8 42,5 47,0 55,0 60,0 62,6 66,8 58,3 Autres (extrabudgétaires et reconstruction) 0,0 0,0 0,0 0,0 0,0 0,0 0,0 0,0 Prêts nets 1,2 -5,6 -5,6 -4,0 -4,4 -4,3 -4,0 -4,5 Solde budgétaire primaire (FMI) 2) -23,4 -44,9 -54,8 37,9 42,6 52,8 62,0 28,1 Solde global (engagements, hors dons) -170,0 -325,6 -349,9 -266,0 -279,5 -299,1 -320,4 -303,0Solde global (engagements) -65,9 874,4 -182,9 -103,1 -112,4 -119,6 -128,4 -129,3Ajustement 1,8 0,0 0,0 0,0 0,0 0,0 0,0 0,0 Solde global (base caisse & hors dons) -168,3 -325,6 -349,9 -266,0 -279,5 -299,1 -320,4 -303,0Solde global (base caisse) -64,2 874,4 -182,9 -103,1 -112,4 -119,6 -128,4 -129,3

FINANCEMENT 64,2 -874,4 182,9 103,1 112,4 119,6 128,4 129,3 Financement extérieur net 89,3 -845,1 159,2 172,3 185,3 201,9 215,6 186,9 Emprunts 100,6 200,7 182,9 196,0 210,2 227,7 246,0 212,6 PASEP 0,0 0,0 0,0 0,0 0,0 0,0 0,0 0,0 BDM 0,0 0,0 0,0 0,0 0,0 0,0 0,0 0,0 Projets 79,1 152,2 152,9 166,0 180,2 197,7 216,0 182,6 Prêts budgétaires 21,4 48,5 30,0 30,0 30,0 30,0 30,0 30,0 Amortissement (-) -39,0 -1 071,7 -34,2 -34,4 -36,1 -37,9 -41,5 -36,8 Régulation dette/PPTE 27,7 25,9 10,5 10,7 11,2 12,1 11,1 11,1 Financement intérieur net -25,2 -43,1 23,7 -69,2 -72,9 -82,4 -87,2 -57,6 bancaire (net) -3,0 -34,0 36,3 -76,3 -88,3 -118,1 -132,2 -75,7 Position nette du Gouvernement -2,1 -33,4 36,3 -75,3 -87,3 -117,1 -131,2 -74,9 Avance statutaire -1,6 -2,1 -2,1 -2,1 -2,1 -2,1 -2,1 -2,1 Tirages nets -11,1 -9,0 2,0 2,0 2,0 2,0 2,0 2,0 FMI rachats 15,8 11,1 0,0 0,0 0,0 0,0 0,0 0,0 FMI achats 4,7 2,1 2,0 2,0 2,0 2,0 2,0 2,0 Autres postes (nets) 12,6 -20,3 36,4 -75,2 -87,2 -117,0 -131,1 -74,8 Concours cons./Titrisation -2,0 -2,0 0,0 0,0 0,0 0,0 0,0 0,0 Autres financements monétaires -0,9 -0,6 0,0 -1,0 -1,0 -1,0 -1,0 -0,8 Avance CMDT 0,0 0,0 0,0 0,0 0,0 0,0 0,0 0,0 Recetttes de privatisation 10,3 8,1 8,1 4,0 4,0 4,0 4,0 4,8 Autres financements -32,5 -17,2 -20,7 3,1 11,4 31,7 41,0 13,3Gap de financement Etat (+ = déficit) 0,0 13,8 0,0 0,0 0,0 0,0 0,0 0,0Pour mémoire: PIB aux prix du marché (milliards FCFA, prix courants) 2 550,3 3 205,8 3 419,4 3653,0 3895,0 4196,9 4493,8 3 931,6 Solde primaire en % du PIB 1,4% 0,6% 0,2% 2,9% 2,9% 3,0% 3,1% 2,4% Déficit (engagements, hors dons) en % PIB -6,7% -10,2% -10,2% -7,3% -7,2% -7,1% -7,1% -7,8% Déficit (caisse) en % PIB -2,5% 27,3% -5,3% -2,8% -2,9% -2,8% -2,9% -3,4% Solde opérations courantes hors dons en % PIB 3,9% 3,5% 3,6% 6,4% 6,5% 6,5% 6,6% 5,9%1) secteur bancaire et secteur privé2) Recettes (hors dons) moins total des dépenses (y c. prêts nets) (hors dépenses en capital à financement extérieur)Source: DNPD, modèle MME-DNPD Table 17: Structure of government expenditure
Structure des dépenses (% des dépenses totales) Average 2006 2007 2008 2009 2010 2011 Average2002-2005 2007-2011
Dépenses courantes 55,9% 49,3% 49,3% 49,2% 49,2% 49,2% 49,2% 49,2% Dépenses en capital 37,6% 46,4% 46,3% 45,6% 45,5% 45,6% 45,6% 45,7% Autres dépenses et prêts nets 6,6% 4,3% 4,4% 5,2% 5,3% 5,2% 5,2% 5,1% Ajustements 0,4% 0,0% 0,0% 0,0% 0,0% 0,0% 0,0% 0,0% Total des dépenses 100,4% 100,0% 100,0% 100,0% 100,0% 100,0% 100,0% 100,0%Structure de financement (% des dépenses totales)
Recettes budgétaires, etc. 72,1% 62,4% 62,5% 73,0% 73,3% 73,5% 73,7% 71,2% Dons 17,2% 138,6% 17,9% 16,5% 15,9% 15,9% 15,8% 16,4% Financement extérieur (tirages sur emprunts nets) (hors PPTE) 10,2% -100,6% 15,9% 16,4% 16,6% 16,8% 16,8% 16,5% Régulation de la dette/PPTE 4,6% 3,0% 1,1% 1,1% 1,1% 1,1% 0,9% 1,1% Financement intérieur -4,5% -5,0% 2,5% -7,0% -7,0% -7,3% -7,2% -5,2% Ajustements 0,4% 0,0% 0,0% 0,0% 0,0% 0,0% 0,0% 0,0% Financement extér. exceptionn. à rechercher (gap) 0,0% 1,6% 0,0% 0,0% 0,0% 0,0% 0,0% 0,0% Total des dépenses 100,0% 100,0% 100,0% 100,0% 100,0% 100,0% 100,0% 100,0% Total financement intérieur des dépenses 67,6% 57,4% 65,0% 66,0% 66,4% 66,2% 66,5% 66,0% Total financement extérieur des dépenses 32,0% 42,6% 35,0% 34,0% 33,6% 33,8% 33,5% 34,0% Structure des dépenses (% du PIBm)
Dépenses courantes 13,3% 13,3% 13,4% 13,3% 13,2% 13,2% 13,3% 13,3% Dépenses en capital 9,0% 12,5% 12,6% 12,3% 12,2% 12,3% 12,4% 12,4% Autres dépenses et prêts nets 1,6% 1,2% 1,2% 1,4% 1,4% 1,4% 1,4% 1,4% Ajustements 0,1% 0,0% 0,0% 0,0% 0,0% 0,0% 0,0% 0,0% Total des dépenses 23,9% 27,0% 27,3% 27,0% 26,9% 26,9% 27,1% 27,0%Structure de financement (% du PIBm)
Recettes budgétaires, etc. 17,2% 16,8% 17,0% 19,7% 19,7% 19,7% 19,9% 19,2% Dons 4,1% 37,4% 4,9% 4,5% 4,3% 4,3% 4,3% 4,4% Financement extérieur (tirages sur emprunts nets) (hors PPTE) 2,4% -27,2% 4,3% 4,4% 4,5% 4,5% 4,6% 4,5% Régulation de la dette/PPTE 1,1% 0,8% 0,3% 0,3% 0,3% 0,3% 0,2% 0,3% Financement intérieur -1,0% -1,3% 0,7% -1,9% -1,9% -2,0% -1,9% -1,4% Ajustements 0,1% 0,0% 0,0% 0,0% 0,0% 0,0% 0,0% 0,0% Financement extér. exceptionn. à rechercher (gap) 0,0% 0,4% 0,0% 0,0% 0,0% 0,0% 0,0% 0,0% Total des dépenses 23,8% 27,0% 27,3% 27,0% 26,9% 26,9% 27,1% 27,0% Total financement intérieur des dépenses (% du PIBm) 16,1% 15,5% 17,7% 17,8% 17,9% 17,8% 18,0% 17,8% Total financement extérieur des dépenses (% du PIBm) 7,6% 11,5% 9,5% 9,2% 9,0% 9,1% 9,1% 9,2%
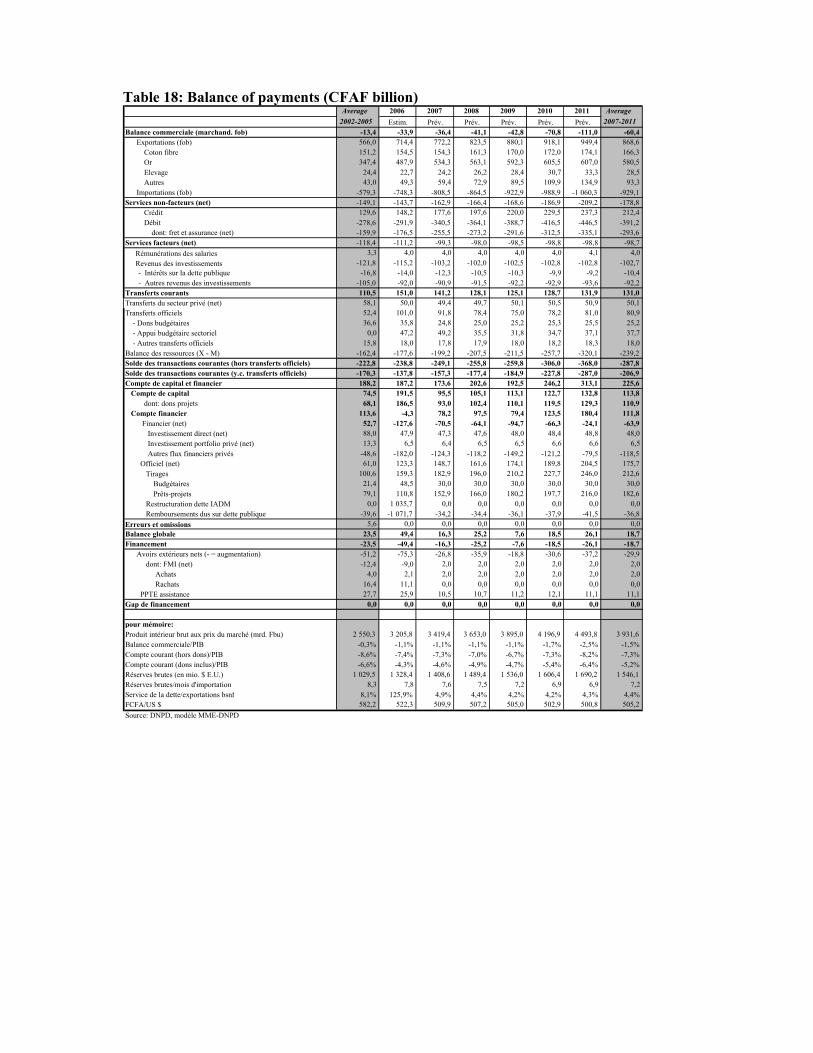
Table 18: Balance of payments (CFAF billion)
Average 2006 2007 2008 2009 2010 2011 Average2002-2005 Estim. Prév. Prév. Prév. Prév. Prév. 2007-2011
Balance commerciale (marchand. fob) -13,4 -33,9 -36,4 -41,1 -42,8 -70,8 -111,0 -60,4 Exportations (fob) 566,0 714,4 772,2 823,5 880,1 918,1 949,4 868,6 Coton fibre 151,2 154,5 154,3 161,3 170,0 172,0 174,1 166,3 Or 347,4 487,9 534,3 563,1 592,3 605,5 607,0 580,5 Elevage 24,4 22,7 24,2 26,2 28,4 30,7 33,3 28,5 Autres 43,0 49,3 59,4 72,9 89,5 109,9 134,9 93,3 Importations (fob) -579,3 -748,3 -808,5 -864,5 -922,9 -988,9 -1 060,3 -929,1Services non-facteurs (net) -149,1 -143,7 -162,9 -166,4 -168,6 -186,9 -209,2 -178,8 Crédit 129,6 148,2 177,6 197,6 220,0 229,5 237,3 212,4 Débit -278,6 -291,9 -340,5 -364,1 -388,7 -416,5 -446,5 -391,2 dont: fret et assurance (net) -159,9 -176,5 -255,5 -273,2 -291,6 -312,5 -335,1 -293,6Services facteurs (net) -118,4 -111,2 -99,3 -98,0 -98,5 -98,8 -98,8 -98,7
Rémunérations des salaries 3,3 4,0 4,0 4,0 4,0 4,0 4,1 4,0 Revenus des investissements -121,8 -115,2 -103,2 -102,0 -102,5 -102,8 -102,8 -102,7
- Intérêts sur la dette publique -16,8 -14,0 -12,3 -10,5 -10,3 -9,9 -9,2 -10,4 - Autres revenus des investissements -105,0 -92,0 -90,9 -91,5 -92,2 -92,9 -93,6 -92,2Transferts courants 110,5 151,0 141,2 128,1 125,1 128,7 131,9 131,0 Transferts du secteur privé (net) 58,1 50,0 49,4 49,7 50,1 50,5 50,9 50,1 Transferts officiels 52,4 101,0 91,8 78,4 75,0 78,2 81,0 80,9 - Dons budgétaires 36,6 35,8 24,8 25,0 25,2 25,3 25,5 25,2 - Appui budgétaire sectoriel 0,0 47,2 49,2 35,5 31,8 34,7 37,1 37,7 - Autres transferts officiels 15,8 18,0 17,8 17,9 18,0 18,2 18,3 18,0 Balance des ressources (X - M) -162,4 -177,6 -199,2 -207,5 -211,5 -257,7 -320,1 -239,2Solde des transactions courantes (hors transferts officiels) -222,8 -238,8 -249,1 -255,8 -259,8 -306,0 -368,0 -287,8Solde des transactions courantes (y.c. transferts officiels) -170,3 -137,8 -157,3 -177,4 -184,9 -227,8 -287,0 -206,9Compte de capital et financier 188,2 187,2 173,6 202,6 192,5 246,2 313,1 225,6 Compte de capital 74,5 191,5 95,5 105,1 113,1 122,7 132,8 113,8 dont: dons projets 68,1 186,5 93,0 102,4 110,1 119,5 129,3 110,9 Compte financier 113,6 -4,3 78,2 97,5 79,4 123,5 180,4 111,8 Financier (net) 52,7 -127,6 -70,5 -64,1 -94,7 -66,3 -24,1 -63,9 Investissement direct (net) 88,0 47,9 47,3 47,6 48,0 48,4 48,8 48,0 Investissement portfolio privé (net) 13,3 6,5 6,4 6,5 6,5 6,6 6,6 6,5 Autres flux financiers privés -48,6 -182,0 -124,3 -118,2 -149,2 -121,2 -79,5 -118,5 Officiel (net) 61,0 123,3 148,7 161,6 174,1 189,8 204,5 175,7 Tirages 100,6 159,3 182,9 196,0 210,2 227,7 246,0 212,6 Budgétaires 21,4 48,5 30,0 30,0 30,0 30,0 30,0 30,0 Prêts-projets 79,1 110,8 152,9 166,0 180,2 197,7 216,0 182,6 Restructuration dette IADM 0,0 1 035,7 0,0 0,0 0,0 0,0 0,0 0,0 Remboursements dus sur dette publique -39,6 -1 071,7 -34,2 -34,4 -36,1 -37,9 -41,5 -36,8Erreurs et omissions 5,6 0,0 0,0 0,0 0,0 0,0 0,0 0,0 Balance globale 23,5 49,4 16,3 25,2 7,6 18,5 26,1 18,7 Financement -23,5 -49,4 -16,3 -25,2 -7,6 -18,5 -26,1 -18,7 Avoirs extérieurs nets (- = augmentation) -51,2 -75,3 -26,8 -35,9 -18,8 -30,6 -37,2 -29,9 dont: FMI (net) -12,4 -9,0 2,0 2,0 2,0 2,0 2,0 2,0 Achats 4,0 2,1 2,0 2,0 2,0 2,0 2,0 2,0 Rachats 16,4 11,1 0,0 0,0 0,0 0,0 0,0 0,0 PPTE assistance 27,7 25,9 10,5 10,7 11,2 12,1 11,1 11,1 Gap de financement 0,0 0,0 0,0 0,0 0,0 0,0 0,0 0,0 pour mémoire: Produit intérieur brut aux prix du marché (mrd. Fbu) 2 550,3 3 205,8 3 419,4 3 653,0 3 895,0 4 196,9 4 493,8 3 931,6 Balance commerciale/PIB -0,3% -1,1% -1,1% -1,1% -1,1% -1,7% -2,5% -1,5% Compte courant (hors dons)/PIB -8,6% -7,4% -7,3% -7,0% -6,7% -7,3% -8,2% -7,3% Compte courant (dons inclus)/PIB -6,6% -4,3% -4,6% -4,9% -4,7% -5,4% -6,4% -5,2% Réserves brutes (en mio. $ E.U.) 1 029,5 1 328,4 1 408,6 1 489,4 1 536,0 1 606,4 1 690,2 1 546,1 Réserves brutes/mois d'importation 8,3 7,8 7,6 7,5 7,2 6,9 6,9 7,2 Service de la dette/exportations bsnf 8,1% 125,9% 4,9% 4,4% 4,2% 4,2% 4,3% 4,4%FCFA/US $ 582,2 522,3 509,9 507,2 505,0 502,9 500,8 505,2 Source: DNPD, modèle MME-DNPD
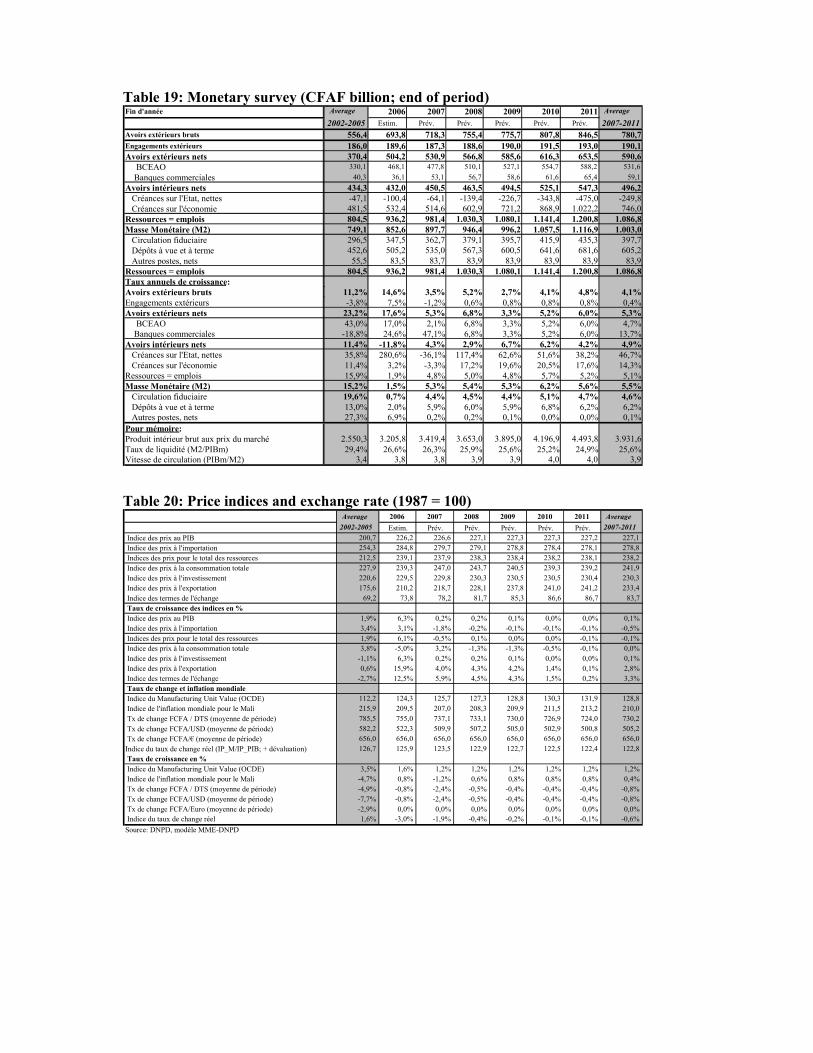
Table 19: Monetary survey (CFAF billion; end of period)
Table 20: Price indices and exchange rate (1987 = 100)
Fin d'année Average 2006 2007 2008 2009 2010 2011 Average
2002-2005 Estim. Prév. Prév. Prév. Prév. Prév. 2007-2011 Avoirs extérieurs bruts 556,4 693,8 718,3 755,4 775,7 807,8 846,5 780,7 Engagements extérieurs 186,0 189,6 187,3 188,6 190,0 191,5 193,0 190,1 Avoirs extérieurs nets 370,4 504,2 530,9 566,8 585,6 616,3 653,5 590,6 BCEAO 330,1 468,1 477,8 510,1 527,1 554,7 588,2 531,6 Banques commerciales 40,3 36,1 53,1 56,7 58,6 61,6 65,4 59,1 Avoirs intérieurs nets 434,3 432,0 450,5 463,5 494,5 525,1 547,3 496,2 Créances sur l'Etat, nettes -47,1 -100,4 -64,1 -139,4 -226,7 -343,8 -475,0 -249,8 Créances sur l'économie 481,5 532,4 514,6 602,9 721,2 868,9 1.022,2 746,0 Ressources = emplois 804,5 936,2 981,4 1.030,3 1.080,1 1.141,4 1.200,8 1.086,8 Masse Monétaire (M2) 749,1 852,6 897,7 946,4 996,2 1.057,5 1.116,9 1.003,0 Circulation fiduciaire 296,5 347,5 362,7 379,1 395,7 415,9 435,3 397,7 Dépôts à vue et à terme 452,6 505,2 535,0 567,3 600,5 641,6 681,6 605,2 Autres postes, nets 55,5 83,5 83,7 83,9 83,9 83,9 83,9 83,9 Ressources = emplois 804,5 936,2 981,4 1.030,3 1.080,1 1.141,4 1.200,8 1.086,8 Taux annuels de croissance: Avoirs extérieurs bruts 11,2% 14,6% 3,5% 5,2% 2,7% 4,1% 4,8% 4,1% Engagements extérieurs -3,8% 7,5% -1,2% 0,6% 0,8% 0,8% 0,8% 0,4% Avoirs extérieurs nets 23,2% 17,6% 5,3% 6,8% 3,3% 5,2% 6,0% 5,3% BCEAO 43,0% 17,0% 2,1% 6,8% 3,3% 5,2% 6,0% 4,7% Banques commerciales -18,8% 24,6% 47,1% 6,8% 3,3% 5,2% 6,0% 13,7% Avoirs intérieurs nets 11,4% -11,8% 4,3% 2,9% 6,7% 6,2% 4,2% 4,9% Créances sur l'Etat, nettes 35,8% 280,6% -36,1% 117,4% 62,6% 51,6% 38,2% 46,7% Créances sur l'économie 11,4% 3,2% -3,3% 17,2% 19,6% 20,5% 17,6% 14,3% Ressources = emplois 15,9% 1,9% 4,8% 5,0% 4,8% 5,7% 5,2% 5,1% Masse Monétaire (M2) 15,2% 1,5% 5,3% 5,4% 5,3% 6,2% 5,6% 5,5% Circulation fiduciaire 19,6% 0,7% 4,4% 4,5% 4,4% 5,1% 4,7% 4,6% Dépôts à vue et à terme 13,0% 2,0% 5,9% 6,0% 5,9% 6,8% 6,2% 6,2% Autres postes, nets 27,3% 6,9% 0,2% 0,2% 0,1% 0,0% 0,0% 0,1% Pour mémoire: Produit intérieur brut aux prix du marché 2.550,3 3.205,8 3.419,4 3.653,0 3.895,0 4.196,9 4.493,8 3.931,6 Taux de liquidité (M2/PIBm) 29,4% 26,6% 26,3% 25,9% 25,6% 25,2% 24,9% 25,6% Vitesse de circulation (PIBm/M2) 3,4 3,8 3,8 3,9 3,9 4,0 4,0 3,9
Average 2006 2007 2008 2009 2010 2011 Average2002-2005 Estim. Prév. Prév. Prév. Prév. Prév. 2007-2011
Indice des prix au PIB 200,7 226,2 226,6 227,1 227,3 227,3 227,2 227,1 Indice des prix à l'importation 254,3 284,8 279,7 279,1 278,8 278,4 278,1 278,8 Indices des prix pour le total des ressources 212,5 239,1 237,9 238,3 238,4 238,2 238,1 238,2 Indice des prix à la consommation totale 227,9 239,3 247,0 243,7 240,5 239,3 239,2 241,9 Indice des prix à l'investissement 220,6 229,5 229,8 230,3 230,5 230,5 230,4 230,3 Indice des prix à l'exportation 175,6 210,2 218,7 228,1 237,8 241,0 241,2 233,4 Indice des termes de l'échange 69,2 73,8 78,2 81,7 85,3 86,6 86,7 83,7 Taux de croissance des indices en %
Indice des prix au PIB 1,9% 6,3% 0,2% 0,2% 0,1% 0,0% 0,0% 0,1% Indice des prix à l'importation 3,4% 3,1% -1,8% -0,2% -0,1% -0,1% -0,1% -0,5% Indices des prix pour le total des ressources 1,9% 6,1% -0,5% 0,1% 0,0% 0,0% -0,1% -0,1% Indice des prix à la consommation totale 3,8% -5,0% 3,2% -1,3% -1,3% -0,5% -0,1% 0,0% Indice des prix à l'investissement -1,1% 6,3% 0,2% 0,2% 0,1% 0,0% 0,0% 0,1% Indice des prix à l'exportation 0,6% 15,9% 4,0% 4,3% 4,2% 1,4% 0,1% 2,8% Indice des termes de l'échange -2,7% 12,5% 5,9% 4,5% 4,3% 1,5% 0,2% 3,3% Taux de change et inflation mondiale
Indice du Manufacturing Unit Value (OCDE) 112,2 124,3 125,7 127,3 128,8 130,3 131,9 128,8 Indice de l'inflation mondiale pour le Mali 215,9 209,5 207,0 208,3 209,9 211,5 213,2 210,0 Tx de change FCFA / DTS (moyenne de période) 785,5 755,0 737,1 733,1 730,0 726,9 724,0 730,2 Tx de change FCFA/USD (moyenne de période) 582,2 522,3 509,9 507,2 505,0 502,9 500,8 505,2 Tx de change FCFA/€ (moyenne de période) 656,0 656,0 656,0 656,0 656,0 656,0 656,0 656,0 Indice du taux de change réel (IP_M/IP_PIB; + dévaluation) 126,7 125,9 123,5 122,9 122,7 122,5 122,4 122,8 Taux de croissance en %
Indice du Manufacturing Unit Value (OCDE) 3,5% 1,6% 1,2% 1,2% 1,2% 1,2% 1,2% 1,2% Indice de l'inflation mondiale pour le Mali -4,7% 0,8% -1,2% 0,6% 0,8% 0,8% 0,8% 0,4% Tx de change FCFA / DTS (moyenne de période) -4,9% -0,8% -2,4% -0,5% -0,4% -0,4% -0,4% -0,8% Tx de change FCFA/USD (moyenne de période) -7,7% -0,8% -2,4% -0,5% -0,4% -0,4% -0,4% -0,8% Tx de change FCFA/Euro (moyenne de période) -2,9% 0,0% 0,0% 0,0% 0,0% 0,0% 0,0% 0,0% Indice du taux de change réel 1,6% -3,0% -1,9% -0,4% -0,2% -0,1% -0,1% -0,6% Source: DNPD, modèle MME-DNPD

Table 21: Price indices by economic sector (1987 = 100)
Table 22: GDP by sector (CFAF billion at 1987 prices)
Average 2006 2007 2008 2009 2010 2011 Average 2002-2005 Estim. Prév. Prév. Prév. Prév. Prév. 2007-2011
SECTEUR PRIMAIRE 198,2 224,0 225,8 226,7 227,1 227,1 227,1 226,8 Agriculture vivrière hors riz 195,9 242,3 244,3 245,3 245,7 245,7 245,7 245,3 Branche consolidé du riz 152,8 176,4 177,8 178,5 178,8 178,9 178,8 178,6 Agriculture industrielle hors coton 255,2 276,6 278,9 279,9 280,4 280,5 280,4 280,0 Branche consolidé coton 238,1 253,7 255,8 256,8 257,2 257,3 257,2 256,9 Elevage 187,3 198,6 200,3 201,0 201,4 201,4 201,4 201,1 Pêche 179,2 190,6 192,2 192,9 193,2 193,3 193,3 193,0 Sylviculture 241,4 256,9 259,1 260,1 260,5 260,6 260,5 260,1 SECTEUR SECONDAIRE 203,9 255,5 215,9 216,2 216,4 216,5 216,5 216,3 Produits de l'extraction 184,5 223,1 188,5 188,8 188,9 189,0 189,0 188,8 Industries manufacturières 218,4 297,2 251,2 251,5 251,7 251,9 251,9 251,6 Agroalimentaires 187,5 255,1 215,6 215,9 216,1 216,2 216,2 216,0 Industries textiles 299,2 407,2 344,1 344,6 344,9 345,0 345,1 344,7 Autres branches manufact. 167,1 227,3 192,1 192,4 192,5 192,6 192,6 192,5 Electricité eau 172,7 201,9 170,6 170,8 171,0 171,1 171,1 170,9 Bâtiment, Travaux publics 226,1 256,1 216,4 216,7 216,9 217,0 217,0 216,8 SECTEUR TERTIAIRE 201,1 209,8 215,9 216,2 216,4 216,5 216,5 216,3 Commerce 186,6 194,9 200,6 200,9 201,1 201,2 201,2 201,0 Transport et télécommunication 174,4 178,0 183,2 183,5 183,6 183,7 183,7 183,5 Autr. services march. non financiers 189,4 193,8 199,5 199,8 199,9 200,0 200,1 199,9 Services financiers 188,5 192,6 198,2 198,5 198,7 198,7 198,8 198,6 Services non marchands 246,9 264,3 272,0 272,4 272,7 272,8 272,8 272,5 Total branche fictive 188,5 192,6 198,2 198,5 198,7 198,7 198,8 198,6 PIB AU COUT DES FACTEURS 200,7 226,2 226,6 227,1 227,3 227,3 227,2 227,1
Average 2006 2007 2008 2009 2010 2011 Average 2002-2005 Estim. Prév. Prév. Prév. Prév. Prév. 2007-2011
Secteur primaire 431,4 485,1 512,0 540,6 571,0 603,3 638,8 573,1 Agriculture vivrière hors riz 149,4 175,5 186,1 197,2 209,1 221,6 236,0 210,0 Branche consolidé du riz 50,0 58,5 64,3 70,7 77,7 85,4 93,9 78,4 Agriculture industrielle hors coton 11,3 15,4 16,4 17,4 18,5 19,7 20,9 18,6 Branche consolidé coton 35,3 34,6 35,2 35,8 36,4 37,0 37,6 36,4 Elevage 123,8 134,2 140,4 146,8 153,5 160,6 167,9 153,8 Pêche 11,4 12,3 12,9 13,4 14,1 14,7 15,4 14,1 Sylviculture 50,2 54,5 56,8 59,2 61,7 64,3 67,1 61,8 Secteur secondaire 278,5 309,7 331,7 351,6 374,1 399,0 427,1 376,7 Produits de l'extraction 106,5 116,5 120,6 120,6 120,6 120,6 120,6 120,6 Industries manufacturières 94,4 101,8 111,3 121,7 133,1 145,7 159,5 134,3 Agroalimentaires 35,2 38,0 42,3 47,0 52,3 58,2 64,7 52,9 Industries textiles 31,3 33,7 36,0 38,4 41,1 43,9 46,9 41,3 Autres branches manufact. 27,9 30,1 33,0 36,2 39,8 43,6 47,9 40,1 Electricité eau 24,5 30,7 34,7 39,2 44,2 50,0 56,4 44,9 Bâtiment, Travaux publics 53,2 60,7 65,2 70,2 76,2 82,8 90,6 77,0 Secteur tertiaire 435,9 487,0 522,0 557,3 594,4 640,1 688,0 600,4 Commerce 166,9 183,6 196,5 208,8 222,5 237,6 254,5 224,0 Transport et télécommunication 65,0 81,0 86,8 92,2 98,2 104,9 112,4 98,9 Autr. services march. non financiers 86,7 94,2 100,9 107,1 114,2 122,0 130,6 115,0 Services financiers 9,8 10,9 11,7 12,4 13,2 14,1 15,1 13,3 Services non marchands 114,2 124,8 134,2 145,3 155,4 171,2 185,7 158,4 Production imputée de services bancaires (marges d'intérêt) -6,7 -7,5 -8,0 -8,5 -9,1 -9,7 -10,4 -9,2 PIB au coût des facteurs 1 145,8 1 281,7 1 365,7 1 449,5 1 539,5 1 642,5 1 753,8 1 550,2 Taxes indirectes (moins subventions) 117,5 128,7 143,5 159,2 174,4 204,3 224,5 181,2 PIB aux prix du marché 1 263,3 1 410,4 1 509,2 1 608,7 1 713,9 1 846,8 1 978,3 1 731,4 PIB du secteur formel au coût des facteurs 395,6 487,1 519,0 550,8 600,4 640,6 684,0 599,0

Table 23: Sectoral contribution to growth (in percent)
Taux annuel de croissance Average 2006 2007 2008 2009 2010 2011 Average 2002-2005 Estim. Prév. Prév. Prév. Prév. Prév. 2007-2011
Secteur primaire 4,7% 5,0% 5,5% 5,6% 5,6% 5,7% 5,9% 5,7% Agriculture vivrière hors riz 8,7% 8,3% 6,0% 6,0% 6,0% 6,0% 6,5% 6,1% Branche consolidé du riz 2,7% 7,3% 9,9% 9,9% 9,9% 9,9% 9,9% 9,9% Agriculture industrielle hors coton 14,3% 2,1% 6,3% 6,3% 6,3% 6,3% 6,3% 6,3% Branche consolidé coton 1,1% -0,4% 1,6% 1,6% 1,6% 1,6% 1,6% 1,6% Elevage 4,1% 2,5% 4,6% 4,6% 4,6% 4,6% 4,6% 4,6% Pêche 2,2% 3,8% 4,5% 4,5% 4,5% 4,5% 4,5% 4,5% Sylviculture 2,9% 3,8% 4,2% 4,2% 4,2% 4,2% 4,2% 4,2%Secteur secondaire 5,3% 5,9% 7,1% 6,0% 6,4% 6,7% 7,0% 6,6% Produits de l'extraction 2,0% 10,6% 3,4% 0,0% 0,0% 0,0% 0,0% 0,7% Industries manufacturières 9,5% 0,3% 9,3% 9,4% 9,4% 9,4% 9,5% 9,4% Agroalimentaires 9,4% 0,6% 11,2% 11,2% 11,2% 11,2% 11,2% 11,2% Industries textiles 9,5% 0,2% 6,8% 6,8% 6,8% 6,8% 6,8% 6,8% Autres branches manufact. 9,5% 0,2% 9,7% 9,7% 9,7% 9,7% 9,7% 9,7% Electricité eau 12,0% 8,3% 12,9% 12,9% 12,9% 12,9% 12,9% 12,9% Bâtiment, Travaux publics 5,2% 5,7% 7,5% 7,7% 8,5% 8,7% 9,4% 8,4%Secteur tertiaire 4,8% 2,9% 7,2% 6,8% 6,7% 7,7% 7,5% 7,2% Commerce 3,8% 3,6% 7,1% 6,2% 6,6% 6,8% 7,1% 6,8% Transport et télécommunication 9,3% 3,4% 7,1% 6,2% 6,6% 6,8% 7,1% 6,8% Autr. services march. non financiers 3,9% 3,8% 7,1% 6,2% 6,6% 6,8% 7,1% 6,8% Services financiers 4,5% 4,1% 7,1% 6,2% 6,6% 6,8% 7,1% 6,8% Services non marchands 4,7% 0,9% 7,5% 8,3% 6,9% 10,2% 8,4% 8,3% Production imputée de services bancaires (marges d'intérêt) 5,1% 4,3% 7,1% 6,2% 6,6% 6,8% 7,1% 6,8%PIB au coût des facteurs 4,6% 4,4% 6,5% 6,1% 6,2% 6,7% 6,8% 6,5% Taxes indirectes (moins subventions) 12,1% -4,2% 11,5% 10,9% 9,5% 17,2% 9,9% 11,8%PIB aux prix du marché 5,2% 3,6% 7,0% 6,6% 6,5% 7,8% 7,1% 7,0% Source: DNPD, modèle MME-DNPD
Average 2006 2007 2008 2009 2010 2011 Average 2002-2005 Estim. Prév. Prév. Prév. Prév. Prév. 2007-2011
Secteur primaire 1,6% 1,9% 2,1% 2,1% 2,1% 2,1% 2,2% 2,1% Agriculture vivrière hors riz 1,0% 1,1% 0,8% 0,8% 0,8% 0,8% 0,9% 0,8% Branche consolidé du riz 0,0% 0,3% 0,5% 0,5% 0,5% 0,5% 0,5% 0,5% Agriculture industrielle hors coton 0,1% 0,0% 0,1% 0,1% 0,1% 0,1% 0,1% 0,1% Branche consolidé coton 0,0% 0,0% 0,0% 0,0% 0,0% 0,0% 0,0% 0,0% Elevage 0,4% 0,3% 0,5% 0,5% 0,5% 0,5% 0,4% 0,5% Pêche 0,0% 0,0% 0,0% 0,0% 0,0% 0,0% 0,0% 0,0% Sylviculture 0,1% 0,2% 0,2% 0,2% 0,2% 0,2% 0,2% 0,2%Secteur secondaire 1,2% 1,4% 1,7% 1,5% 1,6% 1,6% 1,7% 1,6% Produits de l'extraction 0,0% 0,9% 0,3% 0,0% 0,0% 0,0% 0,0% 0,1% Industries manufacturières 0,7% 0,0% 0,7% 0,8% 0,8% 0,8% 0,8% 0,8% Agroalimentaires 0,2% 0,0% 0,3% 0,3% 0,4% 0,4% 0,4% 0,4% Industries textiles 0,2% 0,0% 0,2% 0,2% 0,2% 0,2% 0,2% 0,2% Autres branches manufact. 0,2% 0,0% 0,2% 0,2% 0,2% 0,3% 0,3% 0,2% Electricité eau 0,2% 0,2% 0,3% 0,3% 0,3% 0,4% 0,4% 0,4% Bâtiment, Travaux publics 0,2% 0,3% 0,4% 0,4% 0,4% 0,4% 0,5% 0,4%Secteur tertiaire 1,8% 1,1% 2,7% 2,6% 2,6% 3,0% 2,9% 2,8% Commerce 0,5% 0,5% 1,0% 0,9% 0,9% 1,0% 1,0% 1,0% Transport et télécommunication 0,5% 0,2% 0,4% 0,4% 0,4% 0,4% 0,5% 0,4% Autr. services march. non financiers 0,3% 0,3% 0,5% 0,5% 0,5% 0,5% 0,5% 0,5% Services financiers 0,0% 0,0% 0,1% 0,1% 0,1% 0,1% 0,1% 0,1% Services non marchands 0,5% 0,1% 0,7% 0,8% 0,7% 1,0% 0,9% 0,8% Production imputée de services bancaires (marges d'intérêt) 0,0% 0,0% 0,0% 0,0% 0,0% 0,0% 0,0% 0,0%PIB au coût des facteurs 4,6% 4,4% 6,5% 6,1% 6,2% 6,7% 6,8% 6,5% PIB du secteur formel au coût des facteurs 1,3% 6,2% 2,5% 2,3% 3,4% 2,6% 2,6% 2,7% Source: DNPD, modèle MME-DNPD

Table 24: GDP by sector (CFAF billion current)
Average 2006 2007 2008 2009 2010 2011 Average 2002-2005 Estim. Prév. Prév. Prév. Prév. Prév. 2007-2011
Secteur primaire 859,2 1 086,4 1 251,1 1 325,9 1 402,7 1 482,6 1 569,5 1 406,3 Agriculture vivrière hors riz 298,3 427,4 454,7 483,8 513,6 544,6 579,9 515,3 Branche consolidé du riz 76,1 104,6 157,1 173,3 190,9 209,9 230,7 192,4 Agriculture industrielle hors coton 29,2 45,0 40,0 42,7 45,5 48,4 51,4 45,6 Branche consolidé coton 79,0 65,2 86,1 87,8 89,4 90,9 92,3 89,3 Elevage 234,0 278,2 343,0 360,1 377,2 394,6 412,6 377,5 Pêche 20,5 23,8 31,4 33,0 34,5 36,1 37,7 34,6 Sylviculture 122,1 142,2 138,8 145,3 151,6 158,1 164,8 151,7 Secteur secondaire 568,6 791,3 716,2 760,4 809,7 864,0 924,8 815,0 Produits de l'extraction 201,6 254,0 260,3 260,7 260,9 261,0 261,0 260,8 Industries manufacturièrs 207,7 363,4 240,2 263,2 288,1 315,5 345,4 290,5 Agroalimentaires 66,6 116,5 91,3 101,7 113,2 126,0 140,2 114,5 Industries textiles 94,2 164,8 77,7 83,1 88,9 95,0 101,5 89,3 Autres branches manufact. 47,0 82,2 71,3 78,3 86,0 94,5 103,7 86,8 Electricité eau 42,4 55,4 74,9 84,7 95,7 108,2 122,2 97,1 Bâtiment, Travaux publics 116,9 118,4 140,8 151,9 164,9 179,3 196,2 166,6 Secteur tertiaire 876,7 1 021,8 1 127,0 1 205,1 1 286,4 1 386,0 1 489,6 1 298,8 Commerce 312,8 354,8 424,3 451,4 481,5 514,5 551,2 484,6 Transport et télécommunication 114,2 164,8 187,3 199,3 212,6 227,1 243,3 213,9 Autr. services march. non financiers 165,3 186,2 217,8 231,7 247,1 264,1 282,9 248,7 Services financiers 18,7 21,7 25,2 26,8 28,6 30,6 32,8 28,8 Services non marchands 278,4 309,3 289,8 314,3 336,3 370,8 402,0 342,6 Production imputée de services bancaires (marges d'intérêt) -12,8 -14,9 -17,4 -18,5 -19,7 -21,1 -22,6 -19,8PIB au coût des facteurs 2 304,5 2 899,4 3 094,2 3 291,5 3 498,7 3 732,6 3 983,9 3 520,2 Taxes indirectes (moins subventions) 245,8 306,4 325,2 361,5 396,3 464,3 509,9 411,5 PIB aux prix du marché 2 550,3 3 205,8 3 419,4 3 653,0 3 895,0 4 196,9 4 493,8 3 931,6
Taux annuel de croissance Average 2006 2007 2008 2009 2010 2011 Average 2002-2005 Estim. Prév. Prév. Prév. Prév. Prév. 2007-2011
Secteur primaire 7,9% 8,1% 15,2% 6,0% 5,8% 5,7% 5,9% 7,7% Agriculture vivrière hors riz 14,7% 9,4% 6,4% 6,4% 6,2% 6,0% 6,5% 6,3% Branche consolidé du riz 5,1% 14,5% 50,2% 10,4% 10,1% 10,0% 9,9% 18,1% Agriculture industrielle hors coton 18,9% 10,2% -11,0% 6,7% 6,5% 6,4% 6,3% 3,0% Branche consolidé coton -1,4% -0,4% 31,9% 2,0% 1,8% 1,7% 1,6% 7,8% Elevage 7,5% 6,8% 23,3% 5,0% 4,7% 4,6% 4,6% 8,4% Pêche 7,1% 5,9% 32,0% 4,9% 4,7% 4,6% 4,5% 10,1% Sylviculture 7,8% 5,9% -2,4% 4,6% 4,4% 4,3% 4,2% 3,0%Secteur secondaire 8,8% 22,5% -9,5% 6,2% 6,5% 6,7% 7,0% 3,4% Produits de l'extraction 4,6% 13,9% 2,5% 0,2% 0,1% 0,0% 0,0% 0,6% Industries manufacturièrs 22,3% 41,0% -33,9% 9,5% 9,5% 9,5% 9,5% 0,8% Agroalimentaires 14,5% 41,0% -21,6% 11,4% 11,3% 11,3% 11,2% 4,7% Industries textiles 44,7% 41,0% -52,9% 7,0% 6,9% 6,9% 6,8% -5,0% Autres branches manufact. 13,1% 41,0% -13,3% 9,9% 9,8% 9,8% 9,7% 5,2% Electricité eau 13,6% 10,5% 35,1% 13,1% 13,0% 13,0% 12,9% 17,4% Bâtiment, Travaux publics 1,0% 2,8% 18,9% 7,9% 8,6% 8,7% 9,4% 10,7%Secteur tertiaire 5,4% 6,4% 10,3% 6,9% 6,7% 7,7% 7,5% 7,8% Commerce 3,3% 4,7% 19,6% 6,4% 6,7% 6,9% 7,1% 9,3% Transport et télécommunication 11,1% 17,9% 13,7% 6,4% 6,7% 6,9% 7,1% 8,1% Autr. services march. non financiers 4,3% 6,0% 17,0% 6,4% 6,7% 6,9% 7,1% 8,8% Services financiers 5,9% 6,2% 16,5% 6,4% 6,7% 6,9% 7,1% 8,7% Services non marchands 6,6% 3,1% -6,3% 8,5% 7,0% 10,2% 8,4% 5,6% Production imputée de services bancaires (marges d'intérêt) 6,4% 6,4% 16,5% 6,4% 6,7% 6,9% 7,1% 8,7%PIB au coût des facteurs 6,6% 11,0% 6,7% 6,4% 6,3% 6,7% 6,7% 6,6%Taxes indirectes (moins subventions) 11,3% 9,2% 6,1% 11,2% 9,6% 17,2% 9,8% 10,8%PIB aux prix du marché 7,0% 10,8% 6,7% 6,8% 6,6% 7,7% 7,1% 7,0%
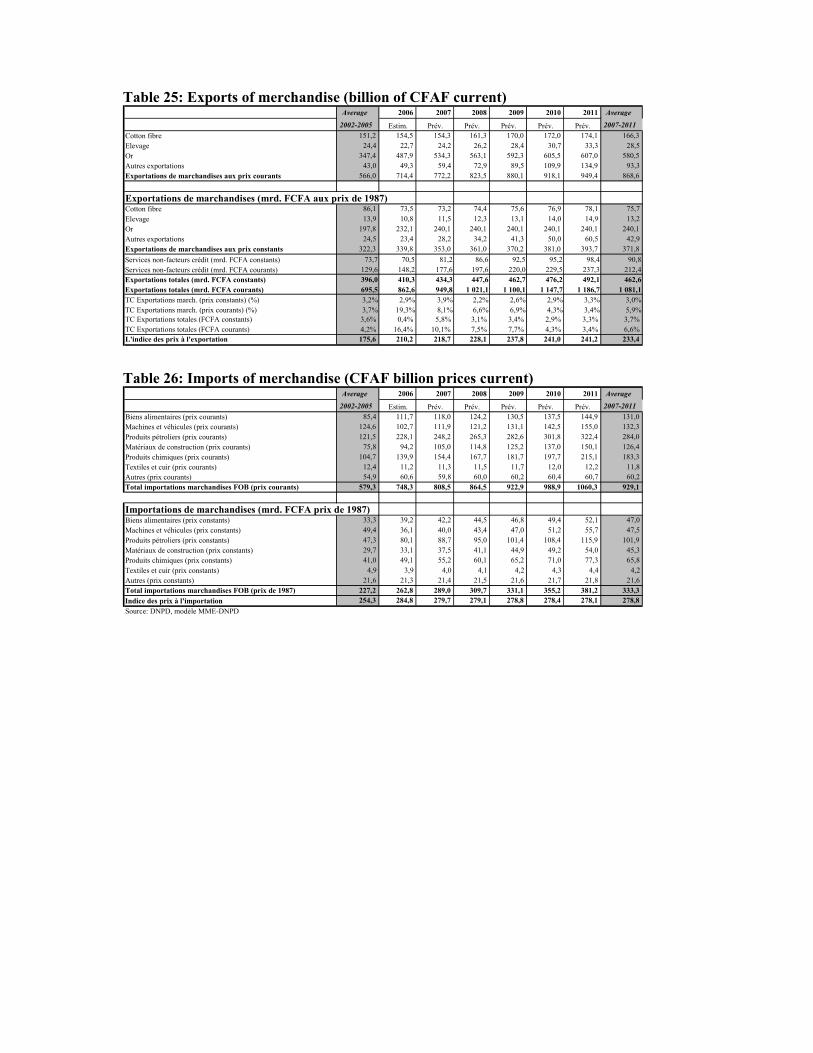
Table 25: Exports of merchandise (billion of CFAF current)
Table 26: Imports of merchandise (CFAF billion prices current)
Average 2006 2007 2008 2009 2010 2011 Average 2002-2005 Estim. Prév. Prév. Prév. Prév. Prév. 2007-2011
Cotton fibre 151,2 154,5 154,3 161,3 170,0 172,0 174,1 166,3 Elevage 24,4 22,7 24,2 26,2 28,4 30,7 33,3 28,5 Or 347,4 487,9 534,3 563,1 592,3 605,5 607,0 580,5 Autres exportations 43,0 49,3 59,4 72,9 89,5 109,9 134,9 93,3 Exportations de marchandises aux prix courants 566,0 714,4 772,2 823,5 880,1 918,1 949,4 868,6 Exportations de marchandises (mrd. FCFA aux prix de 1987)Cotton fibre 86,1 73,5 73,2 74,4 75,6 76,9 78,1 75,7 Elevage 13,9 10,8 11,5 12,3 13,1 14,0 14,9 13,2 Or 197,8 232,1 240,1 240,1 240,1 240,1 240,1 240,1 Autres exportations 24,5 23,4 28,2 34,2 41,3 50,0 60,5 42,9 Exportations de marchandises aux prix constants 322,3 339,8 353,0 361,0 370,2 381,0 393,7 371,8 Services non-facteurs crédit (mrd. FCFA constants) 73,7 70,5 81,2 86,6 92,5 95,2 98,4 90,8 Services non-facteurs crédit (mrd. FCFA courants) 129,6 148,2 177,6 197,6 220,0 229,5 237,3 212,4 Exportations totales (mrd. FCFA constants) 396,0 410,3 434,3 447,6 462,7 476,2 492,1 462,6 Exportations totales (mrd. FCFA courants) 695,5 862,6 949,8 1 021,1 1 100,1 1 147,7 1 186,7 1 081,1 TC Exportations march. (prix constants) (%) 3,2% 2,9% 3,9% 2,2% 2,6% 2,9% 3,3% 3,0% TC Exportations march. (prix courants) (%) 3,7% 19,3% 8,1% 6,6% 6,9% 4,3% 3,4% 5,9% TC Exportations totales (FCFA constants) 3,6% 0,4% 5,8% 3,1% 3,4% 2,9% 3,3% 3,7%TC Exportations totales (FCFA courants) 4,2% 16,4% 10,1% 7,5% 7,7% 4,3% 3,4% 6,6%L'indice des prix à l'exportation 175,6 210,2 218,7 228,1 237,8 241,0 241,2 233,4
Average 2006 2007 2008 2009 2010 2011 Average 2002-2005 Estim. Prév. Prév. Prév. Prév. Prév. 2007-2011
Biens alimentaires (prix courants) 85,4 111,7 118,0 124,2 130,5 137,5 144,9 131,0 Machines et véhicules (prix courants) 124,6 102,7 111,9 121,2 131,1 142,5 155,0 132,3 Produits pétroliers (prix courants) 121,5 228,1 248,2 265,3 282,6 301,8 322,4 284,0 Matériaux de construction (prix courants) 75,8 94,2 105,0 114,8 125,2 137,0 150,1 126,4 Produits chimiques (prix courants) 104,7 139,9 154,4 167,7 181,7 197,7 215,1 183,3 Textiles et cuir (prix courants) 12,4 11,2 11,3 11,5 11,7 12,0 12,2 11,8 Autres (prix courants) 54,9 60,6 59,8 60,0 60,2 60,4 60,7 60,2 Total importations marchandises FOB (prix courants) 579,3 748,3 808,5 864,5 922,9 988,9 1060,3 929,1 Importations de marchandises (mrd. FCFA prix de 1987)Biens alimentaires (prix constants) 33,3 39,2 42,2 44,5 46,8 49,4 52,1 47,0 Machines et véhicules (prix constants) 49,4 36,1 40,0 43,4 47,0 51,2 55,7 47,5 Produits pétroliers (prix constants) 47,3 80,1 88,7 95,0 101,4 108,4 115,9 101,9 Matériaux de construction (prix constants) 29,7 33,1 37,5 41,1 44,9 49,2 54,0 45,3 Produits chimiques (prix constants) 41,0 49,1 55,2 60,1 65,2 71,0 77,3 65,8 Textiles et cuir (prix constants) 4,9 3,9 4,0 4,1 4,2 4,3 4,4 4,2 Autres (prix constants) 21,6 21,3 21,4 21,5 21,6 21,7 21,8 21,6 Total importations marchandises FOB (prix de 1987) 227,2 262,8 289,0 309,7 331,1 355,2 381,2 333,3 Indice des prix à l'importation 254,3 284,8 279,7 279,1 278,8 278,4 278,1 278,8 Source: DNPD, modèle MME-DNPD
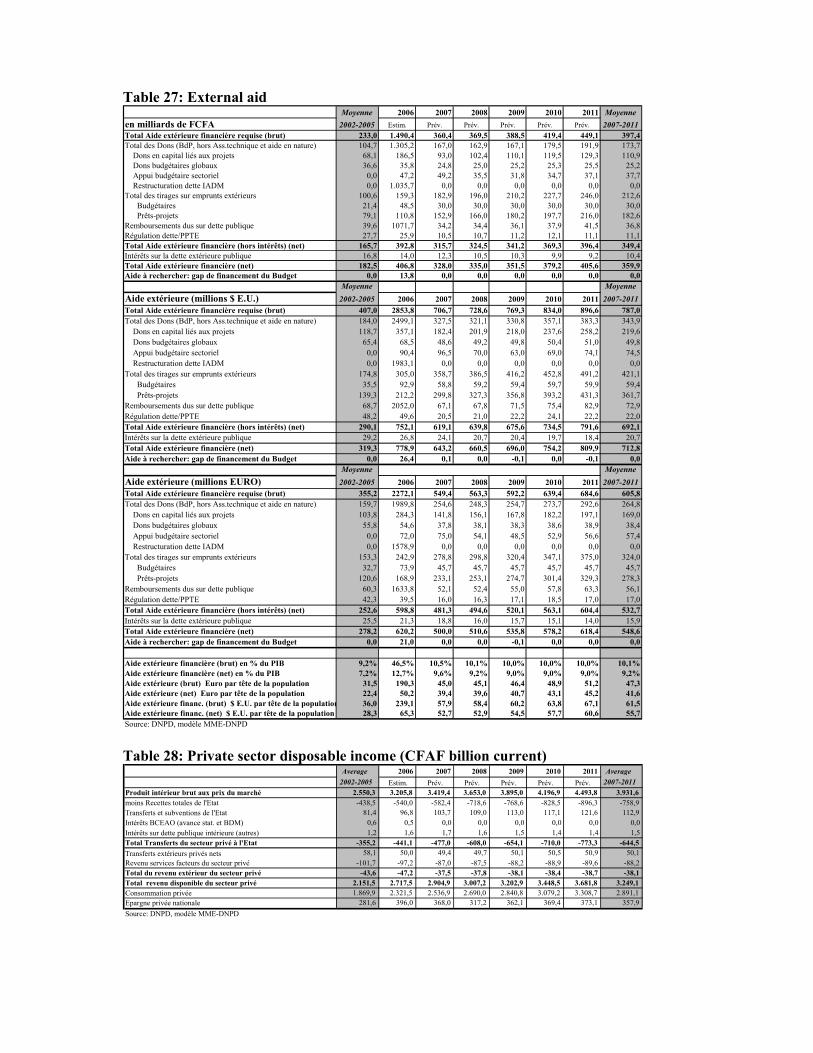
Table 27: External aid Moyenne 2006 2007 2008 2009 2010 2011 Moyenneen milliards de FCFA 2002-2005 Estim. Prév. Prév. Prév. Prév. Prév. 2007-2011Total Aide extérieure financière requise (brut) 233,0 1.490,4 360,4 369,5 388,5 419,4 449,1 397,4Total des Dons (BdP, hors Ass.technique et aide en nature) 104,7 1.305,2 167,0 162,9 167,1 179,5 191,9 173,7 Dons en capital liés aux projets 68,1 186,5 93,0 102,4 110,1 119,5 129,3 110,9 Dons budgétaires globaux 36,6 35,8 24,8 25,0 25,2 25,3 25,5 25,2 Appui budgétaire sectoriel 0,0 47,2 49,2 35,5 31,8 34,7 37,1 37,7 Restructuration dette IADM 0,0 1.035,7 0,0 0,0 0,0 0,0 0,0 0,0Total des tirages sur emprunts extérieurs 100,6 159,3 182,9 196,0 210,2 227,7 246,0 212,6 Budgétaires 21,4 48,5 30,0 30,0 30,0 30,0 30,0 30,0 Prêts-projets 79,1 110,8 152,9 166,0 180,2 197,7 216,0 182,6Remboursements dus sur dette publique 39,6 1071,7 34,2 34,4 36,1 37,9 41,5 36,8Régulation dette/PPTE 27,7 25,9 10,5 10,7 11,2 12,1 11,1 11,1Total Aide extérieure financière (hors intérêts) (net) 165,7 392,8 315,7 324,5 341,2 369,3 396,4 349,4Intérêts sur la dette extérieure publique 16,8 14,0 12,3 10,5 10,3 9,9 9,2 10,4Total Aide extérieure financière (net) 182,5 406,8 328,0 335,0 351,5 379,2 405,6 359,9Aide à rechercher: gap de financement du Budget 0,0 13,8 0,0 0,0 0,0 0,0 0,0 0,0
Moyenne MoyenneAide extérieure (millions $ E.U.) 2002-2005 2006 2007 2008 2009 2010 2011 2007-2011Total Aide extérieure financière requise (brut) 407,0 2853,8 706,7 728,6 769,3 834,0 896,6 787,0Total des Dons (BdP, hors Ass.technique et aide en nature) 184,0 2499,1 327,5 321,1 330,8 357,1 383,3 343,9 Dons en capital liés aux projets 118,7 357,1 182,4 201,9 218,0 237,6 258,2 219,6 Dons budgétaires globaux 65,4 68,5 48,6 49,2 49,8 50,4 51,0 49,8 Appui budgétaire sectoriel 0,0 90,4 96,5 70,0 63,0 69,0 74,1 74,5 Restructuration dette IADM 0,0 1983,1 0,0 0,0 0,0 0,0 0,0 0,0Total des tirages sur emprunts extérieurs 174,8 305,0 358,7 386,5 416,2 452,8 491,2 421,1 Budgétaires 35,5 92,9 58,8 59,2 59,4 59,7 59,9 59,4 Prêts-projets 139,3 212,2 299,8 327,3 356,8 393,2 431,3 361,7Remboursements dus sur dette publique 68,7 2052,0 67,1 67,8 71,5 75,4 82,9 72,9Régulation dette/PPTE 48,2 49,6 20,5 21,0 22,2 24,1 22,2 22,0Total Aide extérieure financière (hors intérêts) (net) 290,1 752,1 619,1 639,8 675,6 734,5 791,6 692,1Intérêts sur la dette extérieure publique 29,2 26,8 24,1 20,7 20,4 19,7 18,4 20,7Total Aide extérieure financière (net) 319,3 778,9 643,2 660,5 696,0 754,2 809,9 712,8Aide à rechercher: gap de financement du Budget 0,0 26,4 0,1 0,0 -0,1 0,0 -0,1 0,0
Moyenne MoyenneAide extérieure (millions EURO) 2002-2005 2006 2007 2008 2009 2010 2011 2007-2011Total Aide extérieure financière requise (brut) 355,2 2272,1 549,4 563,3 592,2 639,4 684,6 605,8Total des Dons (BdP, hors Ass.technique et aide en nature) 159,7 1989,8 254,6 248,3 254,7 273,7 292,6 264,8 Dons en capital liés aux projets 103,8 284,3 141,8 156,1 167,8 182,2 197,1 169,0 Dons budgétaires globaux 55,8 54,6 37,8 38,1 38,3 38,6 38,9 38,4 Appui budgétaire sectoriel 0,0 72,0 75,0 54,1 48,5 52,9 56,6 57,4 Restructuration dette IADM 0,0 1578,9 0,0 0,0 0,0 0,0 0,0 0,0Total des tirages sur emprunts extérieurs 153,3 242,9 278,8 298,8 320,4 347,1 375,0 324,0 Budgétaires 32,7 73,9 45,7 45,7 45,7 45,7 45,7 45,7 Prêts-projets 120,6 168,9 233,1 253,1 274,7 301,4 329,3 278,3Remboursements dus sur dette publique 60,3 1633,8 52,1 52,4 55,0 57,8 63,3 56,1Régulation dette/PPTE 42,3 39,5 16,0 16,3 17,1 18,5 17,0 17,0Total Aide extérieure financière (hors intérêts) (net) 252,6 598,8 481,3 494,6 520,1 563,1 604,4 532,7Intérêts sur la dette extérieure publique 25,5 21,3 18,8 16,0 15,7 15,1 14,0 15,9Total Aide extérieure financière (net) 278,2 620,2 500,0 510,6 535,8 578,2 618,4 548,6Aide à rechercher: gap de financement du Budget 0,0 21,0 0,0 0,0 -0,1 0,0 0,0 0,0
Aide extérieure financière (brut) en % du PIB 9,2% 46,5% 10,5% 10,1% 10,0% 10,0% 10,0% 10,1%Aide extérieure financière (net) en % du PIB 7,2% 12,7% 9,6% 9,2% 9,0% 9,0% 9,0% 9,2%Aide extérieure (brut) Euro par tête de la population 31,5 190,3 45,0 45,1 46,4 48,9 51,2 47,3Aide extérieure (net) Euro par tête de la population 22,4 50,2 39,4 39,6 40,7 43,1 45,2 41,6Aide extérieure financ. (brut) $ E.U. par tête de la population 36,0 239,1 57,9 58,4 60,2 63,8 67,1 61,5Aide extérieure financ. (net) $ E.U. par tête de la population 28,3 65,3 52,7 52,9 54,5 57,7 60,6 55,7Source: DNPD, modèle MME-DNPD Table 28: Private sector disposable income (CFAF billion current)
Average 2006 2007 2008 2009 2010 2011 Average 2002-2005 Estim. Prév. Prév. Prév. Prév. Prév. 2007-2011 Produit intérieur brut aux prix du marché 2.550,3 3.205,8 3.419,4 3.653,0 3.895,0 4.196,9 4.493,8 3.931,6 moins Recettes totales de l'Etat -438,5 -540,0 -582,4 -718,6 -768,6 -828,5 -896,3 -758,9Transferts et subventions de l'Etat 81,4 96,8 103,7 109,0 113,0 117,1 121,6 112,9 Intérêts BCEAO (avance stat. et BDM) 0,6 0,5 0,0 0,0 0,0 0,0 0,0 0,0 Intérêts sur dette publique intérieure (autres) 1,2 1,6 1,7 1,6 1,5 1,4 1,4 1,5 Total Transferts du secteur privé à l'Etat -355,2 -441,1 -477,0 -608,0 -654,1 -710,0 -773,3 -644,5 Transferts extérieurs privés nets 58,1 50,0 49,4 49,7 50,1 50,5 50,9 50,1 Revenu services facteurs du secteur privé -101,7 -97,2 -87,0 -87,5 -88,2 -88,9 -89,6 -88,2 Total du revenu extérieur du secteur privé -43,6 -47,2 -37,5 -37,8 -38,1 -38,4 -38,7 -38,1 Total revenu disponible du secteur privé 2.151,5 2.717,5 2.904,9 3.007,2 3.202,9 3.448,5 3.681,8 3.249,1 Consommation privée 1.869,9 2.321,5 2.536,9 2.690,0 2.840,8 3.079,2 3.308,7 2.891,1 Epargne privée nationale 281,6 396,0 368,0 317,2 362,1 369,4 373,1 357,9 Source: DNPD, modèle MME-DNPD

Table 29: Public sector disposable income (CFAF billion current) Average 2006 2007 2008 2009 2010 2011 Average
2002-2005 Estim. Prév. Prév. Prév. Prév. Prév. 2007-2011 Total des recettes fiscales, non-fisc. et autres 438,5 540,0 582,4 718,6 768,6 828,5 896,3 758,9 Transferts extérieurs officiels 52,4 101,0 91,8 78,4 75,0 78,2 81,0 80,9 Appui budgétaire sectoriel 0,0 47,2 49,2 35,5 31,8 34,7 37,1 37,7 Dons budgétaires (Budget) 36,6 35,8 24,8 25,0 25,2 25,3 25,5 25,2 Autres transferts officiels nets 15,8 18,0 17,8 17,9 18,0 18,2 18,3 18,0 moins Total intérêts dûs sur la dette publique -18,6 -16,1 -14,0 -12,1 -11,8 -11,3 -10,6 -12,0 moins Intérêts BCEAO (avance stat. et BDM) -0,6 -0,5 0,0 0,0 0,0 0,0 0,0 0,0 moins Intérêts sur dette publique intérieure (autres) -1,2 -1,6 -1,7 -1,6 -1,5 -1,4 -1,4 -1,5 moins Intérêts sur dette publique extérieure -16,8 -14,0 -12,3 -10,5 -10,3 -9,9 -9,2 -10,4 Transferts extérieurs officiels nets 52,4 101,0 91,8 78,4 75,0 78,2 81,0 80,9 moins Transferts et subventions de l'Etat au sect. privé -81,4 -96,8 -103,7 -109,0 -113,0 -117,1 -121,6 -112,9Total revenu disponible du secteur public 390,9 528,1 556,5 675,8 718,8 778,3 845,1 714,9 Consommation publique 294,3 374,6 406,6 436,5 468,8 507,4 551,5 474,2 Epargne publique nationale 96,5 153,5 149,9 239,3 250,0 270,9 293,6 240,7 Pour mémoire:
PNB ("revenu disponible brut"), prix cour. 2.542,4 3.245,6 3.461,4 3.683,1 3.921,6 4.226,8 4.526,9 3.964,0 Amortissements (sur stock de capital total), p.cour. 89,1 134,3 131,8 143,6 156,2 170,4 187,5 157,9 PNN ("revenu disponible net"), prix cour. 2.453,2 3.111,3 3.329,5 3.539,5 3.765,5 4.056,4 4.339,4 3.806,1 Revenu disponible brut du secteur privé en % 84,7% 83,7% 83,9% 81,7% 81,7% 81,6% 81,3% 82,0%Revenu disponible brut du secteur public en % 15,3% 16,3% 16,1% 18,3% 18,3% 18,4% 18,7% 18,0%PNB ("revenu disponible brut"), prix const. 1.263,5 1.434,8 1.527,7 1.622,0 1.725,6 1.860,0 1.992,9 1.745,6 PNN ("revenu disponible net"), prix const. 1.219,0 1.375,4 1.469,5 1.558,8 1.656,9 1.785,0 1.910,3 1.676,1 PNB ("revenu disp. brut") par tête, en FCFA cour. 225.403 271.899 283.555 294.994 307.057 323.478 338.567 309.530 TC nominal du PNB ("revenu disp. brut") par tête 4,7% 9,5% 4,3% 4,0% 4,1% 5,3% 4,7% 4,5% PNB ("revenu disp. brut") par tête, en FCFA const. 112.165 120.199 125.150 129.913 135.112 142.344 149.048 136.313 TC réel du PNB ("revenu disp. brut") par tête 2,7% 3,0% 4,1% 3,8% 4,0% 5,4% 4,7% 4,4% Source: DNPD, modèle MME-DNPD

20 December 2006
2nd Generation PRSP 2007 – 2011
MMAALLII
Annex II Overall Medium Term Budgetary Framework
(MTBF) 2007 - 2011
MTBF RSP 2007 – 2011 Page 2 of 224
Table of Contents 1 PUBLIC FINANCE AND BUDGET MANAGEMENT REFORMS 6 2 TREND OF STATE BUDGET 2002 - 2006 8 3 MACRO-BUDGETARY FRAMEWORK 2007-2011 13
3.1 BUDGETARY RESOURCES 2007-2011 13 3.2 BUDGETARY EXPENDITURES 2007-2011 15 3.3 BUDGETARY RESOURCES AND APPLICATION OF FUNDS 2007-2011 18
4 BUDGETARY ALLOCATIONS BY TYPE OF EXPENDITURE 2007 – 2011 21 5 SECTORAL BUDGETARY ALLOCATIONS 2007-2011 29
5.1 OVERVIEW 29 5.2 EDUCATION 31
5.2.1 Basic Education Component 31 5.2.2 General Secondary Education (ESG), Technical and Vocational Education (ETP), and Apprenticeship Component 33 5.2.3 Higher Education and Research Component 35 5.2.4 General Administration Component 35
5.3 HEALTH 36 5.3.1 Sub-Component 1: Geographic accessibility to health services in health districts: 37 5.3.2 Sub-Component: Availability, Quality and Management of Human Resources 37 5.3.3 Sub-Component 3: Availability of Drugs, Vaccines and Medical Consumables 37 5.3.4 Sub-Component 4: Improvement of quality of health services, increase in demand and control of diseases 37 5.3.5 Sub-Component 5: Financial accessibility and support to demand and participation 38 5.3.6 Sub-component 6: Reform of hospital and other research institutions 38 5.3.7 Sub-Component 7: Institutional capacity building and decentralization 38
5.4 OTHER SOCIAL SECTORS 38 5.4.1 Sub-Component 1: Strengthening of Solidarity and Fight against Exclusion 39 5.4.2 Sub-component 2: Poverty Reduction 39 5.4.3 Sub-Component 3: Reinforcement of Social Security 39 5.4.4 Sub-Component 4: Institution Building 39 5.4.5 Sub-Component 5: Human Resource Development 40
5.5 CONDITIONS FOR BUDGET SUPPORT (SOCIAL SECTOR) 40 5.6 CULTURE, YOUTH AND SPORTS 44
5.6.1 Pillar I: Socio-education supervision of youths: 44 5.6.2 Pillar II: Youths and Social Vulnerability: 44 5.6.3 Pillar III: Youths and Socio-economic Integration: 44 5.6.4 Pillar IV: Capacity building for youth associations in mobilization, citizenship and participation in public life 45 5.6.5 Pillar V: Institution Building 45
5.7 RURAL DEVELOPMENT AND ENVIRONMENT 45 5.8 TRANSPORT 45
5.8.1 Pillar 1: Internal accessibility of Mali – Rural Transport (roads – river ways) 46 5.8.2 Pillar 2: Internal Accessibility of Mali - urban and interurban transport (Roads, Rail, Air) 47 5.8.3 Pillar 3: External Accessibility of Mali (Roads-Rail-Air) 47 5.8.4 Pillar 4: Maintain and preserve infrastructure and equipment of the rural network (roads - river ways) 48 5.8.5 Pillar 5: Maintain and preserve infrastructures and equipment of the urban network 49 5.8.6 Pillar 6: Maintain and preserve infrastructures and equipment of the interurban network 49 5.8.7 Pillar 7: Capacity building for the institution and human resources 49 5.8.8 Pillar 8: Improve levels of services, safety and security of transport and performance of BET/PME 50
5.9 TOWN PLANNING AND PUBLIC WORKS 50 5.10 COMMUNICATION 51 5.11 ARMED FORCES AND SECURITY 51
5.11.1 Armed Forces 51 5.11.2 Internal Security and Civil Protection 51
5.12 DEBT - PRINCIPAL AND INTEREST 51 5.13 MINING – WATER RESOURCES AND INDUSTRY 51
5.13.1 Mining 52 5.13.2 Energy 52
MTBF RSP 2007 – 2011 Page 3 of 224
5.13.3 Water 53 5.14 PUBLIC AUTHORITIES AND ADMINISTRATION 53 5.15 DIPLOMACY AND FOREIGN AFFAIRS 56
6 ANNEXES 58 6.1 ANNEX 1: PRESENTATION OF THE OPERATIONALIZATION AND INTERNALIZATION LOGICAL FRAMEWORK OF THE MTBF PROCESS 58 6.2 ANNEX 2: SOME PROJECTS ILLUSTRATING EXTENSION OF PROJECTS/PROGRAMMES 59 6.3 ANNEX 3: CONTRIBUTION OF MALIAN MINING COMPANIES TO BUDGETARY REVENUE 2002-2006 60
Table of Tables TABLE 1: GOVERNMENT FLOW OF FUNDS TABLE (GFFT) 2002-2006 IN CFAF BILLION 9 TABLE 2: MACRO-BUDGETARY PERFORMANCE 2002-2006 10 TABLE 3: COMPARISON OF BUDGETARY ALLOCATIONS (INCLUDING EXTERNAL FINANCING) AND BREAKDOWN OF
BUDGETARY EXPENDITURES IN THE PRSP: 2002-2006 11 TABLE 4: COMPARISON OF EXTERNAL FINANCING OF FINANCE LAW AND PRSP (2002 - 2005) IN CFAF BILLION 12 TABLE 5: TOTAL REVENUE 2006-2011 (DGB PRESENTATION) (IN CFAF BILLION) 14 TABLE 6: BUDGETARY REVENUE BY DEPARTMENT 2006-2011 (IN CFAF BILLION) 14 TABLE 7: TOTAL REVENUE 2006-2011 IN CFAF BILLION 15 TABLE 8: TOTAL EXPENDITURE 2006-2011 (DGB PRESENTATION) IN CFAF BILLION 16 TABLE 9: TRANSITION FROM DGB PRESENTATION (FINANCE LAW) TO GFFT 17 TABLE 10: BUDGETARY EXPENDITURE 2006-2011 (GFFT PRESENTATION) 18 TABLE 11 : BREAKDOWN OF BUDGET SUPPORT BY PROGRAMME IN CFAF 18 TABLE 12: BUDGETARY RESOURCES AND APPLICATION OF FUNDS (GFFT) OF PRSP 2006-2011 IN CFAF BILLION 19 TABLE 13: EXPECTED MACRO-BUDGETARY PERFORMANCE 2006-2011 20 TABLE 14: BUDGET BREAKDOWN BY TYPE (DGB PRESENTATION) (IN CFAF BILLION) 2006 – 2011 21 TABLE 15: TREND OF TRANSFER EXPENDITURES 2006-2011 (IN CFAF BILLION) 24 TABLE 16: TREND OF HIPC EXPENDITURES 2006-2011 (IN CFAF BILLION) 25 TABLE 17: SECTORAL BREAKDOWN OF PROJECTS AND PROGRAMMES 26 TABLE 18: AVERAGE PROJECT AND PROGRAMMES DURATION 26 TABLE 19: SOME PROJECTS AND PROGRAMMES FOLLOWING EXTENSIONS OF COMPLETION DATES (IN CFAF MILLION) 26 TABLE 20: BREAKDOWN OF BSI (EXTERNAL FINANCING) BY AREA OF INTERVENTION 2006-2008 28 TABLE 21: SECTORAL BREAKDOWN OF EXPENDITURES (DGB PRESENTATION) 2006-2011 IN CFAF BILLION 29 TABLE 22: SECTORAL BREAKDOWN OF EXPENDITURES 2006-2011 IN % OF GDP 29 TABLE 23: SECTORAL BREAKDOWN OF EXPENDITURES 2006-2011 IN % OF TOTAL 30 TABLE 24: OVERALL RATIOS BY SECTOR 2006-2011 30 TABLE 25: RECURRENT COST RATIOS BY SECTOR 2006-2011 30 TABLE 26: TREND OF EDUCATION EXPENDITURE 2006-2011 (IN CFAF BILLION) 31 TABLE 27: TREND OF HEALTH EXPENDITURES (IN CFAF BILLION) 36 TABLE 28: COMMON CONDITIONS FRAMEWORK (EDUCATION) 41 TABLE 29: COMMON CONDITIONS FRAMEWORK (HEALTH AND SOCIAL) 42 TABLE 30: TREND OF BUDGETARY EXPENDITURE ON DECENTRALIZATION (IN CFAF THOUSAND) 55 TABLE 31: BUDGET TIMETABLE 58 TABLE 32: SOME PROJECTS ILLUSTRATING EXTENSIONS OF PROJECTS/PROGRAMMES 59 TABLE 33: SHARE OF MINING COMPANIES IN REVENUE OF DIRECTORATE GENERAL OF TAXES FROM 1 JANUARY 2002 TO
31 MARCH 2006 (IN CFAF BILLION) 61 TABLE 34: SITUATION OF GOLD PRODUCTION, PAYMENT OF DIVIDENDS AND AD VALOREM TAX TO DNDC 62 TABLE 35: CONTRIBUTION OF THE MINING SECTOR TO THE REVENUE OF DNDC FROM 1 JANUARY 2002 TO 31 MARCH
2006 (IN CFAF BILLION) 62 TABLE 36: EXEMPTIONS GRANTED TO MINING COMPANIES FROM 2002 TO 2005 (IN CFAF BILLION) 63 TABLE 37: CONTRIBUTION OF MINING SECTOR TO STATE BUDGETARY REVENUE FROM 1 JANUARY 2002 TO 31 MARCH
2006 (IN CFAF BILLION) 63
MTBF RSP 2007 – 2011 Page 4 of 224
ACRONYMS AE Académie d’Enseignement (Education Academy) AGEROUTE Agence d’Exécution des Travaux Routiers (Road Works Agency) ANICT Agence Nationale d'Investissement des Collectives Territoriales APC Skills Approach AR Road Authority ARV Anti-retrovirals BCEAO Central Bank of West African States BRVM Regional Stock Exchange CAD/DE Decentralization/Education Decentralization Support Unit CAF Functional Literacy Centre CAFÉ Women’s Apprenticeship Training Centre CAP Certificat d’Aptitude Professionnelle (Vocational School Certificate) CAP Centre d’Animation Pédagogique (Teachers’ Training Centre) CDI Documentation and Information Centre CED Development Education Centre CFAF Franc of the African Financial Community CNPAM Conseil National des Personnes Agées du Mali COMANAV Compagnie Malienne de Navigation CPS Planning and Statistics Unit CSAR Revitalized District Health Centre CSC District Health Centre CSCOM Community Health Centre CSREF Referral Health Centre DEF Diplôme d’Études Fondamentales (Primary School Certificate) DGABE Directorate General of Administration of State Property DGB Directorate General of the Budget DGD Directorate General of Customs DGDP Directorate General of Public Debt DGI Directorate General of Taxes DGMP Directorate General of Public Procurements DNDC National Directorate of Lands and Survey DNGM National Directorate of Geology and Mines DNM National Directorate of Mines DNPD National Directorate of Planning and Development DNR National Highways Directorate DNSI National Directorate of Statistics and Data Processing DNTCP National Directorate of the Treasury and Public Accounting DTCP Diphtheria Tetanus Whooping Cough Polio EAC Enquête Agricole et de Conjoncture EBES Children with Special Education Needs ECOWAS Economic Community of West African States EDSM Enquête Démographique et de Santé/Mali EMEP Enquête Malienne d’Évaluation de la Pauvreté EPH Public Hospital Institution FAFPA Fonds d’Appui à la Formation Professionnelle et à l’Apprentissage FAM Medical Assistance Fund GD Generic Drugs GDP Gross Domestic Product GFCF Gross Fixed Capital Formation GFFT Government Flow of Funds Table HIPC Heavily Indebted Poor Countries I/BIC Corporate Tax IAS Social Affairs Inspection ICO Islamic Conference Organization IGM Institut Géographique du Mali (Geographic Institute of Mali)

MTBF RSP 2007 – 2011 Page 5 of 224
IMF International Monetary Fund INFET National Equipment and Transport Training Institute IRVM Securities Income Tax LA Local Authority LSI Light and Sound Indicators MDRI Multilateral Debt Relief Initiative MDSSPA Ministry of Social Development, Solidarity and Old Persons MEF Ministry of the Economy and Finance MEFP Ministry of Employment and Vocational Training MEN Ministry of National Education MME_DNPD Macro-Economic Model of Mali by DNPD MPAT Ministry of the Plan and Territorial Development MS Ministry of Health MTBF Medium Term Budgetary Framework MTEF Medium Term Expenditure Framework PAGAMGFP Government Action Plan for the Improvement and Modernization of
Public Finance Management PARAD Administrative Reform and Decentralization Support Programme PASAOP Agricultural Services and Farmer Organizations Support Programme PDDSS Ten-year Socio-Health Development Plan PDI Institutional Development Programme PDS Health Development Project PISE Education Sector Investment Programme PMA Minimum Activities Package PNG Government Net Position PNIR National Rural Infrastructure Programme PRODEC Ten-year Education Development Programme PRODEJ Ten-year Justice Development Programme PRODESS Social and Health Development Programme PRSP Poverty Reduction Strategy Paper RNDB Gross National Disposable Income SiSo Social Information System SPB Special Capital Budget VAT Value Added Tax WAEMU West African Economic and Monetary Union

MTBF PRSP 2007 – 2011 Page 6 of 224
1. PUBLIC FINANCE AND BUDGET MANAGEMENT REFORMS 1. During PRSP I, significant progress was made in public finance management, as well as
macro-economic and macro-budget planning through: (i) implementation of Programme Budgets (MTEF); (ii) implementation of expenditure procedures manuals; (iii) interconnection of computer networks of administrative services responsible for implementing the State Budget; (iv) introduction of a new budget nomenclature and reinforcement of controls; (v) establishment of a macro-economic and macro-budget model, as well as the creation of a Forecasts and Modelling Committee in 2003.
2. With respect to public expenditure, stringent management helped to maintain the budget position in line with the objectives of the IMF programme. Recurrent and capital expenditure was maintained within the limits of the programme. Delays in disbursements of external aid led to a decline in the volume and rate of implementation of the Special Investment Budget (BSI).
3. Throughout PRSP I, Mali complied with most of the WAEMU convergence criteria (base budget balance excl. HIPC, public investment rate, inflation rate, wage bill in percentage of budgetary revenue). However, this could not significantly reduce the level of poverty mainly because of the inadequate level of growth. Non-compliance with the tax pressure rate criterion show that considerable efforts still have to be made in the mobilization of internal budgetary resources.
4. In April 2005, the Government adopted a Government Action Plan for the Improvement and Modernization of Public Finance Management (PAGAMGFP). In this connection, actions will be undertaken to: (i) adapt and modernize the General Public Finance Framework, (ii) enhance governance and transparency, (iii) increase the efficiency of tax and financial administrations, (iv) increase the quality of budget preparation and implementation, (v) include external financing in national budget procedures, (vi) interconnect computerized public expenditure management systems, (vii) improve the performance of Departments of Administrative and Financial Affairs (DAF), (viii) enhance the efficiency of public procurements, and (ix) provide continuous training to financial employees.
5. Sustainable improvement of the Government’s financial situation will remain a key component of budget management. The objective is to contain the overall deficit of the Government’s financial operations to a sustainable level, while taking charge of pressing needs in priority sectors, as well as to create a “budget space” for achieving poverty reduction objectives.
6. The budget policy will continue to be marked by adjustment efforts to: (i) improve revenue, (ii) control public expenditure, and (iii) search for external financing in accordance with budget support conditions and the conclusions of the Geneva Round Table in March 2004.
7. Budget support is the instrument for financial cooperation between the Government of Mali and the Technical and Financial Partners, which makes it possible to: (i) better coordinate their activities, (ii) gradually replace the multiplicity of donor procedures with national procedures, and (iii) consider concrete means of harmonizing programmes and procedures, so as to prepare a gradual reorientation of part of international aid in the form of programme aid transiting through the budget.
8. This Medium Term Budgetary Framework contributes to the improvement of budget management by providing a document that gives a vision of the trend of medium-term revenue and expenditure so as to: (i) strengthen the results-based management mechanisms, (ii) seek greater efficiency in expenditure, and (iii) have a support tool for

MTBF PRSP 2007 – 2011 Page 7 of 224
decision-making and negotiation with development partners in the search for financing for development programmes.
9. The Medium Term Budgetary Framework is the principal means of operationalizing the PRSP document. This framework determines budgetary aggregates in line with the macro-economic framework and strategies and guidelines defined in the PRSP. The MTBF presents the macro-economic framework on the basis of which the budget programming of revenue and expenditure is conducted. It determines the overall sector allocations, as well as the policies of strategies and actions envisaged in the various sectors.
10. Estimates of total expenditure and net loans are fully consistent in the macro-economic framework and overall MTBF. The macro-budgetary framework provides for an increase in total expenditure and net loans at an average annual rate of 7.1% to CFAF 1,216.7 billion in 2011. Budgetary expenditure will represent an average of 28.1% of GDP, as against 27.5% of GDP over the 2002-2005 period. These indicators reflect a prudent budget policy, based on the mobilization of national resources. Emphasis will be laid on the search for greater efficiency in expenditure, which could be achieved through deconcentration of budgetary allocations at the operational level so as to further increase the impact of Government interventions on the living conditions of the populations.
11. The results of the MME_DNPD voluntarist scenario show total revenue (excluding grants) of CFAF 896.3 billion in 2011, as against CFAF 540.0 in 2006, representing an average annual increase rate of 10.7% (as against 13.0% in 2002-2005). Tax revenue would increase at an average annual rate of 10.5%. Consequently, the tax pressure rate would improve rapidly, and stand at 17% as from 2008 (an average of 16.6% between 2007 and 2011), as against an average of 14.6% between 2002 and 2005. The Community standard would therefore be respected as from 2008. The base macro-economic scenario stems from the more modest assumption that the tax pressure rate would increase gradually to 17% in 2011.
12. As for the wage bill, it would increase from CFAF 149 billion in 2006 to CFAF 222.6 billion in 2011, representing an average increase rate of 8.4% as against 12.6% in 2002-2005. It would account for an average of 29.2% of tax revenue between 2007 and 2011, as against 30.7% between 2002 and 2005. Consequently, the WAEMU target of less than 35% would be amply achieved. This also applies to the base budget balance target, which should be positive. The ratio of this balance to GDP stands at an average annual rate of 0.9% in 2007-2011 as against 0.2% between 2002 and 2005. The third WAEMU criterion is also observed, namely the ratio of public investments financed by internal resources to GDP, which is fixed at a minimum of 20%. Budget estimates show an average ratio of 22.5% over the 2007-2001 period, as against 21.9% in 2002-2005.
MTBF PRSP 2007 – 2011 Page 8 of 224
2. TREND OF STATE BUDGET 2002 - 2006 13. The budget policy over the 2002-2006 period was aimed at containing budget deficit and
making significant public investments, to ensure recovery of economic activities and improvement of the living conditions of the population.
14. The period was marked by a low taxing rate by assessment services; the tax pressure rate was 13.8% in 2002 and 14.7% in 2006. The total revenue and grants increased from CFAF 456.7 billion in 2002 to CFAF 1,740 billion in 2006 because of the restructuring of the MDRI debt (1,035.7), while the total expenditure and net loans increased from CFAF 541 billion in 2002 to CFAF 865.6 billion in 2006. This expenditure trend is due to poverty reduction expenditure and exceptional expenditures.
15. Public finance adjustment efforts increased the primary budget balance deficit from CFAF 29.8 billion in 2002 to CFAF 44.9 billion in 2006. As for the overall balance commitment base, it has continued to record a deficit from CFAF 84.3 billion in 2002 to CFAF 874.4 billion in 2006.
16. Budget allocations in the Finance Law increased from CFAF 679.3 billion to CFAF 935.8 billion in 2006, representing an average increase of 8.3% over the 2002-2006 period. The implementation level of budget allocations rose from CFAF 591.6 billion in 2002 to CFAF 774.1 billion in 2005, representing an average increase of 9.5%.
17. The external financing of the Finance Law increased from CFAF 208.3 billion in 2002 to CFAF 231.6 billion in 2006, representing an average increase of 3.6%. Its implementation level rose from CFAF 140.7 billion in 2002 to CFAF 179.8 billion in 2005, representing an average increase of 9.2%.
18. Between 2000 and 2005, Mali obtained a total HIPC debt relief of CFAF 141.97 billion, comprising CFAF 29.05 billion for the IMF, CFAF 48.57 billion for IDA, CFAF 16.66 billion for the Paris Club, and CFAF 26.83 billion for ADB/ADF.

MTBF PRSP 2007 – 2011 Page 9 of 224
Table 21: Government Flow of Funds Table (GFFT) 2002-2006 in CFAF billion
2002 2003 2004 2005 2006 Total revenue and grants 456.7 534.0 557.9 621.6 1,740.0 Total revenue 370.9 421.7 454.6 506.6 540.0 Budgetary revenue 337.2 384.3 412.0 461.3 497.5 Tax revenue Additional measures Non-tax revenue
306.0 0.0
31.2
349.1 0.0
35.2
393.3 0.0
18.7
446.2 0.0
15.1
469.9
Sp. Fd & suppl. Budgets Revenue 33.7 37.4 42.6 45.3 42.5 Grants 85.8 112.3 103.3 115.0 1,200.0 Grants for projects 69.2 60.7 70.0 70.0 81.3 Budgetary grants 16.6 51.6 33.3 45.0 35.8 Sectoral budget support 0.0 0.0 0.0 0.0 47.2 MDRI debt restructuring 0.0 0.0 0.0 0.0 1,035.7 Expenditure and net loans 541.0 552.0 626.1 714.9 865.6 Budgetary expenditures 512.2 518.5 592.5 646.9 828.7 Current expenditures 309.2 316.9 350.3 378.8 427.0 Salaries 93.5 106.2 121.7 137.8 149.0 Goods and services 109.0 107.7 136.5 140.9 161.1 Transfers and subsidies 87.8 83.8 74.5 79.6 96.8 Interests due 18.9 19.2 17.6 20.5 20.1 Internal debt External debt
2.1 16.8
3.3 15.9
1.5 16.1
2.3 18.2
2.6 17.5
Capital expenditure 203.0 201.6 242.2 268.1 401.7 External financing Borrowings Overall grants Sectoral budget support Internal financing 1)
140.3 71.1 69.2
0.0 62.7
123.3 62.6 60.7
0.0 78.3
152.8 82.8 70.0
0.0 89.4
170.0 100.0
70.0 0.0
98.1
280.7 152.2 81.3 47.2
121.0
Sp. Fd & Suppl. Budgets Expend. 33.7 37.4 42.6 45.3 42.5 Net loans -4.9 -3.9 -9.0 22.7 -5.6 Primary budget balance (IMF 2) Overall balance (commits, excl. grants)
-29.8 -170.1
-7.0 -130.3
-18.7 -171.5
-38.3 -208.3
-44.9 -325.6
Overall balance (commitments) -84.3 -18.0 -68.2 -93.3 874.4 Adjustment -1.5 11.0 7.9 -10.3 0.0 Overall balance (cash base & excl. grants) -171.6 -119.3 -163.6 -218.6 -325.6 Overall balance (cash base) -85.8 -7.0 -60.3 -103.6 874.4 FINANCING 85.8 7.0 60.3 103.6 874.4 Net external financing 88.5 90.8 74.5 103.4 -845.1 Borrowings Projects Budgetary loans Amortization Debt/HIPC settlement
102.6 71.1 31.5
-41.6 27.5
97.5 62.6 34.9
-36.8 30.1
82.8 82.8
0.0 -37.0 28.7
119.36 100.30
19.3 -40.5 24.6
200.7 152.2
-1,071.7 25.9
Net internal financing -2.7 -83.8 -14.2 0.1 -43.1 Bank (net) Privatization revenue Other financing
-9.9 29.4
-22.2
-49.6 1.0
-35.2
14.4 1.2
-29.8
33.1 9.7
-42.7
-34.0 8.1
-7.2 Gov’t financing gap (+=deficit) 0.0 0.0 0.0 0.0 13.8 2) Banking sector and private sector 3) Revenue (excl. grants) less total expenditure (incl. net loans) (excl. capital expenditure with external financing) Source: DGD/DNPD

MTBF PRSP 2007 – 2011 Page 10 of 224
Table 22: Macro-budgetary Performance 2002-2006
2002 2003 2004 2005 2006
Resources and Appl. of Funds for Goods & services Réal. Réal. Réal. Prov. Estim.GDP at market prices (current CFAF billion) 2,222.7 2,453.6 2,632.1 2,892.9 3,205.8Real growth rate of GDP at market prices 4.4% 7.7% 2.8% 6.1% 3.6%Fixed investment rate GFCF/GDPm) 19.8% 18.0% 17.0% 15.4% 20.9%-Public GFCF in % of GDPm 7.8% 7.5% 7.4% 6.9% 10.0%-Private GFCF in % of GDPm 12.0% 10.5% 9.6% 8.5% 11.0%Consumption rate (in % of GDPm) 85.7% 81.5% 86.2% 85.9% 84.1%-Private consumption rate 75.2% 70.0% 74.4% 74.1% 71.2%-Public consumption rate 10.5% 11.5% 11.8% 11.7% 12.9%Per capita Gross National Product in current CFAF 199,502 223,302 230,402 247,176 269,324Per capita real growth rate of Gross National Product 0.1% 8.6% -1.7% 3.4% 2.5%
Public Finances 2002 2003 2004 2005 2006Tax pressure rate (=Tax revenue/GDPm) 13.8% 14.2% 14.9% 15.4% 14.7%Tax rate (current revenue, excl. grants, in % of GDP) 16.7% 17.2% 17.3% 17.5% 16.8%Tax rate (current revenue in % of GDP formal sector) 45.0% 52.6% 46.1% 47.3% 49.0%Total expenditure and net loans, in % of GDP 24.3% 22.5% 23.8% 24.7% 27.0%Balance of current operations (national public savings) in % of GDP 5.9% 8.2% 7.3% 7.8% 40.5%Balance of current operations (own savings) in % of GDP 2.8% 4.3% 4.0% 4.4% 3.5%Primary budget balance (IMF) in % of GDP 1.0% 2.0% 1.6% 1.0% 0.6%Primary budget balance (WAEMU) in % of GDP -0.1% 0.9% 0.4% -0.5% -0.6%Total balance (commitment base) excl. grants in % of GDP -7.7% -5.3% -6.5% -7.2% -10.2%Total balance (cash base) in % of GDP -3.9% -0.3% -2.3% -3.6% 27.3%
External Aid 2002 2003 2004 2005 2006External aid (gross) in % of GDP 9.7% 9.8% 8.2% 9.0% 46.5%External aid (gross) in US$ million 310.8 413.8 407.1 496.5 2853.8
WAEMU Convergence Criteria 2002 2003 2004 2005 2006First rank criteriaBase budget balance/GDPm ratio >=0 -0.1% 0.9% 0.4% -0.5% -0.6%Inflation rate (IHPC Bamako) <= 3% 5.1% -1.3% -3.1% 6.4% 2.4%Outstanding internal and external debt/GDPm ratio <= 70% 0.0% 0.0% 0.0% 0.0% 0.0%Incl. outstanding external debt/GDPm 74.2% 59.0% 63.9% 60.0% 23.3%Variation of internal arrear payments (in CFAF billion) <= 0 0.0 0.0 0.0 0.0 0.0Variation of external arrear payments (in CFAF billion) <= 0 0.0 0.0 0.0 0.0 0.0Second rank criteria 0.0 0.0 0.0 0.0Wage bill/tax revenue ratio <= 35 30.6% 30.4% 30.9% 30.9% 31.7%Public investments financed with internal resources/tax revenue ratio >= 20% 20.5% 22.4% 22.7% 22.0% 25.8%Current external deficit excl. public transfers/GDPm ratio <= 5% -6.1% -9.2% -10.2% -9.1% -7.4%Tax pressure rate (=Tax revenue/GDPm) >= 17% 13.8% 14.2% 14.9% 15.4% 14.7% 1) Revenue (excl. grants) less total expenditure (incl. net loans) (excl. capital expenditure with external financing and excl. HIPC) /GDPm
2) Here only BSI investment.
Source: DNPD/DGB

MT
BF
PRSP
200
7 –
2011
Pa
ge 1
1 of
224
Tab
le 2
3: C
ompa
riso
n of
Bud
geta
ry A
lloca
tions
(inc
ludi
ng e
xter
nal f
inan
cing
) and
Bre
akdo
wn
of B
udge
tary
Exp
endi
ture
s in
the
PRSP
: 200
2-20
06
Publ
ic
Aut
horit
ies
Gen
. A
dmin
istra
tion
73.5
29
73.7
53
53.1
56
20.5
97
67.8
4 85
.7
65.8
34
19.8
66
75.4
43
94.3
17
67.0
35
27.2
82
96.8
08
103.
396
89.3
08
14.0
88
115.
695
115
695
0
DES
CR
IPTI
ON
LF
(1)
PRSP
(2)
EXEC
(3
)
GA
P (2
-3)
LF (1
) PR
SP
(2)
EXEC
(3
)
GA
P (2
-3)
LF (1
) PR
SP
(2)
EXEC
(3
)
GA
P (2
-3)
LFC
1
PRSP
2 EX
EC 3
G
AP2
-3
LF 1
PR
SP
(2)
GA
P (1
-2)
Dip
lom
acy
Fore
ign
Aff
airs
11
.798
12
.836
10
.949
1.
887
12.8
41
14.5
64
12.1
61
2.40
3 13
.098
16
.155
12
.904
3.
251
14.5
88
17.9
35
14.4
62
3.47
3 16
.714
16
.714
0
Nat
iona
l D
efen
ce
Inte
rnal
Sec
urity
44.4
94
44.7
12
45.7
62
-1.0
5 48
.63
47.3
14
51.6
71
-4.3
57
55.3
09
49.3
75
54.4
76
-5.1
01
63.2
01
51.9
7 60
.807
-8
.837
68
.919
68
.919
0
Bas
ic E
duca
tion
51.9
63
48.7
75
53.1
1 -4
.335
74
.305
54
.502
62
.2
-7.6
98
89.6
52
59.2
85
84.6
17
- 25.3
32
96.0
04
62.9
07
81.4
17
-18.
51
119.
322
119.
322
0
Seco
ndar
y an
d H
ighe
r Ed
ucat
ion
26.6
03
29.2
98
26.6
01
2.69
7 28
.347
31
.731
28
.047
3.
684
29.4
09
33.7
73
27.7
56
6.01
7 32
.699
37
.059
31
.355
5.
704
39.1
68
39.1
68
0
Cul
ture
You
th
and
Spor
ts
6.29
7 6.
678
5.64
9 1.
029
7.90
7 7.
809
7.39
9 0.
41
9.71
7 8.
647
9.45
5 -0
.808
11
.334
9.
52
10.7
8 -1
.26
13.0
51
13.0
51
0
Hea
lth
39.3
76
39.6
66
32.5
82
7.08
4 52
.093
43
.543
33
.925
9.
618
53.4
36
46.6
18
41.7
85
4.83
3 57
.1
50.1
56
48.2
73
1.88
3 72
.684
72
.684
0
Soci
al S
ecto
rs
16.9
28
11.9
37
12.5
29
-0.5
92
17.1
32
13.2
93
17.9
83
-4.6
9 28
.439
14
.677
27
.971
- 13
.294
33
.044
15
.587
30
.671
- 15
.084
27
.849
27
.849
0
Empl
oym
ent
0.7
0.75
3 0.
659
0.09
4 1.
948
1.24
2 1.
676
-0.4
34
3.64
8 1.
514
3.14
1 -1
.627
5.
194
1.60
5 4.
725
-3.1
2 7.
636
7.63
6 0
Agr
icul
ture
11
0.53
6 10
5.05
9 85
.932
19
.127
11
4.55
4 89
.717
66
.151
23
.566
11
8.86
2 86
.184
72
.405
13
.779
14
3.68
4 91
.201
11
6.15
9 - 24
.958
11
8.28
3 11
8.28
3 0
Min
es
Wat
er R
esou
rces
In
dust
ry
32.7
16
32.8
16
22.4
14
10.4
02
26.5
78
26.3
31
20.4
59
5.87
2 27
.834
31
.388
16
.318
15
.07
41.9
19
36.7
18
25.8
41
10.8
77
53.8
59
53.8
59
0
Tow
n Pl
anni
ng
Publ
ic W
orks
65
.341
66
.942
65
.877
1.
065
87.1
72
73.5
02
79.8
43
-6.3
41
88.1
58
76.3
27
63.6
03
12.7
24
83.6
22
80.2
78
85.9
89
-5.7
11
99.2
17
99.2
17
0
Tran
spor
t 17
.053
17
.998
11
.547
6.
451
10.6
55
23.5
01
4.62
8 18
.873
15
.301
24
.813
17
.4
7.41
3 11
.34
28.8
99
8.95
8 19
.941
10
.57
10.5
7 0
Com
mun
icat
ion
6.28
7 6.
424
3.93
3 2.
491
9.77
1 7.
984
9.1
-1.1
16
8.93
1 8.
899
13.1
37
-4.2
38
10.0
9 9.
812
7.25
9 2.
553
9.1
9.1
0 In
tern
al d
ebt
6.82
7.
37
8.54
7 -1
.177
13
.04
14.8
8 8.
067
6.81
3 1.
748
14.8
8 12
.986
1.
894
1.88
14
.88
1.36
6 13
.514
1.
637
1.63
7 0
Exte
rnal
deb
t 58
.666
54
.484
57
.665
-3
.181
63
.449
72
.517
42
.812
29
.705
74
.5
74.5
46
.46
28.0
4 81
.406
82
.593
76
.17
6.42
3 79
.053
79
.053
0
Una
lloca
ted
fund
s 11
0.22
4 93
.997
94
.644
-0
.647
10
1.29
91
.749
10
9.11
6 - 17
.367
93
.713
97
.91
86.5
42
11.3
68
66.7
18
102.
038
80.5
81
21.4
57
83.0
02
83.0
02
0
TOTA
L B
UD
GET
AR
Y
EXPE
ND
ITU
RE
679.
331
653.
498
591.
556
61.9
42
737.
552
699.
879
621.
072
78.8
07
787.
198
739.
262
657.
991
81.2
71
850.
631
796.
554
774.
121
22.4
33
935.
759
935.
759
0

MT
BF
PRSP
200
7 –
2011
Pa
ge 1
2 of
224
Tab
le 2
4: C
ompa
riso
n of
Ext
erna
l Fin
anci
ng o
f Fin
ance
Law
and
PR
SP (2
002
- 200
5) in
CFA
F bi
llion
D
ESC
RIP
TIO
N
LF(1
) PR
SP(2
) EX
EC
(3)
GA
P (2
-3)
LF (1
) PR
SP (2
) EX
EC (3
) G
AP
(2-
3)
LF (1
) PR
SP (2
) EX
EC (3
) G
AP
(2-
3)
LF 1
PR
SP
(2)
EXEC
(3
)
GA
P (1
-2)
Pu
blic
Aut
horit
ies
Gen
. Adm
inis
tratio
n 21
.5
21.5
11
.7
9.8
16.2
21
.5
14.5
7
12.7
21
.5
6.5
15
16.5
21
.5
12.8
8.
7
Dip
lom
acy
Fore
ign
Aff
airs
0
0 0
0 0
0 0
0 0
0 0
0 0
0 0
0
Nat
iona
l Def
ence
In
tern
al S
ecur
ity
0 0
0 0
0 0
0 0
0 0
0 0
0.1
0 0.
1 -0
.1
Bas
ic E
duca
tion
10
.4
6.4
10.2
-3
.8
23.1
6.
3 12
.4
-6.1
29
.8
6.4
26.9
-2
0.5
26.1
6
16.8
-1
0.8
Seco
ndar
y an
d H
ighe
r Edu
catio
n 0.
8 4.
9 0.
4 4.
5 0.
1 4.
9 0.
1 4.
8 0.
1 4.
7 0
4.7
0 4.
9 0
4.9
Cul
ture
You
th a
nd
Spor
ts
0.5
0.5
0.1
0.4
0.4
0.5
0 0.
5 0.
1 0.
4 0
0.4
0.2
0.5
0.1
0.4
Hea
lth
18
18.1
12
.1
6 25
.1
18
9.7
8.3
19.8
18
11
.8
6.2
20.1
18
15
.1
2.9
Soci
al S
ecto
rs
6.
6 6.
6 7.
4 -0
.8
4.6
6.6
5.5
1.1
4.9
6.6
4.5
2.1
8.3
6.6
6 0.
6 Em
ploy
men
t 0
0.1
0 0.
1 0
0 0
0 0
0 0
0 0
0 0
0 A
gric
ultu
re
59.4
59
.5
35.5
24
71
.7
59.4
33
.4
26
87.3
59
.4
44.4
15
83
.7
59.4
59
.9
-0.5
M
ines
W
ater
Res
ourc
es
Indu
stry
26.9
26
.9
17.1
9.
8 18
.8
19.2
13
.2
6 13
.1
23.6
6.
8 16
.8
24.7
28
15
.4
12.6
Tow
n Pl
anni
ng
Publ
ic W
orks
52
.1
52.1
43
.1
9 51
.3
52.1
48
.1
4 55
.3
52.1
33
.3
18.8
46
.5
52.1
51
.9
0.2
Tran
spor
t 7.
7 6.
8 2.
7 4.
1 4.
2 18
.1
1.3
16.8
0
7.7
0.8
6.9
2 6.
9 0.
9 6
Com
mun
icat
ion
2.6
2.6
0.4
2.2
3.1
1.7
3.2
61.5
3.
1 2.
6 7.
2 -4
.6
3.4
2.6
0.8
1.8
Inte
rnal
deb
t 0
0 0
0 0
0 0
0 0
0 0
0 0
0 0
0 Ex
tern
al d
ebt
0 0
0 0
0 0
0 0
0 0
0 0
0 0
0 0
Una
lloca
ted
fund
s 1.
8 0.
9 0
0.9
0 0
0 0
0 1.
9 0
1.9
0 2
0 2
TOTA
L B
UD
GET
EX
PEN
DIT
UR
E 20
8.3
206.
9 14
0.7
66.2
21
8.6
208.
3 14
1.4
66.9
22
6.2
204.
9 14
2.2
62.7
23
1.6
208.
5 17
9.8
28.7

MTBF PRSP 2007 – 2011 Page 13 of 224
3. MACRO-BUDGETARY FRAMEWORK 2007-2011 19. The economic situation of Mali in recent years has been marked by the Ivorian crisis
which started in 2002, the decline in gold production in 2003, the desert locust invasion in 2004, and the low rainfall during the 2004/2005 season. However, the expected average growth rate would be 7% over the 2007-2011 period, as against 5.2% between 2002 and 2005.
20. Budget programming is based on determining the State revenue, calculating allocations taking into account the objectives of the budget policy, and determining the budget deficit in line with the macro-economic framework.
3.1 Budgetary Resources 2007-2011 21. The resources of the 2007 State Budget amount to CFAF 885.3 billion. In 2008, 2009,
2010 and 2011, the resources should increase to CFAF 947.8 billion, CFAF 1,019.7 billion, CFAF 1,118.2 billion and CFAF 1,209.8 respectively, representing an increase rate of 7.1% in 2007, 7.6% in 2008, 9.7% in 2009 and 8.2% in 2010 respectively.
22. To achieve the above resource estimates, the tax assessment and collection services will continue to optimize the current collection systems, while developing new initiatives.
23. As regards internal taxation, the strengthening of fiscal control and operations to broaden the taxation base initiated five years ago will be maintained and implemented as effectively as possible through new measures. These measures will result in:
• broadening the tax base: the strategy will centre on mobilizing the overall potential of the national economy;
• proper identification and information of taxpayers, that will help to limit tax evasions; • improvement of the efficiency of collection services: modernization of the taxation
administration, adaptation of the tax laws to the taxable event, and reinforcement of the system of tax deducted at source;
• reorganization of the tax administration; • intensification of the fight against fraud; • closer monitoring of the mining sector; • conduct of periodic controls to ensure strict application of penalties; • improvement of collection of parol tenancy taxes; • positive impacts of some ongoing reforms of the General Tax Code (introduction of
the Simplified Tax System); • better management of the petroleum products taxation mechanism; • control of customs exemptions; • improvement of implementation of the Imports Verification Programme (PVI); • capacity building for tax assessment and collection services; • improvement in the processing of tax declarations for products of WAEMU origin; • compliance with goods collection provisions.

MTBF PRSP 2007 – 2011 Page 14 of 224
Table 25: Total Revenue 2006-2011 (DGB Presentation) (in CFAF billion)
2006 2007 2008 2009 2010 2011 TAX REVENUE NON-TAX REVENUE EXCEPTIONAL REVENUE SPECIAL INVESTMENT BUDGET BUDGET SUPPORT SUPPL. BUDGETS SP. ACCOUNTS AND FUNDS
487.523 41.234 25.907
233.465 47.224
5.387
534.482 39.568 10.472
245.899 49.227
5.672
580.171 46.943 10.660
268.400 35.503
6.091
630.090 49.779 11.225
290.300 31.751
6.541
689.993 57.373 12.141
317.200 34.702
6.785
755.739 53.260 11.125
345.300 37.145
7.204 TOTAL 840.740 885.320 947.768 1,019.685 1,118.195 1,209.772
Source: DGB, DNDC, DNTCP, DNPD, DGABE, DGD, DGI and DGDP
Chart 8: Trend of Tax and Non-tax Revenue 2006-2011 (in CFAF billion)
Tax revenue will increase over the 2007-2011 period as indicated in Chart 1, while non-tax revenue will remain stable linearly over the same period. The budgetary revenue, by collection service, is as follows for the period:
Table 26: Budgetary Revenue by Department 2006-2011 (in CFAF billion)
SERVICES 2006 2007 2008 2009 2010 2011 Directorate General of Customs Directorate General of Taxes National Directorate of the Treasury and Public Accounting Directorate General of State property Management 3/ Directorate General of Lands and Survey Directorate General of Public Debt 2/
244.100 215.133 19.878
8.070 36.000
5.576
265.628 237.647 18.609
8.070 38.520
5.576
293.900 254.896 21.915
3.000 49.405
3.998
317.500 280.386 23.011
3.000 51.555
4.417
348.400 308.424 24.162
8.000 54.122
4.258
382.300 339.267 25.369
1.000 57.021
4.042 TOTAL Budgetary Revenue (according to DGB) 528.757 574.050 627.114 679.869 747.366 808.999 TOTAL Budgetary Revenue (according to GFFT) 3/ 493.111 535.404 595.917 648.337 711.278 780.249 1/ Privatization revenue 2/ Net loans (neg) 3/ Total DGB – privatization revenue – net loans – reimbursement exemptions – reimbursement VAT credit
Source: DNDC, DGD, DGI, DNTCP, DGDP, DGABE
0 100 200 300 400 500 600 700 800
2006 2007 2008 2009 2010 2011
Tax Revenue Non-tax Revenue
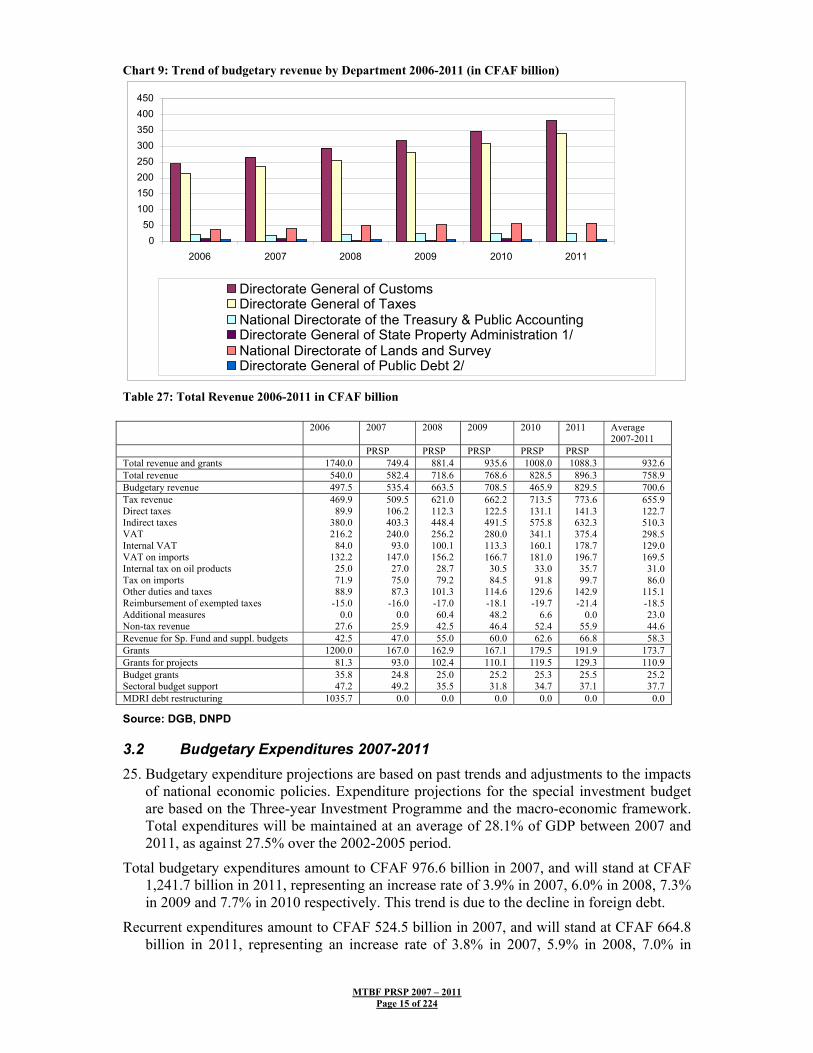
MTBF PRSP 2007 – 2011 Page 15 of 224
Chart 9: Trend of budgetary revenue by Department 2006-2011 (in CFAF billion)
Table 27: Total Revenue 2006-2011 in CFAF billion 2006 2007 2008 2009 2010 2011 Average
2007-2011 PRSP PRSP PRSP PRSP PRSP Total revenue and grants 1740.0 749.4 881.4 935.6 1008.0 1088.3 932.6 Total revenue 540.0 582.4 718.6 768.6 828.5 896.3 758.9 Budgetary revenue 497.5 535.4 663.5 708.5 465.9 829.5 700.6 Tax revenue Direct taxes Indirect taxes VAT Internal VAT VAT on imports Internal tax on oil products Tax on imports Other duties and taxes Reimbursement of exempted taxes Additional measures Non-tax revenue
469.9 89.9
380.0 216.2
84.0 132.2
25.0 71.9 88.9
-15.0 0.0
27.6
509.5 106.2 403.3 240.0
93.0 147.0
27.0 75.0 87.3
-16.0 0.0
25.9
621.0 112.3 448.4 256.2 100.1 156.2
28.7 79.2
101.3 -17.0 60.4 42.5
662.2 122.5 491.5 280.0 113.3 166.7
30.5 84.5
114.6 -18.1 48.2 46.4
713.5 131.1 575.8 341.1 160.1 181.0
33.0 91.8
129.6 -19.7
6.6 52.4
773.6 141.3 632.3 375.4 178.7 196.7
35.7 99.7
142.9 -21.4
0.0 55.9
655.9 122.7 510.3 298.5 129.0 169.5
31.0 86.0
115.1 -18.5 23.0 44.6
Revenue for Sp. Fund and suppl. budgets 42.5 47.0 55.0 60.0 62.6 66.8 58.3 Grants 1200.0 167.0 162.9 167.1 179.5 191.9 173.7 Grants for projects 81.3 93.0 102.4 110.1 119.5 129.3 110.9 Budget grants Sectoral budget support
35.8 47.2
24.8 49.2
25.0 35.5
25.2 31.8
25.3 34.7
25.5 37.1
25.2 37.7
MDRI debt restructuring 1035.7 0.0 0.0 0.0 0.0 0.0 0.0
Source: DGB, DNPD
3.2 Budgetary Expenditures 2007-2011 25. Budgetary expenditure projections are based on past trends and adjustments to the impacts
of national economic policies. Expenditure projections for the special investment budget are based on the Three-year Investment Programme and the macro-economic framework. Total expenditures will be maintained at an average of 28.1% of GDP between 2007 and 2011, as against 27.5% over the 2002-2005 period.
Total budgetary expenditures amount to CFAF 976.6 billion in 2007, and will stand at CFAF 1,241.7 billion in 2011, representing an increase rate of 3.9% in 2007, 6.0% in 2008, 7.3% in 2009 and 7.7% in 2010 respectively. This trend is due to the decline in foreign debt.
Recurrent expenditures amount to CFAF 524.5 billion in 2007, and will stand at CFAF 664.8 billion in 2011, representing an increase rate of 3.8% in 2007, 5.9% in 2008, 7.0% in
0 50
100 150 200 250 300 350 400 450
2006 2007 2008 2009 2010 2011
Directorate General of CustomsDirectorate General of TaxesNational Directorate of the Treasury & Public Accounting Directorate General of State Property Administration 1/ National Directorate of Lands and SurveyDirectorate General of Public Debt 2/
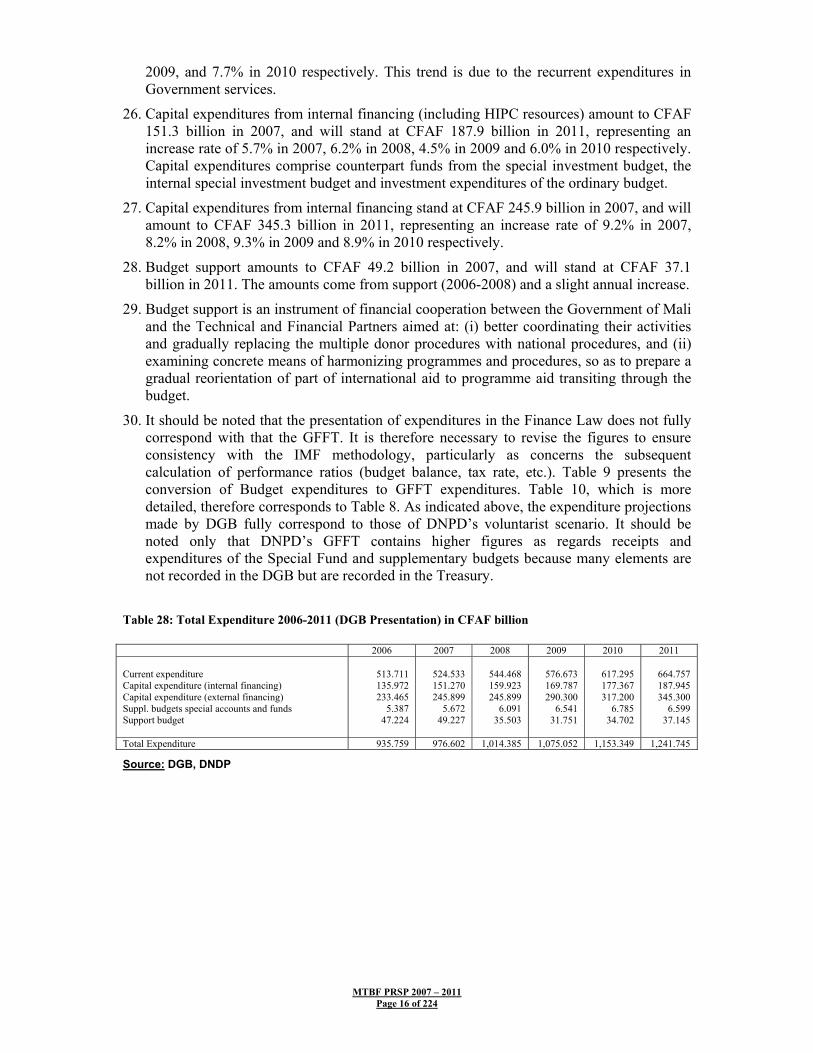
MTBF PRSP 2007 – 2011 Page 16 of 224
2009, and 7.7% in 2010 respectively. This trend is due to the recurrent expenditures in Government services.
26. Capital expenditures from internal financing (including HIPC resources) amount to CFAF 151.3 billion in 2007, and will stand at CFAF 187.9 billion in 2011, representing an increase rate of 5.7% in 2007, 6.2% in 2008, 4.5% in 2009 and 6.0% in 2010 respectively. Capital expenditures comprise counterpart funds from the special investment budget, the internal special investment budget and investment expenditures of the ordinary budget.
27. Capital expenditures from internal financing stand at CFAF 245.9 billion in 2007, and will amount to CFAF 345.3 billion in 2011, representing an increase rate of 9.2% in 2007, 8.2% in 2008, 9.3% in 2009 and 8.9% in 2010 respectively.
28. Budget support amounts to CFAF 49.2 billion in 2007, and will stand at CFAF 37.1 billion in 2011. The amounts come from support (2006-2008) and a slight annual increase.
29. Budget support is an instrument of financial cooperation between the Government of Mali and the Technical and Financial Partners aimed at: (i) better coordinating their activities and gradually replacing the multiple donor procedures with national procedures, and (ii) examining concrete means of harmonizing programmes and procedures, so as to prepare a gradual reorientation of part of international aid to programme aid transiting through the budget.
30. It should be noted that the presentation of expenditures in the Finance Law does not fully correspond with that the GFFT. It is therefore necessary to revise the figures to ensure consistency with the IMF methodology, particularly as concerns the subsequent calculation of performance ratios (budget balance, tax rate, etc.). Table 9 presents the conversion of Budget expenditures to GFFT expenditures. Table 10, which is more detailed, therefore corresponds to Table 8. As indicated above, the expenditure projections made by DGB fully correspond to those of DNPD’s voluntarist scenario. It should be noted only that DNPD’s GFFT contains higher figures as regards receipts and expenditures of the Special Fund and supplementary budgets because many elements are not recorded in the DGB but are recorded in the Treasury.
Table 28: Total Expenditure 2006-2011 (DGB Presentation) in CFAF billion
2006 2007 2008 2009 2010 2011 Current expenditure Capital expenditure (internal financing) Capital expenditure (external financing) Suppl. budgets special accounts and funds Support budget
513.711 135.972 233.465
5.387 47.224
524.533 151.270 245.899
5.672 49.227
544.468 159.923 245.899
6.091 35.503
576.673 169.787 290.300
6.541 31.751
617.295 177.367 317.200
6.785 34.702
664.757 187.945 345.300
6.599 37.145
Total Expenditure 935.759 976.602 1,014.385 1,075.052 1,153.349 1,241.745
Source: DGB, DNDP
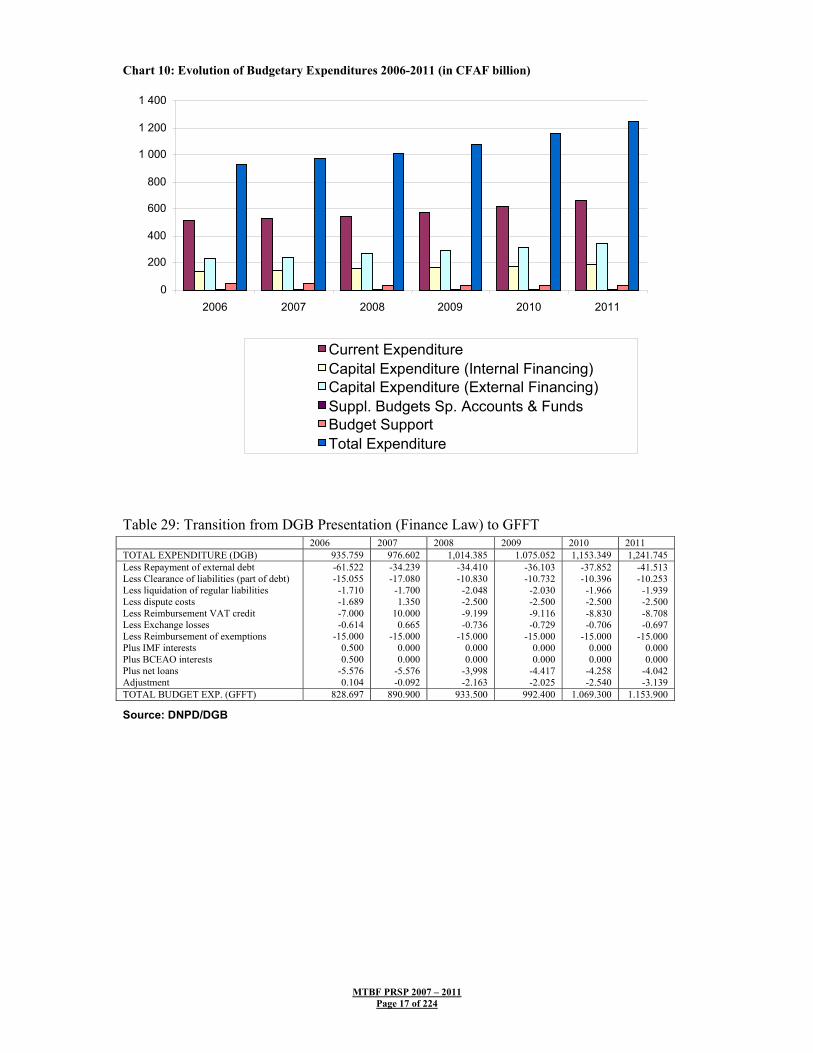
MTBF PRSP 2007 – 2011 Page 17 of 224
Chart 10: Evolution of Budgetary Expenditures 2006-2011 (in CFAF billion)
Table 29: Transition from DGB Presentation (Finance Law) to GFFT 2006 2007 2008 2009 2010 2011 TOTAL EXPENDITURE (DGB) 935.759 976.602 1,014.385 1.075.052 1,153.349 1,241.745 Less Repayment of external debt Less Clearance of liabilities (part of debt) Less liquidation of regular liabilities Less dispute costs Less Reimbursement VAT credit Less Exchange losses Less Reimbursement of exemptions Plus IMF interests Plus BCEAO interests Plus net loans Adjustment
-61.522 -15.055
-1.710 -1.689 -7.000 -0.614
-15.000 0.500 0.500
-5.576 0.104
-34.239 -17.080
-1.700 1.350
10.000 0.665
-15.000 0.000 0.000
-5.576 -0.092
-34.410 -10.830
-2.048 -2.500 -9.199 -0.736
-15.000 0.000 0.000
-3,998 -2.163
-36.103 -10.732
-2.030 -2.500 -9.116 -0.729
-15.000 0.000 0.000
-4.417 -2.025
-37.852 -10.396
-1.966 -2.500 -8.830 -0.706
-15.000 0.000 0.000
-4.258 -2.540
-41.513 -10.253
-1.939 -2.500 -8.708 -0.697
-15.000 0.000 0.000
-4.042 -3.139
TOTAL BUDGET EXP. (GFFT) 828.697 890.900 933.500 992.400 1.069.300 1.153.900
Source: DNPD/DGB
0
200
400
600
800
1 000
1 200
1 400
2006 2007 2008 2009 2010 2011
Current ExpenditureCapital Expenditure (Internal Financing) Capital Expenditure (External Financing) Suppl. Budgets Sp. Accounts & FundsBudget SupportTotal Expenditure
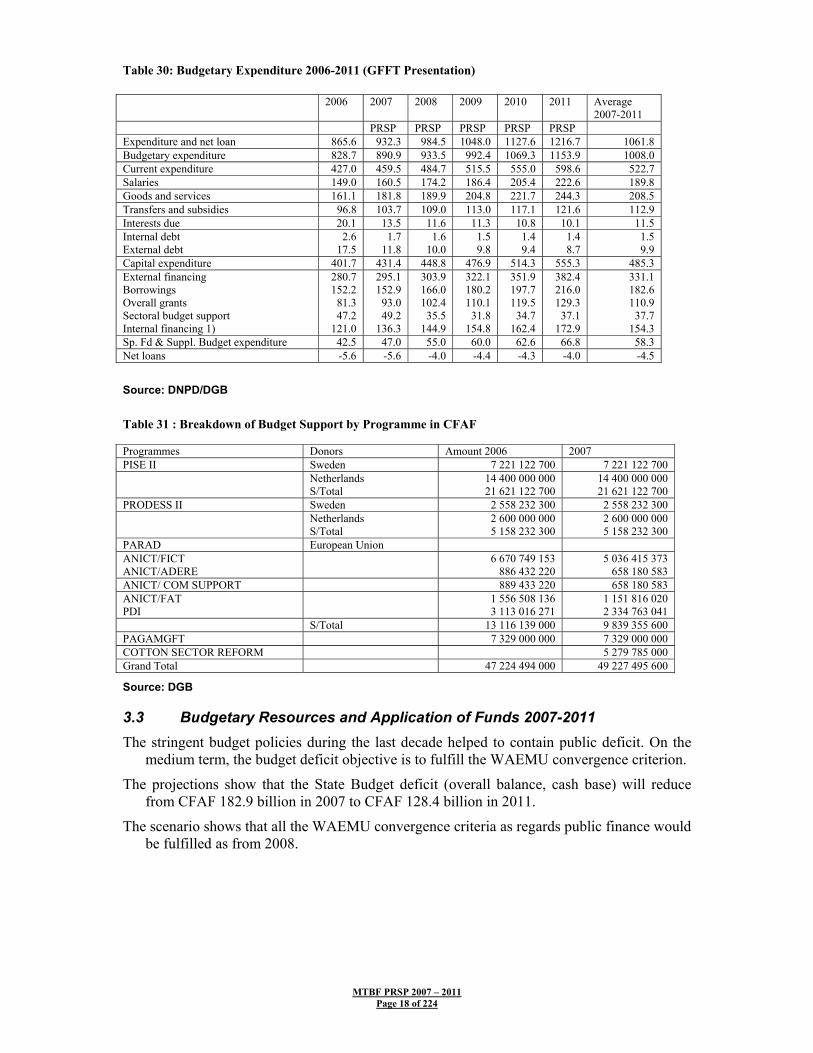
MTBF PRSP 2007 – 2011 Page 18 of 224
Table 30: Budgetary Expenditure 2006-2011 (GFFT Presentation) 2006 2007 2008 2009 2010 2011 Average
2007-2011 PRSP PRSP PRSP PRSP PRSP Expenditure and net loan 865.6 932.3 984.5 1048.0 1127.6 1216.7 1061.8 Budgetary expenditure 828.7 890.9 933.5 992.4 1069.3 1153.9 1008.0 Current expenditure 427.0 459.5 484.7 515.5 555.0 598.6 522.7 Salaries 149.0 160.5 174.2 186.4 205.4 222.6 189.8 Goods and services 161.1 181.8 189.9 204.8 221.7 244.3 208.5 Transfers and subsidies 96.8 103.7 109.0 113.0 117.1 121.6 112.9 Interests due 20.1 13.5 11.6 11.3 10.8 10.1 11.5 Internal debt External debt
2.6 17.5
1.7 11.8
1.6 10.0
1.5 9.8
1.4 9.4
1.4 8.7
1.5 9.9
Capital expenditure 401.7 431.4 448.8 476.9 514.3 555.3 485.3 External financing Borrowings Overall grants Sectoral budget support Internal financing 1)
280.7 152.2
81.3 47.2
121.0
295.1 152.9
93.0 49.2
136.3
303.9 166.0 102.4 35.5
144.9
322.1 180.2 110.1
31.8 154.8
351.9 197.7 119.5
34.7 162.4
382.4 216.0 129.3 37.1
172.9
331.1 182.6 110.9
37.7 154.3
Sp. Fd & Suppl. Budget expenditure 42.5 47.0 55.0 60.0 62.6 66.8 58.3 Net loans -5.6 -5.6 -4.0 -4.4 -4.3 -4.0 -4.5
Source: DNPD/DGB
Table 31 : Breakdown of Budget Support by Programme in CFAF Programmes Donors Amount 2006 2007 PISE II Sweden 7 221 122 700 7 221 122 700 Netherlands
S/Total 14 400 000 000 21 621 122 700
14 400 000 000 21 621 122 700
PRODESS II Sweden 2 558 232 300 2 558 232 300 Netherlands
S/Total 2 600 000 000 5 158 232 300
2 600 000 000 5 158 232 300
PARAD European Union ANICT/FICT ANICT/ADERE
6 670 749 153 886 432 220
5 036 415 373 658 180 583
ANICT/ COM SUPPORT 889 433 220 658 180 583 ANICT/FAT PDI
1 556 508 136 3 113 016 271
1 151 816 020 2 334 763 041
S/Total 13 116 139 000 9 839 355 600 PAGAMGFT 7 329 000 000 7 329 000 000 COTTON SECTOR REFORM 5 279 785 000 Grand Total 47 224 494 000 49 227 495 600
Source: DGB
3.3 Budgetary Resources and Application of Funds 2007-2011 The stringent budget policies during the last decade helped to contain public deficit. On the
medium term, the budget deficit objective is to fulfill the WAEMU convergence criterion.
The projections show that the State Budget deficit (overall balance, cash base) will reduce from CFAF 182.9 billion in 2007 to CFAF 128.4 billion in 2011.
The scenario shows that all the WAEMU convergence criteria as regards public finance would be fulfilled as from 2008.
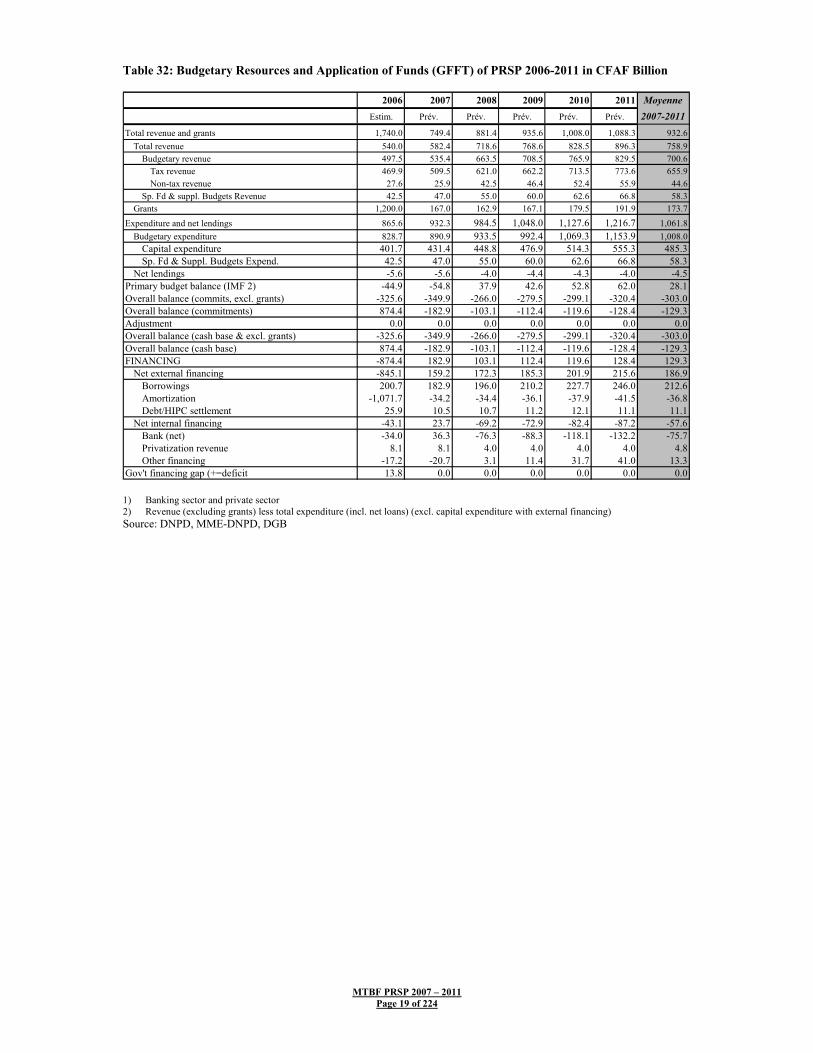
MTBF PRSP 2007 – 2011 Page 19 of 224
Table 32: Budgetary Resources and Application of Funds (GFFT) of PRSP 2006-2011 in CFAF Billion
2006 2007 2008 2009 2010 2011 MoyenneEstim. Prév. Prév. Prév. Prév. Prév. 2007-2011
Total revenue and grants 1,740.0 749.4 881.4 935.6 1,008.0 1,088.3 932.6Total revenue 540.0 582.4 718.6 768.6 828.5 896.3 758.9
Budgetary revenue 497.5 535.4 663.5 708.5 765.9 829.5 700.6Tax revenue 469.9 509.5 621.0 662.2 713.5 773.6 655.9Non-tax revenue 27.6 25.9 42.5 46.4 52.4 55.9 44.6
Sp. Fd & suppl. Budgets Revenue 42.5 47.0 55.0 60.0 62.6 66.8 58.3Grants 1,200.0 167.0 162.9 167.1 179.5 191.9 173.7
Expenditure and net lendings 865.6 932.3 984.5 1,048.0 1,127.6 1,216.7 1,061.8Budgetary expenditure 828.7 890.9 933.5 992.4 1,069.3 1,153.9 1,008.0
Capital expenditure 401.7 431.4 448.8 476.9 514.3 555.3 485.3Sp. Fd & Suppl. Budgets Expend. 42.5 47.0 55.0 60.0 62.6 66.8 58.3
Net lendings -5.6 -5.6 -4.0 -4.4 -4.3 -4.0 -4.5Primary budget balance (IMF 2) -44.9 -54.8 37.9 42.6 52.8 62.0 28.1Overall balance (commits, excl. grants) -325.6 -349.9 -266.0 -279.5 -299.1 -320.4 -303.0Overall balance (commitments) 874.4 -182.9 -103.1 -112.4 -119.6 -128.4 -129.3Adjustment 0.0 0.0 0.0 0.0 0.0 0.0 0.0Overall balance (cash base & excl. grants) -325.6 -349.9 -266.0 -279.5 -299.1 -320.4 -303.0Overall balance (cash base) 874.4 -182.9 -103.1 -112.4 -119.6 -128.4 -129.3FINANCING -874.4 182.9 103.1 112.4 119.6 128.4 129.3
Net external financing -845.1 159.2 172.3 185.3 201.9 215.6 186.9Borrowings 200.7 182.9 196.0 210.2 227.7 246.0 212.6Amortization -1,071.7 -34.2 -34.4 -36.1 -37.9 -41.5 -36.8Debt/HIPC settlement 25.9 10.5 10.7 11.2 12.1 11.1 11.1
Net internal financing -43.1 23.7 -69.2 -72.9 -82.4 -87.2 -57.6Bank (net) -34.0 36.3 -76.3 -88.3 -118.1 -132.2 -75.7Privatization revenue 8.1 8.1 4.0 4.0 4.0 4.0 4.8Other financing -17.2 -20.7 3.1 11.4 31.7 41.0 13.3
Gov't financing gap (+=deficit 13.8 0.0 0.0 0.0 0.0 0.0 0.0 1) Banking sector and private sector 2) Revenue (excluding grants) less total expenditure (incl. net loans) (excl. capital expenditure with external financing) Source: DNPD, MME-DNPD, DGB

MTBF PRSP 2007 – 2011 Page 20 of 224
Table 33: Expected Macro-budgetary Performance 2006-2011 2006 2007 2008 2009 2010 2011 Average
2007-2011 Resources and Appl. of Funds for Goods & services PRSP PRSP PRSP PRSP PRSP GDP at market prices (current CFAF billion) 3,205.8 3,419.4 3,653.0 3,895.0 4,196.9 4,493.8 3,931.6 Real growth rate of GDP at market prices 3.6% 7.0% 6.6 6.5% 7.8% 7.1% 7.0% Fixed investment rate GFCF/GDPm) 20.9% 19.3% 19.7% 20.0% 20.3% 20.9% 20.0% -Public GFCF in % of GDPm -Private GFCF in % of GDPm
10.0% 11.0%
8.3% 11.0%
8.7% 11.0%
9.1% 11.0%
9.5% 10.8%
9.6% 11.2%
9.0% 11.0%
Consumption rate (in % of GDPm) 84.1% 86.1% 85.6% 85.0% 85.5% 85.9% 85.6% -Private consumption rate -Public consumption rate
71.2% 12.9%
73.4% 12.7%
73.5% 12.1%
73.0% 12.0%
73.4% 12.0%
73.7% 12.2%
73.4% 12.2%
Per capita Gross National Product in current CFAF Per capita real growth rate of Gross National Product
269,324 2.5%
279,650 3.7%
289,717 3.4%
300,315 3.6%
315,076 4.9%
328,400 4.3%
301,632 4.0%
Public Finance 2006 2007 2008 2009 2010 2011 Tax pressure rate (=Tax revenue/GDPm) Tax rate (current revenue, excl. grants, in % of GDP) Tax rate (current revenue in % of GDP formal sector) Total expenditure and net loans, in % of GDP Balance of current operations (national public savings) in % of GDP Balance of current operations (own savings) in % of GDP Primary balance (=own public savings excl. interests) in % of GDPm Primary budget balance (IMF) in % of GDP Primary budget balance (WAEMU) in % of GDP Tot. balance (commit. base) excl. grants in % of GDP Tot. balance (commit. base) incl. grants in % of GDP Total balance (cash base) in % of GDP
14.7% 16.8% 49.0% 27.0% 40.5% 3.5% 4.2% 0.6% -0.6% -10.2% 27.3% 27.3%
14.9% 17.0% 49.5% 27.3% 8.1% 3.6% 4.0% 0.2% -1.3% -10.2% -5.3% -5.3%
17.0% 19.7% 57.5% 27.0% 10.6% 6.4% 6.7% 2.9% 1.3% -7.3% -2.8% -2.8%
17.0% 19.7% 56.3% 26.9% 10.5% 6.5% 6.8% 2.9% 1.4% -7.2% -2.9% -2.9%
17.0% 19.7% 56.9% 26.9% 10.6% 6.5% 6.8% 3.0% 1.5% -7.1% -2.8% -2.8%
17.2% 19.9% 57.7% 27.1% 10.7% 6.6% 6.9% 3.1% 1.6% -7.1% -2.9% -2.9%
16.6% 19.2% 55.6% 27.0% 10.1% 5.9% 6.2% 2.4% 0.9% -7.8% -3.4% -3.4%
External Aid External aid (gross) in % of GDP 46.5%
10.5%
10.1%
10.0%
10.0%
10.0%
10.1%
External aid (gross) in US$ million 2853.8 706.7 728.6 769.3 834.0 896.6 787.0 WAEMU Convergence Criteria 2006 2007 2008 2009 2010 2011 First rank criteria Expected ratio
Average 2007-2011
Base budget balance/GDPm ratio 1/ >=0% Inflation rate (IHPC Bamako) <=3% Outstanding internal and external debt/GDPm ratio <=70% Incl. outstanding external debt/GDPm Variation of internal arrear payments (in CFAF billion) <=0 Variation of external arrear payments (in CFAF billion) <=0
-0.6% 2.4% 0.0 23.3% 0.0 0.0
-1.3% 0.2% 0.0 24.9% 0.0 0.0
1.3% 0.5% 0.0 25.2% 0.0 0.0
1.5% 0.2% 0.0 21.1% 0.0 0.0
1.6% 0.2% 0.0 18.2% 0.0 0.0
1.6% 0.2% 0.0 18.2% 0.0 0.0
0.9% 0.3% 0.0 22.6% 0.0 0.0
Second rank criteria Wage bill/tax revenue ratio <=35% Public investments financed with internal resources/tax revenue ratio 2/ >=20% Current external deficit excl. public transfers/GDPm ratio <=5% Tax pressure rate (=Tax revenue/GDPm) >=17%
31.7% 25.8% -7.4% 14.7%
31.5% 22.5% -7.3% 14.9%
28.1% 22.5% -7.0% 17.0%
28.2% 22.5% -6.7% 17.0%
28.8% 22.5% -7.3% 17.0%
28.8% 22.5% -7.3% 17.0%
29.1% 22.5% -7.3% 16.6%
1/ Revenue (excluding grants) less total expenditure (including net loans) (excluding capital expenditure with external financing and excl.
HIPC)/GDPm 2/ Here only BSI investment Source: DNPD, MME-DNPD model.
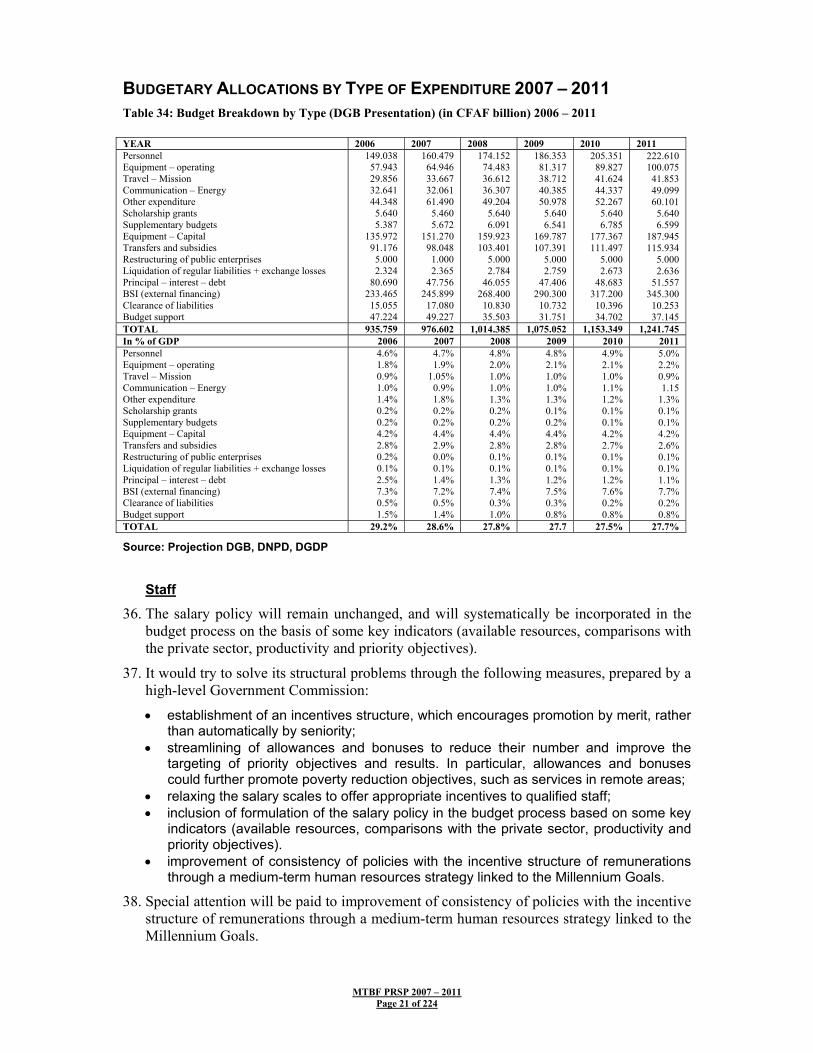
MTBF PRSP 2007 – 2011 Page 21 of 224
BUDGETARY ALLOCATIONS BY TYPE OF EXPENDITURE 2007 – 2011 Table 34: Budget Breakdown by Type (DGB Presentation) (in CFAF billion) 2006 – 2011 YEAR 2006 2007 2008 2009 2010 2011 Personnel Equipment – operating Travel – Mission Communication – Energy Other expenditure Scholarship grants Supplementary budgets Equipment – Capital Transfers and subsidies Restructuring of public enterprises Liquidation of regular liabilities + exchange losses Principal – interest – debt BSI (external financing) Clearance of liabilities Budget support
149.038 57.943 29.856 32.641 44.348
5.640 5.387
135.972 91.176
5.000 2.324
80.690 233.465 15.055 47.224
160.479 64.946 33.667 32.061 61.490
5.460 5.672
151.270 98.048
1.000 2.365
47.756 245.899 17.080 49.227
174.152 74.483 36.612 36.307 49.204
5.640 6.091
159.923 103.401
5.000 2.784
46.055 268.400 10.830 35.503
186.353 81.317 38.712 40.385 50.978
5.640 6.541
169.787 107.391
5.000 2.759
47.406 290.300
10.732 31.751
205.351 89.827 41.624 44.337 52.267
5.640 6.785
177.367 111.497
5.000 2.673
48.683 317.200 10.396 34.702
222.610 100.075 41.853 49.099 60.101
5.640 6.599
187.945 115.934
5.000 2.636
51.557 345.300 10.253 37.145
TOTAL 935.759 976.602 1,014.385 1,075.052 1,153.349 1,241.745 In % of GDP 2006 2007 2008 2009 2010 2011 Personnel Equipment – operating Travel – Mission Communication – Energy Other expenditure Scholarship grants Supplementary budgets Equipment – Capital Transfers and subsidies Restructuring of public enterprises Liquidation of regular liabilities + exchange losses Principal – interest – debt BSI (external financing) Clearance of liabilities Budget support
4.6% 1.8% 0.9% 1.0% 1.4% 0.2% 0.2% 4.2% 2.8% 0.2% 0.1% 2.5% 7.3% 0.5% 1.5%
4.7% 1.9%
1.05% 0.9% 1.8% 0.2% 0.2% 4.4% 2.9% 0.0% 0.1% 1.4% 7.2% 0.5% 1.4%
4.8% 2.0% 1.0% 1.0% 1.3% 0.2% 0.2% 4.4% 2.8% 0.1% 0.1% 1.3% 7.4% 0.3% 1.0%
4.8% 2.1% 1.0% 1.0% 1.3% 0.1% 0.2% 4.4% 2.8% 0.1% 0.1% 1.2% 7.5% 0.3% 0.8%
4.9% 2.1% 1.0% 1.1% 1.2% 0.1% 0.1% 4.2% 2.7% 0.1% 0.1% 1.2% 7.6% 0.2% 0.8%
5.0% 2.2% 0.9% 1.15
1.3% 0.1% 0.1% 4.2% 2.6% 0.1% 0.1% 1.1% 7.7% 0.2% 0.8%
TOTAL 29.2% 28.6% 27.8% 27.7 27.5% 27.7%
Source: Projection DGB, DNPD, DGDP
Staff
36. The salary policy will remain unchanged, and will systematically be incorporated in the budget process on the basis of some key indicators (available resources, comparisons with the private sector, productivity and priority objectives).
37. It would try to solve its structural problems through the following measures, prepared by a high-level Government Commission:
• establishment of an incentives structure, which encourages promotion by merit, rather than automatically by seniority;
• streamlining of allowances and bonuses to reduce their number and improve the targeting of priority objectives and results. In particular, allowances and bonuses could further promote poverty reduction objectives, such as services in remote areas;
• relaxing the salary scales to offer appropriate incentives to qualified staff; • inclusion of formulation of the salary policy in the budget process based on some key
indicators (available resources, comparisons with the private sector, productivity and priority objectives).
• improvement of consistency of policies with the incentive structure of remunerations through a medium-term human resources strategy linked to the Millennium Goals.
38. Special attention will be paid to improvement of consistency of policies with the incentive structure of remunerations through a medium-term human resources strategy linked to the Millennium Goals.
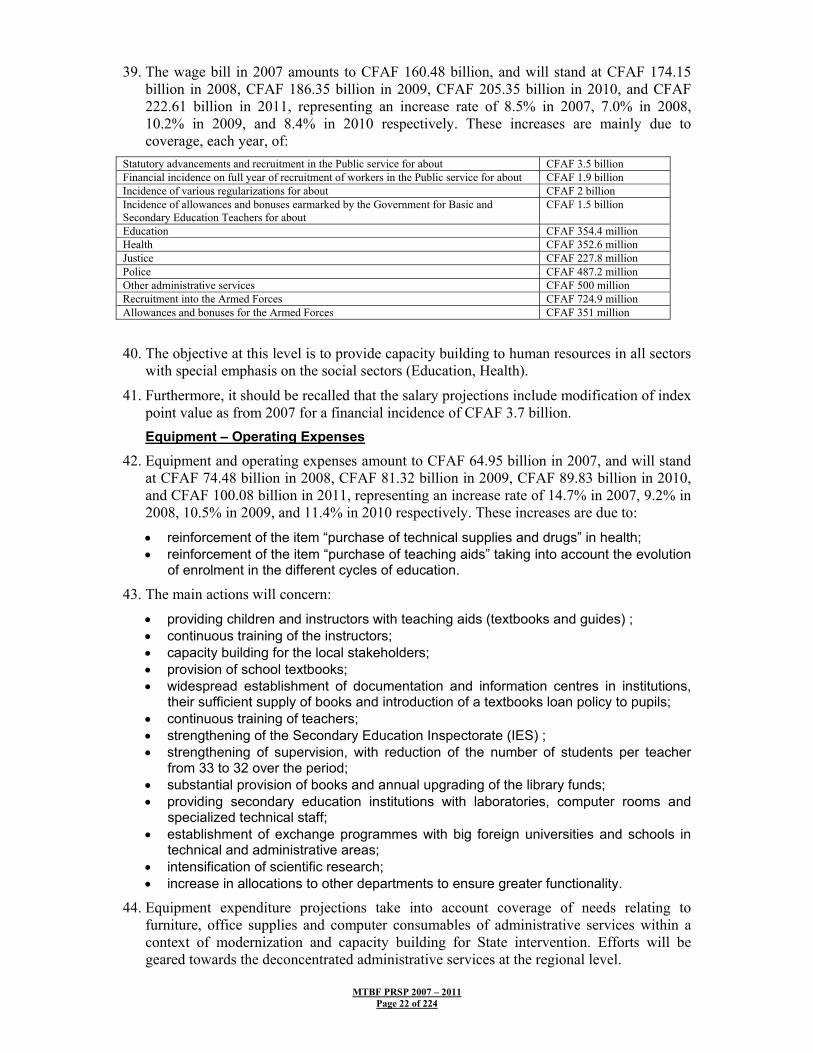
MTBF PRSP 2007 – 2011 Page 22 of 224
39. The wage bill in 2007 amounts to CFAF 160.48 billion, and will stand at CFAF 174.15 billion in 2008, CFAF 186.35 billion in 2009, CFAF 205.35 billion in 2010, and CFAF 222.61 billion in 2011, representing an increase rate of 8.5% in 2007, 7.0% in 2008, 10.2% in 2009, and 8.4% in 2010 respectively. These increases are mainly due to coverage, each year, of:
Statutory advancements and recruitment in the Public service for about CFAF 3.5 billion Financial incidence on full year of recruitment of workers in the Public service for about CFAF 1.9 billion Incidence of various regularizations for about CFAF 2 billion Incidence of allowances and bonuses earmarked by the Government for Basic and Secondary Education Teachers for about
CFAF 1.5 billion
Education CFAF 354.4 million Health CFAF 352.6 million Justice CFAF 227.8 million Police CFAF 487.2 million Other administrative services CFAF 500 million Recruitment into the Armed Forces CFAF 724.9 million Allowances and bonuses for the Armed Forces CFAF 351 million
40. The objective at this level is to provide capacity building to human resources in all sectors with special emphasis on the social sectors (Education, Health).
41. Furthermore, it should be recalled that the salary projections include modification of index point value as from 2007 for a financial incidence of CFAF 3.7 billion. Equipment – Operating Expenses
42. Equipment and operating expenses amount to CFAF 64.95 billion in 2007, and will stand at CFAF 74.48 billion in 2008, CFAF 81.32 billion in 2009, CFAF 89.83 billion in 2010, and CFAF 100.08 billion in 2011, representing an increase rate of 14.7% in 2007, 9.2% in 2008, 10.5% in 2009, and 11.4% in 2010 respectively. These increases are due to:
• reinforcement of the item “purchase of technical supplies and drugs” in health; • reinforcement of the item “purchase of teaching aids” taking into account the evolution
of enrolment in the different cycles of education.
43. The main actions will concern: • providing children and instructors with teaching aids (textbooks and guides) ; • continuous training of the instructors; • capacity building for the local stakeholders; • provision of school textbooks; • widespread establishment of documentation and information centres in institutions,
their sufficient supply of books and introduction of a textbooks loan policy to pupils; • continuous training of teachers; • strengthening of the Secondary Education Inspectorate (IES) ; • strengthening of supervision, with reduction of the number of students per teacher
from 33 to 32 over the period; • substantial provision of books and annual upgrading of the library funds; • providing secondary education institutions with laboratories, computer rooms and
specialized technical staff; • establishment of exchange programmes with big foreign universities and schools in
technical and administrative areas; • intensification of scientific research; • increase in allocations to other departments to ensure greater functionality.
44. Equipment expenditure projections take into account coverage of needs relating to furniture, office supplies and computer consumables of administrative services within a context of modernization and capacity building for State intervention. Efforts will be geared towards the deconcentrated administrative services at the regional level.

MTBF PRSP 2007 – 2011 Page 23 of 224
Travel and Mission
45. Travel expenses amount to CFAF 33.67 billion in 2007, and will stand at CFAF 36.61 billion in 2008, CFAF 38.71 billion in 2009, CFAF 41.62 billion in 2010, and CFAF 41.85 billion in 2011, representing an increase rate of 8.8% in 2007, 5.7% in 2008, 7.5% in 2009, and 0.6% in 2010 respectively.
46. These increases are mainly due to higher allocations to Ministries for missions within the country and readjustment of the allocation for the transportation of pupils and students within the country and abroad during the holidays, given the increase in enrolment. The projection takes into account an increase in allocations to deconcentrated Government services. Communication and Energy
47. Communication and energy expenditures in 2007 amount to CFAF 32.06 billion, and will stand at CFAF 36.31 billion in 2008, CFAF 40.39 billion in 2009, CFAF 44.34 billion in 2010, and CFAF 49.10 billion in 2011, representing an increase rate of 13.2% in 2007, 11.2% in 2008, 9.8% in 2009, and 10.7% in 2010 respectively. These increases are due to:
• pursuance of alignment of budgetary allocations on the real levels of consumption at the national and regional levels;
• increase in the number of Government services; • development of new communication technologies.
48. Furthermore, actions to control communication, water and electricity expenditures will be concurrently initiated and carried out. Other Expenditures
49. The other expenditures in 2007 stand at CFAF 61.49 billion, and will amount to CFAF 49.20 billion in 2008, CFAF 50.98 billion in 2009, CFAF 52.27 billion in 2010, and CFAF 60.10 billion in 2011, representing a 20.0% decline in comparison to 2007, an increase rate of 3.6% in 2008, 2.5% in 2009 and 15.0% in 2010 respectively. These figures are mainly due to training expenditures, election expenditures, and reimbursement of VAT credit. It should be underscored that 2007 is an election year. Supplementary Budgets and Special Accounts and Funds
50. The supplementary budgets in 2007 amount to CFAF 5.672 billion, and will stand at CFAF 6.091 billion in 2008, CFAF 6.541 billion in 2009, CFAF 6.785 billion in 2010, and CFAF 6.599 billion in 2011. These concern:
• Malian warehouses in Senegal, Togo, Côte d’Ivoire, Guinea, Mauritania and Ghana ; • the Road Crossing Charges Fund; • the Mineral Resources Development Programme; • the Equipment Security Fund ; • the Oil Exploration Promotion Support Fund.
Equipment - Investment
51. The proposed equipment-investment expenditures in 2007 amount to CFAF 151.27 billion, and will stand at CFAF 159.92 billion in 2008, CFAF 169.79 billion in 2009, CFAF 177.37 billion in 2010, and CFAF 187.95 billion in 2011, representing an increase rate of 5.7% in 2007, 6.2% in 2008, 4.5% in 2009, and 6.0% in 2010 respectively.
52. The increases are due to coverage of counterpart funds for investment projects in the Three-year Investment Programme and the financing of new projects and programmes with an impact on poverty reduction in line with the PRSP.

MTBF PRSP 2007 – 2011 Page 24 of 224
Transfers and Subsidies
53. Expenditures relating to transfers and subsidies, excluding grants and expenditures on the restructuring of enterprises, in 2007 amount to CFAF 98.05 billion, and will stand at CFAF 103.40 billion in 2008, CFAF 107.39 billion in 2009, CFAF 111.50 billion in 2010, and CFAF 115.93 billion in 2011, representing an increase rate of 5.5% in 2007, 3.9% in 2008, 3.8% in 2009, and 4.0% in 2010 respectively. The increase shows:
• the Government’s desire to control subsidies granted to personalized public establishments;
• the parametric reform measures, which will help to gradually reduce the estimated deficit of the Pension Fund of Mali.
54. However, more than half of the estimated transfers and subsidies are intended for personalized public establishments.
Table 35: Trend of Transfer Expenditures 2006-2011 (in CFAF billion)
NB=* The total of transfers contains grants and amount for restructuring of enterprises.
Source: DGDP, DGB
55. Expenditures on the restructuring of public enterprises amount to CFAF one billion in 2007 and CFAF 5 billion over the 2008, 2009, 2010 and 2011 period.
56. Grants will not undergo significant change; they will remain constant over the period, and stand at CFAF 5.64 billion each year. Liquidation of Regular Liabilities and Exchange Losses
57. Expenditures relating to liquidation of the regular liabilities and exchange losses in 2007 amount to CFAF 2.37 billion, and will stand at CFAF 2.78 billion in 2008, CFAF 2.76 billion in 2009, CFAF 2.67 billion in 2010, and CFAF 2.64 billion in 2011.
58. The estimates for “liquidation of regular liabilities” will cover pending situations in enterprises whose liquidation is not yet completed. Debt- Principal - Interest
59. The principal and interest of the debt in 2007 amount to CFAF 47.76 billion, and will stand at CFAF 46.06 billion in 2008, CFAF 47.41 billion in 2009, CFAF 48.68 billion in 2010, and CFAF 51.56 billion in 2011. This trend takes into account the foreign debt cancellation under MDRI. Expenditure using HIPC Resources
60. Debt relief resources will be used to finance priority programmes and projects in the Poverty Reduction Strategy Paper in Education, Health, Social Development, Rural Development, Sanitation, Drinking Water and Gender Promotion.
61. These resources will also be used for current expenditure in improving basic social services, in particular the recruitment of teachers in the Education sector and Health employees. Projections for expenditure using HIPC Initiative resources from 2007 to 2009 are as follows:
ITEMS 2006 2007 2008 2009 2010 2011Subsidies to EPAs 45.4 52.56 48.32 49.64 51.14 52.55CRM 17.96 20.94 18 18 18 18Others 38.46 31,19 47.72 50.39 53 56.02TOTAL 101.82 104.69 114.04 118.03 122.14 126.57
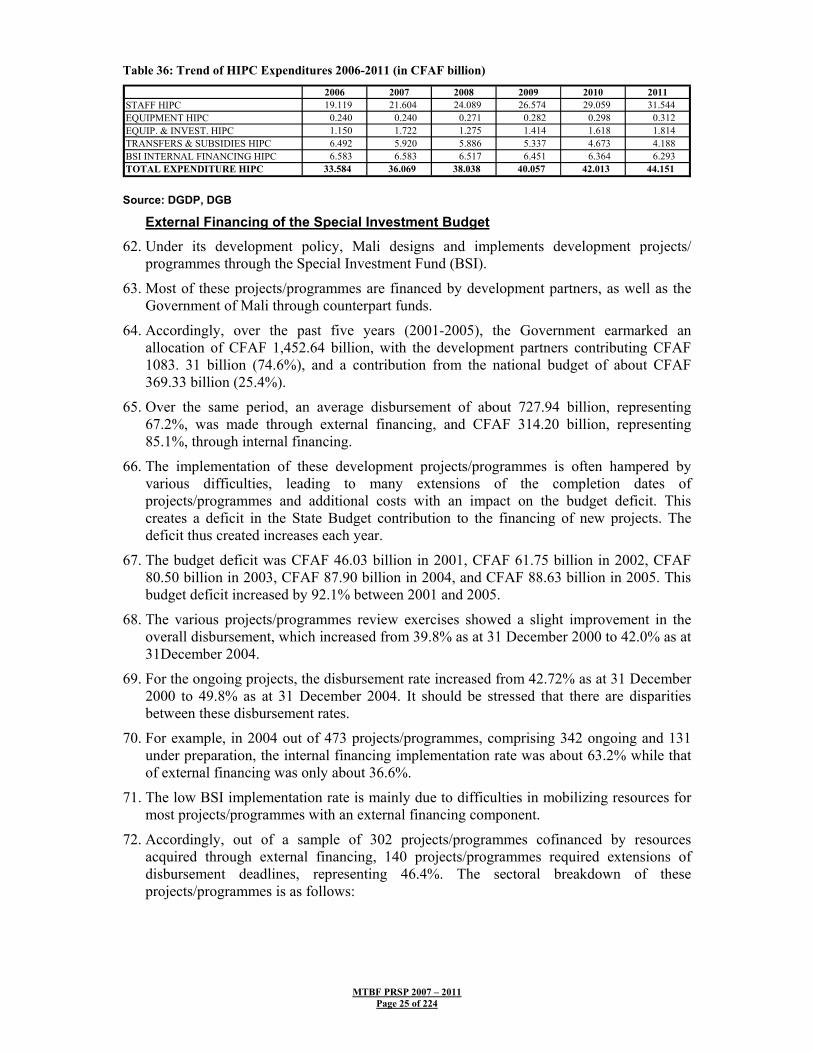
MTBF PRSP 2007 – 2011 Page 25 of 224
Table 36: Trend of HIPC Expenditures 2006-2011 (in CFAF billion)
Source: DGDP, DGB
External Financing of the Special Investment Budget
62. Under its development policy, Mali designs and implements development projects/ programmes through the Special Investment Fund (BSI).
63. Most of these projects/programmes are financed by development partners, as well as the Government of Mali through counterpart funds.
64. Accordingly, over the past five years (2001-2005), the Government earmarked an allocation of CFAF 1,452.64 billion, with the development partners contributing CFAF 1083. 31 billion (74.6%), and a contribution from the national budget of about CFAF 369.33 billion (25.4%).
65. Over the same period, an average disbursement of about 727.94 billion, representing 67.2%, was made through external financing, and CFAF 314.20 billion, representing 85.1%, through internal financing.
66. The implementation of these development projects/programmes is often hampered by various difficulties, leading to many extensions of the completion dates of projects/programmes and additional costs with an impact on the budget deficit. This creates a deficit in the State Budget contribution to the financing of new projects. The deficit thus created increases each year.
67. The budget deficit was CFAF 46.03 billion in 2001, CFAF 61.75 billion in 2002, CFAF 80.50 billion in 2003, CFAF 87.90 billion in 2004, and CFAF 88.63 billion in 2005. This budget deficit increased by 92.1% between 2001 and 2005.
68. The various projects/programmes review exercises showed a slight improvement in the overall disbursement, which increased from 39.8% as at 31 December 2000 to 42.0% as at 31December 2004.
69. For the ongoing projects, the disbursement rate increased from 42.72% as at 31 December 2000 to 49.8% as at 31 December 2004. It should be stressed that there are disparities between these disbursement rates.
70. For example, in 2004 out of 473 projects/programmes, comprising 342 ongoing and 131 under preparation, the internal financing implementation rate was about 63.2% while that of external financing was only about 36.6%.
71. The low BSI implementation rate is mainly due to difficulties in mobilizing resources for most projects/programmes with an external financing component.
72. Accordingly, out of a sample of 302 projects/programmes cofinanced by resources acquired through external financing, 140 projects/programmes required extensions of disbursement deadlines, representing 46.4%. The sectoral breakdown of these projects/programmes is as follows:
2006 2007 2008 2009 2010 2011STAFF HIPC 19.119 21.604 24.089 26.574 29.059 31.544 EQUIPMENT HIPC 0.240 0.240 0.271 0.282 0.298 0.312 EQUIP. & INVEST. HIPC 1.150 1.722 1.275 1.414 1.618 1.814 TRANSFERS & SUBSIDIES HIPC 6.492 5.920 5.886 5.337 4.673 4.188 BSI INTERNAL FINANCING HIPC 6.583 6.583 6.517 6.451 6.364 6.293 TOTAL EXPENDITURE HIPC 33.584 36.069 38.038 40.057 42.013 44.151
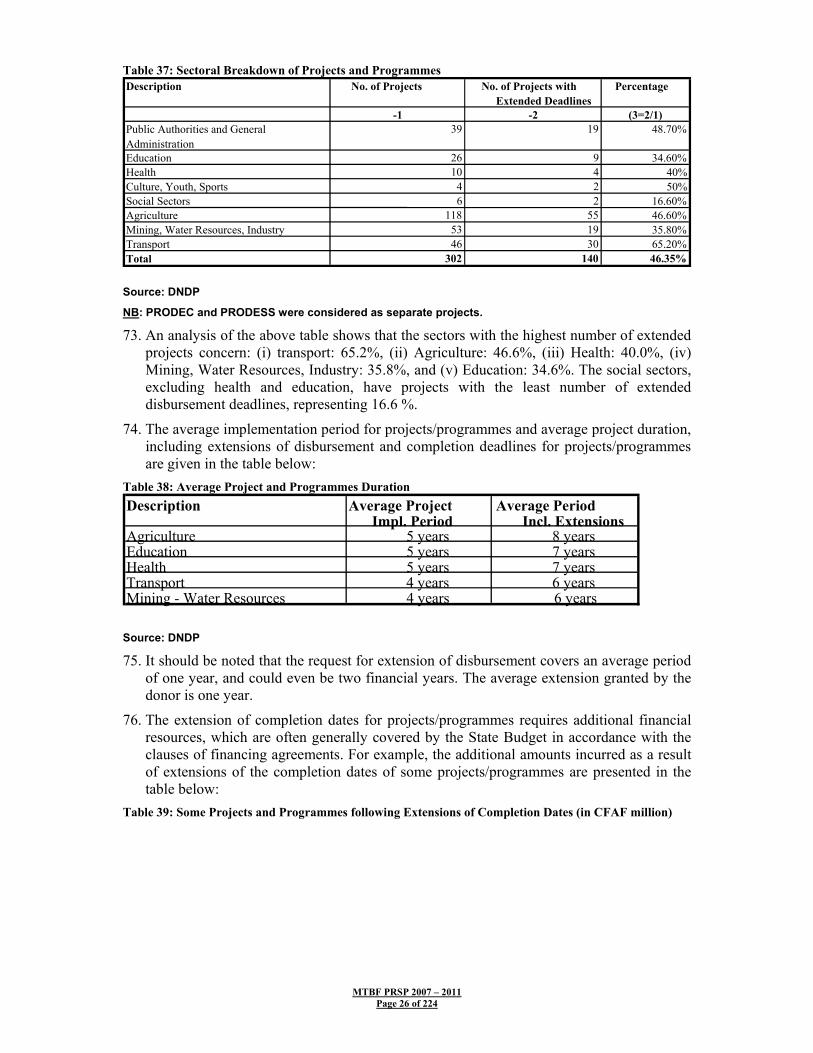
MTBF PRSP 2007 – 2011 Page 26 of 224
Table 37: Sectoral Breakdown of Projects and Programmes
Source: DNDP
NB: PRODEC and PRODESS were considered as separate projects.
73. An analysis of the above table shows that the sectors with the highest number of extended projects concern: (i) transport: 65.2%, (ii) Agriculture: 46.6%, (iii) Health: 40.0%, (iv) Mining, Water Resources, Industry: 35.8%, and (v) Education: 34.6%. The social sectors, excluding health and education, have projects with the least number of extended disbursement deadlines, representing 16.6 %.
74. The average implementation period for projects/programmes and average project duration, including extensions of disbursement and completion deadlines for projects/programmes are given in the table below:
Table 38: Average Project and Programmes Duration
Source: DNDP
75. It should be noted that the request for extension of disbursement covers an average period of one year, and could even be two financial years. The average extension granted by the donor is one year.
76. The extension of completion dates for projects/programmes requires additional financial resources, which are often generally covered by the State Budget in accordance with the clauses of financing agreements. For example, the additional amounts incurred as a result of extensions of the completion dates of some projects/programmes are presented in the table below:
Table 39: Some Projects and Programmes following Extensions of Completion Dates (in CFAF million)
Description No. of Projects No. of Projects with Extended Deadlines
Percentage
-1 -2 (3=2/1)Public Authorities and General Administration
39 19 48.70%
Education 26 9 34.60%Health 10 4 40%Culture, Youth, Sports 4 2 50%Social Sectors 6 2 16.60%Agriculture 118 55 46.60%Mining, Water Resources, Industry 53 19 35.80%Transport 46 30 65.20%Total 302 140 46.35%
Description Average Project Impl. Period
Average Period Incl. Extensions
Agriculture 5 years 8 years Education 5 years 7 years Health 5 years 7 years Transport 4 years 6 years Mining - Water Resources 4 years 6 years

MTBF PRSP 2007 – 2011 Page 27 of 224
Source: DNDP
77. It should be stressed that despite many extensions (see table in Annex), these projects are still ongoing. The extensions of completion and disbursement dates of projects/programmes are due mainly to:
78. Generic causes:
• delays in the ratification and effectiveness of loan or grant agreements; • delays in fulfillment of the conditions precedent to the first disbursement. These
conditions are discussed and accepted at the time of project/programme appraisal and validated during negotiation of the loan or grant. However, their fulfillment takes one and a half to two years.
79. For the fulfillment of these two pre-conditions for all the loan or grant agreements, it takes two to three years without any disbursement of external financing. During this period, the Government has already mobilized the counterpart funds;
• the long, slow and cumbersome procurement procedure (works and services) at the national level and with the donors. The average period is one and a half years for works, and one year for consultancy services. These periods may double in the case of cofinancing with several donors. The long period is due to the complexity of procedures because at each stage, the prior approval of the donor is required.
80. For example, for the works: The bidding documents should be approved by the Directorate General of Public Procurements (DGMP) and the donor(s). The invitation to bid takes 90 days. The procedure for opening bids and awarding contracts, as well as the report on the opening of bids are approved by DGMP and the donor(s). The report on the negotiations and the draft contract follow the same approval procedure. Each of these stages affects the project duration.
• Ignorance of the procedures of the technical and financial partners by the stakeholders leads to many rejections of the files during processing;
• Mobility of staff of the Project Management Units (PMU).
81. The technical causes are mainly related to inadequate final or preliminary designs of projects. These cases are frequent in projects relating to roads, dam construction, irrigation schemes and water resources.
82. The above inadequacies lead mainly to additional financing as in the case of projects for the construction of Gao Bridge (30% additional financing), Rehabilitation of inland aerodromes, construction of the Nioro du Sahel – Mauritania border road, construction of urban roads in Bamako, agricultural development downstream Manantali dam, and agricultural development of Ké-Macina Phase II.
Saouné Plain Agricultural Development Project
3 888.00 576.00 Ongoing
Poultry Development Project In Mali
4 039.00 374.00 Ongoing
Mopti and Tombouctou Integrated Dev. Project
2 266.00 813.00 Ongoing
Gao Village Irrigation Project 4 080.00 38.00 Ongoing
Western Sahel Livestock Development Project
7 823.00 50.00 Ongoing
Niafunké Lake Zone Development Project
12 120.00 503.00 Ongoing
Total 34 216,00 2 354,00
Description Initial Amount Additional Amount
Remarks
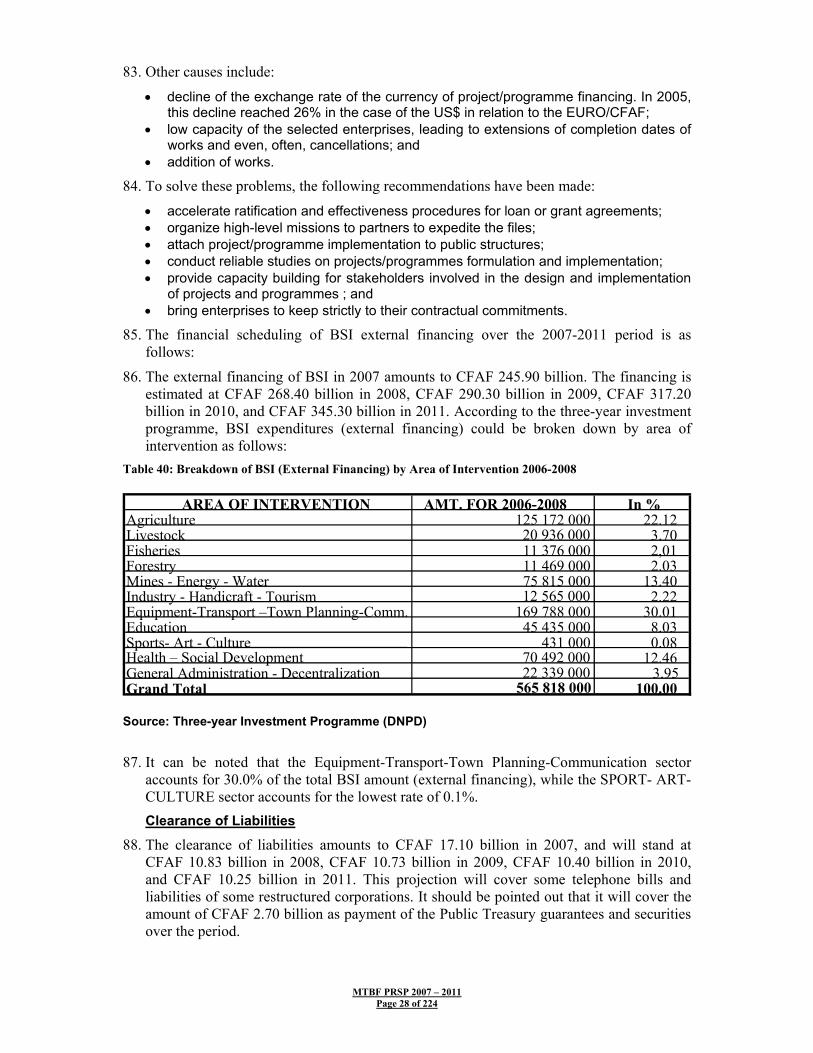
MTBF PRSP 2007 – 2011 Page 28 of 224
83. Other causes include:
• decline of the exchange rate of the currency of project/programme financing. In 2005, this decline reached 26% in the case of the US$ in relation to the EURO/CFAF;
• low capacity of the selected enterprises, leading to extensions of completion dates of works and even, often, cancellations; and
• addition of works.
84. To solve these problems, the following recommendations have been made:
• accelerate ratification and effectiveness procedures for loan or grant agreements; • organize high-level missions to partners to expedite the files; • attach project/programme implementation to public structures; • conduct reliable studies on projects/programmes formulation and implementation; • provide capacity building for stakeholders involved in the design and implementation
of projects and programmes ; and • bring enterprises to keep strictly to their contractual commitments.
85. The financial scheduling of BSI external financing over the 2007-2011 period is as follows:
86. The external financing of BSI in 2007 amounts to CFAF 245.90 billion. The financing is estimated at CFAF 268.40 billion in 2008, CFAF 290.30 billion in 2009, CFAF 317.20 billion in 2010, and CFAF 345.30 billion in 2011. According to the three-year investment programme, BSI expenditures (external financing) could be broken down by area of intervention as follows:
Table 40: Breakdown of BSI (External Financing) by Area of Intervention 2006-2008
Source: Three-year Investment Programme (DNPD)
87. It can be noted that the Equipment-Transport-Town Planning-Communication sector accounts for 30.0% of the total BSI amount (external financing), while the SPORT- ART-CULTURE sector accounts for the lowest rate of 0.1%. Clearance of Liabilities
88. The clearance of liabilities amounts to CFAF 17.10 billion in 2007, and will stand at CFAF 10.83 billion in 2008, CFAF 10.73 billion in 2009, CFAF 10.40 billion in 2010, and CFAF 10.25 billion in 2011. This projection will cover some telephone bills and liabilities of some restructured corporations. It should be pointed out that it will cover the amount of CFAF 2.70 billion as payment of the Public Treasury guarantees and securities over the period.
AREA OF INTERVENTION AMT. FOR 2006-2008 In %Agriculture 125 172 000 22.12 Livestock 20 936 000 3.70 Fisheries 11 376 000 2,01 Forestry 11 469 000 2.03 Mines - Energy - Water 75 815 000 13.40 Industry - Handicraft - Tourism 12 565 000 2.22 Equipment-Transport –Town Planning-Comm. 169 788 000 30.01 Education 45 435 000 8.03 Sports- Art - Culture 431 000 0.08 Health – Social Development 70 492 000 12.46 General Administration - Decentralization 22 339 000 3.95 Grand Total 565 818 000 100.00

MTBF PRSP 2007 – 2011 Page 29 of 224
5. SECTORAL BUDGETARY ALLOCATIONS 2007-2011
5.1 Overview 89. The sectoral allocation of budgetary expenditures over the 2007-2011 period took into
account the impetus that will be given to the productive sectors without worsening the recurrent cost ratios of social sectors. According to projections, the productive sector will have an average of 32.2% of overall ratios as against 27.8% for the social sector. The overall ratios of the productive sector are driven substantially by the portion of BSI allocated; in other words, investments will be increasingly geared towards this sector to stimulate growth.
Table 41: Sectoral Breakdown of Expenditures (DGB Presentation) 2006-2011 in CFAF billion SECTORS OF ACTIVITY 2006 2007 2008 2009 2010 2011
PUBLIC AUTHORITIES AND GENERAL ADMINISTRA 115.695 117.318 128.993 133.177 142.494 153.243 DIPLOMACY AND FOREIGN AFFAIRS 16.714 20.265 20.300 21.778 23.706 25.455 NATIONAL DEFENCE AND INTERNAL SECURITY 68.920 75.633 77.290 83.323 93.860 101.587 BASIC EDUCATION 119.322 122.629 135.451 138.575 145.436 159.035 SEC. HIGHER EDUCATION & SCIENTIFIC RESEARCH 39.169 41.494 44.171 47.763 52.004 56.805 CULTURE YOUTH AND SPORTS 13.051 13.668 14.780 15.758 17.150 18.126 HEALTH 72.684 65.307 70.146 72.299 79.797 87.417 SOCIAL SECTORS 27.849 36.620 38.799 38.976 41.126 43.342 EMPLOYMENT 7.636 7.876 7.698 7.045 7.996 8.785 AGRICULTURE 118.283 131.192 132.908 145.563 158.222 170.297 MINING WATER RESOURCES AND INDUSTRY 53.859 68.353 72.882 79.626 85.120 91.030 TOWN PLANNING AND PUBLIC WORKS 99.217 115.376 119.051 131.830 140.332 150.908 TRANSPORT 10.570 13.749 14.580 15.969 18.133 19.982 COMMUNICATION 9.100 10.845 11.945 12.775 13.579 14.487 DOMESTIC DEBT 1.637 1.748 1.602 1.520 1.445 1.372 FOREIGN DEBT 61.522 34.239 34.410 36.103 37.852 41.513 INTEREST FOREIGN DEBT 17.531 11.769 10.042 9.783 9.385 8.671 UNALLOCATED FUNDS 83.002 88.522 79.337 83.189 85.712 89.688
TOTAL 935.759 976.602 1,014.385 1,075.052 1,153.349 1,241.745 Source: DGB
Table 42: Sectoral Breakdown of Expenditures 2006-2011 in % of GDP
SECTORS OF ACTIVITY 2006 2007 2008 2009 2010 2011PUBLIC AUTHORITIES AND GENERAL AD 3.6% 3.4% 3.5% 3.4% 3.4% 3.4%DIPLOMACY AND FOREIGN AFFAIRS 0.5% 0.6% 0.6% 0.6% 0.6% 0.6%NATIONAL DEFENCE AND INTERNAL SE 2.1% 2.2% 2.1% 2.1% 2.2% 2.3%BASIC EDUCATION 3.7% 3.6% 3.7% 3.6% 3.5% 3.5%SEC. HIGHER EDUCATION & SCIENTIFIC 1.2% 1.2% 1.2% 1.2% 1.2% 1.3%CULTURE YOUTH AND SPORTS 0.4% 0.4% 0.4% 0.4% 0.4% 0.4%HEALTH 2.3% 1.9% 1.9% 1.9% 1.9% 1.9%SOCIAL SECTORS 0.9% 1.1% 1.1% 1.0% 1.0% 1.0%EMPLOYMENT 0.2% 0.2% 0.2% 0.2% 0.2% 0.2%AGRICULTURE 3.7% 3.8% 3.6% 3.7% 3.8% 3.8%MINING WATER RESOURCES AND INDUS 1.7% 2.0% 2.0% 2.0% 2.0% 2.0%TOWN PLANNING AND PUBLIC WORKS 3.1% 3.4% 3.3% 3.4% 3.4% 3.4%TRANSPORT 0.3% 0.4% 0.4% 0.4% 0.4% 0.4%COMMUNICATION 0.3% 0.3% 0.3% 0.3% 0.3% 0.3%DOMESTIC DEBT 0.1% 0.1% 0.0% 0.0% 0.0% 0.0%FOREIGN DEBT 1.9% 1.0% 0.9% 0.9% 0.9% 0.9%INTEREST FOREIGN DEBT 0.5% 0.3% 0.3% 0.3% 0.2% 0.2%UNALLOCATED FUNDS 2.6% 2.6% 2.2% 2.1% 2.0% 2.0%
TOTAL 29.2% 28.6% 27.8% 27.7% 27.5% 27.7% Source: DGB

MTBF PRSP 2007 – 2011 Page 30 of 224
Table 43: Sectoral Breakdown of Expenditures 2006-2011 in % of total
SECTORS OF ACTIVITY 2006 2007 2008 2009 2010 2011PUBLIC AUTHORITIES AND GENERAL AD 12.4% 12.0% 12.7% 12.4% 12.4% 12.3%DIPLOMACY AND FOREIGN AFFAIRS 1.8% 2.1% 2.0% 2.0% 2.1% 2.0%NATIONAL DEFENCE AND INTERNAL SE 7.4% 7.7% 7.6% 7.8% 8.1% 8.2%BASIC EDUCATION 12.8% 12.6% 13.4% 12.9% 12.6% 12.8%SEC. HIGHER EDUCATION & SCIENTIFIC 4.2% 4.2% 4.4% 4.4% 4.5% 4.6%CULTURE YOUTH AND SPORTS 1.4% 1.4% 1.5% 1.5% 1.5% 1.5%HEALTH 7.8% 6.7% 6.9% 6.7% 6.9% 7.0%SOCIAL SECTORS 3.0% 3.7% 3.8% 3.6% 3.6% 3.5%EMPLOYMENT 0.8% 0.8% 0.8% 0.7% 0.7% 0.7%AGRICULTURE 12.6% 13.4% 13.1% 13.5% 13.7% 13.7%MINING WATER RESOURCES AND INDUS 5.8% 7.0% 7.2% 7.4% 7.4% 7.3%TOWN PLANNING AND PUBLIC WORKS 10.6% 11.8% 11.7% 12.3% 12.2% 12.2%TRANSPORT 1.1% 1.4% 1.4% 1.5% 1.6% 1.6%COMMUNICATION 1.0% 1.1% 1.2% 1.2% 1.2% 1.2%DOMESTIC DEBT 0.2% 0.2% 0.2% 0.1% 0.1% 0.1%FOREIGN DEBT 6.6% 3.5% 3.4% 3.4% 3.3% 3.3%INTEREST FOREIGN DEBT 1.9% 1.2% 1.0% 0.9% 0.8% 0.7%UNALLOCATED FUNDS 8.9% 9.1% 7.8% 7.7% 7.4% 7.2%
TOTAL 100.0% 100.0% 100.0% 100.0% 100.0% 100.0% Source: DGB
Table 44: Overall Ratios by Sector 2006-2011 Sectors 2006 2007 2008 2009 2010 2011All Social Sectors 27.68 27.24 28.45 27.68 27.60 27.91
EDUCATION 16.94 16.81 17.71 17.33 17.12 17.38HEALTH 7.77 6.69 6,92 6.73 6.92 7.04SOCIAL SECTORS 2.98 3.75 3,82 3.63 3.57 3.49
Average 27.76 Productive Sectors 29.00 32.14 32.02 33.21 33.27 33.20
AGRICULTURE 12.64 13.43 13.10 13.54 13.72 13.71MINING, WATER RESOURCES AND
INDUSTRY 5.76 7.00 7.18 7.41 7.38 7.33TOWN PLANNING AND PUBLIC WORKS 10.60 11.81 11.74 12.26 12.17 12.15
Average 32.16 Other Sectors 43.32 40.51 39.53 39.11 39.13 38.89Average 40.08
Source: DGB
90. As regards recurrent cost ratios, the social sector will have an average of 47.6%, as against 9.3% for the productive sector. This trend is due to the high predominance of recurrent expenditure in the social sector, comprising mainly almost incompressible expenditure such as staff, purchase of teaching aids, and subsidies to the Pension Fund of Mali and Public Hospital Institutions.
Table 45: Recurrent Cost Ratios by Sector 2006-2011 Sectors 2006 2007 2008 2009 2010 2011 Social Sectors 46.67 47.21 47.68 48.07 48.19 47.89 Education 30.07 30.12 30.29 30.29 30.31 30.41
HEALTH 10.63 10.75 10.84 11.07 11.22 11.23
SOCIAL SECTORS 5.97 6.34 6.56 6.70 6.65 6.25 Average 47.62 Productive sectors 9.40 9.53 9.80 8.97 9.41 9.29
AGRICULTURE 4.85 5.00 5.17 4.62 4,55 4.57
MINING WATER RES. AND INDUSTRY 2.24 2.29 2.39 2.17 2.68 2.48
TOWN PLANNING AND PBLIC WORKS 2.31 2.24 2.24 2.19 2.18 2.24 Average 9.34 Other sectors 43.93 43.26 42.51 42.96 42.40 42.83 Average 42.98
Source: DGB

MTBF PRSP 2007 – 2011 Page 31 of 224
5.2 Education 91. Expenditures of the education sector in 2007 amount to CFAF 164.12 billion. They will
increase to CFAF 179.62 billion in 2008, CFAF 186.34 billion in 2009, CFAF 197.44 billion in 2010, and CFAF 215.84 billion in 2011, representing an increase rate of 7.4% in 2007, 3.7% in 2008, 6.0% in 2009, and 9.3% in 2010 respectively.
Table 46: Trend of Education Expenditure 2006-2011 (in CFAF billion) YEAR 2006 2007 2008 2009 2010 2011 BASIC EDUCATION 119.322
122.629 135.451 138.575 145.436 159.035
SEC. EDUC. HIGHER EDUC. & SCIENTIFIC RESEARCH 39.169
41.494 44.171 47.763 52.004 56.805
TOTAL 158.491
164.123 179.622 186.338 197.440 215.840
Source: Projection DGB
92. These increases are due to the sectoral policy defined in the Ten-year Education Development Programme (PRODEC). The programme aims at universal education through basic schools and Development Education Centres (CED), and improvement of the quality of education at all levels of the education system. To that end, in the medium term, the recruitment policy each year in Education will continue:
• 847 employees for National Education under PRODEC ; • 2 000 teachers of Basic Education level; • 360 teachers of Secondary Education level.
93. As regards equipment and investment, the following activities are expected:
• construction of the Secondary Education Inspectorate; • providing basic and secondary schools with textbooks, library books and other
teaching aids; • finalization of the construction of the teaching block of FLASH ; • construction of BUC ; • construction and equipment of premises for the Faculties of Law and Economics; • construction and equipment of an amphitheatre of 1000 seats; • construction of hotel and tourism teaching structure of the University Institute of
Management; • construction of premises for the ETP Institute for the Training of Trainers; • construction of a university restaurant; • conduct of a feasibility study for a university sports and cultural space; • construction and equipment of three (3) Residences of 1,000 places ; • construction of the residence of the Rector; • construction and equipment of Kalabancoro high school; • construction and equipment of classrooms of CFPAA, Gao ; • construction and equipment of Douentza high school.
PRODEC is centred on four components:
5.2.1 Basic Education Component
Pre-school Education:
• Initial training for about 120 pre-school teachers, and continuous education for about 300 instructors per year,
• Capacity building for pre-school teachers in the making of local teaching aids, • Provision of teaching aids, • Provision of a programme and a guide for each Children’s Development Centre; • Construction and equipment of the Pre-school Teachers’ Training School (EFEP); • Construction and equipment of 250 CDPEs.

MTBF PRSP 2007 – 2011 Page 32 of 224
95. First Cycle of Basic Education Initial Training
• construction and equipment of 2,000 classrooms on average per year for the first cycle taking into account the school map and criteria for choosing the site, including the existence of water point and the objective of reducing disparities ; and
• training of an average of 2,500 teachers per year.
Alternative Strategy for the Recruitment of Teaching Staff (SARPE) SARPE is an intermediary strategy, which will disappear during PISE II. During implementation, the following activities will be carried out:
• training of new unqualified teachers for 6 months, • gradual increase in the proportion of women recruited.
Continuous Training
96. Refresher Courses:
• training of 15,885 teachers, with 20% of this number each year and an average of 20 days for each teacher,
• continuous training for all teachers, irrespective of their status and the category of school (public, community, médersas).
97. Continuous training by the apprenticeship communities (CA):
• field pedagogic support for all public first cycle basic schools; • training of employees of AEs and Pedagogic Training Centres (CAP) and providing
them with operating resources, so that they effectively play their above-mentioned pedagogic supervisory and support role.
98. Continuous training through the school radio:
• widespread organization of this training in case of satisfactory results from the ongoing experimentation.
99. Curriculum Development
• gradual generalization of level 1 (1st and 2nd years) ; • trial and validation of level 2 (3rd and 4th years) ; • preparation, trial and validation of level 3 (5th and 6th years of Basic Education); • preparation, trial and validation of normal education curriculum; • preparation and application of a relevant performance evaluation system for pupils in
line with the curriculum.
100. School text books, library books, and teaching aids
• operationalize the basic options of the School text book and teaching aids policy, namely privatization of the school text books chain and decentralization of the purchase, distribution and management of text books, books, and teaching aids;
• observe transition period (2006-2007) during which the DAF will award contracts for text books, library books and teaching aids, and have them distributed by the private sector;
• encourage private national publishers to put additional text books and teaching aids on the market;
• provide all schools and all classes with teaching aids deemed indispensable; • provide each teacher with a curriculum guide and a teacher’s guide for each pupils’
text book; • provide each first year pupil of the first cycle with a national language text book and a
mathematics text book; • provide each second year pupil with 2 language text books (national and French) and
a mathematics text book.

MTBF PRSP 2007 – 2011 Page 33 of 224
• provide each second cycle pupil with four text books: French language, maths, physical science and natural science;
• produce and disseminate a text book management guide in all schools; • create and equip libraries and reading corners in schools or classes; • prepare a training module for teachers in reading, as well as the use and pedagogic
management of libraries and reading corners.
101. Second Cycle of Basic Education
• Construct and equip an average of 1,000 classrooms per year taking into account the school map/eligibility criteria for the site, including the existence of a water point and the objective of reducing regional disparities;
• rehabilitate about 200 classrooms and fit out about 200 classrooms for EBES; • equip all public and community schools with separate boys-girls latrines, far from
each other; • increase the number of school canteens on the initiative of LAs so as to improve
access to schools, particularly for girls.
102. Informal Education
• provide CEDs with pedagogic text books and guides so that each CED teacher has 2 text books (language and maths) and about 10 guides, and each learner has two text books (language and maths) ;
• provide initial and continuous training to CED teachers; • support literacy education for adults with CFAF 4.24 billion per year; and • prepare and implement a professional training strategy for auditors of CAF, CAFÉ and
CED learners in consultation with MEN and MEFP.
5.2.2 General Secondary Education (ESG), Technical and Vocational Education (ETP), and Apprenticeship Component
103. General Secondary Education (ESG)
• construct 3 high schools with 12 classes each; • rehabilitate classrooms and offices in 5 high schools; • rehabilitate/construct washroom facilities in 24 public high schools.
104. Human Resources
• recruit 400 teachers for ESG ; • provide continuous training for an average of 500 teachers per year; • train 200 language teachers in the teaching of French; • train 120 laboratory assistants throughout the project; • train 184 computer maintenance workers, comprising 100 workers for private high
schools and 84 for public high schools, and • enhance supervision through continuous training of Inspectors and administrative
staff of ESG.
105. Pedagogical Environment
• revise the teaching series and programmes; • provide the CDI of more than 50 high schools with books and introduce a loan
system; • provide school text books to more than 50 high schools and introduce a system for
lending out text books to pupils; and • construct and equip a maximum of 25 laboratories (15 for the private sector), 25
computer rooms (15 for the private sector) and 25 documentation and information centres (15 for the private sector).
106. Improvement of the Management System
MTBF PRSP 2007 – 2011 Page 34 of 224
• establish School Management Committees (CGS) in high schools for participatory management; and
• develop the scheme of work in high schools through training.
107. Technical and Vocational Training (ETP)
• construct and equip eight (8) industrial and/or agro-sylvo-pastoral training centres (Kidal, Kita, Koulikoro, Niono, Kayes, Sikasso, Bamako and Yélimané) ;
• rehabilitate/extend three (3) public centres: Koutiala, Gao, Fana; • construct 3 industrial workshops in Technical High School, Bamako, to introduce new
tracks.
108. Human Resources
• create and construct an ETP Teachers’ Training Institute; • provide initial training for 35 technical education teachers per year abroad (in 2006
and 2007) ; • train 42 maintenance workers; • prepare and implement a plan for ETP staff (trainers, administrators, support staff) ; • provide further training to 1,500 trainers and 500 administrators and support staff of
the public and private sectors following a continuous training programme.
109. Pedagogical Environment and Content:
• reproduce 10,000 copies of pedagogical documents for public institutions and approved private institutions;
• 20 former programmes will be translated into APC ; • organize a training programme in Information and Communication Technology (TIC) ; • provide approved public and private institutions with computer equipment; • transform the libraries of 36 public and private schools into Documentation and
Information Centres; and • establish an information, sensitization and orientation system on ETP and a
monitoring system for the integration of graduates.
110. Improve management of the system
• transform the vocational training centre into a public institution with financial and pedagogical autonomy;
• adopt the ETFP policy upon consultation with all partners of the ETFP (within the context of decentralization) to define the main aspects of the autonomy; and
• review the legal and regulatory texts of the ETFP and their implementation.
111. Vocational Training through Apprenticeship
• Training of 22,899 failed pupils in Basic 1 for one year in various trades in partnership with the private sector; and
• Qualifying modular training of 5,500 young school drop outs from Basic 2 for 3 years in Public Apprenticeship Centres.
112. Improvement of the quality and internal efficiency of apprenticeship centres
• Train 500 handicraft instructors and 300 endogenous trainers (trainers of the productive private sector) to increase supervisory possibilities in enterprises;
• Train about 150 trainers of private and public centres and about 50 workers of the private and public sectors in training engineering;
• Prepare course and programme aids for 30 new trades; • Reproduce training and programme aids for 30 trades; • Prepare apprenticeship regulations, and put in place a mechanism for certification
and validation of experience acquired.

MTBF PRSP 2007 – 2011 Page 35 of 224
5.2.3 Higher Education and Research Component • search for information on labour market demand, which will be used in defining the
needs, as well as job profiles and training to be developed (work to be done in collaboration with the Employment and Training Observatory) ;
• prepare statutory regulations for professional teachers as required by training (consideration of professional experience acquired in productive sector enterprises, time for practicals, contacts with professional circles, monitoring of internship of students and initiation of collaboration/transfer of technology activities with enterprises) ;
• enhance the autonomy of institutions to allow for more flexible management of resources (diversified resources from the State, enterprises, service contracts or from pupils, management of expensive equipment which requires maintenance and consumption of workpieces, contractualization of professionals from enterprises, more diversified teaching methods through practicals, alternation or internships in enterprises) ;
• prepare, with the professional branches, valid certificates for the private and public sectors which facilitate recognition of the level of skills on the labour market and development of a career path by students through equivalents and platforms;
• develop 10 short vocational tracks, including feasibility studies, buildings and equipment required for the tracks; train and recruit about 35 teachers for these tracks;
• create regional university centres in accordance with the results of the feasibility study;
• rehabilitate libraries; • construct and equip the Central University Library (BUC); • reinforce university infrastructures (buildings and science equipment) ; • strengthen the capacities of the teaching corps, with priority for tracks that are
becoming professional and are upgraded to LMD through continuous training; • create a competitive research fund; • improve access to science and technical information (improvement of the university
network) ; • establish monitoring, management and control instruments corresponding to the
autonomy granted to institutions and their capacity to manage their own resources; • design an information, school management and accounting system for higher
education institutions; • provide equipment for communication networks; • train administrative employees in these new networks; • design and implement a method of financing that allocates part of the budget of
higher education institutions on a contractual basis.
5.2.4 General Administration Component • put in place a new institutional plan of the Ministry responsible for Education; • define framework documents for decentralization ; • gradually install operational planning tools; • finalize and implement a new communication strategy.
113. Management of Reform and Consultations
• establish a management structure for institutional reform in the Office of MEN; • ensure management at the regional level; • revitalize consultation organs on the reform.
114. Decentralization of Education and Transfer of Powers
• transfer powers in education and related resources as from January 2007; • provide support/advisory services to Local Authorities (LA) and School Management
Committees (CGS); • train CGS in planning, implementation, monitoring and evaluation of school projects in
line with a strategy developed by the Support Unit for the Decentralization -
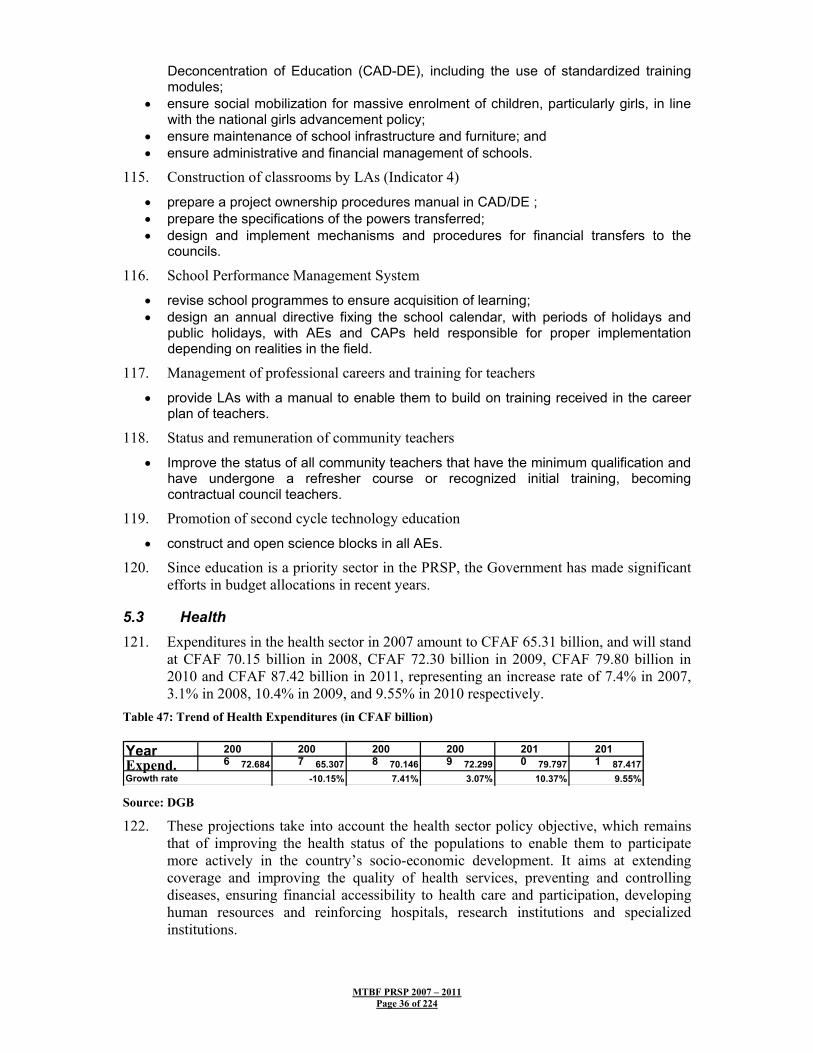
MTBF PRSP 2007 – 2011 Page 36 of 224
Deconcentration of Education (CAD-DE), including the use of standardized training modules;
• ensure social mobilization for massive enrolment of children, particularly girls, in line with the national girls advancement policy;
• ensure maintenance of school infrastructure and furniture; and • ensure administrative and financial management of schools.
115. Construction of classrooms by LAs (Indicator 4)
• prepare a project ownership procedures manual in CAD/DE ; • prepare the specifications of the powers transferred; • design and implement mechanisms and procedures for financial transfers to the
councils.
116. School Performance Management System
• revise school programmes to ensure acquisition of learning; • design an annual directive fixing the school calendar, with periods of holidays and
public holidays, with AEs and CAPs held responsible for proper implementation depending on realities in the field.
117. Management of professional careers and training for teachers
• provide LAs with a manual to enable them to build on training received in the career plan of teachers.
118. Status and remuneration of community teachers
• Improve the status of all community teachers that have the minimum qualification and have undergone a refresher course or recognized initial training, becoming contractual council teachers.
119. Promotion of second cycle technology education
• construct and open science blocks in all AEs.
120. Since education is a priority sector in the PRSP, the Government has made significant efforts in budget allocations in recent years.
5.3 Health 121. Expenditures in the health sector in 2007 amount to CFAF 65.31 billion, and will stand
at CFAF 70.15 billion in 2008, CFAF 72.30 billion in 2009, CFAF 79.80 billion in 2010 and CFAF 87.42 billion in 2011, representing an increase rate of 7.4% in 2007, 3.1% in 2008, 10.4% in 2009, and 9.55% in 2010 respectively.
Table 47: Trend of Health Expenditures (in CFAF billion)
Source: DGB
122. These projections take into account the health sector policy objective, which remains that of improving the health status of the populations to enable them to participate more actively in the country’s socio-economic development. It aims at extending coverage and improving the quality of health services, preventing and controlling diseases, ensuring financial accessibility to health care and participation, developing human resources and reinforcing hospitals, research institutions and specialized institutions.
Year 2006
2007
2008
2009
2010
2011 Expend. 72.684 65.307 70.146 72.299 79.797 87.417
Growth rate -10.15% 7.41% 3.07% 10.37% 9.55%

MTBF PRSP 2007 – 2011 Page 37 of 224
123. Consequently, the policy to recruit 305 workers under the Health and Social Development Programme will continue. Special emphasis will be laid on equipment-investment:
• pursue the equipment of CSCOMs and allocation of financial resources to poor areas; • construct new CSCOMs and create new health districts; • construct and equip regional traditional medicine centres; • construct and equip premises for the Department of Pharmacy and Drugs, and the
Health Inspectorate; • construct the Mother and Child Centre of Nianankoro FOMBA Hospital, Ségou ; • equip the National Health Laboratory; and • equip the IOTA.
5.3.1 Sub-Component 1: Geographic accessibility to health services in health districts:
124. The proposed activities are:
• create new CSCOMs; • develop existing CSCOMs, and revitalize non-functional CSCOMs; • reinforce mobile teams and services at the community level; • develop collaboration partnership with private sector service providers; • establish appropriate technical support centres in CSREFs, including emergency
surgery; • establish and improve counter-referral and evacuation systems.
5.3.2 Sub-Component: Availability, Quality and Management of Human Resources
125. The proposed relevant activities are:
• increase the total production capacity of all paramedical training schools (public and private) ;
• enable the students to undergo adequate practical internships; • make training programmes adequate for the health policy; • revise training modules and refresher courses as necessary; • provide health structures with adequate qualified staff; • conduct a package of reforms based on a human resource management and
development policy and a multi-year implementation plan, taking into account the reform of the administration ;
• provide MS with short and long-term technical assistance (TA) based on a rollover multi-year TA plan.
5.3.3. Sub-Component 3: Availability of Drugs, Vaccines and Medical Consumables
126. The proposed relevant activities are:
• ensure availability of essential drugs, vaccines and consumables, as well as laboratory tests in CSCOMs and CSREFs in all areas, particularly in poor areas and areas with difficult accessibility;
• make essential drugs financially accessible throughout the country.
5.3.4 Sub-Component 4: Improvement of quality of health services, increase in demand and control of diseases
The proposed relevant activities are:
• reinforce the integrated disease surveillance approach and response (SIMR) ; • manage patients in line with the standards and protocols of the pathology concerned; • improve hygiene and control of disease vectors in health institutions, work
environment, schools, and food establishments) ; • supervise health institutions, as well as health workers regularly;
MTBF PRSP 2007 – 2011 Page 38 of 224
• ensure availability of essential drugs, including ARVs ; • intensify intersectoral collaboration with private sector service providers and the civil
society; • initiate community activities by district health teams; • initiate community preventive and promotional health care activities; • meet the nutrition requirements of the populations through specific interventions in the
minimum activity package (PMA).
5.3.5 Sub-Component 5: Financial accessibility and support to demand and participation
128 The proposed relevant activities are:
• reinforce the third-party payer mechanism so as to promote access by the poor to quality health care in health institutions;
• subsidize essential health services package for the poor and vulnerable groups; • contribute to the implementation of alternative financing for the management of poor
populations in the health care system.
5.3.6 Sub-component 6: Reform of hospital and other research institutions
129. The proposed relevant activities are:
• prepare the various implementing texts of the hospital law and their PHE status taking into account the economic plan of the schemes of work;
• improve the health status of the population by providing specialized institutions, including research institutions.
5.3.7 Sub-Component 7: Institutional capacity building and decentralization
130. The proposed relevant activities are:
• transfer part of the technical and financial powers to the local authorities so as to effectively manage health problems in councils, districts and regions;
• support health services to accomplish their mission and play their role in the implementation of PRODESS II.
5.4 Other Social Sectors 131. In 2007, expenditures for the other social sectors (Social Development, Employment
and Vocational Training) amount to CFAF 44.50 billion. They will stand at CFAF 46.50 billion in 2008, CFAF 46.02 billion in 2009, CFAF 49.12 billion in 2010, and CFAF 52.13 billion in 2011. The increases are due to the medium-term policy of the sector, comprising:
• conduct of studies required for knowledge of the handicap phenomenon; • develop support for self-employment initiatives for handicapped persons; • organize sensitization, information and education campaigns on the problem of senior
citizens; • conduct studies on the phenomenon of ageing; • conduct of studies on nicotinism, alcoholism, drug addiction and prostitution ; • construct and equip CNAOM ; • construct the headquarters of the National Solidarity Fund; • implement the youth employment programme; • implement the multi-sector rural employment investment programme (PROMIER); • rehabilitate youth centres; • reinforce the facilities of national youth camps; • implement the vocational training by apprenticeship programme; • restore the West Tribune and lighting of the Mamadou KONATE Stadium and
rehabilitate Ouézin COULIBALY stadium;
MTBF PRSP 2007 – 2011 Page 39 of 224
• fit out the Hunting and Shooting Museum in Yanfolila; • construct and equip the "Maison des Arts et Cultures" (Arts and Culture Centre),
Kidal; and • provide support to grassroots PAIB extension initiatives.
In PRODESS II, the social development component has five sub-components, namely:
5.4.1 Sub-Component 1: Strengthening of Solidarity and Fight against Exclusion
132. Some of the proposed relevant activities are:
• conduct 2 studies required for knowledge of the specific needs of the handicapped; • support the enrolment and education of 10,000 handicapped persons; • organize a national training of trainers workshop and 9 regional senior citizens
workshop for socio-health workers and the civil society; and • support three transit centres (Bamako, Sikasso and Mopti) and 11 psychological and
social supervision centres (3 in Bamako and 8 in the regions).
5.4.2 Sub-component 2: Poverty Reduction
133. Some of the proposed relevant activities are:
• organize accompanying training sessions for 1,350 social workers and social development partners in the management of cooperative societies, mutual benefit societies, SFDs and groups in the regions and Bamako District;
• finance 50 projects and AGRs for 3,000 persons in the Old Persons Assistance Programme;
• finance 250 individual and collective projects for the self-employment of handicapped persons; and
• establish a pilot project in 4 regions and Bamako District on the development and economic accessibility of traditional medicine.
5.4.3 Sub-Component 3: Reinforcement of Social Security
134. Some of the proposed relevant activities are:
• conduct an actuarial study on the pension scheme of CRM, as well as INPS schemes; • conduct the financial and institutional audit of CRM and INPS; • organize 3 consultations on coverage of natural risks in the agricultural sector; • support the creation of 200 social and solidarity health insurance organizations
(mutual benefit societies, solidarity funds); and • organize training sessions and study trips for administrators and senior staff of social
and solidarity health insurance organizations.
5.4.4 Sub-Component 4: Institution Building
135. Some of the proposed relevant activities are:
• construct/rehabilitate new buildings for central, attached and associated partner services;
• construct premises for regional CNPAM stations in each region and Bamako District; • prepare a directory of stakeholders of the social and solidarity sector; • create a National Information, Education and Communication Centre (CNIEC) in the
Ministry; • create a Website in the Ministry; • conduct 10 annual control missions by IAS to structures and agencies under the
supervisory authority of MDSSPA; • prepare and implement a strategy and programme for fighting against some social
evils (alcoholism, nicotinism, drug addiction, and prostitution) ; • establish a legal and regulatory framework for the transfer of powers in development
matters to local authorities.
MTBF PRSP 2007 – 2011 Page 40 of 224
5.4.5 Sub-Component 5: Human Resource Development
136. Some of the proposed relevant activities are:
• recruit more than 60 social workers (civil servants or contract officers) per year for five years;
• train 70 INFTS teachers; • train trainers and workers in SISo software; • recruit 10 permanent INFTS teachers; • train teachers of MDSSPA and partner structures in gender and development each
year; • organize further training in foreign mutual benefit groups (2 per year) ; • organize study trips on ageing; and • conduct a study on incentives for MDSSPA staff.
5.5 Conditions for Budget Support (Social Sector) 137. The tables below give us the common conditions for budget support to specific
sectoral arrangements for the education, health and social development sectors.

MT
BF
PRSP
200
7 –
2011
Pa
ge 4
1 of
224
Tab
le 4
8: C
omm
on C
ondi
tions
Fra
mew
ork
(Edu
catio
n)
From
*
FIX
ED
TR
AN
CH
ES
A
. Mac
ro T
rigge
rs
1.
Exi
sten
ce o
f an
appr
ecia
ted
sust
aina
ble
mac
ro-e
cono
mic
fram
ewor
k, p
artic
ular
ly o
n th
e ba
sis
of a
pos
itive
con
clus
ion
of o
ne
of th
e an
nual
revi
ews
of th
e IM
F pr
ogra
mm
e IM
F A
nnua
l Rev
iew
Rep
ort
2.
Posi
tive
conc
lusi
on o
f PR
SP re
view
for y
ear
N-1
PR
SP A
nnua
l Rev
iew
Rep
ort
3.
Po
sitiv
e co
nclu
sion
of r
evie
w o
f act
ion
plan
to im
prov
e an
d m
oder
nize
pub
lic fi
nanc
e m
anag
emen
t for
yea
r N-1
PA
GA
MG
FP A
nnua
l Rev
iew
R
epor
t
B. S
ecto
ral T
rigge
rs
4.
Sha
re o
f rec
urre
nt b
udge
t of e
duca
tion
sect
or in
the
recu
rrent
Sta
te b
udge
t (to
be
upda
ted
at e
nd Ju
ne in
line
with
the
over
all M
TEF)
20
06
30.0
7%
2007
30
.12%
20
08
30.1
7%
2009
30
.22%
Fi
nanc
e B
ill
5.
Bud
get f
or y
ear N
+1 in
acc
orda
nce
with
the
appr
oved
MTE
F an
d de
mon
stra
ting
addi
tiona
lity
of A
BS
MTE
F an
d Fi
nanc
e B
ill
6.
In
tra-s
ecto
ral b
reak
dow
n in
acc
orda
nce
with
MTE
F Fi
nanc
e B
ill
7.
Pub
lic E
xpen
ditu
re R
evie
w (P
ER
) of v
alid
ated
PIS
E II
for y
ear N
-1, i
nclu
ding
indi
cato
rs b
ased
on
the
logi
cal f
ram
ewor
k a
nd
the
stat
istic
s ye
arbo
ok
Val
idat
ed P
ublic
Exp
endi
ture
R
evie
w/S
tatis
tics Y
ear B
ook
8. E
xist
ence
of a
n an
nual
val
idat
ed a
ctio
n pl
an N
+1 fo
r im
plem
enta
tion
of P
ISE
II
Val
idat
ed A
nnua
l Act
ion
Plan
9.
Exis
tenc
e of
favo
urab
le P
ISE
audi
t for
yea
r N-1
and
impl
emen
tatio
n of
the
reco
mm
enda
tions
bas
ed o
n au
dit N
-2
Aud
it re
port
V
AR
IAB
LE
TR
AN
CH
ES
2004
(ref
eren
ce)
2005
20
06
2007
20
08
2009
Est
im.
Act
ual
Act
ual
Est
im.
Est
im.
Est
im.
Est
im.
Edu
catio
n In
dica
tors
1.
Perc
enta
ge o
f pup
ils w
ho o
btai
ned
the
aver
age
in R
eadi
ng a
nd M
athe
mat
ics i
n 2nd
an
d 5th
yea
rs o
f the
firs
t cyc
le o
f bas
ic
educ
atio
n (b
ase
PASE
C)
2nd y
ear:
51%
in
Rea
ding
48
% in
M
athe
mat
ics
5th y
ear:
43%
in
Rea
ding
42
% in
M
athe
mat
ics
2nd y
ear:
60%
in
Rea
ding
60
% in
M
athe
mat
ics
5th y
ear:
60%
in
Rea
ding
60
% in
M
athe
mat
ics
St
udy
repo
rt (P
ASE
C)
2.
Perc
enta
ge o
f im
plem
ente
d re
curre
nt b
udge
t N
-1 in
com
paris
on to
recu
rren
t bud
get
earm
arke
d fo
r the
sect
or
100%
98
.65%
96
.97%
≥9
5%
≥95%
≥9
5%
Pu
blic
Exp
endi
ture
Rev
iew
(P
ER)
3.
Perc
enta
ge re
curr
ent r
esou
rces
tran
sfer
red
to
deco
ncen
trate
d se
rvic
es in
impl
emen
tatio
n of
bu
dget
N-1
53.5
%
62.0
5%
x 60
%
60%
60
%
Pu
blic
Exp
endi
ture
Rev
iew
(P
ER)
4.
Perc
enta
ge o
f rec
urre
nt re
sour
ces t
rans
ferr
ed
to L
ocal
Aut
horit
ies i
n th
e im
plem
enta
tion
of
As f
rom
20
06-
Publ
ic E
xpen
ditu
re R
evie
w
(PER
)
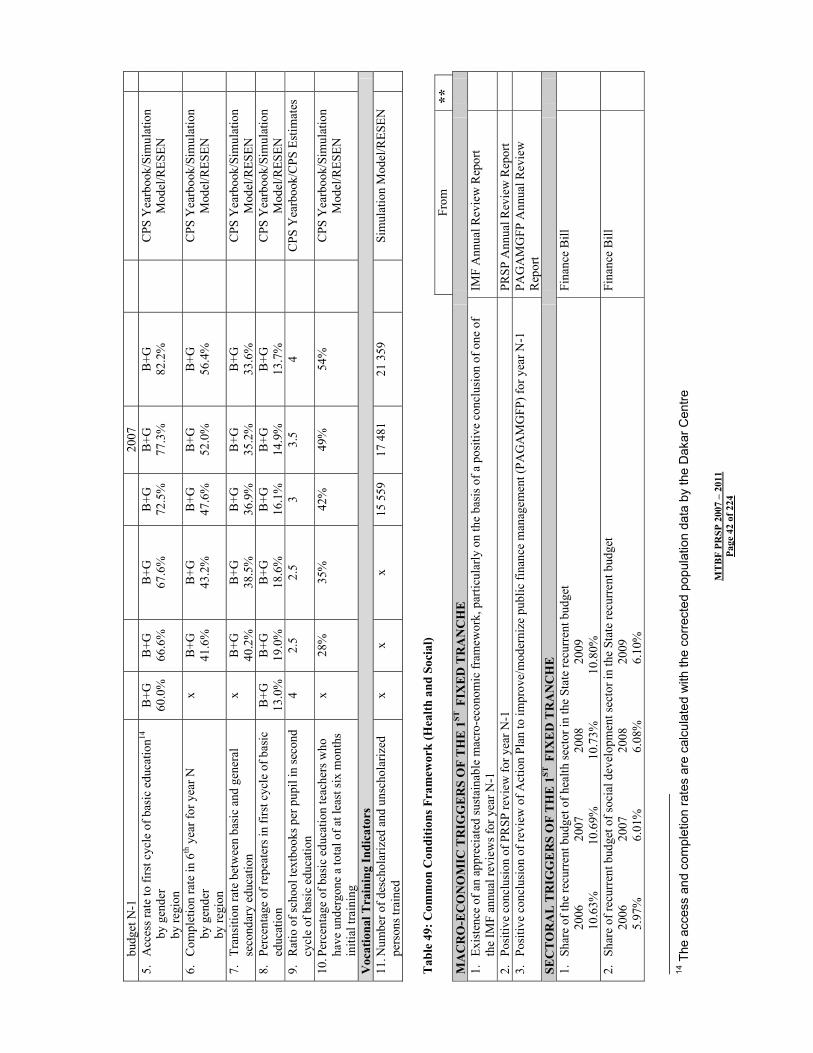
MT
BF
PRSP
200
7 –
2011
Pa
ge 4
2 of
224
budg
et N
-1
2007
5.
A
cces
s rat
e to
firs
t cyc
le o
f bas
ic e
duca
tion14
by
gen
der
by re
gion
B+G
60
.0%
B
+G
66.6
%
B+G
67
.6%
B
+G
72.5
%
B+G
77
.3%
B
+G
82.2
%
C
PS Y
earb
ook/
Sim
ulat
ion
Mod
el/R
ESEN
6.
Com
plet
ion
rate
in 6
th y
ear f
or y
ear N
by
gen
der
by re
gion
x B
+G
41.6
%
B+G
43
.2%
B
+G
47.6
%
B+G
52
.0%
B
+G
56.4
%
C
PS Y
earb
ook/
Sim
ulat
ion
Mod
el/R
ESEN
7.
Tran
sitio
n ra
te b
etw
een
basi
c an
d ge
nera
l se
cond
ary
educ
atio
n x
B+G
40
.2%
B
+G
38.5
%
B+G
36
.9%
B
+G
35.2
%
B+G
33
.6%
CPS
Yea
rboo
k/Si
mul
atio
n M
odel
/RES
EN
8.
Perc
enta
ge o
f rep
eate
rs in
firs
t cyc
le o
f bas
ic
educ
atio
n B
+G
13.0
%
B+G
19
.0%
B
+G
18.6
%
B+G
16
.1%
B
+G
14.9
%
B+G
13
.7%
CPS
Yea
rboo
k/Si
mul
atio
n M
odel
/RES
EN
9.
Rat
io o
f sch
ool t
extb
ooks
per
pup
il in
seco
nd
cycl
e of
bas
ic e
duca
tion
4 2.
5 2.
5 3
3.5
4
CPS
Yea
rboo
k/C
PS E
stim
ates
10. P
erce
ntag
e of
bas
ic e
duca
tion
teac
hers
who
ha
ve u
nder
gone
a to
tal o
f at l
east
six
mon
ths
initi
al tr
aini
ng
x 28
%
35%
42
%
49%
54
%
C
PS Y
earb
ook/
Sim
ulat
ion
Mod
el/R
ESEN
Voc
atio
nal T
rain
ing
Indi
cato
rs
11. N
umbe
r of d
esch
olar
ized
and
uns
chol
ariz
ed
pers
ons t
rain
ed
x x
x 15
559
17
481
21
359
Sim
ulat
ion
Mod
el/R
ESEN
Tab
le 4
9: C
omm
on C
ondi
tions
Fra
mew
ork
(Hea
lth a
nd S
ocia
l)
From
**
M
AC
RO
-EC
ON
OM
IC T
RIG
GE
RS
OF
TH
E 1
ST F
IXE
D T
RA
NC
HE
1.
Ex
iste
nce
of a
n ap
prec
iate
d su
stai
nabl
e m
acro
-eco
nom
ic fr
amew
ork,
par
ticul
arly
on
the
basi
s of a
pos
itive
con
clus
ion
of o
ne o
f th
e IM
F an
nual
revi
ews f
or y
ear N
-1
IMF
Ann
ual R
evie
w R
epor
t
2.
Posi
tive
conc
lusi
on o
f PR
SP re
view
for y
ear N
-1
PRSP
Ann
ual R
evie
w R
epor
t
3.
Posi
tive
conc
lusi
on o
f rev
iew
of A
ctio
n Pl
an to
impr
ove/
mod
erni
ze p
ublic
fina
nce
man
agem
ent (
PAG
AM
GFP
) for
yea
r N-1
PA
GA
MG
FP A
nnua
l Rev
iew
R
epor
t
SEC
TO
RA
L T
RIG
GE
RS
OF
TH
E 1
ST F
IXE
D T
RA
NC
HE
1.
Sh
are
of th
e re
curr
ent b
udge
t of h
ealth
sect
or in
the
Stat
e re
curr
ent b
udge
t
2006
2007
2008
2009
10.6
3%
10.6
9%
10.7
3%
1
0.80
%
Fina
nce
Bill
2.
Shar
e of
recu
rren
t bud
get o
f soc
ial d
evel
opm
ent s
ecto
r in
the
Stat
e re
curr
ent b
udge
t
2006
2007
2008
2009
5.97
%
6.
01%
6.08
%
6.
10%
Fina
nce
Bill
14
The
acc
ess
and
com
plet
ion
rate
s ar
e ca
lcul
ated
with
the
corre
cted
pop
ulat
ion
data
by
the
Dak
ar C
entre
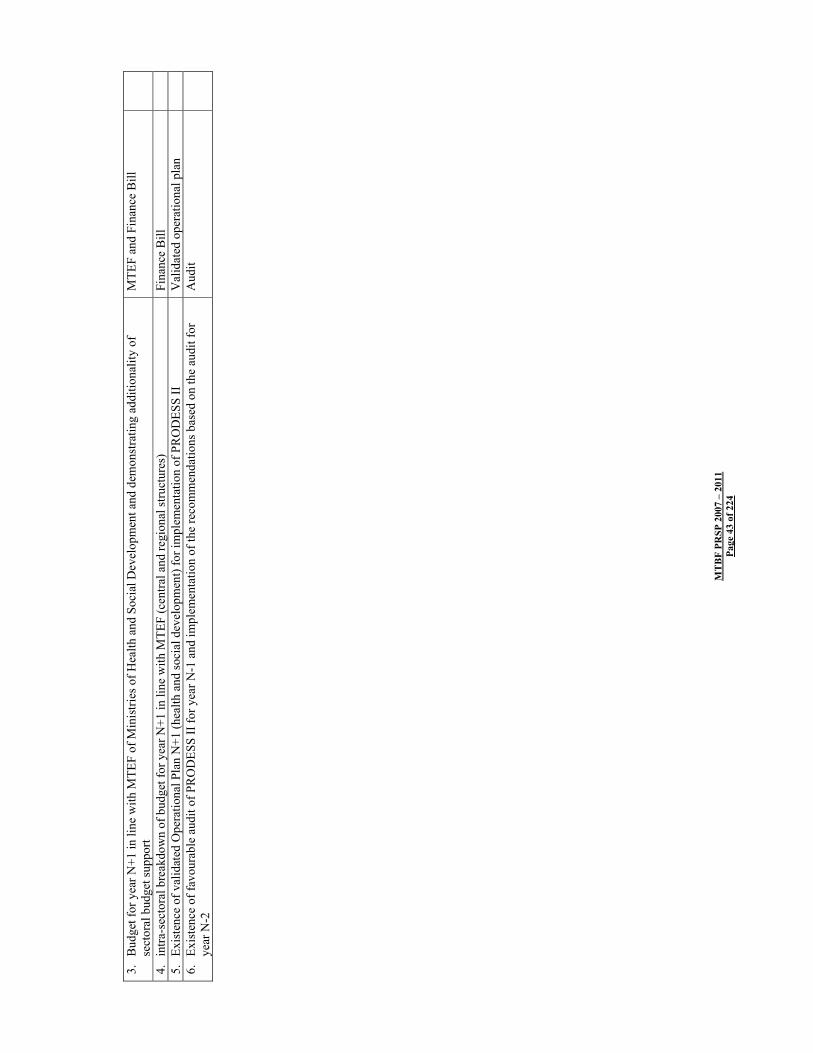
MT
BF
PRSP
200
7 –
2011
Pa
ge 4
3 of
224
3.
Bud
get f
or y
ear N
+1 in
line
with
MTE
F of
Min
istri
es o
f Hea
lth a
nd S
ocia
l Dev
elop
men
t and
dem
onst
ratin
g ad
ditio
nalit
y of
se
ctor
al b
udge
t sup
port
MTE
F an
d Fi
nanc
e B
ill
4.
intra
-sec
tora
l bre
akdo
wn
of b
udge
t for
yea
r N+1
in li
ne w
ith M
TEF
(cen
tral a
nd re
gion
al st
ruct
ures
) Fi
nanc
e B
ill
5.
Ex
iste
nce
of v
alid
ated
Ope
ratio
nal P
lan
N+1
(hea
lth a
nd so
cial
dev
elop
men
t) fo
r im
plem
enta
tion
of P
RO
DES
S II
V
alid
ated
ope
ratio
nal p
lan
6.
Ex
iste
nce
of fa
vour
able
aud
it of
PR
OD
ESS
II fo
r yea
r N-1
and
impl
emen
tatio
n of
the
reco
mm
enda
tions
bas
ed o
n th
e au
dit f
or
year
N-2
A
udit
5.6 Culture, Youth and Sports 138. In 2007, expenditures relating to the culture, youth and sports sector amount to CFAF
13.67 billion. They will stand at CFAF 14.78 billion in 2008, CFAF15.76 billion in 2009, CFAF 17.15 billion in 2010, and CFAF 18.13 billion in 2011. The progress is due to the medium-term sector policy, particularly in the youth and sports sector. The three-year development action plan for the youths is divided into five pillars:
5.6.1 Pillar I: Socio-education supervision of youths: • train at least 60% benevolent and/or voluntary youths in first degree socio-educative
animation techniques; • organize practical immersion courses for benevolent and/or voluntary youths in first
degree animation techniques; • implement programmes of extra-curricular activities for youths from 10 to 18 years
old; • train stakeholders/ youths in schools/CED ; • create extra-curricular education associations in schools/CED of rural councils; • create a network of stakeholders/youths from schools/CED; • define an extra-curricular minimum activities package (PMA) for youths; • organize sports, artistic and cultural activities for youths; • organize refresher courses for youth administration staff in sports, cultural and artistic
activities; • prepare training modules for socio-educational activities in rural areas; • teach training modules for socio-educational activities in rural areas in the National
Youth and Sports Institute; and • promote youth activities in institutions in rural and urban areas.
5.6.2 Pillar II: Youths and Social Vulnerability: • prepare a programme for the education of youths in social life as regards social
development, health and justice services; • implement the programme for education in social life in homes, meetings, as well as
youth centres and associations; • prepare a programme for education in social life in line with the needs of rural youths; • train peers educators for youths in social life in rural areas; • implement the programme for education of youths in rural areas; • inform and sensitize youths on environmental protection; • organize reforestation and sanitation worksites; • create youth programmes in at least one radio station for all rural and urban councils,
and councils with a radio station; • provide socio-educational youth facilities with cybercafés; • develop a local campaign by using education peers and youth centres; • include a STI/HIV/AIDS sub-component in youth supervision programmes; • train peer educators in communication skills for change in behaviour in youth circles; • develop a multimedia education campaign on reproductive health; • develop reproductive health activities for girls in rural schools; and • inform girls on the risks of intentional abortion.
5.6.3 Pillar III: Youths and Socio-economic Integration: • disseminate the youth promotion advisory assistance guide in regions and youth
associations; • prepare a youth promotion advisory assistance guide;

MTBF PRSP 2007 – 2011 Page 45 of 224
• train and sensitize elected municipal officers on the importance of youth promotion in the country’s social, economic and cultural development.
5.6.4 Pillar IV: Capacity building for youth associations in mobilization, citizenship and participation in public life
• Train youth associations in assistance and advisory services, as well as animation techniques;
• Organize youths in the design and implementation of the life education programme. • Train association officials in management, programming, search for financing and
administration.
5.6.5 Pillar V: Institution Building • Prepare texts for the establishment and functioning of youth centres; • Construct and equip youth centres in two regional capitals; • Construct and equip two youth centres in districts and councils; • Enroll 70 pupils and students per year in the socio-education track; • Refresher courses for 20 middle youth staff in animation sciences and techniques
(STA).
5.7 Rural Development and Environment 139. In 2007, expenditures of the “rural development and environment” sector amount to
CFAF 131.20 billion. They will stand at CFAF 132.91 billion in 2008, CFAF 145.56 billion in 2009, CFAF 158.22 billion in 2010, and CFAF 170.30 billion in 2011, representing an increase rate of 1.3% in 2007, 9.5% in 2008, 8.7% in 2009 and 7.6% in 2010 respectively. The increases are due to the implementation of the Rural Development Sector Master Plan, which has the following objectives:
• increase the contribution of the rural development sector to the country’s economic growth;
• strengthen food security and self-sufficiency; • improve the incomes and living conditions of the rural populations; • protect the environment and ensure better management of natural resources; • These objectives will be achieved through the following programmes or actions: • support to agricultural services and farmer organizations; • enhancement of food security; • development of agricultural sub-sectors and improvement of their competitiveness; • revitalization of agricultural, forestry, livestock and fishery exports; • intensification and diversification of agricultural products; • strengthening of food security; • promotion of loans and financing for the rural sector; • rational management of natural resources to ensure sustainable rural development;
and • finalization and implementation of local development plans.
5.8 Transport 140. Expenditures of this sector in 2007 amount to CFAF 13.75 billion. They will stand at
CFAF 14.58 billion in 2008, CFAF 15.97 billion in 2009, CFAF 18.13 billion in 2010, and CFAF 19.98 billion in 2011, representing an increase rate of 6.0% in 2007, 9.5% in 2008, 13.6% in 2009 and 10.2% in 2010 respectively. The medium-term policy of the sector is as follows:
MTBF PRSP 2007 – 2011 Page 46 of 224
5.8.1 Pillar 1: Internal accessibility of Mali – Rural Transport (roads – river ways) For this pillar, the actions concern studies and rehabilitation of infrastructures and equipment
Rehabilitation of infrastructures and equipment 141. The following feeder roads will be improved:
• Douentza -Bandiagara - 155 km • Douentza -Koro- 100 km • Banamba - Mourdiah - 110 km • Gossi - Rharouss - 147 km • Gao - Bourem - 95 km
Rehabilitation of boats • The entire river fleet will be maintained.

MTBF PRSP 2007 – 2011 Page 47 of 224
The following studies will be conducted: • Study on efficient trucking • Study on river transport • Study on the dry ports of Kayes and Sikasso • Interurban/urban roads • Study on internal accessibility • Study on a River Code.
5.8.2 Pillar 2: Internal Accessibility of Mali - urban and interurban transport (Roads, Rail, Air)
142. The actions concern the construction and equipment of infrastructures, tarring of roads, and improvement of modern earth roads.
Construction of infrastructures and equipment • Construction of dry ports in Kayes and Sikasso • Construction of motor parks
Tarred roads (interurban) • Markala - Niono -70 km • Kayes - Diamou -Bafoulabé - 130 km • Fana - Dioila - 40 km • Koulikoro - Banamba - 90 km • Banankoro - Dioro - 35 km
Modern earth roads • Tonka -Goundam – Tombouctou
Tarred roads (urban) • Urban roads phase II – 4.5 km • Urban roads Gao, Tombouctou, Bandiagara • Koutiala, Bougouni, Kita - 30 km
Rehabilitation of Infrastructures • Purchase of equipment for TRANSRAIL
Procurement and operation of equipment • Purchase of 4X4 vehicles • Purchase of 6 axle scales • Procurement of 4 flat-bottom boats • Purchase of service vehicles • Purchase of ferries
5.8.3 Pillar 3: External Accessibility of Mali (Roads-Rail-Air)
143. Here, actions concern feasibility studies, development of the storage capacity of some Malian warehouses in coastal countries, construction of infrastructures and equipment in some airports, and tarring of sections of national roads.
• Extension of Malian warehouses in Guinea • Extension of Malian warehouses in Togo • Extension of Malian warehouses in Mauritania • Construction of 3 store rooms and offices, and fitting out of existing offices in Conakry • Construction of a store room and administrative offices in Téma, Ghana • Construction of a store room and administrative offices in Lomé, Togo • Construction of a store room and administrative offices in Cotonou, Benin • Extension of the existing office and construction of a store room in Nouakchott,
Mauritania (EMAMAU) • Infrastructures of an ILS and a fuel depot at Tombouctou airport • Equipment of the ILS and fuel depot of Tombouctou airport
MTBF PRSP 2007 – 2011 Page 48 of 224
• Fencing of the security zone of Kayes airport • Fencing of the security zone of Sikasso airport • Construction of DNAC building • Equipment of DNAC Building • Infrastructures - Rehabilitation of Gao airport • Rehabilitation - Buildings and VRD of Gao airport • Rehabilitation of Gao airport
Tarring of national roads • Bko-Kati-Kolokani-Didiéni - 165 km • Kayes-Sandaré-Dièma - 270 km • Dièma - Didiéni - 180 km • Gao-Ansonga-Labbézanga -209 km • Bamako -Kourémalé - 123 km • Nioro - Gogui - 62 km • Sikasso - Koloko - Fre Burkina -44 km • Kayes - Diboli - Fre Sénégal - 97.545 km • Kati - Kita - 175 km • Kita - Saraya - Fre Sénégal - 310 km • Gao Bridge and access -14 km • Bamako - Bougouni -160 km • Bougouni- Sikasso- 210 km • Sevaré- Gao - 558 km
Improvement of rural roads • Tiendaga and Kankéla bridges - 125m
Studies • Study on supply and installation of an ILS and a fuel depot at Tombouctou airport • Feasibility studies on rehabilitation of Gao airport • Study on rehabilitation of Gao airport • Study on fencing the security zone of Kayes airport • Study on fencing the security zone of Sikasso airport • Study on supervision and control of works on the DNAC Building
5.8.4 Pillar 4: Maintain and preserve infrastructure and equipment of the rural network (roads - river ways)
144. It will consist in reinforcing infrastructures and equipment affected by weather or wear and tear and conduct maintenance feasibility studies.
Reinforcement and Periodic Maintenance Improved feeder roads
• Dioila - Sorokoro - 38 km • Dioila - Massigui -Koualé 137km • Didiéni - Goumbou - Nara 209 km • Kita - kourounikoto-Diangounté 178 km • Tambaga - Manantali 89 km • CMDT roads
Studies • Improved roads • Periodic maintenance • Tambaga - Manantali - 89 km

MTBF PRSP 2007 – 2011 Page 49 of 224
5.8.5 Pillar 5: Maintain and preserve infrastructures and equipment of the urban network
145. This pillar provides for studies and maintenance of some urban roads. Routine Maintenance Tarred roads
• Avenue Nelson Mandéla - 5 km • RR14 - Nelson Mandéla - 2 km • RR15 Square - Dalot woyo - 1 km • San market crossing - 1 km
Studies • Various urban road sections:153 ;187.5 ;187.5 ; 187.5 and 202.5 km
5.8.6 Pillar 6: Maintain and preserve infrastructures and equipment of the interurban network
146. This pillar provides for studies and routine maintenance of some sections of the interurban network.
Tarred roads • Faladiè - Ségou - 240 km • Sikasso - Zégoua -9 0 km • Bla - San - Sienso - 115 km • Access to Djenné - 29 km • Kimparana - Kouri - 82 km • Bamako - koulikoro - 54 km • Koulouba - Kati - 11 km • Modern earth roads • Mahina -Manantali - 87 km • Kayes - Sadiola - 74 km • Ansongo -Kismane -Ménaka - 222 km
Improved feeder roads • Douentza - Tombouctou - 200 km
Studies • Inter-urban roads • Tarred roads • Various road sections: 2902 ; 3459 ; 3678 ; 3902 and 4193 km • Modern earth roads • Various road sections: 1234 ; 1234 ; 1517 ; 1598 and 1674 km
5.8.7 Pillar 7: Capacity building for the institution and human resources 147. Pillar 7 has the following objectives: conduct of studies, restoration and construction
of infrastructures, purchase of equipment, and training of employees. Restructuring, establishment of new structures and constructions Technical Assistance
• DNR • AR • PME/BET
Studies and Training • Study on the restructuring of the National Transport Directorate • Training in ILS maintenance in Tombouctou airport • Study AGEROUTE

MTBF PRSP 2007 – 2011 Page 50 of 224
• Formation DNR/PME/BET Purchase of equipment Computerization of Regional Transport Directorates and their connection to the National Directorate of Transport:
• 80 computers • 80 UPS machines • 28 CITOH printers • 60 Laser printers • 05 CD PLAYER AND EXTERNAL BURNER • 02 MS Office XP
IGM • Purchase of IGM equipment • Repatriation of map records
DNM • Logistic support for irrigation and meteorological activities.
INFET • Equipment of the Documentation Centre
COMANAV • Purchase of equipment
5.8.8 Pillar 8: Improve levels of services, safety and security of transport and performance of BET/PME
The proposed actions are: Construction and security equipment
• Construction of control post • Fence along the railway in Bamako built-up area • Improvement of services.
Revitalization of the National Road Security Committee • Data collection • Road control • Study and road safety • Casualty management
Sensitization Activities • Sensitization campaigns; • Road Safety Week.
5.9 Town Planning and Public Works 149. Expenditures of this sector in 2007 amount to CFAF 115.38 billion. It will stand at
CFAF 119.05 billion in 2008, CFAF 131.83 billion in 2009, CFAF 140.33 billion in 2010, and CFAF 150.91 billion in 2011, representing an increase rate of 3.2% in 2007, 10.7% in 2008, 6.5% in 2009, and 7.5% in 2010 respectively. The medium-term policy of the sector is as follows:
• preparation of town planning master plans in 12 towns; • construction of 1.975 low-cost housing units in the medium term in Bamako and
regional capitals; • preparation of nine (9) sector town planning plans; • development of the Natural Collector “Le Diafaranokô” ; • support for the collection and dissemination of average prices and indices of building
products and materials.
MTBF PRSP 2007 – 2011 Page 51 of 224
5.10 Communication 149. Expenditures of this sector in 2007 amount to CFAF 10.85 billion. They will stand at
CFAF 11.95 billion in 2008, 12.78 billion in 2009, CFAF 13.58 billion in 2010, and CFAF 14.49 billion in 2011, representing an increase rate of 10.1% in 2007, 7.0% in 2008, 6.3% in 2009, and 6.7% in 2010 respectively. The medium-term policy of the sector is as follows:
• preparation of the sector policy document of the Communication department; • production and broadcast of news, news magazines, debates and investigative
programmes for at least 25% of the air time; • extension of TV/FM coverage to areas not covered or poorly served; • modernization of the mail processing system at the international level (IPS).
5.11 Armed Forces and Security 150. Expenditures of the Armed Forces and Security in 2007 amount to CFAF 75.63
billion. They will stand at CFAF 77.29 billion in 2008, CFAF 83.32 billion in 2009, CFAF 93.86 billion in 2010, and CFAF 101.59 billion in 2011, representing an increase rate of 2.2% in 2007, 7.8% in 2008, 12.7% in 2009 and 8.2% in 2011 respectively. These increases are due to:
5.11.1 Armed Forces • recruitment into the army; • providing the Armed Forces with various modern communication equipment, major
equipment and musical equipment; • construction of a military hospital; • continuation of patrols throughout the country; and • continuous military training and further training.
5.11.2 Internal Security and Civil Protection • recruitment of 520 student Gendarmes, 750 Police Officers, 250 Civil Protection
Officers each year; • construction of Police Stations and houses for Commissioners of Police; • sensitization of the population on risks; • training of Security Forces and Civil Protection officers; • construction of Police Stations and houses for Commissioners of Police; • procurement of technical supplies (special equipment and materials); and • maintenance and renovation of buildings.
5.12 Debt - Principal and Interest 151. Expenditures relating to the payment of the principal and interest on debt for the 2007
financial year amount to CFAF 47.76 billion. They will stand at CFAF 46.05 billion in 2008, CFAF 47.41 billion in 2009, CFAF 48.68 billion in 2010, and CFAF 51.56 billion in 2011, representing an increase rate of -3.6% in 2007, 2.9% in 2008, 2.7% in 2009, and 5.9% in 2010 respectively. The debt policy aims at non-accumulation of payment arrears.
5.13 Mining – Water Resources and Industry 152. In 2007, the expenditures of the Mining, Water Resources and Industry sector amount
to CFAF 68.35 billion. They will stand at CFAF 72.88 billion in 2008, CFAF 79.63 billion in 2009, CFAF 85.12 billion in 2010, and CFAF 91.03 billion in 2011,

MTBF PRSP 2007 – 2011 Page 52 of 224
representing an increase rate of 6.6% in 2007, 9.3% in 2008, 6.9% in 2009, and 6.9% in 2010 respectively. The medium-term policy for the sector by area of intervention is as follows:
5.13.1 Mining
153. Specific Objectives:
• Improve the regulatory and institutional environment of the mining and petroleum sectors;
• intensify, develop and diversify mining resources; • put in place a mechanism for monitoring, controlling and evaluating mining and
petroleum activities and projects; • promote mines handicraft and small-scale mining; • put in place a financing mechanism for the mining sector; and • improve the management of mining activities.
154. Priority Actions
• Updating of the legal framework; • Institutional reform based on redefinition and refocusing of the missions of structures
operating in the mining sector; • Promotion of the mining sector through acquisition of geological data, incentives for
national mining promoters, creation and development of a local mining industry, and organization of handicraft activities;
• Training, through the establishment of a programme of academic and pluri-disciplinary training and courses to upgrade the level of staff involved in the mining sector, as well as by adapting school and university education to the needs of the mining industry, and providing incentives for mining companies and their sub-contractors in Mali to develop the skills of their staff.
5.13.2 Energy
155. Specific Objectives
• Satisfy the energy needs of the country in terms of quality, quantity and least cost; • Protect people, property and the environment against risks relating to energy
services; • Provide capacity building in orientation, management, control and strategic
management of the energy sector; • Strengthen the benefits of international cooperation for the country in the area of
energy.
156. Priority Actions
• Strengthening of institutional and regulatory framework of the emery sector; • Creation and implementation of an efficient energy planning system; • Development of domestic energy and rural electrification; • Streamlining of production and use of energy; • Promotion of alternative energy sources and traditional fuels; • Creation of a national buffer stock of hydrocarbons; • Improvement of control and monitoring of operators; • Development of the interconnected national workshop; • Development of electricity services to isolated areas; • Electricity interconnection with countries in the sub-region; • Development of renewable sources of energy; • Reinforcement of national radioprotection infrastructure;
MTBF PRSP 2007 – 2011 Page 53 of 224
• Promotion of exploration of hydrocarbons and solid and gaseous fuels; • Establishment of an institutional, legal and regulatory framework adapted to the
development needs of the national energy sector; • Promotion of measures for capacity building in human, material and financial
resources for public, parapublic and private stakeholders of the energy sector; • Promotion of communication and consultation between the various stakeholders of
the energy sector; and • Support and participation in sub-regional, regional and international energy projects
and programmes.
5.13.3 Water
157. Objectives Reduce, by 2015 and by at least 50%, the current water resources infrastructure deficit so as to cover 75% of the basic drinking water requirements of the entire population of Mali through the following actions:
• creation of 4 841 new water points; • rehabilitation of 6 278 old pumps; • replacement of 1 675 old boreholes; • rehabilitation of 1 755 old wells; • creation of 170 basic water supply systems; • optimization of 149 boreholes; • institutional support; • study and planning programme; • infrastructure programme; • capacity building programme; • communication for change of behaviour programme; • applied research programme
5.14 Public Authorities and Administration 158. Expenditures of the public authorities and administration sector in 2007 amount to
CFAF 117.32 billion CFAF. They will stand at CFAF 128.99 billion in 2008, CFAF 133.18 billion in 2009, CFAF 142.49 billion in 2010, and CFAF 153.24 billion in 2011, representing an increase rate of 10.0% in 2007, 3.2% in 2008, 7.0% in 2009, and 7.5% in 2010.
159. In the medium term, the sector policy shows the implementation of key programmes on governance. The Institutional Development Programme (PDI) is implemented as reform of the entire Administration to enhance the institutional framework of governance within a perspective of sustainable development. It centres on six strategic areas of focus, namely:
• reorganization of the central Government and strengthening of public management through the following activities: (i) conduct organizational audit of all central, regional, and sub-regional structures; (ii) conduct a study on social dialogue; (iii) define and implement a training programme for central and decentralized administrative employees in their new functions; (iv) prepare and implement an Administrative Code which should reinforce legality and define the rights of users of administrative services;
• modernization of public service methods and procedures to adapt them to the new context of administrative reform: (i) evaluate the methods and procedures of central and decentralized Administrations; (ii) prepare administrative and financial procedures manuals for the administrations of regional assemblies and district councils; (iii)
MTBF PRSP 2007 – 2011 Page 54 of 224
conduct a study on the technical criteria required for redistribution of budget allocations between the central and deconcentrated administrations;
• consolidation of decentralization: (i) prepare a law defining principles of administrative organization of the territory and its implementing decree; (ii) prepare and implement for each Ministry, a plan for the transfer of powers; (iii) develop the operations of the Regional Orientation Committees so as to define, coordinate, orientate, monitor and evaluate the technical support required for implementation of development plans and territorial development projects.
160. The objective or overall impact sought by decentralization is the same as that sought by the PRSP. The specific objectives concern all the impacts expected from the decentralization policy on the direct beneficiaries. They are divided into two categories corresponding to two levels:
• the intermediate impacts of level 1 are: (i) improvement of distribution of basic services and public utilities on the territory; (ii) efficient management of local authorities; (iii) improvement of partnership between development actors; (iv) full participation of citizens in the management of local affairs; (v) increased participation in local elections; (vi) liberalization of local initiatives; and (vii) qualitative development of supply of local services;
• the intermediate impacts of level 2 are: (i) improved access by the populations to basic services and public utilities; (ii) strengthening of local democracy; and (iii) creation and preservation of local jobs;
161. To achieve these objectives, the following challenges will be addressed:
• the challenges of decentralization today are clear: the transfer of powers, the link between decentralization and national sectoral programmes, local taxation and resource mobilization, conditions for exercising supervisory powers, relations between councils, territorial development, communication and training;
• ownership of technical support functions by the local authorities and Government technical services;
• strategic management of decentralization at various levels to promote consistency and rationality in interventions, particularly with respect to initiatives of local authorities without undermining the results obtained in mobilization of funds made available and the emergence of local initiatives;
• the Government should specify and implement the new sharing of roles between it and the local authorities, ensure strategic management of decentralization through its representatives, and create conditions for greater involvement of the deconcentrated services in the implementation of decentralization;
• increase in resources of local authorities, consolidation of their financial support as well as the monitoring/control of financial transfers to the local authorities;
• mobilization of financial resources should be a key concern for sustainable success of decentralization.
• Development of the role of local authorities in the promotion of development: • revise the Local Authorities Code to better specify their areas of competence; • prepare and adopt regulations on the sharing of resources between the central
Government and the local authorities; • put in place instruments for shared governance at the local level; • communication and relations with users; • carry out an information and sensitization campaign on the respective roles and
missions of the institutions ; • carry out an information and sensitization campaign on the legal and regulatory
framework governing the administration’s relations with users; • establishment of reception and guidance services for users; and

MTBF PRSP 2007 – 2011 Page 55 of 224
• carry out activities on communication between the administrations and their users.
162. With respect to decentralization, budget allocations amount to CFAF 7.07 billion in 2007. They will stand at CFAF 7.36 billion in 2008, CFAF 7.66 billion in 2009, CFAF 7.98 billion in 2010, and CFAF 8.32 billion in 2011, representing an average increase of 4.2%.
Table 50: Trend of Budgetary Expenditure on Decentralization (in CFAF thousand)
Source: DGB
163. Mention should also be made of the implementation of the Programme for the Improvement and Modernization of Public Finance Management in the PDI, through actions relating to budget decentralization, deconcentration of the public procurement procedure, and operational establishment of organization charts and deconcentrated organic frameworks. It is structured around the following pillars:
• adaptation and modernization of the general public finance framework: the proposed actions are:
• ensure conformity of laws and regulations with WAEMU directives, and institutionalize management for results;
• adapt the organization and organic framework of the Ministry of the Economy and Finance;
• strengthen governance and increase transparency through the following activities: • make the control system coherent and effective, apply international audit standards; • strengthen the Accounts Section of the Supreme Court; • give the National Assembly the resources to accomplish its missions; • build the operational capacities of the General Control of Public Services; • build the operational capacities of the Inspectorate of Finance; • build the capacities of the National Directorate of the Financial Control, and improve
the quality of conformity control by broadening the scope, and adapting it to new technologies;
• develop the efficiency of taxation and financial administrations (DNTCP, DGI, DGD, DGABE) :
• improve transparency and simplification of financial and accounting operations; • strengthen the accounting management of Local Authorities and Public Institutions; • reinforce infrastructures and equipment; • increase the relative proportion of internal tax revenue in the State budget by
contributing to achievement of the objectives of overall tax pressure; • offer quality professional services that meet the needs of taxpayers; • modernize the tax administration through resource mobilization and professionalism; • improve and secure customs revenue; • enhance the quality of budget preparation and implementation:
ITEMS 2007 2008 2009 2010 2011Subsidies to Local Authorities 1 507 539 1 530 152 1 553 104 1 576 401 1 600 047Support to supervisory structures of Local Authorities 1 050 781 1 103 320 1 158 486 1 216 410 1 277 231
National Directorate of Local Authorities 79 711 84 510 89 599 94 975 100 673FICT/ANICT (EPA subsidy) 75 075 78 829 82 770 86 909 91 254
Missions to Support Civil Status Consolidation 513 240 513 240 513 240 518 372 523 556Mission to Support Deconc/Decentralization (50%) 7 282 8 010 8 811 9 692 10 661BSI related to Decentralization (incl. Support for Local Authorities from ANICT) 3 834 795 4 037 795 4 251 542 4 476 874 4 714 148TOTAL 7 068 423 7 355 856 7 657 552 7 979 633 8 317 570
MTBF PRSP 2007 – 2011 Page 56 of 224
• adapt the Directorate General of the Budget to all its missions ; • change the budget system to a system based on performance and results; • improve the budget management system to meet international standards; • include external financing in national budgetary procedures: • ensure widespread use of budget support; • produce exhaustive and quality financial and accounting information; • have a budget consistent with the principle of management for results; • increase the effectiveness and productivity of services for budget preparation and
implementation; • interconnect the National Expenditure Management Computer System: • interconnect the expenditure chain of central and regional services; • provide Regional Directorates with computer equipment; • train users; • prepare a MEF computer master plan; • enhance the performance of DAF and related services: • stabilize and professionalize the Directors of DAF and related services; • enhance strict application of procedures; • improve the quality of service to users and increase resources; • enhance the efficiency of public procurements: • adapt the Public Procurement Code to current administrative and economic
requirements; • refocus the institutional framework on deconcentration and decentralization efforts; • build the capacities of structures ; • improve access by SMEs to public contracts; • strengthen governance and transparency in public procurements; • implement an appropriate training programme for Finance employees by creating a
continuous training structure for them.
164. Furthermore, increase in expenditures in the public authorities and administration sector is also due to:
• capacity building for the Administrations ; • the democratic process/Institutions; • the Institutional Support Project for all Ministries and Institutions; • the Support Project for Preparation of Territorial Development Plans; • the fourth general population and housing census; • the Support Project for the Labour Intensive Unit (HIMO) ; • preparation of regional development plans for some regions; • recruitment of 225 employees in Justice under PRODEJ ; • construction of 12 court houses and 10 modern prisons with separate areas for men,
women and minors; • construction of official residences for magistrates in preparation for the replacement of
broad jurisdiction courts with small-claims courts (20 houses from 2006 to 2007) ; and • rehabilitation of 15 court houses and 15 prisons.
5.15 Diplomacy and Foreign Affairs 165. Expenditures of the Diplomacy and Foreign Affairs Sector in 2007 amount to CFAF
20.27 billion. They will stand at CFAF 20.30 billion in 2008, CFAF 21.78 billion in 2009, CFAF 23.71 billion in 2010, and CFAF 25.46 billion in 2011, representing an increase rate of 0.2% in 2007, 7.3% in 2008, 8.9% in 2009, and 7.4% in 2010. The increases are due to:

MTBF PRSP 2007 – 2011 Page 57 of 224
• participation in international meetings (United Nations General Assembly, and meetings of OIC, African Union, Movement of the Non-Aligned) ;
• extension of the central building of the Ministry of Foreign Affairs and International Cooperation, and equipment of the central services;
• inspection missions within the country and abroad; • contact visits to Malian communities abroad; • adequate supply of consular and civil status documents to Diplomatic and Consular
Missions.
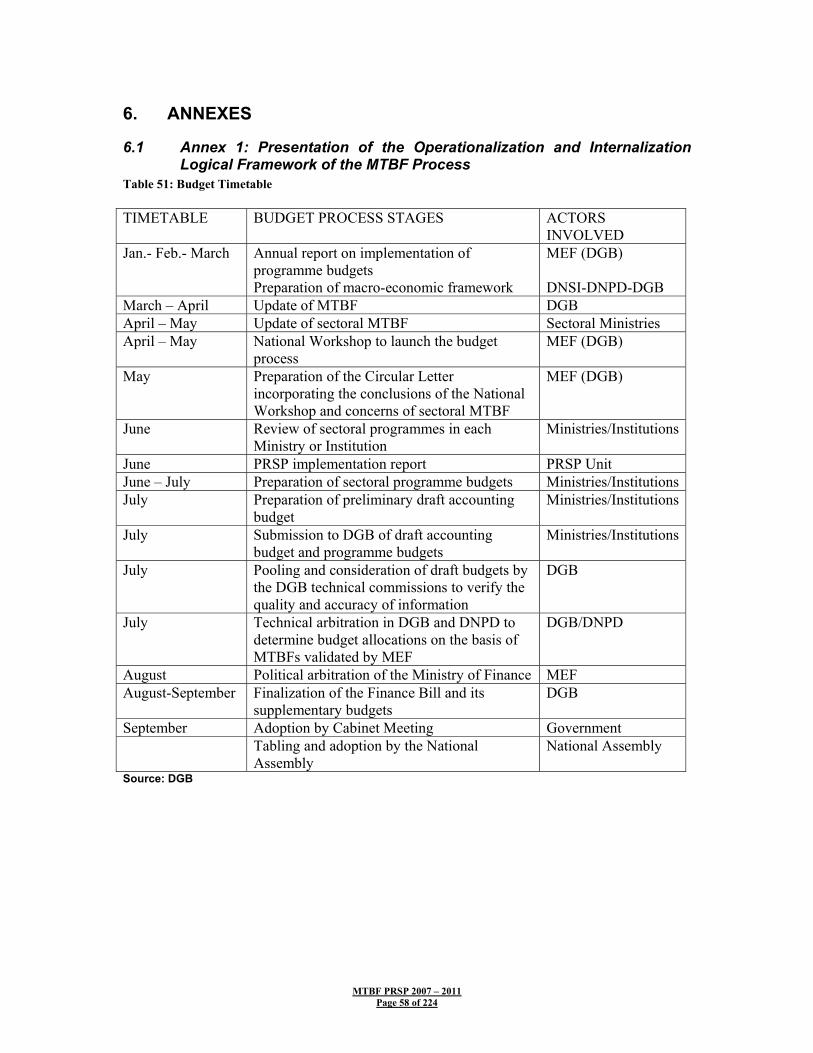
MTBF PRSP 2007 – 2011 Page 58 of 224
6. ANNEXES
6.1 Annex 1: Presentation of the Operationalization and Internalization Logical Framework of the MTBF Process
Table 51: Budget Timetable TIMETABLE BUDGET PROCESS STAGES ACTORS
INVOLVED Jan.- Feb.- March Annual report on implementation of
programme budgets Preparation of macro-economic framework
MEF (DGB) DNSI-DNPD-DGB
March – April Update of MTBF DGB April – May Update of sectoral MTBF Sectoral Ministries April – May National Workshop to launch the budget
process MEF (DGB)
May Preparation of the Circular Letter incorporating the conclusions of the National Workshop and concerns of sectoral MTBF
MEF (DGB)
June Review of sectoral programmes in each Ministry or Institution
Ministries/Institutions
June PRSP implementation report PRSP Unit June – July Preparation of sectoral programme budgets Ministries/InstitutionsJuly Preparation of preliminary draft accounting
budget Ministries/Institutions
July Submission to DGB of draft accounting budget and programme budgets
Ministries/Institutions
July Pooling and consideration of draft budgets by the DGB technical commissions to verify the quality and accuracy of information
DGB
July Technical arbitration in DGB and DNPD to determine budget allocations on the basis of MTBFs validated by MEF
DGB/DNPD
August Political arbitration of the Ministry of Finance MEF August-September Finalization of the Finance Bill and its
supplementary budgets DGB
September Adoption by Cabinet Meeting Government Tabling and adoption by the National
Assembly National Assembly
Source: DGB

MTBF PRSP 2007 – 2011 Page 59 of 224
6.2 Annex 2: Some Projects illustrating Extension of Projects/Programmes Table 52: Some Projects illustrating Extensions of Projects/Programmes
Description Initial Duration
Actual Duration
Remarks
Water points project in Liptako-Gourma 4 years 20 years Project completed in 2003
200 water points Tenenkou 4 years 11 years Project completed in 2005
DWS Kidal 4 years 9 years Project completed in 2005
100 water points Kayes Koulikoro region 5 years 8 years Project completed in 2004
Village water supply Dogon Highlands 5 years 8 years Project completed in 2004
CEAO II 5 years 13 years Project completed in 2005
PDRI Mopti/Tombouctou 4 years 9 years Project completed in 2005
PRODESO 6 years 12 years Project completed in 2005
PSARK 6 years 15 years Project completed in 2005
Lake Zone 5years 10 years Project completed in 2003
Agriculture Goumbo 3 years 15 years Project completed in 2000
Poultry development in Mali 4 years 10 years Project completed in 2005
Saouné agricultural project 4 years 10 years Ongoing and will be completed in 2006
PIV Gao 5 years 14 years Project completed in2005
Moyen Bani project 5 years 9 years Ongoing and will be completed in 2007
Non-Cotton zone development 5 years 11 years Project completed in 2005
PDIA Manantali 6 years 8 years Ongoing PDRI Kita 5 years 7 years Ongoing 45 primary schools 4 years 11 years Completed in 2003 Construction of health centres Mopti/Tombouctou
5 years 13 years Completed in 2005

MTBF PRSP 2007 – 2011 Page 60 of 224
6.3 ANNEX 3: Contribution of Malian Mining Companies to Budgetary Revenue 2002-2006
166. The main sources of the tax systems applicable to enterprises carrying out mining activities, including sub-contracting of the said activities, are the Mining Code and Establishment Agreements. For practical reasons and transparency in public management, the establishment Agreement summarizes the respective rights and obligations of the Government and the mining enterprises, and supplements the Mining Code. The tax system defined by the 1991 Code (established by Ordinance No. 91-065/P-CTSP of 19 September 1991) varies according to the different operation phases, namely:
Exploration, prospecting, development and first three financial years of exploitation:
167. During this period, the mining company and its sub-contractors are exempted from all taxes, internal dues and taxes (including company tax and value added tax) with the exception of some charges and taxes mainly on remunerations to employees and assets (vehicles).
168. The charges mainly consist of: fixed tax for the issue or renewal of exploration license (CFAF 300,000) irrespective of the surface area allotted, fixed tax for the issue of prospecting permit (CFAF 300,000), fixed tax for the issue of an exploitation permit (CFAF 700,000), fixed tax for the issue of an exploitation licence (CFAF 1,000,000) and charges calculated on the basis of the surface area of the mining licence.
169. The area-based charges range from CFAF 50,000 to CFAF 100,000 per square kilometer and per year depending on the size of the company. Currently, it is calculated by the National Directorate of Geology and Mining (DNGM). However, Article 32 of the Land Code of 22 March 2000 stipulates that: “The Government, like any owner, has its developed private immovable property. However, subject to the provisions of this Code, the appurtenances of forest, mining or pastoral lands are governed by specific texts, but the proceeds from these lands are collected by the lands services for the public treasury.”
170. The fixed contribution (7%) by the employer, the housing tax of 1% of the gross remuneration granted to employees of the company, and the employee remuneration tax calculated on the basis of a progressive scale and taking into account the salary and social status of each employee. In addition, the following taxes are also paid:
• tax on vehicles (“vignettes”) with the exception of heavy worksite machinery, • stamp duty, • ad valorem tax at 3% the value of the extracted substances, • contribution for services rendered (CPS) at the rate of 3%. Period after the first three accounting years:
171. During this period, the company, in addition to the above charges, pays the following:
• business profits tax (I/BIC), • professional business licence charges in accordance with the provisions of the
General Tax Code, • stockholders’ tax (IRVM) at 18%, the tax base being the amount of profits distributed, • value added tax (VAT) at 18% and in accordance with the rules defined by the
General Tax Code,

MTBF PRSP 2007 – 2011 Page 61 of 224
• tax on insurance contracts with companies in Mali. It is paid in accordance with the terms and conditions defined in the General Tax Code.
172. The Mining Code was amended in 1999 and 2000 by Ordinances No. 99-032/P-RM of 19 August 1999 and No. 00-013/P-RM of 10 February 2000 respectively. The amendments by these two Ordinances are as follows:
• abolition of the 5-year temporary exemption granted for company tax; consequently, the profits are immediately taxed without any tax vacation;
• abolition of the temporary exemption from stockholders’ tax; • introduction of a 10% tax on capital gain on mining exploration and/or exploitation
licence • abolition of the ad valorem tax.
173. Mining companies, with the exception of those exempted from all taxes, are subject to a number of deductions from the tax services.
Table 53: Share of mining companies in revenue of Directorate General of Taxes from 1 January 2002 to 31 March 2006 (in CFAF billion)
TAXES AND DUTIES 2002 2003 2004 2005 2006 TOTAL Company tax 0.068 5.37 6.325 6.679 0 18.442 VAT deducted at source 1.376 1.358 4.468 5.769 0.211 13.182 Deduction at source of business profits and company taxes
0.529 0.786 0.972 2.131 0.033 4.451
Tax on compensation 4.22 4.694 5.753 6.44 0.823 21.93 Housing tax 0.108 0.129 0.253 0.336 0.035 0.861 Vocational training tax 0.089 0.104 0.128 0.154 0.023 0.498 Poll tax 1.484 1.458 1.919 2.228 0.209 7.298 Stamp duty 0.749 0.18 0 0 0 0.929 Service tax/special tax on some CPS/ISCP products
11.478 9.077 7.466 10.49 3.454 41.965
Stockholders’ tax 1.949 2.622 2.325 0.005 0 6.901 TOTAL 22.05 25.778 29.609 34.232 4.788 116.457 Source: CPS/DGI
174. It should be pointed out that these new provisions are not retroactive.
175. Only Morila, Yatela, Sadiola and Loulou companies pay the ad valorem tax, because they are subject to the 1991 Code. Determination of the tax base poses serious difficulties, since it is based on the value of extracted substances. However, it was only in 2006 that the mining companies started to submit refining certificates, following adjustment operations initiated by the services of the National Directorate of Lands and Survey (DNDC). These certificates provide some information such as:
• the weight of the exported quantity in kg, • the weight of refined gold in ounces, • the weight of silver in the exported quantity in ounces, • the selling price of gold and silver per once, • the cost of refining.
176. It should also be pointed out that the price of gold and conversion rates vary (the rate of the dollar and once /kg).
177. As regards the dividends, the State owns 20% of the shares in mining companies; its dividends, if any, correspond to 18% of the net profits recorded by each company. Consequently, it is important to know if the charges calculated at the time of determining the base of the Ad Valorem Tax are not considered when determining the net profit.

MTBF PRSP 2007 – 2011 Page 62 of 224
Table 54: Situation of Gold Production, Payment of Dividends and Ad Valorem Tax to DNDC
Sources: BCEAO/DNDC/ SEMOS/DNGM
The OHADA Treaty signed in Port Louis on 17 October 1993 was ratified on 31 December 2000, and it entered into force in 1995. It stipulates in Article 146 as follows: “the terms and conditions of payment are defined by the General Meeting, which can delegate this right, as the case may be, to the Manager, Chairman and Managing Director, General Manager, or Executive Director. However, the dividends should be paid within nine months following the end of the financial year. Extension of this period may be granted by the President of the competent court.” However, the reports of Boards of Directors of mining companies are submitted late to DNDC.
Table 55: Contribution of the mining sector to the revenue of DNDC from 1 January 2002 to 31 March 2006 (in CFAF billion)
Sources: BCEAO/DNDC/ SEMOS/DNGM
It should also be noted that these companies often sign agreements with the Ministry of the Economy and Finance, authorizing them to stagger, and even defer payments of dividends for several months. The gold produced in Yatela and Sadiola is exported from Kayes, and that of Morila and other private exporters from Bamako Sénou airport; consequently, some quantities may elude control. All things being equal, these companies enjoy many other benefits such as tax exemptions and reimbursement of VAT credits. Accordingly,
Companies 2002 2003 2004 2005 2006 Total Semos 5.34 7.014 6.97 5.794 1.754 26.872Morila 24.195 23.182 3.412 11.319 1.176 63.284Yatela 1.694 1.486 1.388 1.729 0.667 6.964Somika 0 0 0 0 0 0Loulo 0 0 0 0.521 0.376 0.897Total 31.229 31.682 11.77 19.363 3.973 98,017
YEAR 2002 2003 2004 2005 2006
Gold Prod. in kg 16 192.84 15 726.32 15 569.62 15 100.32 -
SEMOS Ad Valorem Tax 3.085 2. 781 2. 865 3.119 0.909 Dividends 2.256 4.234 4.105 2.675 0.845Gold Prod. in kg 38 914.41 28 638.36 17 634.03 23 832.07 -
MORILA Ad Valorem Tax 6.678 4.940 2.753 4.723 1.176 Dividends 17.519 18. 244 0.659 6.597 -Gold Prod. in kg 8 586.53 7 233.08 8 109.14 8 012.63 -
YATELA Ad Valorem Tax 1.695 1.486 1.388 1.730 0.668 Dividends - - - -
272.725 540.499 -1 636.04 0.522 0.377Ad valorem Tax SOMILO
Gold Production SOMIKA Gold Production SOMILO

MTBF PRSP 2007 – 2011 Page 63 of 224
from 2002 to date, the status of payments relating to reimbursement of VAT credits is as follows:
• CFAF 14,988,299,013 in 2002, including CFAF 13,748,241,516 for the miners, representing 92% of the total amount paid;
• CFAF 7,735,057,478 in 2003, including CFAF 5,458,281,871 for the miners, representing 71% of the total amount paid;
• CFAF 3,889,504,320 in 2004, including CFAF 2,306,087,453 for the miners, representing 59% of the total amount paid;
• CFAF 3,275,277,451 in 2005, including CFAF 1,350,211,279 for the miners, representing 41% of the total amount paid;
• as at 24 May 2006, reimbursements of VAT credit stood at CFAF 5,375,795,368, including CFAF 5,147,441,894 for the miners as compensation, representing 96% of the total amount paid. Under the same item, CFAF 1,624,205,000 are available for pending payments of CFAF 15,345,167,279 as of 24 May 2006.
The status of tax exemptions granted to mining companies is as follows: Table 56: Exemptions granted to mining companies from 2002 to 2005 (in CFAF billion)
Source: DGB
A single Mining Code should be adopted. This would facilitate assessment of the tax base and the rate of the Ad Valorem Tax, and also help to clearly define the conditions of payment of dividends. The harmonization of Establishment Agreements will ensure some homogeneity in the companies. It is important to note that DNDC is a department that is not under the Ministry of the Economy and Finance; however, it should be consulted before any decision is taken on some provisions concerning mining companies.
Increase in DNDC revenues requires closer monitoring of the State portfolio, review of texts to clearly define land revenues, the determination of an ad valorem tax rate for all mining companies, the timely communication of conclusions of Boards of Directors of the various companies and resolutions of the General Meetings, and compliance with Community texts (such as OHADA texts) in force. It is necessary to identify all the mining developers and sub-contractors on the national territory.
Table 57: Contribution of mining sector to State budgetary revenue from 1 January 2002 to 31 March 2006 (in CFAF billion)
Source: DGI and DNDC
2002 2003 2004 2005Amounts 8. 655 14. 548 15. 755 10. 498
Services 2002 2003 2004 2005 2006 TOTALDGI 22.05 25.779 29.609 34.232 4.788 116.46
DNDC 31.229 31.682 11.77 19.363 3.973 98.02 TOTAL 53.279 57.461 41.379 53.595 8.761 214.48
20 December 2006
2nd Generation PRSP 2007 – 2011
MMAALLII
Annex III Actions Matrix for GPRSP
2007 - 2009

Actions Matrix PRSP 2007 - 2009 Page 65 of 224
Table of Contents 1 ENHANCEMENT OF DEVELOPMENT MANAGEMENT 66
1.1 STRENGTHENING AND COORDINATION OF POVERTY REDUCTION STRATEGY 66 1.2 DEVELOPMENT OF MACRO-SECTORAL ANALYSIS TOOLS 66
2 INFRASTRUCTURE AND PRODUCTIVE SECTORS 66 2.1 FOOD SECURITY 66 2.2 RURAL DEVELOPMENT 66
2.2.1 Agriculture Sub-sector 66 2.2.2 Cotton Sub-sector 67 2.2.3 Livestock and Fisheries Sub-sector 67 2.2.4 Support to rural areas 68
2.3 MINNING AND EXTRACTIVE INDUSTRIES 69 2.4 SME-SMI DEVELOPMENT 70 2.5 TOURISM AND HANDICRAFT 70 2.6 CULTURE 71 2.7 ENVIRONMENTAL PROTECTION AND MANAGEMENT OF NATURAL RESOURCES 71 2.8 INFRASTRUCTURE DEVELOPMENT 72
2.8.1. Transport 72 2.8.2. Telecommunications and ICT 72 2.8.3. Energy 73
3 PURSUANCE AND CONSOLIDATION OF STRUCTURAL REFORMS 74 3.1 CONSOLIDATION OF PUBLIC ADMINISTRATION REFORMS 74
3.1.1 Decentralization and Deoncentration 74 3.1.2 Improvement and Modernization of Public Finance Management 74
3.2 PURSUANCE OF REFORM OF THE BUSINESS ENVIRONMENT 75 3.3 FINANCIAL SECTOR DEVELOPMENT 76 3.4 PROMOTION OF DEMOCRATIC GOVERNANCE AND PUBLIC FREEDOMS 76 3.5 CAPACITY BUILDING FOR THE CIVIL SOCIETY 77 3.6 STRENGTHENING OF REGIONAL AND SUB-REGIONAL INTEGRATION INITIATIVES 77
4 DEVELOPMENT OF ACCESS TO BASIC SOCIAL SERVICES 78 4.1 EDUCATION 78 4.2 HEALTH 78 4.3 SOCAL DEVELOPMENT 79 4.4 DRINKING WATER AND SANITATION 79 4.5 CREATION AND PROMOTION OF SUSTAINABLE JOBS 80 4.6 HIV/AIDS CONTROL 80
5 CROSS-CUTTING ISSUES 81 5.1 GENDER 81 5.2 PEACE AND SECURITY 81 5.3 TERRITORIAL DEVELOPMENT 81
6 STRENGTHENING OF STATISTICS MECHANISM AND PRSP MONITORING 81 6.1 STRENGTHENING OF STATISTICS MACHINERY 81 6.2 STRENGTHENING OF PRSP MONITORING 82

1. ENHANCEMENT OF DEVELOPMENT MANAGEMENT
1.1 Strengthening and Coordination of Poverty Reduction Strategy Ensure linkage between PRSP, State Budget and MTEF Budget consistent with PRSP priorities Incorporation of PRSP priorities in State budget and
MTEF Sectoral and overall review of PRSP Ensure synergy of sector policies Synergy between PRSP and sector policies Regional consultations on PRSP Ownership of PRSP by the civil society through presentation workshops
Strengthen the participatory process and capacities of institutional stakeholders (civil society, regional and local committees)
Better internalization of PRSP by the institutional stakeholders. Ensure consistency of regional development plans
Workshops on dissemination of PRSP process and reflection on consistency with regional and local development plans
Analyze poverty Series of thematic studies on poverty: health, vulnerability and education
Studies on poverty and consumption based on the results of ELIM 2003 and 2006.
1.2 Development of Macro-sectoral Analysis Tools The PRSP Unit has tools for analyzing the impact of economic and social policy measures
Preparation of micro-simulation model (MEGC) for analysis of impacts of exogenous shocks and policy measures on poverty and income distribution (WorldBank financing)
Economic situation performance chart Preparation of an economic situation performance chart.
Simple national accounting model National accounts and macro-economic analysis Macro-sectoral forecasts model, as tool for analysis of growth-oriented sectors.
Coordination of macro-economic modelling activitieof DNSI, Macro-economic Unit and DNPD.
Capacity building in macro-economic modelling and analysis
Senior staff trained Training in macro-economic modelling and analysis
2. INFRASTRUCTURE AND PRODUCTIVE SECTORS
2.1 Food Security Reduce the impact of major food crises
Strengthen and broaden the crisis prevention and management system
Complete and available buffer stock - Supplement SNS to 35 000 tonnes - Create a Food Stock Intervention Fund - Create the seeds stock - Finance transport - Finance SNA structures: OPAM, SAP, ONA
Implement the National Food Security Programme (PNSA) Coverage of food requirements better ensured -Development of natural resources - Intensification of crops - Diversification of production systems - Marketing and processing of agricultural products- Strengthen the cereal sub-sectors - Strengthen the fishery sub-sector and impronutrition and health status - Strengthen the surveillance and alert mechaniparticularly under the 10th EDF
Implement PIDRN Reduction of vulnerability of North region
Implement PIDRK Reduction of vulnerability of KIDAL region
2.2 Rural Development
2.2.1 Agriculture Sub-Sector Implementation of the LOA - Texts adopted and signed
- Structures put in place and operational - Evaluation reports produced
- Design of texts - Establishment of structures - Evaluation of implementation
Development of irrigation schemes The new master plan of the Niger Authority is implemented
Implement the master plan of the Niger Authortaking into account new programmes, particularly MCA programme and 10th EDF
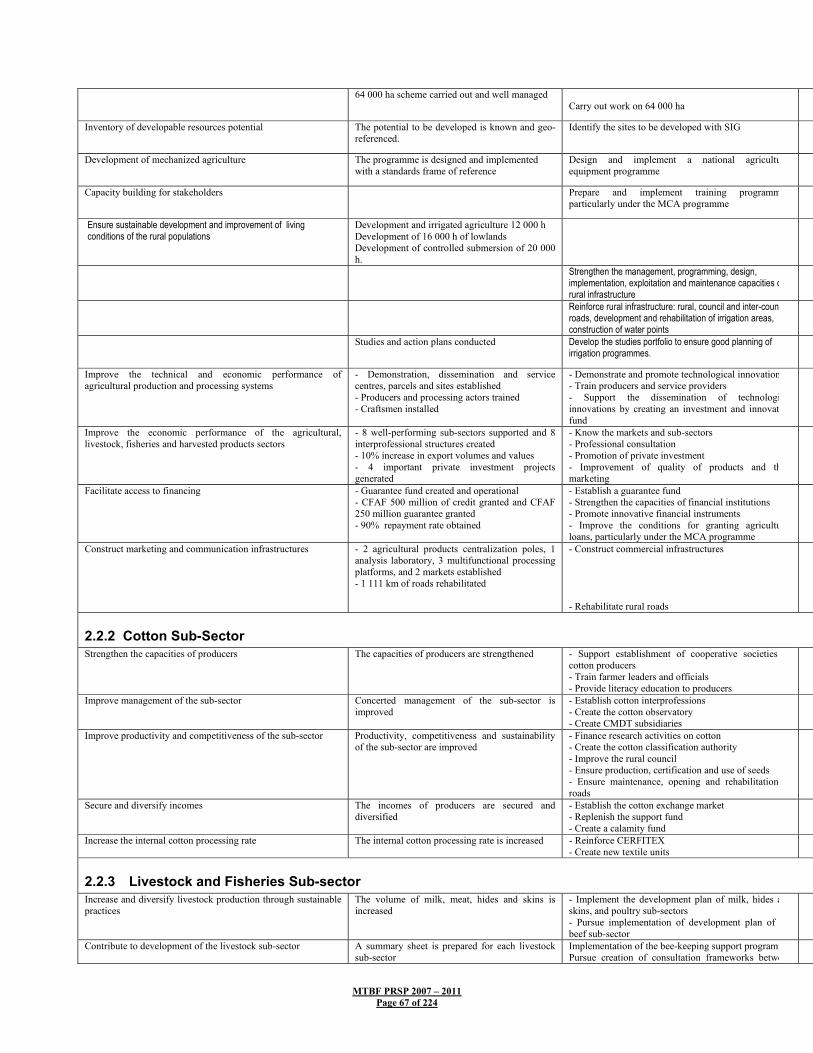
MTBF PRSP 2007 – 2011 Page 67 of 224
64 000 ha scheme carried out and well managed Carry out work on 64 000 ha
Inventory of developable resources potential The potential to be developed is known and geo-referenced.
Identify the sites to be developed with SIG
Development of mechanized agriculture The programme is designed and implemented with a standards frame of reference
Design and implement a national agricultuequipment programme
Capacity building for stakeholders Prepare and implement training programmparticularly under the MCA programme
Ensure sustainable development and improvement of living conditions of the rural populations
Development and irrigated agriculture 12 000 h Development of 16 000 h of lowlands Development of controlled submersion of 20 000 h.
Strengthen the management, programming, design, implementation, exploitation and maintenance capacities orural infrastructure
Reinforce rural infrastructure: rural, council and inter-councroads, development and rehabilitation of irrigation areas, construction of water points
Studies and action plans conducted Develop the studies portfolio to ensure good planning of irrigation programmes.
Improve the technical and economic performance of agricultural production and processing systems
- Demonstration, dissemination and service centres, parcels and sites established - Producers and processing actors trained - Craftsmen installed
- Demonstrate and promote technological innovation- Train producers and service providers - Support the dissemination of technologiinnovations by creating an investment and innovatifund
Improve the economic performance of the agricultural, livestock, fisheries and harvested products sectors
- 8 well-performing sub-sectors supported and 8 interprofessional structures created - 10% increase in export volumes and values - 4 important private investment projects generated
- Know the markets and sub-sectors - Professional consultation - Promotion of private investment - Improvement of quality of products and thmarketing
Facilitate access to financing - Guarantee fund created and operational - CFAF 500 million of credit granted and CFAF 250 million guarantee granted - 90% repayment rate obtained
- Establish a guarantee fund - Strengthen the capacities of financial institutions - Promote innovative financial instruments - Improve the conditions for granting agricultuloans, particularly under the MCA programme
Construct marketing and communication infrastructures - 2 agricultural products centralization poles, 1 analysis laboratory, 3 multifunctional processing platforms, and 2 markets established - 1 111 km of roads rehabilitated
- Construct commercial infrastructures - Rehabilitate rural roads
2.2.2 Cotton Sub-Sector Strengthen the capacities of producers The capacities of producers are strengthened - Support establishment of cooperative societies
cotton producers - Train farmer leaders and officials - Provide literacy education to producers
Improve management of the sub-sector Concerted management of the sub-sector is improved
- Establish cotton interprofessions - Create the cotton observatory - Create CMDT subsidiaries
Improve productivity and competitiveness of the sub-sector Productivity, competitiveness and sustainability of the sub-sector are improved
- Finance research activities on cotton - Create the cotton classification authority - Improve the rural council - Ensure production, certification and use of seeds - Ensure maintenance, opening and rehabilitation roads
Secure and diversify incomes The incomes of producers are secured and diversified
- Establish the cotton exchange market - Replenish the support fund - Create a calamity fund
Increase the internal cotton processing rate The internal cotton processing rate is increased - Reinforce CERFITEX - Create new textile units
2.2.3 Livestock and Fisheries Sub-sector Increase and diversify livestock production through sustainable practices
The volume of milk, meat, hides and skins is increased
- Implement the development plan of milk, hides askins, and poultry sub-sectors - Pursue implementation of development plan of beef sub-sector
Contribute to development of the livestock sub-sector A summary sheet is prepared for each livestock sub-sector
Implementation of the bee-keeping support programmPursue creation of consultation frameworks betwe
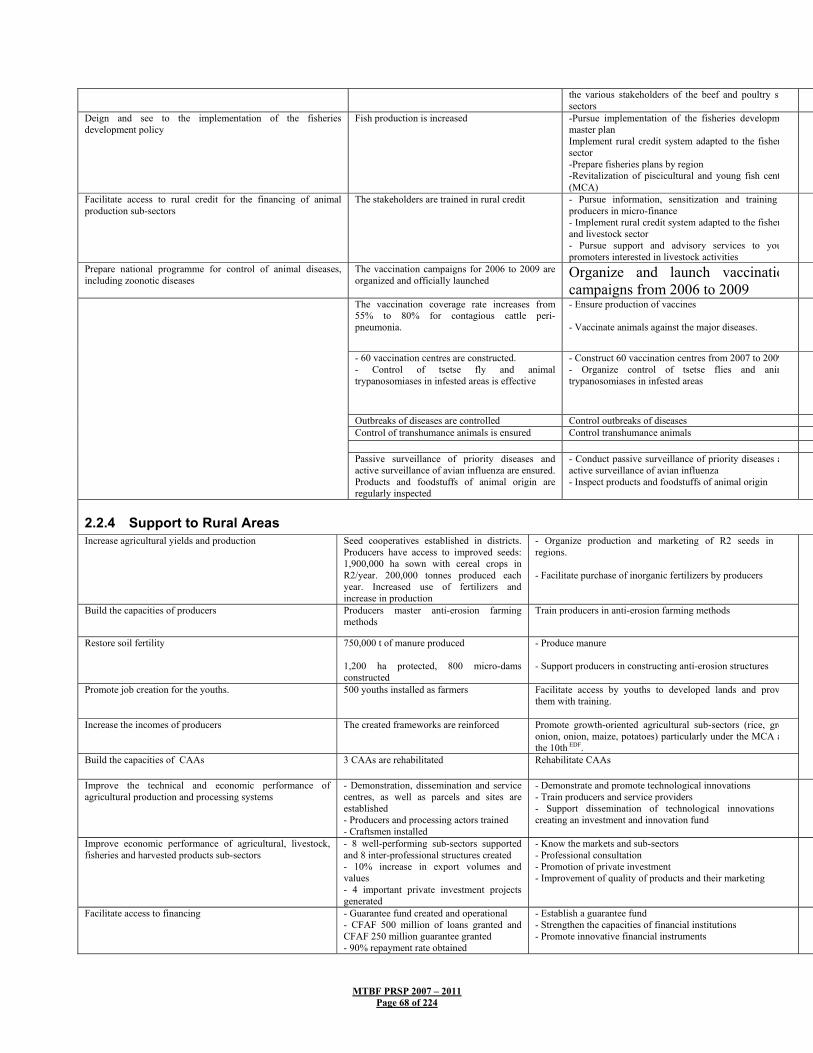
MTBF PRSP 2007 – 2011 Page 68 of 224
the various stakeholders of the beef and poultry susectors
Deign and see to the implementation of the fisheries development policy
Fish production is increased -Pursue implementation of the fisheries developmmaster plan Implement rural credit system adapted to the fishersector -Prepare fisheries plans by region -Revitalization of piscicultural and young fish cent(MCA)
Facilitate access to rural credit for the financing of animal production sub-sectors
The stakeholders are trained in rural credit - Pursue information, sensitization and training producers in micro-finance - Implement rural credit system adapted to the fisherand livestock sector - Pursue support and advisory services to youpromoters interested in livestock activities
Prepare national programme for control of animal diseases, including zoonotic diseases
The vaccination campaigns for 2006 to 2009 are organized and officially launched
Organize and launch vaccinatiocampaigns from 2006 to 2009
The vaccination coverage rate increases from 55% to 80% for contagious cattle peri-pneumonia.
- Ensure production of vaccines - Vaccinate animals against the major diseases.
- 60 vaccination centres are constructed. - Control of tsetse fly and animal trypanosomiases in infested areas is effective
- Construct 60 vaccination centres from 2007 to 2009- Organize control of tsetse flies and animtrypanosomiases in infested areas
Outbreaks of diseases are controlled Control outbreaks of diseases Control of transhumance animals is ensured Control transhumance animals
Passive surveillance of priority diseases and active surveillance of avian influenza are ensured. Products and foodstuffs of animal origin are regularly inspected
- Conduct passive surveillance of priority diseases aactive surveillance of avian influenza - Inspect products and foodstuffs of animal origin
2.2.4 Support to Rural Areas Increase agricultural yields and production
Seed cooperatives established in districts. Producers have access to improved seeds: 1,900,000 ha sown with cereal crops in R2/year. 200,000 tonnes produced each year. Increased use of fertilizers and increase in production
- Organize production and marketing of R2 seeds in regions. - Facilitate purchase of inorganic fertilizers by producers
Build the capacities of producers Producers master anti-erosion farming methods
Train producers in anti-erosion farming methods
Restore soil fertility
750,000 t of manure produced 1,200 ha protected, 800 micro-dams constructed
- Produce manure - Support producers in constructing anti-erosion structures
Promote job creation for the youths.
500 youths installed as farmers Facilitate access by youths to developed lands and provthem with training.
Increase the incomes of producers
The created frameworks are reinforced Promote growth-oriented agricultural sub-sectors (rice, greonion, onion, maize, potatoes) particularly under the MCA athe 10th EDF.
Build the capacities of CAAs 3 CAAs are rehabilitated Rehabilitate CAAs
Improve the technical and economic performance of agricultural production and processing systems
- Demonstration, dissemination and service centres, as well as parcels and sites are established - Producers and processing actors trained - Craftsmen installed
- Demonstrate and promote technological innovations - Train producers and service providers - Support dissemination of technological innovations creating an investment and innovation fund
Improve economic performance of agricultural, livestock, fisheries and harvested products sub-sectors
- 8 well-performing sub-sectors supported and 8 inter-professional structures created - 10% increase in export volumes and values - 4 important private investment projects generated
- Know the markets and sub-sectors - Professional consultation - Promotion of private investment - Improvement of quality of products and their marketing
Facilitate access to financing - Guarantee fund created and operational - CFAF 500 million of loans granted and CFAF 250 million guarantee granted - 90% repayment rate obtained
- Establish a guarantee fund - Strengthen the capacities of financial institutions - Promote innovative financial instruments
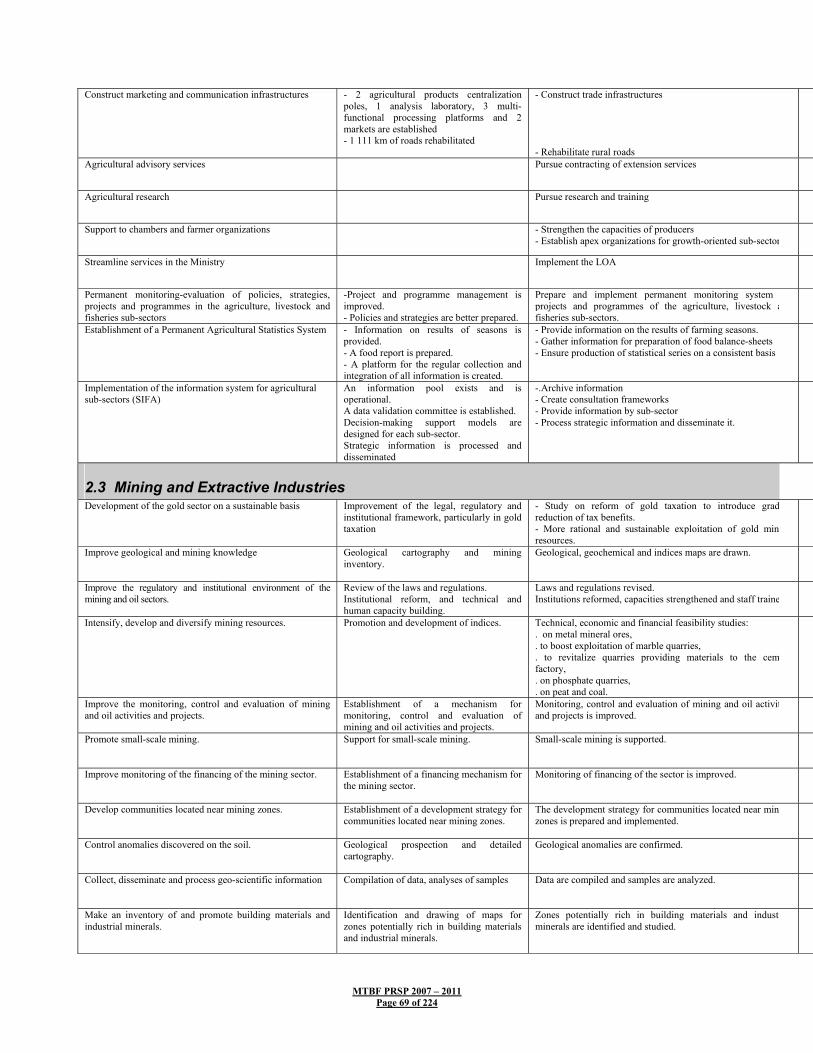
MTBF PRSP 2007 – 2011 Page 69 of 224
Construct marketing and communication infrastructures - 2 agricultural products centralization poles, 1 analysis laboratory, 3 multi-functional processing platforms and 2 markets are established - 1 111 km of roads rehabilitated
- Construct trade infrastructures - Rehabilitate rural roads
Agricultural advisory services Pursue contracting of extension services
Agricultural research Pursue research and training
Support to chambers and farmer organizations - Strengthen the capacities of producers - Establish apex organizations for growth-oriented sub-sector
Streamline services in the Ministry Implement the LOA
Permanent monitoring-evaluation of policies, strategies, projects and programmes in the agriculture, livestock and fisheries sub-sectors
-Project and programme management is improved. - Policies and strategies are better prepared.
Prepare and implement permanent monitoring system projects and programmes of the agriculture, livestock afisheries sub-sectors.
Establishment of a Permanent Agricultural Statistics System - Information on results of seasons is provided. - A food report is prepared. - A platform for the regular collection and integration of all information is created.
- Provide information on the results of farming seasons. - Gather information for preparation of food balance-sheets - Ensure production of statistical series on a consistent basis
Implementation of the information system for agricultural sub-sectors (SIFA)
An information pool exists and is operational. A data validation committee is established. Decision-making support models are designed for each sub-sector. Strategic information is processed and disseminated
-.Archive information - Create consultation frameworks - Provide information by sub-sector - Process strategic information and disseminate it.
2.3 Mining and Extractive Industries Development of the gold sector on a sustainable basis Improvement of the legal, regulatory and
institutional framework, particularly in gold taxation
- Study on reform of gold taxation to introduce gradreduction of tax benefits. - More rational and sustainable exploitation of gold miniresources.
Improve geological and mining knowledge Geological cartography and mining inventory.
Geological, geochemical and indices maps are drawn.
Improve the regulatory and institutional environment of the mining and oil sectors.
Review of the laws and regulations. Institutional reform, and technical and human capacity building.
Laws and regulations revised. Institutions reformed, capacities strengthened and staff traine
Intensify, develop and diversify mining resources. Promotion and development of indices. Technical, economic and financial feasibility studies: . on metal mineral ores, . to boost exploitation of marble quarries, . to revitalize quarries providing materials to the cemfactory, . on phosphate quarries, . on peat and coal.
Improve the monitoring, control and evaluation of mining and oil activities and projects.
Establishment of a mechanism for monitoring, control and evaluation of mining and oil activities and projects.
Monitoring, control and evaluation of mining and oil activitand projects is improved.
Promote small-scale mining. Support for small-scale mining. Small-scale mining is supported.
Improve monitoring of the financing of the mining sector. Establishment of a financing mechanism for the mining sector.
Monitoring of financing of the sector is improved.
Develop communities located near mining zones. Establishment of a development strategy for communities located near mining zones.
The development strategy for communities located near minizones is prepared and implemented.
Control anomalies discovered on the soil. Geological prospection and detailed cartography.
Geological anomalies are confirmed.
Collect, disseminate and process geo-scientific information Compilation of data, analyses of samples Data are compiled and samples are analyzed.
Make an inventory of and promote building materials and industrial minerals.
Identification and drawing of maps for zones potentially rich in building materials and industrial minerals.
Zones potentially rich in building materials and industrminerals are identified and studied.

MTBF PRSP 2007 – 2011 Page 70 of 224
2.4 SME-SMI Development Develop SME-SMIs
The competitiveness of targeted industrial enterprises is improved.
Implementation of PRMN
Reform tax laws to include more incentives The tax load of enterprise is reduced.
- Organization of conventions on tax issues - Revision of laws and regulations
Improve the business environment Improved business environment - Intensification of measures to combat fraud and unfair competition - Assistance to support project for retail traders
Strengthen the institutional and regulatory operation of procurements.
Anti-competition practices (fraud, counterfeiting, and smuggling) are reduced significantly.
- Implement plan to fight against fraudulent imports. - Preparation and implementation of a plan to combat corruption in the Public Service: award of public contracts, mobilization of Government revenues, management of Government human resources.
Capacity building for existing financial institutions. The financial situation of credit institutions and insurance companies in difficulty is stabilized.
Prepare and support the implementation of a financial stabilization plan and strengthening of institutional capacitiesfinancial institutions in difficulty
Identify the real infrastructure requirements for private sector development.
The real infrastructure requirements for private sector development are identified.
Conduct studies to determine private sector infrastructure requirements (transport, water, electricity, industrial zones, telephone, Internet).
Identify the real requirements for modernizing or replacing equipment needed to strengthen competitiveness of enterprises.
The real equipment requirements for private sector development are identified
Conduct studies to identify requirements for replacing or modernizing equipment, particularly in transport (road, railwriver, etc.), data processing, information technologies, etc.
2.5 Tourism and Handicraft Promotion of tourism Preparation of PDDT
800 private sector operators are trained Training of professionals
10 national events are supported each year Support for cultural events.
5 tourism towns are supported each year. Support for sanitation of tourism towns.
The National Administration is managed. Ordinary management of the National Tourism Administratio
Promotion of handicraft 100 craftsmen are trained. 25 elected officers are trained. 1000 apprentices are trained.
Training of craftsmen, elected officers and apprentices.
A census is conducted for craftsmen in Mali Census of craftsmen
- The CRPAs of BKO/KOUL/TOMB/GAO/KIDAL are installed. - 3 CMs are installed each year. - All the CMs are renewed.
Installation of CMs and CRPAs
The budgets for recurrent and capital expenditure and promotion of handicraft are provided.
Ordinary management of the National Handicraft Directorate

MTBF PRSP 2007 – 2011 Page 71 of 224
2.6 Culture Professional industries are created and culture economy structured
Creation of an Cultural Industries PromotiAgency
Improve the quality of human resources.
The quality and quantity of national production are improved.
Opening of a cinematographic studio-school
Restoration and rehabilitation of heritage sites, and enriching of tourism circuits.
Creation of a National Cultural Heritage AgencyProtect and promote the cultural heritage
The cultural heritage is better known.
Production of works on cultural heritage
Cultural identity and national unity are preserved.
Organization of artistic and cultural events. Promote artistic and cultural activities
Cultural events for the promotion of diversity of cultural expressions, peace and stability are organized.
Promotion of cultural exchange
The history of Mali is better known.
Production of films of Malian epics
National production increases Production of TV series
Generate cultural products
National production increases Production of Sitcom.
2.7 Environmental Protection and Management of Natural Resources Contribute to improvement of the living environment The conditions of natural habitat and eco-
tourism visits are improved following involvement of the populations in sanitation
-Formulate the National Sanitation Policy and its strategies -Organize a sanitation forum
Implement the PSAs of towns Individual and collective structures are constructed. Jobs are created. The living environment is improved.
Construct 300 improved latrines, 500 km of cross drains, 250km of main drains, 100 transit depots, 5 final disposal sites, 600 washing drain tanks, 50000 ml of sewerage systems
Contribute to the conservation of biological diversity Consultations on the preliminary drafts of texts on transfer of natural resource management are organized.
Organization of consultations on the preliminary drafts of teon transfer of natural resource management
Protect the banks against erosion and silting. The banks of River Niger are developed in built-up areas
Development and protection of the river corridor on the Nige
Ensure integrated management of the ecosystems of the river Niger basin.
An adequate geographic information system to be used by NRBA is put in place. The territorial information on sub-basin resources (DIN, Niger Loop) is accessible
- Management and structuring of territorial information on thsub-basins of River Niger - Evaluation of river basin resources
Ensure sustainable management of forest and wildlife resources.
The development and management plans for protected forests and areas of 5 Humid Zones, 2 Biodiversity Zones, 2 Hunting Zones, 1 Pastureland Zone, and 4 FCs are prepared
Preparation of development and management plans protected forests and areas of 5 Humid Zones, 2 BiodiversZones, 2 Hunting Zones, 1 Pastureland Zone and 4 FCs.
Create and maintain better synergy between the various ongoing programmes
-The CIGQE organs are functional. The capacities of senior officials are strengthened.
-Organization of meeting of STP/ CIGQE organs - Strengthen the capacities of senior officials (negotiatiproject formulation, preparation of tools and methodologiguides, etc.)
Strengthen the organizational capacities of the Agency The institutional capacities of RNBA and users are strengthened.
Strengthening and development of RNBA institutional capacities
Establish an information, monitoring and surveillance system for environmental and sanitation issues.
A status report on the environment is prepared and disseminated
Prepare and disseminate the annual status report on environment

MTBF PRSP 2007 – 2011 Page 72 of 224
2.8 Infrastructure Development
2.8.1. Transport Policy – Transport Infrastructure
Improvement of the national transport policy, financing of road maintenance, and privatization of infrastructures concessioned, facilitation of transit and implementation of regulations
Update of the master plan for the development of transport infrastructure network: better mobilization of internal resources, better management of railway and air transport, and reinforcement of road safety.
Review of the National Transport Policy Letter, support for Road Authority, pursuance of airport concessioning afacilitation of transport
Internal and external accessibility of the country The state of roads is improved. Improvement of the state of the network and accessibility to various areas.
- Routine maintenance of the priority network (32 281 Km) - Periodic maintenance of roads (1894 km) - Rehabilitation (5 450 km of roads) Construction of 16 959 km of roads
Bridges are constructed and ferries are available
Construction bridges and ferries ( 6 bridges and 10 ferries)
Urban road network (640 km)
Maintenance of the railway Reduction of travel time and costs.
Maintenance and rehabilitation of Bamako-Kayes-Dibrailway line (347 km)
Passenger and freight airport and meteorology infrastructures constructed and rehabilitated, particularly under the MCA programme
Extension, rehabilitation and maintenance of passenger afreight airport and meteorology infrastructures under the MCprogramme
Wharfs and ports are constructed River transport (Construction of wharfs and banks, river ports
Monitor transport facilitation and capacity building projects Transport administration is operational. Facilitation of transport
The number of accidents is reduced. Road safety, HIV/AIDS, and environmental protectiparticularly under 10th EDF
2.8.2. Telecommunications and ICT Adapt the legal and institutional framework to the promotion and development of ICTs
Texts are adopted, and information is available online
Establish a legal and regulatory framework
Develop TELECOM infrastructures Projects are implemented, and councils are served
Implement infrastructure projects
Include information and communication technologies in the formal and informal education programmes, school administration, and scientific research. Promote medical information technology to ensure widespread access to telemedicine activities and development of specific computer applications in health
Institutions are connected each year, and appropriate teaching aids and curricula are available
Provide ICT equipment and connect all schools and universitin the country. Training programme for workers in the maintenance and usethis equipment
Use ICTs to ensure transparency, free flow of information within the administration itself, and equal access to public information for all citizens
The ministries are gradually connected through the Internet
Install the Internet network of the administration gradually linking the ministries, public services and their subsidiservices in the regions and councils
Gradually connect the councils of Mali to the digital network The councils are connected, services are provided, and e-mail is available and used by the councils. The workers are trained, and the ICTs are effectively used
Schedule the connection of the councils of Mali in successphases

MTBF PRSP 2007 – 2011 Page 73 of 224
2.8.3. Energy Satisfy the energy needs of the country in terms of quality, quantity and least cost.
The portion of ENR in the national production of electricity increases by 8%
Promotion and development of ENRs
Development of the energy potential Electricity coverage of the country increases to 50% The rural electrification rate increases to 15%
Diversification of sources of supply of petroleum products and increase in storage capacities.
The storage capacities of the country increase to 120 000 m3
Control of supply and demand Land area transferred to community management increases to 2.75 million hectares Overall energy consumption of the country as regards firewood moves to 65%
The peaceful applications of technologies based on ionizing radiation are controlled; X-ray safety and security of radioactive sources and related equipment on the national territory are controlled
Planning, implementation and monitoring-evaluation projects and programmes in technical cooperation with AIEA
Protect people, property and the environment against risks inherent in energy services
The performance of energy services is optimized
Professionalization of supply energy services to optimize thperformance and minimize the risks of breaks in services aaccidents.
Assessment and mitigation of environmental impacts are automatically taken into account.
Automatic assessment and mitigation of environmental aspein the design, construction and utilization of enerinfrastructure and equipment.
Strengthen the orientation, management, control and strategic management capacities of the energy sector
The sector is provided with an institutional, legal and regulatory framework.
Establishment of an institutional, legal and regulatoframework adapted to the development requirements of national energy sector
The sector is strengthened in terms of human, material and financial resources
Promotion of capacity building measures for human, materand financial resources of public, parapublic and privstakeholders of the energy sector
The existence of a good communication system
Promotion of communication and consultation between various stakeholders of the energy sector.
4. Strengthen international cooperation in energy The sector is closely involved in foreign energy programmes.
Support for and participation in sub-regional, regional ainternational energy projects and programmes.
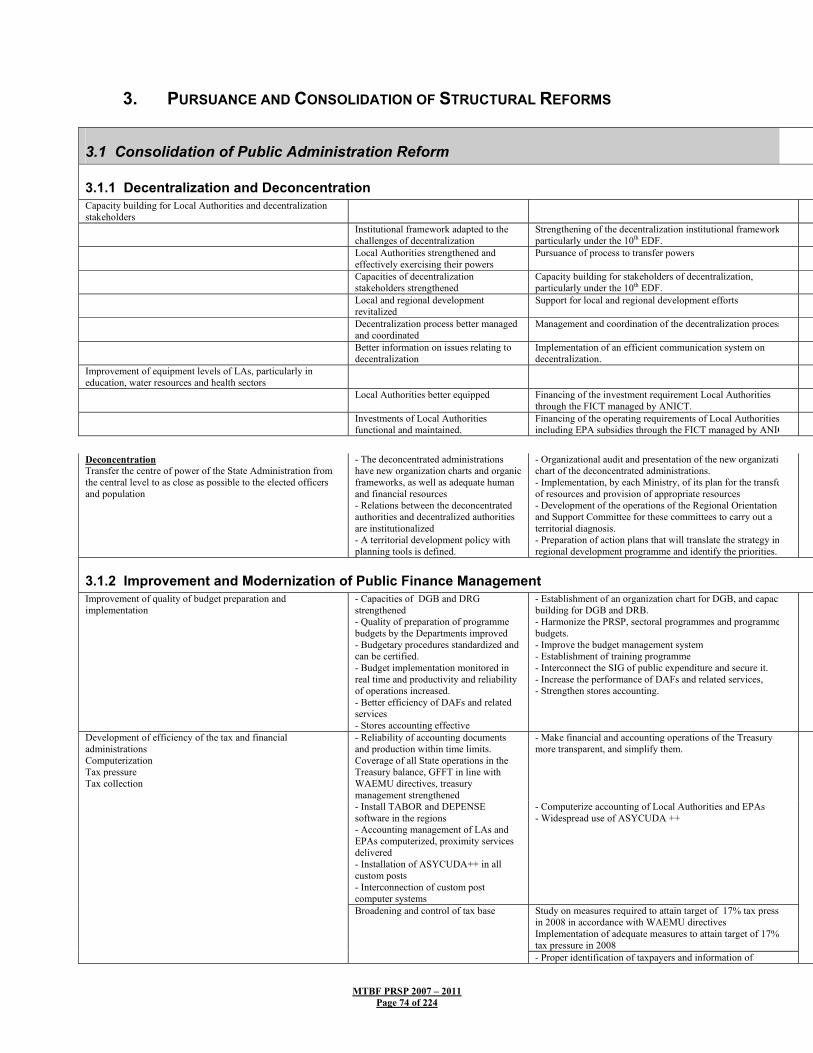
MTBF PRSP 2007 – 2011 Page 74 of 224
3. PURSUANCE AND CONSOLIDATION OF STRUCTURAL REFORMS
3.1 Consolidation of Public Administration Reform
3.1.1 Decentralization and Deconcentration Capacity building for Local Authorities and decentralization stakeholders
Institutional framework adapted to the challenges of decentralization
Strengthening of the decentralization institutional frameworkparticularly under the 10th EDF.
Local Authorities strengthened and effectively exercising their powers
Pursuance of process to transfer powers
Capacities of decentralization stakeholders strengthened
Capacity building for stakeholders of decentralization, particularly under the 10th EDF.
Local and regional development revitalized
Support for local and regional development efforts
Decentralization process better managed and coordinated
Management and coordination of the decentralization process
Better information on issues relating to decentralization
Implementation of an efficient communication system on decentralization.
Improvement of equipment levels of LAs, particularly in education, water resources and health sectors
Local Authorities better equipped Financing of the investment requirement Local Authorities through the FICT managed by ANICT.
Investments of Local Authorities functional and maintained.
Financing of the operating requirements of Local Authoritiesincluding EPA subsidies through the FICT managed by ANIC
Deconcentration Transfer the centre of power of the State Administration from the central level to as close as possible to the elected officers and population
- The deconcentrated administrations have new organization charts and organic frameworks, as well as adequate human and financial resources - Relations between the deconcentrated authorities and decentralized authorities are institutionalized - A territorial development policy with planning tools is defined.
- Organizational audit and presentation of the new organizatiochart of the deconcentrated administrations. - Implementation, by each Ministry, of its plan for the transfeof resources and provision of appropriate resources - Development of the operations of the Regional Orientation and Support Committee for these committees to carry out a territorial diagnosis. - Preparation of action plans that will translate the strategy inregional development programme and identify the priorities.
3.1.2 Improvement and Modernization of Public Finance Management Improvement of quality of budget preparation and implementation
- Capacities of DGB and DRG strengthened - Quality of preparation of programme budgets by the Departments improved - Budgetary procedures standardized and can be certified. - Budget implementation monitored in real time and productivity and reliability of operations increased. - Better efficiency of DAFs and related services - Stores accounting effective
- Establishment of an organization chart for DGB, and capacibuilding for DGB and DRB. - Harmonize the PRSP, sectoral programmes and programmebudgets. - Improve the budget management system - Establishment of training programme - Interconnect the SIG of public expenditure and secure it. - Increase the performance of DAFs and related services, - Strengthen stores accounting.
- Reliability of accounting documents and production within time limits. Coverage of all State operations in the Treasury balance, GFFT in line with WAEMU directives, treasury management strengthened
- Make financial and accounting operations of the Treasury more transparent, and simplify them.
- Install TABOR and DEPENSE software in the regions - Accounting management of LAs and EPAs computerized, proximity services delivered - Installation of ASYCUDA++ in all custom posts - Interconnection of custom post computer systems
- Computerize accounting of Local Authorities and EPAs - Widespread use of ASYCUDA ++
Study on measures required to attain target of 17% tax pressuin 2008 in accordance with WAEMU directives Implementation of adequate measures to attain target of 17% tax pressure in 2008
Development of efficiency of the tax and financial administrations Computerization Tax pressure Tax collection
Broadening and control of tax base
- Proper identification of taxpayers and information of

MTBF PRSP 2007 – 2011 Page 75 of 224
taxpayers in order to control tax evasion - Capacity building for tax collection services
Incorporate external financing in national budget procedures
- Gather information required for improving predictability of budgetary aid resources - Government control of all Budget resources - Enhanced decentralization of investments
- Adapt budget procedures to ensure widespread use of budgesupport. - Make accounting information exhaustive, of high quality anavailable - Investments under the supervision of Local Authorities
Improve the efficiency and transparency of public procurements procedures
- Scope of the Code redefined, award threshold increased, purchases outside contracts regulated. - Organization of deconcentrated DGMP - Procurement regulations adapted to decentralization - More effective and independent controls, contracting authority given more powers, public procurement procedures followed. - Access by SMEs and national enterprises to public contracts encouraged - Fair prices obtained for all Government purchases.
- Renovation of the regulatory framework for public procurement - Reinforcement of control structures - Capacity building for DGMP - Improvement of access by SMEs and national enterprises topublic contracts - Enhancement of governance and transparency in public procurements. - Revision of market prices
Strengthen governance and enhance Transparency (cross-cutting activities)
- Texts consistent with Directives 5/9 and 6/97 of WAEMU - Organization, procedures and competence of MEF adapted - Increased efficiency of controls - Control and evaluation roles of the Accounts Section of the Supreme Court, National Assembly, General Control of Public Services and the Inspectorate of Finance reinforced - Upgrade the skills of employees
- Make legal texts consistent with WAEMU Directives. - Adaptation of organization charts and organic frameworks oMEF services to their missions - Make the control system consistent - Reliability of court and administrative controls - Capacity building for the Accounts Section of the Supreme Court, the National Assembly, General Control of Public Services and Inspectorate of Finance - Adapt the conformity control - Improve the quality of a priori control, and reinforce it - Create a continuous training structure for Finance employee- Prepare a Computer Master Plan for MEF
3.2 Pursuance of Reform of the Business Environment Improvement of the business environment Implementation of the Law establishing a
single identity
Computerization of the trade register. Measures to fight against corruption particularly under 1EDF
Computerization of the property loan register.
Simplification of procedures for starting a business
Creation of a single window for starting a business.
Comparative study on the competitiveness of business tax with those of WAEMU countries
Simplification of corporate taxes, particularly under the 1EDF
Ensure consistency of the regulatory framework with the judicial system in the business environment.
Improvement of the judicial system
Study on reduction of registration duty on property.
Improvement of access to land
Review of the Labour Code to improve flexibility of the labour market.
Improvement of labour market regulations
Formalities of credit files simplified and lightened.
Development of access to bank financing
Reduction of water and electricity charges Significant reduction of telecommunication charges.
Reduction of factor costs (investments development competition)
Study on formulation of measures to Promotion of exports
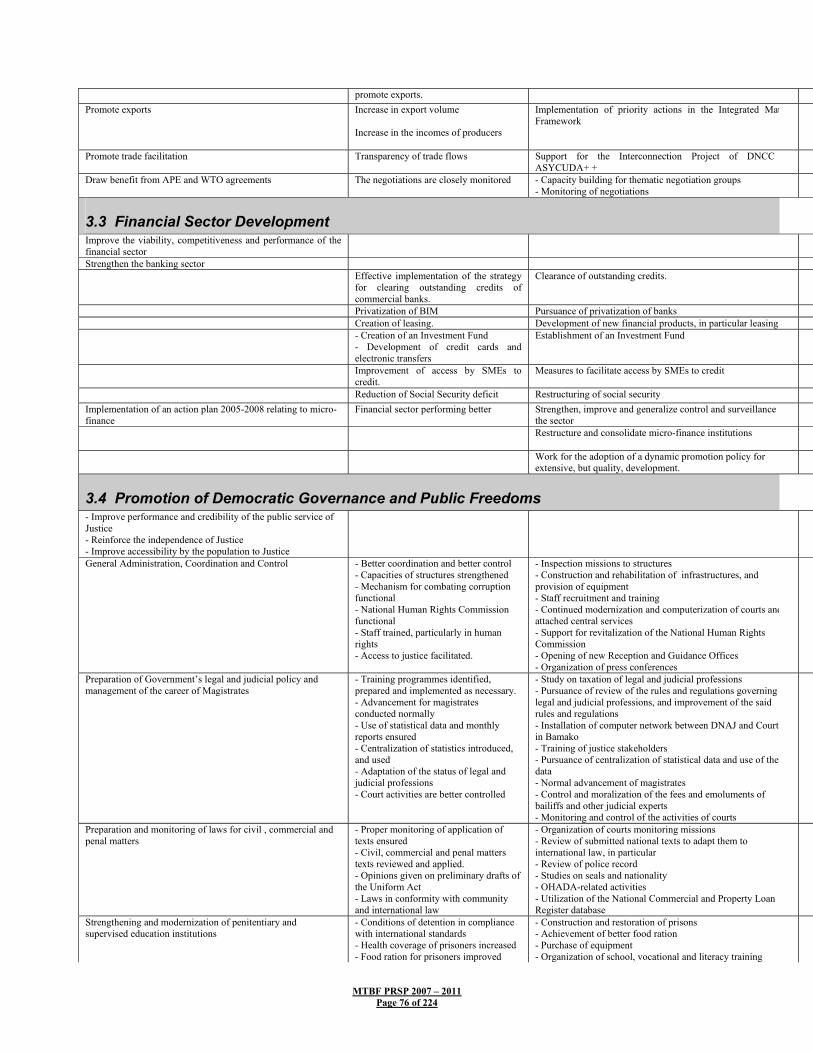
MTBF PRSP 2007 – 2011 Page 76 of 224
promote exports. Promote exports
Increase in export volume Increase in the incomes of producers
Implementation of priority actions in the Integrated MatFramework
Promote trade facilitation Transparency of trade flows Support for the Interconnection Project of DNCCASYCUDA+ +
Draw benefit from APE and WTO agreements The negotiations are closely monitored - Capacity building for thematic negotiation groups - Monitoring of negotiations
3.3 Financial Sector Development Improve the viability, competitiveness and performance of the financial sector
Strengthen the banking sector Effective implementation of the strategy
for clearing outstanding credits of commercial banks.
Clearance of outstanding credits.
Privatization of BIM Pursuance of privatization of banks Creation of leasing. Development of new financial products, in particular leasing. - Creation of an Investment Fund
- Development of credit cards and electronic transfers
Establishment of an Investment Fund
Improvement of access by SMEs to credit.
Measures to facilitate access by SMEs to credit
Reduction of Social Security deficit Restructuring of social security Implementation of an action plan 2005-2008 relating to micro-finance
Financial sector performing better Strengthen, improve and generalize control and surveillance othe sector
Restructure and consolidate micro-finance institutions
Work for the adoption of a dynamic promotion policy for extensive, but quality, development.
3.4 Promotion of Democratic Governance and Public Freedoms - Improve performance and credibility of the public service of Justice - Reinforce the independence of Justice - Improve accessibility by the population to Justice
General Administration, Coordination and Control - Better coordination and better control - Capacities of structures strengthened - Mechanism for combating corruption functional - National Human Rights Commission functional - Staff trained, particularly in human rights - Access to justice facilitated.
- Inspection missions to structures - Construction and rehabilitation of infrastructures, and provision of equipment - Staff recruitment and training - Continued modernization and computerization of courts andattached central services - Support for revitalization of the National Human Rights Commission - Opening of new Reception and Guidance Offices - Organization of press conferences
Preparation of Government’s legal and judicial policy and management of the career of Magistrates
- Training programmes identified, prepared and implemented as necessary. - Advancement for magistrates conducted normally - Use of statistical data and monthly reports ensured - Centralization of statistics introduced, and used - Adaptation of the status of legal and judicial professions - Court activities are better controlled
- Study on taxation of legal and judicial professions - Pursuance of review of the rules and regulations governing legal and judicial professions, and improvement of the said rules and regulations - Installation of computer network between DNAJ and Courtsin Bamako - Training of justice stakeholders - Pursuance of centralization of statistical data and use of the data - Normal advancement of magistrates - Control and moralization of the fees and emoluments of bailiffs and other judicial experts - Monitoring and control of the activities of courts
Preparation and monitoring of laws for civil , commercial and penal matters
- Proper monitoring of application of texts ensured - Civil, commercial and penal matters texts reviewed and applied. - Opinions given on preliminary drafts of the Uniform Act - Laws in conformity with community and international law
- Organization of courts monitoring missions - Review of submitted national texts to adapt them to international law, in particular - Review of police record - Studies on seals and nationality - OHADA-related activities - Utilization of the National Commercial and Property Loan Register database
Strengthening and modernization of penitentiary and supervised education institutions
- Conditions of detention in compliance with international standards - Health coverage of prisoners increased - Food ration for prisoners improved
- Construction and restoration of prisons - Achievement of better food ration - Purchase of equipment - Organization of school, vocational and literacy training

MTBF PRSP 2007 – 2011 Page 77 of 224
- Modern database of prisoners created - School and vocational training of prisoners undertaken
- Procurement and equipment of workshops - Operationalization of Regional Directorates - Implementation of the national reeducation and social reintegration policy. - Strengthening of agricultural penitentiary structures
Training of judicial staff and dissemination of law - Justice stakeholders better equipped to accomplish their missions more efficiently. - Access to legal information ensured - Appropriate work environment created.
- Training of judges, trainee registrars, registry and prosecutooffice secretaries and prison guards - Development of a computer network and access to legal information - Development of the work environment - Update, improvement and extension of training programme- Strengthening of infrastructures and reform of INFJ
Strengthening the capacities and capabilities of the Government and civil society organizations in detecting and preventing corruption
Enhancement of transparency in the management of public contracts (See Pillar 4: Improvement and modernization of the management of public finance)
Reinforcement of peace and security Tranquility of the population ensured - Installation of new security forces, new security posts, gendarmerie units, and police units - Organization of patrols along the borders and urban centres. - Security coverage of presidential and legislative elections in 2007
Fight against financial delinquency. Increase effectiveness of the fight against financial delinquency.
Implementation of the GAF recommendations and GIABA actions, in particular the creation of a National Financial Information Processing Unit (CENTIF).
3.5 Capacity Building for the Civil Society Enhance participation of civil society in the management of public affairs.
Support to establishment of regional CNSC organs,particularly under the 10th EDF
Reinforcement of Governance within the civil society Preparation of a strategic plan and its implementation Support for harmonization of OSC interventions Conduct of a study on actual contribution by OSCs to the
socio-economic development of Mali. Capacity building for youth associations in the formulation,
preparation, implementation and monitoring of projects. Capacity building for stakeholders of the civil society in the
design, implementation, and evaluation of development policies.
Creation of a database in apex organizations.
• • Implementation of a civilsociety programme on peaceand security.
3.6 Strengthening of Regional and Sub-regional Integration Initiatives See to the implementation of agreements and treaties relating to establishment and movement of goods
The populations and stakeholders of integration are informed and sensitized on integration programmes.
- Monitoring of activities of phase II of the co-developmentprogramme. - Creation of an emergency and assistance fund forrepatriated persons.
Effective implementation of sectoral agreements under WAEMU, ECOWAS and NEPAD
- Free movement of people and goods, the right of establishment and right of residence are ensured. - The population and stakeholders of integration are informed and sensitized on integration programmes.
- Harmonization of WAEMU, ECOWAS, CEN-SAD andAU programmes.

MTBF PRSP 2007 – 2011 Page 78 of 224
4. DEVELOPMENT OF ACCESS TO BASIC SOCIAL SERVICES
4.1 Education
By 2015, all Malian children will complete quality basic education, and the education sector provides the country with human resources required for its development.
The quality and management of basic education, as well as access to it are improved.
Improvement of quality and management of basic education, and improvement of access to it.
334 998
2007-2009
MEN
The enrolment capacities are increased in general secondary education.
Increase enrolment capacities in general secondary education
Develop general secondary education.
The quality and management of general secondary education are improved.
Improvement of quality and management of general secondary education.
32 281 2007-2009 MEN
Consolidate and diversify technical and vocational education
The initial and continuous training of trainers of technical and vocational education is ensured. Training is better adapted to labour market requirements.
Initial and continuous training of trainers of technical and vocational education. Adaptation of training to labour market requirements.
14 208
2007-2009 MEN
Provide quality higher education adapted to priority needs and controlled costs.
The enrolment capacity of higher training institutions is increased and improved. The management and quality of higher education are improved.
Increase and improvement of the enrolment capacity of higher training institutions and improvement of the management and quality of higher education.
56 734 2007-2009 MEN
Undertake any type of scientific and technological works for sustainable human development.
The results of scientific production are increased and disseminated. The research coordination organs are dynamic.
Increase the level of scientific production, and revitalization of research coordination organs. 2 517
2007-2009
MEN, Research Institutes
Ensure human resources management, as well as coordination, animation and supervision of activities of the department.
The capacities of the ministry are strengthened at all levels.
Capacity building for departments in the coordination, planning and management of human resources at all levels.
65 322 2007-2009
Ministry of Education
Total 440 738
4.2 Health
Make services available and accessible in public, community and private structures with emphasis on poor zones, disinherited zones and/or zones with difficult access. (Sub-component 1)
Health centres coverage at the 1st level is ensured: 70% of the new areas defined, 80% of which are covered by the community sector and 20% by the private sector.
Improvement of accessibility of the population to quality Minimum Activities Package (PMA).
120 909
2007-2009
MS
Improve the availability of staff in health services, laying emphasis on peripheral services. (Sub-component 2)
Qualified, motivated and adequate staff is available in health structures at all levels.
Reform of human resource management
45 431
2007-2009 MS
Make available essential drugs, vaccines, and consumables, as well as laboratory tests in CSCOMs and CSREFs in all areas, particularly in poor areas and areas with difficult access. (Sub-component 3)
Quality essential drugs are more available and accessible at all levels of the health pyramid.
- Availability of financially accessible essential drugs 64 002 2007-
2009 MS
Improve the quality of health services, increase demand and control of priority diseases. (Sub-component 4)
The population benefit from quality services in health institutions of health districts, as well as specific programmes for control of priority
Improvement of quality of health services, increase in demand and control of priority diseases. 39 242 2007-
2009 MS

MTBF PRSP 2007 – 2011 Page 79 of 224
diseases. Improve financial accessibility and sustain demand and participation. (Sub-component 5).
Financial accessibility to health care is improved, particularly in poor areas.
Improvement of access by the poor to quality health care in health institutions through third party payer mechanism.
7 595
2007-2009
MDSSPA
Improve the quality of health services in hospital institutions and other research institutions. (Sub-component 6).
Specialized institutions, including research institutions contribute to improving the health status of the population, particularly the poor.
Improvement of health status of the population, particularly the poor, through the implementation of action plans of specialized institutions, including research institutions.
29 774
2007-2009 MS
Reinforce decentralization and institutional capacities. (Sub-component 7).
Local authorities are capable of more effectively handling health problems in councils, districts and regions.
Improvement of management capacities of councils, districts and regions in the transfer of powers in health matters.
39 384
2007-2009
MS, Research Institutes, MATCL, MDSSPA
Total 346 337
4.3 Social Development
Ensure the protection and promotion of social categories and communities in particularly difficult situation through prevention, compensation and reintegration measures (Sub-component).
The protection and promotion of handicapped persons are improved through prevention, compensation and reintegration measures.
Promote the socio-economic integration of handicapped persons.
Strengthen the self-promotion capacities of communities. Improve incomes and access to basic services for the poorest. (Sub-component).
The living conditions of targeted most underprivileged rural communities are improved.
Improvement of living conditions of targeted most underprivileged rural communities.
Gradually extend coverage of social risks to the entire population through various mechanisms and improve financial accessibility to health care. (Sub-component)
The coverage of social risks is gradually extended to the entire population, and financial accessibility to health care is improved.
Extension of scope of social security
A legal and institutional framework adapted to the missions of the ministry is defined.
Definition of a legal and institutional framework adapted to the missions of the ministry.
Institutional capacity building for MDSSPA, partner institutions and social and solidarity economy organizations. Develop the institutional framework and implementation process of social interventions at the decentralized level (Sub-component 4).
The structures and resources of the ministry are managed and planned more efficiently.
Planning and efficient management of the structures and resources of the ministry.
Improve human resources in terms of quantity and quality, leading to professionalization of the social sector (Sub-component 5)
The capacities and quality of education in INFTS and CAMASC are improved.
Improve the capacities and quality of education in INFTS and CAMASC.
Total
4.4 Drinking Water and Sanitation
Satisfy the water needs, in terms of quality and quantity, of a growing population, as well as various sectors of the developing national economy, while respecting aquatic ecosystems and preserving the needs of future generations.
50 DWS and 3 000 modern water points are constructed 100 DWS and 1 700 modern water points rehabilitated
Construction and rehabilitation of modern water points aspart of PNAEP implementation using a sectoral approach(PROSEA)
The project and programme monitoring and evaluation mechanism is established and functional
Establishment of a project and programme monitoring andevaluation mechanism (Government/TFP investments)

MTBF PRSP 2007 – 2011 Page 80 of 224
Protect people and property against the aggressive actions of water, and protect water resources against various types of pollution
The implementing texts of the Water Code are applied
Application of the Water Code
The water resources monitoring and evaluation strategy is adopted and implemented
Implementation of the water resources monitoring andevaluation strategy
PAGIRE is prepared and adopted Preparation and adoption of PAGIRE
PAGIRE is implemented. Implementation of PAGIRE
The Water Quality Laboratory of is constructed, equipped and functional.
Construction and equipment of the Water Quality Laboratoryin Mopti.
Contribute to development of agro-sylvo-pastoral activities by protecting them against the vagaries of the weather, so as to actively participate in poverty reduction and achievement of food security.
The pastoral water resources strategy is prepared and implemented.
Preparation and implementation of the pastoral waterresources strategy.
Reduce the burden of the water sector on public finance by sharing the costs between the public authorities, local authorities and users.
The Drinking Water and Sanitation Strategy reviewed
Review of the Drinking Water and Sanitation Strategy.
The national drinking water infrastructure maintenance strategy is adopted and implemented.
Adoption and implementation of the national drinking waterinfrastructure maintenance strategy.
Promote regional cooperation for the management of cross-border waters so as to prevent conflicts relating to their use.
The Water Sector Communication Strategy is implemented.
Implementation of the Water Sector CommunicationStrategy.
2008 and 2010 Editions of SIDEAU are held Holding of the International Water Fair
Total
4.5 Creation and Promotion of Sustainable Jobs
Improve the legal framework and promote employment. - Labour-intensive projects are implemented throughout the national territory. - Jobs are created and/or consolidated in the associations or cooperatives sector.
Consolidation of the national employment policy Coordination of activities of structures operating in the employment sector
Adopt a coherent qualifying and apprenticeship continuous vocational training policy.
Qualifying and apprenticeship continuous vocational training is gradually extended to cover the entire country.
Improvement of access to, and quality of, qualifying and apprenticeship continuous vocational training.
Ensure human resources management, as well as coordination, animation and supervision of activities relating to qualifying and apprenticeship continuous vocational training.
Synergy in coordination activities is achieved.
Establishment of a programme coordination mechanism in the implementation of the national employment policy.
Total
4.6 HIV/AIDS Control
Control HIV/AIDS HIV/AIDS prevention is ensured. Infected and affected persons are treated.
Prevention and treatment of persons infected and affected by HIV/AIDS

MTBF PRSP 2007 – 2011 Page 81 of 224
5. CROSS-CUTTING ISSUES
5.1 Gender Guide, coordinate, evaluate and control the activities of the ministry, manage the resources and information.
The intervention and operating capacities are strengthened.
Intervention and operating capacities are strengthened for incorporation of gender aspects in development projects/programmes.
Improve the social status of women. The well-being of women is improved. Improvement of the well-being of women through education,training, as well as economic, social and cultural promotion.
Ensure the well-being of children and the family. The environment is conducive for the implementation of children’s and family rights.
Promotion of an environment conducive to the implementation of children’s and family rights.
Total
5.2 Peace and Security Preserve social peace in Mali Take into account peace-security dimension in all projects
and programmes ; Include peace-security cross-cutting theme in civil society interventions
Ensure personal security for the citizens Strengthen the capacities of internal security and civil protection forces; Strengthen road and river safety; Lay the bases for a proximity police force; Strengthen prevention and management of community conflicts; Strengthen the disaster management mechanism; Establish proper governance of internal security and civil protection.
5.3 Territorial Development Balanced distribution of populations and activities throughout the national territory
Establish a geographical information system
Consistency of public and private activities, which contribute to the country’s economic development
Prepare development plans for the various territorial levels
Reduction of inter-regional and intra-regional disparities in development
Review sector and/or regional and local plans and programmes prior to adoption of the national territorial development policy
Emergence of economic regions based on development poles Better coordination of the development actions of stakeholders at the various territorial levels
Train and sensitize stakeholders in territorial development
Promotion of peaceful and traditional land management Consistency between national, community and African sector policies
Enhancement of integration within WAEMU space Establish partnership relations with sub-regional organizations/institutions engaged in the promotion of territorial development (WAEMU, CILSS)
6. STRENGTHENING OF STATISTICS MECHANISM AND PRSP MONITORING
6.1 Strengthening of Statistics Mechanism Key surveys available on CD-ROM Statistics available in electronic version
Electronic archiving and dissemination of statistical information Launching and dissemination of Malikunnafoni database
Initial results of ELIM 2006 available. Launching of the next ELIM survey in 2008
Sustainability of ELIM survey (every 2 years and increase in sampling rate to obtain significant results in decentralized authorities) Census of craftsmen
The production of basic statistics is improved Broadening of scope of indicators to the environment,

MTBF PRSP 2007 – 2011 Page 82 of 224
energy and tourism Production of a basic TES using ERETES software Registration of natural persons and corporate bodies Conduct of vegetable crops survey Conduct of the 4th general population and housing census Conduct of the 3rd budget consumption survey Economic analysis of some sub-sectors (rice, cattle, meat, poultry, shea, sesame, etc.)
Effective implementation of the bill on the creation of several new sectoral CPS
Support for the creation of new CPS
Staff of CPS trained (survey skills, data processing and analysis, cartographic statistics software)
Institution building for existing CPS and staff training
Sectoral performance chart Sector statistics produced and disseminated Support for statistics production
6.2 Strengthening of PRSP Monitoring Support for preparation of projects and programmes of local authorities Extension of GEPRIMA to CPS Preparation of report of the 7th Review of projects and programmes in Mali Training workshop for DRPSIAP, CPS and regional assemblies in the evaluation of development policies and strategies
Development projects and programmes are managed
Study on the technical assistance strategy Establishment of a geographical information system (SIG) and training Evaluation of sectoral and spatial plans and programmes
Balanced and viable development of the national territory
Training workshops for regional committees on territorial development Prospective study on human resources Preparation of a programme for studies and research in population and development
Improve the coordination, monitoring-evaluation of policies, programmes, as well as social, economic, cultural, sectoral and spatial development strategies
Population variables are integrated into development programmes
Prospective study on training and employment

MINISTRY OF THE ECONOMY REPUBLIC OF MALI AND FINANCE One People – One Goal – One Faith
------------------ ---------------- GENERAL SECRETARIAT ------------------
SUMMARY OF THE 2ND GENERATION PRSP 1. The first Poverty Reduction Strategy Paper of Mali (PRSP I), which covered the 2002-
2006 period, was adopted in May 2002. It is the single medium-term frame of reference for the economic and social development policy of Mali, and the main reference document used by Technical and Financial Partners in their support operations, in particular budget support, for the country. The PRSP has helped to implement several programmes in each of the proposed priority areas, namely: institutional development, improvement of governance and participation, human development, reinforcement of access to social services, development of infrastructures, and support to key productive sectors.
2. The reports on PRSP implementation and review conducted in June 2006 underscored the achievements and weaknesses in PRSP I preparation and implementation. Justifications for the preparation of a new generation PRSP therefore lie in the weaknesses of PRSP I, in particular:
• Inadequacy of results obtained in relation to the set overall goals;
• Lack of link between the PRSP and the State budget;
• Operational weakness of the institutional monitoring-evaluation mechanism; and
• Weakness of the various analysis instruments, indicators, and statistics.
3. It is within this context that the draft NG (new generation) PRSP or PRSP II was prepared. On 8 and 9 June 2006, the first review of the Poverty Reduction Strategy Paper (PRSP) took place. The review made it possible to:
• assess, through the various PRSP pillars and sector programmes, the trend of poverty since 2002 ;
• conduct a critical analysis of the PRSP process and the results obtained at the macro-economic and sectoral levels;
• exchange views on the constraints and difficulties which hampered implementation of the PRSP, and specifically sector projects and programmes;
• exchange views on the problem of PRSP financing; and
• make operational recommendations for preparation of the 2nd generation PRSP.
4. These recommendations, adopted in the Cabinet Meeting of 26 July 2006, are as follows:
• give priority to productive sectors to ensure sustained growth that would reduce poverty;
• review the impact of policies and programmes, while laying emphasis on quality through better analysis ;
• improve statistics by implementing the Statistics Master Plan;

MTBF PRSP 2007 – 2011 Page 84 of 224
• extend taxation to the agricultural sector (semi-urban farms) and housing (survey) ;
• implement all the PDI components;
• ensure consolidation of decentralization by accelerating transfer of resources, adopting new laws on inter-council relations, and giving impetus to efforts towards coherent and sustainable local and regional development;
• harmonize donor procedures and alignment on national procedures through budget support;
• ensure harmonization of timetables for sectoral reviews, as well as PRSP and budget process review;
• ensure PRSP-MDG integration;
• review monitoring and evaluation indicators and institutional mechanism;
• provide capacity building for monitoring-evaluation stakeholders; and
• broaden the PRSP participatory process.
5. The preparation of a new generation PRSP is justified for the following reasons:
• inadequacy of the results obtained in relation to the overall objectives defined in PRSP I;
• weaknesses noted in PRSP implementation, in particular the weak PRSP- State Budget link, the low operationalization of the institutional monitoring-evaluation mechanism, the low institutional capacity in terms of the methods, tools, instruments and indicators used, as well as the poor quality of basic statistics;
• limited consideration of some areas in the current version of the PRSP, in particular the environment, food security, the cotton sub-sector, HIV/AIDS control, handicraft and tourism, trade, the fight against corruption, the gender approach, and micro-finance;
• consolidation of PRSP I outputs and consideration of the MDGs; and
• continuity of the PRSP process over time.
6. The 2nd generation PRSP preparation process took place as follows:
• formulation and adoption, by the PRSP institutional mechanisms (Steering Committee, Mali-Development partners Joint Committee, Policy Committee), of terms of reference and detailed road map for the preparatory meetings: September to December 2005 ;
• organization and holding of a workshop to launch PRSP II preparation: 16-17 January 2006 ;
• formation of six ad hoc working groups: (1) Macro-economic Framework; (2) Budgetary framework; (3) Sector Policies Analysis; (4) PRSP I Evaluation; (5) Formulation of accelerated growth strategy; and (6) Decentralization and spatialization.
• conduct of ad hoc group meetings: February to June 2006 ;
• organization and conduct of first 2002-2005 PRSP review: 8-9 June 2006 ;
• preparation of PRSP II document: July-September 2006 ;
• national workshop on PRSP II preparation and monitoring/evaluation: 11-13 September 2006;
• incorporation of stakeholders’ remarks: October 2006;
MTBF PRSP 2007 – 2011 Page 85 of 224
• 22nd meeting of Mali-TFP Joint Commission: 20 November 2006; and
• finalization of PRSP II and submission to Cabinet Meeting: November 2006.
7. The preparation of PRSP II is based on:
• the 2002-2006 PRSP;
• the reports of ad hoc groups;
• the conclusions of 1st PRSP review; and
• sector policy documents.
8. The current version of PRSP II, which incorporates remarks from the national workshop held from 11 to 13 September 2006, is the focus of this written statement. This version also takes into account suggestions for improvement made by the civil society (meeting with PRSP Unit on 9 November 2006) and by the 22nd meeting of the Mali-TFP Joint Commission on 20 November 2006.
POVERTY IN MALI 9. Implementation of the PRSP helped to reduce the level of poverty from 68.3% in 2001
(income base) to 59.2% in 2005, on the basis of an updated poverty line of CFAF 153,310. The goal of reducing poverty by one-quarter over the 2001-2006 period and bringing down the level to 47.5% in 2006 was therefore not achieved. The analysis shows a wide gap between rural areas (73.04%) and urban areas (20.12%). Furthermore, poverty in urban areas was reduced, since the incidence of poverty in these areas declined from 26.2% in 2001 to 20.12% in 2006, representing a decline of more than 6 points. On the other hand, in rural areas, the incidence of poverty has remained stable, from 73.8% in 2001 to 73.04% in 2005. The preceding analyses therefore show that in Mali poverty is essentially a rural phenomenon; the degree of poverty stood at 24.1% in 2005 as against 31.4 % in 2001, which indicates some progress. This shows that the gap between the incomes of the poor and the poverty line is reducing. In the same connection, the severity of poverty has reduced from 17.6% in 2001 to 12.6% in 2005, representing a decline by 5 points.
10. In conclusion, it should be noted that the low level of poverty reduction during PRSP I could be due mainly to poor control of population growth, inadequate growth rate of the Malian economy, and unequal distribution of the fruits of growth.
PRSP II 11. The new generation Poverty Reduction Strategy Paper (PRSP II), which could be
defined as the Growth and Poverty Reduction Strategy Paper, describes the policies and programmes which the country intends to implement at the macro-economic, structural and social levels, so as to promote growth and reduce poverty over the 2007-2011 period. It also presents the financing plan and related external financing requirements for the entire period.
12. The guiding principles of PRSP II preparation are as follows:
• consolidation of the achievements of PRSP I;
• acceleration of growth by eliminating major constraints and implementing new sources of growth; and

MTBF PRSP 2007 – 2011 Page 86 of 224
• integration of MDGs.
13. PRSP II is based on conclusions/recommendations of the first PRSP 2002-2006 review and specific meetings of six ad hoc groups set up in the first quarter of 2006 :
• “Macro-economic Framework”,
• “Budgetary framework”,
• “Sector Policies Analysis”,
• “PRSP I Evaluation”,
• “Formulation of accelerated growth strategy”,
• “Decentralization and spatialization”.
14. These six ad hoc working groups discussed the themes of the 13 thematic groups that had prepared PRSP 2002-2006. Following preparations at end of 2005, the discussions started in January 2006 and the initial documents were presented in July 2006. Consultations were held with all the stakeholders throughout the preparation process, and a national workshop in September put together the views of all stakeholders in PRSP II.
15. This new strategy underscores the major expectations, as drawn from the evaluation of PRSP implementation and which can affect the achievement of PRSP II objectives; the expectations concern mainly the following points:
• continued stability of the macro-economic environment and consistency between macro-economic and budgetary forecasts, as well as external financing ;
• better adaptation of the strategies, priorities and budget programming of the Medium Term Budgetary framework (MTBF) to those of the sectoral Medium Term Expenditure Frameworks (MTEF), particularly in action plans and detailed sectoral financing plans ;
• significant reduction of poverty and hunger, especially in rural areas, as a result of real development of food security;
• improvement of the health status of the populations, especially the poorest;
• significant improvement of the quantity and quality of education ;
• creation of a conducive environment for private sector development and pursuance of structural reforms, such as privatizations (CMDT, SOTELMA);
• pursuance and acceleration of Government reform in terms of decentralization, deconcentration, and public finance.
Economic and Budgetary framework 16. The main objective of the macro-budgetary framework is to maintain macro-economic
and budgetary balances, taking into account the real potential of the Malian economy, as well as the overall and sector goals of the PRSP.
17. Following consideration of several variants based on diverse public investments and tax pressure assumptions, a voluntarist scenario of strong growth was adopted, showing the political will to accelerate overall growth driven by rapid private sector development. The average estimated GDP growth rate for the 2007-2011 period will be +7%. In public finance, efforts will be made towards mobilization of internal resources, with a tax pressure of 17% as from 2008, in accordance with Mali’s commitments concerning the WAEMU convergence criteria.
MTBF PRSP 2007 – 2011 Page 87 of 224
18. The Government’s budget and financial policy will be supported by activities proposed in the Government’s Action Plan for the Improvement and Modernization of Public Finance Management (PAGAMGFP). During PRSP II, total revenue and expenditure estimates (including net loans) are consistent with the macro-economic framework and Medium Term Budgetary framework. The total revenue (excluding grants) will stand at CFAF 884 billion in 2011 as against CFAF 540 billion in 2007. Tax revenue will increase at an average annual rate of 10.3%. Total expenditure and net loans would increase at an average annual rate of 7.1% to CFAF 1,217 billion in 2011. These estimates include the financing programmes, as well as evaluations of internal and external financing requirements for the period.
PRSP Objectives and Actions 19. PRSP II has two major objectives:
• promote strong annual growth of 7.0%, by generating wealth and creating jobs in growth-oriented sectors of the national economy, such as rural production (agriculture, livestock, fisheries, agro-forestry, fruits and vegetables), the mining and energy sector, and the goods and services sector (tourism, culture and NICT). These growth-oriented sectors require explicit energy strategies that consider alternative forms of energy other than electricity alone (motive force, pumping). Real control of population growth and better redistribution of the created wealth will help to reduce inequalities and distortions of access to basic social services, which are the main causes of poverty;
• improve the functioning of public services by pursuing, consolidating and deepening reforms initiated at the institutional level (decentralization and deconcentration), democratic governance (democracy, fight against corruption, and establishment of the rule of law), the economic level (micro- finance and the private sector) and improvement of the social sector (education, health and, above all, HIV/AIDS control).
20. During PRSP I, priority was given to the allocation of budgetary resources to social sectors in general. In PRSP II, while continuing with these sectors, emphasis will be laid on the implementation of structural reforms and on the Special Investment Budget (BSI) to support growth-oriented sectors, such as rural production, mining and infrastructure.
21. To ensure sustained growth and sustainable poverty reduction, development should be anchored on the decentralization of government action to the local level, and on territorial development which will help to tap the existing economic, human and environmental potential, mitigate constraints and territorial imbalances, and revitalize local economies.
22. Ensuring consistency between national (Government) strategies and local (Local Authorities) priorities and improving production conditions in rural areas will create attractive development poles to reduce rural exodus of youths, particularly to urban centres. Poverty reduction also requires real control of population growth and special attention to the redistribution of wealth by social and spatial category.
Strategic Orientations 23. PRSP II is based on three strategic orientations: I. Development of infrastructures and the productive sector; II. Pursuance and consolidation of structural reforms; and III. Strengthening of the social sector.

MTBF PRSP 2007 – 2011 Page 88 of 224
Priority Areas of Intervention 24. The priority areas of intervention of PRSP II are as follows: 1. Food security and rural development; 2. Development of small and medium size enterprises; 3. Protection and sustainable management of natural resources; 4. Consolidation of public administration reform; 5. Pursuance of reform of the business environment; 6. Development of the financial sector; 7. Development of infrastructures; 8. Promotion of democratic governance and public freedoms; 9. Capacity building for the civil society; 10. Strengthening of regional and sub-regional integration initiatives; 11. Creation and promotion of long-term jobs; 12. Development of access to basic social services; 13. HIV/AIDS control; and 14. Integration into the Multilateral Trade System.
PRSP II Accelerated Growth Strategy Major Constraints: climate change and volatility of world commodity prices. Objective: sustainable growth that would improve the country’s socio-economic situation and facilitate achievement of the Millennium Development Goals (MDG). Major Challenges to the Malian Economy:
• ensure competitiveness of the economy;
• diversify its sources of growth so as to broaden its supply capacity; and
• make the private sector the principal engine of growth.
Growth-oriented Sectors in Mali
Traditional Sectors Rural Sector Growth of the rural sector will be achieved through maximum development of the country’s agro-ecological potential and pastoral skills. Cotton will continue to be an important sector during the PRSP II period. The National Development Strategy Paper for the cotton sector will help to increase productivity of the sector. Mining
• Gold
• Oil exploration.
New Possibilities • industries
• trade
• tourism
• fruits, vegetables and oil plants
• handicraft
• culture
• youth and sports.
MTBF PRSP 2007 – 2011 Page 89 of 224
Growth-oriented infrastructures Growth will also be boosted through: (i) development of viable industrial zones; (ii) availability of water and electricity at better prices, (iii) construction of transport infrastructure, (iv) development of Telecommunications/ICT, and (v) access to more substantial financing. It is therefore necessary to improve the business climate.
Cross-cutting Issues • gender
• territorial development
• population issues
• peace and security issues.
Institutional Monitoring-Evaluation Mechanism 25. Analyses have shown low operationalization of the institutional monitoring-evaluation
mechanism, low capacity of the PRSP Unit, and low institutional capacity in terms of methods, tools, instruments and indicators used. Consequently, the information system remains incapable of accurately measuring the performance indicators. The reliability and consistency of information and statistics obtained from various sources remain a serious problem. Mention should also be made of the poor quality of basic statistics. Strengthening the national statistics system is included in PRSP II activities.
26. It is necessary to clarify and simplify the institutional mechanism. The PRSP institutional mechanisms will comprise: (i) a Policy Committee, (ii) a Mali – Development Partners Joint Commission, (iii) a National Steering Committee, and (iv) a PRSP Technical Unit, which will be strengthened. The PRSP process will be conducted and coordinated by the Ministry responsible for the Economy.
27. As regards methods, the PRSP evaluation calls for harmonization with the three-year programme, the Special Investment Budget, and programme budgets. It also calls for a review of the number and nature of the proposed indicators by component or thematic area for better legibility and greater relevance.
Next Stages of PRSP II • finalization and ensuring of consistency of MDG action plan with PRSP II;
• preparation of a financing plan for PRSP II;
• incorporation of the results of ongoing surveys in poverty analyses;
• finalization of the institutional mechanism and the list of monitoring-evaluation indicators;
• preparation of PRSP II communication plan; and
• preparation of PRSP II logical framework.
Bamako, 20 December 2006