POVERTY AND SOCIAL SAFETY NETS - Pakistan Institute … · Poverty and Social Safety Nets: ... and...
53
MIMAP TECHNICAL PAPER SERIES NO. 15 Poverty and Social Safety Nets: A Case Study of Pakistan MOHAMMAD IRFAN Former Joint Director Pakistan Institute of Development Economics July 2003 PAKISTAN INSTITUTE OF DEVELOPMENT ECONOMICS ISLAMABAD, PAKISTAN
Transcript of POVERTY AND SOCIAL SAFETY NETS - Pakistan Institute … · Poverty and Social Safety Nets: ... and...

MIMAP TECHNICAL PAPER SERIES NO. 15
Poverty and Social Safety Nets: A Case Study of Pakistan
MOHAMMAD IRFAN Former Joint Director
Pakistan Institute of Development Economics
July 2003
PAKISTAN INSTITUTE OF DEVELOPMENT ECONOMICS ISLAMABAD, PAKISTAN
MIMAP Technical Paper Series No. 15 This study is a component of the Micro Impact of Macroeconomic Adjustment Policies (MIMAP), Pakistan Phase-II. This project is being implemented by the Pakistan Institute of Development Economics, Islamabad. The main aim of this project is to analyse the impact of structural adjustment policies on income distribution and poverty in Pakistan. This work has been carried out with financial assistance from the International Development Research Centre, Ottawa, Canada. ISBN 969-461-116-4 Pakistan Institute of Development Economics
Quaid-i-Azam University Campus, P.O. Box No. 1091 Islamabad 44000, Pakistan. Tel: 92-51-9206610-27 Fax: 91-51-9210886 E-mail: [email protected] [email protected] Web: http://www.pide.org.pk
(ii)

(iii)
The Pakistan Institute of Development Economics, established by the Government of Pakistan in 1957, is an autonomous research organisation devoted to carrying out theoretical and empirical research on development economics in general and on Pakistan-related economic issues in particular. Besides providing a firm foundation on which economic policy-making can be based, its research also provides a window through which the outside world can see the direction in which economic research in Pakistan is moving. The Institute also provides in-service training in economic analysis, research methods, and project evaluation.
(iv)

CONTENTS
Page Introduction 1
I. Poverty Levels and Trends in Pakistan (1960-2003) 1 II. Responses to Poverty—A Brief History 5 Poverty Alleviation—Pakistan’s Approach 7 Social Safety Nets in Pakistan 8 (i) Social Security Schemes for Workers (Formal Sector) 9 (ii) Schemes to Finance Small Business and Micro Credit 9 (iii) The Transfers 9 (iv) Public Works Programme for Employment Generation 10 (v) Education and Health Services 10
A. Formal Sector Schemes 10 Pension and Retirement Benefits (Old Age Support) 10 (i) Pensions for Government Employees 10 (ii) Other Private Sector Pension Plans 11 (iii) Employees’ Old Age Benefit Institution (EOBI) 11 (iv) Employees’ Social Security (ESS) 13 (v) Workers’ Profit Participation Scheme 14 (vi) The Workers Welfare Fund (WWF) 15 (vii) Excise Duty on Minerals (Labour Welfare) Scheme, 1967 16 (viii) The Workers’ Children Education Ordinance, 1972 17 (ix) Compulsory Group Insurance Scheme, 1968 17
B. Micro Credit 18 (i) Khushali Bank 18 (ii) Pakistan Poverty Alleviation Fund 18
C. Transfers to the Poor 19 (i) Zakat 19 (ii) Pakistan Baitul Mal 21 (iii) Private Transfers—Philanthropy 22
2
D. Public Works Programme for Employment Generation 24 (i) Khushal Pakistan Programme (KPP) 25
E. Social Services 25 Social Action Programme 26 (i) Education 26 (ii) Health and Population Welfare 29 (iii) Population Welfare 31 (iv) Rural Water Supply and Sanitation 33
III. Social Safety Nets—An Assessment 33 A. Old Age Pensions, Social Security, and Welfare Programmes in the Formal Sector 34 (i) The Design Problem 34 (ii) Management and Governance Issues 35 (iii) Coverage and Adequacy 36 (iv) Cost Effectiveness 36 (v) Sustainability 36 B. Transfers 37 C. Public Works 38 D. Micro Credit 38
E. Social Action Programme (SAP) 39 (i) Coverage 39 (ii) Misgovernance and Politicisation of the Programme 39 (iii) Failure to Have a Sound Monitoring System 40 (iv) Inefficiency in Resource Use 41
F. SSN—Adequacy and Limitation 41 (i) Income Equivalence of Transfers 41 (ii) Poverty-related Expenditure 41 IV. Concluding Remarks 42 Appendices 44
References 45
(2)
3
List of Tables
Table 1. Poverty Estimates: Different Sources 2 Table 2. Selected EOBI Data 12 Table 3. Coverage of Social Security Institutions and Facilities— 1999-2000 13 Table 4. Per Capita Administrative and Total Expenditure on Secured Persons 14 Table 5. Actual Collection and Releases of WWF 15 Table 6. WWF Expenditure 16 Table 7. Receipts of Excise Duty on Minerals by Provinces 17 Table 8. Beneficiaries 1998-99, Punjab 17 Table 9. Recipient Household + Zakat Received 1998-99 21 Table 10. Estimates of Total Giving by Individuals in 1998 23 Table 11. Public Works/Rural Development Programmes 24 Table 12. Net Primary Enrolment (Excluding Katchi), by Income Group 27 Table 13. Net Enrolment Rate at the Primary Level, by Province
(Including Katchi Class) 28 Table 14. Percentage of Children Aged 12-23 Months who Have been
Fully Immunised, by Income Group 30 Table 15. Access to Health Facilities and Selected Health Indicators
(1998-99) 31 Table 16. Percentage of Currently Married Women who are Currently
Using Specific Contraceptive Methods, by Various Sources 32 Table 17. Contribution of Proximate Determinants in Reduction of Births
Per Woman in Pakistan: 1975-1996 32 Table 18. Percentage of Cases where Criteria were not Observed 40 Table 19. Social Protection in SAARC Countries 42
List of Appendix Tables
Appendix Table 1. Zakat Receipts 44 Appendix Table 2. Net Primary Enrolment Rates in Pakistan and Provinces 45
(3)
INTRODUCTION Over two fifths of our population appears to be poor in the sense that their basic
needs are not met by the resources at their disposal. This level of pauperism is roughly similar if not higher to what was our experience to begin with, at the time of independence in 1947. During some periods of the Pakistan’s history of over five decades, poverty was brought under some control however. But numbers of poor today are more than the total population in 1947. Emergence of poverty and deprivation in a society or community in general has evoked a response in terms of provisions and transfers as well as modification in growth pursuits to improve the situation. These measures may take variety of forms in terms of institutional structures and organisations. Social Safety Nets (SSN) for instance currently are opted throughout the developing world including Pakistan to address the issues of poverty and deprivation.
This study aims at examination of varying levels of poverty overtime and description and evaluation of existing social safety nets. In the first section of this study a brief discussion of inter-temporal poverty profile is made. The nature of SSN currently in vogue will be assessed in the second section of the report, wherein, their coverage, the contents and other qualitative dimensions will be described in detail. In addition, there will be a discussion of private philanthropy and transfers as well as their impact on the well-being of poor. In the concluding section SSN will be assessed with a major focus on highlighting the inadequacies of the existing approaches to alleviate poverty.
I. POVERTY LEVELS AND TRENDS IN PAKISTAN (1960–2003)
Multidimensionality of poverty defies a neat demarcation. Often several but not separable meanings can be attributed to poverty which essentially should encompass totality of deprivation experienced by an individual or group of individuals. Encyclopedia of social sciences for instance suggests that definition of poverty is convention specific and distinguishes between Social Poverty and Pauperism. The former includes economic inequality or property incomes etc. in addition to social inequality such as dependence or exploitation while Pauperism denotes one’s inability to maintain at the level conventionally regarded as minimal.
Pauperism has been the focus of researchers wherein efforts have been made to quantify the poverty, thus defined, using essentially arbitrary poverty lines or norms with application of varying procedures for estimation. Planning Commission of Pakistan recently suggested an official poverty line in terms of minimum caloric requirement per adult (2350 per day) and the needed expenditure of Rs 670 per person for 1998-99. This, however, is different than what has been used by other researchers. Arif (2002) for instance viewed that, despite a need to demonstrate the relevance of 2350 calorie intake used by official poverty line it can facilitate monitoring the poverty levels in the country in future.

2
During the past however poverty in Pakistan has been estimated using essentially two distinct procedures each having merit as well as demerits though both entail arbitrariness and variety of assumptions. In the first case the poverty estimates are based on poverty lines defined in terms of expenditure needed to attain a given level of calories per adult or per capita. Required expenditure has been estimated on the basis of regression of food and non-durable expenditure (sometimes total household expenditure) on calorie intake by households estimated on the basis of the quantities of different items consumed reported in the Household Income and Expenditure Survey (HIES), the only source used to estimate poverty. In some studies the expenditure required is estimated using the expenditure pattern of bottom three income groups. Non caloric needs such as housing, education, and health etc., arbitrary of course, are added using the ratio of food to non-food expenditure of poor or those just crossing the food poverty line. Obviously the poverty lines constructed using this procedure vary with the caloric intake needed, their conversion into expenditure and estimated non-food expenditure. In contrast to this so-called revealed preference in the second case a normative approach following Ahmed (1993) wherein money value of bundle of commodities regarded as minimum acceptable level of living is used as a surrogate of poverty line. These include food, clothing, housing, health, education, transport, social interaction, and recreation facilities.
Varying definitions and procedure used to estimate the poverty incidence have made it difficult to assess the situation at a point of time and exceedingly difficult to discern an inter-temporal trend. This is manifest from Table 1 where poverty estimates for 1984-99 period from three different sources are presented. Obviously the poverty levels for different years vary across these estimates but the time profile suggested by World Bank estimate using normative approach clearly takes exception to the other two estimates based on revealed preference. It hardly needs to be emphasised that the trend yielded by former estimate is inconsistent with other variable of relevance such as GDP growth rate, unemployment rate, and real wage trends.
Table 1
Poverty Estimates: Different Sources Source 1984-85 1987-88 1990-91 1992-93 1993-94 1996-97 1998-99
Urban 38.2 30.7 28.0 20.8 17.2 18.9 24.2 Rural 49.3 40.2 36.9 27.7 33.4 27.3 35.9
World Bank
Overall 46.0 37.4 34.0 25.7 28.6 24.0 32.6 Urban – 15.0 18.6 19.8 15.2 – 20.9 Rural – 18.3 23.6 27.0 32.9 – 34.7
Planning Commission
Overall – 17.3 22.1 24.9 27.7 – 30.8 Urban – 15.0 18.6 15.5 – 27.0 26.0 Rural – 18.3 23.6 23.3 – 32.0 34.8
Independent Researcher
Overall – 17.3 22.1 22.4 – 31.0 32.6 Source: World Bank: Poverty in Pakistan: Vulnerabilities, Social Gaps and Rural Dynamics, May 2002.
Planning Commission: Pakistan Human Condition Report 2002. CRPRID. Independent Researcher: Amjad and Kemal (1997). Qureshi and Arif (2001).
(2)
3
Notwithstanding the above mentioned limitations poverty trends in Pakistan have been examined and analysed by various researchers. There is almost a consensus that in an historical perspective Pakistan was successful in reducing poverty over the decades since independence. Absolute poverty, Head Count Ratio based on caloric intake, declined from 46.5 percent in 1969-70 to 17 percent in 1987-88. Since then however the reversal has taken place. Most recent research exercises are suggestive of a substantial rise in poverty incidence to 33 percent in 1998-99 and the worsening situation continued since then [Talat and Qureshi (2003)]. Incidence of poverty using basic needs approach also recount the same story, a rise from 29 percent in 1986-87 to 38 percent in 1998-99. This deterioration during 1990s has been experienced both by rural as well as urban areas.
Admittedly, overall economic growth has a direct bearing on poverty level in a country. However, Pakistan’s experience reflects a dissonance between these two. For example, high growth period of 1960s is associated with a decline in poverty only in urban areas. In rural areas, the poverty situation worsened. During the next decade, GDP growth rate was lower than the previous one but level of poverty declined. During 1980s, one finds a straightforward and expected relationship between growth rate and poverty wherein the poverty improved while the economy registered a remarkable growth rate.
A perusal of research studies conducted over the years reflects that in addition to growth there are some important determinants of poverty situation. For instance, high growth rate of 1960s failed to reflect any improvement in the poverty situation in rural areas because of the eviction of tenants and rise in landlessness [Irfan and Amjad (1984)]. In the wake of subdued economic performance of the early 1970s, a decline in the poverty level was made possible through escalation in the public sector employment and a massive rise in public sector expenditure [Zaidi (1999)]. Similarly, Middle East emigration and return flow of remittances had a very favourable impact on poverty situation in the country beginning late 1970s to middle of 1980s. A time period analysis of poverty level conducted by Amjad and Kemal (1997) highlights importance of remittances for the household poverty level. In other words, Pakistan’s experience suggests a very close link between employment generation, remittances and tight labour market and poverty.
The decade of 1990s unfurled a host of challenges and problems for the economy and society of Pakistan. These problems, such as budget deficit and disequilibrium in balance of payment were in the making for long time. The mismatch between revenue and expenditure worsened the situation, through accumulation of large stock of debt with insurmountable debt servicing liabilities overtime. Since 1977 for instance Public Debt in real terms grew at a rate much higher than real GDP growth. The built in rigidities and weaknesses of the system were exposed when efforts to address these issues were initiated under various IMF/World Bank Stabilisation and Structural Adjustment Programmes since late 1980s.
The slippage of the economy into debt trap in fact put a halt to the past practices wherein the entire development expenditure and occasionally the current expenditure used to be financed by internal and external borrowing. To the extent the improvement in poverty situation during 1970s and 1980s occurred because of the policies and measures resulting in huge budget deficits and mounting indebtedness, these represent inter-generational poverty
(3)

4
shift, wherein future generations have to pay back what was borrowed for sustaining as well as inflating the consumption level of current generation. That borrowings from abroad were inconsequential for Pakistan’s GDP growth is a major conclusion of study by Kemal (2001). Most of the endeavours like escalation in the public sector employment provided temporary relief in case of poverty alleviation which re-emerged with added complications in 1990s.
In order to rectify the internal and external imbalances through curtailing expenditure, raising revenues and better export performance under IMF/World Bank reform packages, the economy was subjected to a discipline. Pakistan agreed to implement various structural adjustment and stabilisation programmes. It is in this context that various agreements beginning with 1987-88 were signed by the Government of Pakistan for implementation. With the exception of the latest SAP, there were implementation lapses though, Pakistan has been successful in attaining macroeconomic stability by implementing SAP and 9/11 events and at the same time, experienced a massive upsurge in the foreign exchange reserves, currently being blown out of proportion as a distinct success of those at the helm of affairs. But the real side of the economy reflected a very sorry state of affairs, decline in the GDP growth rate, falling or stagnating level of investment, worsening unemployment situation and deteriorating poverty conditions during the 90s. Kemal (2003) identified the factors underlying the deterioration of the poverty conditions in the country in the context of Structural Adjustment Programmes and highlighted a number of factors explaining both subdued economic performance as well as worsening poverty situation in the country. For instance, decline in the GDP growth rate has been attributed to low level of investment and lack of effective demand occasioned by the squeeze entailed by massive reduction in the public sector expenditure to address the problem of budget deficit. Furthermore the failure of the state to bring the rich into tax net rendered the taxation structure regressive wherein the poor were subjected to a disproportionate burden. Similarly, the withdrawal of input subsidies in agriculture sector along with provision of international prices to producers benefited only those who had marketed surplus in the agriculture sector which explains the failure of respectable growth in agriculture during 1990s to have a positive influence on the poverty in rural areas. The conjunctive influence of tariff rationalisation, financial sector reform and privatisation led to closure of factories and downsizing which in turn resulted into substantial job losses. It may be added that poverty-related expenditure of the government drastically reduced as a percentage of GDP during this decade, thereby crucifying the poor at the altar of macro stabilisation. The labour market outcome as indexed by rising unemployment rate and stagnant or declining real wages further compounded the situation.
Whilst the above mode of analysis provides explanation for rise in poverty during 1990s, there is also a need to disentangle the effect of structural adjustment from the inherent limitation of the overall dispensation of the country. A case in point is that of failure of investment to rise, the basic factor which explains low growth. Of course this can be attributed to the inconsistency of the policies along with law and order situation but these can not be regarded as the off-shoot of the structural adjustment programme.
(4)

5
Similarly, massive reduction in public sector expenditure is more a failure of the state to generate resources because of the particular compositional specifics of the society than an effect of the transition of the economy under the structural adjustment. Obviously, there is a need to mount more investigative pursuits with a view to understand the given constellation of the power brokers in the country and their impact on the poor, through the choices they make.
Few if any research endeavour has been made to understand the power play and assess the sustainability of the interventions through critical scrutiny of their financing mechanism both in case of the macro or household level. Most of the poverty estimates at the level of household exclusively focus on consumption expenditure with little investigation of the financing mechanism. This glossing over of survival strategy of the poor leads to equate those who have been out of poverty clutches at a point of time because of distress sale of their assets or through reckless borrowing resulting into high level of indebtedness, with those who have regular and permanent sources of income. This argument is equally valid for country level study too, because in general the sustainability of pro poor interventions has not been reckoned by researchers.
II. RESPONSES TO POVERTY—A BRIEF HISTORY
Social concern for the poor appears to be as old as mankind itself. Sharing the hunger and poverty was observed to be a major characteristic of the traditional societies like Eskimos, and in sub-Saharan Africa [Herskovites (1940)]. In other parts of the world, this concern was reflected through variety of provisions and transfers wherein the rich segments of the society tried to share resources with the poor. The motives behind helping the poor by rich are not very clear and factors underlying this human behaviour defy simple interpretation. The transactions between rich and poor may be based on some exchange relationships entailing reciprocity to sustain a given structure or control mechanism. These transfers could also be due to much highlighted religion and cultural values.
For instance, Amos much before Christ emphasised upon the rich to help the poor. It is well known that the Church in Europe established hospitals and poorhouses. Islam made it obligatory for the rich to pay Zakat and Ushr besides Sadaqat, (Charities), to help the poor. In fact a fixed proportion of wealth and agriculture produce has to be given to poor under Zakat and Ushr. This in fact represented the foremost effort in human history wherein Zakat/Ushr collection, establishment of Baitual Mal and elaborate procedures for distribution among poor was made by state. With the demise of Caliphate system and emergence of kingdoms in Muslim world the obligatory payment of Zakat to poor was left to the individuals themselves and state ceased to collect and distribute these levies.
In the embryonic phase, therefore, the social concern reflected itself at the non-state and at the level of communities and families with the exception of brief Caliphate period under Islam mentioned above. With the emergence of national state in Europe and elsewhere, a new social contract between individuals and the state evolved overtime. This was brought about by the changing nature of the economy, the ensuing settlement pattern
(5)
6
of population and related internal as well as external dynamics. Social protection as a matter of right was thus introduced in many countries in the West wherein the national state assumed major responsibility in this context.
It appears instructive to highlight the factors which shifted the responsibility to alleviate poverty from family and communities to the national states. In England consequent upon dispossession of monasteries and break up of manors the state was forced to assume this responsibility. Famous “old poor law” of 1601 tended to accept in principle the responsibility of state to help the needy. A specific tax for poor relief was levied wherein different categories of need were also identified. However, till the onset of industrial revolution which brought variety of changes, major burden of the poverty alleviation was still borne by family and communities.
Industrialisation and associated rural to urban migration weakened the structure composed of primary groups. Endurance of traditions wilted, thus the family was much less available for helping the aged. A new class of “able bodied poor” the ones largely excluded and incapacitated to participate in the productive process for supplementing their incomes, was generated by industrialisation. The enforced idleness in the context of labour supply outstripping the demand was rationalised by many though for a while. The poor were characterised to be improvident wherein syllogism of economists was reinforced by theologians. This temporary retreat of state in England is visible in the “New Poor Law” of 1834 which sought to reduce the expenditure on the poor. English and American policy in fact adhered to this philosophy until the twentieth century.
The effects of industrialisation on poor and unemployed were however addressed at state level in Germany primarily to combat the appeal of Marxian Socialism. Bismark instituted a system of national insurance in 1880. The Iron chancellor appropriated the ideas of economists like Adolf Wagner and Gustav Von Schmoller and applied the social insurance to whole of Germany. Well organised workers demanded for substantive reforms in England too. Historic surveys of Charles Booth and B.S. Rowntree’s study documented the massive prevalence of poverty in “the Workshop of the World”. The Royal Commission on Poor Laws and Relief of Distress set up under Beatrice Webb proposed the abolition of archaic poor laws to be substituted by a comprehensive programme of social insurance [Webb and Webb (1909)]. National Insurance Act of 1911 was the first such legislative measure. The widely publicised Beverage report of 1942 and National Insurance Act of 1946 were milestones on the way to provide insurance for all people in the UK from the “cradle to the grave”.
The welfare state which essentially assumes legal and formal responsibility for basic well-being of its members was brought in existence by variety of co-terminus forces and factors such as industrial revolution, urbanisation, protests of worker’s organisation, and challenges of socialism. Currently it appears to be under stress in the West, because of ascendancy of market oriented development paradigm under globalisation since early 1980s and the demographic imbalances resulting in a high level of dependency of aging population. Furthermore the relegation of socialism to secondary importance as a contender or assumption of the role as successor further encourages the
(6)
7
proponents of unfettered capitalistic growth. These tendencies press for a modification if not total retreat from the welfare state. The extent to which democracies in the West can embrace the ideas such as “poverty is inescapable” and “poor are improvident” however remains a matter of speculation.
Poverty Alleviation—Pakistan’s Approach Sufferings and miseries of those living in the colonies as subjects of the architects
of welfare state in Europe were not addressed in similar fashion. Thus, in the Indian sub-continent during occupancy of over hundred years hardly any measure resembling to Europe can be traced. Some sectoral legislation was resorted to for protection of employees in formal private and public sector. Similarly, health measures were mostly introduced to control epidemics. The limited educational services produced little just to man the offices of the Lords.
Founding father of Pakistani nation always emphasised the importance of justice as a cardinal principle in Pakistan. “There are millions of our people who hardly get one meal a day. Is this civilisation? Do you visualise that millions have been exploited and can not get one meal a day. If this is the idea of Pakistan I would not have it” Quaid-i-Azam in annual session of Muslim League in 1943 meeting clearly affirmed his pro-poor agenda [Tahir (1999)]. Needless to mention that successive regimes since independence could not live up to the expectations of the founding father. A renewed commitment was made in 1973 wherein social security as an explicit right of an individual was laid down in the Constitution under article 38 which reads as under:
provide for all persons employed in the service of Pakistan or otherwise, social security by compulsory social insurance or other means; provide basic necessities of life such as food, clothing, housing, education and medical relief, for all such citizens, irrespective of sex, creed, caste, or race, as are permanently or temporarily unable to earn their livelihood on account of infirmity, sickness or unemployment; reduce disparity in the income and earnings of individuals. Article 38 (d) and (e).Constitution of Pakistan.
A closer scrutiny of the development policies pursued during the past five and a half decade since independence, hardly inspires confidence that an explicit pro-poor agenda was ever implemented despite such objectives being reflected in various policy documents and Five Year Plans. This tension between words and deeds could be attributed to various factors. Underdevelopment and lack of financial resources to opt for a generalised social security system, a characteristic of welfare state, could be the major one. Often pervasive family based enterprise system and self-employment have been identified as a surrogate of social protection as well as a hindrance in introducing one by the state. A general perception that families, tribes and communities take care of the poor members was also used to justify limited initiatives by state. At the same time one fails to find a sustained mass movement of poor or labourers demanding exclusive pro-poor development strategy. This was presumably because of accommodative value system of the people, an interactive outcome of culture, religion and centuries old domination by
(7)

8
foreign powers, and tight grip of those at the helm of affairs. Finally it is also believed that the coalition of policy and decision-makers in Pakistan prefers to retain paternalism and dependency which explains their reluctance to introduce any measures which was right based such as, the social security.
Various regimes have however devised programmes to alleviate poverty as a byproduct of rural development or employment creation. These were for instance rural development programmes such as—Village Aid in 1950, Rural Works Programme, People Works Programmes and other similar ventures. Construction of dams and irrigation networks, and provision of social services—education and health, etc. were also relied upon for addressing the poverty in Pakistan. Asset distribution through the land reforms was implemented twice but these reforms were not designed to introduce a radical departure from the erstwhile skewed distribution. In addition to officialisation of Zakat, food rationing and provision of subsidies to consumers and small producers were also introduced occasionally. Mostly, these measures were believed to be reflective of the visibility concern of various regimes with limited and short lived impact wherein poverty alleviation still remains a challenge as discussed in the previous section. A detailed discussion of various measures currently being undertaken to address problems of widespread poverty is presented in the following sub-section. Social Safety Nets in Pakistan
A continuation of the efforts made in the past ostensibly to alleviate poverty in Pakistan is represented by the currently widely publicised social safety nets. These also reflect an international perspective too wherein states are assumed to be responsible in the developing world to address the casualties of economic growth under globalisation, the IMF and the World Bank Stabilisation and Structural Adjustment programmes. While the social safety nets in this sense are compensatory in nature, the policy-makers, planners, and the international organisations often use terminologies which lend a pretense of universal social protection or social security. In fact the approaches are widely different in coverage as well as dispensation. The universality and right-based nature of social security is totally missing under SSN. The origin of recently coined SSN can be traced to a deterioration of economic conditions in the developing world in the context of structural adjustment and globalisation [Cornia and Stewart (1988)]. Associated with the ascendancy of market oriented development paradigm, the state apparatus tended to weaken, hence growing disenchantment with its capacity to provide social services gave birth to certain new forms of SSN as well as provided space for new agents of development (NGOs) too. To some extent these imported (or imposed) models of social policy may be divorced from the political and social realities of the developing world.
It is imperative to highlight the distinction between Social Security and Social Safety Nets, currently in vogue. The latter in essence often construed to act as a substitute of social security is in fact far from it. And is no more than euphemism for the social protection envisioned under universal social security system. The following basic elements characterise social security [Ginneken (1999)].
(8)

9
(a) People derive their rights from social security; (b) Social security is provided through public or collective arrangements; (c) Social security aims at protection, hence, promotion of employment and social
services is not its major role; and (d) Social security is not concerned exclusively with cash benefits but also with
basic needs (medical care, education, housing and nutrition).
Although the notions of Social Safety Nets keep on varying, however, the broadest use refers to all institutions and practices envisaged to prevent individual from remaining or falling below a specified minimum standard of living. SSN aim at:
(a) enabling the poor to better manage the risk; (b) preventing poor from distress sale of their assets; (c) a system of income insurance to help people through short term stress and
calamities; and (d) taking care of the long term disability.
Obviously SSN in contrast to Social Security entail instrumentalism to achieve certain ends and unlike Social Security are not necessarily right based. SSN can be formal, the one legally guaranteed (though not right based) and informal. The latter do not carry any legal guarantee but can be provided both by public and private sector. The current SSN in Pakistan like most of the developing countries are heavily skewed towards workers in the formal sector in urban areas. The bias can prevent a fair distribution of services and benefits to poor. Given that Pakistan does not have an umbrella institution, a characteristic of generalised social security system, to cater to the needs of poor, the institutions providing SSN are: Government, Non-Government Organisations, Mosques, Financial Institutions, and Private Transfers. The SSN can be classified into five categories.
(i) Social Security Schemes for Workers (Formal Sector)
(1) Pension for Government Servants. (2) Employees old age benefits schemes such as pension in the Formal Private
Sector. (3) Provincial social security benefits also include medical coverage, cash benefits
and pensions, and other labour welfare measures for Formal Sector Worker. (ii) Schemes to Finance Small Business and Micro Credit
(1) Pakistan Poverty Alleviation Fund (PPAF). (2) Khushali Bank. (iii) The Transfers (1) Zakat system to provide short term and long term relief to the poor. (2) Provision of subsidised food and shelter to the vulnerable population. (3) Private Transfers.
(9)
10
(iv) Public Works Programme for Employment Generation (v) Education and Health Services
In the above classificatory scheme measures falling under (i) designed for public
and formal sector employees are backed by legal guarantee. Measures under (ii) essentially envisage to address the issues of the credit market imperfection wherein poor can not participate because of the inability to offer collateral. The extension of access to credit facilities to poor will result in social assistance only if the credit is provided at a subsidised rate of interest. However (ii) along with (iv) can also be regarded as facilitation and generation of employment which reflect an attempt to rectify the growth strategy for its failure to generate full employment. Provision of education and health services represent a constitutional obligation of the state and in principle can be regarded as poverty alleviation measures to the extent that these cover the poor and the latter in return also enjoy benefits from these.
In the above package only old-age support under Pensions for public and formal sector employees provides income security and social protection. The remaining such as transfers can be characterised as social assistance with no legal guarantee. The SSN in Pakistan are generally not designed to provide income security or social protection to all the poor and destitute, though there are some elements of social assistance. All the above cited elements of SSN package are discussed below in detail. A. Formal Sector Schemes Pension and Retirement Benefits (Old Age Support)
Retirement benefits currently comprise of (i) Civil Servants Pension, General Provident Fund, and Benevolent Fund for Government Employees (ii) the Employees Old Age Benefit Institutions (EOBI) which offers subsistence pension benefits to private sector workers and (iii) Pension and Gratuity Schemes of Private Companies. These are discussed below.
(i) Pensions for Government Employees Permanently employed government servants of the federal or the provincial
governments receive pension and other benefits under the laws of their respective governments, covered under the Government Servants Pension Funds Scheme. The government servants are entitled to receive pension and other benefits such as provident fund, on retirement, at the age of 60 or earlier after 25 years of pensionable service. Government servants who have worked for less than 25 years are not entitled to receive pension. Also the contract employees of the government are not entitled to any social benefits. It is noteworthy that much of the new recruitment during the recent period in government is on contract though with better salary package than regular government employees. It may be added that government pension scheme is unfunded and pensions constituted 30 percent of total salary in 1996 budget. Pensions are fixed according to the length of the service and because of non-indexation of the pensions the inflation erodes their real content overtime.
(10)
11
(ii) Other Private Sector Pension Plans Private sector pension plans are rare but there do exist a couple of hundred
occupational plans, mostly promoted by multinationals. These are defined benefit plans funded by employers on the basis of actuarial recommendations. Contributions to these plans are tax deductible, subject to a maximum of 20 percent of salary earned by members. These plans promise benefits in the form of life annuities for the retiree and reduced contingent pensions for the spouse and minor children. The pensions accrue at the rate of 1 percent to 3 percent of basic pay for each completed year of covered service. Vesting is quite late, after 15 years of service and 50 years of age. Investment income of pension funds is exempt from income tax but not from zakat. Pensions and the commutations there upon are also exempt from tax and zakat. Besides being rare, these pensions are not portable, and annuity benefits of these pensions have been substituted by commutations which are quite common.
(iii) Employees’ Old Age Benefit Institution (EOBI) Most of the old age security and other welfare measures are managed and
administered by Ministry of Labour under various schemes. Notwithstanding the fact that provision of labour welfare has been identified, to be a wise investment (Royal Commission on Labour 1931), precise definition of labour welfare remained elusive. For instance, Labour Investigation Committee 1946 viewed labour welfare to be “over and above what is laid down by law and what is normally expected as the part of the contractual benefits for which workers may have bargained”. Efforts spent at defining the labour welfare broadly suggest that the concept is flexible being specific to temporal, developmental and ideological contexts.
Origin of the labour welfare work in the West can be traced to the nature of industrial system wherein conditions of work were regarded to be non-congenial for the health of the worker. Also it was felt that industrial atmosphere was strange to ruralite workers. These two factors often termed as “the long arm of the job and the “social invasion of factory” underscored the need for labour welfare measures. However, this focus on factory employment led to the exclusion of workers engaged in agriculture, informal sector and self-employed in general. Nearly all the worker welfare measure in Pakistan, administered by Ministry of Labour exclusively focus upon formal sector employees as discussed below.
EOBI established under Employees Old-age Benefit Act, 1976 administers the only national pension scheme for employees in private sector industries/establishments with at least ten employees, excluding those in managerial and professional categories and directors. EOBI, a corporate body gets policy guidance from a Tripartite Board of Trustees, with Secretary Labour as its Chairman, four representatives from the Federal Government, four provincial Labour Secretaries, four provincial representatives of employers, and four provincial representatives of workers, and the Director General EOBI. EOBI currently operates a head office, 9 zonal offices, 36 regional offices and 31 field offices. These offices are engaged in the identification and registration of establishments and persons, collecting contributions, managing the Employees Old-age
(11)

12
Benefit Fund, and administering of benefits and settling related disputes and complaints. EOBI is authorised to invest the Funds which are not needed immediately and the resultant income of the Fund is exempt from income tax and zakat.
According to the existing rules, employers pay mandatory contributions of 5 percent of the first Rs 3,000 of employee’s wages per month. The government had been contributing an equivalent matching grant until July 1995, but it withdrew thereafter. Old age pensions accrue at the rate of 2 percent of the final year wage (maximum of Rs 3,000 p.m.), subject to a minimum of Rs 630 p.m. (recently increased to Rs 700 p.m). Survivor’s pension (for spouses on death after retirement and on death in service after 36 months of coverage), invalidity pension, and old-age grants are also provided. These benefits are portable only between covered establishments. Normally workers become eligible to draw pension after reaching the age of 60 years (55 years for females) provided they complete 15 years as covered service.
At the end of year 2000, the EOBI had 43,560 employers, 1,572,014 insured persons and 181,547 pensioners on its register. EOBI, coverage is simply inadequate wherein only a minor fraction of total wage employees (estimated to be over 10 million) is covered. The number of beneficiaries is only a small proportion of the covered workers (10.4 percent), although this number is growing at a much faster rate (19.3 percent p.a) than the growth rate of the number of person entering the scheme (7.3 percent p.a) (see Table 2). This slow growth is due to employer’s evasion of paying contribution as well as low employment growth in formal sector. However, this generates a sustainability problem for EOBI because benefit outgo is higher than the increments in contribution. According to some estimates the Fund will start decreasing in next 20 years and get depleted in just a few more years under unchanging conditions. This un-sustainability has been pointed out by many actuarial assessments.
Table 2
Selected EOBI Data
Registration End 2000
End 1999
End 1998
End 1997 Growth
Employers (No.) 43560 42632 – – 2.2% Insured Persons (No.) 1572014 1465087 – – 7.3% Beneficiaries (No.) 181547 164203 – – 10.6% Pensions Disbursed (Billion Rs) 6.6 5.53 – – 19.3% Beneficiaries as % of Total Coverage 10.4% 10.1% – – – Contributions (Million) 1534 1421 1337 1276 6.3% Administrative Expenditure (Million Rs)
318 228.16 211.53 187.36 19.3%
Admn. Exp./Total Income (%) 4.9 3.5 3.8 3.9 – Admn. Exp./Ann Contributions (%) 20.7 16.1 15.8 14.7 –
Source: Ministry of Labour.
(12)

13
Sharp growth in EOBI’s administrative expenditures is quite noticeable. These expenditures (4.9 percent of total receipts and 20.7 percent of contributions in 2000) are much higher than similar institutions in other countries, and are growing rapidly (19.3 percent) p.m. in 1997–2000. These high establishment costs would exert a downward pressure on the benefit level. The system is managed poorly and reportedly suffers from several governance and administrative problems. Procedures for monitoring of payments, filing of returns and assessment, and resolution of disputes are cumbersome. There are numerous complaints from employers and employees against harassment at the hands of the EOBI staff. Records are alleged to be poorly maintained and there is a lot of evasion and manipulation. Recent scam of Rs 1 billion is still shrouded in the mystery.
Finally pensions are not indexed and erode quickly due to inflation. The government has at times attempted to partially relieve this hardship by raising the minimum pension. But this relief has not been enough and even the minimum pensions have lost one-thirds of their value in last 15 years. The erosion produces unpredictable effect on pensions, creates inequities between different age cohorts, and diminishes the effectiveness of the plan.
(iv) Employees’ Social Security (ESS) Under the Provincial Employees Social Security Ordinance 1965, the ESS operates
with applicability to commercial, industrial and other establishments employing 10 or more workers. The social security institutions collect contributions from employers @7 percent of the wages of those employees whose wages are upto Rs 5000 per month. A worker is defined as secured under the Ordinance if the employer contributes to the social security institutions. Secured persons are entitled to benefits as laid down in sections 35-44 of the said Ordinance. These include comprehensive medical care and hospitalisation for employees and their dependents too. In addition secured persons are also entitled to employment injury benefits, maternity benefits, death grants and partial disablement pensions as well as survivor’s pensions.
The social security schemes are administered by Provincial Social Security institutions in different provinces through tripartite governing bodies comprising representatives of employees, workers and government. The coverage of these institutions is provided below in the Table 3.
Table 3
Coverage of Social Security Institutions and Facilities—1999-2000
Industrial/Commercial
Units Registered Workers Dispensaries Hospitals
Sindh 12700 198000 37 4 Punjab 26299 524000 127 8 NWFP 2301 234015 17 2 Balochistan 194 7234 4 N.A
Source: Ministry of Labour.
(13)

14
Needless to mention that registered workers account for insignificant fraction of wage employees in urban areas. Actual dispensation of the medical facilities and health services to the secured workers can not be assessed because of the limited information. However, data pertaining to the expenditure per secured person appears to be a paltry sum while on the other hand the administrative expenditures appear disproportionate and on the higher side. The relevant data are reproduced in the Table 4 below for different provinces.
Table 4
Per Capita Administrative and Total Expenditure on Secured Persons (Rupees)
Punjab Sindh NWFP Balochistan Per
Capita Admn. Exp.
Per Capita
Exp. on Secured Person
Per Capita Admn. Exp.
Per Capita
Exp. on Secured Person
Per Capita Admn. Exp.
Per Capita
Exp. on Secured Person
Per Capita Admn. Exp.
Per Capita
Exp. on Secured Person
1996-97 52231 917 73803 1246 51096 1203 55453 1740 1997-98 60780 1130 80080 1374 65302 1256 65095 1899 1998-99 61848 1407 81866 1463 64934 1400 66569 2339
Source: Report of the Task Force on Labour Welfare Levies. Finance Division, Government of Pakistan, Islamabad. May 2000.
In fact administrative expenditure has risen during 1996-99. For instance the ratio
of administrative expenditure to total receipt rose from 18.8 percent in 1996-97 to 19.4 percent in 1998-99 in Punjab. The information on other provinces reflects similar trends. The Task Force on Labour Welfare Levies headed by Justice (Rtd.) Mohammad Afzal Lone for instance viewed that “The figures disclose a marked difference between the administrative expenditure and the expenditure incurred on the “Secured Persons” which reflects that the objection of employers is not entirely ill-conceived and rather it tends to support their allegation that these Institutions are existing more for the benefit of the administrative set up rather than to promote the well being of the labour force who are the real beneficiaries identified by the legislature”.
(v) Workers’ Profit Participation Scheme In response to massive labour protests and strikes during late 1960s against the
declining real wages and deteriorating living conditions, the Government enacted Companies Profit Participation Act 1968 wherein workers (drawing salary less than Rs 3000) were entitled to participate in the profit of establishment. The Act was applicable to the companies having (i) 50 or more workers in their employment (ii) paid up capital of Rs 2.00 million or more and (iii) fixed assets of value of Rs 4.00 million. It was also laid down that every establishment/company falling under the purview of the act would establish a Workers Participation Fund to be managed by Board of Trustees (comprising of two
(14)

15
persons elected by workers). A sum equivalent to 5 percent of the profit has to be earmarked to the fund annually, which was to be distributed among the eligible workers. The leftover amount was to be transferred to Workers Welfare Fund by the AGPR. (vi) The Workers Welfare Fund (WWF)
The workers welfare fund was established in 1971 through an Ordinance. Its main purpose was to finance projects connected with the establishment of housing estates or construction of houses for workers; and finance other measures for the welfare of workers. It is financed through a 2 percent levy on taxable income of employers whose taxable income in a year is Rs 100,000 or more, (the levy last year brought an income of Rs 1 billion to the WWF). The second and even more important source of income of the Fund is the surplus amount from the op cited Workers Participation Fund; which amounted to Rs 2 billion in the year 2000.
The Fund has an accumulated amount of close to Rs 6 billion in investment and over Rs 11 billion lying with the Finance Ministry. It may be noted that the Workers Welfare Fund is collected by the CBR and a large amount of resources are lying with the Federal government and the Fund does not receive any benefit or interest on that amount. The receipts of WWF (2 percent of the levy and left over amount under Workers Profit Participation Scheme) in the first instance forms part of Federal Consolidated Fund subsequently these are transferred to Reserve Funds of WWF by debiting to the budget Grant of Ministry of Labour. The actual collection of WWF and actual releases for the 1994-99 period are reported below in Table 5.
Table 5
Actual Collection and Releases of WWF (Rs Million)
Actual Collections
Budgeted Release to WWF
Actual Release to WWF
1994-95 957.8 650 650 1995-96 1234.9 650 650 1996-97 1531.9 650 – 1997-98 1711.3 650 – 1998-99 2458.5 650 423 Source: Ministry of Labour.
The above table reflects that release to WWF has been only 21 percent of the actual
collection and 41 percent of the budget provision. The fund is collected federally but most of the operations are undertaken by the Provincial Workers Welfare Board (WWBs). These Boards are run by the officials of the provincial governments with little control for monitoring by the WWF. Total expenditure made by WWF on welfare and other related activities in different provinces and at headquarter during 1971-99 period is shown in Table 6.
(15)

16
Table 6
WWF Expenditure (Rs Million)
(i) WW Board Punjab 1612.6 (ii) WW Board Sindh 2089.9
(iii) WW Board NWFP 1285.6 (iv) WW Board Balochistan 1469.1 (v) Headquarter 682.0
Source: Report of the Task Force on Labour Welfare Levies. Finance Division, Government of Pakistan, May 2000.
At the federal level, the Fund is theoretically run by a tri-partite governing body, but in
practice the Federal government controls it. The Fund has, therefore, in general, not been administered according to its mandate; successive governments have used it for outlandish projects such as the Kidney Centres etc. The structural problems such as the relationship between the Fund and the Boards have led to widespread misuse and misappropriation of funds on the one hand and an extremely inefficient allocation of resources, especially in the housing sector on the other. This has been substantiated by investigation and subsequent prosecution of the officials of the Boards in the NWFP and Balochistan by NAB. Similar inquiries are being conducted in the affairs of the other Boards as well.
Quite apart from the problems listed above, the overall performance of the Fund in its major area of activity, the housing sector, has been totally unsatisfactory. For example in its 30 years of operations only 11577 houses (578 units/years), and 4749 flats (237 units/years), have been built. It has over the same period developed 35175 plots (1758/year). And only 44860 workers or 1.1 percent of those employed in the manufacturing and mining sectors have benefited from the three decade long endeavors.
There are serious complaints as to the manner in which the houses/flats and plots have been allotted. There are also questions about the eligibility of the beneficiaries in most cases. In the area of “other welfare measures” as well, the Fund seems to have been wandering into all kinds of activities, most of which are regarded to be dubious and many duplicating the functions of other institutions such as the ESSIs, Mine Workers Welfare, etc. (vii) Excise Duty on Minerals (Labour Welfare) Scheme, 1967
Excise Duty on Minerals (Labour Welfare) Act 1967, a Federal enactment with Provincial implementation regulates welfare of mine workers. It may be noted that the Mines Act 1923 guarantees the provision of health, safety and maintenance of shelter for workers to rest and a canteen. Under the Act of 1967 collection of a levy on all minerals at rates not less than Rs 1 and not more than Rs 5 per ton as specified by the Government are collected. The information on collections and receipts during 1996-99 for different provinces is reported below in Table 7, which also reports in parenthesis administrative expenditure of inspectorate of Mines for the said period.
The table is reflective of a very high ratio of administrative expenditure to receipts, ranging from 8.8 percent in NWFP to 70 percent in Balochistan. Information pertaining to the welfare oriented work and number of beneficiaries is available only for Punjab Province for 1998-99 as reproduced below in Table 8.
(16)

17
Table 7
Receipts of Excise Duty on Minerals by Provinces (Rs Million)
Year Punjab Sindh NWFP Balochistan 1996-97 9.31
(4.40) Around 17.00
3.76 (0.37)
6.25 (2.49)
1997-98 7.63 (4.06)
–
4.70 (0.375)
4.13 (2.80)
1998-99 13.41 (4.07)
– 4.79 (4.2)
3.76 (2.64)
Addition Exp. (30.3%) – (8.8%) (70.2%) Source: Report of the Task Force.
Table 8
Beneficiaries 1998-99, Punjab (i) Students on Roll 1670
(ii) Patient Treated 48566 (iii) Scholarship to Miner’s Children 356 (iv) Beneficiaries of Housing Schemes 180
Source: Report of the Task Force.
Independent evaluation of the transparency and manner of dispersal of these benefits to workers is lacking, though there are allegations of misuse and non-transparency. (viii) The Workers’ Children Education Ordinance, 1972
This scheme meant for providing free education to worker’s children was conceived as a provincial scheme to be financed through a levy at the rate of 100 rupees per annum per worker on industrial establishment. A separate establishment has been created by each province to administer this scheme. The collection of levy is undertaken by ESSIs on behalf of this scheme. Only 12000 students in two Provinces of Punjab and NWFP benefited while the total collection in these two provinces amounted to Rs 9 Million. Information pertaining to provinces of Sindh and Baluchistan is not available. (ix) Compulsory Group Insurance Scheme, 1968
This scheme under the standing order 10-B of the West Pakistan (industrial and commercial employment) Standing Orders Ordinance, 1968, obliges all employers to insure all permanent employees against natural death, disability and injury arising out of contingencies not covered by the Workman Compensation Act, 1923, or the Employees
(17)
18
Social Security Ordinance, 1965. The premium fixed by the insurance companies is usually very high as compared to the amount disbursed to the workers, or their heirs. The employers therefore, usually avoid. Given that the Ordinance does not apply to establishments with less than 20 workers, and the fact that today most workers are not employed as permanent workers, a vast majority of workers are not covered by this scheme. The social security institutions also provide these benefits while of late the WWF is also providing death grants. The scheme under the circumstances is left with very little scope and perhaps with little validity. B. Micro Credit
Improved access to credit facilities has always been recognised as a measure leading to higher incomes of the poor and small operators in the farm as well as non-farm sector. In Pakistan during the past variety of initiatives have been undertaken, which ranged from extending the out-reach of banking system to specialised credit schemes such as Peoples Finance Corporation in early 1970s, Small Business Finance Corporation and Youth Investment Promotion Scheme in 1980s. The extent to which poor benefited from these ventures largely remains undocumented. The above mentioned credit extension measures are alleged to benefit non-poor more than the poor particularly wherever subsidy was involved because of the rent seeking behaviour of the functionaries, as well as requirement of collateral, which the poor cannot offer. It appears that the reliance of poor on expensive sources of credit provided through informal lenders did not curtail substantially. Some studies suggested that share of institutional credit in overall credit has declined since 1985, and the role of informal credit was predominant, accounting for over three fourths of the total [Irfan (1999)].
During the 1990s the Government added to the pre-existing facilities such as Agricultural Development Bank, First Women Bank, and National Rural Support Programme. The new initiatives under, Khushali Bank and Pakistan Poverty Alleviation Fund (PPAF) were undertaken. Similarly a special facility for SME sector was put in place. Below a brief discussion of Khushali Bank and PPAF is made. (i) Khushali Bank
Khushali Bank currently operating in over 80 districts was established in August 2000. So far around Rs 0.3 billion have been disbursed to 30 thousand applicants with female share being one-third in the beneficiaries. The Bank is planning to enhance the coverage to 100000 households annually as well as the operations will be targeted to poor. Recently opening up of Micro-Finance Bank in the private sector is being allowed with simplified procedures for licensing and supervision. (ii) Pakistan Poverty Alleviation Fund
PPAF was established to extend the access of poor and micro enterprises to credit facilities. The World Bank provided a loan of US $ 90 million and an equivalent amount of grant, the former for disbursement as a credit and the latter for infrastructure buildup
(18)

19
of PPAF and related organisations. The PPAF was established as a joint stock company outside the Governmental influence, presumably to avoid its discretionary powers. The Board of Directors of PPAF which provides policy guidelines, comprises of three members from the government and the remaining nine from the civil society.
PPAF acts as wholesaler and distributes credit through the sister organisations (NGOs). While the provision of credit to poor without any subsidy (often reflected through lower interest rates) is understandable, the appropriation of spread between the borrowing rate (at 2 percent) and ultimate lending rate (20-22 percent) hardly appears to be justifiable. Who is the beneficiary in the totality of transaction? Do the functionaries of PPAF and sister organisation enjoy this reward simply for organising CBOs in the villages?
The above constitutes a major design problem. The objective of arranging a social collateral through CBO could have been achieved at much lower cost through cooperative credit societies under the administrative control of the Provincial governments. The spread would have been used to build up their reserve fund, which in turn would have ensured sustainability to the venture, currently missing under PPAF.
In addition to the above mentioned design problems the coverage of PPAF is currently limited. Also allegations of application of social pressure and harsh measures for the recovery of loans have been made too. Furthermore hardly is there any evaluative study which could indicate the extent to which the poor have benefited from PPAF as well as making it difficult to assess targeting efficiency. PPAF was established because of the encouraging experience of micro-enterprises loan of the World Bank distributed through Banker’s Equity Limited wherein loan was extended to successful ongoing enterprises. The extent to which PPAF can achieve such a primacy is difficult to determine. C. Transfers to the Poor
Under transfer to poor there are three main elements. Zakat and Pakistan Baitul Mal is administered by State, while private transfers from rich to poor do take place too. These are discussed below. (i) Zakat
Payment of Zakat and Ushr is obligatory upon rich and constitutes as one of the five fundamental tenets of Islam. In the initial periods of Muslim history the government used to collect Zakat/Ushr to be deposited in Baitul Mal for assistance of the poor and destitute. With the emergence of kingdoms in Muslim World this practice was stopped and payment of Zakat/Ushr was left to individuals themselves to help the poor and needy. In Pakistan, President of Pakistan, on June 20th, 1980, promulgated the Zakat and Ushr Ordinance. However in contradistinction to religious injunctions where Zakat has to be paid at the rate of 2.5 percent of all the wealth over and above NISAB (the minimal amount of property liable to the payment of Zakat), under this Ordinance it was levied on only interest bearing financial wealth. Thus, Zakat is deducted by the financial
(19)
20
institutions on the following assets: saving bank accounts, fixed deposits saving certificates, NIT units, ICP’s mutual fund, certificates, government securities on which return is paid, annuities and life insurance policies and provident fund credit balances.
Five tier administrative set up was put in place for Zakat administration: Central Zakat Council, Provincial Zakat Council, District Zakat Committees, Tehsil Zakat Committees, and Local Zakat Committees. Provincial and Tehsil Zakat Committees were abolished and 12 regional administrators were appointed in 1996. Until 2001, more than 30,000 Local Zakat Committees were working in the country with the help of more than 250,000 employed workers and volunteers. In 2001, all the Zakat committees were dissolved through a Presidential Order, on the charges of politicisation and financial mismanagement of the system. Under the new setup, about 40,000 new Zakat committees were constituted after the clearance by the Army Monitoring Team.
The financial institutions do not charge fee for the collection service. After keeping a percentage of all proceeds for national welfare and other schemes, the State Bank of Pakistan transfers the Zakat funds to Zakat committees for distribution. These committees can spend up to 10 percent of allocated funds on administration. These Local Zakat Committees spend 60 percent of the Zakat funds for distribution among poor for subsistence and rehabilitation of deserving persons. The remaining 40 percent is distributed through institutions like deeni madaris, public hospitals, vocational training institutions and other welfare institutions.
Zakat collection increased over time from Rs 846 million in 1980-81 to Rs 4276 million in year 2000-01. But as a percent of gross domestic product Zakat was around 0.31 percent in 1980-81 which declined to 0.204 percent during 1990s and in the 2000-01 it was only 0.14 percent of GDP (see Appendix Table 1). Initially, Zakat was distributed at the rate of Rs 300 per month to Mustahaqin (eligibles). Upto Rs 7000 p.a was paid to an eligible student for higher education and upto Rs 5000 for Jahez (dowery). However, under the revised system, the subsistence grant increased from monthly transfer of Rs 300 to Rs 500. All payments are made through banks to improve transparency.
By the end of December 2001, Zakat system according to official records benefited 2 million people and about 0.5 million of them received assistance on a regular basis. Previously Zakat system emphasised on grants and stipends. The revitalised system seeks to provide funds to Mustahaqin not only to fulfill basic needs but also to permanently rehabilitate them, by helping them in the establishment of small-scale business or other means of living suitable to them to achieve self-reliance.
The extent to which officialisation of Zakat collection and distribution represents an additionality in the totality of transfers from rich to poor is difficult to determine. In case of Pakistan Cox and Eser (1995) viewed that private transfers are sensitive to pre-transfer income of the recipient, hence an increase in the public transfer may reduce the levels of private transfers. Identification of eligible beneficiary by Local Zakat Committee reportedly involves favouritism and misgovernance. This is manifest from the wholesale changes and the dismissal of all Zakat Committees through a Presidential Order in 2001. The new Zakat committees simply with the clearance of Army Monitoring Team hardly
(20)
21
qualify to be more honest than the previous ones replaced unless some supporting evidence, missing in this case, is provided.
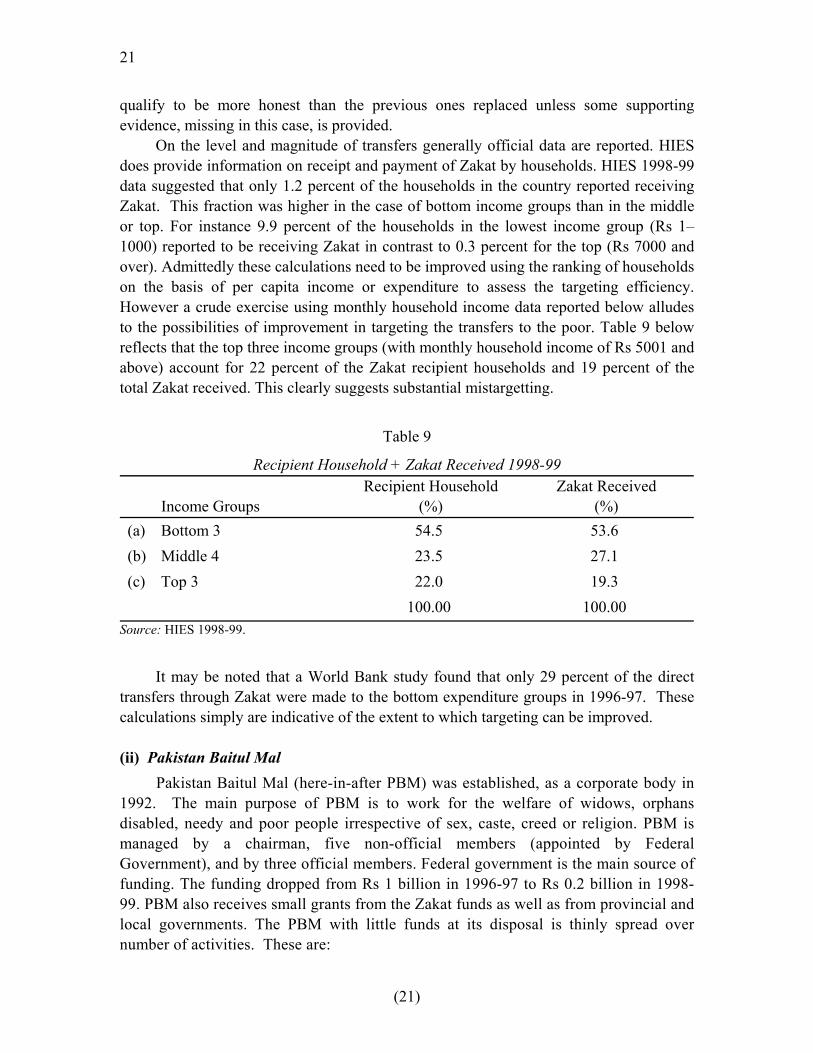
On the level and magnitude of transfers generally official data are reported. HIES does provide information on receipt and payment of Zakat by households. HIES 1998-99 data suggested that only 1.2 percent of the households in the country reported receiving Zakat. This fraction was higher in the case of bottom income groups than in the middle or top. For instance 9.9 percent of the households in the lowest income group (Rs 1–1000) reported to be receiving Zakat in contrast to 0.3 percent for the top (Rs 7000 and over). Admittedly these calculations need to be improved using the ranking of households on the basis of per capita income or expenditure to assess the targeting efficiency. However a crude exercise using monthly household income data reported below alludes to the possibilities of improvement in targeting the transfers to the poor. Table 9 below reflects that the top three income groups (with monthly household income of Rs 5001 and above) account for 22 percent of the Zakat recipient households and 19 percent of the total Zakat received. This clearly suggests substantial mistargetting.
Table 9
Recipient Household + Zakat Received 1998-99
Income Groups Recipient Household
(%) Zakat Received
(%) (a) Bottom 3 54.5 53.6 (b) Middle 4 23.5 27.1 (c) Top 3 22.0 19.3 100.00 100.00
Source: HIES 1998-99.
It may be noted that a World Bank study found that only 29 percent of the direct
transfers through Zakat were made to the bottom expenditure groups in 1996-97. These calculations simply are indicative of the extent to which targeting can be improved. (ii) Pakistan Baitul Mal
Pakistan Baitul Mal (here-in-after PBM) was established, as a corporate body in 1992. The main purpose of PBM is to work for the welfare of widows, orphans disabled, needy and poor people irrespective of sex, caste, creed or religion. PBM is managed by a chairman, five non-official members (appointed by Federal Government), and by three official members. Federal government is the main source of funding. The funding dropped from Rs 1 billion in 1996-97 to Rs 0.2 billion in 1998-99. PBM also receives small grants from the Zakat funds as well as from provincial and local governments. The PBM with little funds at its disposal is thinly spread over number of activities. These are:
(21)

22
(1) PBM provides individual financial assistance to poor persons with monthly household income of less than Rs 1500.
(2) The programmes for the provision of food included, World Food Programme’s food support programme where PBM helped for distribution of food among needy. In 1998, Rs 89 million were spent on distribution of food. In addition to programme for food, provisions are made for health and education and remission of House Building Finance Corporation’s loans to the widows.
(3) The programme for education and training included the rehabilitation of the parents of these school going children. Under the programme, the parents are asked to propose/select any small scale business or work and a loan of Rs 5000 is provided for this purpose. Open Tech Scheme was started as joint venture with Allama Iqbal University for vocational training of child workers, working as apprentice in auto workshops. For this purpose, 175 workshops are selected. After the training the children are provided a tool box to earn a living on their own.
(4) National Centre for Rehabilitation of Child Labour opened 33 schools for 3 million working children (17 schools are in process). Stipend of Rs 150 p.m. to each child and Rs 300 to parents was given to compensate for loss of child’s income. Similarly, National Commission for Child Welfare was established to deal with the issue of child labour.
(5) Mobile Dispensaries are started to provide medical help in the katchi abadies. So far these dispensaries are working only in provincial capitals.
However, despite wide variety of coverage of activities, the number of beneficiaries of PBM programmes is quite small. For example, the number of beneficiaries was only 230865 households in 1999, which is negligible considering the extent of poverty. Furthermore, there may be overlap of Zakat recipients and PBM beneficiaries. This will reduce the coverage and effectiveness of the programme further. Since government is main source of funding, the programme is sensitive to changes in the fiscal conditions. Funding to PBM declined from Rs 1 billion in 1996-97 to Rs 0.2 billion in 1998-99. In addition, the alleged lack of transparency and corruption in the use of funds may have reduced the effectiveness of these programmes.
(iii) Private Transfers—Philanthropy Generally it is believed that private charity is deep-rooted in Pakistan owing to
cultural and religious reasons. Few research attempts have been made to check the veracity of this belief which have provided some insights into the magnitude and pattern of indigenous philanthropy. A study quoted in Rimmer (2000) investigated formal and informal social safety nets using 10 locations in urban as well as rural areas. According to the authors, employers and well off neighbours demonstrate their generosity by giving cash and in-kind charities to poor at the occasion of Eid and Ramadan. That private charity is not only ad hoc, depending on free will of giver but it does not capacitate the poor for permanent extrication out of poverty. In addition, private charity, according to
(22)

23
authors, also involves strings such as to repay in term of labour, loyalty or commitment to support a particular political party. The recipient of charity characterised it as a disempowering experience.
A study sponsored by Aga Khan Development Network (2000), reflects a massive amount as individual giving or charity as reproduced below in Table 10.
Table 10
Estimates of Total Giving by Individuals in 1998 (Rs Billion)
Given to: Forms of Giving Organisations Individuals Total A. “Monetary” Giving (1+2) 15.144 25.972 41.116 1. Money (1.1 + 1.2) 10.353 19.444 29.797 1.1 Non-Zakat 9.369 6.647 16.016 1.2 Zakat 0.984 12.797 13.781 2. Gifts-in-kind 4.791 6.528 11.319 B. Value of Time Volunteered 17.233 12.189 29.422 Hours of Time Volunteered 0.919 0.650 1.569 Total Giving (A + B) 32.377 38.161 70.538
Source: Arshad Zaman Associates (1999) The Dimensions of Individual Giving in Pakistan. A Study for Aga Khan Foundation (Pakistan).
According to this study, around Rs 41 billions of donations (cash/kind) and Rs 29
billions worth of time has been donated under private philanthropy by individuals. Two-thirds of monetary donations represent inter-individual transfers, while remainder is donated to organisations. This reflects a general lack of awareness as well as of trust of the social institutions. The extent to which charity as inter-individual transaction, as discussed above, yields certain benefits to donors such as subservience and serfdom of recipients, was not explored by this study.
On the basis of this survey however, certain tall claims, such as the private charity being higher than the government expenditure on social sector development and that indigenous grants are almost five times that of foreign resources, have been made. As usual Pakistani authorities rushed to establish a new institution, Pakistan Centre for Philanthropy, to tap the potentials hinted at by the above mentioned study. The extent to which claims made in the study have been exaggerated cannot be quantified. It may be added that the report suggests that around one-thirds of the transfers occur among the poor themselves.
HIES 1998-99 (the year of the above cited study) suggests that around 11 percent of the households reported receipt of gifts. Overall average value of the gift among the recipient households for the year works out to Rs 4168.00. In other words a total of Rs 8 or 9 billion have been received by individuals as gifts. Nearly 47 percent of these gifts were given to top three monthly income groups. This underscores the need to launch a
(23)

24
survey on statistically sound footing to estimate the totality of individual philanthropy for provision of a solid base to prevailing euphoria.
In fact some of the observers are of the opinion that creeping cash economy over the years has substantially weakened the level and mode of individual charity. Some of the goods such as vegetables, fruits, wheat, milk, etc. which were given free to poor in the rural areas in the past are being sold now in the market. The effects of monetisation and commercialisation on the individual and collective philanthropy in Pakistan have not been examined. In addition in majority of the cases the so called philanthropy entails reciprocity hence it entrenches the divide as well as sustains the very apparatus which has generated poverty. D. Public Works Programme for Employment Generation
Pakistan has a long history of introducing public works programmes with different nomenclatures in different periods as provided in Table 11.
Table 11
Public Works/Rural Development Programmes Name of Programme Duration Description Village AID 1953-1962 Village workers aimed to mobilise communities and act as
extension agents for government departments;
Surplus labour in villages used to enhance rural infrastructure: schools, clinics, water supply;
Each village worker served 7 villages; plan was to cover most villages by 1965.
Rural Works Programme (RWP)
1962-1971 Financed through US PL-480 food grants;
Employment Programme for Infrastructure;
Unlike Village AID, did not require any contribution from community;
Urban programme included under 3rd Plan but did not get off the ground.
Integrated Rural Development Programme (IRDP)
1972-1980 Aimed to support small and medium farmers;
Sought to improve rural production and incomes through establishing service centres to serve communities.
Peoples’ Works Programme (PWP)
1972-1982 Amalgam of old RWP with an added urban component; Government funded employment programme for non-farm work.
Five Point Programme (FPP)
1985-1988 Rural component covered education, health, road, electrification, water supply and sanitation; also 7 marla plots scheme and special development programme.
Taameer-e-Waten Programme (renamed in 1993 as Peoples Programme
1991-1999 Senators and MNAs identify development schemes in their constituencies;
Objective to provide basic amenities like rural roads, sanitation, drinking water.
Source: Rimmer (2000).
(24)

25
It may be noted that right from V-AID to current Khushal Pakistan Programme the interventions were made to achieve the objectives of poverty alleviation through rural development and consequent direct employment generation, though of short duration, depending upon the length of construction phase. Indirect employment generation of the increased construction activity can be sizeable, however.
Nearly all the programmes with the exception of V-AID have been politicised essentially though the involvement of Union Council, MNAs, MPAs etc. In 1962 Rural Works Programme started outside Five Years Plan and was handed over to Basic Democrats. This tradition of involving local politicians was kept alive thereafter wherein politicians wielded their influence in site selection and channeling benefits in terms of jobs and contracts to their clients in the constituency. In the mix of activities generally new construction has been preferred over the maintenance, simply because of the visibility as well as hefty kickbacks.
Community participation in the context of lord/serf relationships is simply a hoax. In more egalitarian setting it has generated dividends and ensured efficient use of resource. Only under Village Aid the community was supposed to contribute towards programme/project. Impact of these programmes on employment generation and in turn on poverty alleviation has never been systematically estimated. Generally guestimates have been offered, precisely like the current governmental practice. (i) Khushal Pakistan Programme (KPP)
KPP is under implementation since 1999 and over 13000 small projects have been approved out of which 10000 have been completed. Under this programme, farm to market roads, water supply schemes and small rural roads have been constructed. The budget allocation for FY 2001-02 was Rs 7.5 billion, which increased after the events of September 2001. The official estimate is that around 500000 jobs of various durations would be created. This claim is not based on sound evidence or exercise. In principle communities are empowered to participate in various phases of the project ranging from identification to implementation, but the manner and level of community participation is not very well documented.
Expectations of improvement in implementation and better governance under Devolution through District Councils appear to be optimistic because of two major factors. Firstly in a district, tehsil or union council the feudalistic mode of dispensation will not wither away by sub-division of geographic area. Second and most important stumbling block are the claims of MNAs and MPAs for having a major say in the distribution of these funds. In the ensuing tussle the District Councils can be rendered ineffective. While the importance of public works programme for provision of infrastructure, employment generation and poverty alleviation cannot be denied, the challenge remains in the effective use of resources and overall better governance. E. Social Services
Pakistan’s failure to translate improved growth into human development over the years has been highlighted by many research studies [Ranis and Stewart (1997)]. A low
(25)

26
level of public expenditure, weak delivery system and sub-optimal utilisation of resources have been identified as major factors underlying the poor performance of social sectors and thereby human development which not only is often regarded as an important input for the overall developmental ventures of the nation but also for poverty alleviation. Cross-sectional surveys very often yield a positive association between poverty and illiteracy. Similarly better health is supposed to enable one enjoying higher productivity than a sick or ill person, as implied by efficiency wage hypothesis. More important is the intrinsic value of the education, health etc. than the instrumental. Citizens are entitled to have education and health as a matter of right, hence these need to be treated as merit goods.
Social Action Programme Government of Pakistan with funding and collaboration of international donors
initiated a Social Action Programme (SAP) in 1992 to improve the human development indicators. In principle a cross-sectoral initiative, in actual implementation was sectoral under SAPP-1 and SAPP-2. SAP focused upon four major areas—primary education, basic health care, drinking water supply and rural sanitation and population welfare. Execution of the programme was entrusted to Planning and Development Ministry at the Federal level whereas SAP secretariats at the provincial levels were established for implementation.
The first phase of SAP was completed at a cost of Rs 106.4 billion with two thirds being spent on education. The overall performance, as discussed below, was frustrating in case of education and limited in other sectors. Still the Government launched SAPP-2 for five years 1997–2002 with an estimated cost of Rs 498 billion. A brief description of the achievements under these programmes is made below. (i) Education
A perusal of Pakistan Integrated Household Survey (PIHS), officially considered to be a monitoring device for performance under SAP for various years, fails to yield any improvement in primary enrolment rates, both net as well as gross (see Appendix Table 1). Not only are the achievements insignificant but lie way below the targets. For instance Gross Enrolment Rate (GER) of 72 percent in primary in 2001-021 was substantially lower than the target of 88 percent set by SAP for 1998-99. Similarly primary NER was 42 percent in 2001-02 which in fact declined from 46 in 1991. The failure of SAP took its toll in the shape of worsening inequalities among rich and poor and rural vs. urban areas, though the gender gap appears to have been narrowed essentially because of larger decline in the male NER at primary level. A perusal of intertemporal data (PIHS) reflects that declining participation of poor, and low income groups during the 1990s account for the overall decline in NER & GER.
The stark differentials by income quintiles yielded by PIHS 2001-02 are reproduced below in Table 12.
1The PIHS report 2001-02 presents adjusted and unadjusted data. Due to non-availability of adjusted data for the previous years in this section unadjusted data for 2001-02 are reported.
(26)
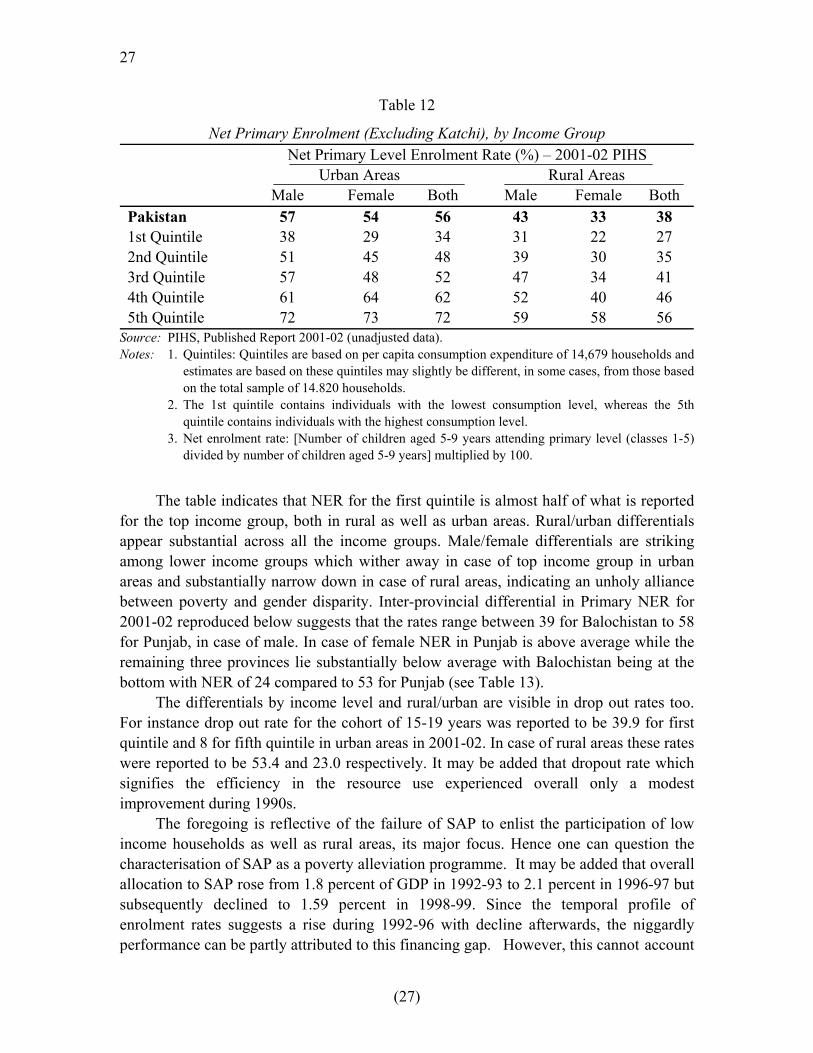
27
Table 12
Net Primary Enrolment (Excluding Katchi), by Income Group Net Primary Level Enrolment Rate (%) – 2001-02 PIHS
Urban Areas Rural Areas
Male Female Both Male Female Both Pakistan 57 54 56 43 33 38 1st Quintile 38 29 34 31 22 27 2nd Quintile 51 45 48 39 30 35 3rd Quintile 57 48 52 47 34 41 4th Quintile 61 64 62 52 40 46 5th Quintile 72 73 72 59 58 56
Source: PIHS, Published Report 2001-02 (unadjusted data). Notes: 1. Quintiles: Quintiles are based on per capita consumption expenditure of 14,679 households and
estimates are based on these quintiles may slightly be different, in some cases, from those based on the total sample of 14.820 households.
2. The 1st quintile contains individuals with the lowest consumption level, whereas the 5th quintile contains individuals with the highest consumption level.
3. Net enrolment rate: [Number of children aged 5-9 years attending primary level (classes 1-5) divided by number of children aged 5-9 years] multiplied by 100.
The table indicates that NER for the first quintile is almost half of what is reported
for the top income group, both in rural as well as urban areas. Rural/urban differentials appear substantial across all the income groups. Male/female differentials are striking among lower income groups which wither away in case of top income group in urban areas and substantially narrow down in case of rural areas, indicating an unholy alliance between poverty and gender disparity. Inter-provincial differential in Primary NER for 2001-02 reproduced below suggests that the rates range between 39 for Balochistan to 58 for Punjab, in case of male. In case of female NER in Punjab is above average while the remaining three provinces lie substantially below average with Balochistan being at the bottom with NER of 24 compared to 53 for Punjab (see Table 13).
The differentials by income level and rural/urban are visible in drop out rates too. For instance drop out rate for the cohort of 15-19 years was reported to be 39.9 for first quintile and 8 for fifth quintile in urban areas in 2001-02. In case of rural areas these rates were reported to be 53.4 and 23.0 respectively. It may be added that dropout rate which signifies the efficiency in the resource use experienced overall only a modest improvement during 1990s.
The foregoing is reflective of the failure of SAP to enlist the participation of low income households as well as rural areas, its major focus. Hence one can question the characterisation of SAP as a poverty alleviation programme. It may be added that overall allocation to SAP rose from 1.8 percent of GDP in 1992-93 to 2.1 percent in 1996-97 but subsequently declined to 1.59 percent in 1998-99. Since the temporal profile of enrolment rates suggests a rise during 1992-96 with decline afterwards, the niggardly performance can be partly attributed to this financing gap. However, this cannot account
(27)

28
Table 13
Net Enrolment Rate at the Primary Level, by Province (Including Katchi Class) Net Primary Level Enrolment Rate (%)1998-99 PIHS
Male Female Both Overall 53 44 49 Punjab 58 53 56 Sindh 45 34 46 NWFP 55 38 46 Balochistan 39 24 32
Notes: 1. Net enrolment rate: [Number of children aged 4-9 years attending primary level (classes 0-5) divided by number of children aged 4-9 years] multiplied by 100. Enrolment in katchi is included.
2. Numerator of NER: Raised sum of all individuals aged 4 -9 years who report currently attending primary level, including katchi class.
3. Denominator of NER: Raised sum of all individuals aged 4-9 years who responded to the relevant questions.
for the entire story. Various research studies identified obstacles both in the demand and supply side of education. The factors underlying the political decision-making and management can be held responsible for sub-optimal and misuse of resources such as improper site selection, and absenteeism of teachers etc. It may be noted that during the second phase of SAP, Third Party Validation (TPV) of recruitment, procurement site selection and absenteeism was introduced. The findings of TPV undertaken in 1998, 1999 and 2000 fail to reflect any improvement except somewhat in case of the site selection.
The demand side of education appears to have been glossed over by the designer of SAP. First of all it is costly to send a child to primary school. In government schools on the average Rs 821 per year are spent per student at primary level according to PIHS 2001-02. Thus 40 percent of the boys and 26 percent of the girls who never attended schools reported the reason to be too expensive in 2001-02 PIHS. In addition there are other costs too, such as contribution of child in domestic work and household enterprise which must be sacrificed by getting a child enrolled in school. Furthermore the economic benefits from education hardly appear obvious in the context of massive unemployment particularly for poor and under privileged. In the job market both influence and links are important and poor do not have either one. Failure to reckon with the parental constraints and motivation resulted in their lower level of participation.
Low quality and absenteeism of teachers along with inadequate instructional material (a supply side factor) also tends to bear upon the enrolment. In urban areas there has been substantial shift away from government schools particularly among the middle and upper income groups. PIHS 2001-02 for instance reveals that only 27 percent of the primary school students belonging to top income group (5th Quintile) are in government schools in urban areas. The corresponding percentage for 1st Quintile households in
(28)
29
urban areas is 75 percent. While emergence of private schools has been identified and very often celebrated as a productive public-private partnership, some aspects seemingly have been neglected. Not only does the quality of education in private school vary but the participation is income level specific. Furthermore with the exit of rich and influential from the government schools there will be little pressure, if any, on the government to improve the situation in public sector institutions. In addition through the prevailing education system rich poor divide is likely to be accentuated. (ii) Health and Population Welfare
SAP envisaged to improve the quality and access to basic primary health care services. Preventative care, control of communicable diseases, maternal and child health/reproductive care were emphasised by SAP. Infrastructural provisions such as Basic Health Units (BHU) and Rural Health Centres were set up in rural areas. However, most of these outlets reportedly were under-funded and understaffed. The impact of SAP on major indicators (outcomes as well as process indicators) related to health are discussed below: Infant Mortality
Infant mortality improved from 122 in 1991 to 82 in 2001-02. However, Oxford Policy Management (OPM) mid-term review of SAP casts doubt on the data related to the base year 1991, which according to OPM is an overestimate hence the pace at which infant mortality declined during 1990 is slower than suggested by PIHS data. Also according to some studies the rate of decline in infant mortality during this decade was in fact lower than that in 1980. Irrespective of the correct rate, the 2001-02 level of infant mortality (82) is substantially higher than India (70) and Bangladesh (61). It needs to be pointed out that SAP failed to achieve the target of 65. Large differentials in this respect between rural and urban areas are noticeable. Inter-household variations in a given area appear to be substantial and often have been attributed by researcher to mother’s level of education.
Application of care is consulted while interpreting the data yielded by HIES which relies on maternity history and refers to data on births three years prior to survey. Thus PIHS 2001-02 reported infant mortality rate is based on the cohort of children born between January 1995 and December 1997. Memory lapses leading to under-enumeration or over-reporting of births can generate implausible results. For instance in 1998-99 the male infant mortality rate for Balochistan is lower than Punjab and Sindh. However, the ranking gets reversed in 1996-97 PIHS. Incidence of Diarrhea
Diarrhea, a leading cause of infant deaths and a major disease, appears to have been brought under some control. Its incidence (during the 30 days preceding the survey) has declined from 25 percent in 1991 to 12 percent in 2001-02. Administration of ORS, an inexpensive treatment for Diarrhea, remains however quite low. Over 63 percent of the
(29)

30
children with Diarrhea resorted to private practitioners according to 2001-02 PIHS, while only 20 percent of the patients are reported to have used government facilities. Immunisation
One of the major objectives of SAP was to expand immunisation with a target of universal coverage by the end of 1990s. The available data suggest that by the end of the decade the coverage was around 50 percent which was almost twice of what obtained in 1991, though the progress in the coverage of immunisation appears to have been stagnated after 1997. It may be noted that the fraction of those children regarded to be fully immunised varies across income groups as well as provinces. The evidence on the former by sex is reproduced below from PIHS 1998-99.
Table 14
Percentage of Children Aged 12-23 Months who Have been Fully Immunised, by Income Group
1998-99 PIHS Urban Areas Rural Areas Both Areas Province and
Income Group Male Female Both Male Female Both Male Female Both Pakistan 1st Quintile 31 26 28 23 27 25 23 26 24 2nd Quintile 54 28 42 27 28 28 30 29 29 3rd Quintile 43 33 38 32 18 25 37 22 30 4th Quintile 65 58 62 31 29 30 35 31 33 5th Quintile 84 68 76 32 32 32 51 49 50
Notes: PIHS Published Report. 1. Quintiles: Income group made on the basis of per capita household consumption. 2. Children who reported having received full immunisation who also have an immunisation card, expressed a
percentage of all children aged 12-23 months. 3. Immunisation: To be classed as fully immunised a child must have received: ‘BCG’, ‘DPT1’, ‘DPT2’,
‘DPT3’ ‘PLIO1’, ‘POLIO2’, ‘POLIO3’, and ‘Measles’. 4. Quintiles are based on per capita consumption expenditure of 14.679 households and estimates are based on
these quintiles may slightly be different, in some cases, from those based on the total sample of 14,820 household.
The above Table 14 is indicative of stark differentials (of 1 to 3) by income group
in urban areas. These get narrowed down in rural areas where overall level of full immunisation is substantially lower than urban areas. Pre- and Post-natal Care
A perusal of the 2001-02 PIHS is indicative of low level of pre-natal medical consultation. Only 35 percent females resorted to pre-natal consultation. Wide disparity among rural (26 percent) and urban (63 percent) was noticed. One finds substantial variation in medical consultation by household’s income/expenditure levels. Low income and poverty appears to be a major detractor in this respect. Overwhelming proportion of deliveries among the low income and poor households has been at home wherein nearly 40 percent of births were not attended by any trained personnel. Rural/urban and income specific differentials
(30)
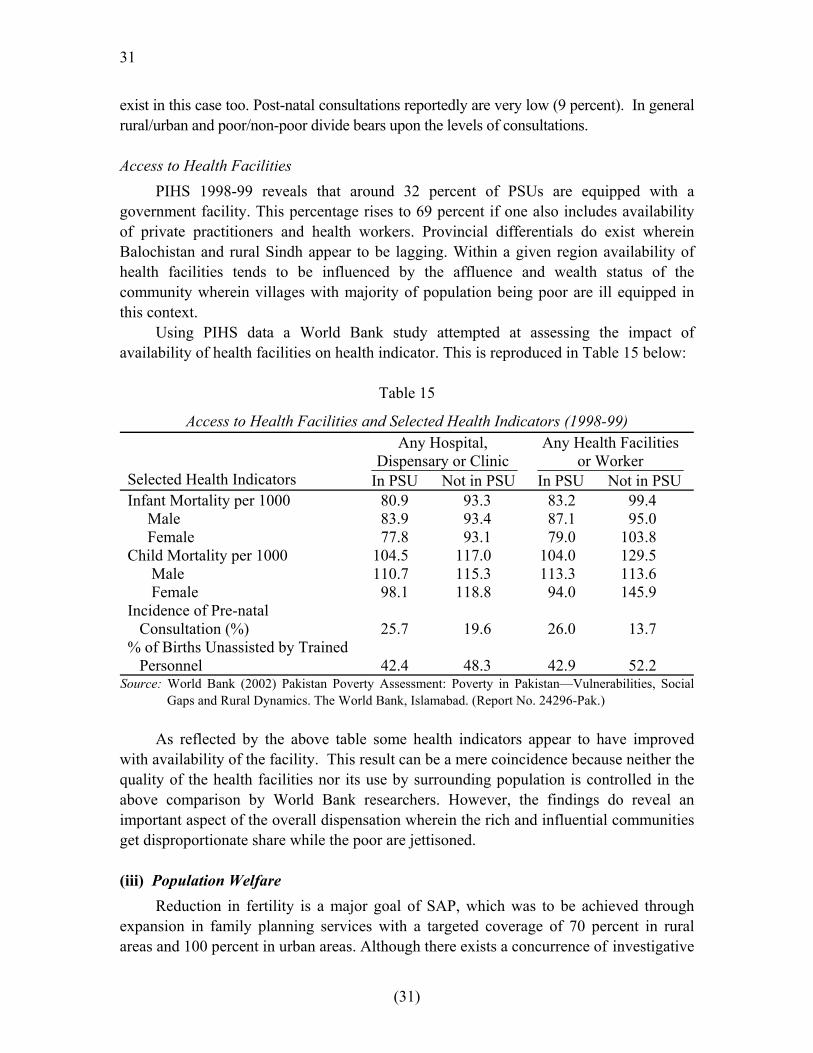
31
exist in this case too. Post-natal consultations reportedly are very low (9 percent). In general rural/urban and poor/non-poor divide bears upon the levels of consultations. Access to Health Facilities
PIHS 1998-99 reveals that around 32 percent of PSUs are equipped with a government facility. This percentage rises to 69 percent if one also includes availability of private practitioners and health workers. Provincial differentials do exist wherein Balochistan and rural Sindh appear to be lagging. Within a given region availability of health facilities tends to be influenced by the affluence and wealth status of the community wherein villages with majority of population being poor are ill equipped in this context.
Using PIHS data a World Bank study attempted at assessing the impact of availability of health facilities on health indicator. This is reproduced in Table 15 below:
Table 15
Access to Health Facilities and Selected Health Indicators (1998-99) Any Hospital,
Dispensary or Clinic Any Health Facilities
or Worker Selected Health Indicators In PSU Not in PSU In PSU Not in PSU Infant Mortality per 1000 80.9 93.3 83.2 99.4 Male 83.9 93.4 87.1 95.0 Female 77.8 93.1 79.0 103.8 Child Mortality per 1000 104.5 117.0 104.0 129.5 Male 110.7 115.3 113.3 113.6 Female 98.1 118.8 94.0 145.9 Incidence of Pre-natal Consultation (%) 25.7 19.6 26.0 13.7 % of Births Unassisted by Trained Personnel 42.4 48.3 42.9 52.2
Source: World Bank (2002) Pakistan Poverty Assessment: Poverty in Pakistan—Vulnerabilities, Social Gaps and Rural Dynamics. The World Bank, Islamabad. (Report No. 24296-Pak.)
As reflected by the above table some health indicators appear to have improved
with availability of the facility. This result can be a mere coincidence because neither the quality of the health facilities nor its use by surrounding population is controlled in the above comparison by World Bank researchers. However, the findings do reveal an important aspect of the overall dispensation wherein the rich and influential communities get disproportionate share while the poor are jettisoned. (iii) Population Welfare
Reduction in fertility is a major goal of SAP, which was to be achieved through expansion in family planning services with a targeted coverage of 70 percent in rural areas and 100 percent in urban areas. Although there exists a concurrence of investigative
(31)

32
studies that fertility has declined during the 1990s the precise magnitude and timing of the onset of decline remains controversial. Surveys conducted in 1997 yield estimates of TFR for mid 1990s ranging between 5.3 (PFFPS) to 5.9 (PIHS). Unfortunately PIHS is regarded to be of limited value assessing TFR as well as Contraceptive Prevalence Rate (CPR).
More reliable estimates based on PDHS, PCPS and PFFPS are indicative of a rise in CPR during the decade of 1990s. As reported in Table 16 below, CPR has risen from 11.8 percent in 1990-91 to 27.6 percent in 2000-01. However, the use of modern method is still as low as 20 percent in 2000-01.
Irrespective of the imprecision surrounding the exact quantification of the decline in T.F.R. some studies allude to the changes in nuptiality pattern as a major contributor in this respect. Table 15 below reproduced from a study by Soomro (2000) presents contributions of various proximate determinants in the fertility decline during 1975-97 period.
Table16
Percentage of Currently Married Women who are Currently Using Specific Contraceptive Methods, by Various Sources
Method PCPS
1984-85 PDHS
1990-91 PCPS
1994-95 PFFPS
1996-97 PRHFPS 2000-01
Any Method 9.1 11.8 17.8 23.9 27.6 Any Modern Method 7.6 9.0 12.6 16.9 20.2 Any Traditional Method 1.5 2.8 5.2 7.0 7.4
Source: Pakistan Human Condition Report 2002 CRPRID, Islamabad.
Table 17
Contribution of Proximate Determinants in Reduction of Births Per Woman in Pakistan: 1975-1996
PFS-75 DHS-91 PFFPS-97
Proximate Determinants
Index Absolute Change in TF
Relative Change
Index Absolute Change in TF
Relative Change
Index Absolute Change in TF
Relative Change
Non-marriages 0.788 2.421 29.524 0.682 3.60 39.56 0.678 3.471 37.976 Lactational Infecundibility 0.593 5.311 64.768 0.625 4.42 48.57 0.677 3.484 38.118 Contraception 0.955 0.468 5.707 0.891 1.08 11.87 0.783 2.185 23.906 Total (TF-TFR) 8.2 8.2 100.00 9.1 9.1 100.00 9.14 9.14 100.00
Source: Soomro (2000).
The above Table 17 suggests that while relative share of the contraception in
decomposition exercise has risen during the period under review from 5.7 percent in 1975 to 23.9 percent in 1997, its level however is still lower than the other two proximate determinants in 1997. A rise in the relative share of non-marriages during the same period has been attributed by the author to worsening economic conditions during 1990s which led to postponement and delay of marriages. Not only is there a need to investigate further in this respect but the impact of Family Planning on fertility needs to be assessed carefully.
(32)

33
(iv) Rural Water Supply and Sanitation Improving the performance of the local systems, expanding access to safe drinking
water and to ensure sustainability through promoting community responsibility particularly for operation and maintenance of water supply schemes were major objectives of SAP. Water supply provision was carried out by Department of Local Government and Rural Development (LGRD) while Public Health Engineering Department (PHED) were involved in schemes based on piped system.
A perusal of PIHS data suggests that percentage of households having access to clean water in rural areas experienced a modest increase from 74 percent in 1990-91 to 80 percent in 2001-02. It must be noted that various sources such as tap, hand pump, and motorised pumps proxy the access to clean drinking water. The quality of water from these sources is not assessed in PIHS. It may be noted that changes introduced in the PIHS questionnaire to improve data collection on safe and clean water during different rounds complicate the interpretation of the data. Availability of toilets in rural areas registered a limited rise from 32 percent in 1990-91 to 40 percent in 2001-02. Household access to drainage system, either underground or covered appears to have remained stagnant or declined during 1990s. The above is suggestive of a limited impact of SAP, if any, on the availability of clean water and improvement in sanitation facilities.
III. SOCIAL SAFETY NETS—AN ASSESSMENT
Evaluation of the social safety nets with respect to their totality of the impact on the poor, the society and the economy is admittedly a complex task because of pervasive ramifications. However, the SSN have generally been examined and evaluated with a particular focus on their implications for the poverty stricken segment of the society. Keeping this orientation in view, the SSN evaluation has often been made on the basis of
(a) coverage; (b) targeting efficiency; (c) access; (d) incentive effects; (e) income equivalence of the transfers; and (f) the cost effectiveness of the delivery mechanism.
In the foregoing section, formal sector SSN such as pensions, social security and welfare measures implemented by the governmental departments particularly, Ministry of Labour, have been discussed separately from the measures like SAP, Zakat, Micro-finance and credit as well as infrastructural development programmes under Public Works for employment creation. In the following, this classification is retained to assess the relevance of these interventions for poverty alleviation. In addition, the question of sustainability of programmes as well as the problems in their design will be discussed.
(33)

34
A. Old Age Pensions, Social Security, and Welfare Programmes in the Formal Sector
The Ministry of Labour implements a number of programmes ranging from old age pension to provision of housing and education of workers’ children as discussed in detail in the previous section. It appears imperative to highlight the fact that most of these programmes and interventions have followed the announcement of 1969 labour policy wherein, the government has explicitly recognised for the first time “that the workers had not had a fair deal in the past in a period of growing prosperity and rapidly increasing production the workers’ real income and living conditions have remained static and in many cases have deteriorated”. It may be added that the 1969 labour policy essentially was a response to the massive unrest and protests of the labour movements in late 60s. Thus one finds an emergence of a number of measures such as EOBI, Workers Welfare Fund (WWF) and other related interventions as discussed earlier. Most of the measures suffer from various limitations in addition to the problems of design, management, governance and inadequacy of the coverage as discussed below. (i) The Design Problem
Nearly all the interventions and measures envisaged to provide social security/protection to the workers are funded by the employers, though ultimate impact is borne by workers in the shape of lower wages. Non-visibility of contribution by the workers has rendered the entire system as a charity based, affording limited sense of participation of workers towards their own benefits. This is also associated with number of other related problems. For instance, there is no provision for the preservation or transfer of pension rights on termination of employment. Thus, in the privatisation process, since the workers’ do not contribute to the pension fund, there is no basis for the payment of the lump sum as a substitute of pension right. In the wake of closure of unprofitable public sector industrial units, payments have been defaulted by employers. Hence problems have occurred for the beneficiaries in receiving these benefits.
There appears to be a discrepancy between the intent of the labour policy and the subsequent introduction of certain measures such as under WWF. For instance, the policy seems to be categorical in its intent to “construct low cost housing and other facilities for workers” as a supplement to “the previous government’s policy regarding the provision of housing by employers”. The Workers’ Welfare Ordinance in its actual implementation has failed to follow the spirit of the labour policy which was not to undertake construction activity aimed at providing self-owned shelter to the workers but to cater for his housing needs during his working life with a particular employer at a particular station. In other words, through the implementation of Workers’ Welfare Ordinance 1991, the employers were no more regarded to be responsible for providing houses to the workers. This can be regarded akin to providing subsidy to employers.
Identification of the beneficiaries is also a complicated issue in the design. While the Workers Welfare Ordinance opts the definition of “worker” from the Industrial Relations Ordinance, in actual implementation there is no procedure laid down to
(34)

35
maintain this exclusiveness. Similarly insertion of “other benefits” alongwith house construction in the WWF Ordinance proved to be too elastic. In actual implementation activities ranging from distribution of cycles to establishment of Kidney centres were undertaken, mostly for political dividends as well as constituency buildup. (ii) Management and Governance Issues
The Workers Welfare Ordinance 1971 and rules made in 1976 are imprecise and vague with respect to authority and procedures of (a) identification of welfare measures and benefits for the workers; and (b) control of funds collected. In actual practice, it has been an exclusive prerogative of the government to suggest and undertake measures such as housing and others. Interestingly, in 1982, through a Presidential Order, construction of houses was stopped but again revived in 1988 by the Cabinet as if the factors underlying the previous decisions were not relevant anymore. Similarly, Kidney Centres were established using workers money under the directives of the Prime Minister of Pakistan and a massive funding went into these ventures which were presumably populous in nature and in the process also led to the built up of the respective constituencies of the decision-makers, both the political as well as bureaucratic. Imprecision and vagueness of the rules were exploited by those who were at the helm of affairs to identify the benefit as well as beneficiary using the free will as if the funds were just like a bounty. At times one feels that the Ministry of Labour has taken upon itself to provide everything under the sun ranging from education, health, housing, old age security, etc. with total neglect to duplication in the system as well as cost effectiveness and governance. On top of it all benefits to eligible workers were reported to be little if any. Management
It may be added that all the institutions under the Ministry are managed by a governing body with Minister or Secretary as Chairman and comprising of members from the government, the workers and the employers—the highly celebrated tripartite mechanism. In actual dispensation, the governing body approach for the administration of these organisations and measures proved totally ineffective and weak. It rubber stamped the decisions made by the Ministers or other higher level authorities. One of the reasons for this ineffectiveness was that mostly the selected individuals were hand picked and irrespective of their level of representation were nominated by the Ministry as members of the governing body. Thus the whole mode of dispensation not only permitted but also facilitated the buildup of respective constituencies in addition to rent seeking. There are dozens of cases lying with National Accountability Bureau. Some of the politicians and officials have been convicted and more recently, the scam of Rs One billion in EOBI reflects the level of honesty and governance applied in the actual administration of these institutions.
Interestingly enough, the Ministry itself started examining the functioning of various schemes. Thus, in 1985, a Federal Inspection Commission was assigned to
(35)

36
prepare a review report on the functioning of WWF. Similarly, various task forces and commissions were set up. For instance Commission on Social Security 1993, the Task Force on Labour 1994, the Task Force on Social Security 1994, the Task Force on Pension Fund 1996, the Task Force on Labour Welfare Levies 2001 and the Task Force on Labour Welfare 2001 were set up. One can find a common thread in most of these deliberations. Nearly all of these task forces offered recommendations for creation of one or two national institutions through amalgamation of existing ones for the provision of a comprehensive social security, old age pension and right based measures. Also most of these task forces recommended these two institutions to be fully autonomous, transparent and with independent functioning. So far, the Ministry and the government demonstrated good deal of imperviousness and the dispensation has remained unaltered which tends to suggest that constitution of task forces were to deflect the criticism rather than seeking guidance for improvement. (iii) Coverage and Adequacy
It is generally recognised that pensions, social security and all the related welfare measures undertaken by various institutions under Ministry of Labour do not cover workers from the agriculture sector, the informal economy and those in the formal sector who are employed temporarily through contractors. On aggregate, therefore, these measures influence the lives of only 5 percent of the non-agricultural labour force. Given that most of the incremental employment during the past few years has been generated either in the informal sector or as the contractual labour in the formal sector, the coverage of these schemes has declined from 3-4 percent of the total employed labour force in 1991 to an estimated 2 percent around year 2000. Similarly, construction of housing and flats under WWF benefited during the past thirty years only to 44000 workers which accounts for around one percent of the industrial labour force in mining and manufacturing only. (iv) Cost Effectiveness
It has already been discussed in the previous section that the administrative cost of Social Security Institutions, Workers Welfare Fund and EOBI are very high compared to other similar organisations in the developing world. Indeed, it may sound repetitious but one of the Commissions constituted to suggest for improvement in the implementation of the various measures very frankly viewed that all the measures and interventions made ostensibly to improve the workers welfare in fact are meant to enlarge the empire of the Ministry. (v) Sustainability
The problems of sustainability relating to EOBI have been discussed in detail in the foregoing. At present, the benefit outgo ratio being larger than the incoming contribution alludes to the possibility that the EOBI under unchanging conditions may find itself incapacitated to cater to the needs of the workers after 20 years. Similarly, there are
(36)

37
some indicators which suggest the emergence of the sustainability problem for the Workers Welfare Fund in near future. The major contributory stream originating from the unutilised funds collected under WPPF 1968 is likely to shrink in future, because the recent changes in the entitlement pattern wherein maximum wage ceiling has been raised from 3000 to 5000, the number of eligible employees will increase and left over funds for WWF may be curtailed substantially in future. B. Transfers
Zakat and private philanthropy constitute the two major streams of transfers presumed to be made to poor. The former prior to officialisation by Zia regime was part of the latter. It is difficult to quantify the net impact of the additionality of official Zakat. It may very well have substituted the former though a serious research study has yet to be conducted.
Coverage of Zakat is quite limited. It benefited only 2 million people during the year 2001, in contrast to over 40 million poor. According to HIES 1998-99 data only 1.2 percent households received Zakat. Overall magnitude of the transfer under Zakat works out to 0.2 percent of GDP. There appears to be ample room for targeting efficiency. In 1996-97 only 29 percent of the direct transfers through Zakat were made to the bottom expenditure groups. Similarly HIES 1998-99 indicates that around one fifth of Zakat was pocketed by top three income groups.
Lack of transparency and misgovernance have been reported to be substantial. Identification of eligible beneficiary by local zakat committee involves favouritism. As already discussed these concerns led to wholesale changes of the zakat committees in 2001, only to be replaced by another group of “honest” as identified by Army Monitoring Teams at district level. It may be added that any serious evaluation of the impact of zakat has never been made. Zakat also suffers from lack of financial stability. Payment of zakat has been made voluntary by the Supreme Court. In addition riba free economy under Islamisation is likely to change the entire collection and distribution of zakat.
The magnitude of private transfer appears to have been exaggerated. For instance on the basis of responses of the households in HIES 1998-99 the value of gifts (private transfers) works out to Rs 8 or 9 billion. A survey of donors in the same year on the other hand suggests that Rs 41 billion have been spent under private philanthropy. Not much is known about the rich/poor share in the gifts. HIES 1998-99 suggests that 11 percent of households received gifts during the year. But nearly half of the gifts were made to top three income groups, the share of poverty stricken households receiving the gifts would be around 5 to 6 percent. Based on 1991 PIHS, a study maintained that although around half of poor benefit from transfers, the system is ad hoc and depends on the discretion of donor. Motives underlying private transfers have not been explored well in Pakistan. To the extent these transactions entail reciprocity it cannot be identified as philanthropy. Disempowerment, helplessness and ultimately subjugation of recipient while sustaining the structure of control can be a welfare loss too.
(37)

38
C. Public Works Despite long history of the public works programme rarely any evaluative study has
ever been undertaken to document the totality of impact of a programme for poverty alleviation or employment generation. This simply is reflective of the level of concern of policy-maker with respect to efficient use of resources. Incidentally it also exhibits the efforts to cover up the effects of politicisation and misgovernance. Targeting efficiency of these programmes involves firstly to identify the poverty stricken areas. Geographic or regional incidence of poverty, however, based on HIES or PIHS produces inconsistent results. The provincial ranking using head count ratio fluctuates from year to year. Once project site is selected the participation of poor in construction work is ensured by keeping wages lower than the prevailing market rate. Hardly any information pertaining to wage rates paid to different categories of workers to determine the applicability of the above cited self-targeting. That public works programmes in the past have been politicised with attendant misgovernance and sub-optimal use of resources appears to be a foregone conclusion. However, these programmes constitute one of the major interventions for rural development, employment generation and poverty alleviation. The challenge therefore is to strengthen the institutional structure and ensure better governance. In addition there is a need to allocate sufficient funds for maintenance of infrastructure to reap benefits of the past investments. Major initiatives in the construction of new facility, holding out potentials for kickback and constituency fortification have to be resisted. D. Micro Credit
Coverage of both PPAF and Khushali Bank at present is limited. Furthermore not much is known about the targeting efficiency. The criterion laid down by PPAF for selection of sister organisation can facilitate favouritism and be misused [Kemal (2002)]. In addition systematic procedures to evaluate the impact of these credit programmes have yet to be laid down. Reliance on household surveys (HIES or PIHS) to infer changes in Head Count ratio will be of limited use to determine the efficacy of credit programme which could be one of many actors in the field.
Admittedly release of credit constraints has positive effect on poor. The borrowed money is used for consumption smoothening as well as investment purposes. Among the poor the former influence predominates, as a consequence around 30 percent of the households in rural areas got classified as non-poor because their consumption was financed through borrowings. Evidence on capacity generation (in other words asset formation) in the case of poor is rare which is exclusively found in higher income groups [Malik (1999)]. Mounting indebtedness, however, appears to be a major result of these credit programmes. Recent World Bank Report (2002) described the borrowings by poor as “coping strategy” without scrutinising the sustainability of such a strategy. A perusal of 1998-99 HIES for instance reveals that outstanding debts of three bottom income groups are equivalent to three times of their annual household income. Not only does this represent an inter-generational transfer of poverty but it also tends to question the very
(38)
39
assumptions under credit programmes which claim to attain asset formation of the poor. Clearly there is a need to package the credit provision along with other measures such as training, marketing and related aspects of their better use, otherwise the poor will be condemned to eternal dependency and destitution.
E. Social Action Programme (SAP)
The fact that the objective of improving human development indicators of Pakistan, a major programme under SAP met with limited success particularly in case of primary education appears to be a foregone conclusion. What makes this outcome least palatable and disturbing is the fact that not only massive funding has been made to improve the situation but the government of Pakistan also enjoyed partnership with number of multi-donor agencies in the design and implementation of SAP. It appears that multiplicity of actors, the agenda being partly donor-driven, disproportionate emphasis on supply of inputs along with almost total neglect to the outcome (or output) as well as the failure to assess the demand of the population, which was supposed to be served, explain this poor performance. There are many reports and research efforts which document the reasons for failure of SAP. Major findings are summarised below. (i) Coverage
SAP during its implementation from 1992 to 2002 has simply failed to achieve the targets which were fixed to begin with. In other words the intended coverage could not be materialised. As far as the effect on the poor is concerned, it may be noted that failure to enhance the participation of poor accounts for the major portion of failure of education programme under SAP. World Bank (2002) for instance reports that “for all the lower expenditure deciles primary GERs were lower in 1998-99 than in 1990-91. Improvement in enrolments in primary and secondary were experienced by highest expenditure deciles. Also, the drop-out rate recounts the same story wherein poverty status of a household is closely associated with high drop out rate.
The incidence of diarrhea, as already discussed, is substantially higher in case of poverty stricken households alluding to the possibility of under-coverage of the poor. Similarly information on female health as indicated by pre- and post-natal care, and assistance at the time of delivery suggests wide differences in the consultation rates of rural and urban female as well as poor and non-poor. According to 1998-99 PIHS, pre- marital consultations in case of first quintile (per capita expenditure) in rural areas were reported to be 12 percent compared to 32 percent in the fifth quintile. Stark differentials are also observed in case of proportion of children with diarrhea having access to medical consultation as well as administration of ORS. SAP not only failed as a programme to improve human development conditions but performed miserably in extending coverage to poverty stricken segment of society as SSN too. (ii) Misgovernance and Politicisation of the Programme
Emphasis laid down on the supply side in the design of SAP led to spurt in the infrastructural construction activity. Thus, during the first phase of the SAP, the
(39)

40
establishment of primary schools, BHUs and other infrastructure pre-empted the major portion of the funds allocated for SAP. These activities essentially were undertaken in a climate of political patronage which led to tremendous misuse in the deployment of resources. The phenomenon of ghost schools and non-existing BHUs along with massive absenteeism of the functionaries is very well-known which needs hardly any more discussion. One wonders why the designers of SAP which also includes the multi-national donors failed to incorporate the possibilities of politicisation of the programme at the design stage because it was very well known and could have been anticipated. One of the major reasons for scratching the Village-Aid Programme in 1962 to substitute it with the Rural Works Programme under the Basic Democracies was to sustain the hold of rural èlites needed for the continuation of the structure at the apex. Since then the politicisation of all the infrastructural activities continued uninterruptedly. Therefore, one can safely conclude that all the construction activities under the guise of infrastructural developments or provision of schools and BHUs were likely to be misused by the politicians with the connivance of bureaucracy as well.
That the failure of SAP is embedded in the political economy has been identified as a major conclusion. Not only does this represent an Herculean challenge but efforts to improve the situation appear to have met with limited success as indicated by the experience under SAPP-II (Social Action Programme Project 1998-2002). Major World Bank Loans to Government of Pakistan since 1997 contain improvement in governance as a major clause of agreements. In case of Social Action Programme Project (SAPP-II) the agreement lays down adherence to objective criterion for appointments, site selection and procurement. The Third Party Validation however suggested substantial non-compliance in this respect as reported below in Table 18.
Table 18
Percentage of Cases where Criteria were not Observed 1999 2000 2001 Recruitment 5 38 36 Procurement 46 50 64 Absenteeism 60 70 69 Site Selection 41 19 38
The above is indicative of the fact that improving governance is not simply a matter
of laying down criterion, rules and procedures only. The clearance of World Bank for reimbursement despite non-compliance, however, remains esoteric.
(iii) Failure to Have a Sound Monitoring System
The two monitoring agencies, MSU and SAP secretariat were put in place to monitor the performance of various outcome and process indicators as well as the delivery mechanism. These agencies could not mature and become fully functional
(40)

41
presumably because of various reasons, a major one being the frequent multilateral and bilateral missions which disrupted the process of strengthening the focus of monitoring. A system of annual operational plans exists at provincial level with little evidence to suggest its institutionalisation. These are simply seen as a requirement of donors. Quarterly monitoring review by line departments has never been operationalised. (iv) Inefficiency in Resource Use
Deployment of resources in general has been sub-optimal owing to massive governance and management failure. In case of education for instance Mingat and Chuard (1996) reported that the unit cost of primary education in Pakistan is 40 percent higher than in comparable countries in spite of a higher pupil/teacher ratio. Similarly high dropout and repetition rates imply massive wastage of resources.
F. SSN—Adequacy and Limitation
Not only are the SSN insufficient but suffer from variety of problems associated with weak and corrupt institutional setup as already discussed. The financing gaps and low level of allocation of resources to alleviate poverty further compounded the situation. The foregoing is indicative of utter inadequacy of the SSN to address the issues related to poverty alleviation. This is manifest from the crude estimates of income equivalence of SSN, low and declining level of poverty related expenditure and Pakistan’s position among the SAARC countries, as discussed below. (i) Income Equivalence of Transfers
It is a complex task to estimate the income equivalence of the transfers entailed by SSN which are thinly spread over number of activities and defy quantification of the impact on poor. Governance issues further complicate the exercise because it is simply not clear how much of the funds were siphoned off by the influence wielders or gate keepers. Still SPDC (1999) made an attempt to work out the income equivalence of transfers. According to the estimates of this study based on crude as well as bold assumptions, less than 1 percent of GDP was the totality of transfers provided through Zakat, private philanthropy and credit measures. It may be added some researchers have estimated that around 6.8 percent of GDP has to be transferred to poor if the objective of poverty alleviation is to be achieved.
(ii) Poverty-related Expenditure It will be instructive to assess the governmental commitment to alleviate poverty by
using the level of resources deployed. During the 1990s the fiscal gap appeared to have been bridged through drastic curtailment in the PSDP. A particular focus on poverty-related national expenditure suggests a cut from 4.8 percent of the GDP in 1987-88 to 3.8 percent in the year 2000-01. The fact that the allocation to mega projects and the personnel expenditure of government was protected underscores the priority of the government attached to poverty alleviation. That Pakistan is lagging behind in the provision of social protection is clearly manifest from Table 19 below.
(41)
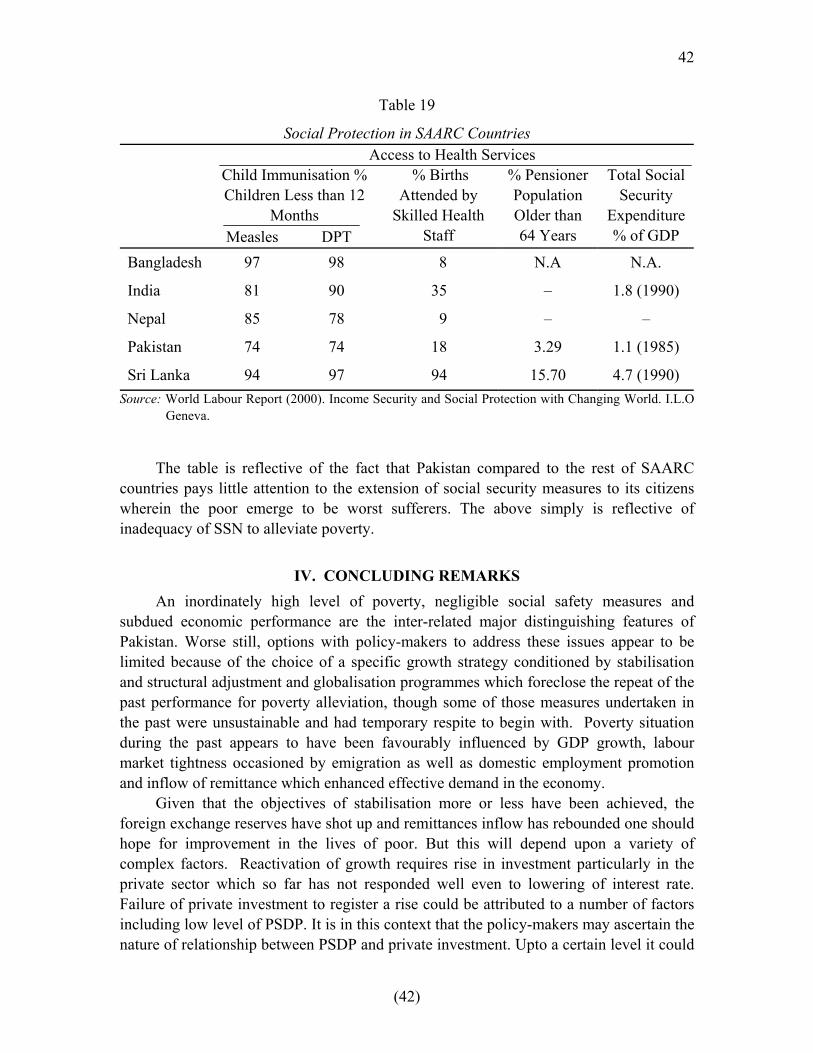
42
Table 19
Social Protection in SAARC Countries Access to Health Services
Child Immunisation % Children Less than 12
Months
Measles DPT
% Births Attended by
Skilled Health Staff
% Pensioner Population Older than 64 Years
Total Social Security
Expenditure % of GDP
Bangladesh 97 98 8 N.A N.A.
India 81 90 35 – 1.8 (1990)
Nepal 85 78 9 – –
Pakistan 74 74 18 3.29 1.1 (1985)
Sri Lanka 94 97 94 15.70 4.7 (1990) Source: World Labour Report (2000). Income Security and Social Protection with Changing World. I.L.O
Geneva.
The table is reflective of the fact that Pakistan compared to the rest of SAARC
countries pays little attention to the extension of social security measures to its citizens wherein the poor emerge to be worst sufferers. The above simply is reflective of inadequacy of SSN to alleviate poverty.
IV. CONCLUDING REMARKS
An inordinately high level of poverty, negligible social safety measures and subdued economic performance are the inter-related major distinguishing features of Pakistan. Worse still, options with policy-makers to address these issues appear to be limited because of the choice of a specific growth strategy conditioned by stabilisation and structural adjustment and globalisation programmes which foreclose the repeat of the past performance for poverty alleviation, though some of those measures undertaken in the past were unsustainable and had temporary respite to begin with. Poverty situation during the past appears to have been favourably influenced by GDP growth, labour market tightness occasioned by emigration as well as domestic employment promotion and inflow of remittance which enhanced effective demand in the economy.
Given that the objectives of stabilisation more or less have been achieved, the foreign exchange reserves have shot up and remittances inflow has rebounded one should hope for improvement in the lives of poor. But this will depend upon a variety of complex factors. Reactivation of growth requires rise in investment particularly in the private sector which so far has not responded well even to lowering of interest rate. Failure of private investment to register a rise could be attributed to a number of factors including low level of PSDP. It is in this context that the policy-makers may ascertain the nature of relationship between PSDP and private investment. Upto a certain level it could
(42)
43
be symbiotic, thus a massive increase in PSDP appears imperative to reactivate growth. Given the newly acquired fiscal space despite the commitment that budget deficit must be contained within limits agreed with IMF it should be feasible to enhance PSDP.
High GDP growth must occur in the labour intensive sectors to generate employment which often acts as conduit for growth to influence poor. What should not be glossed over is the fact that a wedge has been driven between employment generation and poverty alleviation by low and declining wages in informal and other labour intensive sectors of the economy. Under the existing paradigm, labour is just a factor of production rather than social partner, and hence has to be priced by supply and demand forces. This has generated a phenomenon of rapid growth of working poor because the low wages fail to extricate the workers from poverty. Minimum wage legislation of 2001 was unique in the history of this country wherein rise in cost of living was not fully adjusted while fixing the minimum wages. At the same time, there is an urgent need to improve the productivity levels of these in the informal sector, so that they are pulled out of poverty.
Recent rise in remittance may not have the same effect on growth and poverty alleviation as was the case in 1980s. During the past the unskilled and semiskilled emigrants in the Middle East sent the remittances which were mostly spent on consumption and house construction activities. The current upsurge in the officially recorded inflow of remittances may be reflecting to some extent the substitution of erstwhile Havala transfer by banking channels thereby exaggerating the additionality of remittances inflow. Furthermore, emigrants in the Western countries which underwent an attitudinal change after 9-11 besides intensified scrutiny of Havala and Transfers also acted as a stimulant in this context. Most of these remittances emanating from West, which account for substantial portion of total, appear to have gone into real estate, hence imparting the depressed economy of Pakistan some features of a bubble economy.
Irrespective of the level of PSDP, the efficient deployment of resources has to be guaranteed. The governance structure ranging from resource allocation to implementation has to be improved. It will be premature to speculate about the impact of the efforts made to improve governance in the recent past, however, a clean departure from the past would necessitate that agents of change will have to become also the subject of change. Of course this constitutes a tall order.
(43)

44
Appendices
Appendix Table 1
Zakat Receipts (Rs Million)
Years
Total Deduction at
Source
Zakat Voluntarily
Paid Other
Receipts Total Zakat
Total Zakat/GDP
(%)
1980-81 844.25 1.6 – 845.9 0.31
1981-82 902.4 1.6 – 904.0 0.28
1982-83 1027.0 1.0 – 1028.0 0.28
1983-84 1490.0 1.0 – 1491.0 0.36
1984-85 1334.8 1.8 – 1336.6 0.29
1985-86 1521.0 1.7 – 1522.7 0.30
1986-87 1658.9 1.4 – 1660.3 0.30
1987-88 2069.5 2.4 0.3 2072.2 0.33
1988-89 2279.4 3.5 1.8 2284.7 0.32
1989-90 2573.2 3.5 0.8 2577.6 0.34
1990-91 2792.0 5.6 0.6 2798.2 0.31
1991-92 2770.3 8.3 0.2 2778.8 0.26
1992-93 2658.4 7.7 1.7 2667.8 0.22
1993-94 2844.4 7.4 1804.1 4655.9 0.33
1994-95 3073.2 9.9 47.5 3130.6 0.18
1995-96 3260.6 12.5 208.1 3481.2 0.18
1996-97 3805.5 13.0 78.4 3896.6 0.17
1997-98 4088.1 11.2 19.5 4118.8 0.16
1998-99 4061.2 16.0 2434.8 6512.0 0.23
1999-2000 4309.0 18.0 85.0 4411.0 0.15
2000-01 4276.0 11.0 88.0 4376.0 0.14 Source: State Bank of Pakistan (various issues) Annual Report.
(44)

45
Appendix Table 2
Net Primary Enrolment Rates in Pakistan and Provinces Total Boys Girls
1991 1996 1997 1999 1991 1996 1997 1999 1991 1996 1997 1999 Pakistan Total 46 44 42 42 53 49 46 47 38 38 37 37 Rural 41 39 37 37 50 47 43 43 31 31 30 30 Urban 59 55 55 57 61 56 56 58 57 55 55 56 Punjab Total 53 45 42 44 59 50 45 47 46 39 39 40 Rural 47 42 38 40 56 49 42 44 38 34 32 35 Urban 67 55 55 56 69 55 54 54 65 55 56 57 Sindh Total 39 45 45 41 45 50 51 47 33 39 39 35 Rural 32 35 37 29 41 45 46 37 21 24 28 21 Urban 51 57 57 60 51 58 58 63 50 57 56 57 NWFP Total 38 35 37 39 49 42 42 47 27 28 32 30 Rural 36 32 35 37 47 40 40 45 25 24 30 27 Urban 47 51 50 54 59 52 55 59 39 50 45 49 Balochistan Total 27 45 36 36 37 51 46 44 18 39 27 28 Rural 26 44 34 34 37 49 42 42 18 39 24 25 Urban 32 49 50 54 40 57 53 58 24 41 47 51
Source: Social Action Programme-SAPPII Mid-Term Review: Performance indicators 1991-99, Oxford Policy Management.
Note: T=Both Sexes; B=Boys; G-Girls.
REFERENCES
Ahmed, M. (1993) Choice of a Norm of Poverty Threshold and Extent of Poverty in Pakistan. The Journal of Development Studies 12: Peshawar.
Amjad, R., and A. R. Kemal (1997) Macroeconomic Policies and their Impact on Poverty Alleviation in Pakistan. The Pakistan Development Review 36:1, 39–68.
Arif, G. M. (2002) Measuring Poverty in Pakistan: A Critical Review of Recent Poverty Lines. Pakistan Institute of Development Economics, Islamabad. (Mimeographed.)
Booth, Charles, et al. (1902, 1903) Life and Labour of the People in London. London: MacMillon.
Cornia, Jolly, and Stewart (1988) Adjustment with Human Face: Ten Countries Case Studies. Vol. II. Oxford University Press.
Cox, D., and Z. Eser (1995) Family Safety Nets in Pakistan. Background paper for 1995 Pakistan Poverty Assessment. World Bank, Washington, D. C.
Ginneken, W. (1999) Social Security for Informal Sector: A New Challenge for Developing Countries. International Social Security Review 52:1.
Herskovites, Melville J. (1940) Economic Anthropology: A Study in Comparative Economics. New York: Knopf.
(45)
46
Irfan, M. (1999) The Structure of Informal Credit Market in Pakistan. Pakistan Institute of Development Economics, Islamabad. (Research Report No. 168.)
Irfan, M., and R. Amjad (1984) Poverty in Rural Pakistan. In A. R. Khan and Eddy Lee (ed.) Poverty in Rural Asia. Geneva, ILO.
Kemal, A. R. (2001) Debt Accumulation, Debt Servicing and Growth. The Bank of Punjab, Lahore.
Kemal, A. R. (2002) World Bank Assistant for Economic Policy Reforms and its Impact on Corruption in Pakistan. Pakistan Institute of Development Economics, Islamabad. (Mimeographed.)
Kemal, A. R. (2003) Structural Adjustment and Poverty in Pakistan. Pakistan Institute of Development Economics, Islamabad. (MIMAP Technical Paper Series No. 14.)
Malik, Sohail Jehangir (1999) Poverty and Rural Credit: The Case of Pakistan. Islamabad: Pakistan Institute of Development Economics.
Mingat, A., and D. Chuard (1996) Analysis of Dropout and Student Learning in Primary Education of Pakistan. Manila A.D.B.
Qureshi, S. K., and G. M. Arif (1999) Profile of Poverty in Pakistan. MIMAP Project, Pakistan Institute of Development Economics, Islamabad.
Ranis, G., and F. Stewart (1997) Growth and Human Development: Pakistan in Comparative Perspective. The Pakistan Development Review 36:4, 333–352.
Rimmer, Martin (2000) Reducing Poverty in Pakistan: Priorities for the Asian Development Bank. October. (Mimeographed.)
Rowntrees, B. S. (1922) Poverty, Study of Town Life. London and N. York: Longman. Soomro, G. Y. (2000) A Re-examination of Fertility Transition in Pakistan. The Pakistan
Development Review 39:3, 247–261. SPDC (1999) Social Development in Pakistan – Annual Review, Social Policy and
Development Centre, Karachi: Oxford University Press. Tahir, Pervez (1999) Poverty Alleviation Policies: A Historical Perspective. In A Profile
of Poverty in Pakistan. Mahbub-ul-Haq Centre for Human Development, Islamabad. February.
Talat, Anwar, and Sarfraz Khan Qureshi (2003) Trends in Absolute Poverty in Pakistan 1998-99 and 2001. Centre for Research on Poverty Reduction and Income Distribution, Islamabad.
Webb, Sidney, and Webb Beatrice (1909) The Public Organisation of the Labour Market. London: Longmans.
World Bank (2002) Pakistan: Poverty Assessment, South Asia Region, World Bank.
Zaidi, S. A. (1999) An Annotated Bibliography of Poverty in Pakistan. In Towards a National Poverty Strategy in Pakistan. UNDP, Islamabad.
(46)