Poverty and Social Exclusion in the UK · 2018-08-21 · Poverty and Social Exclusion in the UK...
44
Poverty and Social Exclusion in the UK Working Paper Analysis Series No. 2 Local Services Under Siege; attitudes to public services in a time of austerity Kirsten Besemer, Glen Bramley April 2012 ESRC Grant RES-060-25-0052
Transcript of Poverty and Social Exclusion in the UK · 2018-08-21 · Poverty and Social Exclusion in the UK...

Poverty and Social Exclusion in the UK
Working Paper Analysis Series No. 2
Local Services Under Siege; attitudes to public services in a time of austerity
Kirsten Besemer, Glen Bramley
April 2012
ESRC Grant RES-060-25-0052

Working Paper Analysis Series No.2 Local Services Under Siege
2
Poverty and Social Exclusion in the UK
Overview
The Poverty and Social Exclusion in the UK Project is funded by the Economic, Science and Research Council (ESRC). The Project is a collaboration between the University of Bristol, University of Glasgow, Heriot Watt University, Open University, Queen‘s University (Belfast), University of York, the National Centre for Social Research and the Northern Ireland Statistics and Research Agency. The project commenced in April 2010 and will run for three-and-a-half years.
The primary purpose is to advance the 'state of the art' of the theory and practice of poverty and social exclusion measurement. In order to improve current measurement methodologies, the research will develop and repeat the 1999 Poverty and Social Exclusion Survey. This research will produce information of immediate and direct interest to policy makers, academics and the general public. It will provide a rigorous and detailed independent assessment on progress towards the UK Government's target of eradicating child poverty.
Objectives
This research has three main objectives:
To improve the measurement of poverty, deprivation, social exclusion and standard of living
To assess changes in poverty and social exclusion in the UK
To conduct policy-relevant analyses of poverty and social exclusion
For more information and other papers in this series, visit www.poverty.ac.uk
This paper has been published by Poverty and Social Exclusion, funded by the ESRC. The views expressed are those of the Author[s].
This work is licensed under a Creative Commons Attribution-ShareAlike 2.0 UK: England & Wales License. You may copy and distribute it as long as the creative commons license is retained and attribution given to the original author.

Working Paper Analysis Series No.2 Local Services Under Siege
3
Contents Abstract ............................................................................................................ 4
Introduction ...................................................................................................... 5
Method ............................................................................................................ 7 Changes in public service delivery and attitudes ............................................. 6
Differences in attitudes to public services between socioeconomic and demographic groups ...................................................................................... 21 Local Services in Northern Ireland ................................................................. 32 Service Spending cuts.....................................................................................36 Conclusions.....................................................................................................39 Bibliography.....................................................................................................41

Working Paper Analysis Series No.2 Local Services Under Siege
4
Abstract
Recent austerity measures in the UK have resulted in major reductions in spending on local public services, which will have a significant impact on both the level and quality of local service provision. This paper presents a new analysis of people‘s attitudes to local services and discusses to what extent the degree and allocation of public service cuts reflects the priorities of the general population. In addition, we examine differences in attitudes between specific socioeconomic and demographic groups and between different locations within the United Kingdom. Overall, it was found that support for local services remains very high across the UK and has in some cases increased since 1999. Socioeconomic and demographic differences are mostly small, though older people do regard more services as ‗essential‘. Cultural services, more valued by middle class / higher income people are amongst those which have taken the larger cuts. Nevertheless, services which are widely supported as essential and widely used and valued across the socio-economic spectrum, such as libraries and sport/recreation, are taking substantial cuts as well. This paper also notes that major cuts to preventative services may imply greater costs in core services in the long run. Key words: public services, poverty, social exclusion, social policy, austerity measures, budget cuts, big society, public sector, social attitudes Authors: Kirsten Besemer, Institute of Housing, Urban and Real Estate Research, School of the Built Environment, Heriot-Watt University, Edinburgh EH14 4AS +44 131 451 4418 [email protected] Professor Glen Bramley, Institute of Housing, Urban and Real Estate Research, School of the Built Environment, Heriot-Watt University, Edinburgh EH14 4AS +44 131 451 4605 [email protected]

Working Paper Analysis Series No.2 Local Services Under Siege
5
Introduction
“This government will not cut [the] deficit in a way that hurts those we most need to help, that divides the country, or that undermines the spirit and ethos of our public services.”
(Keynote speech by David Cameron, at the launch of The Conservative party‘s manifesto in Milton Keynes, June 7th 2010)
The new Coalition Government‘s time in office since 2010 has been characterised by the institution of an almost unprecedented level of cuts in spending by local authorities and other public sector bodies. These austerity measures have resulted in major reductions in spending on local public services, which will have a significant impact on both the level and quality of local service provision (See Hastings, Bramley, Bailey, & Watkins, 2011 and the final section of this paper). There is a substantial cause for concern that the worst impacts of the budget cuts may be felt by the most deprived communities, households and individuals, as these groups are known to be most reliant on public services (M. Evans & Bramley, 2000).
Alongside the budget cuts, the Coalition Government has promoted the narrative of the Big Society as part of the vision by which the UK economy should be restructured. Big Society is conceived in opposition to an idea of a demonised Big Government or Big State and encompasses a broad range of measures aimed at transferring power and responsibility from national government to individuals, neighbourhoods and voluntary organisations (K. Evans, 2011). One of these measures constitutes a greater involvement of charities and other non-profit organisations in the delivery of public services, an idea which was, in fact, supported by all three mainstream parties. For example, in their 2010 election manifesto, Labour proposed ―[...] greater support for third-sector organisations in competing for public-sector contracts‖ as well as voluntary sector take-overs of ‗failing‘ schools, hospitals and police forces (The Labour Party, 2010). The Liberal Democrats arguably made the least mention of third sector issues in their pre-election campaign, but still alluded to greater voluntary sector involvement in the delivery of youth services (Liberal Democrats, 2010). It has been suggested that the involvement of the third sector in public service delivery could moderate some of the effects of the budget cuts, though the evidence that service delivery by third sector organisations is cheaper and more efficient is, at best, mixed (Andrews & Entwistle, 2010; Macmillan, 2010).
This paper will present a new analysis of people‘s attitudes to local services, and in particular of the extent to which they regard specific public services as essential. We examine differences between services and between different socio-demographic groups and locations. The data are derived from a recent Omnibus Survey which included special questions on this subject, as well as from earlier surveys and the

Working Paper Analysis Series No.2 Local Services Under Siege
6
long-running British Social Attitudes. We are also able to draw in new evidence on the pattern of spending cuts as they are beginning to affect local government services.
This analysis was written at a time when the austerity measures became particularly contentious. One of the many diverse explanations for the severe riots that spread through Britain in August 2011 was the effects of budget cuts on local services, especially for young people living in deprived areas. Though the connection between the UK riots and austerity measures is far from conclusive, research published shortly before the riots is suggestive. According to this research, over the last 90 years and across 25 different European countries, budget cuts above 2 per cent of GDP have typically been accompanied by a major surge in social instability (Ponticelli & Voth,2011). Others looking for connections between the riots and austerity measures have pointed out that some of the demographics involved in the riots have also been the worst affected by spending reductions. Young people from deprived areas stood out as the demographic most involved in the riots (Clifton, et al., 2011; Rogers, 2011). While without further evidence any connection to riots is highly speculative, this paper will present some evidence that services for young people have been subject to particular cutbacks, at a time when their job opportunities as new entrants to a weak labour market are particularly limited. Apart from age groups, households at the bottom of the income distribution also stand to lose most from the budget cuts, in absolute as well as relative terms (Browne & Levell, 2010). Evidence presented later in this paper also confirms that the scale of cuts in 2011 is generally greater in more deprived localities.
A major question at the moment is how people view public services, which public services most people prioritise, and what groups are likely to experience the strongest discontent when specific public services are reduced in response to budget cuts. This paper will examine to what extent the degree and allocation of public service cuts reflects the priorities of the general population. In order to do so, we consider the extent to which local services are considered ―essential‖ by different types of households in the United Kingdom. We will attempt to answer the following questions:
Has the value people place on local services changed since 1990? What factors might account for these changes?
Which local services are currently considered essential by most households?
Are certain services regarded as more, or less essential by specific socioeconomic or demographic groups? In particular: are poor people more likely to regard certain services as essential? And do attitudes towards public services change vary with age and location?
To what extent are attitudes towards public services related to political affiliation?
Which services, and which social groups are most likely to be affected by the projected budget cuts
To what extent does the distribution of projected cuts to public services reflect the priorities of the population.

Working Paper Analysis Series No.2 Local Services Under Siege
7
Method
This research is largely based on data from the Omnibus Survey, conducted in the United Kingdom in July 2011 by the independent social research institute – NatCen. Omnibus surveys permit researchers and others to ask a small range of questions to a large representative sample. The data was collected through face-to-face interviews with 1839 adults, in their own homes. The purpose of this part of the Omnibus in 2011 was to identify the items, activities and services that are necessary for an acceptable standard of living in Britain and Northern Ireland in 2011, according to the views of the adult population.
This paper also draws on previous analysis of the 1999 Poverty and Social Exclusion survey and the 1990 Breadline Britain Survey (Bramley, 1997, referring to 1990 survey; Fisher & Bramley, 2006, referring to 1999 survey). These two earlier surveys are similar to the Omnibus in that they include lists of widely used possessions, activities and local services. In the case of items and activities, respondents are asked to identify items they feel are necessary and ‗which all adults should be able to afford and which they should not have to do without.‘ For the list of local services, respondents identify which services they feel are ‗essential‘ and should be available. The overarching aim of this list of questions is to establish from a nationally representative sample what are perceived to be the necessities of life, so that different measures of poverty and social exclusion can be developed in relation to a widely shared definition of a basic standard of living. This system of poverty measurement is known as the consensual method, and was first developed by Mack and Lansley (1985). The consensual method of poverty measurement operationalises the assumption that a person is in 'poverty' when their standard of living falls below the minimum deemed necessary by current public opinion. This paper, however will restrict itself mainly to a discussion of one aspect of people‘s standard of living, i.e. access to public services.
Whilst this set of surveys provides broadly comparable results which cover a span of over 20 years, there are a number of small differences in methodology which should be noted. Although the surveys are nationally representative samples, which have been weighted to better represent the general population, there were some differences in sampling method between 1990, 1999 and 2011. Therefore, small discrepancies are possible, and may affect the temporal component of this analysis in a small way. However, as all three surveys ask the same basic question, and should be broadly representative, it can be assumed that significant differences are likely to represent true observations.
A further important point is that this analysis does not include a comprehensive range of local services. The public services included in this paper are chosen because they are included in at least two of the three surveys, and because they have the broadest range of users. The demographic analysis uses only the 2011 survey, which had a reduced list of local services compared to the two preceding

Working Paper Analysis Series No.2 Local Services Under Siege
8
ones. Local services which are targeted at a specific demographic, such as services for children, disabled and elderly people were therefore not included in this paper. Local services which are used by a wide range of people but which are not usually provided by the public sector, such as banks, petrol stations, pubs and cinemas, have been omitted from the 2011 survey as well. It should finally be noted that the results presented here mainly refer to Great Britain, but some comparisons can be made with Northern Ireland for 2011.
The findings of this research are contextualised through a discussion of budget reductions affecting the public services analysed. Information about ongoing austerity measures and their effect on public service delivery is partly derived from an ongoing scoping study by Hastings et al., (2011)which documents the scale and impacts of local authority spending cuts on deprived communities, particularly in England. In addition, data from the British Social Attitudes Survey has been used for a more detailed picture of public satisfaction with specific services, in particular the NHS and the educational system.

Working Paper Analysis Series No.2 Local Services Under Siege
9
Changes in public service delivery and attitudes
Figure 1 below shows the percentage of people who listed a specific public service as ‗essential and should be available‘ from a list of services. Medical services, i.e. doctor, dentist and hospital have been almost unanimously considered essential services throughout all three time points. Similarly, opticians, while not quite as widely supported, continue to be seen as essential by just over 80% of the population. Some of the other services do show some different levels of support over time. The next section will contextualise these changes by providing a short history of each of these local services since 1990.
FIGURE 1: PERCENTAGE OF PEOPLE WHO THINK PUBLIC SERVICES ARE 'ESSENTIAL' IN 1990, 1999 AND 2011

Working Paper Analysis Series No.2 Local Services Under Siege
10
DOCTORS, HOSPITALS AND OPTICIANS
As can be seen in
Figure 1, doctors and hospitals represent the most widely supported public service in this list, with over 90% of respondents considering such services essential. This support for NHS medical services has not changed significantly since 1990. Data from the British Social attitudes survey shows a similar picture. A considerable majority of the population supports higher government spending on the NHS. There seems to be a slight reduction in the number of people who feel additional spending on the NHS is required between 1996 and 2006 (which may well be due to the large spending increase which occurred between 2001 and 2006). However, only a very small minority wants public health spending to decrease.
FIGURE 2: WOULD YOU LIKE TO SEE MORE OR LESS GOVERNMENT SPENDING ON HEALTH?
Figure 1 and Figure 2 show that general support for public health services has remained consistently high for the last 2-3 decades. However, the NHS has undergone significant changes during this period. The first data point in figure 1, at 1990, came after a series of structural reforms by the conservative party in the 1980s. These reforms were initiated to improve the efficiency of the NHS. However, during the 1980s and 1990s, pressures on the NHS increased because of rising medicine costs, an ageing population, and increasing need for advanced technology (Warden, 1997; Zalmanovitch & Vashdi, 2010). As demand for NHS services continued to increase, the NHS experienced increasing shortages of funding.
Working Paper Analysis Series No.2 Local Services Under Siege
11
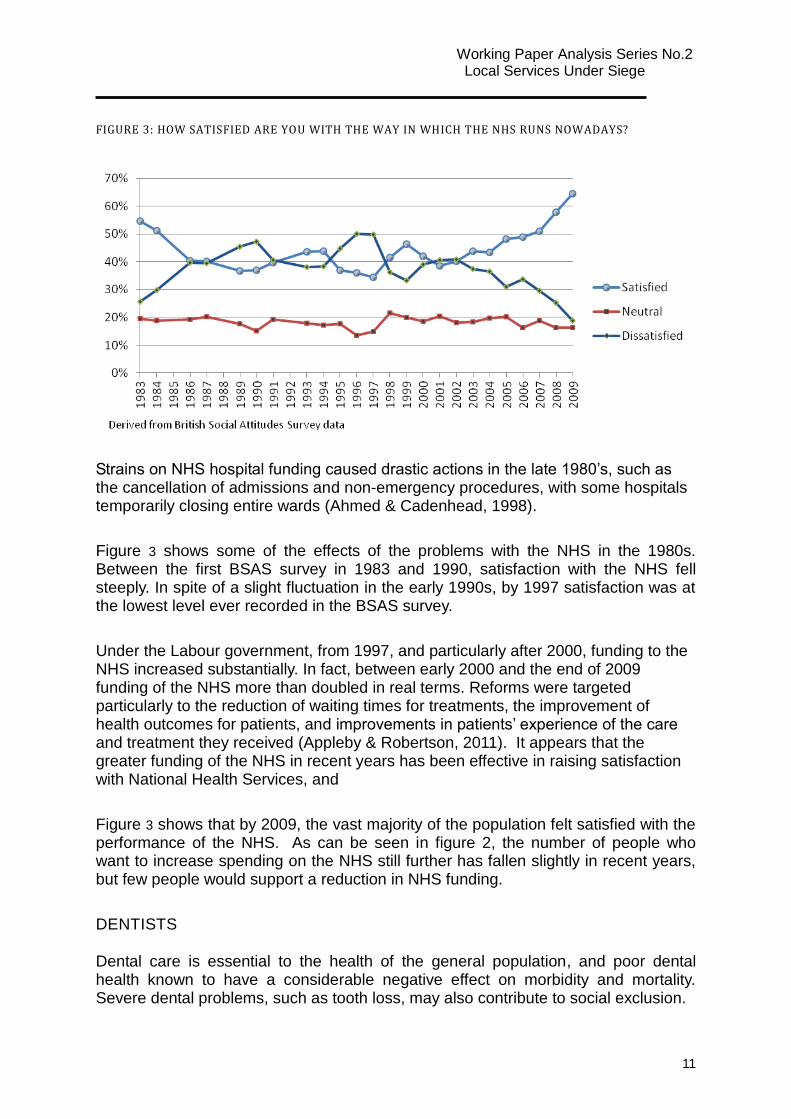
FIGURE 3: HOW SATISFIED ARE YOU WITH THE WAY IN WHICH THE NHS RUNS NOWADAYS?
Strains on NHS hospital funding caused drastic actions in the late 1980‘s, such as the cancellation of admissions and non-emergency procedures, with some hospitals temporarily closing entire wards (Ahmed & Cadenhead, 1998).
Figure 3 shows some of the effects of the problems with the NHS in the 1980s. Between the first BSAS survey in 1983 and 1990, satisfaction with the NHS fell steeply. In spite of a slight fluctuation in the early 1990s, by 1997 satisfaction was at the lowest level ever recorded in the BSAS survey.
Under the Labour government, from 1997, and particularly after 2000, funding to the NHS increased substantially. In fact, between early 2000 and the end of 2009 funding of the NHS more than doubled in real terms. Reforms were targeted particularly to the reduction of waiting times for treatments, the improvement of health outcomes for patients, and improvements in patients‘ experience of the care and treatment they received (Appleby & Robertson, 2011). It appears that the greater funding of the NHS in recent years has been effective in raising satisfaction with National Health Services, and
Figure 3 shows that by 2009, the vast majority of the population felt satisfied with the performance of the NHS. As can be seen in figure 2, the number of people who want to increase spending on the NHS still further has fallen slightly in recent years, but few people would support a reduction in NHS funding.
DENTISTS
Dental care is essential to the health of the general population, and poor dental health known to have a considerable negative effect on morbidity and mortality. Severe dental problems, such as tooth loss, may also contribute to social exclusion.

Working Paper Analysis Series No.2 Local Services Under Siege
12
Dental health has a considerable effect on quality of life and wellbeing; and dental anxiety and pain from tooth problems has may cause depression and other mental health problems (Coles, et al., 2011; McGrath & Bedi, 2002). There is a well-established, strong association between social deprivation and tooth problems (Fox; Jones & Worthington, 2000; McGrath & Bedi, 2002; Watt & Sheiham, 1999). However, while most healthcare in the UK is provided by the NHS (Calnan, 2000), dental care is an exception to this general rule. Since the late 1990‘s, there has been a considerable drop in the availability of NHS dental care. As can be seen in Figure 4, this period has also been marked by a long-term decline in levels of satisfaction with NHS dentistry, and only since 2004 has dissatisfaction remained relatively stable, with slight signs of improvement since 2008. Research has shown that the most important reasons for this long-term dissatisfaction is the poor availability of dentists which accept NHS patients (Appleby & Robertson, 2011; Hancock, Calnan, & Manley, 1999; McGrath, Bedi, & Dhawan, 2001).
FIGURE 4: HOW SATISFIED OR DISSATISFIED ARE YOU WITH THE NHS AS REGARDS NHS DENTISTS?
The decline in the availability of NHS dentists began in 1992, after the government cut the fees it paid to dentists for providing treatments to NHS patients. At the same time, charges for the use of NHS dental services increased. Dentists were quite critical of the funding reductions, which some felt reduced the quality of NHS dental care to an unacceptable level and made it difficult for dental practices to cope financially. In response, many dentists began to take on more private patients, and lowered the proportion of NHS patients they accepted (Calnan, Silvester, Manley, & Taylor Gooby, 2000; Hancock, et al., 1999). Between 1993 and 2003 the number of adults registered with an NHS dentist fell by 5.5 million. Areas of high social deprivation became those most severely affected by shortages of NHS dentists (Department of Health, 2005). The growth of private dentistry was also affected by other measures of the conservative government (1979-1997), including tax relief on private medical insurance for people over 60, the withdrawal of entitlement to free dental checks and tax reliefs to encourage people to opt out of the State Earnings Related Pension Scheme (SERPS) (Burchardt & Propper, 1999).
Working Paper Analysis Series No.2 Local Services Under Siege
13
The New Labour government, which came to office in 1997, tried to put in some reforms to reduce inequalities in access to dentistry and to reduce the shortage of NHS dentists. A strategy for reform was set out in 2000. The most important reforms were: to improve NHS Direct, the telephone medical advice service, so that it could better advice about available NHS dentists; to increase spending on NHS dentistry, particularly the modernisation and size of existing practices; and to open a small number of Dental Access centres to deliver care to patients who are not registered with a dentist (Department of Health, 2000). In spite of considerable investment, however, satisfaction with NHS dentistry has improved only a little over the last decade. As shown in Figure 1, the proportion of people who consider dentists an ‗essential‘ service is at over 90%, comparable to public support for doctors and hospitals. Delivery of NHS dentistry, however, continues to be much less satisfactory to the public than it was during the 1980s, and access to NHS dentists continues to be a problem in parts of the UK (Davies, 2008).
OPTICIANS
Opticians are considered an ‗essential service‘ by roughly 80% of the population, and as shown in Figure 1, this support has remained fairly constant over time. Like dental care, ophthalmology under the NHS was at first universal, but from 1985, NHS provision of spectacles was restricted to specific vulnerable groups, including children and young people and individuals on low income. In the late 1980s, the provision of NHS glasses was replaced by a scheme of vouchers that could be used to pay for glasses and lenses (Carol, 2000). Arguably, opticians are effectively part of the private healthcare system, with a small number of services, such as eye tests, partly or wholly funded by the NHS for a minority of users. Other ophthalmological services, such as cataract and glaucoma treatments, which are commonly carried out in hospitals are usually accessed through the NHS.
POST OFFICES
As shown in Figure 1, the percentage of people who consider a post office an essential service has fallen from 94% to 84% over the last ten years. The decline in support of the post office is perhaps to be expected, as the 1990‘s and particularly the early 21st century have seen a significant rise in alternatives to the traditional mail system, particularly internet-based forms of communication (Pintsov & Obrea, 2009). In addition, means of payment of benefit to many recipients have shifted away from traditional PO book, while access to general bank-accounts has become more widespread, if still not quite universal (Midgley, 2005). A wider range of bill payment methods has also become available to people, with much more use of direct debit. Additionally, online payment systems, such as those provided by most high street banks, as well as internet payment systems like PayPal have replaced older and less secure methods of sending money through the post office. As a consequence, the use of cheques and postal orders is in steady decline. The combination of these

Working Paper Analysis Series No.2 Local Services Under Siege
14
factors has caused a considerable reduction in the demand for postal services, causing post post offices to become increasingly unprofitable to run. Furthermore, in 1997, an EU directive required the UK to open up the mail delivery market to national and international competition. It has been argued that rural post offices, and post offices in deprived urban areas suffered the heaviest losses as a result of subsequent competition from companies such as DHL, TNT and the state-subsidised German Post Office (Comber, Brunsdon, Hardy, & Radburn, 2009). In fact, given the combined impact of these developments, the continuing strong support for post-offices at over 80% is noteworthy.
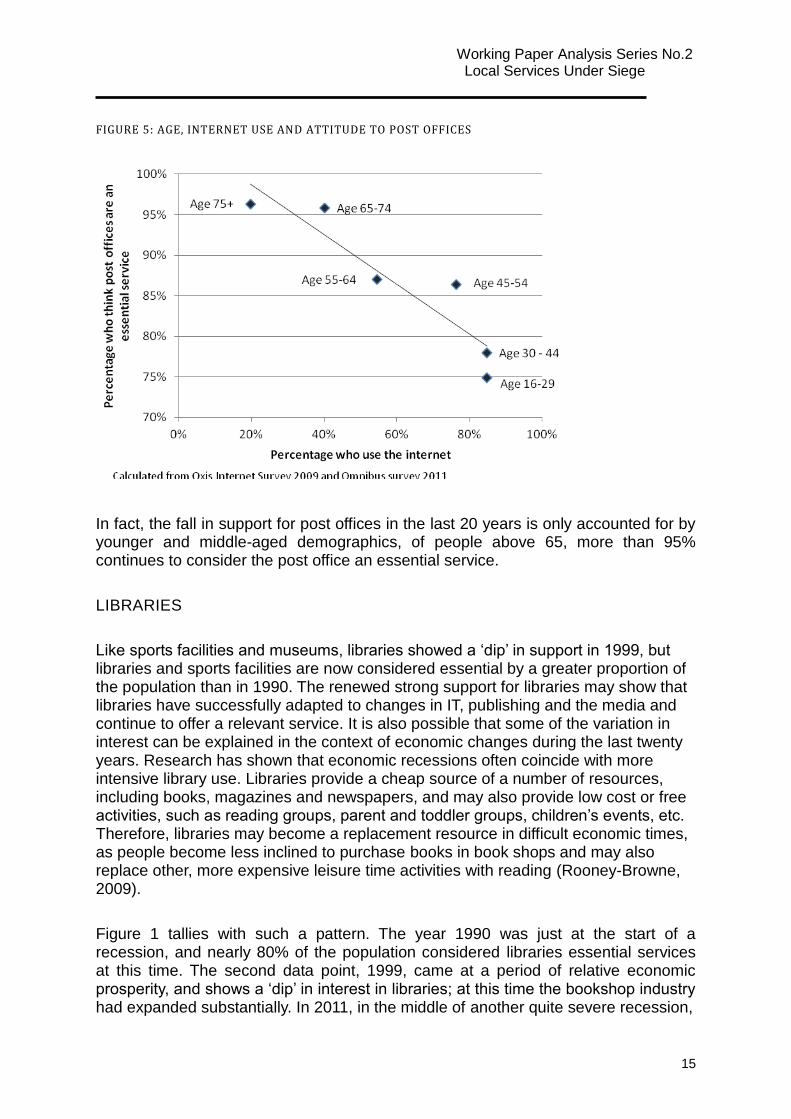
However, not all functions of the post office can be easily taken over either by internet-based communication or by private companies. Since the late 1990‘s Post Offices have been part of a national strategy of financial inclusion, by providing banking services to households and individuals without access to the traditional banking system (French, Leyshon, & Signoretta, 2008). In rural areas, post offices often double as the village shop, and provide not only postal and banking services, but may also function as a primary meeting place for local residents. Research has shown that people in rural areas not only regard their local shop as a service provider, but as a central focus for their community identity (Scarpello, Poland, Lambert, & Wakeman, 2009). Furthermore, access to the internet, as a replacement to the banking and postal delivery services provided by the post office, is far from universal. As shown in
Figure 5, older people are far more likely not to use the internet. For them, traditional mail remains an important method of communication. This demographic is much more likely to consider the Post Office an essential public service.
Working Paper Analysis Series No.2 Local Services Under Siege
15
FIGURE 5: AGE, INTERNET USE AND ATTITUDE TO POST OFFICES
In fact, the fall in support for post offices in the last 20 years is only accounted for by younger and middle-aged demographics, of people above 65, more than 95% continues to consider the post office an essential service.
LIBRARIES
Like sports facilities and museums, libraries showed a ‗dip‘ in support in 1999, but libraries and sports facilities are now considered essential by a greater proportion of the population than in 1990. The renewed strong support for libraries may show that libraries have successfully adapted to changes in IT, publishing and the media and continue to offer a relevant service. It is also possible that some of the variation in interest can be explained in the context of economic changes during the last twenty years. Research has shown that economic recessions often coincide with more intensive library use. Libraries provide a cheap source of a number of resources, including books, magazines and newspapers, and may also provide low cost or free activities, such as reading groups, parent and toddler groups, children‘s events, etc. Therefore, libraries may become a replacement resource in difficult economic times, as people become less inclined to purchase books in book shops and may also replace other, more expensive leisure time activities with reading (Rooney-Browne, 2009).
Figure 1 tallies with such a pattern. The year 1990 was just at the start of a recession, and nearly 80% of the population considered libraries essential services at this time. The second data point, 1999, came at a period of relative economic prosperity, and shows a ‗dip‘ in interest in libraries; at this time the bookshop industry had expanded substantially. In 2011, in the middle of another quite severe recession,

Working Paper Analysis Series No.2 Local Services Under Siege
16
attitudes to libraries are more positive than even in 1990.
However, the increasing level of public support for library services has not been reflected in national funding priorities. Between, 1986 and 1997, 179 library service points were closed, comprising 5.5% of all libraries. The majority of these closures were driven by budget cuts (Proctor & Simmons, 2000). Current budget cuts are likely to result in an even greater number of closures, as discussed in the last section of this paper. Libraries, culture & community learning were highlighted by 16% of local authorities as services with proportionately larger savings targets. Moreover, 10% of all local authorities named libraries as the cultural service that would be most severely affected by budget cuts (Hastings, et al., 2011).
SPORTS FACILITIES
Public sports and leisure facilities in the UK are typically provided at a low, subsidised charge by local authorities. Such facilities can include swimming pools, sports centres and golf courses. The presumption underlying the policy of subsidising access to sports is that cost can be a significant barrier for people in low income groups, while widespread participation in sports can have a number of positive externalities, including benefits to public health, neighbourhood renewal, social exclusion and reductions in antisocial behaviour (Coalter, 1993; Liu, 2009). It has been shown, however, that price is rarely a reason for non-use of public sports, and that other constraints, such as family and work commitments, travel distance and lack of interest are much more important (Coalter, 1993). It is likely that these latter factors, rather than price, account for the consistent pattern of under-representation of disadvantaged socio-economic groups in public sports activities in the UK (Bramley & Karley, 2007). Leisure facilities and services have been consistently overused by those with above average incomes for the last twenty years (Collins & Kay, 2003) In spite of an overall agenda of inclusive public sports provision, levels of participation in public sports have declined for younger people and disabled groups between 1997 and 2007 (Liu, 2009).
Over the late 1990‘s and into the new millennium, many public sports facilities have been subject to substantial quality improvements. These quality improvements were a consequence of a change in legislation in 1989, which made competitive tendering for the management of public sports facilities compulsory. Initially, service providers were chosen mostly in terms of their financial efficiency, but towards the late 1990‘s, organisations were increasingly required to prove their ability to manage quality of service provision in order to win contracts (Robinson, 2003). Further improvements in the quality of public sports facilities were made in response to the 1999 ―Best Value‖ policy in England and Wales, which explicitly required local authorities to perform against specific quality targets.
The late 1990‘s were also accompanied by a renewed interest in sport policy by the government, symbolised by the Labour government‘s inclusion of ―Sport‖ in the

Working Paper Analysis Series No.2 Local Services Under Siege
17
name of a government department (the Department for Culture, Media and Sport, DCMS). This interest heightened after the 2005 announcement of London as the host of the 2012 Olympics. It has been observed that renewed interest in sports due to the Olympics shifted the focus from public sports facilities as deliverers of wider societal goals to ‗sports for sports‘ sake‘ (Goodwin & Grix, 2011). A greater interest in sports caused by the London Olympic games may explain some of the increase in support for public sports activities observed between 1999 and 2011 (see Figure 1).
Overall, the pattern of support for public sports facilities is similar to that already observed in libraries, and could reflect a similar tendency for difficult economic times to encourage low-cost, council subsidised forms of leisure activity, while affluent times allow for greater use of private alternatives such as gyms and sports clubs. Research by the Irish Sports Council found that in Ireland, the relationship between participation and sports and the high employment levels during economic recession was complex. In the initial phase of recession, participation remained stable, which could reflect people initially maintaining their sporting habits after leaving employment and perhaps even increasing participation because of their additional free time. However, during the recession sports participation did fall marginally, presumably because those unemployed for a longer period of time would find it difficult to meet the costs to maintain participation. The same research also found that during recession people tend to switch from more expensive sports to less expensive sports (Lunn & Layte, 2008). This explanation also supports the pattern seen here. Due to unemployment during the current recession period, people have more time but less money to spend on sports. This could have resulted in the increased support of public sports facilities, which are typically much cheaper than private equivalents.
MUSEUMS
The UK has had a long, but not a continuous tradition of free entry to museums. Many of Britain‘s most well-known museums were founded in the late 19th century, and were built as part of the Victorian ideal of education for the masses, a goal which required wide access to the public (Wilkinson, 2003). The 1979–1997 Conservative governments held consistently to the view that the decision to charge for general admission should be made by museums themselves. During this period many museums began to charge for admission. The removal of general admission charges became an important Labour Party policy commitment in Opposition, and became Labour‘s flagship policy after their election in 1997 (Bailey & Falconer, 1998; Falconer & Blair, 2003). Charges were gradually reduced, first for specific groups and then universally. From the first of December 2001 the United Kingdom abolished admission charges in all national museums (Been, Visscher, & Goudriaan, 2002).
As can be seen in Figure 1, for museums and galleries, support has fallen considerably over the last 20 years, and now symbolically falls below the 50% level, perhaps meriting the label ‗minority interest‘. However, although support fell sharply to 1999, it appears to have at least partially recovered during the 2000s. This may

Working Paper Analysis Series No.2 Local Services Under Siege
18
reflect the positive impacts of the change from charging to free regimes in many museums, and also the significant enhancement in number, range and quality of museums as a result of Millennium and Lottery funding. Since the National Lottery began distributing funds in 1994, British and Northern Irish museums have received over £750m in funding.
Figure 6 gives a more detailed picture of how public opinion changed over this period. During the Thatcher years, the percentage of the population which wanted spending on the arts to increase grew from 13-27%. After 1991, opinion appears to have fluctuated somewhat, but by 1996, just before Labour came into government, the majority of people wanted spending on arts and culture to decrease. Over Labour‘s period of government, a growing number of people wanted spending on museums to stay the same but still nearly half wanted to spend less. These attitudes may help to account for the disproportionate level of cuts in cultural services, including museums, which appear to be being implemented by local authorities at the moment (see final section).
FIGURE 6: WOULD YOU LIKE TO SEE MORE OR LESS GOVERNMENT SPENDING ON CULTURE AND THE ARTS?
Source: British Social Attitudes Survey
Free access to museums was situated in Labour‘s central target of combating ―social exclusion‖, a word that became popularised during their time in office. Consequently, the term social inclusion has become widely adopted within the rhetoric of the UK museum sector (Sandell, 2003). This instrumental focus on museums reflects a diminishing confidence in the use of public funding to subsidise the cultural sector. Rather than funding culture from the belief that culture is important in its own right, it appears subsidies were justified by the expectation that cultural institutions would perform against policy objectives external to the sector itself (Gray, 2008).

Working Paper Analysis Series No.2 Local Services Under Siege
19
However, museums and galleries are not uncontroversial as promoters of social inclusion. According to Bourdieu's influential concept of cultural capital, museums may by their nature act to generate greater social exclusion and social stratification by upholding an arbitrary definition of high culture which is prioritised and exclusive of other forms of cultural expression. Bourdieu observed that class domination takes place through the passing on of such tacit cultural knowledge, tastes and behaviours that are acquired through participation in cultural leisure activities such as visits to museums (Bourdieu, 1984). Others have pointed out that museums‘ and art galleries‘ role in organising and reproducing class relationships can also be employed in more inclusive ways (Newman, McLean, & Urquhart, 2005; Savage & Bennett, 2005). By offering exhibitions that serve to educate and entertain a wide and diverse range of audiences, and by removing barriers that exclude access to specific groups, museums can arguably be a vehicle for social inclusion too. Thus, museums have been cast, contradictorily, as ‗temples of elitism‘ and as ‗utalitarian instruments of democratic education‘ (Bennett, 1995, p. 89). It is not clear that the Labour government‘s inclusionary policies have resolved the essential incompatibility between these two identities. In spite of all attempts to widen the appeal of museums and galleries, such leisure activities continue to appeal only to a select audience. Moreover, various studies have reported that admission fees have only a marginal effect on the representation of socioeconomic groups among museum visitors.
Research undertaken at the Museum of London even reported a better representation of low income groups after introducing entrance fees in the 1990s (O'Hagan, 1998).
EVENING CLASSES
The only service included in this analysis where the proportion considering it as essential has consistently fallen is evening classes. Like museums, evening classes are now considered essential by less than half of the population. This may reflect changing general education levels among the adult population, as well as cuts in subsidies and rising charges for such services, which tend to be regarded as ‗non-core‘ by the education authorities themselves.
Evening classes can fall into various categories, including classes that aimed to better equip people for the job market, e.g. classes in numeracy, literacy and computer skills, classes to help with daily life activities, such as cooking and parenting classes, and classes to contribute to people‘s ability to participate in leisure activities, e.g. dance or art classes . Whilst the latter may be viewed as less essential, such skills may add to a person‘s cultural capital, and can be of value in accessing economic and social positions and opportunities, making a case for helping less advantaged groups to participate. Subsidising such cultural leisure activities, however, has been argued to be of little success as a tool for widening the job opportunities of marginalised populations (Roberts, 2004).
The consistent fall in support for evening classes may be related to greater

Working Paper Analysis Series No.2 Local Services Under Siege
20
confidence in the educational system‘s ability to equip the population with the skills they need. Confidence in schools and the educational system is not included in Figure 1, as it was not included in the most recent PSE survey. However, data from the British Social Attitudes Survey, shown in Figure 7, shows that public confidence in education has consistently improved since 1991.
FIGURE 7: HOW MUCH CONFIDENCE DO YOU HAVE IN SCHOOLS AND THE EDUCATIONAL SYSTEM?
Source: British Social Attitudes Survey

Working Paper Analysis Series No.2 Local Services Under Siege
21
Differences in attitudes to public services between socioeconomic and demographic groups
The previous sections have frequently mentioned the associations between various demographic and socioeconomic characteristics and support for specific public services. The next sections will look at the effect of some of these characteristics in more detail.
TABLE 1: ESSENTIAL LOCAL SERVICES, BY AGE GROUP (BRITAIN)
Service 16 to 24 25 to 34 35 to 44 45 to 54 55 to 64 65 to 74 75 or more
Doctor 98% 98% 100% 99% 99% 99% 99%
Hospital with A & E 95% 97% 96% 97% 95% 97% 96%
Dentist 93% 96% 96% 96% 94% 95% 95%
Post Office 79% 75% 81% 86% 90% 95% 96%
Library 79% 85% 83% 83% 85% 88% 88%
Optician 78% 79% 80% 86% 85% 91% 90%
Public sports facilities 74% 80% 84% 84% 81% 85% 82%
Village hall 41% 44% 52% 56% 60% 71% 69%
Museum or gallery 31% 40% 40% 47% 49% 53% 52%
Evening class 31% 32% 39% 49% 54% 59% 61%
It has been previously discussed that while post offices are considered essential by over 95% of people over pension age, only 75% of people under 30 years old consider this service ‗essential‘. In fact, there are a number of other public services that are valued more by older generations than by young people. As can be seen in Figure 7 above, this applies to opticians, post offices, community / village halls, evening classes and museums. Services with near-universal support, such as hospitals, doctors do not show strong differences in attitudes by age groups.
To some extent, the differences above can be explained by differences in use. Opticians are more likely to be considered essential by older people, quite possibly because age is strongly associated with greater need for such services. As discussed earlier, post offices are also more likely to be used by older generations, partly because online alternatives to post office services are more accessible to younger age groups. Museums, galleries and village halls may be of greater interest to older age groups, whereas younger people may have a greater number of alternatives to such leisure time activities. It is interesting to note that sports activities do not show any clear correlation with age, even though it is expected that older age groups make less use of such services.

Working Paper Analysis Series No.2 Local Services Under Siege
22
Whereas the greater need for opticians, say, may be a continuing feature of greater age, the reliance on post offices (rather than use of the internet) could be seen as more of a ‗cohort effect‘. Future generations may show a different pattern as they will have acquired different skills, practices and lifestyles at a younger age. Therefore, the future prospects may be for a decline in the use, value and reliance place up on services such as post offices.
FIGURE 8: ESSENTIAL SERVICES IN BRITAIN, BY EMPLOYMENT STATUS
Figure 8 (above) shows the percentage of people who consider specific local services essential. On the vertical axis is the percentage of people who are of working age, unemployed and seeking work who consider a particular service essential, while the horizontal axis shows the percentage of employed people who consider the same service essential. A cursory glance shows that nearly all services are supported more by employed people than by unemployed people, although the different is marginal in some cases, while being most noticeable for libraries and sports. This finding seems counter-intuitive, as we might expect unemployed people to be more dependent on public services.
Other research has shown, however, that unemployed people are less likely to use quite a number of these services (Bramley & Smart, 1993; Fisher & Bramley, 2006). Whilst most of the services listed here are provided publicly by the council or at the national level, most have some costs associated with them, e.g. dentists, post offices, opticians, and sports facilities cost some money to use. Village halls may charge for some events that are held there, such as local clubs and societies.

Working Paper Analysis Series No.2 Local Services Under Siege
23
Furthermore, the use of local services may have travel costs associated with them. It may be that because some unemployed people feel they are unable to afford using these services, there is no need to provide them. A further hypothesis may be that services like libraries and sports facilities are seen as less essential because they meet ‗higher order needs‘ (Maslow ref) when unemployed people are under pressure to meet essentials like food.
GENDER AND THE EFFECT OF CHILDREN IN THE HOUSEHOLD
As can be seen in Figure 9 below, most services are more likely to be considered essential by women than by men. Almost all services are considered more essential by women, except sports facilities and doctors, which show no gender preference. Another interesting pattern that can be seen is that local services appear to come in three clusters, with medical services – including doctors, hospitals and dentists - getting near-universal support as essential services. The second cluster consists of Libraries, post office, sports facilities and opticians. The third cluster consists of community halls, evening classes and museums.
FIGURE 9: ESSENTIAL SERVICES, BY GENDER

Working Paper Analysis Series No.2 Local Services Under Siege
24
A potential reason for more women considering services essential could be that women may be more likely to be carers of children in the household, which may prompt them to consider other family members‘ requirement of these services to a greater extent. For example, they may use libraries not out of their own interest, but to get books for their children. Some of these services also have a social function, which may be valued more by women than by men. This may be both a gender preference and a reflection of the fact that many women spend more time at home or in the neighbourhood engaging in domestic and childcare activities, with less opportunities for work-based socialisation.
FIGURE 10: ESSENTIAL SERVICES, BY RURAL / URBAN LOCATION
While most rural / urban differences are so small as to be statistically insignificant, there are a number of services worth mentioning in this context. It appears that services for which rural urban differences are comparatively greater are either services for which rural areas tend to face much greater barriers to access, or
Working Paper Analysis Series No.2 Local Services Under Siege
25
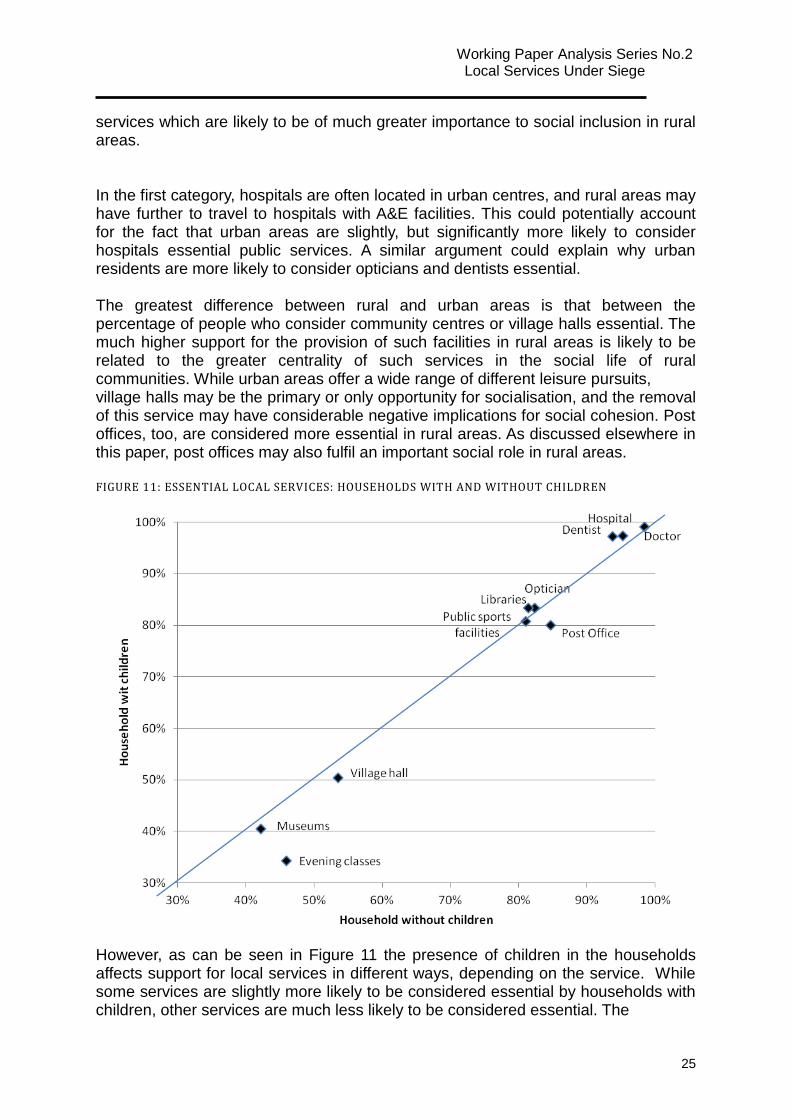
services which are likely to be of much greater importance to social inclusion in rural areas. In the first category, hospitals are often located in urban centres, and rural areas may have further to travel to hospitals with A&E facilities. This could potentially account for the fact that urban areas are slightly, but significantly more likely to consider hospitals essential public services. A similar argument could explain why urban residents are more likely to consider opticians and dentists essential. The greatest difference between rural and urban areas is that between the percentage of people who consider community centres or village halls essential. The much higher support for the provision of such facilities in rural areas is likely to be related to the greater centrality of such services in the social life of rural communities. While urban areas offer a wide range of different leisure pursuits, village halls may be the primary or only opportunity for socialisation, and the removal of this service may have considerable negative implications for social cohesion. Post offices, too, are considered more essential in rural areas. As discussed elsewhere in this paper, post offices may also fulfil an important social role in rural areas. FIGURE 11: ESSENTIAL LOCAL SERVICES: HOUSEHOLDS WITH AND WITHOUT CHILDREN
However, as can be seen in Figure 11 the presence of children in the households affects support for local services in different ways, depending on the service. While some services are slightly more likely to be considered essential by households with children, other services are much less likely to be considered essential. The

Working Paper Analysis Series No.2 Local Services Under Siege
26
difference is particularly large for evening classes, museums and village halls. It may be that households without children have more opportunity to make use of such leisure time activities, and possibly more need for the associated social contact. Families with children may be more likely to need a dentist or hospital. It is interesting to note that the difference is not very large for libraries and public sports facilities, both of which make considerable provision which is specifically geared towards children. EDUCATION
As there is a significant correlation between highest level of education and age, the following graph has been restricted to people aged 25-45. It is expected that most people in this age group will have finished their formal education (younger people are overrepresented in the lower educational groups because they have not yet finished their studies). It is quite clear that education has a considerable effect on the likelihood of considering local services essential. As was discussed earlier, museums have a greater appeal to specific socioeconomic groups, as can be seen here support for museums is strongly positively correlated with level of education. With many other services, it is interesting to see that postgraduate degree holders have significantly different preferences from even people with only a first degree. They appear to have much less support for post offices, possibly due to their greater access to online alternatives, as discussed earlier. Postgraduate degree holders have a much lower interest in evening classes, perhaps because their own educational needs have already been met, and with their higher earning potential, they may have good access to other leisure opportunities. This educational group is the only group more likely to support museums than village hall, possibly reflecting different leisure preferences.

Working Paper Analysis Series No.2 Local Services Under Siege
27
FIGURE 12: ESSENTIAL SERVICES BY EDUCATIONAL LEVEL

Working Paper Analysis Series No.2 Local Services Under Siege
28
FIGURE 13: PERCENTAGE OF ADULTS WHO CONSIDER SERVICES ESSENTIAL, BY POLITICAL AFFILIATION
Figure 13 above shows how political party affiliation is related to the perception that specific local services are essential. Note that the priorities shown here are those of people who say they support this particular party or ‗feel closer to it than any other party‘ – these are not the priorities of those specific parties themselves. Patterns that stand out are the significantly lower support of potential Liberal Democrat voters for post offices and community halls – this slightly surprising finding (given Lib Dem emphasis on local community issues) may be partly related to age and / or education. Conservative party supporters are less inclined to think sports facilities, museums and libraries essential.

Working Paper Analysis Series No.2 Local Services Under Siege
29
HOUSEHOLD INCOME
FIGURE 14: PERCENTAGE OF ADULTS WHO CONSIDER SERVICES ESSENTIAL, BY EQUIVALISED INCOME QUINTILE
Figure 14 shows the relationship between household income quintile and the opinion whether items from the list of local services are essential. To calculate these income quintiles, equivalised income has been used, i.e. the income of the household has been corrected for the expected requirements of the number of people in the household.

Working Paper Analysis Series No.2 Local Services Under Siege
30
Evening classes are one of the services that show a very large (but non-linear) income effect. Middle income groups appear to support these services most strongly, while the poorest quintile is least likely to consider this service essential. A number of the services show an ‗inverted U‘ pattern with greatest support in the middle income bands. This is consistent with the hypothesis that these services may have costs entailed in using them and that they may not be the highest priority for hard pressed households on low income. It is noteworthy that the richest quintile is more likely than the next quintile to consider museums and evening classes as essential, whereas this does not apply with opticians and community halls. Public sports facilities are much less likely to be considered essential by the poorest fifth, but both the top two quintiles are more likely than the middle income group to regard them as essential.
If the results are instead broken down by Indices of Multiple Deprivation Quintiles, a variable describing the level of poverty in the area, results are very similar to those discussed above. This suggests that household income is a more important determinant of support for local services than the level of poverty in the area.

Working Paper Analysis Series No.2 Local Services Under Siege
31
As can be seen in Figure 15, ethnicity has quite a strong effect on the kind of public services people are likely to consider essential. Nearly all services (barring hospitals, post offices and libraries) have a stronger support from White people than from ethnic minorities. This may be evidence of cultural barriers to service access, or possibly culturally inappropriate provision. It may also reflect a difficult-to-avoid situation where local services have adapted to the needs and preferences of long established majority communities.
FIGURE 15: ESSENTIAL SERVICES, BY ETHNICITY

Working Paper Analysis Series No.2 Local Services Under Siege
32
Local Services in Northern Ireland
Comparable data are only available for Northern Ireland in 2011. For most services, the differences between the countries of the United Kingdom are small, though the general trend appears to be that British people are slightly more likely to consider services essential than Northern Irish people, and Scottish people are slightly more likely to consider services essential than the English and Welsh. As a result, Village halls / Community Centres are slightly below the 50% cut-off point in Northern Ireland, while they are essential to a narrow majority in Britain. Another noticeable difference is museums and galleries, which are considered essential by only 28% of Northern Irish people. TABLE 2: ESSENTIAL PUBLIC SERVICES IN COUNTRIES OF THE UK
Scotland England & Wales Northern Ireland
Doctor 99% 99% 98%
Hospital with A & E 95% 96% 93%
Dentist 95% 95% 91%
Post Office 88% 83% 87%
Optician 83% 82% 78%
Public Sports facilities 85% 81% 75%
Library 86% 82% 74%
Village hall 59% 52% 48%
Evening classes 48% 42% 40%
Museum or gallery 45% 41% 28%
Figure 16 below shows differences within Northern Ireland itself. The differences are slight, but one pattern that stands out is that people in Belfast are slightly more likely than those in the rest of the country to consider libraries, evening classes and museums essential. This may be related to access, as such services are much more likely to be available in the city than in rural areas. There may also be a relationship with level of education. Post offices and village halls are slightly more highly rated outside of Belfast, which may be related to the role such services play in the social life of rural and small town communities.

Working Paper Analysis Series No.2 Local Services Under Siege
33
FIGURE 16: ESSENTIAL SERVICES IN NORTHERN IRELAND: BY AREA
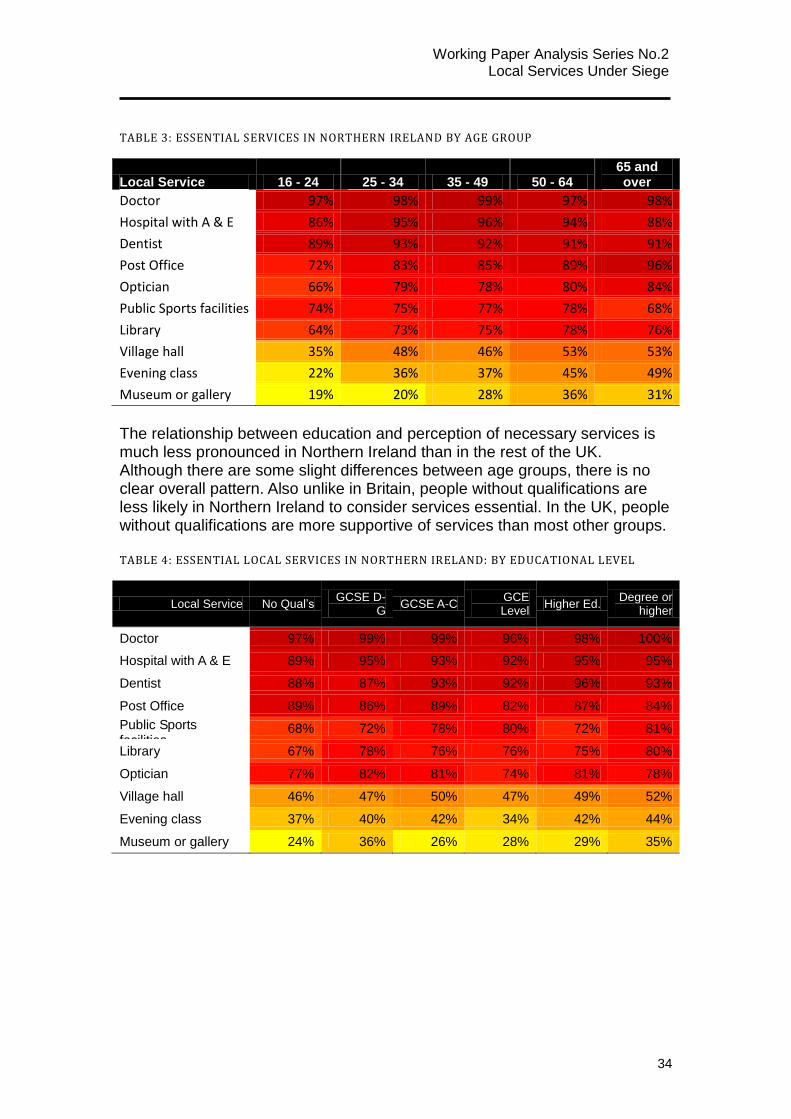
Just like in the rest of the UK, older people in Northern Ireland are more likely to consider services essential than younger people. Particularly with the most universally supported services, these differences are even greater in Northern Ireland, and it appears that most of the difference between Northern Ireland and Britain can be accounted for by the lack of support for local services among young people. Hospitals are interesting in this context. Hospitals are considered essential by more than 95% of British people in any age group, but are only considered essential by 86% of young Northern Irish people, and 88% of Northern Irish people over 65 years old.
Working Paper Analysis Series No.2 Local Services Under Siege
34
TABLE 3: ESSENTIAL SERVICES IN NORTHERN IRELAND BY AGE GROUP
Local Service 16 - 24 25 - 34 35 - 49 50 - 64 65 and over
Doctor 97% 98% 99% 97% 98%
Hospital with A & E 86% 95% 96% 94% 88%
Dentist 89% 93% 92% 91% 91%
Post Office 72% 83% 85% 89% 96%
Optician 66% 79% 78% 80% 84%
Public Sports facilities 74% 75% 77% 78% 68%
Library 64% 73% 75% 78% 76%
Village hall 35% 48% 46% 53% 53%
Evening class 22% 36% 37% 45% 49%
Museum or gallery 19% 20% 28% 36% 31%
The relationship between education and perception of necessary services is much less pronounced in Northern Ireland than in the rest of the UK. Although there are some slight differences between age groups, there is no clear overall pattern. Also unlike in Britain, people without qualifications are less likely in Northern Ireland to consider services essential. In the UK, people without qualifications are more supportive of services than most other groups. TABLE 4: ESSENTIAL LOCAL SERVICES IN NORTHERN IRELAND: BY EDUCATIONAL LEVEL
Local Service No Qual‘s GCSE D-
G GCSE A-C
GCE Level
Higher Ed. Degree or
higher
Doctor 97% 99% 99% 96% 98% 100%
Hospital with A & E 89% 95% 93% 92% 95% 95%
Dentist 88% 87% 93% 92% 96% 93%
Post Office 89% 86% 89% 82% 87% 84%
Public Sports facilities
68% 72% 78% 80% 72% 81%
Library 67% 78% 76% 76% 75% 80%
Optician 77% 82% 81% 74% 81% 78%
Village hall 46% 47% 50% 47% 49% 52%
Evening class 37% 40% 42% 34% 42% 44%
Museum or gallery 24% 36% 26% 28% 29% 35%

Working Paper Analysis Series No.2 Local Services Under Siege
35
FIGURE 17: ESSENTIAL SERVICES: GENDER DIFFERENCES IN BRITAIN AND NORTHERN IRELAND
Figure 17 shows gendered differences in both Northern Ireland and Britain. British people, indicated in red, are on the whole more likely to consider any service essential than Northern Irish people. Differences in gender are also greater in Britain than in Northern Ireland. In Northern Ireland men and women are equally likely to consider most services essential, with the exception of libraries and opticians. In Britain, women are slightly more likely to consider most services essential than men. On the whole, however, differences between the countries of the UK are small. The data does not suggest that people in Northern Ireland have markedly different opinions on what constitute essential services, with the possible exception that support for museums and galleries, while supported by less than half the population throughout the United Kingdom, is particularly low in Northern Ireland.

Working Paper Analysis Series No.2 Local Services Under Siege
36
Service Spending Cuts In the introduction to this paper we highlighted the issue that Government deficit reduction strategy entails an unprecedentedly large cutback in public spending on local and other services. In this section we highlight some features of the planned cuts and some emerging evidence on how these are being determined by local authorities across England, drawing on data obtained through a parallel study1.
From the Comprehensive Spending Review of October 2010 it was clear that local government services would have to take a large share of the cuts. There was to be a cut in central government grant to support revenue spending (excluding schools, including police & fire) from £28.5bn in 2010/11 to 26.1bn in 2011/12, and £22.9bn by 2014/15. That is successive annual cuts in cash terms of 11.4% in 2011/12, cumulating to 19.7% over 4 years. Excluding police and fire, the reduction is 28% in cash terms in real terms, such a cut may amount to as much as 40%. The figures may also be presented in terms of ‗spending power‘, which includes the contribution from (static) Council Tax revenue. . On this basis, the magnitude of the cut looks smaller, averaging 4.7% in the first year and 14% over four years (possibly 25% allowing for inflation). Local capital spending resources will be cut back to a similar or greater degree. The average cut is 30% over four years (possibly 40% in real terms).
For Schools, now mainly funded directly from DfE, there are small cash increases in revenue spend of between 0.8% and 1.8% pa over the four years. Allowing for inflation, however, we would say that schools will probably take a modest real-terms cut over the four years. They will also see a whopping 67.5% cutback in capital spending. The government also promised a small real terms annual increase in health spending, although this is a substantial reduction on the real terms growth typical of the 2000s; allowing for demographic and technological cost pressures and reorganisation costs the reality is likely to be real terms cuts.
One of the issues emerging from this recent analysis of the impact of the spending cuts in local government is the differential impact on more deprived localities. The reasons for this include the rapid rundown of specific grant programmes previously targeted on these areas, the high level of grant dependence of deprived areas, and the way damping arrangements have been used. Table 6 below shows the changes in spending power between 2010 and 2012 for unitary and urban authorities grouped into IMD ranking quintiles. . This shows a definite relationship with deprivation, particularly from 1 See Hastings, A., Bramley, G., Bailey, N. & Watkins, D. (2012) Serving Deprived Communities in a
Recession, York, Joseph Rowntree Foundation.

Working Paper Analysis Series No.2 Local Services Under Siege
37
the most deprived fifth of authorities who lose 15.4% to the second least deprived group who lose only 8.1%, although there is a somewhat higher average loss figure for the least deprived group (12.1%) - only a few unitary/urban councils are in this lowest deprivation quintile) .
TABLE 6: CHANGE IN SPENDING POWER FROM 2010/11 TO 2012/13 WITH NO DAMPING BY UNITARY AND URBAN AUTHORITIES
Quintiles % change___________ Most deprived 1 -15.4 2 -12.9 3 -10.0 4 -8.1 Least deprived 5 -12.1 ______________
(Source: Hastings et al (2012, Table 2.5)
However, the situation facing the most deprived local authorities is suggested in this study as a real cause for concern. These include Hackney (ranked 2, losing 27.7%), Islington (ranked 8, losing 26.2%), Knowsley (ranked 5, losing 23.8%), Liverpool (ranked 1, losing 20.0%), Tower Hamlets (ranked 3, losing 19.6%), Manchester (ranked 4, losing 19.2%), Newham (ranked 6, losing 17.8%). All of these losses of spending power figures are purely in cash terms, with no allowance for inflation. If the earlier estimate of 3% per annum applied, then the real terms cut for Liverpool would be 25%.
Parallel evidence can be drawn on the changes in actual budgets for spending now that these have been set and reported for 2011/12. Table 5 provides a summary analysis for those local authorities in England which provide the full range of services. The overall cash cut in one year is 5.2% or £92 per year per head of population. There is some relationship of the percentage cuts with level of deprivation, as the most and more deprived areas see cuts of 5.5-5.7%, while the middle group sees cuts of 3.9% and the least deprived group only cut by 2.7% (the second least deprived group cut rather more, by 5.9%). The pattern is even clearer in the per capita figures; the most deprived areas cut by £109 per head, compared with the average of £92, but the least deprived only cut by £41 per head. So the absolute reduction in expenditure is much greater in the most deprived localities than in the least deprived.
The table also shows the pattern in terms of cuts by service areas. In percentage terms the largest cuts appear to be in planning (which includes economic and community development), and in cultural and related services, followed by housing. Social care seems to be still seeing some increase in expenditure, while transport has a relatively low level of cut. In per capita terms, the largest cuts are in education (this refers to the remaining local government provision of support services, not the basic school budgets which are now separate). There is little evidence here that local authorities are able to concentrate their cuts on ‗central‘ (‗back office‘) services.

Working Paper Analysis Series No.2 Local Services Under Siege
38
TABLE 5: BUDGET SPENDING CHANGES FOR LOCAL GOVERNMENT SERVICES BY DEPRIVATION LEVEL AND SERVICE. (ALL PURPOSE AUTHORITIES IN ENGLAND, 2010/11 TO 2011/12, CASH TERMS)
By Deprivation Band % cut £/capita_ Most deprived 1 -5.5 -108.6 2 -5.7 -101.5 3 -3.9 -66.3 4 -5.9 -90.9 Least deprived 5 -2.7 -41.3 Average -5.2 -92.4___ By Service_______________________________________________ Education -5.8 -55.1 Transport -0.3 -2.8 Social Care 1.5 3.3 Housing -8.0 -10.0 Culture -10.0 -6.9 Envir.Regulations -4.9 -4.5 Planning -22.4 -15.2 Central -5.6 -5.1 All Services -5.2 -92.4___
(Source: Hastings et al (2012, Table 5.5)
Although the evidence just presented indicates that cuts in local government services are larger in more deprived areas, it is not necessarily the case that services which are more used by or targeted on deprived households are suffering the greatest cuts. Indeed, the study by Hastings et al shows a mixed picture but one where, overall, services which are more progressive/redistributive/pro poor are experiencing smaller cuts than services with the opposite characteristics. Examples of the former would include housing and social care; examples of the latter would include cultural and recreational services and planning. However, the interaction between the geographical impact of the cuts and geographical concentrations of poor households must inevitably mean that in such areas large groups who are relatively dependent on public provision are likely to see a marked reduction in service availability.
The relatively high level of cuts in cultural and related services (e.g. recreation, museums) is perhaps to be expected in this climate. Local authorities face difficult choices and it seems appropriate that they should try to protect services which are very important for the poor and vulnerable. The evidence presented earlier in this paper suggested that some of the cultural services – museums, evening classes - are no longer regarded as essential by majorities of the population. That helps to account for their being the target of significant cuts. However, the picture presented from the Omnibus survey is not one where all cultural services are regarded as inessential by majorities;

Working Paper Analysis Series No.2 Local Services Under Siege
39
important services within this group, particularly libraries and also sport and recreation, are regarded as essential by over 80% of the population. It turns out that the level of cut imposed on these services in 2011 by local authorities in England was 7.8% for libraries and 11.2% for sport and recreation; the former is slightly below the figure for cultural services as a whole, but both figures are well above the average cut of 5.2% across all local services. The cut for ‗other cultural services‘, which includes museums, evening classes and other items is 17.8% in one year; that is a fairly drastic level of cut, but can be seen to be correlated to some extent with the fact that less people support the idea of these services as being ‗essential‘. It may also be related to the fact that these services tend to be used more by the middle classes and less by the poor.
Another theme which emerges from the Hastings et al study, particularly from surveys of local authorities and qualitative interviews, is that there is a certain tendency for cuts to be quite highly concentrated in services geared to young people – educational support, Connexions (careers), youth service, as well as some of the cultural and recreational services mentioned above. One lens through which this may be viewed is the general issue of equity between age and generational groups, particularly when linked to the problems of difficulty of access to the labour market in recessionary conditions. While it is tempting to link this observation to the recent riots, as mentioned in the introduction, we have no evidence on which to base such a speculation.
This bias against certain types of service, such as youth services, may also be linked to a further theme of cuts focussed more on preventative and developmental services as opposed to crisis interventions. It is not necessarily a rational strategy to cut such services, in terms of the long term outcomes or cost-effectiveness, but it is a natural consequence of tendencies, in a financial crisis, to focus on ‗statutory‘ responsibilities and helping those in most acute or immediate need.
Conclusions
Support for most local services, in the sense of seeing them as being essential, remains very high and has in some cases increased since 1999. This is despite serious cutbacks facing local public services in Britain, and also despite several decades of the promotion of ideas about privatisation or the use of a greater diversity of service providers, including the currently promoted notion of the ‗Big Society‘.
Some changes observed may be explained by technological and associated societal changes. For example the rise of the internet and on-line forms of service access and communication may account for some decline in the proportion of adults regarding post offices as essential. The rising educational
Working Paper Analysis Series No.2 Local Services Under Siege
40
level of the population and perceived improved standards of schooling may account for the declining support for evening classes.
Currently the services considered fall into three groups. Firstly, considered essential by nearly everyone, come the NHS services of doctor, hospital and dentist (nothwithstanding that many people now experience difficulty accessing NHS dentistry). Furthermore, separate social attitudes survey data on satisfaction and willingness to spend supports the picture of strong support for health services. Secondly, a significant group of services including opticians, libraries, post offices and sports facilities, are considered essential by substantial majorities (over 80%). Thirdly, another group of services are closer the the margins between majority and minority support as ‗essential‘, and this includes community hall, evening classes and museums.
There is a strong relationship between attitudes to certain services (e.g. post office, library, community hall, evening classes) and older age. In some cases this reflects need but in other cases it may be a generational cohort effect associated with particular skills and and practices. There is a surprising tendency for poorer groups to be less likely to rate services as ‗essential‘, while typically it is middle income groups who are most likely to support them. There are some relationships with political affiliation, with for example Conservative supporters less likely to regard some services as essential. Perhaps more worrying is the significantly lower proportion of ethnic minority respondents seeing many services as essential, suggesting these services may not be culturally appropriate or easy to access.
The emerging pattern of budget cuts in local government shows that the absolute and proportional scale of cuts in local government expenditure in England is greatest in the most deprived localities. Since large concentrations of poorer people live in these areas they are likely in that sense to suffer more. However, in the way cuts have been applied across different services, there is some evidence of attempts to protect some more ‗pro-poor‘ services (e.g. social care). Services taking larger cuts can be characterised as both less ‗essential‘ and more likely to be used or valued by middle class/higher income people (e.g. cultural services). Nevertheless, services which are widely supported as essential and widely used and valued across the socio-economic spectrum, such as libraries and sport/recreation, are taking substantial cuts as well.
Another feature of the cuts is that services particularly used by young people seem to be taking a high level of cuts, perhaps partly because they are seen as ‗non-statutory‘. There is also a danger than more preventative services will lose out to core services which focus on the casualties when things go wrong.

Working Paper Analysis Series No.2 Local Services Under Siege
41
Bibliography
Ahmed, P. K., & Cadenhead, L. (1998). Charting the developments in the NHS. Health manpower management, 24(6), 222-228.
Andrews, R., & Entwistle, T. (2010). Does Cross-Sectoral Partnership Deliver? An Empirical Exploration of Public Service Effectiveness, Efficiency, and Equity. Journal of Public Administration Research and Theory, 20(3), 679-701.
Appleby, J., & Robertson, R. (2011). A healthy improvement? Satisfaction with the NHS under Labour. In A. Park, M. Phillips, E. Clery & J. Curtice (Eds.), Exploring Labour's Legacy - The 27th Report (pp. 73-102). London: Sage.
Bailey, S. J., & Falconer, P. (1998). Charging for Admission to Museums and Galleries: A Framework for Analysing the Impact on Access. Journal of Cultural Economics, 22(2), 167-177.
Been, I., Visscher, K., & Goudriaan, R. (2002). Fee or free? (Working Paper): Department for Culture Media and Sport (DCMS).
Bennett, T. (1995). The birth of the museum: History, theory, politics. Oxford: Routledge.
Bourdieu, P. (1984). Distinction: A social critique of the judgement of taste. London: Routledge & Kegan Paul.
Bramley, G. (1997). Who uses local services: need, demand and rationing in action. In D. King (Ed.), Local government economics in theory and practice. Cheltenham: Edward Elgar.
Bramley, G., & Karley, N. K. (2007). Homeownership, poverty and educational achievement: School effects as neighbourhood effects. Housing Studies, 22(5), 693-721.
Bramley, G., & Smart, G. (1993). Who benefits from local services: Comparative evidence from different local authorities. London: London School of Economics.
Browne, J., & Levell, P. (2010). The distributional effect of tax and benefit reforms to be introduced between June 2010 and April 2014: a revised assessment (IFS Briefing Notes). London: Institute for Fiscal Studies.
Burchardt, T., & Propper, C. (1999). Does the UK Have a Private Welfare Class? Journal of Social Policy, 28(04), 643-665.
Calnan, M. (2000). NHS and Private Health Care, The. Health Matrix, 10(3). Calnan, M., Silvester, S., Manley, G., & Taylor Gooby, P. (2000). Doing
business in the NHS: exploring dentists‘ decisions to practise in the public and private sectors. Sociology of Health & Illness, 22(6), 742-764.
Carol, P. (2000). The demand for private health care in the UK. Journal of Health Economics, 19(6), 855-876.
Clifton, H., Datoo, S., Burn-Murdoch, J., Cerutti, P., Jassat, F., Smith, A., et al. (2011). UK riots: the demographics of magistrate cases and convictions. The Guardian, (18/08/2011). Retrieved from http://www.guardian.co.uk/news/datablog/2011/aug/11/uk-riots-

Working Paper Analysis Series No.2 Local Services Under Siege
42
magistrates-court-list Coalter, F. (1993). Sports participation: price or priorities? Leisure Studies,
12(3), 171-182. Coles, E., Chan, K., Collins, J., Humphris, G. M., Richards, D., Williams, B., et
al. (2011). Decayed and missing teeth and oral-health-related factors: Predicting depression in homeless people. Journal of Psychosomatic Research, 71(2), 108-112.
Collins, M. F., & Kay, T. (2003). Sport and social exclusion. London: Psychology Press.
Comber, A., Brunsdon, C., Hardy, J., & Radburn, R. (2009). Using a GIS—Based Network Analysis and Optimisation Routines to Evaluate Service Provision: A Case Study of the UK Post Office. Applied Spatial Analysis and Policy, 2(1), 47-64.
Davies, P. (2008). The NHS Handbook 2008/09. London: The NHS Confederation.
Department of Health (2000). Modernising NHS dentistry - Implementing the NHS plan (Guidance Report No. 22266).
Department of Health (2005). Reforming NHS Dentistry: Thirtieth Report of Session 2004-05 (Report with Formal Minutes, Oral and Written Evidence No. 0215025245).
Evans, K. (2011). ‗Big Society‘ in the UK: A Policy Review. Children & Society, 25, 164 - 171.
Evans, M., & Bramley, G. (2000). Urban deprivation and government expenditure: where does spending go? In J. Bradshaw & R. Sainsbury (Eds.), Researching poverty. Studies and cash & care (pp. 160-190). Ashgate, Aldershot: Joseph Rowntree Foundation.
Falconer, P. K., & Blair, S. (2003). The Governance of Museums: a Study of Admission Charges Policy in the UK. Public Policy and Administration, 18(2), 71-88.
Fisher, T., & Bramley, G. (2006). Social exclusion and local services. In C. Pantazis, D. Gordon & R. Levitas (Eds.), Poverty and social exclusion in Britain (pp. 217-248). Bristol: University of Bristol.
Fox, C. Evidence summary: what is the effectiveness of alternative approaches for increasing dental attendance by poor families or families from deprived areas? British Dental Journal, 208(4), 167-171.
French, S., Leyshon, A., & Signoretta, P. (2008). ―All gone now‖: The material, discursive and political erasure of bank and building society branches in Britain. Antipode, 40(1), 79-101.
Goodwin, M., & Grix, J. (2011). Bringing structures back in: the ‗governance narrative‘, the ‗decentred approach‘ and ‗asymmetrical network governance‘ in the education and sport policy communities. Public Administration, 89(2), 537-556.
Gray, C. (2008). Instrumental policies: causes, consequences, museums and galleries. Cultural Trends, 17(4), 209-222.
Hancock, M., Calnan, M., & Manley, G. (1999). Private or NHS general dental service care in the United Kingdom? A study of public perceptions and experiences. Journal of Public Health, 21(4), 415-420.
Hastings, A., Bramley, G., Bailey, N., & Watkins, D. (2011). Serving deprived

Working Paper Analysis Series No.2 Local Services Under Siege
43
communities in a recession. Unpublished draft report on scoping study. University of Glasgow & Heriot-Watt University.
Jones, C. M., & Worthington, H. (2000). Water fluoridation, poverty and tooth decay in 12-year-old children. Journal of Dentistry, 28(6), 389-393.
Liberal Democrats (2010). Liberal Democrat Manifesto 2010. Liu, Y.-D. (2009). Sport and Social Inclusion: Evidence from the Performance
of Public Leisure Facilities. Social Indicators Research, 90(2), 325-337. Lunn, P., & Layte, R. (2008). The Irish Sports Monitor. Dublin: The Economic
and Social Research Institute (ESRI). Mack, J., & Lansley, S. (1985). Poor Britain. London: George Allen & Unwin. Macmillan, R. (2010). The third sector delivering public services: an evidence
review (Working Paper No. 20). Birmingham: Third Sector Research Centre
McGrath, C., & Bedi, R. (2002). Population based norming of the UK oral health related quality of life measure. British Dental Journal, 193(9), 521-524.
McGrath, C., Bedi, R., & Dhawan, N. (2001). public dental health: Who has difficulty in registering with an NHS dentist? - A national survey. Br Dent J, 191(12), 682-685.
Midgley, J. (2005). Financial inclusion, universal banking and post offices in Britain. Area, 37(3), 277-285.
Newman, A., McLean, F., & Urquhart, G. (2005). Museums and the active citizen: Tackling the problems of social exclusion. Citizenship Studies, 9(1), 41-57.
O'Hagan, J. W. (1998). The state and the arts: An analysis of key economic policy issues in Europe and the United States. Cheltenham, UK: Edward Elger.
Pintsov, L. A., & Obrea, A. (2009). Postal reform and product innovation. In M. A. Crew, P. R. Kleindorfer & J. I. Campbell Jr (Eds.), Handbook of worldwide postal reform (pp. 176-192). Cheltenham, UK: Edward Elgar Publishing Ltd.
Ponticelli, J., & Voth, H.-J. (2011). Austerity and Anarchy: Budget Cuts and Social Unrest in Europe, 1919-2009 (CEPR Discussion Paper No. 8513). London: Centre for Economic Policy Research.
Proctor, R., & Simmons, S. (2000). Public library closures: the management of hard decisions. Library Management, 21(1), 25-34.
Roberts, K. (2004). Leisure inequalities, class divisions and social exclusion in present-day Britain. Cultural Trends, 13(2), 57 - 71.
Robinson, L. (2003). Committed to quality: the use of quality schemes in UK public leisure services. Managing Service Quality, 13(3), 247-255.
Rogers, S. (2011). Mapping the riots with poverty. The Guardian, (10/08/2011). Retrieved from http://www.guardian.co.uk/news/datablog/interactive/2011/aug/10/poverty-riots-mapped
Rooney-Browne, C. (2009). Rising to the challenge: a look at the role of public libraries in times of recession. Library Review, 58(5), 341-352.
Sandell, R. (2003). Social inclusion, the museum and the dynamics of sectoral change. Museum and Society, 1(1), 45-62.

Working Paper Analysis Series No.2 Local Services Under Siege
44
Savage, M., & Bennett, T. (2005). Editors‘ introduction: Cultural capital and social inequality. The British Journal of Sociology, 56(1), 1-12.
Scarpello, T., Poland, F., Lambert, N., & Wakeman, T. (2009). A qualitative study of the food related experiences of rural village shop customers. Journal of Human Nutrition and Dietetics, 22(2), 108-115.
The Labour Party (2010). The Labour Party Manifesto 2010: A future fair for all.
Warden, J. (1997). Health department admits to NHS funding crisis. BMJ, 314(7092), 1433.
Watt, R., & Sheiham, A. (1999). Health policy: Inequalities in oral health: a review of the evidence and recommendations for action. Br Dent J, 187(1), 6-12.
Wilkinson, H. (2003). To Charge or not to Charge – Museums' Admission Dilemma (Report). Thatcham, Berkshire, UK: Tourism Insights / VisitBritain
Zalmanovitch, Y., & Vashdi, D. R. (2010). Shrinking budgets, improving care: Trade-offs are unavoidable. BMJ, 340.