Potential systematic biases in the treatment of · PDF filePotential systematic biases in the...
23
RWE Power International PAGE 1 Potential systematic biases in the treatment of LCP Ian Rodgers & Ugo Gasparino RWE npower Stephen Griffiths E.On Engineering Eric Joos EDF R&D
-
Upload
vuongquynh -
Category
Documents
-
view
214 -
download
1
Transcript of Potential systematic biases in the treatment of · PDF filePotential systematic biases in the...
RWE Power International PAGE 1
Potential systematic biases in the treatment of LCP
Ian Rodgers & Ugo Gasparino RWE npowerStephen Griffiths E.On EngineeringEric Joos EDF R&D
RWE Power International PAGE 2
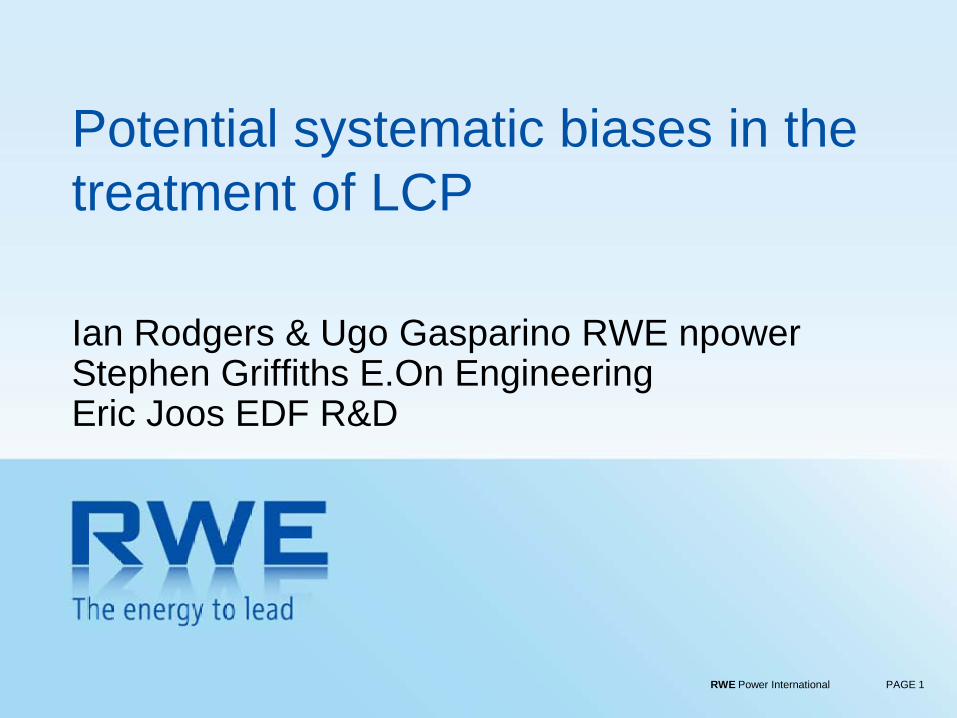
LCP have different source and location characteristics compared with other source types
RWE Power International PAGE 3
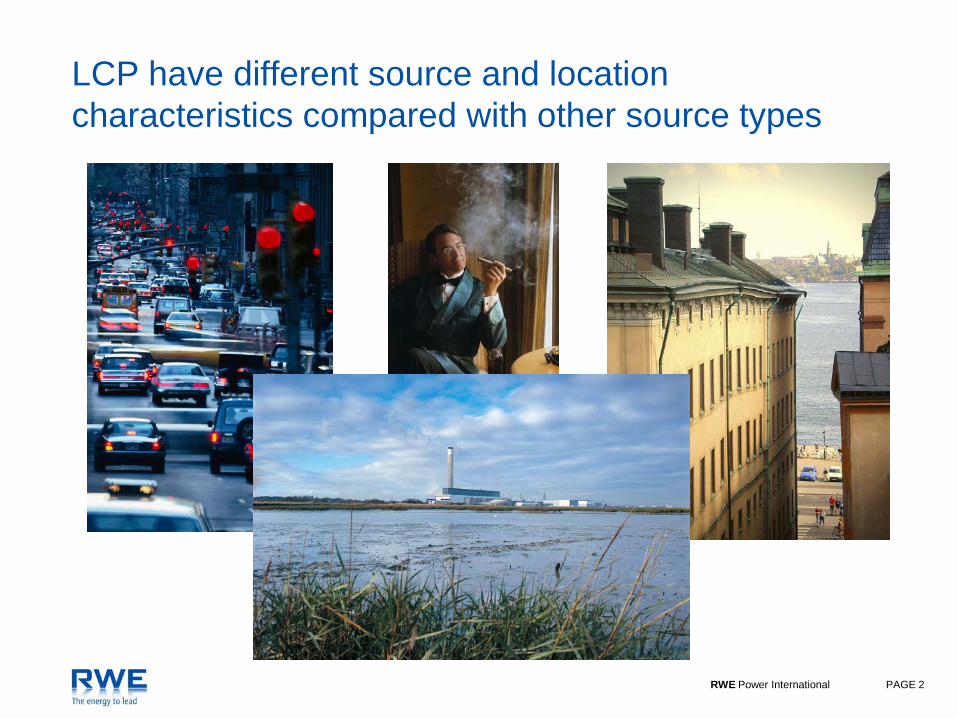
Outline
> Key differences between high-level and low-level sources
> Results from CASES and NEEDS (EcoSense)
– Implications for sectoral contribution to exposure
> Relative toxicity of particulate components; implications for quantification of effects of LCP emissions
> A simple model for building differential toxicity into GAINS
> Recommendations
RWE Power International PAGE 4
Use of EcoSenseWeb to assess effects differences between high and low-level emissions
RWE Power International PAGE 5
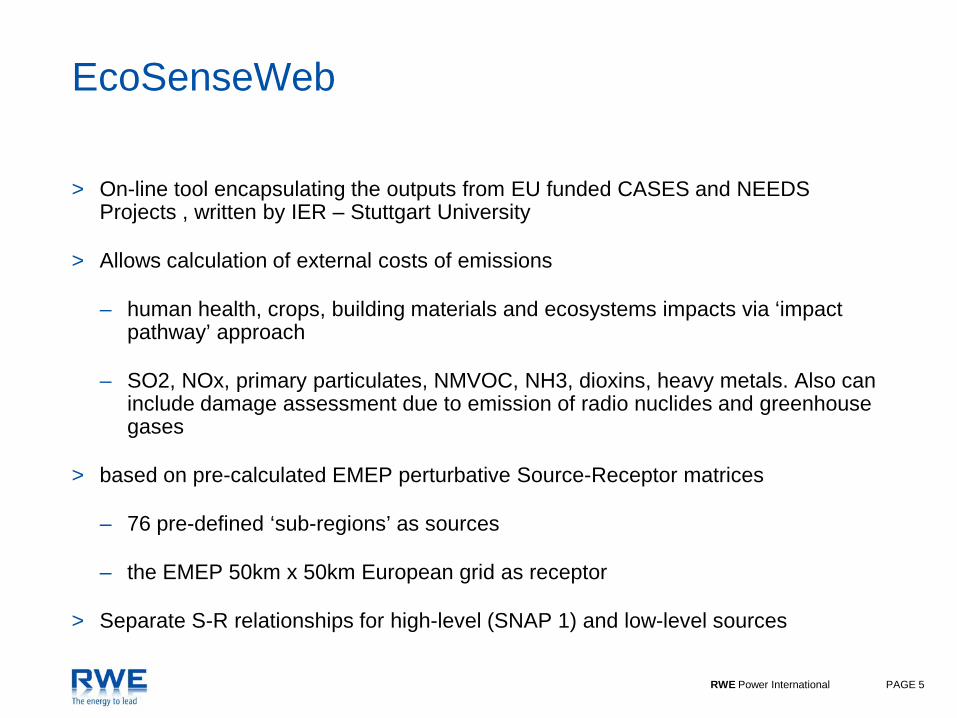
EcoSenseWeb
> On-line tool encapsulating the outputs from EU funded CASES and NEEDS Projects , written by IER – Stuttgart University
> Allows calculation of external costs of emissions
– human health, crops, building materials and ecosystems impacts via ‘impact pathway’ approach
– SO2, NOx, primary particulates, NMVOC, NH3, dioxins, heavy metals. Also can include damage assessment due to emission of radio nuclides and greenhouse gases
> based on pre-calculated EMEP perturbative Source-Receptor matrices
– 76 pre-defined ‘sub-regions’ as sources
– the EMEP 50km x 50km European grid as receptor
> Separate S-R relationships for high-level (SNAP 1) and low-level sources

RWE Power International PAGE 6
EcoSenseWeb application – low versus high emissions> EcoSenseWeb has been used to examine the external damage costs of unit
emissions of SO2 and NOx from a particular region in the south of the UK
> Case study 1: locational sensitivity
– Additional emissions from north of UK
– Additional emissions from south of UK
> Case study 2: source height sensitivity
– additional emissions from high level sources
– Additional emissions from low-level sources
> Case study 3: differential toxicity sensitivity
– Influence of relative toxicity of different particulate components
• 0.5 nitrates, 0.7 sulphates, 1.3 primary PM
RWE Power International PAGE 7
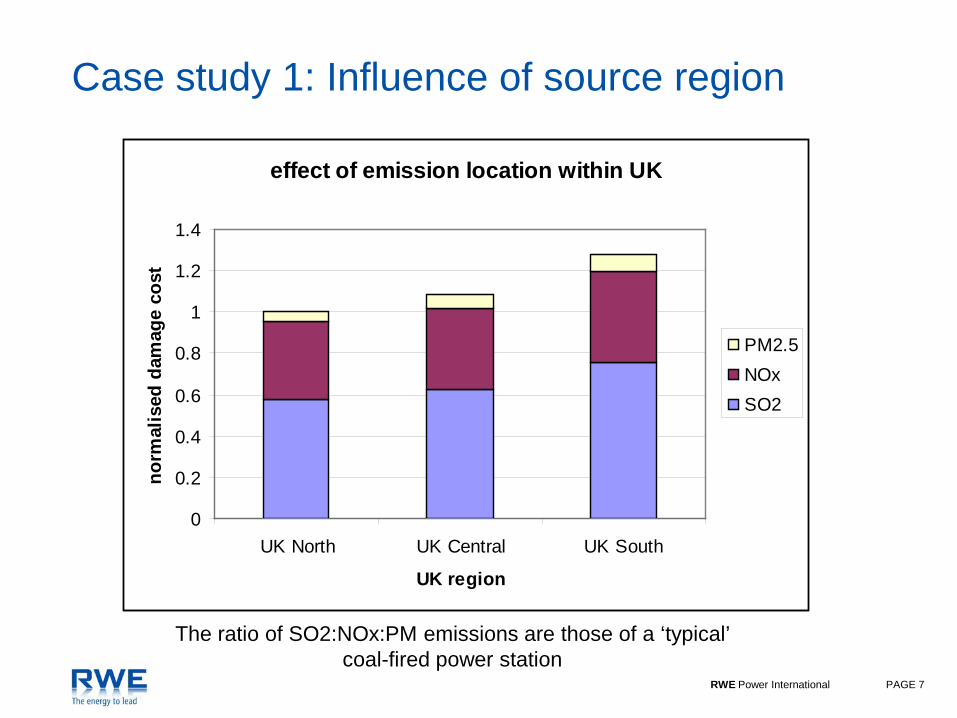
Case study 1: Influence of source region
effect of emission location within UK
0
0.2
0.4
0.6
0.8
1
1.2
1.4
UK North UK Central UK South
UK region
norm
alis
ed d
amag
e co
st
PM2.5NOxSO2
The ratio of SO2:NOx:PM emissions are those of a ‘typical’ coal-fired power station
RWE Power International PAGE 8
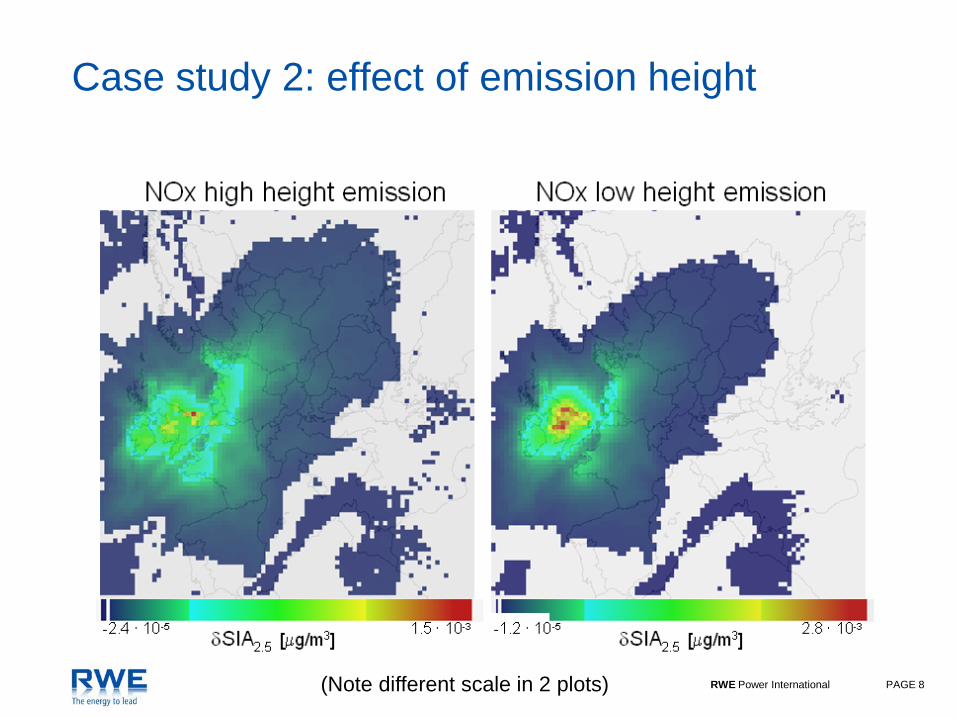
Case study 2: effect of emission height
(Note different scale in 2 plots)

RWE Power International PAGE 9
Influence of emission height on damage cost
comparison of high v low level emission
0
0.5
1
1.5
2
UK North UK Central UK South
UK region
norm
alis
ed d
amag
e co
st
High sourceLow source
Same annual mass emission in all cases
RWE Power International PAGE 10
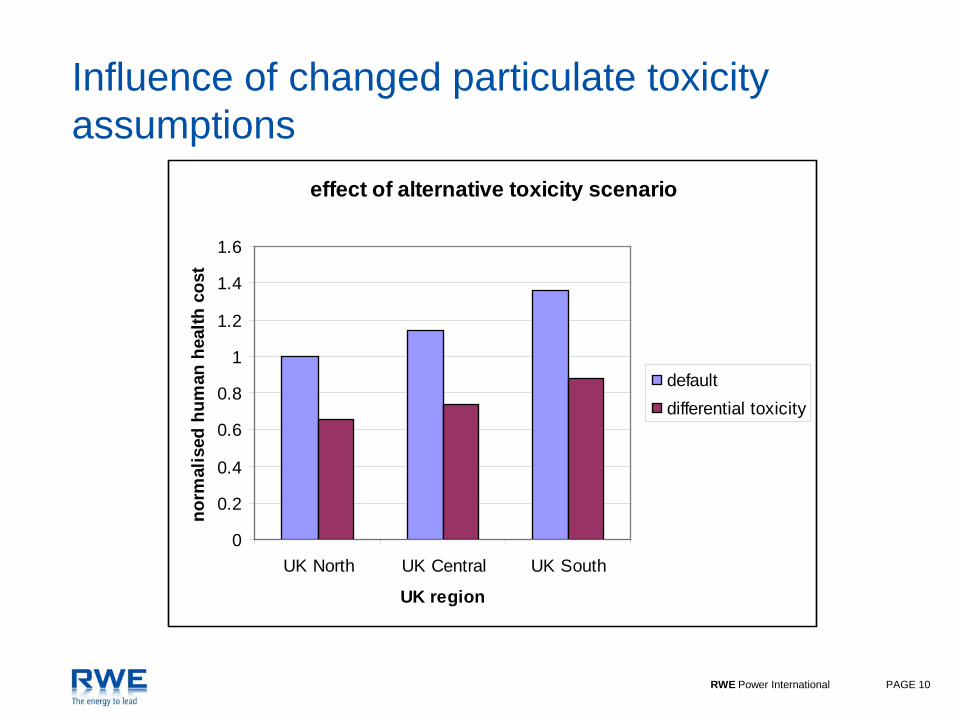
Influence of changed particulate toxicity assumptions
effect of alternative toxicity scenario
0
0.2
0.4
0.6
0.8
1
1.2
1.4
1.6
UK North UK Central UK South
UK region
norm
alis
ed h
uman
hea
lth c
ost
defaultdifferential toxicity

RWE Power International PAGE 11
EcoSenseWeb model results
> Average externalities for a power station located in the ‘UK –Northern region’ are found to be significantly lower than those associated to the same facility when located in the ‘UK – Southern region’ (a factor of ∼30% for SO2, ∼15% for NOx and about a factor two for primary particulate, the last mainly reflecting the lower population density ‘along the dispersed plume’);
> The EcoSenseWeb results, based on the EMEP Source-Receptor matrices, tend to show that the impacts from ‘low level’ emissions are significantly higher (20-40%) then those that would originate if the same amount of pollutants were emitted from a ‘high stack’, even in the case of SO2 and NOx (whose impact is mainly related to ‘long-range’ secondary particulate).

RWE Power International PAGE 12
Potential improvements for integrated assessment models> EcoSenseWeb study showed significant differences depending on
where within a country the emission is made
> Study showed that use of different source-receptor relationships for LCP and other sectors results in significant differences in effects
> Study showed that use of reasonable alternative health hypotheses for particulate toxicity results in significant differences in benefits
Use of country-to-grid relationships could lead to errors in assessment of LCP environmental effects
Use of separate S-R relationships for LCP and other sources needed to ensure correct targeting of emission reductions
Need for sensitivity studies to alternative reasonable health hypotheses to ensure costs are targeted where they will have greatest benefits

RWE Power International PAGE 13
Consistent with TFMM EuroDelta results
> EcoSenseWeb results show a similar picture to those from EuroDelta presented at last TFIAM, which highlighted the greater ‘efficiency’ of emission reduction from low level sources for effects reduction
> Policy implications are the same: if the relative environmental effectiveness of emission reductions from LCP and other sources is not correctly represented in the integrated assessment modelling, then emission ceilings may not reflect the most cost-effective way to attain environmental targets

RWE Power International PAGE 14
Fine PM health impact
How might GAINS calculations be improved?
RWE Power International PAGE 15
Committee on the Medical Effects of Air Pollution (COMEAP) recently-published report ‘Long-term exposure to air pollution: effect on mortality’
> ‘in the absence of clear evidence to the contrary we consider that the recommended coefficient should apply equally to all components of PM2.5’
> ‘this is not to say that all components of PM2.5 do have the same toxicity – but, rather, that there is not, at present, evidence to quantify different components differently, in a way that would gain wide consensus’
> ‘this is clearly an area that requires further study’
> Recommendation is consistent with the WHO/Convention task force recommendation
RWE Power International PAGE 16
Arguments for testing the status quo
> Prof P Hopke, COMEAP peer review comments : ‘This report continues lines of very conventional thinking with regard to the mechanisms of causality by particles. How can one really think that ammonium sulphate or ammonium nitrate will start a catastrophic chain of events leading to death?’
> WHO Bonn workshop, Fintan Hurley: ‘While accepting that it is currently not possible to quality precisely any differences in PM toxicity, some differential quantification is recommended, at least as sensitivity analyses… It may be unwise to wait until the evidence for differential quantification is compelling.’
> NEEDS comprehensive review: ‘we think that it is progressive to attempt differential quantification, including of different kinds of particles, even when the evidence to support differential quantification is limited, rather than simply use as default an assumption which is widely believed to be wrong, i.e. that, within a given size range, all particles have similar toxicity’
RWE Power International PAGE 17
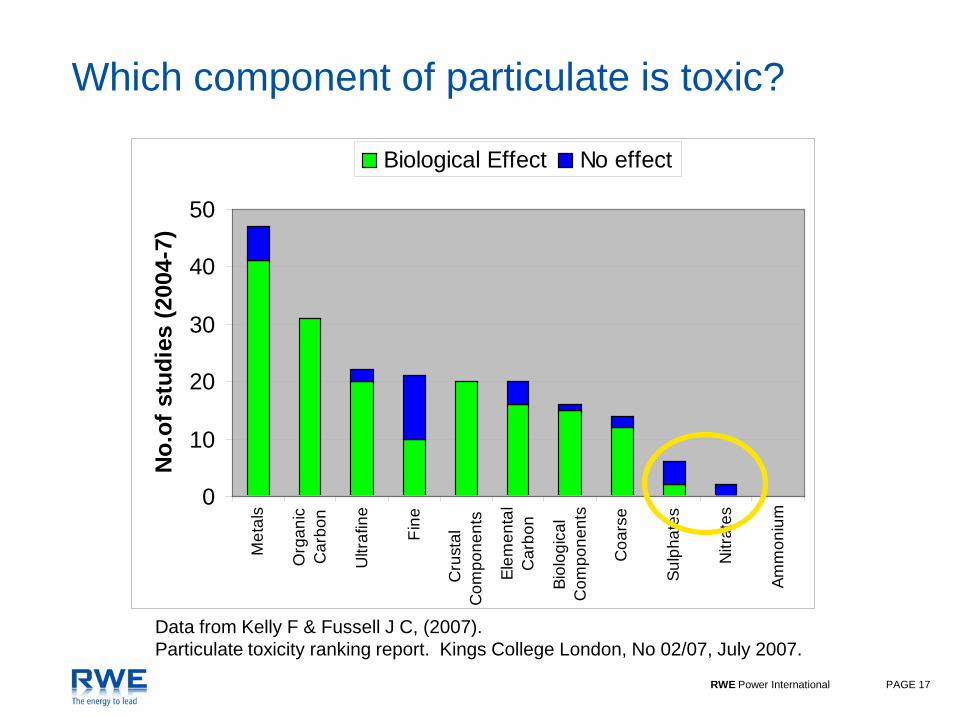
Which component of particulate is toxic?
Data from Kelly F & Fussell J C, (2007). Particulate toxicity ranking report. Kings College London, No 02/07, July 2007.
0
10
20
30
40
50
Met
als
Org
anic
Car
bon
Ultr
afin
e
Fine
Cru
stal
Com
pone
nts
Elem
enta
lC
arbo
n
Biol
ogic
alC
ompo
nent
s
Coa
rse
Sulp
hate
s
Nitr
ates
Amm
oniu
m
No.
of s
tudi
es (2
004-
7)Biological Effect No effect
RWE Power International PAGE 18
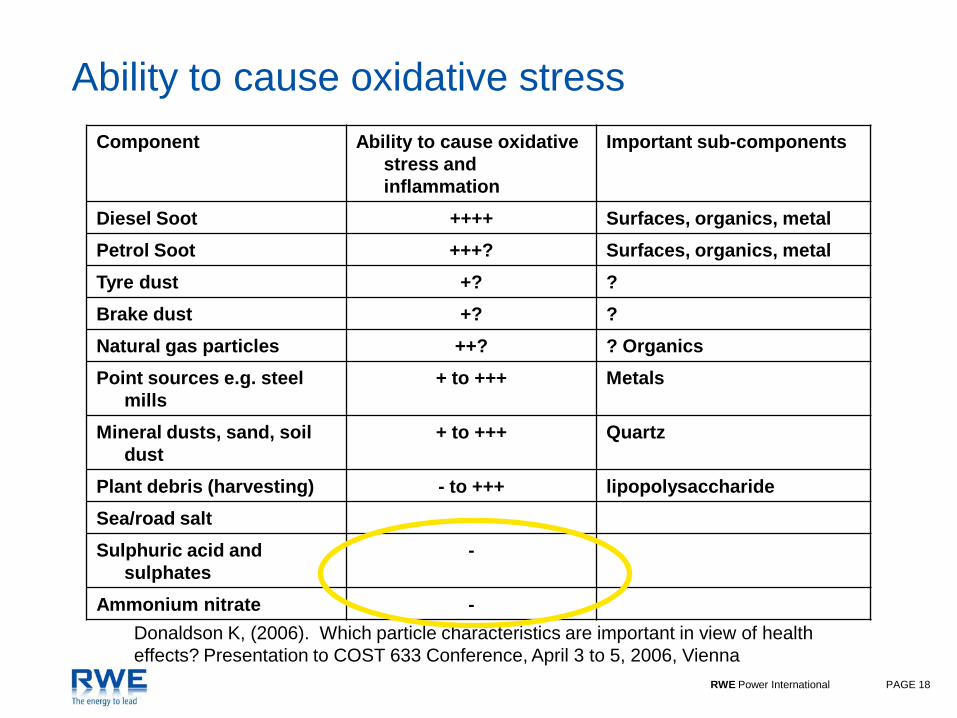
Ability to cause oxidative stressComponent Ability to cause oxidative
stress and inflammation
Important sub-components
Diesel Soot ++++ Surfaces, organics, metalPetrol Soot +++? Surfaces, organics, metalTyre dust +? ?Brake dust +? ?Natural gas particles ++? ? OrganicsPoint sources e.g. steel
mills+ to +++ Metals
Mineral dusts, sand, soil dust
+ to +++ Quartz
Plant debris (harvesting) - to +++ lipopolysaccharideSea/road salt -Sulphuric acid and
sulphates-
Ammonium nitrate -Donaldson K, (2006). Which particle characteristics are important in view of health effects? Presentation to COST 633 Conference, April 3 to 5, 2006, Vienna
RWE Power International PAGE 19
Health impact of fine PM - toxicology> Toxicological studies clearly show the adverse effects of
carbonaceous PM, especially diesel exhaust particles (ultrafine particles):
– genotoxicity, mutagenicity, carcinogenicity (i.e. PAHs, nitro-PAHs)
– cardiovascular and respiratory diseases (oxidative stress with ROS)
> Toxicological studies do not clearly demonstrate detrimental effects of inorganic particulate matter (particularly when compared with proven effects of carbonaceous PM)
> Uncertainty on the toxicity of the black carbon alone, but black carbon UF particles responsible for adsorption of semi-volatile organic compounds (PAHs, nitro-PAHs)
RWE Power International PAGE 20
GAINS/EMEP limitations in health impact calculations
> Secondary organic aerosols not taken into account
> Exposure assessment in urban areas
– the correction factor (City-Delta) is applied to the overall cell-averaged mass concentration whereas effects probably due to increased carbonaceous contribution
– the increasing mass concentration ratio [carbonaceous PM/inorganic PM] is not taken into account in health impact calculations via a higher RR value
– the RR value does not increase in the case of high fine PM mass concentration likely to be associated with a high number concentration of ultrafine particles
– Grid size: epidemiological studies typically find relevant lengthscales for elevated effects around major roads of order 50-100m, i.e. finer resolution than GAINS/EMEP
RWE Power International PAGE 21
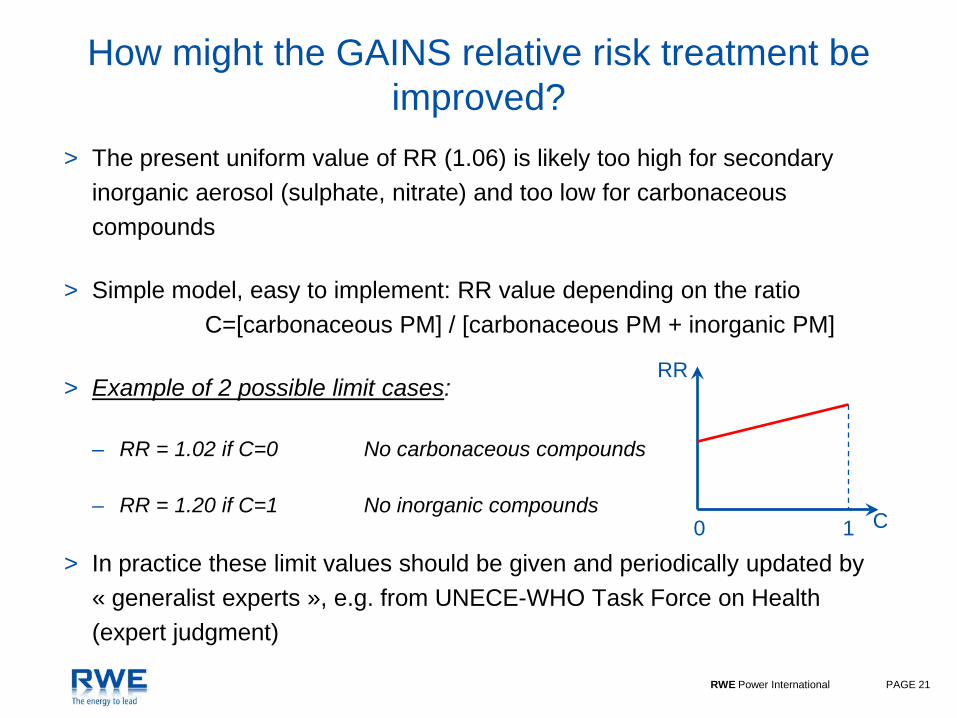
How might the GAINS relative risk treatment be improved?
> The present uniform value of RR (1.06) is likely too high for secondary inorganic aerosol (sulphate, nitrate) and too low for carbonaceous compounds
> Simple model, easy to implement: RR value depending on the ratioC=[carbonaceous PM] / [carbonaceous PM + inorganic PM]
> Example of 2 possible limit cases:
– RR = 1.02 if C=0 No carbonaceous compounds
– RR = 1.20 if C=1 No inorganic compounds
> In practice these limit values should be given and periodically updated by « generalist experts », e.g. from UNECE-WHO Task Force on Health (expert judgment)
RR
C0 1

RWE Power International PAGE 22
Recommendations> Policy should be based on best science
> Large combustion plants and low-level sources have different dispersion
and population exposure characteristics, and these differences should be
accounted for in integrated assessment approaches
– Integrated assessment models should incorporate different source-receptor
relationships for LCP and other sources
> Differential toxicity sensitivity studies for PM should be undertaken to
inform emission reduction policy development
> If this is not done there is a significant risk that emission reduction
policies, and the costs of emission abatement, will be targeted incorrectly
and with less effectiveness
RWE Power International PAGE 23
Acknowledgement
> Part of this work has been supported by the Joint Environmental Programme, which is jointly funded by RWE npower, E.ON UK, Drax Power Ltd, Scottish & Southern Energy, EDF Energy, International Power, Eggborough Power Ltd and Scottish Power