
Introduction - ucl.ac.uk · Web viewThe accuracy of these probability estimates will directly...
80
1 Conceptual and Direct Replications Fail to Support the Stake-Likelihood Hypothesis as an Explanation for the Interdependence of Utility and Likelihood Judgments Laura de Molière and Adam J. L. Harris Department of Experimental Psychology, University College London, 26 Bedford Way, London WC1H 0AP, United Kingdom. Email: [email protected] ; [email protected] Author Note
Transcript of Introduction - ucl.ac.uk · Web viewThe accuracy of these probability estimates will directly...
1
Conceptual and Direct Replications Fail to Support the Stake-Likelihood
Hypothesis as an Explanation for the Interdependence of Utility and Likelihood
Judgments
Laura de Molière and Adam J. L. Harris
Department of Experimental Psychology, University College London, 26 Bedford Way, London
WC1H 0AP, United Kingdom. Email: [email protected]; [email protected]
Author Note
Correspondence concerning this article should be addressed to Adam J.L. Harris, Department of
Experimental Psychology, University College London, 26 Bedford Way, WC1H 0AP, United
Kingdom. Email: [email protected]
THE ROLE OF AROUSAL IN LIKELIHOOD ESTIMATES 2
Abstract
Previous research suggests that we systematically overestimate the occurrence of both positive
and negative events, compared to neutral future events, and that these biases are due to a
misattribution of arousal elicited by utility (Stake-Likelihood Hypothesis, SLH, Vosgerau, 2010).
However, extant research has provided only indirect support for these arousal misattribution
processes. In the present research, we initially aimed to provide a direct test of the SLH by
measuring arousal with galvanic skin responses to examine the mediating role of arousal. We
observed no evidence that measured arousal mediated the impact of utility on probability
estimates. Given the lack of direct support for the SLH in Experiment 1, Experiments 2-5 aimed
to assess the SLH by replicating some of the original findings that provided support for arousal
misattribution as a mechanism. Despite our best efforts to create experimental conditions under
which we would be able to demonstrate the stake-likelihood effect, we were unable to replicate
previous results, with a Bayesian meta-analysis demonstrating support for the null hypothesis.
We propose that accounts based on imaginability and loss function asymmetry are currently
better candidate explanations for the influence of outcome utility on probability estimates.
Keywords: Probability, Utility, Arousal Misattribution, Stake-Likelihood Hypothesis,
Replication

THE ROLE OF AROUSAL IN LIKELIHOOD ESTIMATES 3
Introduction
Living in a world dominated by uncertainty, we are confronted with the situation of not
knowing whether any given proposition is true on a daily basis. Will it rain today? Will the new
phone we want to buy be in stock when we arrive at the store? We must however make
appropriate decisions (‘Should I carry an umbrella?’) in the light of this uncertainty. Subjective
Expected Utility Theory (Savage, 1954) prescribes how decisions ought to be made under such
circumstances, and it prescribes a central role for probability estimates. The accuracy of these
probability estimates will directly affect an individual’s future utility. Thus, understanding
systematic biases in probability judgment is a central question in judgment and decision making
research. In the current paper, we are concerned with the biasing effect that utility can have on
probability estimates.
An accumulated body of evidence suggests that the utility of an event might bias how
likely we believe it is that the event will occur. One line of enquiry claims that we estimate the
occurrence of an event to be more likely when we want the event to occur (Babad, 1995; Babad
& Katz, 1991; Granberg & Brent, 1983; Massey, Simmons & Amor, 2011; Simmons & Massey,
2012; Vosgerau, 2010; but see Bar-Hillel & Budescu, 1995; Bar-Hillel, Budescu & Amar, 2008;
de Molière, Harris, Quantmeyer & Hahn, 2014; Krizan & Windschitl, 2007), and another line of
research proposes that we provide greater probability estimates when we don’t want the event to
occur (Bilgin, 2012; de Molière, 2014; Harris, Corner & Hahn, 2009; Mandel, 2008; Risen &
Gilovich, 2007; Vosgerau, 2010). The former, when “the desirability of an outcome leads to an
increase in the extent to which it is expected to occur” (Krizan & Windschitl, 2007, p. 96), has
been coined wishful thinking. Its counterpart, the undesirability bias, exists when the
undesirability of an outcome leads to an increase in the extent to which it is expected to occur.

THE ROLE OF AROUSAL IN LIKELIHOOD ESTIMATES 4
However, the mechanism that underlies the potential impact of utility on probability estimates
remains subject to discussion. For instance, previous research proposed that approach-avoidance
motivation (Lench, 2009; see also Lench & Bench, 2012; Lench & Darbor, 2014) could explain
wishful thinking effects, whilst there is some empirical support for the role of enhanced
spontaneous imaginability (Bilgin, 2012; Risen & Gilovich, 2007) and asymmetric loss functions
(Harris et al., 2009; see also, de Molière, 2014) as explanations for the undesirability bias.
However, none of these theories has been supported as an explanation for both wishful thinking
effects and the undesirability bias.
In contrast, Vosgerau (2010) provided a unifying theory for both wishful thinking effects
and the undesirability bias with the “Stake-Likelihood Hypothesis” (SLH). Vosgerau (2010)
proposed that the arousal from having a stake (either positive or negative) in the outcome is
misattributed to probability estimates, increasing estimates for both positive and negative
compared to neutral events. However, Vosgerau’s (2010) evidential support for the SLH relied
on somewhat indirect assessments of arousal misattribution. In the present research, we sought to
examine the precise mechanism through which the proposed arousal misattribution might occur
by directly measuring arousal by means of galvanic skin responses.
The Stake-Likelihood Hypothesis
Vosgerau (2010) postulated that misattribution of arousal (excitation transfer, Zillmann,
1971) exhibited by positive or negative events leads to an overestimation of outcome
probabilities. That is, the judgment of an event’s likelihood depends on how aroused the decision
maker is- the higher the arousal, the more likely the decision maker judges the event to be. Since
arousal is non-specific (Schachter & Singer, 1962), and sticky (Cantor, Zillmann, & Bryant,
1975), residual arousal can influence a target despite the removal of the arousal-eliciting
THE ROLE OF AROUSAL IN LIKELIHOOD ESTIMATES 5
stimulus. Dutton and Aron (1974), for example, demonstrated that male participants were more
likely to accept the phone number from an attractive female confederate, as well as to report
greater sexual imagery, when crossing a scary bridge, which increased arousal, compared to a
non-scary, non-arousing bridge. It is assumed that the residual arousal experienced from crossing
the scary bridge led participants to infer a greater attraction towards the experimenter. Vosgerau
(2010) argues that similar arousal transfer holds for probability estimates: first, there is evidence
that having a stake in the outcome - positive or negative - increases physiological arousal (Eliott,
1964; Schnore, 1959). Secondly, if a valenced event has a greater likelihood of occurring it
should be associated with a greater level of arousal. For example, if there is a high probability of
getting into an accident, arousal levels should be higher than for lower chances of getting into an
accident. Thus, greater arousal should be associated with greater probabilities of valenced events
occurring, and Vosgerau (2010) postulates that the arousal from having a stake in the outcome is
misattributed to the likelihood of the event occurring. Vosgerau (2010) assessed the SLH in four
experiments, which shall be discussed below.
In Study 11, Vosgerau (2010) aimed to demonstrate that greater arousal levels give rise to
higher estimates of likelihood. Participants provided nine likelihood judgments (e.g., how likely
to do you think Barack Obama is to become the Democratic presidential candidate?”) on either
grey or bright pink paper, the latter assumed to be more arousing than the former. Supporting the
notion that the arousal from answering on pink paper is misattributed to probability estimates,
participants provided higher estimates when answering on pink compared to on grey paper.
However, the impact of arousal on probability estimates was here only assumed – there was no
evidence that it was truly arousal that led to an increase in probability estimates when 1 Vosgerau (2010) identifies his experiments as ‘Studies.’ To aid exposition, we therefore use the word
‘study’ to refer to his original studies, and ‘experiment’ to refer to the present experiments.

THE ROLE OF AROUSAL IN LIKELIHOOD ESTIMATES 6
participants answered on pink paper. Indeed, the colour pink might have other effects that could
influence probability estimates. Pink has, for example, been shown to worsen performance
(Pellegrini & Schauss, 1980; Pellegrini, Schauss & Birk, 1980; but see Gilliam, 1991). Since the
concrete mechanism through which the impact of colour might operate is not demonstrated, this
first study does not constitute direct evidence for the role of arousal misattribution.
Vosgerau’s (2010) Study 2 tested the SLH in the positive domain. Participants were
informed that they would win $5 if a 3 was rolled at least once in a series of four dice throws,
and asked to estimate the likelihood of this event occurring, and rate how exciting it was to play
the game, either before or after providing the probability estimates. Thus, Study 2 made use of a
classic arousal misattribution paradigm: arousal is only misattributed if participants are unaware
of the actual source of arousal. If participants misattribute arousal, they should be less likely to
do so once the source of the arousal is made salient and they can thus attribute their arousal to
the actual source (Gorn, Pham & Sin, 2001). The data of Study 2 were indeed in line with
arousal misattribution processes: individuals gave higher probability estimates when they were
asked after providing a probability estimate how exciting the game was. Additional evidence was
provided from the arousal ratings: Arousal was greater if it was rated before the provision of
probability estimates than when it was rated afterwards. Although such an effect on arousal
ratings would not seem necessary on the SLH, this decrease is consistent with arousal
misattribution, as participants attributed the arousal to the likelihoods rather than to having a
stake in the outcome if being asked after they made probability estimates. Thus, Study 2
demonstrated the impact of arousal in a more direct fashion than Study 1. Nevertheless,
Vosgerau (2010) does not address the alternative explanation for the order effect on arousal
ratings that it might have been possible that participants did not enjoy providing the probability
THE ROLE OF AROUSAL IN LIKELIHOOD ESTIMATES 7
estimate. Before participants knew that they would have to provide the estimate, they might have
thought that the prospect of the game sounds exciting, since they might win something.
Afterwards, however, they might have realised it was not so exciting since they had to actually
perform some math. This could explain why the ratings of excitement were lower after the
probability estimate. Whilst this argument doesn’t explain why probability estimates decreased
after participants provided arousal ratings, it highlights the lack of a direct, objective measure of
arousal in extant tests of the SLH.
In Study 3, Vosgerau (2010) provided evidence for the notion that valenced, and
therefore supposedly arousal-eliciting, events are assigned greater subjective probabilities than
neutral events. In this study, participants judged the likelihood of a 6 coming up at least twice in
four dice throws. Depending on their condition, participants could either win or lose a shot glass.
Specifically, participants were asked to estimate the chance that they would lose (vs. win) the
shot glass, or were asked simply to estimate the outcome of the dice throws without any outcome
attached. In addition, Vosgerau (2010) included a “low imaginability” condition in which
participants were asked to estimate the chance that a 6 would occur at least twice in the four
throws (as opposed to focussing on the outcome of winning a shot glass). If inflated probability
estimates in the positive domain are a result of greater imaginability (e.g., Bilgin, 2012; Carroll,
1978; Risen & Gilovich, 2007), the “low imaginability” condition should yield lower probability
estimates than the other positive condition. Vosgerau observed higher probability estimates in
the conditions that included a stake in the outcome compared than those observed in the neutral
condition, with higher estimates in the negative condition than the positive condition.
However, the role of imagination cannot be completely ruled out in this study. Vosgerau
(2010) did not include a manipulation check for the imaginability condition. Secondly, a “low
THE ROLE OF AROUSAL IN LIKELIHOOD ESTIMATES 8
imaginability” condition was only included for the win, but not for the loss condition, making
this an incomplete design and allowing for the interpretation that imaginability might indeed
affect positive and negative outcomes differently. Finally, the absence of evidence for
imagination as a mechanism does not necessarily constitute evidence for the SLH, as other
proposed mechanisms (e.g., loss function asymmetries) also predict the present findings.
Moreover, by collapsing across the positive and negative utility conditions, it is impossible to
know whether the difference from the neutral condition is driven by both the negative and the
positive outcome conditions, or whether indeed only the negative condition (in which
participants gave statistically higher estimates than in the positive condition) was driving these
differences.
Finally, Vosgerau’s Study 4 asked German university students before an important
football match to estimate the likelihood of the team favoured by the vast majority of students to
win or to lose the match. Arousal was manipulated by either telling participants that they would
watch the game live (high arousal), or with a delay (lower arousal – see Vosgerau, Wertenbroch
& Carmon, 2006). Depending on their outcome focus, participants assigned higher probabilities
for winning or losing when watching the game live. Vosgerau (2010) interprets these results as
being congruent with the SLH account, arguing that arousal was only misattributed in the live
condition, as individuals were less aroused when not watching the game live. However, arousal
was again not assessed directly. A possible alternative explanation for these results is provided
by Construal Level Theory (CLT – Trope & Liberman, 2002; 2003). CLT provides a framework
for the construct of psychological distance – the subjective experience of how far an event or
object is from the current self. Because a recorded game is distant in time from the present self, it
could be perceived as being higher in psychological distance. Wakslak and Trope (2009; see

THE ROLE OF AROUSAL IN LIKELIHOOD ESTIMATES 9
also, Wakslak, 2012; Wakslak, Trope, Liberman, & Alony, 2006) also proposed that the
subjective probability of events high in psychological distance will be lower than for events
lower in psychological distance, thus predicting the very effect reported in Vosgerau’s Study 4.
In conclusion, Vosgerau (2010) provided some indirect evidence for arousal
misattribution as a mechanism underlying the impact of utility on probability estimates across
four studies. However, concrete evidence for arousal as a mechanism is not provided. The most
direct evidence for the SLH, in Study 2 where subjective arousal was assessed subjectively, was
demonstrated only for positive, but not for negative outcomes. Experiment 1 aimed to close this
gap by measuring arousal directly, to determine whether it could mediate the effect of negative
utility on probability estimates.
Experiment 1
Experiment 1 aimed to test the prediction of the SLH that arousal from an aversive event is
misattributed to likelihood estimates. In order to directly assess arousal, we measured
electrodermal activity (EDA), where changes in EDA reflect changes in arousal levels in
response to emotional stimuli (Andreassi, 2007; Boucsein, 2012; Dawson, Schell, & Courtney,
2011; Dawson, Schell, & Filion, 2007). EDA can be separated into a phasic and a tonic
component. Phasic activity relates to a response to a specific stimulus, whereas tonic activity
relates to responses to chronic stimuli over a longer period of time, reflecting a more general
level of arousal (Dawson et al. 2007). The tonic driver in this context is more meaningful than
the phasic driver, as participants read passages of text when which didn’t allow to match phasic
activity to one emotional stimulus (here: words). As the tonic driver increases in response to
emotional material (e.g. Sundar & Kalyanaraman, 2004), and following Vosgerau (2010), it was
THE ROLE OF AROUSAL IN LIKELIHOOD ESTIMATES 10
expected that negative scenarios should lead to an increase in arousal (and as such in the tonic
driver), which in turn should increase probability estimates.
Following Harris et al. (2009), probability estimates were elicited for fictional scenarios,
in which participants were provided with an objective basis for their subjective estimates and
this objective basis was identical across the utility manipulations. Any systematic difference
between the estimates of probability across conditions is consequently directly attributable to the
manipulation of utility. Two scenarios were employed in Experiment 1. One was a version of
Vosgerau’s (2010) Study 3, adapted to enable us to manipulate negative utility, which we had
found to exert a stronger effect on probability estimates than positive utility in pilot work (de
Moliere, 2014). A second scenario employed an adapted version of the visual display of George
Louis Leclerc’s “Buffon’s Coin” problem (see Strick, 2007).
Method
Participants. 127 Participants were recruited (101 female, median age=19 years2).
Participants either received a payment of £3 or 0.5 course credits as a reimbursement for
participating in this experiment.
Design. Participants were randomly assigned to a 2 (utility: neutral/negative) x 2
(scenario: dice/container) mixed design, the last factor manipulated within participants.
Dependent variables were subjective probability estimates and the change in tonic EDA activity
from baseline measures, experienced during the presentation of the scenarios (see Technical
Appendix for details).2 One participant typed “2” as the answer to how old they are. Since all participants were adults tested in the
laboratory, we assumed that this was a typing mistake and did not include it when calculating the median of age.
THE ROLE OF AROUSAL IN LIKELIHOOD ESTIMATES 11
Materials and Procedure.
Physiological measurements. Upon arrival in the lab, participants were informed that the
research concerned decision-making and physiology. Participants were seated in front of the
computer, all physiological equipment was attached (see Technical Appendix) and a baseline
measure of EDA was obtained for one minute.
Probability Estimates. The two scenarios (counterbalanced presentation) were presented
with Eprime (version 2.0). To allow EDA responses to return to baseline after each scenario,
participants were instructed to relax during a 1-minute break between scenarios.
For the container scenario, participants read the following in the negative condition
(neutral condition in brackets):
A container is to be dropped from the air, and will land somewhere in the area depicted below, with all locations equally likely. The container contains toxic chemicals (natural, organic materials), which are fatally poisonous to humans (pose no risk to people or the environment).
Below, you see the area where the container could land. The blue lines are an underground watercourse, which supply drinking water to a large city. The red circle indicates the size of the area where toxic chemicals will be released. If this area overlaps at all with one of the water veins, the chemicals will be released into the drinking water, killing thousands of people (making it taste very slightly different with no threat to health).
By looking at the picture below, what is the chance that the container lands so that it overlaps with one of the water veins, thus poisoning the large city’s drinking water and killing thousands (causing the large city’s drinking water to taste very slightly different)?
The “area where the container could land” and the “red circle” shown to participants is
reproduced in Figure 1.

THE ROLE OF AROUSAL IN LIKELIHOOD ESTIMATES 12
Figure 1. Probability display in the “Container” scenario.
For the dice scenario, participants in the negative condition read:
Imagine you walk down the street and find $100. You picked it up, so the $100 is in your pocket. However, a very rich, arrogant and rude person was bending down just as you picked up the $100. Seeing a dice for sale in the window of a nearby thrift shop, they propose the following:You will roll the regular, six-sided dice 4 times. If a 6 comes up on at least 2 of these throws, the rich person will get the $100 and you will lose the $100. Otherwise you can keep it. What do you think is the chance that a 6 would turn up on at least 2 out of 4 throws, so you would lose the money to the very rich, arrogant and rude person?
In the neutral version of this scenario, a person, described simply as ‘another person’
(i.e., omitting the rich, arrogant and rude aspect that was designed to increase negativity in the
negative condition), proposes the same game. There is no reference to money or any outcome
involved, and the dice roll has no consequences.
Estimates for both scenarios were provided on slider scales anchored at 0 (absolutely
impossible) and 100 (absolutely certain). The exact integer value of the slider’s position was
displayed to participants.
THE ROLE OF AROUSAL IN LIKELIHOOD ESTIMATES 13
Participants next completed a variety of tasks designed to assess their interoceptive
awareness: a heartbeat counting task (Schandry, 1981) and associated questions assessing
strategies for this task as well as participants’ frequency of physical activity; Consciousness of
Body: Private scale (Miller, Murphy, & Buss, 1981); Sense of Power scale (Anderson, John, &
Keltner, 2012); positive and negative affect scale (Watson, Clark, & Tellegen, 1988); short form
of the state and trait anxiety scale (Marteau & Bekker, 1992). These measures are not discussed
further.3
Finally, a manipulation check asked participants to estimate how “bad” the negative
outcomes (container overlapping with a water vein, other person rolling 2x a 6) would be on a 7-
point Likert scale (0 “not bad at all” to 7 “very bad”).
Results
Of the 129 participants, 8 were excluded from all analyses for not following experimental
instructions.
3 The experiment was conducted as part of LdM’s doctoral thesis (de Molière, 2014), which originally
aimed to investigate the moderating role of social power and interoceptive awareness on the influence of
arousal on estimates of probability, in an attempt to better delineate the SLH from the asymmetric loss
function hypothesis (Weber, 1994) of the interdependence of utility and probability estimates. Finding no
mediating effect of arousal means that these measures are not relevant to the current research goals.
Because of its relevance to the asymmetric loss function hypothesis, and the possibility that arousal
misattribution might only occur for events high in decision-control, a third scenario that was intended to
be low in decision-control was included after the two reported here for participants 36-129. Given the
lack of support for the SLH in the scenarios most similar to Vosgerau (2010), and due to the lower
number of participants in this additional scenario for physiological analysis, we did not analyse the
physiological data for this scenario, which is not discussed further.
THE ROLE OF AROUSAL IN LIKELIHOOD ESTIMATES 14
Data Preparation.
Relative change in tonic activity was analysed for the dice and container scenarios
separately (see Technical Appendix for details).
The EDA data of a further 8 participants were unsuitable for analysis, with an additional
4 removed from only the analysis of the container scenario and a further 4 from the dice
scenario. In addition, 2 participants were excluded for not moving the slider in the container
scenario, and 4 for not moving the slider in the dice scenario. The final sample consisted of 104
participants in the dice, and 106 participants in the container scenario.
Data Analysis.
Manipulation Checks. The manipulation of utility was successful in both the dice
scenario (negative: M = 4.84, SD = 2.28; neutral: M = 1.64, SD = 1.31), t(100.26) = 9.57, p
< .001, and the container scenario (negative: M = 8.13, SD = 1.55; neutral: M = 4.54, SD =
2.46), t(94.17) = 9.48, p < .001 (dfs adjusted due to inequality of variances).
Container Scenario. The relationship between utility and the change in the tonic driver
was marginally significant in the predicted direction, in that individuals in the negative condition
experienced a greater change in tonic arousal (M=.78, SD=.91) than individuals in the neutral
condition (M=.45, SD=.99) t(105)=1.8, p=.07. However, the crucial impact of arousal on
probability was not significant, t(105)=1.62, p=.11. Finally, whilst participants in the negative
condition provided greater estimates (M=37.24, SD=20.04) than participants in the neutral
condition (M=31.5, SD=19.67), the relationship between utility and probability estimates was
not significant, t(105)=1.49, p=.14. Thus, there was no support for the role of arousal in the
impact of utility on probability estimates in the container scenario.

THE ROLE OF AROUSAL IN LIKELIHOOD ESTIMATES 15
Dice Scenario. The impact of utility on the change in the tonic driver was non-significant
(Mnegative=.85, SD=.97 vs. Mneutral=.83, SD=.99), t(102)=0.08, p=.94. However, the impact of
utility on probability estimates was marginally significant in the dice scenario, t(102)=1.95,
p=.054, in that individuals in the negative condition provided greater estimates (M=27.69,
SD=17.7) than participants in the neutral condition (M=21.46, SD=14.76). Thus, whilst there
was a marginally significant relationship between utility and probability estimates, arousal was
not impacted by the manipulation of utility, providing no evidence for the SLH in the dice
scenario.
Discussion
In sum, Experiment 1 offered no support for the hypothesis that arousal (as measured by
EDA response) mediates the impact of utility on probability estimates. It is possible, however,
that whilst arousal misattribution indeed underlies the relationship between utility and
probability, our methods in Experiment 1 were not appropriate to detect this. In addition to the
potential for the type of arousal posited in the SLH to not be reflected in EDA responses (an
issue to which we return in the General Discussion), our experiment employed hypothetical
scenarios rather than real monetary incentives, which might have elicited less arousal than in
Vosgerau’s original experiments where participants had a stake in the outcome, and the arousal
evoked by the utility manipulation could have been too weak to be detected by our equipment. In
addition, measuring physiological arousal might have drawn participants’ attention to the actual
source of their arousal. Once individuals are aware of the source of arousal, misattribution is less
likely to occur (Reisenzein & Gattinger, 1982).
Before going any further with this line of enquiry, we decided it would be prudent to
assess the reliability of the initial support of the SLH. Therefore, in the next experiments, rather

THE ROLE OF AROUSAL IN LIKELIHOOD ESTIMATES 16
than testing further predictions derived from the SLH, we aim to assess the status of the SLH by
replicating the effects originally reported by Vosgerau (2010).
In the following, we present three experiments aiming to replicate Vosgerau’s (2010)
Study 2, and one experiment aiming to replicate Vosgerau’s (2010) Study 1. Such replication
attempts can be direct or conceptual (Schmidt, 2009), constituting replications that employ the
original materials or extend the theory to another set of stimuli, respectively. Experiments 2 (run
online) and 5 (run in the laboratory) constitute conceptual replications of Vosgerau’s (2010)
Studies 2 and 1, respectively. Experiments 3 and 4 (run in the laboratory) are direct replications
of Vosgerau’s Study 2.
Of Vosgerau’s (2010) four experiments, we considered Study 2 to be the strongest
demonstration of arousal misattribution as a mechanism. Study 2 was the only study in which
arousal was actually assessed (via self-report) and the misattribution hypothesis was actually
tested. In Study 2, Vosgerau (2010) demonstrated that probability estimates decreased once the
source of arousal was salient, supporting the notion that arousal is misattributed under conditions
where the source of the arousal is not salient. To pre-empt our results: Three replications of
Study 2 yielded no evidence for the existence of arousal misattribution in the formation of
probability estimates. Finally, Experiment 5 failed to replicate the effect of paper color on
probability estimates (Vosgerau, Study 1).
Experiment 2
Experiment 2 aimed to replicate Vosgerau’s Study 2. Vosgerau (2010) only tested the
manipulation of the arousal misattribution process for positive, but not for negative events.
Moreover, Vosgerau tested this effect for both focal and non-focal events. Whilst the effect

THE ROLE OF AROUSAL IN LIKELIHOOD ESTIMATES 17
appeared very strong for the (arguably more positive) focal event (“what is the probability that at
least one 3 will show up”), this was reduced for the (arguably more negative) non-focal event
(“what is the probability that no 3 will show up”). It therefore remains a possibility that arousal
misattribution occurs for positive, but not for negative events. Therefore, the current experiment
aimed to replicate Vosgerau’s Study 2, as well as to extend it to negative and neutral events.
In addition, the current experiment only used the dice scenario, with the same probability
level as Vosgerau (2010), resembling his study more closely (“at least one 3 within four rolls”).
In the original study, participants indicated higher arousal if arousal was rated before, compared
to after, providing probability estimates. If we were to include more than one scenario, a
meaningful interpretation of arousal ratings would not be possible since arousal questions of the
later scenarios would have been preceded by likelihood estimates.
Method
Participants and Design. 303 participants were recruited via Amazon Mechanical Turk
and paid $0.20 to participate in this online experiment. Following previous exclusion criteria, the
final sample consisted of 285 participants (100 female, median age = 27 years). Note that we
more than tripled the cell size from Vosgerau’s (2010) 13 participants per cell to approximately
47 participants per cell. Participants were randomly assigned to a 3 (utility:
positive/neutral/negative) x 2 (order: arousal rating first/probability estimate first) between
participants design.
Materials and Procedure. Participants were informed that they would participate in a
study on risk perception. Participants read the dice scenario. In the positive utility condition
participants read:
THE ROLE OF AROUSAL IN LIKELIHOOD ESTIMATES 18
Imagine you are walking down the street with another person. Seeing a dice for sale in the window of a nearby thrift shop, they propose the following: You will role a six-sided dice 4 times. If a 3 comes up on at least 1 of these throws, the other person will give you $100. Otherwise they will keep it.
The negative and neutral conditions were the same as in Experiment 1, except that the focal
outcome for the dice roll was a 3 coming up on at least 1 throw out of 4.
In all conditions, participants estimated the probability that at least one 3 shows up on
four throws and provided their answer using the same 0-100 scale as in Experiment 1. Depending
on the order condition, participants were either asked before or after the provision of the
probability estimate to answer the questions: “how much would you like playing this game?” and
“how exciting would it be to play this game”?, both on 8-point Likert-scales from 0 (not at all) to
7 (very much).
Finally, participants completed the Consciousness of Body: Private scale (Miller et al.
1981). This measure is not discussed further (see Footnote 5).
Results and Discussion
Probability Estimates. The arousal misattribution account predicts that probability
estimates for the negative and positive conditions are both higher than estimates for the neutral
condition, when the arousal question is asked afterwards.
A 3 (utility: negative/neutral/positive) x 2 (order: arousal rating first/probability estimate
first) ANOVA yielded no significant main effect of utility, F(2,270)=1.8, p=.17, η2=.01.
However, directionally, participants in the negative condition gave the highest probability
estimates (M=47.9, SD=23.84), followed by participants in the neutral (M=43.37, SD=21.47)
and positive condition (M=42.04, SD=21.33). The direction of these means are not in line with

THE ROLE OF AROUSAL IN LIKELIHOOD ESTIMATES 19
the SLH, which would have predicted greater estimates for positive and negative compared to
neutral events. Furthermore, contrary to the predictions by the SLH, the effect of order,
F(1,279)=2.15, p=.14, η2=.01, and the utility*order interaction, F<1, were non-significant (see
Figure 2).
Negative Neutral Positive0
10
20
30
40
50
60Probability FirstArousal First
Utility
Mea
n Pr
obab
ility
Est
imat
e (%
)
Figure 2. Probability estimate means for the utility and order conditions. Error bars represent +/- 1 standard error of the mean.
Arousal Ratings. As the two arousal questions were highly correlated, r(285)=.81, p<.001, they
were averaged into one arousal score and submitted to a 3 (utility: negative/neutral/positive) x 2
(order: arousal rating first/probability estimate first) between participants ANOVA. A main
effect of utility was present, F(2,279)=94.49, p<.001, η2=.41. Participants in the positive
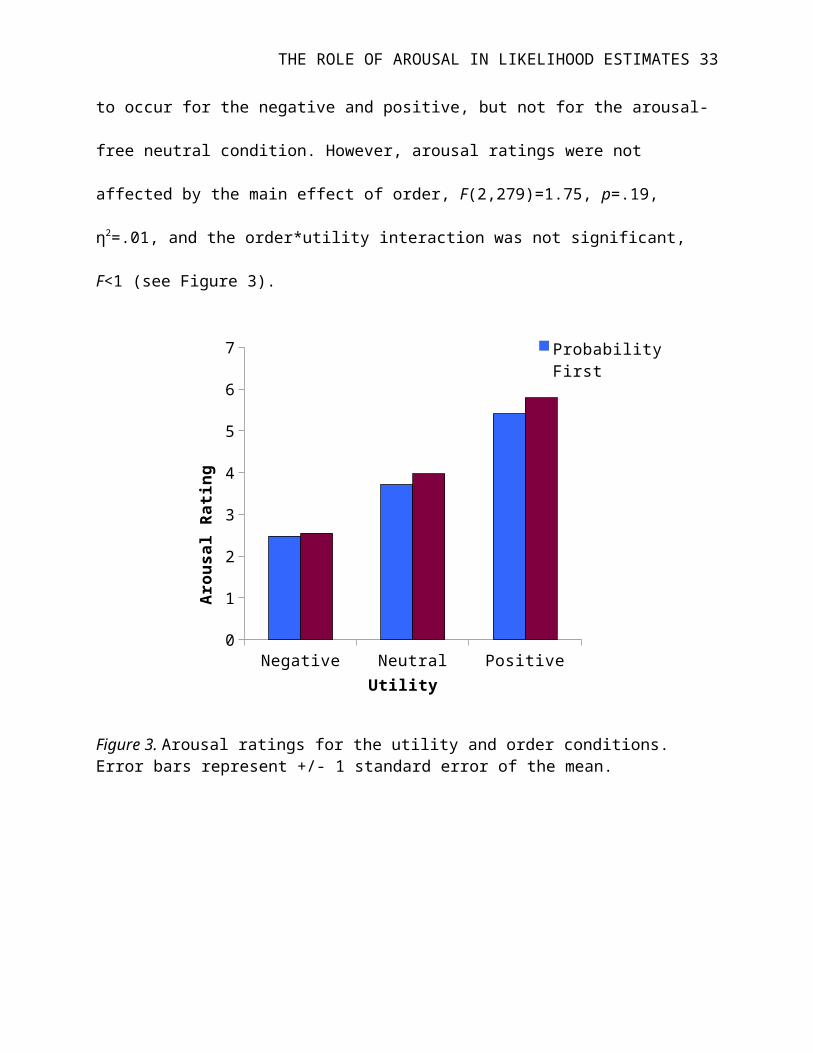
condition gave the highest arousal ratings (M=5.6, SD=1.46), followed by participants in the
THE ROLE OF AROUSAL IN LIKELIHOOD ESTIMATES 20
neutral (M =3.84, SD=1.62) and negative conditions (M =2.52, SD=1.52). Whilst a main effect
of utility would be expected, where both individuals in the negative and positive conditions
report to be more aroused than participants in the neutral condition, it was not expected that
individuals in the negative condition reported lower arousal than individuals in the neutral
condition. This result might hint towards an inappropriate arousal question for the negative
condition. We employed the original questions from Vosgerau (2010) that asked participants
how “excited” they were, and how much they “liked” playing the game. These questions,
however, are exclusively concerned with the enjoyment associated with a game and thus
confound arousal and valence. More appropriate questions in the negative domain could be to
ask participants how “anxious” they would be playing the game, and how much they “disliked”
playing the game.
Furthermore, following the SLH, it was expected that participants’ ratings of arousal
decrease if they rate their arousal after the provision of probability estimates (as arousal is then
misattributed). In particular, this effect was expected to occur for the negative and positive, but
not for the arousal-free neutral condition. However, arousal ratings were not affected by the main
effect of order, F(2,279)=1.75, p=.19, η2=.01, and the order*utility interaction was not
significant, F<1 (see Figure 3).
THE ROLE OF AROUSAL IN LIKELIHOOD ESTIMATES 21
Negative Neutral Positive0
1
2
3
4
5
6
7 Probability FirstArousal First
Utility
Aro
usal
Rat
ing
Figure 3. Arousal ratings for the utility and order conditions. Error bars represent +/- 1 standard error of the mean.
Experiment 3
Experiment 2 was unable to extend the results of Vosgerau’s (2010) Study 2 to the
negative domain, but also failed to replicate Vosgerau’s results in the positive domain.
Participants’ probability estimates did not decrease when they were directed to the source of the
arousal, and arousal levels did not decrease when rated after the probability estimates.
However, there were a number of differences between Experiment 2 and the original
study. Above all, Experiment 2 was conducted online without real monetary outcomes, whereas
in Vosgerau’s (2010) Study 2 participants had the chance to earn $5. Although mean arousal
THE ROLE OF AROUSAL IN LIKELIHOOD ESTIMATES 22
ratings in the positive utility condition of Experiment 2 (see Figure 3) were similar to those in
Vosgerau’s ‘arousal rating first’ condition (M = 5.06, SD = 1.15), this remains a salient
difference between the two studies.
Experiment 3 was therefore a direct, laboratory-based, replication of Vosgerau’s Study 2,
using the same manipulations, the same computer program to display instructions, and the same
rewards in the laboratory4. This also included a £1 incentive for accuracy5. Given the difficulties
in asking a functionally equivalent arousal question in the negative domain, and the unexpected
trends in the neutral condition, we only conducted this experiment with positive outcomes, as in
the original study. We again omitted Vosgerau’s non-focal outcome condition (what is the
likelihood of getting no 3s in four dice rolls) and only measured the focal outcome (what is the
likelihood of getting a 3 at least once in four dice rolls), as the arousal rating had the strongest
effect on probability estimates in this condition in the original study.
Method
Participants and Design. 30 Participants took part in this experiment (15 females,
median age =22 years) conducted in the laboratory. With 15 participants per cell, we therefore
employed a similar cell size as the original study (cell size = 13) by Vosgerau (2010).
Participants received a chocolate bar in return for their participation, in addition to any money
won during the experiment, and were randomly assigned to one of the two order conditions
(probability first/arousal first).
4£3 is the nearest integer amount in GBP to $5.
5 Vosgerau (2010) provided a $1 incentive for accuracy.

THE ROLE OF AROUSAL IN LIKELIHOOD ESTIMATES 23
Procedure and Materials. Participants were approached opportunistically and were
asked to participate in a brief study on risk perception in which they would get a chocolate bar
and could win some money. The experimenter then started the original computer program from
Vosgerau’s (2010) Study 2, generously provided to us by the author. Participants read the
following instructions on the screen: “You will toss a die four times. If you toss a "3" (one or
several 3s) in the four tosses you win £3”. Afterwards, participants were given the following
instructions: “In order to make sure that you understand the game, please describe it in your own
words below. Please ask the experimenter if anything is not clear“. After participants described
the task in their own words, they were asked the questions: “How much do you like playing this
game” and “How exciting is it to play this game”, both on 7-point Likert scales (1 not at all – 7
very much), either before or after they were asked to estimate the probability of a 3 occurring. As
in Vosgerau’s (2010) Study 3, probability estimates were provided on a 21-point scale ranging
from 0-100% in 5% increments. The instructions for the probability judgment were: “How likely
do you think it is that you will toss one or more 3s in the four rolls? If your probability estimate
is within 5% of the true probability, you will receive an extra £1.” Finally, participants
completed demographic information, rolled the dice, and were paid with any money won during
the task as well as with a chocolate bar.
Results
Probability Estimates. Contrary to the predictions of the SLH, there was no main effect
of order, F<1, with the direction of means in the opposite direction to the original findings
(probability rated after arousal ratings: M=42.67, SD=25.49; probability rated before arousal
ratings: M=37.33, SD=25.2).

THE ROLE OF AROUSAL IN LIKELIHOOD ESTIMATES 24
Arousal Ratings. Since the correlation between the two questions was high, r(30)=.80,
p<.001, we averaged the two questions. The average was then submitted to an ANOVA. The
main effect of order was not significant, F<1. Again, the direction of means was in the opposite
direction to the original findings (arousal rated after probability: M=4.43, SD=1.23; arousal rated
before probability: M=4.03, SD=1.04).
Experiment 4
Experiment 3 failed to replicate Vosgerau’s (2010) Study 2, despite using identical
materials. However, we offered participants a mars-bar for participating, irrespective of the
outcome (to make sure that participants would be compensated for taking part in the experiment
in case they did not win the money). As offering a sugary, fatty reward could potentially lead to a
‘hot’ visceral state that could interfere with probability estimates (see Risen & Critcher, 2011),
we repeated the identical experimental set-up, but did not mention the chocolate-bar at the start
of the experiment. Therefore, Experiment 4 removes the only difference in the experimental set-
up of our Experiment 5 and Vosgerau’s (2010) Study 2, and thus constitutes a direct replication
attempt.
Method
40 participants (24 female, median age =23.5 years) took part in this experiment, slightly
increasing the cell size to 20 participants per cell (compared to Vosgerau’s, 2010, 13 participants
per cell). Participants were reimbursed with money won during the task (if participants did not
win anything, they were reimbursed with a chocolate bar, unknown to participants when starting
the task).
THE ROLE OF AROUSAL IN LIKELIHOOD ESTIMATES 25
When approached, participants were told that there was a chance to win money, but there
was no mention of a chocolate bar. In all other respects, the method was identical to Experiment
3.
Results
Probability Estimates. The results of Experiment 3 were replicated. There was again no
main effect of order, F<1, and the direction of means was in the opposite direction to the original
findings (probability rated after arousal ratings: M=49.55, SD=24.82; probability rated before
arousal ratings: M=47.77, SD=27.18).
Arousal Ratings. The correlation between the two questions was high, r(40)=.74,
p<.001, and we averaged the two questions. In this experiment, there was a significant effect of
order on arousal, F(1,38)=6.92, p=.01, η2=.15. As predicted by the SLH, when answering the
arousal questions before the probability judgment, participants rated their arousal to be higher
(M=5.55, SD=1.22) compared to when they answered the arousal questions afterwards (M=4.39,
SD=1.55).
Combining Experiments 3 and 4
Vosgerau (2010) employed 13 participants per cell, which likely constitutes an
underpowered design. A lack of power can enhance the likelihood of false positive results (e.g.,
Simmons, Nelson, & Simonsohn, 2011). Our failed replications suggest that Vosgerau’s results
may indeed be false positive results, but a lack of power can also give rise to false negative
results. As Experiments 3 and 4 were identical in almost all aspects, we combined the data from
these two experiments to double the sample size. Order had no impact on probability estimates in

THE ROLE OF AROUSAL IN LIKELIHOOD ESTIMATES 26
this analysis (F < 1), with the trend in the effects being in the opposite direction to that predicted
by SLH (see Table 1).
Bayesian Meta-Analysis across Experiments 2, 3 and 4
Conventional significance testing cannot provide support in favour of the null hypothesis.
As a result of the greater attention paid to replications recently, some researchers have argued for
the application of Bayesian statistical tests (e.g. Gallistel, 2009; Rouder et al. 2009;
Wagenmakers, Wetzels, Borsboom, & Van Der Maas, 2011). Bayesian tests compare the degree
to which the obtained data are likely under two different hypotheses and thus can be used to
provide an indication of how much more likely the data are to obtain under the null hypothesis
(effect size = 0), or a specified alternative hypothesis. The appropriate specification of the
alternative hypothesis is difficult to know a priori. For the current analyses we employ the
default Cauchy prior with a scale of √2 / 2, which is perceived as appropriate under a broad array
of situations (Rouder et al. 2009; but see Simonsohn, 2015, for critique - for replies see Morey,
2015; Rouder & Hilgard, 2015). Typically, the null hypothesis is that the effect size is exactly
zero, while any value greater or less than this constitutes evidence for an alternative hypothesis.
In the present analysis, however, we have arranged our data such that the SLH predicts a positive
effect (see Table 1). We therefore test a point null hypothesis (effect size is exactly 0) against a
positive alternative hypothesis with a Cauchy distribution truncated at zero as the prior
distribution (Morey & Rouder, 2011) 6. In this way, only effect sizes greater than zero (and not
effect sizes in the opposite direction) are consistent with the alternative hypothesis.
6 Morey and Rouder (2011) Figure 8, Panel B, provides a graphical illustration of this test, although here
we employ a strict point null, rather than including a range of small “unimportant” positive effects in the
null hypothesis.
THE ROLE OF AROUSAL IN LIKELIHOOD ESTIMATES 27
The evidence in favour of the null hypothesis over the SLH (as specified by the default
prior distribution) for our replications of Vosgerau’s (2010) Study 2 is assessed by a Bayesian
meta-analysis conducted across all three replication experiments (for instructions see Rouder &
Morey, 2011). This meta-analysis assumes that the true effect size is constant across experiments.
However, it does not assume equal variances, which makes it applicable to the current set of
experiments where different variances could have been produced, for example by different
means of recruiting participants (e.g. online in Experiment 2, in the laboratory in Experiments 3
and 4).
We applied this meta-analytic Bayes factor to the probability estimates of the three
experiments we conducted (we only considered the data from the positive condition of
Experiment 4). Here, we only report the Bayes factor for probability estimates, as the decrease in
arousal levels is only of interest as a potential mediating mechanism should there really be a
decrease in probability.
For each, we first extracted the t-value of order (arousal rating first/probability estimate
first) (see Table 1 for the t-values associated with the three experiments). We then analysed the
data using the R package Bayes Factor, together with a script for a Bayesian meta-analysis,
written by Rouder & Morey (2011). This analysis revealed a value of 6.08 to 1 in favour of the
null hypothesis over the SLH for the present Experiments 2, 3 and 47. As such, the current results
constitute “some” evidence in favour of a null over the SLH (Rouder et al. 2009, p.228).
7 One can argue that we should have also conducted a meta-analysis across Experiments 3 and 4 rather
than simply combining them. We therefore also ran the Bayesian meta analysis on Experiments 3 and 4.
This analysis shows a value of 5.78 to 1 in favour of the null hypothesis over the SLH.
THE ROLE OF AROUSAL IN LIKELIHOOD ESTIMATES 28
Table 1.
The number of participants, the t-value associated with the main effect of order, and whether the results were in the direction predicted by the SLH for the Experiments 2, 3 and 4.
N t Direction Predicted by SLH
Experiment 2 95 .42 Yes
Experiment 3 30 -.58 No
Experiment 4 40 -.21 No
Data pooled 165 -.37 1/3
Experiment 5
Given our repeated failure to replicate Vosgerau’s (2010) Study 2 across three
experiments, we next aimed to replicate Vosgerau’s (2010) Study 1. In his Study 1, Vosgerau
(2010) asked participants to estimate the probabilities of nine future outcomes, such as “How
likely do you think Barack Obama is to become the Democratic presidential candidate?”, or
“How likely do you think the Steelers are to win the Super Bowl in 2008?”. Vosgerau (2010)
included two sets of questions (manipulated between participants), one of which was the
complement of the other set (e.g. “How likely do you think Barack Obama is not to become the
Democratic presidential candidate?”). These questions were either presented on bright pink
paper, which was assumed to increase arousal, or on grey paper, which was assumed to not
evoke arousal. Vosgerau (2010) demonstrated that when participants read the statements on pink
paper, they provided higher probabilities than when they read the statements on grey paper.
Method
THE ROLE OF AROUSAL IN LIKELIHOOD ESTIMATES 29
Participants and Design. 177 participants (97 female, median age = 20 years) took part
in the experiment and were recruited opportunistically on the campus of University College
London (similar to Vosgerau, 2010, who recruited passers-by close to the campus of the
University of Pittsburgh). Participants were randomly assigned to a 2 (colour: pink/grey) x 2
(focus: version1/version2) x 10 (probability questions) mixed design, with repeated measures on
the last factor.
Materials and Procedure. Materials and procedure closely followed Vosgerau’s (2010)
set up. Half the participants were asked 10 likelihood questions, whereas the other half answered
10 questions with complementary likelihoods (see Table 2). Following Vosgerau (2010), arousal
was manipulated by printing questionnaires either on “bright pink” paper (arousal) or on “light
grey” paper (no arousal)8. As in Vosgerau (2010), likelihood judgments were made on a 21-point
scale ranging from 0% to 100%, in 5% increments.
This set-up closely follows the original set-up by Vosgerau (2010). However, one of the
differences between the original and the present experiment are the questions used, as the
original study included events that had either occurred already or were not relevant to our 2014
U.K. participants. We therefore used two of the original items, which did not depend on time or
location, and added eight items - inspired by Vosgerau’s original items - that were more relevant
to our participants. Another likely difference between the experiments is the precise paper used.
There were no records of the paper brand used in Vosgerau (2010), so we chose the most
fluorescent pink possible (as did Vosgerau, personal communication, 22.01.2014).
8 The papers used were named thus, and purchased from http://www.ebay.co.uk/itm/A4-Coloured-Paper-
Card-Multi-Use-Printing-Copier-Cardmaking-Colour-Craft-Sheet-/281188280909 (URL correct as of
06/02/2015).

THE ROLE OF AROUSAL IN LIKELIHOOD ESTIMATES 30
Table 2.Probability estimation questions asked in Experiment 5. Questions 1 and 5 are original items from Vosgerau (2010).
Focus
Version 1
Ten outcome questions
Version 2
Ten complementary outcome questions
1. How likely do you think it is that of 80 passengers on an airplane, none of the passengers will have been born on the same day (i.e. same day but not necessarily same year)?
1. How likely do you think it is that of 80 passengers on an airplane, at least two will have been born on the same day (i.e. same day but not necessarily same year)?
2. How likely do you think it is that Roger Federer will win Wimbledon 2014?
2. How likely do you think it is that Roger Federer won’t win Wimbledon 2014?
3. How likely do you think it is that Great Britain will not break their existing record for gold medals in the next summer Olympics?
3. How likely do you think it is that Great Britain will break their existing record for gold medals in the next summer Olympics?
4. How likely do you think it is that Prince William and his wife Catherine won’t have another baby by the end of 2016?
4. How likely do you think it is that Prince William and his wife Catherine will have another baby by the end of 2016?
5. If a six-sided die is tossed four times, how likely do you think a 6 is to appear exactly twice in the four tosses?
5. If a six-sided die is tossed four times, how likely do you think a 6 is to appear fewer or more than two times in the four tosses?
6. How likely do you think it is that the average temperature in South West England for June this year won’t be higher than previous records of the last 10 years?
6. How likely do you think it is that the average temperature in South West England for June this year will be higher than previous records of the last 10 years?
7. How likely do you think it is that it will snow in London in January 2015?
7. How likely do you think it is that it won’t snow in London in January 2015?
8. How likely do you think it is that Scotland will not become independent following the upcoming referendum?
8. How likely do you think it is that Scotland will become independent following the upcoming referendum?
9. How likely do you think it is that we will find a cure to all cancers in the next 20 years?
9. How likely do you think it is that we won’t find a cure to all cancers in the next 20 years?
10. How likely do you think it is that organ donation will become opt out rather than opt in?
10. How likely do you think it is that organ donation will remain opt in rather than become opt out?

THE ROLE OF AROUSAL IN LIKELIHOOD ESTIMATES 31
Results
All but one participant answered all probability questions. Following the procedure of
Vosgerau (2010), outliers further than 2.5 standard deviations away from the mean were
removed from further analyses (n=3). The final sample consisted of 173 participants, an increase
of 22 participants compared to the original study from Vosgerau (2010).
After averaging across the ten probability questions, a 2 (colour: pink/grey) x 2 (focus:
version 1/version 2) between subjects ANOVA was conducted. Expectedly, this ANOVA
yielded a significant main effect of focus, F(1,169)=13.67, p<.001, η2=.08. Participants who
answered version 2 of the questionnaire (see Table 2) gave higher probability estimates
(M=51.67, SD=9.35) compared to participants who answered version 1 (M=46.52, SD=9.03).
Critically, however, colour did not significantly impact probability estimates, F(1,169)=1.05,
p=.31, η2=.01, and there was no colour*focus interaction, F<1 (see Figure 4).
Version 1 Version 245
46
47
48
49
50
51
52
53 not-aroused (grey paper)aroused (pink paper)
Version
Mea
n Pr
obab
ility
Est
imat
e (%
)
Figure 4. Probability estimate means for participants answering version 1 or version 2 on either pink, or grey paper. Error bars represent +/- 1 standard error of the mean.
THE ROLE OF AROUSAL IN LIKELIHOOD ESTIMATES 32
General Discussion
Our aim in the present paper was to test the evidential basis for the role of arousal
misattribution in likelihood judgments, as proposed by the SLH. Experiment 1 included a direct
online measure of physiological arousal, but found no evidence for arousal mediating the
influence of utility on probability estimates when measuring arousal with galvanic skin
responses. We next replicated Studies 1 and 2 of Vosgerau’s (2010) research demonstrating the
stake-likelihood effect. However, we failed to provide any evidence for the existence of such an
effect. In an online experiment, Experiment 2 failed to replicate Vosgerau’s (2010) finding that
when participants attend to the source of their arousal, likelihood estimates decrease.
Experiments 3 and 4 failed to replicate the same finding in a set-up that matched Vosgerau’s
(2010) more closely, using his materials in the laboratory. Quantifying these results, a Bayesian
meta-analysis across Experiments 2, 3 and 4 suggested that the data constituted “some” evidence
for the null hypothesis (Rouder et al., 2009, p.228). Finally, we observed no evidence for an
increase in probability estimates when participants provided their estimates on pink (‘arousing’)
compared to grey (‘unarousing’) paper in Experiment 5.
Since, to the best of our knowledge, no other research has been published exploring the
role of arousal in probability estimates, the combination of our inability to demonstrate the
impact of arousal on probability estimates in Experiment 1 and our inability to reproduce the
original findings of the SLH across four experiments challenges this explanation for the
influence of utility on probability estimates. For a misattribution process to occur, two
independent mechanisms need to take place: First, arousal needs to be created, and next, this
arousal needs to inform the decision-maker. In our experiments, (at least) one of the two
THE ROLE OF AROUSAL IN LIKELIHOOD ESTIMATES 33
processes did not occur. Whilst in Experiment 1 arousal was increased for one of the two
scenarios, this increased arousal did not impact probability estimates.
Similarly, in Experiment 4 arousal ratings decreased when participants rated arousal after
the probability estimates – the only time the evidence appeared to be in favour of the SLH in the
replication experiments. However, it is possible that participants did not enjoy providing
probability estimates, and therefore the decrease might more reflect how much they enjoyed the
game (rather than actual arousal levels). Participants were only informed after they rated arousal
that their estimates were incentivised, which might have increased the pressure to get the
probability right, decreasing enjoyment of the game. However, even if this decrease in arousal
ratings reflected an actual reduction in experienced arousal after individuals provided probability
estimates, we can conclude that greater experienced arousal did not impact probability estimates.
Only together with a decrease in probability estimates would this observation enhance our
understanding of the relationship between utility and probability estimates. Additionally, what
remains unexplained is why arousal decreased in Experiment 4, but not in Experiment 3 (where
an additional mars-bar was promised to participants at the start of the experiment). In sum,
however, the evidence for the role of arousal misattribution across these experiments is
negligible. How, then, should the oft-observed interdependence of utility and estimates of
probability be explained?
As outlined in the Introduction, a number of theories have been proposed. Due to our
continuing failure to observe evidence consistent with a Wishful Thinking bias under controlled
laboratory conditions (Experiment 2 in the present paper; de Moliere et al., 2014; see also, Bar-
Hillel & Budescu, 1995; Bar-Hillel et al., 2008; Krizan & Windschitl, 2007), we will here
expand on what we now believe are the leading candidates for explanations of the undesirability
THE ROLE OF AROUSAL IN LIKELIHOOD ESTIMATES 34
bias (but see Lench, 2009; Lench & Bench, 2012; Lench & Darbor, 2014, for accounts of the
Wishful Thinking effects they observe).
The imagination-based account (Bilgin, 2012; Risen & Gilovich, 2007) proposes that the
greater attention directed to negative events (see e.g., Baumeister, Bratslavsky, Finkenauer, &
Vohs, 2001) leads to an enhanced propensity for spontaneous imagination of undesirable
potential outcomes, making them more cognitively accessible. Consequently, estimates of their
likelihood are inflated (on the link between imagination and subjective probability see Carroll,
1978; Gregory, Cialdini, & Carpenter, 1982; Mevissen, Meertens, Ruiter, & Schaalma, 2012).
Bilgin (2012) observed that confidence in the occurrence of a positive outcome increased when
participants were instructed to imagine the outcome occurring. For negative outcomes, however,
this effect was not observed, but confidence was at the same level as for the ‘imagination-
present’ condition with the positive outcome. This result was taken as evidence that participants
were already engaging in the imagination in the negative outcome condition, even without
instruction.9
The asymmetric loss function account (Weber, 1994) proposes that individuals are aware
of the fallibility of their probability estimates, and also of the costs associated with different
types of error. Specifically, for many negative outcomes it is more costly to underestimate the
likelihood of the negative outcome than it is to overestimate it (e.g., overestimating one’s chance
of a curable fatal disease and thus making an unnecessary trip to the doctor is less costly than
underestimating one’s chance). Consequently, people overestimate the likelihood of negative
events under such situations. The relationship with decisions and consequences suggests that
9 An initial study by our lab failed to replicate this effect (Quantmeyer, 2014), but further work is
required, especially given the empirical support that also exists from Risen and Gilovich (2007).

THE ROLE OF AROUSAL IN LIKELIHOOD ESTIMATES 35
such effects should only be observed when an outcome is controllable (were the fatal disease
incurable, there are no costs associated with estimation errors, since the estimate is immaterial).
Such results were observed in Harris et al. (2009).
On replication
The primary aim of experiments is to test theoretical predictions and assumptions. The
experiments reported in the present paper were all intended to test predictions of the SLH.
Experiments themselves also contain assumptions. The degree to which these assumptions are
plausible represents the internal validity of the experiment.
Experiment 1 made the assumption that an increase in arousal (as conceptualised in the
SLH) would be reflected in an increase in physiological arousal – as measured by EDA (an
approach often employed in psychological research, e.g., Bechara, Damasio, Tranel, & Damasio,
1997; Carnagey, Anderson & Bushman, 2007; Rickard, 2004). Arousal, as included in the SLH,
is not, however, a well specified construct and such an experimental assumption might not be
appropriate. Without greater specification of ‘arousal’ in the SLH, however, the degree to which
EDA is a valid measure of this key construct in the SLH is an impossible one to address,
although EDA is one of the most oft-used measures of physiological arousal (Boucsein, 2012).
Both Experiments 1 and 2 made the assumption that stake in an outcome could be
successfully manipulated within a hypothetical scenario. Given that manipulation check
questions demonstrated that utility was successfully manipulated in Experiment 1, and similar
evidence was obtained from the arousal ratings in Experiment 2, this assumption would seem to
be a fair one, and Experiment 2 had the advantage of a far greater sample size than any of the
other experiments in the paper, or those reported in Vosgerau (2010).
THE ROLE OF AROUSAL IN LIKELIHOOD ESTIMATES 36
Experiments 3, 4 and 5 (direct replications of Vosgerau, 2010) also, of course, contain
experimental assumptions. Robust support for psychological theory comes from converging
evidence from a variety of sources. The results of Experiments 1 and 2 alone already cast doubt
on the status of the SLH, but direct replications have been argued to be the most effective
approach to reduce the impact of false positives in psychology (Cohen, 1994; Fisher, 1935/1956;
Pashler & Harris, 2012; Roediger, 2012). In the direct replications reported here, we followed the
original protocol as closely as possible, and Experiments 3 and 4 were even administered by the
same computer program that was used in the original experiments (provided to us by the author).
Nevertheless, it is impossible to eliminate the possibility that previously unidentified moderators
of the effect led to our inability to replicate the original findings (even Bayesian analyses can’t
rule out these possibilities!) For example, one salient difference between our lab experiments and
those of Vosgerau (2010) is that his were conducted in the U.S. and ours were conducted in the
U.K. Whilst there are no a priori reasons why this should affect the nature of the effect, some
readers might wish to take our findings as evidence against the SLH in the U.K., but maintain its
efficacy in the U.S. To us, however, given the lack of theoretical support for such a position, the
results seem to question the status of the SLH as an explanation for the interdependence of utility
and subjective probability.
In addition, it has been noted that effect sizes in the literature are likely to be greater than
the true effect size (Greenwald, 1975), and when replicating, one should increase the number of
participants to ensure sufficient statistical power (Brandt et al., 2012). Whilst in all our
experiments we ensured that the number of participants was greater than in Vosgerau’s (2010)
original studies, one might argue that our experiments were underpowered and therefore failed to
demonstrate the stake-likelihood effect. Figure 5 is a forest plot displaying the effect sizes from
THE ROLE OF AROUSAL IN LIKELIHOOD ESTIMATES 37
Vosgerau’s (2010) original studies and our replication experiments, with which the reader can
reach their own conclusion as to the evidence in support of the effect. The width of the
confidence intervals reflect the small sample sizes used. However, it can be seen that the effect
size in Vosgerau’s Study 2 is something of an outlier in that it lies outside the 95% confidence
intervals of each of its three replications. Combining across our experiments provided no further
support for the SLH. Finally, Bayes-Factors are more independent from sample size than
conventional hypothesis testing (see Rouder et al. 2009, for a discussion), and we subsequently
feel confident in our conclusions in favor of the null hypothesis in our direct replications of
Vosgerau’s Study 2. Although we did not observe a significant effect in Experiment 5, Figure 5
demonstrates that the effect size is not reliably different from that observed in Vosgerau’s Study
1. Note, however, that this experiment neither manipulated utility or measured arousal and thus
provides very little evidence for the SLH. Experiments 1-4 did all (in one way or another) assess
these constructs, and provided no evidence for the SLH.

THE ROLE OF AROUSAL IN LIKELIHOOD ESTIMATES 38
Figure 5. A forest plot showing the effect sizes (cohen’s d) and their 95% confidence intervals
for Vosgerau’s Studies 2 and 1, and for the present replication attempts.
Conclusion
In conclusion, the experiments reported here provided no evidence for arousal
misattribution as a mechanism for the impact of utility on probability estimates. At this stage, we
contend that champions of the SLH must provide more evidence for the existence of such an
effect. A number of theories have previously been proposed to account for the interdependence
of utility and subjective probability. Whilst there is no prerequisite for these theories to be
mutually exclusive, questioning the empirical research for the SLH necessarily adds to our
understanding of the effect of utility on probability estimates. We propose that research attention
should now turn to delineating the relative contributions of the other accounts put forward in the
literature to explain these effects.

THE ROLE OF AROUSAL IN LIKELIHOOD ESTIMATES 39
Acknowledgements
We thank Joachim Vosgerau for sharing his original materials, as well as for a number of useful
email and verbal communications. We thank Richard Morey for providing us with the R program
for the Bayesian meta analysis as well as numerous email-based discussions about Bayesian
analysis. We thank Miguel Vadillo for helping to produce Figure 5.We thank Emma Breeze,
Jasmine Taylor, Sarita Aujla and So Pei Quan for their help in collecting data and creating the
stimuli used in Experiment 5. We also thank David Shanks and Maarten Speekenbrink for useful
discussions.
References
Anderson, C., John, O. P., & Keltner, D. (2012). The personal sense of power.Journal of
Personality, 80(2), 313-344.
Andreassi, J.L. (2007). Psychophysiology: Human Behavior and Physiological Response.
Lawrence Erlbaum Associates, Mahwah, NJ.
Babad, E. (1995). Can accurate knowledge reduce wishful thinking in voters’ predictions of
election outcomes? The Journal of Psychology, 129, 285-300.
Babad, E., & Katz, Y. (1991). Wishful thinking–against all odds. Journal of Applied Social
Psychology, 21, 1921-1938.
Bar-Hillel, M., & Budescu, D. (1995). The elusive wishful thinking effect. Thinking
and Reasoning, 1, 71-103.

THE ROLE OF AROUSAL IN LIKELIHOOD ESTIMATES 40
Bar-Hillel, M., Budescu, D. V., & Amar, M. (2008). Predicting World Cup results: Do goals
seem more likely when they pay off? Psychonomic Bulletin & Review, 15, 278-283.
Baumeister, R. F., Bratslavsky, E., Finkenauer, C., & Vohs, K. D. (2001). Bad is stronger than
good. Review of General Psychology, 5(4), 323–370.
Bechara, A., Damasio, H., Tranel, D., & Damasio, A. R. (1997). Deciding advantageously before
knowing the advantageous strategy. Science, 275, 1293-1295.
Bem, D. J. (2011). Feeling the future: experimental evidence for anomalous retroactive
influences on cognition and affect. Journal of personality and social psychology, 100(3),
407.
Benedek, M. & Kaernbach, C. (2010). A continuous measure of phasic electrodermal activity.
Journal of Neuroscience Methods, 190, 80-91.
Bilgin, B. (2012). Losses loom more likely than gains: Propensity to imagine losses increases
their subjective probability. Organizational Behavior and Human Decision Processes,
118(2), 203-215.
Boucsein, W. (2012). Electrodermal activity. New York: Springer.
Brandt, M. J. (2013). Do the disadvantaged legitimize the social system? A large-scale test of the
status–legitimacy hypothesis. Journal of personality and social psychology, 104(5), 765.
Carnagey, N. L., Anderson, C. A., & Bushman, B. J. (2007). The effect of video game violence
on physiological desensitization to real-life violence. Journal of Experimental Social
Psychology, 43(3), 489-496.

THE ROLE OF AROUSAL IN LIKELIHOOD ESTIMATES 41
Carroll, J. S. (1978). The effect of imagining an event on expectations for the event: An
interpretation in terms of the availability heuristic. Journal of experimental social
psychology, 14(1), 88-96.
Cantor, J. R., Zillmann, D., & Bryant, J. (1975). Enhancement of experienced sexual arousal in
response to erotic stimuli through misattribution of unrelated residual excitation. Journal of
personality and social psychology, 32(1), 69.
Chabris, C. F., Hebert, B. M., Benjamin, D. J., Beauchamp, J., Cesarini, D., van der Loos, M., ...
& Laibson, D. (2012). Most reported genetic associations with general intelligence are
probably false positives. Psychological science, 0956797611435528.
Cohen, J. (1994). The earth is round (p<. 05). American psychologist, 49(12), 997.
Dawson, M. E., Schell, A. M., & Courtney, C. G. (2011). The skin conductance response,
anticipation, and decision-making. Journal of Neuroscience, Psychology, and
Economics, 4(2), 111.
Dawson, M. E., Schell, A. M., & Filion, D. L. (2007). The electrodermal system. In J.T.
Cacioppo, L.G. Tassiniary, & G.G. Berntson (Eds.). Handbook of psychophysiology (3rd ed.,
pp. 159-181). New York: Cambridge University Press.
Doyen, S., Klein, O., Pichon, C. L., & Cleeremans, A. (2012). Behavioral priming: it's all in the
mind, but whose mind?. PloS one, 7(1), e29081.
Dutton, D. G., & Aron, A. P. (1974). Some evidence for heightened sexual attraction under
conditions of high anxiety. Journal of personality and social psychology, 30(4), 510.
THE ROLE OF AROUSAL IN LIKELIHOOD ESTIMATES 42
Elliott, R. (1964). Physiological activity and performance: A comparison of kindergarten
children with young adults. Psychological Monographs: General and Applied, 78(10), 1.
Figner, B., & Murphy, R. O. (2011). Using skin conductance in judgment and decision making
research. A handbook of process tracing methods for decision research, 163-184.
Fisher, R. A. (1935). The logic of inductive interference (with discussion). Journal of the Royal
Statistical Society, 98(1), 39-82.
Fisher, R. A. (1956). Statistical Methods and Scientific Inference. New York: Hafner.
Gallistel, C. R. (2009). The importance of proving the null. Psychological review, 116(2), 439.
Gilliam, G. E. (1991). The effects of Baker-Miller pink on physiological and cognitive behavior
of emotionally disturbed and regular education students. Behavioral Disorders, 17, 47–55.
Gorn, G., Tuan Pham, M., & Yatming Sin, L. (2001). When arousal influences ad evaluation and
valence does not (and vice versa). Journal of consumer Psychology, 11(1), 43-55.
Granberg, D., & Brent, E. (1983). When prophecy bends: The preference–expectation link in US
presidential elections, 1952–1980. Journal of Personality and Social Psychology, 45(3),
477.
Greenwald, A. G. (1975). Consequences of prejudice against the null hypothis. Psychological
Bulletin, 82, 1-20.
Gregory, W. L., Cialdini, R. B., & Carpenter, K. M. (1982). Self-relevant scenarios as mediators
of likelihood estimates and compliance: Does imagining make it so?. Journal of Personality
and Social Psychology, 43(1), 89.

THE ROLE OF AROUSAL IN LIKELIHOOD ESTIMATES 43
Harris, A. J. L., Corner, A., & Hahn, U. (2009). Estimating the probability of negative events.
Cognition, 110(1), 51–64.
Hayes, A. F. (2013). Introduction to mediation, moderation, and conditional process: A
regression based approach. New York: The Guilford Press.
Ingram, F., & Lieberman, L. R. (1985). Effects of expectations on the performance of hand grip
after viewing selected hues. Perceptual and motor skills, 61(2), 370.
Kass, R. E., & Raftery, A. E. (1995). Bayes factors. Journal of the American Statistical
Association, 90, 773iatio.
Koole, S. L., & Lakens, D. (2012). Rewarding Replications A Sure and Simple Way to Improve
Psychological Science. Perspectives on Psychological Science, 7(6), 608-614.
Krizan, Z., & Windschitl, P. D. (2007). The influence of outcome desirability on
optimism. Psychological Bulletin, 133, 95-121.
Lajante, M., Droulers, O., Dondaine, T., & Amarantini, D. (2012). Opening the “black box” of
electrodermal activity in consumer neuroscience research.Journal of Neuroscience,
Psychology, and Economics, 5(4), 238-249.
Lench, H. C. (2009). Automatic optimism: the affective basis of judgments about the likelihood
of future events. Journal of Experimental Psychology. General, 138(2), 187–200.
Lench, H. C., & Bench, S. W. (2012). Automatic Optimism: Why People Assume Their Futures
will be Bright. Social and Personality Psychology Compass, 6(4), 347–360.
Lench, H. C., & Darbor, K. E. (2014). Negative affective reactions reduce perceived likelihood
of risk. Motivation and Emotion, 38(4), 569–577.

THE ROLE OF AROUSAL IN LIKELIHOOD ESTIMATES 44
Makel, M. C., Plucker, J. A., & Hegarty, B. (2012). Replications in Psychology Research How
Often Do They Really Occur?. Perspectives on Psychological Science, 7(6), 537-542.
Mandel, D. R. (2008). Violations of coherence in subjective probability: A representational and
assessment processes account. Cognition, 106(1), 130-156.
Marteau, T. M., & Bekker, H. (1992). The development of a six--‐item short--‐form of the state
scale of the Spielberger State—Trait Anxiety Inventory (STAI).British Journal of Clinical
Psychology, 31(3), 301-306.
Massey, C., Simmons, J. P., & Armor, D. A. (2011). Hope Over Experience Desirability and the
Persistence of Optimism. Psychological Science, 22(2), 274-281.
Mevissen, F. E., Meertens, R. M., Ruiter, R. A., & Schaalma, H. P. (2012). Bedtime stories: The
effects of self-constructed risk scenarios on imaginability and perceived susceptibility to
sexually transmitted infections. Psychology & health, 27(9), 1036-1047.
Miller, L. C., Murphy, R., & Buss, A. H. (1981). Consciousness of body: Private and public.
Journal of Personality and Social Psychology, 41(2), 397–406.
Mitchell, J. (2014). On the emptiness of failed replications. [Retrieved 30.09.2014 from
http://wjh.harvard.edu/~jmitchel/writing/failed_science.htm]
de Molière, L. (2014). Interdependence of Utility and Probability Estimates: The Role of Social
Power in Distinguishing Theories (Unpublished doctoral dissertation). University College
London, London, United Kingdom.
de Molière, L., Harris, A., Quantmeyer, V. & Hahn, U. (2014). On the Hunt for Wishful
Thinking. Manuscript under revision.

THE ROLE OF AROUSAL IN LIKELIHOOD ESTIMATES 45
Morey, R. D. (2015, April 10). All about that "bias, bias, bias" (it's no trouble). Retrieved August
7, 2015.
Morey, R. D., & Rouder, J. N. (2011). Bayes factor approaches for testing interval null
hypotheses. Psychological methods, 16(4), 406-419.
Naqvi, N. H., & Bechara, A. (2006). Skin conductance: A psychophysiological approach to the
study of decision making. Methods in mind, 103-122.
Open Science Collaboration. (2012). An open, large-scale, collaborative effort to estimate the
reproducibility of psychological science. Perspectives on Psychological Science, 7(6), 657-
660.
Pashler, H., Coburn, N., & Harris, C. R. (2012). Priming of social distance? Failure to replicate
effects on social and food judgments. PloS one, 7(8), e42510.
Pashler, H., & Harris, C. R. (2012). Is the replicability crisis overblown? Three arguments
examined. Perspectives on Psychological Science, 7(6), 531-536.
Pashler, H., Rohrer, D., & Harris, C. R. (2013). Can the goal of honesty be primed?. Journal of
Experimental Social Psychology, 49(6), 959-964.
Pashler, H., & Wagenmakers, E. J. (2012). Editors’ Introduction to the Special Section on
Replicability in Psychological Science A Crisis of Confidence?.Perspectives on
Psychological Science, 7(6), 528-530.
Pellegrini, R. J., & Schauss, A. G. (1980). Muscle strength as a function of exposure to hue
difference in visual stimuli: an experimental test of the kinesoid hypothesis. Journal of
Orthomolecular Psychietry, 9, 144-147.

THE ROLE OF AROUSAL IN LIKELIHOOD ESTIMATES 46
Pellegrini, R. J., Schauss, A. G., & Birk, T. (1980). Leg strength as a function of exposure to
visual stimuli of different hues. Bulletin of the Psychonomic Society, 17, 27-28.
Pleskac, T. J., & Hertwig, R. (in press). Ecologically rational choice and the structure of the
environment. Journal of Experimental Psychology: General, 143, 2000-2019.
Quantmeyer, V. (2014). Do losses loom more likely than gains? The role of imagination.
Unpublished MSc thesis. University College London, London, United Kingdom.
Rickard, N. S. (2004). Intense emotional responses to music: a test of the physiological arousal
hypothesis. Psychology of Music, 32(4), 371-388.
Risen, J. L., & Critcher, C. R. (2011). Visceral fit: While in a visceral state, associated states of
the world seem more likely. Journal of personality and social psychology, 100(5), 777.
Risen, J. L., & Gilovich, T. (2007). Another look at why people are reluctant to exchange lottery
tickets. Journal of Personality and Social Psychology, 93(1), 12.
Roediger, H. L. (2012). Psychology’s woes and a partial cure: The value of replication. APS
Observer, 25(2), 9.
Rouder, J., & Hilgard, J. (2015, April 9). Reply to Uri Simonsohn's Critique of Default Bayesian
Tests. Retrieved August 7, 2015.
Rouder, J. N., Speckman, P. L., Sun, D., Morey, R. D., & Iverson, G. (2009).
Bayesian t tests for accepting and rejecting the null hypothesis. Psychonomic
bulletin & review, 16(2), 225- 237.
Savage, L. J. (1954). The Foundations of Statistics. New York: John Wiley & Sons.

THE ROLE OF AROUSAL IN LIKELIHOOD ESTIMATES 47
Schachter, S., & Singer, J. (1962). Cognitive, social, and physiological determinants of
emotional state. Psychological review, 69(5), 379.
Schandry, R. (1981). Heart beat perception and emotional experience. Psychophysiology, 18(4),
483–8.
Schmidt, S. (2009). Shall we really do it again? The powerful concept of replication is neglected
in the social sciences. Review of General Psychology,13(2), 90.
Schnore, M.M. (1959). Individual patterns of physiological activity as a function of task
differences and degree of arousal. Journal of Experimental Psychology, 58, 117-128.
Shanks, D. R., Newell, B. R., Lee, E. H., Balakrishnan, D., Ekelund, L., Cenac, Z., ... & Moore,
C. (2013). Priming intelligent behavior: An elusive phenomenon.PloS one, 8(4), e56515.
Simmons, J. P., & Massey, C. (2012). Is optimism real?. Journal of Experimental Psychology:
General, 141(4), 630.
Simmons, J. P., Nelson, L. D., & Simonsohn, U. (2011). False-positive psychology undisclosed
flexibility in data collection and analysis allows presenting anything as
significant. Psychological science, 0956797611417632.
Simonsohn, U. (2015, April 9). The default bayesian test is prejudiced against small effects.
Retrieved August 7, 2015.
Slovic, P., Fischhoff, B., & Lichtenstein, S. (1982). Facts versus fears. In D. Kahneman, P.
Slovic, & A. Tversky (Eds.), Judgment Under Uncertainty: Heuristics and Biases (pp.
463-489). Cambridge, UK: Cambridge University Press.
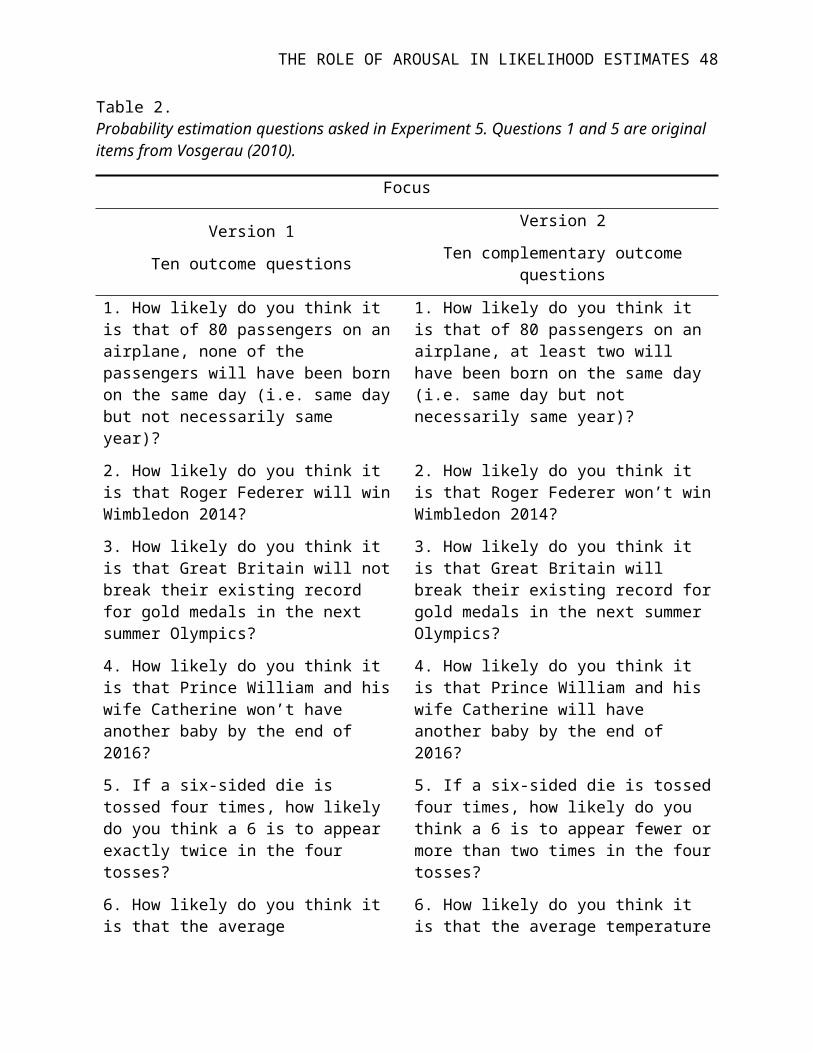
THE ROLE OF AROUSAL IN LIKELIHOOD ESTIMATES 48
Strick, H.K. (2007). George-Louis Leclerc Buffon (1707-1788). Retrieved 29.09.2014 from
http://www.mathematics-in-europe.eu/de/startseite/76-enjoy-maths/strick/654-georges-
louis-leclerc-buffon-1707-1788-by-heinz-klaus-strick-germany.
Stroebe, W., Postmes, T., & Spears, R. (2012). Scientific misconduct and the myth of self-
correction in science. Perspectives on Psychological Science, 7(6), 670-688.
Sundar, S. S., & Kalyanaraman, S. (2004). Arousal, memory, and impression-formation effects
of animation speed in web advertising. Journal of Advertising,33(1), 7-17.
Tukey, J. W. (1969). Analyzing data: Sanctification or detective work?.American
Psychologist, 24(2), 83.
Trope, Y., & Liberman, N. (2000). Temporal construal and time-dependent changes in
preference. Journal of personality and social psychology, 79(6), 876.
Trope, Y., & Liberman, N. (2003). Temporal construal. Psychological review,110(3), 403.
Vosgerau, J. (2010). How prevalent is wishful thinking? Misattribution of arousal causes
optimism and pessimism in subjective probabilities. Journal of Experimental Psychology.
General, 139(1), 32–48.
Vosgerau, J., Wertenbroch, K., & Carmon, Z. (2006). Indeterminacy and live television. Journal
of Consumer Research, 32(4), 487-495.
Wagenmakers, E. J., Wetzels, R., Borsboom, D., & Van Der Maas, H. L. (2011). Why
psychologists must change the way they analyze their data: the case of psi: comment on
Bem (2011).
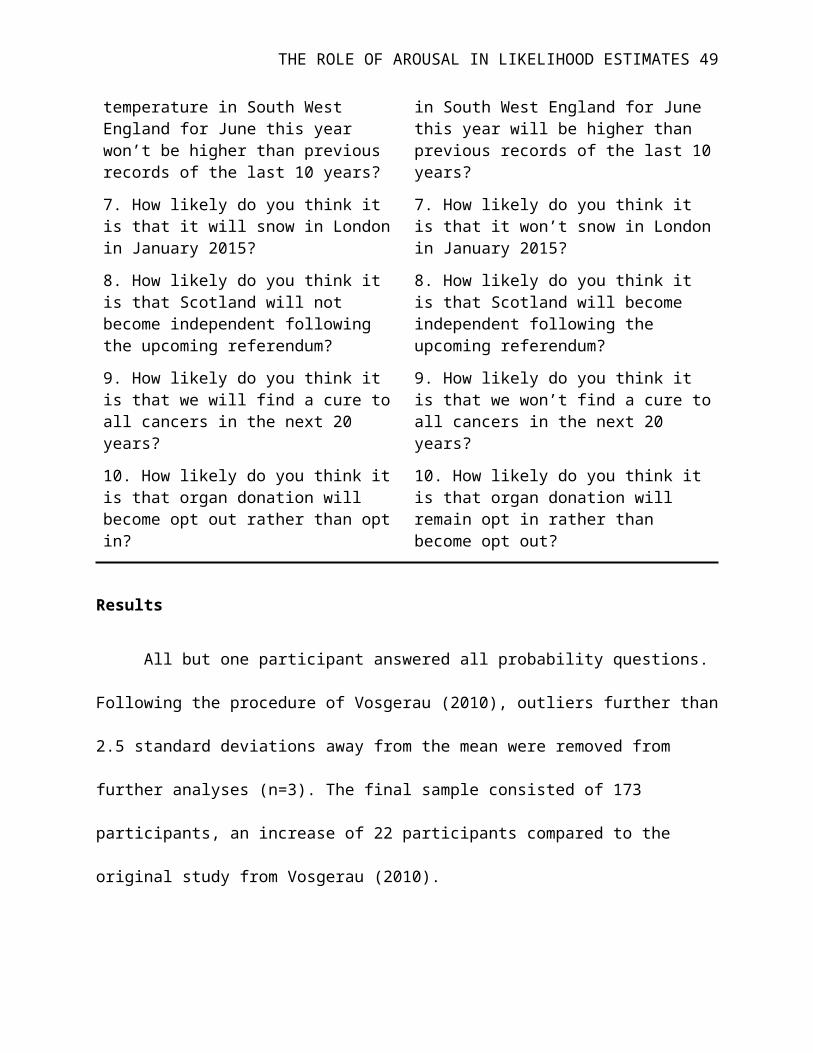
THE ROLE OF AROUSAL IN LIKELIHOOD ESTIMATES 49
Wakslak, C. J. (2012). The where and when of likely and unlikely events.Organizational
Behavior and Human Decision Processes, 117(1), 150-157.
Wakslak, C. J., Trope, Y., Liberman, N., & Alony, R. (2006). Seeing the forest when entry is
unlikely: probability and the mental representation of events. Journal of Experimental
Psychology. General, 135(4), 641–53.
Wakslak, C., & Trope, Y. (2009). The effect of construal level on subjective probability
estimates. Psychological Science, 20(1), 52-58.
Watson, D., Clark, L. A., & Tellegen, A. (1988). Development and validation of brief measures
of positive and negative affect: The PANAS scales. Journal of Personality and Social
Psychology, 54(6), 1063-1070.
Weber, E. U. (1994). From subjective probabilities to decision weights: The effect of asymmetric
loss functions on the evaluation of uncertain outcomes and events. Psychological Bulletin,
115(2), 228–242.
Weber, E. U., & Hilton, D. J. (1990). Contextual effects in the interpretations of probability
words: Perceived base rate and severity of events. Journal of Experimental Psychology:
Human Perception and Performance, 16(4), 781.
Zillmann, D. (1971). Excitation transfer in communication mediated aggressive
behaviour. Journal of Experimental Social Psychology, 4, 419-434.

THE ROLE OF AROUSAL IN LIKELIHOOD ESTIMATES 50
Technical Appendix
EDA measurement
An electrodermal activity (EDA) transducer (Finger Transducer, BSL-SS3LA, Biopac
Systems, Inc) was attached to the index and second finger of the non-dominant hand (all
behavioral responses in the experiment were made with the dominant hand). The transducer
consists of two Ag-AgCl electrodes, each with a 6mm diameter, and was attached with a Velcro
strap after isotonic electrode paste (GEL101, Biopac Systems, Inc, 0.5% saline in neutral base)
was filled into cavities (1.6mm in depth) in the electrodes, and applied onto the finger tips. The
electrodes were connected to a Biopac Student Lab (MP36) system and all cables were
subsequently secured to the table with tape to minimize movement and resulting artefacts. In
order for the electrodes to establish contact with the skin, participants were instructed to relax for
5 minutes. Afterwards a baseline measure of EDA was obtained for a time period of 1 minute.
EDA analysis
EDA features were extracted using the MATLAB toolbox Ledalab (v.3.4.4) by means of
continuous decomposition analysis (Benedek & Kaernach, 2010), allowing for separation
between the tonic and phasic activity. As individuals differ in their mean tonic conductivity, and
in order to infer the relative change of tonic activity following the presentation of emotional
stimuli, we subtracted the mean tonic baseline arousal from the mean tonic arousal experienced
during the completion of each scenario, creating one score for each scenario.


![Order(N) methods in QMC Dario Alfè [d.alfe@ucl.ac.uk]](https://static.fdocuments.in/doc/165x107/56814a83550346895db793cf/ordern-methods-in-qmc-dario-alfe-dalfeuclacuk.jpg)
