Potential Health Risks Associated with Consumption … of Potential Health Risks Associated with...
30
Nueces Bay RC 2005 Characterization of Potential Health Risks Associated with Consumption of Fish and Shellfish from Nueces Bay Nueces County, TX August 2005 Texas Department of State Health Services Seafood and Aquatic Life Group Policy, Standards, and Quality Assurance Unit And Division for Regulatory Services And Environmental and Injury Epidemiology and Toxicology Branch
Transcript of Potential Health Risks Associated with Consumption … of Potential Health Risks Associated with...
Nueces Bay RC 2005
Characterization of Potential Health Risks Associated with Consumption of Fish and Shellfish from
Nueces Bay
Nueces County, TX
August 2005
Texas Department of State Health Services Seafood and Aquatic Life Group
Policy, Standards, and Quality Assurance Unit And
Division for Regulatory Services And
Environmental and Injury Epidemiology and Toxicology Branch

Nueces Bay RC 2005
Nueces Bay RC FINAL 08-29-05 2
INTRODUCTION Nueces Bay is 19,518 acres in size and is part of the Corpus Christi Bay system, which overall covers 124,700 acres along the central Texas coast. The Nueces River empties into Nueces Bay north of the City of Corpus Christi and forms the San Patricio and Nueces county line. Most of Nueces Bay is located in the San Antonio-Nueces coastal basin, but a small portion lies in the Nueces-Rio Grande coastal basin. Nueces Bay is shallow and poorly flushed (average depth: two- to three feet over broad mud flats and scattered oyster reefs), which is characteristic of most coastal bend estuaries. The Corpus Christi Bay system exchanges water with the Gulf of Mexico through Aransas Pass [1]. In 2004, the estimated population of the Corpus Christi, TX metropolitan statistical area (MSA) was over 390,000, of whom more than 281,000 live in Corpus Christi [2]. Several industrial plants and refineries are located near or adjacent to Nueces Bay and to the Dona Park residential neighborhood. Among these is Encycle Texas, Inc. This large hydrometallurgical complex, a subsidiary of the American Smelting and Refining Company (ASARCO), abuts the south side of Nueces Bay. Encycle Texas, Inc. recovers and sells (recycles) nickel, copper, cobalt, tin, zinc, lead, gold, and silver. From 1942 to 1985, ASARCO operated a zinc refinery at this location [3]. Dona Park is a residential neighborhood lying south of the turning basin of the Port of Corpus Christi. Residents of Dona Park complain of numerous health issues, attributing these problems to contamination from the former ASARCO site, to releases from nearby refinery stacks, and to large piles of coke along the canal north of Encycle [3]. Reports exist of releases into the bay. In March 1994, the Texas Natural Resources Conservation Commission (TNRCC, now the Texas Commission on Environmental Quality; TCEQ) reported contamination of neighborhood soils with lead, cadmium, and zinc. In August 1994, responding to Dona Park residents’ concerns for the safety of consuming seafood from Nueces Bay, the Texas Department of State Health Services (DSHS), formerly the Texas Department of Health (TDH), examined fish, blue crabs, and oysters from Nueces Bay. Oysters from the 1994 samples contained zinc (range: 2294-2482 mg/kg) [3]. In January 1995, under authority of Chapter 436 of the Texas Health and Safety Code [4], DSHS closed Nueces Bay to the harvesting of oysters [5] due to zinc concentrations exceeding DSHS risk levels in oysters. Pursuant to that DSHS action, TCEQ classified Nueces Bay as “impaired,” placing the bay on the Texas 303 (d) list [6]. In 2002, with funding from the General Land Office, DSHS collected fish, blue crab, and oyster samples from Nueces Bay to reassess potential health risks from eating contaminated seafood from this water body. DSHS analyzed those samples for arsenic, cadmium, copper, lead, mercury, selenium, zinc, pesticides, polychlorinated biphenyls (PCBs), and semivolatile organic compounds (SVOCs). As expected from historical data, the 2002 study revealed elevated zinc in oysters (range: 479-2300 mg/kg). One of three spotted seatrout samples collected in 2002 contained PCBs at a level that exceeded DSHS guidelines for protection of human health. From the 2002 data, DSHS determined that regular or long-term consumption of zinc-contaminated oysters from Nueces Bay could cause systemic adverse health effects. Those adverse effects include anemia and changes in serum cholesterol profiles. Consequent to the 2002 survey, DSHS concluded that consumption of oysters from Nueces Bay continued to pose a hazard to public health and that prohibition of oyster harvesting from Nueces Bay should remain

Nueces Bay RC 2005
Nueces Bay RC FINAL 08-29-05 3
in force. Inadequate sample numbers limited determination of the probability of adverse health outcomes from consuming PCBs in spotted seatrout. Therefore, DSHS concluded that consumption of spotted seatrout from Nueces Bay constitutes an indeterminate public health hazard. DSHS found nothing in the 2002 survey to suggest that consumption of blue crabs from Nueces Bay or finfish other than spotted seatrout posed a hazard to public health. Subsequent to the 2002 survey, DSHS continued listing Nueces Bay as an area closed to the harvesting of oysters and recommended further sampling of spotted seatrout to better characterize the prevalence of PCBs in this popular game fish. In the present report, generated from samples collected in March 2005, DSHS addresses the public health implications of consuming spotted seatrout contaminated with PCBs, characterizes the geographic extent of oyster zinc contamination in Nueces Bay, and reassesses the impact on public health of consuming zinc-contaminated oysters. METHODS
Fish Tissue Collection and Analysis The DSHS Seafood and Aquatic Life Group (SALG) collects and analyzes edible fish and shellfish from the state’s public waters to evaluate potential risks to the health of people consuming contaminated fish or shellfish. Fish and shellfish tissue sampling follows standard operating procedures from the DSHS Seafood and Aquatic Life Group Survey Branch Standard Operating Procedures and Quality Control/Assurance Manual [7]. The SALG bases its sampling and analysis protocols, in part, on procedures recommended by the United States Environmental Protection Agency (EPA) in that agency’s Guidance for Assessing Chemical Contaminant Data for Use in Fish Advisories, Volume 1 [8]. Advice and direction are also received from the legislatively mandated State of Texas Toxic Substances Coordinating Committee (TSCC) Fish Sampling Advisory Subcommittee (FSAS) [9]. Samples usually represent species, trophic levels, and legal-sized specimens available for consumption from a water body. When practical, the DSHS collects samples from two or more sites within a water body to characterize the geographical distribution of contaminants. The Texas A&M University Geochemical and Environmental Research Group laboratory (GERG laboratory), using established EPA methodology, analyzes fillets (skin off) of fish and edible meats of shellfish (crab and oyster) for common contaminants. Seven metals – arsenic, cadmium, copper, lead, total mercury1, selenium, and zinc – are typically analyzed, as are panels of volatile organic compounds (VOCs), semivolatile organic compounds (SVOCs), pesticides, dioxins, and polychlorinated biphenyls. In the past, the DSHS laboratory analyzed PCBs as Aroclors (Aroclor® 1016, 1221, 1224, 1232, 1248, 1254, and 1260). In the present study, the GERG laboratory, analyzed fish and blue crab tissues for the 209 individual PCB congeners. The laboratory also analyzed fish and blue crabs collected in 2005 from Nueces Bay for metals and pesticides. DSHS commissioned the laboratory to examine oysters for metal content.
1 Nearly all mercury identified in upper trophic-level fish over three years of age is methylmercury [6]. Total mercury is a surrogate for methylmercury concentration in fish and shellfish. Because methylmercury analyses cost much more than total mercury analyses, EPA recommends that states determine total mercury concentrations in fish and that – to protect human health – states assume that all mercury in fish or shellfish is methylmercury. DSHS analyzes fish and shellfish tissues for total mercury. In its risk characterizations, DSHS compares total mercury concentrations in tissues to a comparison value derived from the ATSDR’s minimal risk level for methylmercury [37]. DSHS may utilize the terms “mercury” and “methylmercury” interchangeably to refer to methylmercury in fish.

Nueces Bay RC 2005
Nueces Bay RC FINAL 08-29-05 4
Although the GERG laboratory reports the presence and concentrations of the 209 congeners of PCBs at extremely low detection limits (typically around 1 µg/kg), the toxicity literature does not reflect this state-of-the-art laboratory science. Therefore, DSHS uses recommendations of the National Oceanic and Atmospheric Administration (NOAA) [10] and of McFarland and Clarke [11], along with the EPA’s guidance documents for assessing contaminants in fish tissues [8, 30] to assess the probable toxicity of PCB congeners found in fish and shellfish tissues. Risk assessors sum a total for 43 of a possible 209 PCB congeners for assessing risk associated with consumption of these congeners in fish and shellfish tissues. The cited authorities chose certain congeners for their occurrence in fish and shellfish, for the likelihood of significant toxicity – based on structure-activity relationships – and for their relative abundance in the environment [8, 10, 11]. While using only a portion of a possible 209 congeners may underestimate total PCB concentrations in tissues by omitting many from the summation of total PCBs, the method is consistent with evaluating the systemic toxicity of PCBs through comparisons with information currently available in the EPA’s IRIS database [17]. IRIS information currently encompasses only those congeners likely to have been present in technical mixtures of PCBs similar to Aroclor 1248, Aroclor 1254, and Aroclor 1260. For instance, systemic toxicity estimates reflect comparisons with the RfD for Aroclor 1254, while the cancer potency factor used to assess theoretical lifetime excess cancer risk from exposure to PCBs is based upon a tiered system that accounts for persistence in the environment, occurrence in foodstuffs, and the likelihood of childhood exposures [17]. The GERG laboratory reported total arsenic in each tested sample. However, the major portion of arsenic in fish and shellfish is reportedly organic arsenic, an arsenic form that is virtually non-toxic [12]. Although inorganic arsenic concentrations may differ among species, under different water conditions, and, perhaps, other variables, the predominant literature suggests that well over 90% of arsenic in fish or shellfish is likely organic arsenic [12]. DSHS, taking a conservative approach, estimated around 10% of the total amount of arsenic found in the Nueces Bay samples to be inorganic arsenic and derived the estimates of inorganic arsenic concentrations by multiplying total arsenic by a factor of 0.1.
Description of the Nueces Bay 2005 Sample Set
In March 2005, SALG staff collected 36 fish and 5 composite blue crab samples from five sites around Nueces Bay. Staff members collected 25 composite oyster samples from four sites. SALG used the oyster samples to re-evaluate the continuing applicability of Marine Order 483 (MR 483) that closed Nueces Bay to the harvesting of oysters on January 14, 1995. Risk assessors used data from fish and crabs to examine the potential for human health risks from consuming environmentally contaminated fish or shellfish taken from Nueces Bay in 2005, emphasizing analysis and interpretation of PCBs in spotted seatrout. The SALG utilized measured zinc levels in oysters collected sites within Nueces Bay to determine the spatial distribution of zinc in oysters. The SALG selected five sites to provide spatial coverage of the study area (see Appendix 1 for approximate locations). Site 1 was located near the Central Power and Light Co. outfall, Site 2 near White’s Point, Site 3 along the Portland power line, Site 4 in Gum Hollow near Portland, and Site 5 near the causeway (US 181). However, staff found no living oysters at Site 1.

Nueces Bay RC 2005
Nueces Bay RC FINAL 08-29-05 5
Targeted species were selected based on recreational importance, anecdotal fish- and shellfish-consumption preferences, and on the need to determine spatially-related differences in contaminant concentrations. Target species selected are listed in descending order by the number of samples collected: Eastern oyster (25), spotted seatrout (24), red drum (10), blue crabs (5), and southern flounder (2). Black drum, although prevalent in the bay, were excluded from collection because sampling by the DSHS in 2002 indicated generally low contaminant concentrations in edible tissues of this species. The SALG staff set gill nets and crab traps at each of the sampling sites in the late afternoon and fished them overnight. “Rough” fish collected in the first gill net sets served as cut-bait for the crab traps. The gill nets and crab traps were set out near oyster reefs, available aquatic vegetation, piers, and along power line poles to maximize very limited available cover and habitat in the bay. To keep specimens collected from different sample sites separated, captured fish and blue crabs retrieved from the nets and traps in the early morning hours were placed in individual, labeled mesh bags and kept on wet ice until processed. SALG staff returned remaining live fish and crabs culled from the catch to the bay, while retaining dead fish for crab bait or appropriately disposing of those items. Oysters were hand picked from shallow, wadeable reefs or dredged from deeper reefs using a boat-towed oyster dredge. Collection of spotted seatrout with gill nets proved difficult; only one or two were captured in each gill net set. The gill nets generally captured only hardhead catfish, black drum, stingrays, and menhaden. For efficiency, the SALG staff switched to a hook and line technique, utilizing artificial bait cast and retrieved from the boat while drifting with the tides. Spotted seatrout catch success rate was optimal when drifting parallel to an outgoing or incoming tide. The SALG staff collected 66 total samples with all targeted species represented in the catch. Fish samples submitted to the GERG laboratory for analyses were individual fillets (both fillets were submitted). SALG staff necessarily utilized composite samples for oysters (>200 g per composite) and blue crabs (four to seven eviscerated whole bodies per composite sample). SALG staff processed all fish, blue crab, and oyster samples at the SALG regional office warehouse. Fish samples were weighed and measured to the nearest gram and to the nearest millimeter and were then filleted (skin off) (crabs were measured, only). Each sample was then prepared on an aluminum foil-wrapped cutting board. The SALG staff removed the top shell from each blue crab to expose the internal body cavity, after which the feathery gills just proximal to the legs from the body cavity were taken out along with all loose viscera, mouthparts, and eggs; the body cavity of each crab was thoroughly rinsed with distilled water. The fish fillets and eviscerated crab bodies were wrapped in double layers of aluminum foil, placed in pre-labeled plastic freezer bags, and stored in a chest freezer at the regional office warehouse. SALG staff used oyster knives to shuck oyster samples directly into clean jars, placing the oyster-containing jars in the freezer for temporary storage. The frozen fish, blue crab, and oyster samples were transported on wet ice to SALG headquarters in Austin, TX, where the samples were temporarily stored in a locked freezer. The week following the first sample collection, the SALG delivered the frozen tissue samples on wet ice to the GERG Laboratory for analysis. The SALG shipped the second set of tissue samples frozen (on wet ice) to the GERG laboratory by common carrier during the week following collection.

Nueces Bay RC 2005
Nueces Bay RC FINAL 08-29-05 6
Data Analyses DSHS SALG staff used SPSS® statistical software, versions 13.0 [13] installed on IBM-compatible microcomputers to generate descriptive statistics (mean, standard deviation, median, range, and minimum and maximum concentrations) on all measured compounds in blue crabs, oysters, and in each species of fish. The SALG utilized SPSS® software to determine whether significant differences in zinc or other contaminants occurred among species or at different sites. DSHS compared interactions between species and collection sites and generated graphs with SPSS. The SALG also employed Microsoft Excel® [14] spreadsheets to generate health-based assessment comparison values (HACnonca) for contaminants of interest and to calculate hazard quotients (HQ), hazard indices (HI) cancer risk probability measures, and meal consumption limits for blue crabs, oysters, and fish samples collected in 2005 from Nueces Bay. Statistical analyses and comparison matrices included all samples. SALG risk assessors utilized the USEPA Integrated Environmental Uptake and Biokinetic (IEUBK) model [15] to determine whether consumption of lead in fish and shellfish collected in 2005 from Nueces Bay would significantly increase children’s blood lead (PbB) levels above a cutoff point of 10 µg lead per deciliter of blood. Derivation and Application of Health-Based Assessment Comparison Values (HACs) People who regularly consume contaminated fish or shellfish probably suffer repeated exposures to low concentrations of contaminants over an extended time. Such exposures seldom result in acute toxicity but may increase risk of subtle, chronic, and/or delayed adverse health effects that may include cancer, benign tumors, birth defects, infertility, blood disorders, brain damage, peripheral nerve damage, lung disease, and kidney disease, to name but a few [16]. Presuming people to eat a variety of fish and/or shellfish, the DSHS routinely collapses data across species and sampling sites to evaluate average contaminant concentrations in all samples from a specific water body because such an approach likely reflects consumers’ exposure to contaminants in fish or shellfish over time. However, when relevant, the agency also examines risks associated with ingestion of individual species of fish or shellfish from separate collection sites or at higher concentrations (e.g., the upper 95th percentile of average concentrations). The DSHS evaluates contaminants in fish and shellfish by comparing the average measured concentration of a contaminant to its health-based assessment comparison (HAC) value (measured in milligrams of contaminant per kilogram of edible tissue or mg/kg) derived for non-cancer and cancer endpoints. To derive HAC values for systemic (HACnonca) effects, the department assumes a standard adult weighs 70 kilograms and that adults consume 30 grams of edible tissue per day (about one 8-ounce meal per week). The DSHS uses EPA’s oral reference doses (RfDs) [17] or the Agency for Toxic Substances and Disease Registry’s (ATSDR) chronic oral minimal risk levels (MRLs) [18] to generate HAC values used in evaluating systemic (noncancerous) adverse health effects. EPA defines an RfD as “An estimate of a daily oral exposure for a given duration to the human population (including susceptible subgroups) that is likely to be without an appreciable risk of adverse health effects over a lifetime [19].” The EPA also states, ”It is derived from a BMDL (benchmark dose lower confidence limit), a NOAEL (no observed adverse effect level), a LOAEL (lowest observed adverse effect level), or another suitable point of departure, with uncertainty/variability factors applied to reflect limitations of the data used. [Durations include acute, short-term, subchronic, and chronic and are defined

Nueces Bay RC 2005
Nueces Bay RC FINAL 08-29-05 7
individually in this glossary]” and “RfDs are generally reserved for health effects thought to have a threshold or a low dose limit for producing effects [19].” ATSDR derives minimal risk levels (MRLs) similarly [18]. The DSHS compares the estimated daily dose (mg/kg/day) – derived from the average measured concentration of a contaminant – to the contaminant’s RfD or MRL by using a hazard quotient (HQ). The HQ is “the ratio of the estimated exposure dose of a contaminant (in mg/kg/day) to the contaminant’s RfD or MRL” [20]. For risk management, the DSHS assumes that consumption of fish with a toxicant-to RfD ratio (the HQ) of less than 1.0 is unlikely to result in adverse health effects. The constants (RfDs, MRLs) the DSHS employs to calculate HACnonca values incorporate built-in margins of safety called “uncertainty factors,” as mentioned in EPA reference materials [19]. In developing RfDs and MRLs, scientists utilize uncertainty factors to minimize potential systemic adverse health effects in people who are exposed through consumption of contaminated foodstuffs. Vulnerable groups such as women who are pregnant or lactating, women who may become pregnant, the elderly, infants, children, people with chronic illnesses, or those who consume exceptionally large servings are given special consideration in these calculations, called “sensitivities” by the EPA [19]. The DSHS calculates cancer-risk comparison values (HACca) from the EPA’s chemical-specific cancer slope factors (SFs), derived through mathematical modeling [21]. For carcinogenic outcomes, the DSHS calculates a theoretical lifetime excess risk of cancer using a standard 70-kg body weight and assuming an adult consumes 30 grams of edible tissue per day. Two additional factors are incorporated in determinations of theoretical lifetime excess cancer risk: (1) an acceptable lifetime risk level (ARL [19]) of one excess cancer case in 10,000 persons whose average daily exposure is equal and (2) an exposure period of 30 years. Comparison values used to assess the probability of cancer, thus, do not contain “uncertainty” factors as such. However, conclusions drawn from those probability determinations infer substantial safety margins for all people by virtue of the models utilized to derive the slope factors (cancer potency factors). Because the calculated comparison values (HACnonca and HACca) are conservative, adverse systemic or carcinogenic health effects are unlikely, even if exposures are consistently higher than comparison values. Moreover, comparison values for adverse health effects (systemic or carcinogenic) do not represent sharp dividing lines between safe and unsafe exposures. The perceived strict demarcation between acceptable and unacceptable exposures or risks is primarily a tool to assist risk managers to make decisions that ensure protection of public health. For instance, the DSHS deems it unacceptable when consumption of four or fewer meals per month of contaminated fish or shellfish would result in exposure to contaminant(s) in excess of a HAC value or other measure of risk even when such exposure is unlikely to result in adverse health effects. The department further advises people who wish to minimize exposure to contaminants in fish or shellfish to eat a variety of fish and/or shellfish and to limit consumption of those species most likely to contain toxic contaminants. DSHS aims to protect vulnerable subpopulations with its consumption advice. The DSHS assumes advice that is protective of vulnerable subgroups will also minimize the impact on the general population of consuming contaminated fish or shellfish.

Nueces Bay RC 2005
Nueces Bay RC FINAL 08-29-05 8
Children’s Health Considerations The DSHS recognizes that fetuses, infants, and children may be uniquely susceptible to the effects of toxic chemicals and suggests that exceptional susceptibilities demand special attention [22, 23]. Windows of vulnerability (i.e., critical periods) exist during development, occurring particularly during early gestation, but appearing during pregnancy, infancy, childhood, or adolescence – indeed, anytime during development – times when toxicants can impair or alter the structure or function of vulnerable systems [24]. Unique early vulnerabilities may occur because, at birth, organs and body systems are structurally or functionally immature, continuing to develop throughout infancy, childhood and adolescence. These developmental variables may influence the mechanisms or rates of absorption, metabolism, storage, and excretion of toxicants, any of which factors could alter concentration of biologically effective toxicant at the target organ(s) or modulate response to the toxicant. Children’s exposures to toxicants may be more extensive than adults’ exposures because, in proportion to their body weights, children consume more food and liquids than do adults, another factor that might alter the concentration of toxicant at the target. Infants can ingest small amounts of toxicants through breast milk – an exposure pathway that could go unrecognized [25] (nonetheless, the advantages of breastfeeding outweigh the probability of significant exposure to infants through breast milk and women are encouraged to continue breastfeeding and to limit exposure of their infants by limiting intake of contaminated food [25]. It is possible that children could experience effects at a lower exposure dose than adults because children’s organs may be more sensitive to the effects of toxicants. Stated differently, children’s systems could respond more extensively to a given dose than would adults’ organs exposed to an equivalent dose. Children could be more prone to developing certain cancers from chemical exposures than are adults [26]. In any case, if a chemical – or a class of chemicals –is observed to be – or is thought to be – more toxic to the fetus, infants, or children than to adults, the constants (e.g., RfD, MRL, or CPF) are usually lower to assure protection of the immature system’s potentially greater susceptibility [17]. Additionally, in accordance with the ATSDR’s Child Health Initiative [27] and the EPA’s National Agenda to Protect Children’s Health from Environmental Threats [28], the DSHS further seeks to protect children from the possible negative effects of toxicants in fish and shellfish by suggesting that this potentially sensitive subgroup consume smaller quantities of contaminated fish or shellfish than adults consume. Thusly, DSHS recommends that children weighing 35 kg or less and/or who are 11 years of age or younger limit exposure to contaminated fish or shellfish by consuming smaller meals (no more than four ounces of fish or shellfish per meal). The DSHS also recommends that consumers spread these meals out over time. For instance, if consumption advice recommends eating no more than two meals per month, children consuming affected fish or shellfish should consume no more than 24 meals per year and, ideally, should not eat such fish or shellfish more than twice per month. RESULTS Chemical Analyses The GERG laboratory electronically transmitted the results of chemical analyses on the Nueces Bay samples (Excel spreadsheet) in July 2005. Results consisted of metals, pesticides, and PCBs; the GERG laboratory reported the presence and concentrations of all 209 congeners of PCBs.

Nueces Bay RC 2005
Nueces Bay RC FINAL 08-29-05 9
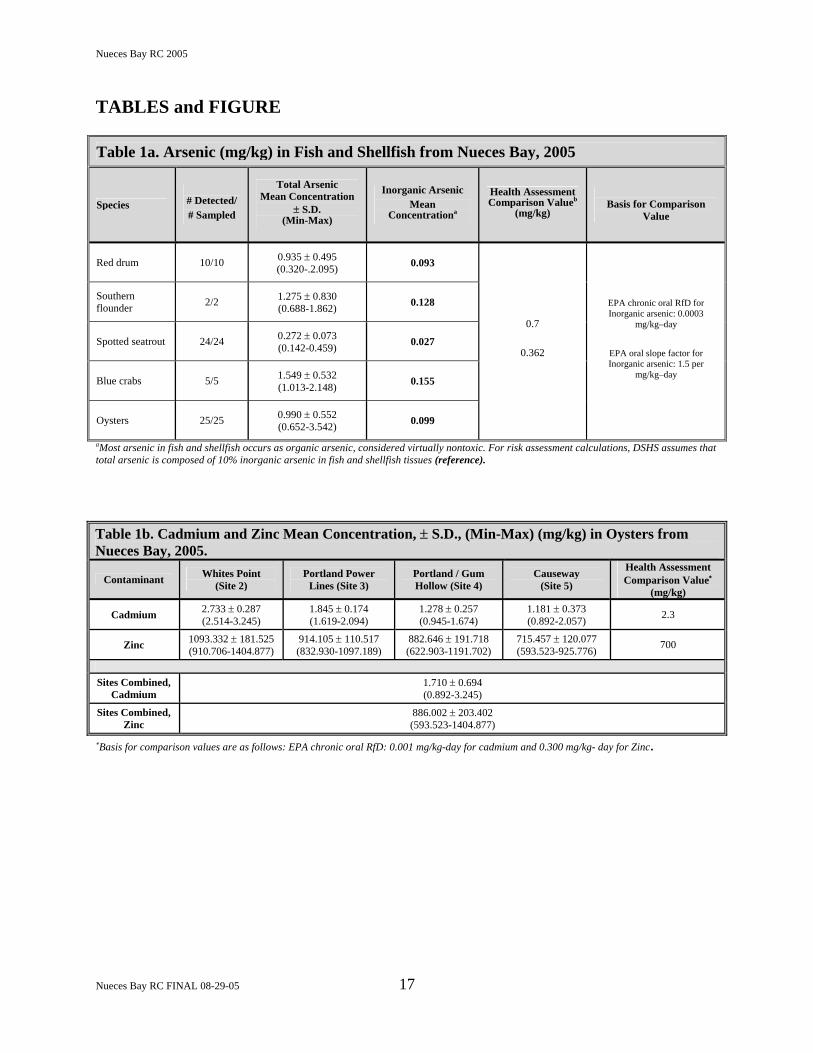
DSHS did not request assessment of dioxins in these samples. After entering field and laboratory data into the spreadsheet and assessing transcription accuracy and other quality control measures, SALG risk assessors performed statistical analyses on the data, using the results to produce the present report. Summary results of chemical analyses for inorganic or metallic contaminants (arsenic, cadmium, copper, lead, mercury, selenium, zinc in fish, blue crab, and oyster samples taken in March 2005 from Nueces Bay are presented in Tables 1a, 1b, 1c, and 1d. Tables 2, 3a, and 3b summarize results of chemical analyses for PCBs and pesticides. The following paragraphs contain written summaries of those data arranged by contaminant. Inorganic or Metallic Contaminants
Arsenic, Cadmium, Copper, Lead, Mercury, and Selenium Inorganic contaminants/constituents such as arsenic, cadmium, copper, lead, mercury, and selenium were reported present in many fish, blue crabs, and oysters at concentrations of no importance to human health. Therefore, the present report addresses only summarily the results of analyses for these contaminants, some of which are essential nutrients [29]. Laboratory analysis revealed arsenic, copper, lead, mercury, and selenium in all fish, blue crab, and oyster samples (Tables 1a, 1c, 1d). Sixty-six of 66 samples contained arsenic, with blue crabs containing the highest average concentration followed by southern flounder, oysters, red drum, and spotted seatrout, in that order (Table 1a). Thirty-six of 66 samples contained cadmium, while six of 36 fish contained cadmium (Table 1a). All blue crabs and all oysters contained this contaminant (Tables 1b, 1c). Oysters contained almost 20 times the cadmium observed in blue crabs (Table 1a). In oysters, copper averaged 40±10.7 mg/kg; in blue crabs, this essential trace element averaged 13.2±2.1 mg/kg (Table 1c). Copper in finfish species averaged 0.281±0.068 mg/kg (data not included in tables) edible tissue. Copper in fish was statistically lower than copper in blue crabs, while oysters contained statistically higher concentrations of copper than did blue crabs or fish. Lead was present in 57 of 66 samples (Table 1c). Blue crab samples contained significantly lower lead levels (0.036±0.031 mg/kg; Table 1c) than did fish (0.067±0.094 mg/kg; data not included in tables), while oysters, with lead averaging 0.187±0.164 mg/kg (Table 1c), contained almost three times as much lead as blue crabs and twice as much lead as fish (combined fish species). All samples collected from Nueces Bay in 2005 contained mercury (Table 1d). Red drum contained the highest concentrations of mercury (0.219±0.113 mg/kg) while oysters contained the lowest levels of this contaminant (0.025±0.004 mg/kg; Table 1d). Other species contained mercury at levels intermediate between these two species. Selenium was present in all samples assayed (Table 1d) Average concentrations ranged from 0.582 mg/kg in to 1.000 mg/kg. Blue crab tissues contained the highest average concentration of selenium, followed by oysters, southern flounder, spotted seatrout, and red drum, in that order.
Zinc Zinc, while present in all samples (Table 1b, 1d), varied widely in concentration among species examined; zinc concentrations were an order of magnitude higher in oysters than in blue crabs

Nueces Bay RC 2005
Nueces Bay RC FINAL 08-29-05 10
and two orders of magnitude higher in oysters than in fish (combined species). The average concentration of zinc in oysters from Nueces Bay was 886±203 mg/kg (Table 1d). The median concentration of zinc in oysters was 866 mg/kg. Blue crab tissues contained an average of 66.7±6.2 mg/kg zinc (Table 1d), while zinc concentration in fish averaged 6.1±3.4 mg/kg edible tissue (data not included in tables). SALG risk assessors examined the spatial distribution of zinc in oysters by collecting and analyzing oyster samples from four sites within Nueces Bay (Table 1b). All oysters contained zinc. Oysters collected at White’s Point contained more zinc (1093±182 mg/kg) than oysters collected at other sites within the bay (Figure 1). Organic Contaminants
Pesticides
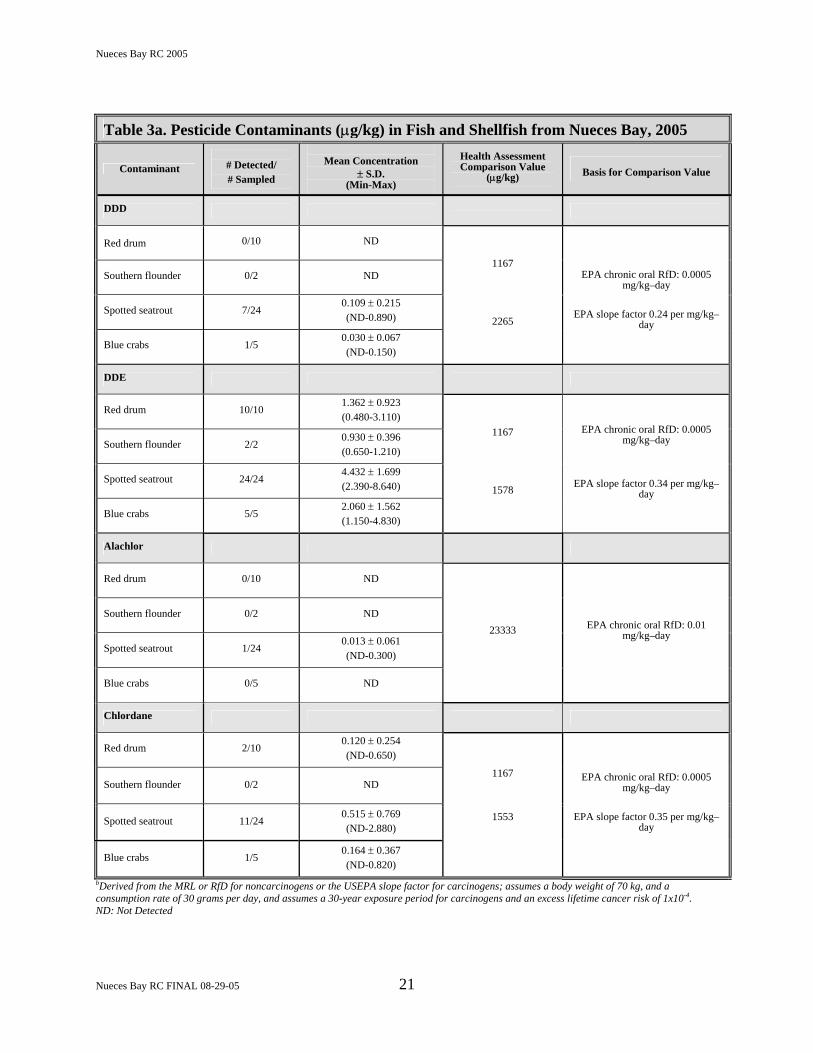
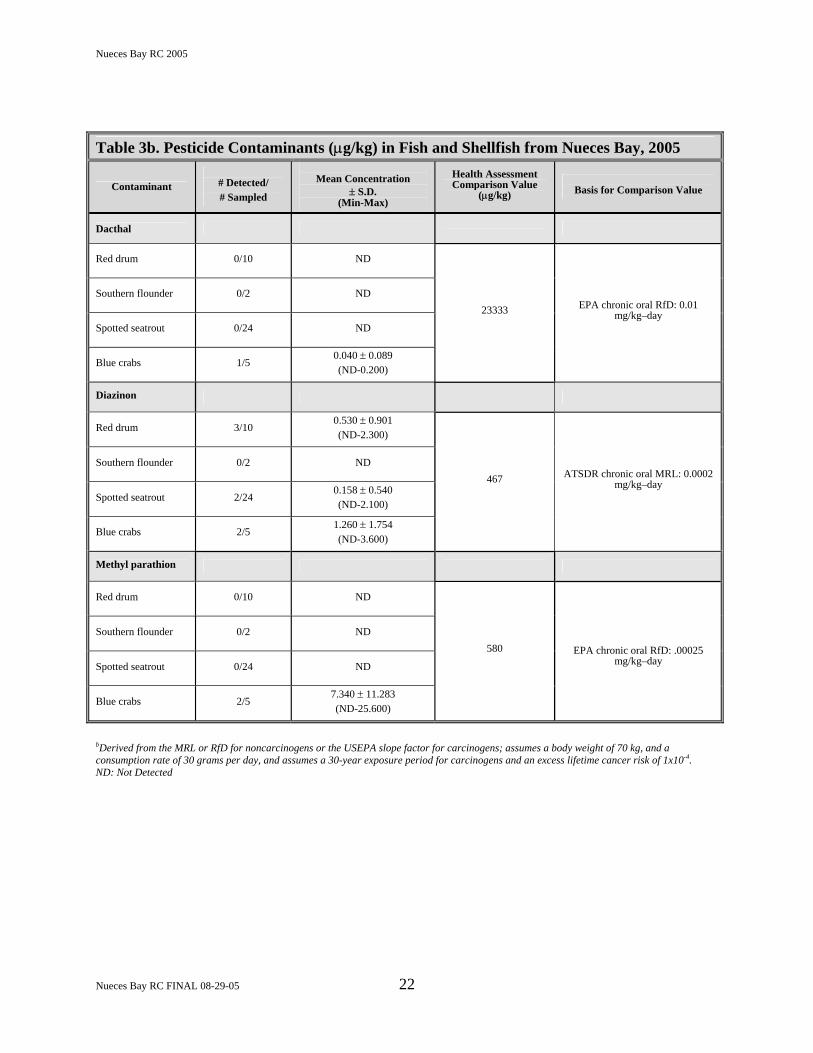
The laboratory reported trace quantities of various pesticides, p,p’-DDD, p,p’-DDE, chlordane, dacthal, and others (Tables 3a, 3b). Blue crabs contained the largest array of pesticides, having traces of DDD, DDE, chlordane, dacthal, diazinon, and methyl parathion. Red drum contained trace levels of DDE, chlordane, and diazinon. Spotted seatrout contained small quantities of DDD, DDE, alachlor, chlordane, and diazinon, while traces of DDE were present in southern flounder. No fish species or blue crab samples contained measurable levels of DDT, the parent compound of DDD and DDE. Not all identified pesticides were reported present in all species sampled for these chemicals. The DSHS did not analyze eastern oysters for pesticides because previous experience has shown this shellfish species is not a major reservoir for most pesticides.
Polychlorinated biphenyls (PCBs) Table 2 contains summary statistics for polychlorinated biphenyls measured in fish and blue crab sampled in March 2005 from Nueces Bay (oysters were not analyzed for PCBs). The laboratory examined blue crabs and three species of fish – spotted seatrout, southern flounder, and red drum for 209 PCB congeners. All fish of all species contained at least one PCB congener, as did all blue crabs. Spotted seatrout contained the highest levels of PCBs (mean = 40.25±11.0 µg/kg), followed by red drum (mean = 25.71±5.90 µg/kg). Blue crabs contained PCBs at an average concentration of 23.59±3.08 µg/kg, while southern flounder had the lowest average concentration of PCBs at 20.38±0.17 µg/kg tissue. Dioxins Samples from Nueces Bay were not analyzed for dioxin content.

Nueces Bay RC 2005
Nueces Bay RC FINAL 08-29-05 11
DISSCUSSION Systemic (Noncancerous) Health Effects from Consumption of Contaminants in Nueces Bay Fish and Shellfish
Arsenic, copper, mercury, selenium Fish blue crabs, and oysters from Nueces Bay contained measurable concentrations of total arsenic, copper, mercury, and selenium. DSHS compared the average concentration of each contaminant to its respective HACnonca for each contaminant (Tables 1a, 1c, 1d). Arsenic, copper, mercury, and selenium concentrations did not exceed their respective HACnonca value or exceed a HQ of 1.0 (Tables 1a, 1c, 1d, 4). Thus, consumption of fish containing any one of these metalloid components is unlikely to have any systemic effect on human health, obviating further discussion of such toxic effects. Furthermore, copper and selenium are essential trace elements present in all vertebrates that are necessary for optimum health in humans and other animals [29].
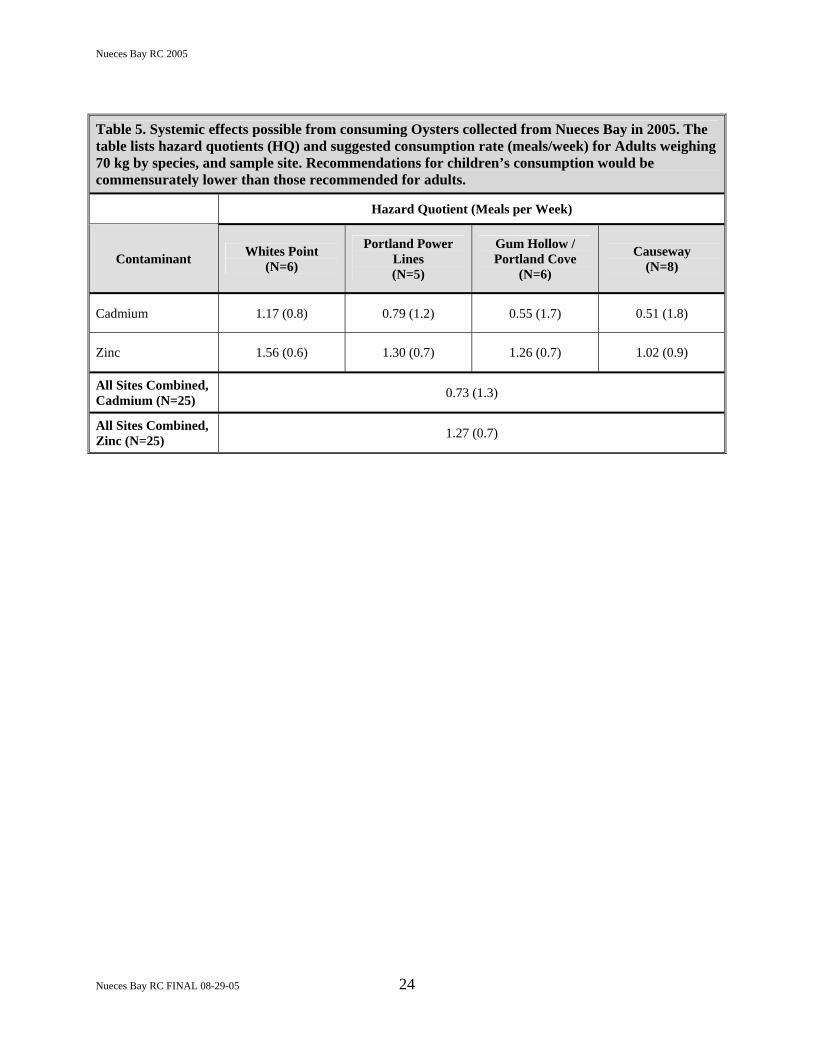
Cadmium Mean cadmium concentrations in oysters collected from all sample sites (N=4) did not exceed the HACnonca value for cadmium (Table 1b) or exceed a HQ of 1.0 (Tables 4, 5). However, mean cadmium concentrations in oysters from Whites Point (Site 2) contained cadmium at levels that exceeded the HACnonca value for cadmium and exceeded a HQ of 1.0 (Tables 1b, 4, 5). Research literature [16] on potential toxic interactions between cadmium in the presence of zinc suggests that zinc antagonizes the toxic effects of cadmium. Thus, consumption of oysters from Nueces Bay containing cadmium is unlikely to have a systemic effect on human health. These findings are predicated upon the observations that only one sampling site yielded oysters with excess cadmium, that oyster harvesting is presently prohibited in Nueces Bay, and upon the reported antagonistic effects of zinc on cadmium toxicity. Fish and blue crab cadmium concentrations did not exceed the HACnonca value for cadmium, nor did cadmium or exceed a HQ of 1.0 (Table 1c - cadmium HQ’s for fish and blue crabs were not included in the tables). Therefore, consumption of fish or blue crabs containing cadmium is also unlikely to result in systemic adverse effects on human health.
Lead
The SALG risk assessors utilized the EPA’s IEUBK to calculate the probability that consumption of 30 g/day of fish, blue crab, or oyster meat containing lead at concentrations from 0 to 0.679 mg/kg (the average concentration +3 standard deviations) would increase blood lead concentrations in children between the ages of 0 and 7 years. In the worst case, less than 0.17% (2/1000 children) of children consuming fish or shellfish from Nueces Bay would have an increase in blood lead levels to a concentration greater than 10 µg/dL. Even so, an increase of consequence to children’s health would occur only if a child’s blood lead was near 10 µg/dL before consumption of lead-contaminated fish or shellfish from Nueces Bay. Using the average lead concentration in oysters – the species containing the highest concentration of lead (0.351 µg/kg) – 0.13% of children’s blood lead would be greater than 10 µg/dL after consuming a meal of fish or shellfish from the bay, a cutoff point accepted as protective of children’s health. Thus,

Nueces Bay RC 2005
Nueces Bay RC FINAL 08-29-05 12
consumption of lead in fish or shellfish from Nueces Bay would not materially increase blood lead concentrations in children whose blood lead concentrations were originally well below 10 µg/dL and should not increase the risk of adverse health outcomes from lead exposure. Mean lead concentrations in fish, blue crabs, and oysters did not exceed the HACnonca value for lead, nor did average lead concentration exceed a HQ of 1.0 (Table 1c, HQ’s for lead not included in tables).
Zinc In contrast to arsenic, cadmium, copper, lead, mercury, and selenium, mean zinc concentrations in oysters exceeded the HACnonca for zinc and exceeded a HQ of 1.0 at all sites measured (Tables 1b, 4, 5). Statistical analyses showed significant differences among zinc levels in oysters collected from Site 2 (Whites Point) and Site 5 (Causeway) (Figure 1). Thus, consumption of oysters from Nueces Bay could pose a risk to human health from the presence of zinc. Mean zinc concentrations in fish and blue crabs did not exceed the HACnonca value for zinc or exceed a HQ of 1.0 (Table 1d, HQ’s for zinc in fish and blue crabs not included in tables). The DSHS also examined the spatial distribution of zinc in oysters by analyzing zinc concentrations in oysters from four of five planned sampling sites. SALG found no living oysters at Site 1, the significance of which finding is unknown. Zinc was significantly higher in oysters collected from Whites Point than was the concentration of this element in oysters collected from other sampling sites within Nueces Bay. The ecological, biological, and environmental significance of the difference in zinc concentration in the oyster samples from Whites Point is unknown. Further studies, including water and sediment sampling, sampling during different times of the year, or sampling under different weather conditions might help to explain these differences in zinc concentrations.
Polychlorinated Biphenyls (PCBs) During 2002 sampling, a single spotted seatrout from Nueces Bay contained PCBs in excess of the HACnonca for PCBs. The DSHS recommended collection of a more representative sample of spotted seatrout for examination of PCBs. In March 2005, the SALG collected 24 spotted seatrout from Nueces Bay. The SALG also examined ten red drum, two southern flounder, and five blue crabs for PCBs. Spotted seatrout contained the highest PCB concentration. The HQ for PCBs in spotted seatrout collected from Nueces Bay in 2005 was less than 1.0, indicating that consumption of spotted seatrout should not pose an unacceptable risk of systemic adverse health effects from PCBs (Table 4). Southern flounders contained the smallest quantities of PCBs measured in this species. The hazard quotient for PCBs in southern flounders was also less than 1.0, as was the hazard quotient for red drum and blue crabs (Table 4). No species contained an average concentration of PCBs that exceeded the HACnonca for PCBs (47.0 µg/kg), although the maximum observed concentration of PCBs – reported in a spotted seatrout – was 65.91 µg/kg (Table 2). Hazard quotients computed from average concentrations of PCBs in fish and blue crabs from Nueces Bay (Table 4) suggest that noncancerous or systemic adverse health effects are an unlikely result of consuming PCB-contaminated fish or shellfish from Nueces Bay.

Nueces Bay RC 2005
Nueces Bay RC FINAL 08-29-05 13
Pesticides Red drum, southern flounder, spotted seatrout, and blue crabs contained trace quantities of various combinations of pesticides (Tables 3a, 3b). In no instance did the concentration of any pesticide approach a level of concern for human health. Cancer Risk from Consumption of Contaminants in Nueces Bay Fish and Shellfish
Inorganic or Metallic Contaminants Inorganic arsenic levels in fish, blue crabs, and oysters from Nueces Bay did not exceed the arsenic HACca value (Table 1a) nor did inorganic arsenic in fish and shellfish from Nueces Bay exceed DSHS cancer risk guidelines for protection of public health (1 excess cancer in 10,000 equally exposed individuals; Table 6). However, one must temper conclusions from such calculations by the known variability of cancer risk calculations, which may differ by orders of magnitude above or below any calculation of theoretical excess risk [17]. Cancer potency factors (slope factors) are not available for cadmium (EPA Cancer Group B), copper (Group D), lead (Group B), mercury (Group C), selenium (Group D), or zinc (Group D) [17]. For this reason, DSHS was unable to determine the probability of excess cancers from consuming fish or shellfish from Nueces Bay that contain cadmium, copper, lead, mercury, selenium, or zinc. It is also important to note that copper, selenium, and zinc are essential trace elements, necessary for health [29].
Organic Contaminants DSHS risk assessors calculated theoretical lifetime excess cancer risks from blue crabs, red drum, southern flounder, and spotted seatrout from Nueces Bay (Table 6). The theoretical increase in risk of cancer from consuming blue crabs, red drum, southern flounder, and spotted seatrout from Nueces Bay that contain chlorinated pesticides or PCBs does not exceed DSHS cancer risk guidelines for protection of public health (1 excess cancer in 10,000 equally exposed individuals) (Table 6). However, one must temper conclusions from such calculations by the variability of cancer risk, which may differ by orders of magnitude above or below any calculation of theoretical excess risk of cancer [17]. Nonetheless, if all fish or blue crabs from Nueces Bay contained the highest observed concentration (65.91µg/kg tissue), the theoretical lifetime excess cancer risk after 30 years’ exposure would be approximately one in 41,300 – a risk about 1/4 that allowed under DSHS guidelines (1 in 10,000). At the average concentration of PCBs in finfish and blue crab samples combined, the calculated theoretical lifetime excess cancer risk would be less than 1 extra cancer in any group of 100,000 people whose only exposure was from consumption of contaminated fish and shellfish from Nueces Bay, a risk about 1/10 that allowable under DSHS guidelines.

Nueces Bay RC 2005
Nueces Bay RC FINAL 08-29-05 14
Cumulative Systemic Adverse Health Effects and Cumulative Cancer Risk from Consumption of Fish or Blue Crabs from Nueces Bay
Inorganic or Metallic Contaminants Fish, blue crabs, and oysters from Nueces Bay contained no metallic contaminants with similar modes of action or that attack the same target organ. Thus, consumption of fish and shellfish from Nueces Bay that contain metallic contaminants should not result in cumulative systemic adverse effects. The cumulative risk of cancer from consuming fish containing carcinogenic metallic contaminants did not exceed DSHS guidelines for protection of public health (1 excess cancer in 10,000 equally exposed individuals). Consumption of fish, blue crabs, or oysters from Nueces Bay that contain multiple metallic contaminants at concentrations similar to those measured should not cause an increase in the theoretical lifetime cancer risk.
Organic Contaminants DSHS risk assessors generated hazard indices (HI’s) for chlorinated pesticides and PCBs to assess cumulative systemic health effects in fish, blue crabs, and oysters from Nueces Bay. Trace levels of chlorinated pesticides observed in samples from Nueces Bay had no discernable effect on the HI or on cancer risk predictions in any species at any site, so chlorinated pesticides were deleted from the calculations, leaving only PCBs in the figures for systemic effects and cancer (pesticide data not shown in tables). The calculated HI’s did not exceed 1.0 for PCBs. Thus, consumption of fish and blue crabs should not result in additive or synergistic systemic adverse effects. The risk of cancer from consuming fish containing PCBs did not exceed DSHS guidelines for protection of public health (1 excess cancer in 10,000 equally exposed individuals – again, traces of chlorinated pesticides reported in these samples did not materially influence cancer risk from consumption of fish, blue crabs, or oysters from Nueces Bay). Therefore, consumption of fish and blue crabs from Nueces Bay that contain PCBs (or pesticides) at concentrations similar to those measured should cause no significant increase in the theoretical lifetime risk of cancer. Conclusions DSHS risk assessors prepare quantitative risk characterizations to determine public health hazards from consumption of fish and shellfish harvested from Texas water bodies by recreational or subsistence fishers, and, if indicated, may suggest risk management strategies to DSHS risk managers who include the Texas Commissioner of State Health Services and others. This study addressed the public health implications of consuming spotted seatrout or other species of fish or shellfish containing PCBs, characterized the geographic extent of oyster zinc contamination in Nueces Bay, and reassessed the impact on public health of consuming zinc-contaminated oysters. The DSHS concludes from the results of the present quantitative risk characterization
1. That oysters from Nueces Bay contain zinc at levels suggesting that regular or long-term consumption could result in systemic adverse health effects that might include anemia and changes in serum cholesterol profiles. Therefore, consumption of oysters from

Nueces Bay RC 2005
Nueces Bay RC FINAL 08-29-05 15
Nueces Bay constitutes a public health hazard due to elevated zinc levels in this species.
2. That spotted seatrout, red drum, and blue crabs from Nueces Bay do not contain
quantities of organic or inorganic substances in excess of DSHS guidelines for protection of human health. Therefore, consumption of spotted seatrout, red drum, and blue crabs from Nueces Bay poses no apparent public health hazard.
Recommendations Risk managers at the DSHS have established criteria for issuing fish consumption advisories based on approaches suggested by the EPA [30]. Confirmation through risk characterization that consumption of four or fewer meals per month (adults: eight ounces per meal; children: four ounces per meal) would result in exposures to toxicants in excess of DSHS health-based guidelines, risk managers may wish to recommend consumption advice for fish and shellfish from the water body in question. Fish possession bans are enforceable under subchapter D of the Texas Health and Safety Code, part 436.061(a) [4]. Declaration of prohibited harvesting areas and classification of oyster growing areas are enforceable under subchapter D of the Texas Health and Safety Code, part 436.091and 436.101 [4]. Consumption advisories are not enforceable by law and carry no penalties for noncompliance. Nonetheless, DSHS consumption advisories inform the public of health hazards from consuming contaminated fish or shellfish so that members of the public can make informed decisions about eating environmentally contaminated fish or shellfish. As an alternative, however, the department may ban possession of fish from the affected water body. The SALG and the Environmental and Injury Epidemiology and Toxicology Branch (EIETB) of DSHS conclude from the data in this risk characterization that consuming oysters from Nueces Bay would pose a threat to public health. Therefore, DSHS recommends
1. That DSHS continues the existing Marine Order 483 (MR-483) that closed Nueces Bay to the harvesting of oysters on January 14, 1995.
2. That, as resources become available, DSHS continues to monitor fish, blue crabs, and
oysters from Nueces Bay for metals, pesticides, PCBs, and other contaminants.
3. That, as resources become available, DSHS conducts additional monitoring of spotted seatrout for PCBs throughout the Corpus Christi Bay system. Because spotted seatrout is a popular sport fish targeted by recreational fishers, additional characterizations of levels of PCBs throughout the Corpus Christi Bay system would allow better assessment of potential human health implications related to consumption of spotted seatrout from this system.
4. That, as resources become available, DSHS conducts additional fish and blue crab tissue
monitoring in the Corpus Christi Bay system – including Nueces Bay – for the presence of dioxins. DSHS has not characterized the likelihood of human health effects of dioxins in fish and shellfish from the Corpus Christi Bay system because data on dioxins has yet to be collected.

Nueces Bay RC 2005
Nueces Bay RC FINAL 08-29-05 16
PUBLIC HEALTH ACTION PLAN The Department of State Health Services publishes fish consumption advisories and bans in a booklet available to the public through the Seafood and Aquatic Life Group: (512-834-6757) [31]. The Seafood and Aquatic Life Group (SALG) also posts this information on the Internet at URL: http://www.tdh.state.tx.us/bfds/ssd. The SALG regularly updates its web site. Some risk characterizations for water bodies surveyed by the Texas Department of State Health Services may also be available from the Agency for Toxic Substances and Disease Registry (http://www.atsdr.cdc.gov/HAC/PHA/region6.html). The Texas Department of State Health Services provides the U.S. Environmental Protection Agency (URL: http://fish.rti.org), the Texas Commission on Environmental Quality (TCEQ; URL: http://www.tceq.state.tx.us), and the Texas Parks and Wildlife Department (TPWD; URL: http://www.tpwd.state.tx.us) with information on all consumption advisories and bans on possession. Each year, the TPWD informs the fishing and hunting public of fishing bans in an official hunting and fishing regulations booklet [32], available at some state parks and at establishments that sell fishing licenses. Readers may direct questions about the scientific information or recommendations in this risk characterization to the Seafood and Aquatic Life Group (512-834-6757 or the Environmental and Injury Epidemiology Branch (512-458-7269) at the Texas Department of State Health Services. Toxicological information on a variety of environmental contaminants found in seafood and other environmental media may also be obtained from the EPA’s IRIS website (http://www.epa.gov/iris/) or from the Agency for Toxic Substances and Disease Registry (ATSDR), Division of Toxicology (800-447-1544) or from the ATSDR website (URL: http://www.atsdr.cdc.gov).
Nueces Bay RC 2005
Nueces Bay RC FINAL 08-29-05 17
TABLES and FIGURE Table 1a. Arsenic (mg/kg) in Fish and Shellfish from Nueces Bay, 2005
Species
# Detected/ # Sampled
Total Arsenic Mean Concentration
± S.D. (Min-Max)
Inorganic Arsenic Mean
Concentrationa
Health Assessment Comparison Valueb
(mg/kg)
Basis for Comparison
Value
Red drum 10/10 0.935 ± 0.495 (0.320-.2.095) 0.093
Southern flounder 2/2 1.275 ± 0.830
(0.688-1.862) 0.128
Spotted seatrout 24/24 0.272 ± 0.073 (0.142-0.459) 0.027
Blue crabs 5/5 1.549 ± 0.532 (1.013-2.148) 0.155
Oysters 25/25 0.990 ± 0.552 (0.652-3.542) 0.099
0.7
0.362
EPA chronic oral RfD for Inorganic arsenic: 0.0003
mg/kg–day
EPA oral slope factor for Inorganic arsenic: 1.5 per
mg/kg–day
aMost arsenic in fish and shellfish occurs as organic arsenic, considered virtually nontoxic. For risk assessment calculations, DSHS assumes that total arsenic is composed of 10% inorganic arsenic in fish and shellfish tissues (reference). Table 1b. Cadmium and Zinc Mean Concentration, ± S.D., (Min-Max) (mg/kg) in Oysters from Nueces Bay, 2005.
Contaminant Whites Point (Site 2)
Portland Power Lines (Site 3)
Portland / Gum Hollow (Site 4)
Causeway (Site 5)
Health Assessment Comparison Value∗
(mg/kg)
Cadmium 2.733 ± 0.287 (2.514-3.245)
1.845 ± 0.174 (1.619-2.094)
1.278 ± 0.257 (0.945-1.674)
1.181 ± 0.373 (0.892-2.057) 2.3
Zinc 1093.332 ± 181.525 (910.706-1404.877)
914.105 ± 110.517 (832.930-1097.189)
882.646 ± 191.718 (622.903-1191.702)
715.457 ± 120.077 (593.523-925.776) 700
Sites Combined,
Cadmium 1.710 ± 0.694 (0.892-3.245)
Sites Combined, Zinc
886.002 ± 203.402 (593.523-1404.877)
∗Basis for comparison values are as follows: EPA chronic oral RfD: 0.001 mg/kg-day for cadmium and 0.300 mg/kg- day for Zinc.

Nueces Bay RC 2005
Nueces Bay RC FINAL 08-29-05 18
Table 1c. Inorganic Contaminants (mg/kg) in Fish and Shellfish from Nueces Bay, 2005
Contaminant
# Detected/ # Sampled
Mean Concentration
± S.D. (Min-Max)
Health Assessment Comparison Valueb
(mg/kg)
Basis for Comparison Value
Cadmium
Red drum 2/10 0.009 ± 0.002 (ND-0.012)
Southern flounder 0/2 ND
Spotted seatrout 4/24 0.010 ± 0.003 ND-0.013)
Blue crabs 5/5 0.107 ± 0.076 (0.019-0.217)
Oysters 25/25 1.710 ± 0.694 (0.892-3.245)
2.3 EPA chronic oral RfD: 0.001 mg/kg–day
Copper
Red drum 10/10 0.272 ± 0.069 (0.167-0.379)
Southern flounder 2/2 0.169 ± 0.007 (0.164-0.174)
Spotted seatrout 24/24 0.293 ± 0.062 (0.144-0.388)
Blue crabs 5/5 13.194 ± 2.145 (9.818-15.697)
Oysters 25/25 40.311 ± 10.727 (25.394-64.806)
333 National Academy of Science Upper Limit: 0.143 mg/kg–day
Lead
Red drum 7/10 0.080 ± 0.071 (ND-0.192)
Southern flounder 2/2 0.043 ± 0.044 (0.012-0.074)
Spotted seatrout 18/24 0.064 ± 0.106 (ND-0.493)
Blue crabs 5/5 0.036 ± 0.031 (0.009-0.087)
Oysters 25/25 0.187 ± 0.164 (0.090-0.937)
0.6 EPA IEUBKwinc
bDerived from the MRL or RfD for noncarcinogens or the USEPA slope factor for carcinogens; assumes a body weight of 70 kg, and a consumption rate of 30 grams per day, and assumes a 30-year exposure period for carcinogens and an excess lifetime cancer risk of 1x10⁻⁴.

Nueces Bay RC 2005
Nueces Bay RC FINAL 08-29-05 19
Table 1d. Inorganic Contaminants (mg/kg) in Fish and Shellfish from Nueces Bay, 2005
Contaminant # Detected / # Sampled
Mean Concentration ± S.D.
(Min-Max)
Health Assessment Comparison Value
(mg/kg) Basis for Comparison Value
Mercury
Red drum 10/10 0.219 ± 0.113 (0.100-0.496)
Southern flounder 2/2 0.072 ± 0.010 (0.065-0.079)
Spotted seatrout 24/24 0.187 ± 0.049 (0.121-0.297)
Blue crabs 5/5 0.126 ± 0.042 (0.073-0.177)
Oysters 25/25 0.025 ± 0.004 (0.019-0.031)
0.7 ATSDR chronic oral MRL: 0.0003 mg/kg–day
Selenium
Red drum 10/10 0.582 ± 0.172 (0.311-0.919)
Southern flounder 2/2 0.870 ± 0.117 (0.787-0.952)
Spotted seatrout 24/24 0.750 ± 0.206 (0.362-1.203)
Blue crabs 5/5 1.000 ± 0.070 (0.941-1.111
Oysters 25/25 0.888 ± 1.370 (0.450-7.451)
6
EPA chronic oral RfD: 0 .005 mg/kg–day ATSDR chronic oral MRL: 0.005 mg/kg–day NAS UL: 0.400 mg/day (0.005 mg/kg–day) RfD or MRL/2: (0.005 mg/kg –day/2= 0.0025 mg/kg–day) to account for other sources of selenium in the diet
Zinc
Red drum 10/10 5.132 ± 2.481 (2.429-11.017)
Southern flounder 2/2 4.657 ± 0.515 (4.292-5.021)
Spotted seatrout 24/24 6.670 ± 3.741 (2.919-18.112)
Blue crabs 5/5 66.668 ± 6.175 (59.302-72.003)
Oysters 25/25 886.002 ± 203.402 (593.523-1404.877)
700 EPA chronic oral RfD: 0.3 mg/kg–day
bDerived from the MRL or RfD for noncarcinogens or the USEPA slope factor for carcinogens; assumes a body weight of 70 kg, and a consumption rate of 30 grams per day, and assumes a 30-year exposure period for carcinogens and an excess lifetime cancer risk of 1x10⁻⁴.

Nueces Bay RC 2005
Nueces Bay RC FINAL 08-29-05 20
Table 2. Polychlorinated Biphenyls (PCBs) (µg/kg) in Fish and Shellfish from Nueces Bay, 2005
Contaminant # Detected / # Sampled
Mean Concentration ± S.D.
(Min-Max)
Health Assessment Comparison Value
(µg/kg) Basis for Comparison Value
Total PCBs
Red drum 5/5 25.71 ± 5.90 (20.50-40.39)
Southern flounder 2/2 20.38 ± 0.17 (20.26, 20.50)
Spotted seatrout 24/24 40.25 ± 11.00 (26.67-65.91)
Blue crabs 5/5 23.59 ± 3.08 (20.13-28.11)
Oysters Not tested
47
272
EPA chronic oral RfD: 0.00002 mg/kg–day
EPA slope factor: 2.0 per mg/kg–day
bDerived from the MRL or RfD for noncarcinogens or the USEPA slope factor for carcinogens; assumes a body weight of 70 kg, and a consumption rate of 30 grams per day, and assumes a 30-year exposure period for carcinogens and an excess lifetime cancer risk of 1x10⁻⁴.
Nueces Bay RC 2005
Nueces Bay RC FINAL 08-29-05 21
Table 3a. Pesticide Contaminants (µg/kg) in Fish and Shellfish from Nueces Bay, 2005
Contaminant
# Detected/ # Sampled
Mean Concentration
± S.D. (Min-Max)
Health Assessment Comparison Value
(µg/kg)
Basis for Comparison Value
DDD
Red drum 0/10 ND
Southern flounder 0/2 ND
Spotted seatrout 7/24 0.109 ± 0.215 (ND-0.890)
Blue crabs 1/5 0.030 ± 0.067 (ND-0.150)
1167
2265
EPA chronic oral RfD: 0.0005
mg/kg–day
EPA slope factor 0.24 per mg/kg–day
DDE
Red drum 10/10 1.362 ± 0.923 (0.480-3.110)
Southern flounder 2/2 0.930 ± 0.396 (0.650-1.210)
Spotted seatrout 24/24 4.432 ± 1.699 (2.390-8.640)
Blue crabs 5/5 2.060 ± 1.562 (1.150-4.830)
1167
1578
EPA chronic oral RfD: 0.0005 mg/kg–day
EPA slope factor 0.34 per mg/kg–day
Alachlor
Red drum 0/10 ND
Southern flounder 0/2 ND
Spotted seatrout 1/24 0.013 ± 0.061 (ND-0.300)
Blue crabs 0/5 ND
23333 EPA chronic oral RfD: 0.01 mg/kg–day
Chlordane
Red drum 2/10 0.120 ± 0.254 (ND-0.650)
Southern flounder 0/2 ND
Spotted seatrout 11/24 0.515 ± 0.769 (ND-2.880)
Blue crabs 1/5 0.164 ± 0.367 (ND-0.820)
1167
1553
EPA chronic oral RfD: 0.0005 mg/kg–day
EPA slope factor 0.35 per mg/kg–
day
bDerived from the MRL or RfD for noncarcinogens or the USEPA slope factor for carcinogens; assumes a body weight of 70 kg, and a consumption rate of 30 grams per day, and assumes a 30-year exposure period for carcinogens and an excess lifetime cancer risk of 1x10⁻⁴. ND: Not Detected
Nueces Bay RC 2005
Nueces Bay RC FINAL 08-29-05 22
bDerived from the MRL or RfD for noncarcinogens or the USEPA slope factor for carcinogens; assumes a body weight of 70 kg, and a consumption rate of 30 grams per day, and assumes a 30-year exposure period for carcinogens and an excess lifetime cancer risk of 1x10⁻⁴. ND: Not Detected
Table 3b. Pesticide Contaminants (µg/kg) in Fish and Shellfish from Nueces Bay, 2005
Contaminant
# Detected/ # Sampled
Mean Concentration
± S.D. (Min-Max)
Health Assessment Comparison Value
(µg/kg)
Basis for Comparison Value
Dacthal
Red drum 0/10 ND
Southern flounder 0/2 ND
Spotted seatrout 0/24 ND
Blue crabs 1/5 0.040 ± 0.089 (ND-0.200)
23333 EPA chronic oral RfD: 0.01 mg/kg–day
Diazinon
Red drum 3/10 0.530 ± 0.901 (ND-2.300)
Southern flounder 0/2 ND
Spotted seatrout 2/24 0.158 ± 0.540 (ND-2.100)
Blue crabs 2/5 1.260 ± 1.754 (ND-3.600)
467 ATSDR chronic oral MRL: 0.0002 mg/kg–day
Methyl parathion
Red drum 0/10 ND
Southern flounder 0/2 ND
Spotted seatrout 0/24 ND
Blue crabs 2/5 7.340 ± 11.283 (ND-25.600)
580
EPA chronic oral RfD: .00025 mg/kg–day

Nueces Bay RC 2005
Nueces Bay RC FINAL 08-29-05 23
Table 4. Systemic effects possible from consuming fish or shellfish collected from Nueces Bay in 2005. The table lists hazard quotients (HQ) and suggested consumption rate (meals/week) for Adults weighing 70 kg by species, all sample sites combined. Recommendations for children’s consumption would be commensurately lower than those recommended for adults.
Species/Contaminant Hazard Quotient Meals per Week
Oysters
Arsenic 0.14 6.5
Cadmium 0.73 1.3
Zinc 1.27 0.7
Blue crabs
Arsenic 0.22 4.2
Mercury 0.18 5.1
Total PCBs 0.51 1.8
Red drum
Arsenic 0.13 6.9
Mercury 0.31 3.0
Total PCBs 0.55 1.7
Southern flounder
Arsenic 0.18 5.1
Total PCBs 0.44 2.1
Spotted seatrout
Mercury 0.27 3.5
Total PCBs 0.86 1.1
Nueces Bay RC 2005
Nueces Bay RC FINAL 08-29-05 24
Table 5. Systemic effects possible from consuming Oysters collected from Nueces Bay in 2005. The table lists hazard quotients (HQ) and suggested consumption rate (meals/week) for Adults weighing 70 kg by species, and sample site. Recommendations for children’s consumption would be commensurately lower than those recommended for adults.
Hazard Quotient (Meals per Week)
Contaminant Whites Point (N=6)
Portland Power Lines (N=5)
Gum Hollow / Portland Cove
(N=6)
Causeway (N=8)
Cadmium 1.17 (0.8) 0.79 (1.2) 0.55 (1.7) 0.51 (1.8)
Zinc 1.56 (0.6) 1.30 (0.7) 1.26 (0.7) 1.02 (0.9)
All Sites Combined, Cadmium (N=25) 0.73 (1.3)
All Sites Combined, Zinc (N=25) 1.27 (0.7)

Nueces Bay RC 2005
Nueces Bay RC FINAL 08-29-05 25
Table 6. Theoretical lifetime excess cancer risk from consumption of fish or shellfish from Nueces Bay, 2005. The table lists excess cancer risk cumulative excess cancer risk and suggested weekly consumption rates for 70-kg adults exposed for up to 30 years by species, all sample sites combined.
Theoretical Lifetime Excess Cancer Risk Species/Contaminant
Risk 1 excess cancer per number exposed
Meals per Week
Oysters
Arsenic 2.7 x 10⁻⁵ 36,663 3.4
Blue crab
Arsenic 4.3 x 10⁻⁵ 23,432 2.2
Total PCBs 8.7 x 10⁻⁶ 115,397 10.7
Cumulative excess cancer risk, blue crab 5.1 x 10⁻⁵ 19,477 1.8
Red drum
Arsenic 2.6 x 10⁻⁵ 38,820 3.6
Total PCBs 9.4 x 10⁻⁶ 105,882 9.8
Cumulative excess cancer risk, red drum 3.5 x 10⁻⁵ 28,405 2.6
Southern flounder
Arsenic 3.5 x 10⁻⁵ 28,468 2.6
Total PCBs 7.5 x 10⁻⁶ 133,573 12.3
Cumulative excess cancer risk, southern flounder 4.3 x 10⁻⁵ 23,466 2.2
Spotted seatrout
Total PCBs 1.5 x 10⁻⁵ 67,633 6.2

Nueces Bay RC 2005
Nueces Bay RC FINAL 08-29-05 26
Whites PointPortlandPowerlines
Nueces BayCauseway
Gum Hollow
Site Name
1400.000
1200.000
1000.000
800.000
600.000
400.000
200.000
0.000
Mea
n Zi
nc (m
g/kg
)
a
a
a
b
Error bars: +/- 1.00
a,b Groups with different letters contain significantly different zinc levels.
Figure 1. Spatial Distribution of Zinc in Oysters Collected in 2005from Nueces Bay

Nueces Bay RC 2005
Nueces Bay RC FINAL 08-29-05 27
Appendix 1

Nueces Bay RC 2005
Nueces Bay RC FINAL 08-29-05 28
SELECTED REFERENCES 1 [TPWD] Texas Parks and Wildlife. Exploring Texas. What’s happening in the Corpus Christi Bay? Information available at URL: http://www.tpwd.state.tx.us/ex;ltx/eft/gulf/habitats/bays_corpuschristibayabout.htm 2 [USCB] United States Census Bureau. 2004 census data for Corpus Christi, TX. Washington, D.C.: 2005. Available at URL: http://factfinder.census/gov/servlet/SAFEPopulation?_event=Search&_name=Corpus+Christi&_state=04000US48&_county=Corpus+Christi&_cityTown=Corpus+Christi&_zip=&+sse=on&-lang=eng&pctxt=fph 3 [TDH] Texas Department of Health, Memorandum to GK Wiles from JF Villanacci concerning Nueces Bay and Port of Corpus Christi Seafood Sampling Data, January 12, 1995 4 Texas Statutes: Health and Safety, Chapter 436, Subchapter D, § 436.011, §436.061 and others 5 [TDH] Texas Department of Health, Marine Order MR-483, 1/14/1995 6 Clean Water Act. 33 USC 125 et seq. 40CFR part 131: Water Quality Standards. 7 [DSHS] Texas Department of State Health Services, Seafood and Aquatic Life Group Standard Operating Procedures and Quality Assurance/Quality Control Manual. Austin, Texas. 2004. 8 [USEPA] U.S. Environmental Protection Agency. Guidance for assessing chemical contaminant data for use in fish advisories. Vol. 1, Fish sampling and analysis, 3rd ed. Washington D.C. 2000. 9 Toxic Substances Coordinating Committee URL: http://www.tscc.state.tx.us/dshs.htm Accessed 08-25-05. 10 Lauenstein, G.G. & Cantillo, A.Y. 1993. Sampling and Analytical Methods of the National Status and Trends Program National Benthic Surveillance and Mussel Watch Projects 1984-1992: Overview and Summary of Methods - Vol I. NOAA Tech. Memo 71. NOAA/CMBAD/ORCA. Silver Spring, MD. 157pp. http://www.ccma.nos.noaa.gov/publications/tm71v1.pdf. 11 McFarland, V.A. & Clarke, J.U. 1989. Environmental occurrence, abundance, and potential toxicity of polychlorinated biphenyl congeners: considerations for a congener-specific analysis. Environmental Health Perspectives. 81:225-239. 12 [ATSDR] Agency for Toxic Substances and Disease Registry Toxicological profile for arsenic (update). U.S. Department of Health and Human Services, Public Health Service. September 2000. 13 SPSS 13 for Windows©. Release 13.0.1. 12 December 2004. Copyright SPSS, Inc., 1989-2004. www.spss.com Accessed August 25, 2005. 14 Microsoft Corporation. Microsoft Excel®2000. Copyright© Microsoft Corporation 1985-1999. 15 [USEPA] United States Environmental Protection Agency. Office of Solid Waste and Emergency Response. Integrated Exposure Uptake Biokinetic Model for Lead in Children (IEUBK). 2004. 16 Casarett and Doull’s Toxicology: The Basic Science of Poisons. 5th ed. Ed. CD Klaassen. Chapter 2, pp. 13-34. McGraw-Hill Health Professions Division, New York, NY, 1996. 17 [IRIS] Integrated risk information system. U.S. Environmental Protection Agency. Office of Research and Development, National Center for Environmental Assessment. Reference Dose: Description and Use in Human Health Risk Assessments. Background Document 1A. 1993, March. http://www.epa.gov/iris/rfd.htm Accessed August 25, 2005.

Nueces Bay RC 2005
Nueces Bay RC FINAL 08-29-05 29
18 [ATSDR] Agency for Toxic Substances and Disease Registry. Minimal Risk Levels for Hazardous Substances. http://www.atsdr.cdc.gov/mrls.html Accessed 08-25-05 19 [USEPA] U.S. Environmental Protection Agency. Glossary of risk assessment-related terms. Washington, D.C.: 1999. Information available at URL: http://www.epa.gov/iris/gloss8.htm 20 [USEPA] U.S. Environmental Protection Agency. Technology Transfer Network. National Air Toxics Assessment. Glossary of Key Terms. Washington, D.C.: 2002. Information available at URL: http://www.epa.gov/ttn/atw/nata/gloss1.html Accessed 08-25-05. 21 [IRIS] Integrated risk information system. U.S. Environmental Protection Agency. Office of Research and Development, National Center for Environmental Assessment. Information available at URL: http://www.epa.gov/iris. 22 Thompson, KM. Changes in Children’s Exposure as a Function of Age and the Relevance of Age Definitions for Exposure and Health Risk Assessment. MedGenMed. 6(3), 2004. URL: http://www.medscape.com/viewarticle/480733. 23 University of Minnesota. Maternal and Child Health Program “Healthy Generations: Children’s Special Vulnerability to Environmental Health Risks. Information available at URL: http://www.epi.umn.edu/mch/resources/hg/hg_enviro.pdf Accessed March 29, 2005. 24 Selevan, SG, CA Kimmel, P Mendola. Identifying Critical Windows of Exposure for Children’s Health. Environmental Health Perspectives Volume 108, Supplement 3, June 2000. Accessed March 29, 2005. 25 Pronczuk J, Akre J, Moy G, Vallenas C. Global perspectives in breast milk contamination: infectious and toxic hazards. Environ Health Perspect 2002 June:110(6):A349-A351. Available from: URL: http://ehp.niehs.nih.gov/members/2002/110pA349-A351pronczuk/pronczuk-full. Accessed March 29, 2005. 26 Schmidt, C.W. Adjusting for Youth: Updated Cancer Risk Guidelines. Environ. Health Perspectives. 111(13):A708-A710. 27 [USDHHS] U.S. Department of Health & Human Services. Public Health Service. Agency for Toxic Substances and Disease Registry. Office of Children’s Health. Child health initiative. Atlanta Ga.: 1995. 28 [USEPA] U.S. Environmental Protection Agency. Office of Research and Development. Strategy for research on environmental risks to children, section 1.2. Washington D.C.: 2000. 29 Reilly, Conor. The Nutritional Trace Metals. Blackwell Publishing, Malden, MA 02148. 2004. 30 [USEPA] U.S. Environmental Protection Agency. Guidance for assessing chemical contaminant data for use in fish advisories. Vol. 2, Risk assessment and fish consumption limits. 3rd ed. Washington, D.C.: 2000. 31 [DSHS] Texas Department of Health. Fish Consumption Advisories and Bans. Seafood Safety Division. Austin, Texas: 2004. 32 [TPWD] Texas Parks and Wildlife Department. 2004-2005 Outdoor Annual: hunting and fishing regulations. Ed. J. Jefferson. Texas Monthly Custom Publishing, a division of Texas Monthly, Inc. 2004. 32 [USDHHS] U.S. Department of Health & Human Services. Public Health Service. [ATSDR] Agency for Toxic Substances and Disease Registry. Toxicological Profile for Mercury (update). Atlanta, GA: 1999 March.

Nueces Bay RC 2005
Nueces Bay RC FINAL 08-29-05 30
REPORT PREPARED BY
Jerry Ann Ward, Ph.D. Toxicologist
Division for Regulatory Services
Michael Tennant, B.S. Environmental Specialist
Seafood and Aquatic Life Division Policy Standards and Quality Assurance Unit
Section of Environmental Health Division for Regulatory Services
Zack Thomas, M.S.
Environmental Specialist Seafood and Aquatic Life Group
Policy Standards and Quality Assurance Unit Section of Environmental Health Division for Regulatory Services
Kirk Wiles, B.S., R.S.
Manager Seafood and Aquatic Life Group
Policy Standards and Quality Assurance Unit Section of Environmental Health Division for Regulatory Services
Gary Heideman, B.S.
Environmental Specialist Seafood and Aquatic Life Group
Policy Standards and Quality Assurance Unit Section of Environmental Health Division for Regulatory Services
Acknowledgements: The authors of this document gratefully acknowledge the technical and editorial assistance of Dr. John Villanacci, of the Environmental and Injury Epidemiology and Toxicology Branch, in the preparation of this document.