Potential Economic Impacts of the Malaysia-Us Free Trade ...
48
Jafari & Othman, Journal of International and Global Economic Studies, 6(1), June 2013, 33-47 33 Potential Economic Impacts of the Malaysia-US Free Trade Agreement Yaghoob Jafari* and Jamal Othman Universiti Kebangsaan Malaysia (UKM) Abstract: This study provides a quantitative economy-wide and sectoral assessment of the likely economic effects of a potential Malaysia-US Free Trade Agreement (MUFTA) on Malaysia and the US economies. The study employed a comparative static, multiple country general equilibrium model, namely the GTAP model. The model simulates the economic impact of the full elimination of bilateral import taxes and export subsidies for Malaysia and the US in the light of proposed MUFTA. Simulation results indicate that the bilateral Malaysia-US FTA is likely to induce an increase in GDP and net welfare for both parties of trade. Additionally, overall trade between Malaysia and the US is poised to expand, while trade with the Rest of the World (ROW) aggregate may decline. Our findings suggest that a bilateral Malaysia-US FTA in merchandise trade can be desirable. However, we emphasis the importance of taking strong caution and wisdom in treating and negotiating the plethora of non tariff, policy impediments instituted by Malaysia so as not to jeopardize her national socio-economic restricting agenda. Keywords: Malaysia-US Free Trade Agreement; Trade liberalization; Computable General Equilibrium Model; GTAP JEL Classification: D58, F11, F13, F15 1. Introduction Free trade Agreements (FTA) seek to remove a policy distortion that affects the free flows of goods and services between the contracting countries with the aim of improving trade and welfare among them. In recent years, there has been a proliferation of bilateral and multilateral Free Trade Agreements (FTAs) across the globe. A number of FTAs which affects Malaysia and the US are also looming. Malaysian and the US are proposing the removal of tariff barriers and expansion of trade between the two nations. The MUFTA aims at further liberalizing Malaysia and the US markets and consequently encourage the trade between them and increase their well being. However, to our understanding, no work has been done to estimate the extent to which such trade agreement affects the economy of Malaysia and the US taking account of impacts on aggregate and economic sectors as well as assessing the implications on gross domestic product, welfare, trade, investment, employment, and natural resources when tariff barriers and enhancement measures are being entirely dismantled. The purpose of this study is to provide a quantitative general macroeconomic and sectoral assessment of economic effects for Malaysia and the US of a potential MUSFTA, in order to assist policy makers in defining its practically, and designing its scope. This study applies the computable general equilibrium (CGE) modeling approach using the Global Trade Analysis project (GTAP) model and the accompanying V8
Transcript of Potential Economic Impacts of the Malaysia-Us Free Trade ...

Jafari & Othman, Journal of International and Global Economic Studies, 6(1), June 2013, 33-47
33
Potential Economic Impacts of the Malaysia-US
Free Trade Agreement
Yaghoob Jafari* and Jamal Othman
Universiti Kebangsaan Malaysia (UKM)
Abstract: This study provides a quantitative economy-wide and sectoral assessment of the likely
economic effects of a potential Malaysia-US Free Trade Agreement (MUFTA) on Malaysia and
the US economies. The study employed a comparative static, multiple country general
equilibrium model, namely the GTAP model. The model simulates the economic impact of the
full elimination of bilateral import taxes and export subsidies for Malaysia and the US in the
light of proposed MUFTA. Simulation results indicate that the bilateral Malaysia-US FTA is
likely to induce an increase in GDP and net welfare for both parties of trade. Additionally,
overall trade between Malaysia and the US is poised to expand, while trade with the Rest of the
World (ROW) aggregate may decline. Our findings suggest that a bilateral Malaysia-US FTA in
merchandise trade can be desirable. However, we emphasis the importance of taking strong
caution and wisdom in treating and negotiating the plethora of non tariff, policy impediments
instituted by Malaysia so as not to jeopardize her national socio-economic restricting agenda.
Keywords: Malaysia-US Free Trade Agreement; Trade liberalization; Computable General
Equilibrium Model; GTAP
JEL Classification: D58, F11, F13, F15
1. Introduction
Free trade Agreements (FTA) seek to remove a policy distortion that affects the free flows of
goods and services between the contracting countries with the aim of improving trade and
welfare among them. In recent years, there has been a proliferation of bilateral and multilateral
Free Trade Agreements (FTAs) across the globe. A number of FTAs which affects Malaysia and
the US are also looming. Malaysian and the US are proposing the removal of tariff barriers and
expansion of trade between the two nations. The MUFTA aims at further liberalizing Malaysia
and the US markets and consequently encourage the trade between them and increase their well
being. However, to our understanding, no work has been done to estimate the extent to which
such trade agreement affects the economy of Malaysia and the US taking account of impacts on
aggregate and economic sectors as well as assessing the implications on gross domestic product,
welfare, trade, investment, employment, and natural resources when tariff barriers and
enhancement measures are being entirely dismantled. The purpose of this study is to provide a
quantitative general macroeconomic and sectoral assessment of economic effects for Malaysia
and the US of a potential MUSFTA, in order to assist policy makers in defining its practically,
and designing its scope. This study applies the computable general equilibrium (CGE) modeling
approach using the Global Trade Analysis project (GTAP) model and the accompanying V8

Jafari & Othman, Journal of International and Global Economic Studies, 6(1), June 2013, 33-47
34
database for a quantitative analysis of the economic effects of a free trade arrangement between
the contracting countries. A full-fledge trade liberalization of tariff barriers is examined.
2. State of Trade between Malaysia and the USA
Table 1 depicts the state of bilateral trade levels between Malaysia and the USA in comparison
with the Rest of the World (ROW) in aggregate. It clearly indicates that the trade between
Malaysia and the US has been large. Almost 20 percent of Malaysian export found its market in
the USA and this is relatively higher than the share of the ROW export to the US. In addition,
Malaysia market constituted 1.2 percent of the USA total merchandise exports. This is slightly
higher relative to that of ROW, which is accounted for only 1 percent.
3. Methodology
3.1. The GTAP Model
The framework used in this study is the GTAP (The Global trade analysis Project) model
developed by the Center for Global Trade Analysis, Purdue University to appraise the economic
wide impact of free trade among Malaysia and the US. The GTAP model is a multi regional,
comparative static, exogenous policy, and applied general equilibrium (AGE) model based on
neoclassical assumptions and equilibrium condition that follows Walras' law. The model to date
has been the most widely used tool for the ex ante analysis of economy-wide trade effects of
multilateral or bilateral trade agreement. The GTAP database is also widely used in a number of
multi-country CGE models such as MIRAGE.
The demand side of the GTAP model assumes that national income is allocated based on
constant value shares among three types of final demand- government, private households, and
saving- using an aggregate Cobb-Douglass utility function. The representative household in each
region maximize a non homothetic constant difference of elasticity expenditure (CDE) function.
Bilateral trade in the model uses the Armington assumption, which distinguishes imports by
origins. Production in each country and all sectors assume constant return to scale technology
and competitive markets. A Leontief, multi level production function, represents the production
for each sector in each country. It involves value added and intermediate inputs sourced from
country input-output tables. A nested CES function models the demand for factors and
intermediate inputs. Firm use a mix of domestically produced and imported goods, in which the
optimal max of both goods is determined given domestic and import prices.
Labor is assumed to be mobile across sectors but not across countries. However, capital is
mobile across both sectors and countries. Saving and capital is determined endogenously through
a fictitious Global Bank. The Global Bank allocates investment across regions such that it
equates the changes in the expected returns across countries.
The ratio of market price to world price gives the magnitude of trade policies (taxes or
subsidies). Specifically, in the case of import tax, market prices are higher than CIF price so that

Jafari & Othman, Journal of International and Global Economic Studies, 6(1), June 2013, 33-47
35
the power of the ad valorem tax is greater than one. Likewise, for export subsidy market price is
greater than FOB price.
Limitations of the GTAP model include the constant returns to scale assumption and competitive
markets. Some sectors of economy might exhibit imperfect competition and economics of scale.
The Armington assumption does not allow relocation of firms across countries. This assumption
also presumes every country has market power and is able to affect its terms of trade. The
comparative static feature of the model may also lead to problems in appraising the timing of the
FTA. While the GTAP model has a distinct strength in examining the impact of trade policies on
merchandise flow, the model is clearly lacking in bilateral trade of FDIs and ownership data.
Furthermore, trade in services sector is viewed from the perspective of balance of payments, not
from the “modes of supply” framework as defined by General Agreement on Trade in Services
(GATS). There is also no explicit treatment of public expenditures, short term investment flows
(domestic and foreign), barrier to services trade, as well as non tariff barriers (NTBs) and
technical barriers to trade (TBTs). Given the above limitations, the use of GTAP may
underestimate the true impacts of an FTA.
The GTAP model is by no means perfect but it is capable to provide meaningful inside to policy
makers on the general equilibrium economy-wide and cross country repercussions of a free trade
scenario between Malaysia and the US.
3.2. The GTAP Database
This study uses the latest GTAP8 database which carries a snapshot of the 2007 world economy.
The database has 129 regions (aggregate of 226 countries) and 57 sectors. The database is
formatted as an input-output structure within each country with bilateral international trade
values expressed in USD million. Granularity of the bilateral trade data extends down to the
sector level in order to analyze the effects of trade policy change on the sector level. The sectoral
definitions in the database follow the Central Product Classification (CPC) for agricultural &
food processing and International Standard Industrial Classification (ISIC) for all others. While
the database is rather old, we presume that is would still be relevant to reflect the policy context
in this study, as the major changes in tariff structure prior to 2007 had been captured in the
database. There was also no attempt to benchmark the database to reflect the various changes in
current international trade relation, including FTAs such as ASEAN Free Trade Agreement. We
suppose that such trade frameworks have not made substantial inroads in terms of changing the
course of trade flows such that it becomes incoherent with the structure (internal consistency) of
2007 database. Moreover the focus of our analysis will be on percentage change or order of
magnitude, rather than the fine tune absolute numbers of trade figures.
3.3. Sectoral and Regional Aggregation
In this study, the world economy was modeled to comprise of Malaysia, the US and the rest of
the world (ROW) aggregated. In addition, all original 57 sectors are aggregated to 8 new sectors.
Table 2 shows the sectoral aggregation. The description of each sectoral aggregate is shown in
Appendix 1.

Jafari & Othman, Journal of International and Global Economic Studies, 6(1), June 2013, 33-47
36
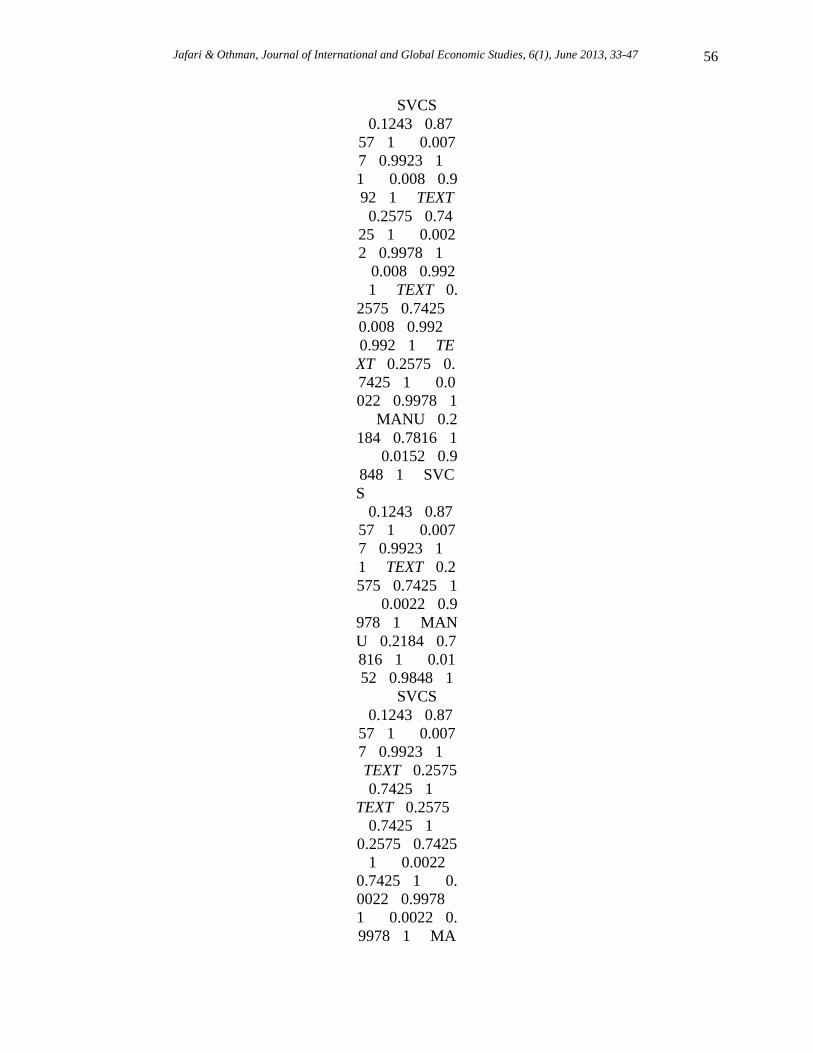
Table 3 indicates the bilateral state of export between Malaysia and the USA in sectoral details.
It obviously indicates that the most outstanding sector in terms of export demand share in the US
market is textiles and wearing apparel sector. Malaysian export of this commodity to the US is
accounted for the 25.7 percent of its export to the world. Another outstanding sector in terms of
export demand share in the US market is manufacturing sector. Malaysian export of these
commodities stood for the 21.8 percent of export to the world. The USA market accounts for 13
percent of Malaysian processed food and services exports on average while other sectors have
found relatively smaller market share. On the Other hand, Malaysia herself stands for 1.5 percent
of the export of the USA from manufacturing products. Malaysian market accounted for a small
share for the exports of the US in other sectors.
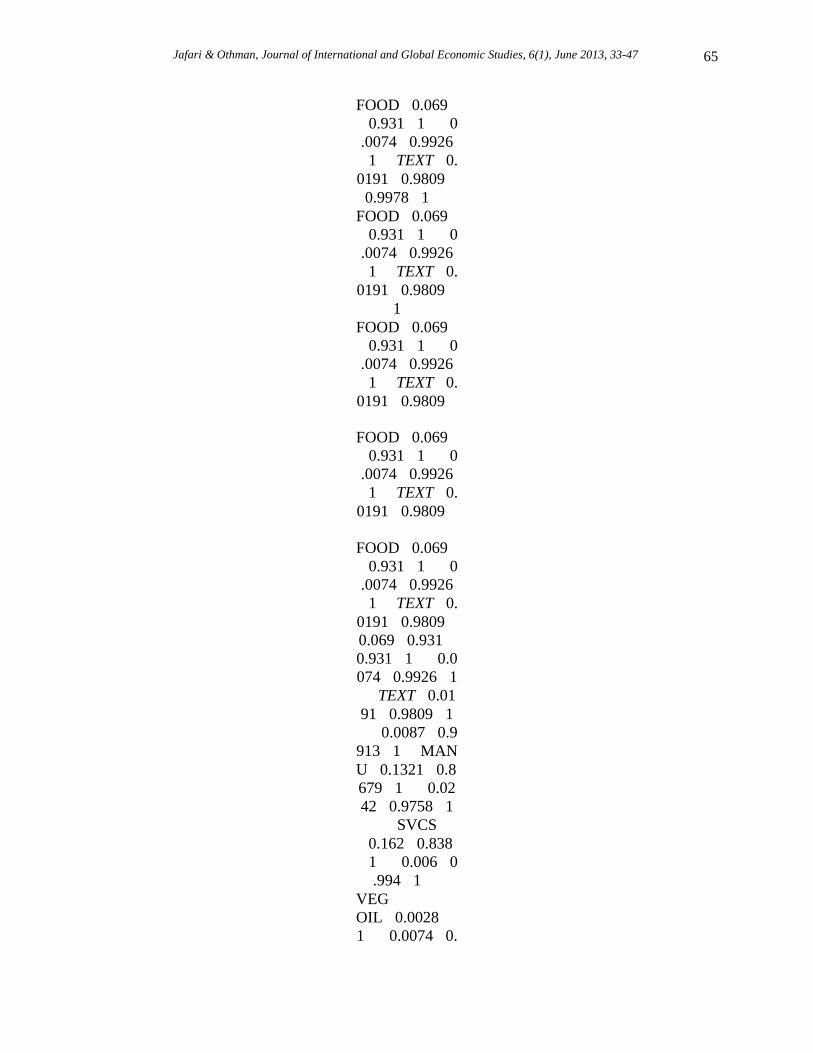
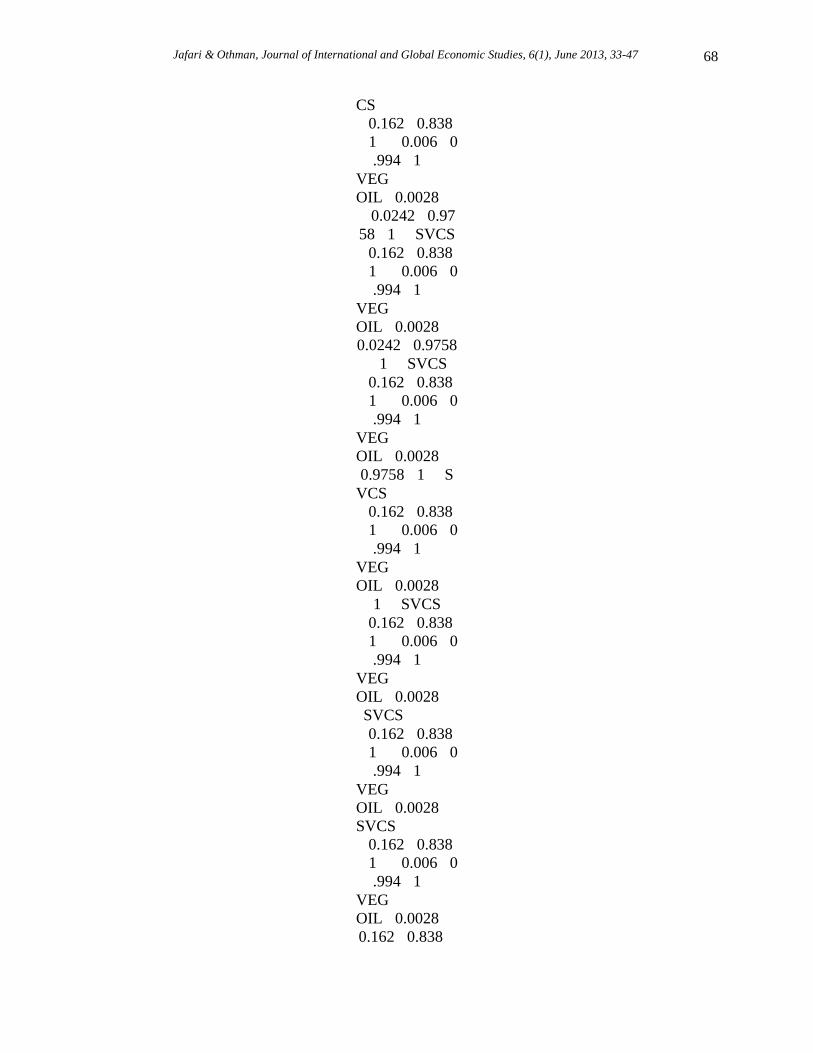
Table 4 indicates the state of bilateral state of export between Malaysia and the USA in sectoral
details. It reveals that almost 13 percent of Malaysian import comes from the USA and Malaysia
herself contributing to 1.8 percent of the USA total import. Malaysian import of services from
the USA is 16 percent of her total imports of services. Furthermore, 13 percent of Malaysian
total import of the manufacturing products and agricultural sector from the USA stands for 12
percent of total Malaysian agricultural imports while other sectors’ import from the USA have a
relatively minute share. On the other hand, the Malaysian manufacturing and vegetable oil are
two outstanding sectors in terms of their importance in import basket of the US from this
product. The US total import of vegetable oil and manufacturing products from Malaysia are
respectively 7.4 and 2.4 percent of its total respective imports. As noted at the outset, it will be
interesting to examine whether removals of trade impediments, particularly tariff barriers will
enhance bilateral trade among contracting countries substantially.
3.4. Decomposition of Import and Export Taxes/Subsidies
Tables 5 and 6 depict the baseline levels of trade policies among Malaysia, the US and ROW
economies. Table 4 shows that import taxes instituted on FOOD (40 percent) have been the
heaviest in Malaysia. The RAWAG sector (30 percent) in Malaysia is the second most protected
sector, followed by TEXT (14 percent). Malaysia levied the higher import levy on all products
(except animal product) relative to the US. On the other hand, the US also protected highly its
TEXT (21 percent). The FOOD is the second most protected sector in the US followed by animal
product and RAWAG. For export subsidies, generally they have been very low across countries
and commodities (Table 5).
4. Simulation Results
This study considers a fully-fledged liberalization of tradable commodities, which is the
elimination of bilateral trade policies, including protectionism policies (import tariffs) and
enhancement policies (export subsidies) on tradable good between Malaysia and the US from the
2007 base year, while other trade distortions in other countries remained unchanged. The
following subsections are presented and discussed in details and the results obtained from the
empirical analysis of impacts on growth, trade and welfare effects on selected economic
variables on the economy of Malaysia and the USA.
Jafari & Othman, Journal of International and Global Economic Studies, 6(1), June 2013, 33-47
37
4.1. Impact on Trade
The most important examination in this study is whether complete removals of trade
impediments between Malaysia and the US would enhance trade between them. Table 7 below
shows the expected share of trade across the three aggregated regions following the removals of
such impediments. To appreciate the magnitude of changes, the figures should well be contrasted
to that of the baseline levels as in Table 1. Trade between Malaysia and the US is expected to
increase. The export share of Malaysian to the US is expected to increase to 20 percent and the
export share of the US to Malaysia is expected to increase to 1.5 percent. This represents a
microscopic increase from the baseline level of 19 percent and 1.2 percent (Table 1). However, it
is projected that the global share of trade for both parties will decrease.
Table 8 shows the change in export in terms of absolute values as compared to the baseline
levels. As shown, following a free trade, the Malaysia’s export to the USA would increase by
USD 30984 million or 7 percent and the US export to Malaysia would increase by USD 16051
million(22 percent). The substantial increase in the volume of export between two countries is
due to removal of trade barriers. The higher increase in the US export to Malaysia relative to the
Malaysia export to the US is because Malaysia currently has a higher tariff than the US.
Further, the export of Malaysia and the US to the world is expected to decline by 0.8 percent and
0.1 percent respectively. The results suggest that if increasing the bilateral trade is an important
objective of the MUFTA, then very likely it would success. However, the total trade of parties of
agreement will be decreased.
4.2. Effect on Real GDP and Sectoral Output
As shown in Table 9, the impact on removal of all bilateral trade policies (import tariff and
export subsidies/taxes) on goods trade between Malaysia and the US on real GDP are highly
insignificant as the changes in countries total trade is very small. Malaysian GDP is expected to
gain albeit dreadfully minute. The GDP of ROW may, however, see a minute decrease while the
US GDP would remain unchanged. Hence, the change in the US GDP is smaller than that of
Malaysia because the USA is the first Malaysian major trade partner while the Malaysian market
constitutes 1.2 percent of the USA export (Table 1). Apart from this, Malaysian economy is far
smaller than the US economy and her economy is expected to be affected more than the US.
Among the economic sectors in Malaysia, the output of TEXT is projected to boost remarkably
by 33 percent. The output of ANIMAL and FOOD are poised to generate some small benefits to
Malaysia. However, the product of RAWAG, VEG OIL, MANU, EXTRACTION and SVCS
would experience a small fall in output. On the other hand, the RAWAG in the US would
experience a larger output increase relative to the FOOD while the product of other sectors is
projected to decline (albeit the decline is very small). Moreover, the share of each component in
GDP in post simulation result remained unchanged compared to the pre simulation results.
The impact of changes in output will affect the demand for primary factors of production. As it is
indicated in Table (10) the RAWAG sector is likely to reduce its demand for every primary
factor. Reduction in demand for primary factors is due to contraction in production of RAWAG

Jafari & Othman, Journal of International and Global Economic Studies, 6(1), June 2013, 33-47
38
products. On the other hand, ANIMAL, FOOD, and TEXT sector are expected to employ more
of primary factors of production. In addition, EXTRACTION, MANU and SVCs sector is
expected to demand less for labor (skilled and unskilled labor), and capital while these sectors
are expected to increase land demand.
4.3. Effects on Trade Balance
As depicted in table 11, the overall trade balances for both parties of trade moves in the negative
direction while the ROW trade balance would increase. However, the direction of trade balance
is different across the sectors. In Malaysia the TEXT and ANIMAL products cannot cover the
negative trade balance from MANU, SVCS, RAWAG, VEG OIL, EXTRACTION and FOOD.
Appendix 2 provides the details of percentage change estimates in Malaysian exports and
imports by her partner and sectors. The US also is expected to experience the negative change in
trade balance and in a higher magnitude relative to Malaysia. In the US, the trade balance for
FOOD and RAWAG is projected to improve. However, this improvement is not capable of
covering the negative trade balance from TEXT, ANIMAL, MANU, SVCS, ANIMAL
EXTRACTION, and VEG OIL.
4.4. Impact on Welfare
In similar to theoretical literature, applied general equilibrium models typically focus on welfare
measures of policy changes. There are several indexes that can be employed to provide a
measure of welfare change, including equivalent variation, compensating variations, equivalent
surplus, and compensating surplus.
The effect of a change in trade policies on the welfare of a region depends on the efficiency gains
associated with output changes, and the impact of changes in world prices on the welfare of the
trading country. Huff and Hertel (2000) decompose the welfare effect for the equivalent
variation, a measure of absolute welfare gain expressed in the USD million, in order to trace
major factors that cause welfare change. The equivalent variation due to a policy shock is equal
to the difference between the required expenditure to obtain new level of utility at initial prices,
and initial expenditure.
Changes in welfare pursuant to trade liberalization could be due to changes in terms of trade,
better use of existing resources (allocative efficiency) and others, i.e. fewer costly imports and
scale effects. There are two main factors or components among these components. The first
important welfare component is the allocation efficiency gains when they remove trade
distortion. The second important welfare component is the terms of trade effect.
The welfare measure in the analysis employs the Equivalent Variation (EV) criterion. As shown
in Table 12, free trade agreement between US and Malaysia would carry the welfare gains to
both sides of the trade agreement.
The results suggest that most of the welfare gains to both parties of trade come due to the
increase in terms of trade followed by the aggregate of other effects. The improvement in the
effective use of a resource seems to have a small positive effect on the welfare in the US and

Jafari & Othman, Journal of International and Global Economic Studies, 6(1), June 2013, 33-47
39
Malaysia. However, the decline in terms of trade followed by deterioration in effective use of the
resource and other aggregated effects are expected to decrease the ROW’s social welfare.
The increase in the US and Malaysian GDP results in the decline of dead welfare loss and this
implies that the US and Malaysian aggregate supply before trade liberalization have been
inefficient.
Table 13 illustrates the allocative efficiency effects by sectors and by regions. It clearly shows
that for Malaysia the Text and RAWAG are the most outstanding sectors in terms of
improvement in better use of resources while manufacturing sector is expected to use the
resources in a more inefficient way. The MANU sector is the first outstanding sector in terms of
improvement in allocative efficiency for the US economy. The second most important sector in
terms of contribution to the allocative efficiency in the US economy is the TEXT sector while
other sectors will experience small change in allocative efficiency in different directions.
Table 14 illustrates the term of trade effects by sectors and by regions. It clearly shows that the
manufacturing sector is the first outstanding sector contributed to an increase in the terms of
trade. The second most important sector is the SVCS, followed by VEG OIL, while FOOD and
TEXT sectors negatively affected the terms of trade. Changes in terms of trade in other sectors
do not seem to affect welfare significantly in Malaysia. On the other hand, in the US all sectors
have contributed to the increase in the terms of trade (except for extraction).
5. Conclusion
Malaysian and the US are proposing the removal of tariff barriers between the two nations in
order to enhance the trade among them and enhance their well being. An important aim of the
study was to appraise whether there will be significant gains in bilateral trade between the US
and Malaysia and their overall well being when tariff barriers and enhancement measures are
being entirely dismantled. In assessing the economic impact of the MUFTA , the study estimated
the likely benefits for both economics with reference to aggregate and sectoral impact of trade
levels, expected GDP gains, use of natural resources and employment of primary factors of
production including land, labour (skilled and unskilled labour) and capital. Using the
computable general equilibrium modeling framework (GTAP model), the following results
deserves special attention.
(i) A bilateral FTA between Malaysia and US is expected to result in a larger increase in the US
and Malaysia’s GDP albeit the changes in the GDP are extremely minute. Malaysia GDP
increases more relative to the US and the direction of sectoral growth expectedly varies across
sectors in both countries. The Malaysian economic sectors which are more likely to be
affected are the TEXT sector followed by the Animal sector. The changes in output of other
sectors in Malaysia seem to be very small. Moreover, the changes in sectoral output within
US economy are projected to be insignificant due to their small changes.
(ii) The bilateral Malaysian –US free trade would pose negative impact on trade balance of both
the US and Malaysia. However, if increasing bilateral trade between the US and Malaysia is
an important objective, very likely it would succeed. The proposed bilateral trade is likely to

Jafari & Othman, Journal of International and Global Economic Studies, 6(1), June 2013, 33-47
40
have a different effect on the natural resources and primary factors of production within
diverse economic sectors.
(iii) Although the US overall welfare is expected to show higher gain relative to Malaysia,
overall national welfare of both countries is projected to increase. For both parties of trade,
the most of gains are a result of improvements in terms of trade, followed by fewer costly
imports, while the role of allocative efficiency changes in the increase of welfare is very
small. The direction and magnitude of impacts for each sector across countries are projected
to be considerably different.
This study considers a FTA between Malaysia and the US only. More inclusive studies warrant
considering the effects of a number of policy scenarios such as a FTA within ASEAN combined
with FTA between Malaysia and the US; and a FTA within ASEAN combined with that of
ASEAN and the US. The future studies would also be warranted employing alternative
methodologies in order to discover further the repercussions of free trade on the individual
disaggregated commodity.
Endnote
* Corresponding author: Yaghoob Jafari, School of Economic, Faculty of Economics and
Management, Universiti Kebangsaan Malaysia, 43000 UKM Bangi, Selangore Darul Ehsan,
Malaysia Tel. +603 89213762 , Fax: +603 89215789, Email: [email protected]. I
appreciate insightful comments from the referee and the editor. Any errors are the authors’ sole
responsibility.
References
Aguiar, A. McDougall, R and G.B. Narayanan, Editors. 2012. The GTAP 7 Data Base: Global
Trade, Assistance and Production, Center for Global Trade Analysis, Purdue University.
AMCHAM Malaysia. 2006. “Public Submission for the Proposed US-Malaysia Free Trade
Agreement,” http://www.ftamalaysia.org/file_dir/189810006944cdb0c12ad9b.pdf (accessed at
22/08/2011).
Brockmeier, M. 1996. “A Graphical Exposition of GTAP Model, GTAP Technical Paper,”
Centre for Global Trade Analysis, Purdue University, West Laffayette, IN.
Dimaranan, B.V. and R. McDougall. 2006. “Global Trade, Assistance and Production: The
GTAP Data Base,” Center for Global Trade Analysis, Purdue University, USA: Indonesia.
Hertel, T.W. 1997. Global Trade Analysis: Modeling and Applications, Cambridge University
Press.
Othman, J. and Y. Jafari. 2010. “Does ASEAN Trade Liberalization Benefit Malaysia,”
Journal of AUSSEN-WIRTSCHAFT, 65(2):191-214.

Jafari & Othman, Journal of International and Global Economic Studies, 6(1), June 2013, 33-47
41
Othman, J. and Y. Jafari. 2009. “Enhancing OIC Economic Cooperation: Impacts of
Developing 8(D8) Preferential Trade,” paper presented at the west Asia-Middle East-Malay
World relations: opportunities From Globalization, 2009 international conference.
Itakura, K. and T.W. Hertel. 2001. A Note on Changes since GTAP Book Model, Center for
Global Trade Analysis, Purdue University, USA.
Itakura, K. and L. Hiro. 2011. “Evaluating the Effects of Free Trade Agreements in the Asia-
Pacific Region under Alternative Sequencings,” working paper.
Kreinin, M.E. and M.G. Plummer. 2012. “Theory And Economic Modeling of Preferential
Trading Arrangements,” The Oxford Handbook of International Commercial Policy, pp. 123-
156.
Siriwardana, M. and Y. Jinmei. 2007. “GTAP Model Analysis of the Effects of an Australia-
China FTA: Sectoral Aspect,” CCAS Working Paper No. 7, May 2007.
Chong, S. Y. and J. Hur. 2007. “Overlapping Free trade Agreements of Singapore-USA-Japan:
A Computational Analysis,’’ SCAPE Working paper Series, No.2007/11.
Jafari & Othman, Journal of International and Global Economic Studies, 6(1), June 2013, 33-47
42
Table 1: Decomposition of Trade Among Malaysia, the US and ROW (percentage)
Reporter
Country
�Partner
Country
����USA�
Partner
Country
����USA�
���USA�Ma
laysia�ROW�
��USA�Mala
ysia�ROW��
�USA�Malay
sia�ROW��T
otal���USA�
USA�Malaysi
a�ROW��To
tal���USA�0
�0.0123�0.98
77��1���M
alaysia�0.1904
�0�0.8096��
Malaysia�RO
W��Total��
ROW��Total
���USA�0�
�Total���US
A�0�0.0123�
Total���USA
�0�0.0123�0.
9877��1���
��USA�0�0.
0123�0.9877�
�USA�0�0.0
123�0.9877�
USA�0�0.012
3�0.9877��1
���Malaysia
�0.1904�0�0.
8096��1���
0�0.0123�0.9
877��1���
0.0123�0.9877
��1���Mala
ysia�0.1904�

Jafari & Othman, Journal of International and Global Economic Studies, 6(1), June 2013, 33-47
43
0.9877��1��
�1���Malays
ia�0.1904�0�
1���Malaysia
�0.1904�0�0.
8096��1���
��Malaysia�0
.1904�0�0.80
96��1���R
OW�0.1764�
�Malaysia�0.
1904�0�0.809
6��1���RO
W�0.1764�0.
01�0.8136��
Malaysia�0.19
04�0�0.8096
��1���RO
W�0.1764�0.
01�0.8136��
0.1904�0�0.8
096��1���R
OW�0.1764�
0�0.8096��1
���ROW�0.1
764�0.01�0.8
136��1���T
otal�0.158�0.
0101�0.832�
0.8096��1��
�1���ROW
�0.1764�0.01
�0.8136��1�
1���ROW�0.
1764�0.01�0.
8136��1���
��ROW�0.17
64�0.01�0.81
36��1���To
tal�0.158�0.0
101�0.832��
�ROW�0.176
4�0.01�0.813
6��1���Tot
al�0.158�0.01
01�0.832��1
Jafari & Othman, Journal of International and Global Economic Studies, 6(1), June 2013, 33-47
44
��Source:
GTAP database
V8
ROW�0.1764
�0.01�0.8136
��1���Total
�0.158�0.010
1�0.832��1�
0.1764�0.01�
0.01�0.8136�
0.8136��1��
�1���Total�
1���Total�0.
158�0.0101�0
.832��1��So
urce: GTAP
database V8
��Total�0.158
�0.0101�0.83
2��1��Sourc
e: GTAP
database V8
�Total�0.158
�0.0101�0.83
2��1��Sourc
e: GTAP
database V8
Total�0.158�
0.158�0.0101
�0.832��1��
0.0101�0.832
��1��Source:
GTAP database
V8
0.832��1��S
ource: GTAP
database V8
�1��Source:
GTAP database
V8
1��Source:

Jafari & Othman, Journal of International and Global Economic Studies, 6(1), June 2013, 33-47
45
GTAP database
V8
�Source: GTAP
database V8
Source:
GTAP database
V8
Table 2:
Regional and
Sectoral
Aggregation
�Regions��
Regions��Co
de�Sectors��
�Code�Secto
rs��1�The
USA��RAW
AG�Agricultur
e��2�Malaysi
a��ANIMAL
�Animal
products��3�
Code�Sectors
��1�The
USA��RAW
AG�Agricultur
e��2�Malaysi
a��ANIMAL
�Animal
products��3�
Sectors��1�T
he
USA��RAW
AG�Agricultur
e��2�Malaysi
a��ANIMAL
�Animal
products��3�
�1�The
USA��RAW
AG�Agricultur
e��2�Malaysi
a��ANIMAL
�Animal
Jafari & Othman, Journal of International and Global Economic Studies, 6(1), June 2013, 33-47
46
products��3�
1�The
USA��RAW
AG�Agricultur
e��2�Malaysi
a��ANIMAL
�Animal
products��3�
The
USA��RAW
AG�Agricultur
e��2�Malaysi
a��ANIMAL
�Animal
products��3�
�RAWAG�A
griculture��2
�Malaysia��
RAWAG�Agri
culture��2�M
alaysia��ANI
MAL�Animal
products��3�
Agriculture��2
�Malaysia��
�2�Malaysia�
2�Malaysia�
Malaysia��A
NIMAL�Anim
al
products��3�
�ANIMAL�A
nimal
products��3�
ANIMAL�Ani
mal
products��3�
Animal
products��3�
�3�ROW(Rest
of the
World)��EXT
RACTION�Ex
traction
industry����
3�ROW(Rest

Jafari & Othman, Journal of International and Global Economic Studies, 6(1), June 2013, 33-47
47
of the
World)��EXT
RACTION�Ex
traction
industry����
ROW(Rest of
the
World)��EXT
RACTION�Ex
traction
industry����
�EXTRACTI
ON�Extraction
industry����
EXTRACTION
�Extraction
industry����
Extraction
industry����
����FOOD�
���FOOD�P
roceeds
food�����T
EXT�Textile
and wearing
apparel����
��FOOD�Pr
oceeds
food�����T
EXT�Textile
and wearing
apparel����
�FOOD�Proc
eeds
food�����T
EXT�Textile
and wearing
apparel����
FOOD�Procee
ds
food�����T
EXT�Textile
and wearing
apparel����
Proceeds
food�����T
Jafari & Othman, Journal of International and Global Economic Studies, 6(1), June 2013, 33-47
48
EXT�Textile
and wearing
apparel����
����TEXT�
���TEXT�T
extile and
wearing
apparel����
��TEXT�Tex
tile and
wearing
apparel����
�TEXT�Textil
e and wearing
apparel����
TEXT�Textile
and wearing
apparel����
Textile and
wearing
apparel����
����MANU
�Manufacturin
g�����SVC
S�Services��
���MANU�
��MANU�M
anufacturing��
�MANU�Ma
nufacturing��
MANU�Manu
facturing���
Manufacturing
�����SVCS
�Services���
����SVCS�
���SVCS�S
ervices����
��SVCS�Ser
vices�����V
EG
OIL�Vegetabl
e
oils��Source:
Sectoral and
regional

Jafari & Othman, Journal of International and Global Economic Studies, 6(1), June 2013, 33-47
49
aggregation by
the authors
�SVCS�Servi
ces�����VE
G
OIL�Vegetabl
e
oils��Source:
Sectoral and
regional
aggregation by
the authors
SVCS�Service
s�����VEG
OIL�Vegetabl
e
oils��Source:
Sectoral and
regional
aggregation by
the authors
Services����
����VEG
OIL�Vegetabl
e
oils��Source:
Sectoral and
regional
aggregation by
the authors
���VEG
OIL�Vegetabl
e
oils��Source:
Sectoral and
regional
aggregation by
the authors
��VEG
OIL�Vegetabl
e
oils��Source:
Sectoral and
regional
aggregation by
the authors
Jafari & Othman, Journal of International and Global Economic Studies, 6(1), June 2013, 33-47
50
�VEG
OIL�Vegetabl
e
oils��Source:
Sectoral and
regional
aggregation by
the authors
VEG
OIL�Vegetabl
e
oils��Source:
Sectoral and
regional
aggregation by
the authors
Vegetable
oils��Source:
Sectoral and
regional
aggregation by
the authors
�Source:
Sectoral and
regional
aggregation by
the authors
Source:
Sectoral and
regional
aggregation by
the authors
Table 3:
Deco
mposit
ion of
export
s by
partner
countri
es and
by
Sector
Amon
g

Jafari & Othman, Journal of International and Global Economic Studies, 6(1), June 2013, 33-47
51
Malay
sia, the
US
and
ROW
(perce
ntage)
�Total export
of Malaysia
��Total
export of
USA���USA
�ROW�Total
� �Malaysia�
Total export of
Malaysia
��Total
export of
USA���USA
�ROW�Total
� �Malaysia�
�Total export
of
USA���USA
�ROW�Total
� �Malaysia�
Total export of
USA���USA
�ROW�Total
� �Malaysia�
��USA�ROW
�Total� �Mal
aysia�ROW�
�USA�ROW
�Total� �Mal
aysia�ROW�
USA�ROW�
ROW�Total�
�Malaysia�R
OW�Total��
RAWAG�0.02
77�0.9723�1
��0.0063�0.9
937�1��ANI
MAL�0.0411
�0.9589�1��

Jafari & Othman, Journal of International and Global Economic Studies, 6(1), June 2013, 33-47
52
Total� �Mala
ysia�ROW�T
otal��
RAWAG�0.02
77�0.9723�1
��0.0063�0.9
937�1��ANI
MAL�0.0411
�0.9589�1��
�Malaysia�R
OW�Total��
RAWAG�0.02
77�0.9723�1
��0.0063�0.9
937�1��ANI
MAL�0.0411
�0.9589�1��
Malaysia�RO
W�Total��
RAWAG�0.02
77�0.9723�1
��0.0063�0.9
937�1��ANI
MAL�0.0411
�0.9589�1��
ROW�Total�
Total��
RAWAG�0.02
77�0.9723�1
��0.0063�0.9
937�1��ANI
MAL�0.0411
�0.9589�1���
RAWAG�0.02
77�0.9723�1
��0.0063�0.9
937�1��ANI
MAL�0.0411
�0.9589�1��
RAWAG�0.02
77�0.9723�1
��0.0063�0.9
937�1��ANI
MAL�0.0411

Jafari & Othman, Journal of International and Global Economic Studies, 6(1), June 2013, 33-47
53
�0.9589�1��
0.0277�0.9723
�1��0.0063�
0.9723�1��0.
0063�0.9937�
1��0.0063�0.
9937�1��ANI
MAL�0.0411
�0.9589�1��
�0.0063�0.99
37�1��ANIM
AL�0.0411�0.
9589�1��0.0
006�0.9994�1
��EXTRACTI
ON�0.0338�0
.9662�1��0.0
028�0.9972�1
��
FOOD�0.1255
�0.8745�1��
0.0063�0.9937
�1��ANIMA
L�0.0411�0.9
589�1��0.00
06�0.9994�1
��EXTRACTI
ON�0.0338�0
.9662�1��0.0
028�0.9972�1
��
FOOD�0.1255
�0.8745�1��
0.9937�1��A
NIMAL�0.041
1�0.9589�1�
1��ANIMAL
�0.0411�0.95
89�1��0.000
6�0.9994�1�
�ANIMAL�0.
0411�0.9589�
ANIMAL�0.0
411�0.9589�1
��0.0006�0.9
994�1��EXT

Jafari & Othman, Journal of International and Global Economic Studies, 6(1), June 2013, 33-47
54
RACTION�0.
0338�0.9662�
0.0411�0.9589
�1��0.0006�
0.9589�1��0.
0006�0.9994�
1��0.0006�0.
9994�1��EX
TRACTION�0
.0338�0.9662
�1��0.0028�
�0.0006�0.99
94�1��EXTR
ACTION�0.03
38�0.9662�1
��0.0028�0.9
972�1��
FOOD�0.1255
�0.8745�1��
0.0006�0.9994
�1��EXTRA
CTION�0.033
8�0.9662�1�
0.9994�1��E
XTRACTION
�0.0338�0.96
62�1��0.002
8�0.9972�1�
1��EXTRACT
ION�0.0338�
�EXTRACTIO
N�0.0338�0.9
662�1��0.00
28�0.9972�1
��
FOOD�0.1255
�0.8745�1��
EXTRACTION
�0.0338�0.96
62�1��0.002
8�0.9972�1�
0.0338�0.9662
�1��0.0028�
0.9662�1��0.
0028�0.9972�
1��0.0028�0.

Jafari & Othman, Journal of International and Global Economic Studies, 6(1), June 2013, 33-47
55
9972�1��
FOOD�0.1255
�0.8745�1��
�0.0028�0.99
72�1��
FOOD�0.1255
�0.8745�1��
0.0028�0.9972
�1��
FOOD�0.1255
�0.8745�1��
0.9972�1��
FOOD�0.1255
�0.8745�1��
1��
FOOD�0.1255
�0.8745�1���
FOOD�0.1255
�0.8745�1��
FOOD�0.1255
�0.8745�1��
0.1255�0.8745
�1��0.008�0
.992�1��TEX
T�0.2575�0.7
425�1��0.00
22�0.9978�1
��MANU�0.2
184�0.7816�1
��0.0152�0.9
848�1��SVC
S
�0.1243�0.87
57�1��0.007
7�0.9923�1�
0.8745�1��0.
008�0.992�1
��TEXT�0.25
75�0.7425�1
��0.0022�0.9
978�1��MAN
U�0.2184�0.7
816�1��0.01
52�0.9848�1
Jafari & Othman, Journal of International and Global Economic Studies, 6(1), June 2013, 33-47
56
��SVCS
�0.1243�0.87
57�1��0.007
7�0.9923�1�
1��0.008�0.9
92�1��TEXT
�0.2575�0.74
25�1��0.002
2�0.9978�1�
�0.008�0.992
�1��TEXT�0.
2575�0.7425�
0.008�0.992�
0.992�1��TE
XT�0.2575�0.
7425�1��0.0
022�0.9978�1
��MANU�0.2
184�0.7816�1
��0.0152�0.9
848�1��SVC
S
�0.1243�0.87
57�1��0.007
7�0.9923�1�
1��TEXT�0.2
575�0.7425�1
��0.0022�0.9
978�1��MAN
U�0.2184�0.7
816�1��0.01
52�0.9848�1
��SVCS
�0.1243�0.87
57�1��0.007
7�0.9923�1�
�TEXT�0.2575
�0.7425�1��
TEXT�0.2575
�0.7425�1��
0.2575�0.7425
�1��0.0022�
0.7425�1��0.
0022�0.9978�
1��0.0022�0.
9978�1��MA

Jafari & Othman, Journal of International and Global Economic Studies, 6(1), June 2013, 33-47
57
NU�0.2184�0
.7816�1��0.0
152�0.9848�1
��SVCS
�0.1243�0.87
57�1��0.007
7�0.9923�1�
�0.0022�0.99
78�1��MAN
U�0.2184�0.7
816�1��0.01
52�0.9848�1
��SVCS
�0.1243�0.87
57�1��0.007
7�0.9923�1�
0.0022�0.9978
�1��MANU�
0.9978�1��M
ANU�0.2184
�0.7816�1��
1��MANU�0.
2184�0.7816�
�MANU�0.21
84�0.7816�1
��0.0152�0.9
848�1��SVC
S
�0.1243�0.87
57�1��0.007
7�0.9923�1�
MANU�0.218
4�0.7816�1�
0.2184�0.7816
�1��0.0152�
0.7816�1��0.
0152�0.9848�
1��0.0152�0.
9848�1��SV
CS
�0.1243�0.87
57�1��0.007
7�0.9923�1�
�0.0152�0.98
48�1��SVCS
�0.1243�0.87

Jafari & Othman, Journal of International and Global Economic Studies, 6(1), June 2013, 33-47
58
57�1��0.007
7�0.9923�1�
0.0152�0.9848
�1��SVCS
�0.1243�0.87
57�1��0.007
7�0.9923�1�
0.9848�1��S
VCS
�0.1243�0.87
57�1��0.007
7�0.9923�1�
1��SVCS
�0.1243�0.87
57�1��0.007
7�0.9923�1�
�SVCS
�0.1243�0.87
57�1��0.007
7�0.9923�1�
SVCS
�0.1243�0.87
57�1��0.007
7�0.9923�1�
0.1243�0.8757
�1��0.0077�
0.8757�1��0.
0077�0.9923�
1��0.0077�0.
9923�1��
VEG
OIL�0.0266�
�0.0077�0.99
23�1�� VEG
OIL�0.0266�
0.0077�0.9923
�1�� VEG
OIL�0.0266�
0.9923�1��
VEG
OIL�0.0266�
1�� VEG
OIL�0.0266�
� VEG
OIL�0.0266�
VEG

Jafari & Othman, Journal of International and Global Economic Studies, 6(1), June 2013, 33-47
59
OIL�0.0266�
0.0266�0.9734
�1��0.0008�
0.9734�1��0.
0008�0.9992�
1��0.0008�0.
9992�1��TO
TAL�0.1903�
�0.0008�0.99
92�1��TOTA
L�0.1903�0.8
097�1��0.01
24�0.9876�1
��Source:
GTAP
database V8
0.0008�0.9992
�1��TOTAL
�0.1903�0.80
97�1��0.012
4�0.9876�1�
0.9992�1��T
OTAL�0.1903
�0.8097�1��
1��TOTAL�0
.1903�0.8097
�1��0.0124�
�TOTAL�0.19
03�0.8097�1
��0.0124�0.9
876�1��Sourc
e: GTAP
database V8
TOTAL�0.190
3�0.8097�1�
0.1903�0.8097
�1��0.0124�
0.8097�1��0.
0124�0.9876�
1��0.0124�0.
9876�1��Sou
rce: GTAP
database V8
�0.0124�0.98

Jafari & Othman, Journal of International and Global Economic Studies, 6(1), June 2013, 33-47
60
76�1��Source
: GTAP
database V8
0.0124�0.9876
�1��Source:
GTAP
database V8
0.9876�1��So
urce: GTAP
database V8
1��Source:
GTAP
database V8
�Source: GTAP
database V8
Source: GTAP
database V8
Table 4:
Deco
mpos
ition
of
Impo
rts by
partn
er
count
ries
and
by
Secto
r
Amo
ng
Mala

Jafari & Othman, Journal of International and Global Economic Studies, 6(1), June 2013, 33-47
61
ysia,
the
US
and
RO
W
(perc
entag
e)
�Total Import
of
Malaysia� �T
otal import of
USA���USA
�ROW�Total
��Malaysia�
Total Import of
Malaysia� �T
otal import of
USA���USA
�ROW�Total
��Malaysia�
�Total import
of
USA���USA
�ROW�Total
��Malaysia�
Total import of
USA���USA
�ROW�Total
��Malaysia�
��USA�ROW
�Total��Mal
aysia�ROW�
�USA�ROW
�Total��Mal
aysia�ROW�
USA�ROW�
ROW�Total�
Total��Malay
sia�ROW�Tot
al��
RAWAG�0.12
11�0.8789�1
��0.0006�0.9

Jafari & Othman, Journal of International and Global Economic Studies, 6(1), June 2013, 33-47
62
994�1��ANI
MAL�0.015�
�Malaysia�R
OW�Total��
RAWAG�0.12
11�0.8789�1
��0.0006�0.9
994�1��ANI
MAL�0.015�
Malaysia�RO
W�Total��
RAWAG�0.12
11�0.8789�1
��0.0006�0.9
994�1��ANI
MAL�0.015�
ROW�Total�
Total��
RAWAG�0.12
11�0.8789�1
��0.0006�0.9
994�1��ANI
MAL�0.015��
RAWAG�0.12
11�0.8789�1
��0.0006�0.9
994�1��ANI
MAL�0.015�
RAWAG�0.12
11�0.8789�1
��0.0006�0.9
994�1��ANI
MAL�0.015�
0.1211�0.8789
�1��0.0006�
0.8789�1��0.
0006�0.9994�
1��0.0006�0.
9994�1��ANI
MAL�0.015�
�0.0006�0.99
94�1��ANIM
AL�0.015�0.9
85�1��0.001

Jafari & Othman, Journal of International and Global Economic Studies, 6(1), June 2013, 33-47
63
4�0.9986�1�
0.0006�0.9994
�1��ANIMA
L�0.015�0.98
5�1��0.0014
�0.9986�1��
EXTRACTION
�0.015�0.985
�1��0.0022�
0.9994�1��A
NIMAL�0.015
�0.985�1��0
.0014�0.9986
�1��
EXTRACTION
�0.015�0.985
�1��0.0022�
1��ANIMAL
�0.015�0.985
�1��0.0014�
�ANIMAL�0.
015�0.985�1
��0.0014�0.9
986�1��
EXTRACTION
�0.015�0.985
�1��0.0022�
ANIMAL�0.0
15�0.985�1�
0.015�0.985�
0.985�1��0.0
014�0.9986�1
��
EXTRACTION
�0.015�0.985
�1��0.0022�
1��0.0014�0.
9986�1��
EXTRACTION
�0.015�0.985
�1��0.0022�
�0.0014�0.99
86�1��
EXTRACTION
�0.015�0.985
�1��0.0022�

Jafari & Othman, Journal of International and Global Economic Studies, 6(1), June 2013, 33-47
64
0.0014�0.9986
�1��
EXTRACTION
�0.015�0.985
�1��0.0022�
0.9986�1��
EXTRACTION
�0.015�0.985
�1��0.0022�
1��
EXTRACTION
�0.015�0.985
�1��0.0022��
EXTRACTION
�0.015�0.985
�1��0.0022�
EXTRACTION
�0.015�0.985
�1��0.0022�
0.015�0.985�
0.985�1��0.0
022�0.9978�1
��
FOOD�0.069
�0.931�1��0
.0074�0.9926
�1��TEXT�0.
0191�0.9809�
1��0.0022�0.
9978�1��
FOOD�0.069
�0.931�1��0
.0074�0.9926
�1��TEXT�0.
0191�0.9809�
�0.0022�0.99
78�1��
FOOD�0.069
�0.931�1��0
.0074�0.9926
�1��TEXT�0.
0191�0.9809�
0.0022�0.9978
�1��
Jafari & Othman, Journal of International and Global Economic Studies, 6(1), June 2013, 33-47
65
FOOD�0.069
�0.931�1��0
.0074�0.9926
�1��TEXT�0.
0191�0.9809�
0.9978�1��
FOOD�0.069
�0.931�1��0
.0074�0.9926
�1��TEXT�0.
0191�0.9809�
1��
FOOD�0.069
�0.931�1��0
.0074�0.9926
�1��TEXT�0.
0191�0.9809��
FOOD�0.069
�0.931�1��0
.0074�0.9926
�1��TEXT�0.
0191�0.9809�
FOOD�0.069
�0.931�1��0
.0074�0.9926
�1��TEXT�0.
0191�0.9809�
0.069�0.931�
0.931�1��0.0
074�0.9926�1
��TEXT�0.01
91�0.9809�1
��0.0087�0.9
913�1��MAN
U�0.1321�0.8
679�1��0.02
42�0.9758�1
��SVCS
�0.162�0.838
�1��0.006�0
.994�1��
VEG
OIL�0.0028�
1��0.0074�0.

Jafari & Othman, Journal of International and Global Economic Studies, 6(1), June 2013, 33-47
66
9926�1��TEX
T�0.0191�0.9
809�1��0.00
87�0.9913�1
��MANU�0.1
321�0.8679�1
��0.0242�0.9
758�1��SVC
S
�0.162�0.838
�1��0.006�0
.994�1��
VEG
OIL�0.0028�
�0.0074�0.99
26�1��TEXT
�0.0191�0.98
09�1��0.008
7�0.9913�1�
0.0074�0.9926
�1��TEXT�0.
0191�0.9809�
0.9926�1��T
EXT�0.0191�
1��TEXT�0.0
191�0.9809�1
��0.0087�0.9
913�1��MAN
U�0.1321�0.8
679�1��0.02
42�0.9758�1
��SVCS
�0.162�0.838
�1��0.006�0
.994�1��
VEG
OIL�0.0028�
�TEXT�0.0191
�0.9809�1��
TEXT�0.0191
�0.9809�1��
0.0191�0.9809
�1��0.0087�
0.9809�1��0.
0087�0.9913�
1��0.0087�0.

Jafari & Othman, Journal of International and Global Economic Studies, 6(1), June 2013, 33-47
67
9913�1��MA
NU�0.1321�0
.8679�1��0.0
242�0.9758�1
��SVCS
�0.162�0.838
�1��0.006�0
.994�1��
VEG
OIL�0.0028�
�0.0087�0.99
13�1��MAN
U�0.1321�0.8
679�1��0.02
42�0.9758�1
��SVCS
�0.162�0.838
�1��0.006�0
.994�1��
VEG
OIL�0.0028�
0.0087�0.9913
�1��MANU�
0.9913�1��M
ANU�0.1321
�0.8679�1��
1��MANU�0.
1321�0.8679�
�MANU�0.13
21�0.8679�1
��0.0242�0.9
758�1��SVC
S
�0.162�0.838
�1��0.006�0
.994�1��
VEG
OIL�0.0028�
MANU�0.132
1�0.8679�1�
0.1321�0.8679
�1��0.0242�
0.8679�1��0.
0242�0.9758�
1��0.0242�0.
9758�1��SV
Jafari & Othman, Journal of International and Global Economic Studies, 6(1), June 2013, 33-47
68
CS
�0.162�0.838
�1��0.006�0
.994�1��
VEG
OIL�0.0028�
�0.0242�0.97
58�1��SVCS
�0.162�0.838
�1��0.006�0
.994�1��
VEG
OIL�0.0028�
0.0242�0.9758
�1��SVCS
�0.162�0.838
�1��0.006�0
.994�1��
VEG
OIL�0.0028�
0.9758�1��S
VCS
�0.162�0.838
�1��0.006�0
.994�1��
VEG
OIL�0.0028�
1��SVCS
�0.162�0.838
�1��0.006�0
.994�1��
VEG
OIL�0.0028�
�SVCS
�0.162�0.838
�1��0.006�0
.994�1��
VEG
OIL�0.0028�
SVCS
�0.162�0.838
�1��0.006�0
.994�1��
VEG
OIL�0.0028�
0.162�0.838�

Jafari & Othman, Journal of International and Global Economic Studies, 6(1), June 2013, 33-47
69
0.838�1��0.0
06�0.994�1�
1��0.006�0.9
94�1�� VEG
OIL�0.0028�
�0.006�0.994
�1�� VEG
OIL�0.0028�
0.006�0.994�
0.994�1��
VEG
OIL�0.0028�
1�� VEG
OIL�0.0028�
� VEG
OIL�0.0028�
VEG
OIL�0.0028�
0.0028�0.9972
�1��0.0744�
0.9972�1��0.
0744�0.9256�
1��0.0744�0.
9256�1��TO
TAL�0.1272�
�0.0744�0.92
56�1��TOTA
L�0.1272�0.8
728�1��0.01
8�0.982�1��
0.0744�0.9256
�1��TOTAL
�0.1272�0.87
28�1��0.018
�0.982�1��S
ource: GTAP
database V8
0.9256�1��T
OTAL�0.1272
�0.8728�1��
1��TOTAL�0
.1272�0.8728
�1��0.018�0
.982�1��Sour
ce: GTAP

Jafari & Othman, Journal of International and Global Economic Studies, 6(1), June 2013, 33-47
70
database V8
�TOTAL�0.12
72�0.8728�1
��0.018�0.98
2�1��Source:
GTAP database
V8
TOTAL�0.127
2�0.8728�1�
0.1272�0.8728
�1��0.018�0
.982�1��Sour
ce: GTAP
database V8
0.8728�1��0.
018�0.982�1
��Source:
GTAP database
V8
1��0.018�0.9
82�1��Source
: GTAP
database V8
�0.018�0.982
�1��Source:
GTAP database
V8
0.018�0.982�
0.982�1��Sou
rce: GTAP
database V8
1��Source:
GTAP database
V8
�Source: GTAP
database V8
Source: GTAP
database V8
Table 5: Import

Jafari & Othman, Journal of International and Global Economic Studies, 6(1), June 2013, 33-47
71
Taxes by
Sector
�Import taxes
by
Malaysia��Im
port taxes by
USA���USA
�ROW�Total
��Malaysia�
Import taxes by
Malaysia��Im
port taxes by
USA���USA
�ROW�Total
��Malaysia�
�Import taxes
by
USA���USA
�ROW�Total
��Malaysia�
Import taxes by
USA���USA
�ROW�Total
��Malaysia�
��USA�ROW
�Total��Mal
aysia�ROW�
�USA�ROW
�Total��Mal
aysia�ROW�
USA�ROW�
ROW�Total�
Total��Malay
sia�ROW�Tot
al�� RAW
AG�30.7556�
�Malaysia�R
OW�Total��
RAW
AG�30.7556�
Malaysia�RO
W�Total��
RAW
AG�30.7556�
ROW�Total�
Total�� RAW

Jafari & Othman, Journal of International and Global Economic Studies, 6(1), June 2013, 33-47
72
AG�30.7556�
� RAW
AG�30.7556�
RAW
AG�30.7556�
30.7556�11.13
96�41.8952�
11.1396�41.89
52��1.8132�
41.8952��1.8
132�3.1204�4
.9336��ANIM
AL�0.876�0.6
088�1.4847�
�1.8132�3.12
04�4.9336��
1.8132�3.1204
�4.9336��AN
IMAL�0.876�
3.1204�4.9336
��ANIMAL�
4.9336��ANI
MAL�0.876�
�ANIMAL�0.
876�0.6088�1
.4847��1.212
6�3.9268�5.1
394��EXTRA
CTION�0.517
8�1.352�1.86
98��0.4028�
ANIMAL�0.8
76�0.6088�1.
4847��1.2126
�3.9268�5.13
94��EXTRAC
TION�0.5178
�1.352�1.869
8��0.4028�0.
1922�0.5949�
0.876�0.6088
�1.4847��1.2
126�3.9268�5
.1394��EXTR
ACTION�0.51
78�1.352�1.8

Jafari & Othman, Journal of International and Global Economic Studies, 6(1), June 2013, 33-47
73
698��0.4028
�0.1922�0.59
49��
FOOD�40.746
3�25.5126�66
.2589��1.783
3�5.209�6.99
23��TEXT�14
.7777�14.0653
�28.843��12.
7731�8.4442�
0.6088�1.4847
��1.2126�3.9
268�5.1394��
1.4847��1.21
26�3.9268�5.
1394��EXTR
ACTION�0.51
78�1.352�1.8
698��0.4028
�0.1922�0.59
49��
FOOD�40.746
3�25.5126�66
.2589��1.783
3�5.209�6.99
23��TEXT�14
.7777�14.0653
�28.843��12.
7731�8.4442�
�1.2126�3.92
68�5.1394��E
XTRACTION
�0.5178�1.35
2�1.8698��0.
4028�0.1922�
1.2126�3.9268
�5.1394��EX
TRACTION�0
.5178�1.352�
3.9268�5.1394
��EXTRACTI
ON�0.5178�1
.352�1.8698�
5.1394��EXT
RACTION�0.

Jafari & Othman, Journal of International and Global Economic Studies, 6(1), June 2013, 33-47
74
5178�1.352�1
.8698��0.402
8�0.1922�0.5
949��
FOOD�40.746
3�25.5126�66
.2589��1.783
3�5.209�6.99
23��TEXT�14
.7777�14.0653
�28.843��12.
7731�8.4442�
�EXTRACTIO
N�0.5178�1.3
52�1.8698��
EXTRACTION
�0.5178�1.35
2�1.8698��0.
4028�0.1922�
0.5178�1.352
�1.8698��0.4
028�0.1922�0
.5949��
FOOD�40.746
3�25.5126�66
.2589��1.783
3�5.209�6.99
23��TEXT�14
.7777�14.0653
�28.843��12.
7731�8.4442�
1.352�1.8698
��0.4028�0.1
922�0.5949��
FOOD�40.746
3�25.5126�66
.2589��1.783
3�5.209�6.99
23��TEXT�14
.7777�14.0653
�28.843��12.
7731�8.4442�
1.8698��0.40
28�0.1922�0.
5949��
FOOD�40.746

Jafari & Othman, Journal of International and Global Economic Studies, 6(1), June 2013, 33-47
75
3�25.5126�66
.2589��1.783
3�5.209�6.99
23��TEXT�14
.7777�14.0653
�28.843��12.
7731�8.4442�
�0.4028�0.19
22�0.5949��
FOOD�40.746
3�25.5126�66
.2589��1.783
3�5.209�6.99
23��TEXT�14
.7777�14.0653
�28.843��12.
7731�8.4442�
0.4028�0.1922
�0.5949��
FOOD�40.746
3�25.5126�66
.2589��1.783
3�5.209�6.99
23��TEXT�14
.7777�14.0653
�28.843��12.
7731�8.4442�
0.1922�0.5949
��
FOOD�40.746
3�25.5126�66
.2589��1.783
3�5.209�6.99
23��TEXT�14
.7777�14.0653
�28.843��12.
7731�8.4442�
0.5949��
FOOD�40.746
3�25.5126�66
.2589��1.783
3�5.209�6.99
23��TEXT�14
.7777�14.0653
�28.843��12.
7731�8.4442�

Jafari & Othman, Journal of International and Global Economic Studies, 6(1), June 2013, 33-47
76
�
FOOD�40.746
3�25.5126�66
.2589��1.783
3�5.209�6.99
23��TEXT�14
.7777�14.0653
�28.843��12.
7731�8.4442�
FOOD�40.746
3�25.5126�66
.2589��1.783
3�5.209�6.99
23��TEXT�14
.7777�14.0653
�28.843��12.
7731�8.4442�
40.7463�25.51
26�66.2589�
25.5126�66.25
89��1.7833�
66.2589��1.7
833�5.209�6.
9923��TEXT�
�1.7833�5.20
9�6.9923��T
EXT�14.7777
�14.0653�28.
843��12.7731
�8.4442�21.2
173��MANU
�2.0249�5.40
35�7.4284��
1.7833�5.209
�6.9923��TE
XT�14.7777�
5.209�6.9923
��TEXT�14.7
777�14.0653�
6.9923��TEXT
�14.7777�14.
0653�28.843�
�TEXT�14.777
7�14.0653�28
.843��12.773

Jafari & Othman, Journal of International and Global Economic Studies, 6(1), June 2013, 33-47
77
1�8.4442�21.
2173��MANU
�2.0249�5.40
35�7.4284��
TEXT�14.7777
�14.0653�28.
843��12.7731
�8.4442�21.2
173��MANU
�2.0249�5.40
35�7.4284��
14.7777�14.06
53�28.843��
14.0653�28.84
3��12.7731�
28.843��12.7
731�8.4442�2
1.2173��MAN
U�2.0249�5.4
035�7.4284�
�12.7731�8.4
442�21.2173�
12.7731�8.444
2�21.2173��
8.4442�21.217
3��MANU�2.
0249�5.4035�
21.2173��MA
NU�2.0249�5
.4035�7.4284
��0.5871�1.1
948�1.7819��
�MANU�2.02
49�5.4035�7.
4284��0.5871
�1.1948�1.78
19��VEG OIL
�1.3311�0.56
98�1.901��0.
6182�1.6286�
MANU�2.024
9�5.4035�7.4
284��0.5871
�1.1948�1.78
19��VEG OIL
�1.3311�0.56
Jafari & Othman, Journal of International and Global Economic Studies, 6(1), June 2013, 33-47
78
98�1.901��0.
6182�1.6286�
2.0249�5.4035
�7.4284��0.5
871�1.1948�1
.7819��VEG
OIL
�1.3311�0.56
98�1.901��0.
6182�1.6286�
5.4035�7.4284
��0.5871�1.1
948�1.7819��
7.4284��0.58
71�1.1948�1.
7819��VEG
OIL
�1.3311�0.56
98�1.901��0.
6182�1.6286�
�0.5871�1.19
48�1.7819��
0.5871�1.1948
�1.7819��VE
G OIL
�1.3311�0.56
98�1.901��0.
6182�1.6286�
1.1948�1.7819
��VEG OIL
�1.3311�0.56
98�1.901��0.
6182�1.6286�
1.7819��VEG
OIL
�1.3311�0.56
98�1.901��0.
6182�1.6286�
�VEG OIL
�1.3311�0.56
98�1.901��0.
6182�1.6286�
VEG OIL
�1.3311�0.56
98�1.901��0.
6182�1.6286�

Jafari & Othman, Journal of International and Global Economic Studies, 6(1), June 2013, 33-47
79
1.3311�0.5698
�1.901��0.61
82�1.6286�2.
2468��Total�
0.5698�1.901
��0.6182�1.6
286�2.2468��
1.901��0.618
2�1.6286�2.2
468��Total�9
1.0294�58.651
7�149.681��
�0.6182�1.62
86�2.2468��T
otal�91.0294�
0.6182�1.6286
�2.2468��Tot
al�91.0294�5
8.6517�149.68
1��19.1903�
1.6286�2.2468
��Total�91.02
94�58.6517�1
49.681��19.1
903�23.716�4
2.9063��Sourc
e: GTAP
database V8
2.2468��Total
�91.0294�58.
6517�149.681
��19.1903�2
3.716�42.9063
��Source:
GTAP database
V8
�Total�91.029
4�58.6517�14
9.681��19.19
03�23.716�42
.9063��Source
: GTAP
database V8
Total�91.0294

Jafari & Othman, Journal of International and Global Economic Studies, 6(1), June 2013, 33-47
80
�58.6517�149
.681��19.190
3�23.716�42.
9063��Source:
GTAP database
V8
91.0294�58.65
17�149.681�
58.6517�149.6
81��19.1903
�23.716�42.9
063��Source:
GTAP database
V8
149.681��19.
1903�23.716�
�19.1903�23.
716�42.9063�
19.1903�23.71
6�42.9063��S
ource: GTAP
database V8
23.716�42.906
3��Source:
GTAP database
V8
42.9063��Sour
ce: GTAP
database V8
Source: GTAP database V8
Table 6: Export Subsidies by Sector
Export subsidize by
Malaysia Export subsidize by USA
USA ROW Total Malaysia ROW Total
Rawag 0 0 0 0 0 0
Animal 0 0 0 -0.0002 0 -0.0002
Extraction 0.4992 -0.3633 0.1358 -0.0144 -0.0239 -0.0383
FOOD 0 0 0 0.9182 0.2963 1.2145
Text 0 -0.8961 -0.8961 -0.0885 -0.0437 -0.1322
Manu 0 0 0 -0.6283 -0.3117 -0.94