Potato Market Information Review 2012-2013 · Potato Market Information Review 2012-2013 ... Paru...
62
Potato Market Information Review 2012-2013 Prepared by: Market Analysis and Information Section Horticulture and Cross Sectoral Division Agriculture and Agri-Food Canada April 2014
Transcript of Potato Market Information Review 2012-2013 · Potato Market Information Review 2012-2013 ... Paru...

Potato Market Information Review 2012-2013 Prepared by: Market Analysis and Information Section Horticulture and Cross Sectoral Division Agriculture and Agri-Food Canada April 2014

ii
© Her Majesty the Queen in Right of Canada, represented by the Minister of Agriculture and Agri-Food (2014). Electronic version available at www.agr.gc.ca/horticulture_e ISSN :1925-3796 AAFC No. 12203E Paru également en français sous le titre : Revue d’information sur les marchés de la pomme de terre 2012-2013 ISSN: 1925-380X n° d'AAC: 12203F For more information, reach us at www.agr.gc.ca or call us toll-free at 1-855-773-0241.
iii
Table of Contents Summary .................................................................................................................................. 1 Seasonal Review 2012 – 2013 ................................................................................................. 2
Prince Edward Island ............................................................................................................. 2 New Brunswick ...................................................................................................................... 2 Quebec .................................................................................................................................. 3 Ontario ................................................................................................................................... 3 Manitoba ................................................................................................................................ 4 Saskatchewan ........................................................................................................................ 4 Alberta ................................................................................................................................... 4 British Columbia ..................................................................................................................... 5
1. Production ............................................................................................................................ 6 1.1. Number of Potato Farms in Canada (2006 and 2011) ..................................................... 6 1.2. Canadian Potato Production ............................................................................................ 6 1.3. Top 50 Registered Seed Potato Varieties Grown in Canada, Total Area (Ha) 2013 ........ 9 1.4. Area of Registered Varieties (Ha) – Five-Year Average..................................................10
2. Canadian Potato Storage Holdings ....................................................................................11 2.1. Canadian Potato Storage by Province ............................................................................11 2.2. Canadian Potato Storage ...............................................................................................11 2.3. Intended Utilization of Potatoes by Province...................................................................12 2.4. Intended Utilization of Potatoes – Total ..........................................................................13 2.5. Percentage of Intended Utilization of Potato by Province ...............................................13
3. Revenue ...............................................................................................................................14 3.1. Potato Farm Cash Receipts ...........................................................................................14 3.2. Potato Farm Value .........................................................................................................14
4. Prices ...................................................................................................................................15 4.1. Canadian Potato Average Prices ....................................................................................15 4.2. Monthly Summary of Daily Wholesale to Retail Market Prices ........................................16 4.3. Monthly Summary of Weekly Wholesale to Retail Market Prices ....................................17
5. Domestic Consumption ......................................................................................................19 5.1. Potatoes Available for Consumption in Canada ..............................................................19 5.2. Potatoes Available for Consumption in Canada – 10 Year-Trend ...................................20
6. Trade ....................................................................................................................................21 6.1. Canadian Potatoes Trade Balance .................................................................................21 6.2. Canadian Potato Exports................................................................................................22
6.2.1. Fresh .......................................................................................................................22 6.2.1.1. Monthly Fresh Potato Exports, Value ................................................................22 6.2.1.2. Monthly Fresh Potato Exports, Volume .............................................................22 6.2.1.3. Monthly Fresh Potato Exports, 2009/10 to 2012/13 ..........................................23 6.2.1.4. Fresh Potato Exports by Province, Value ..........................................................23 6.2.1.5. Fresh Potato Exports by Province, Volume .......................................................24 6.2.1.6. Fresh Potato Exporting Provinces - Percent Share ...........................................24 6.2.1.7. Fresh Potato Export Destinations, Value ..........................................................25 6.2.1.8. Fresh Potato Export Destinations, Volume .......................................................25
6.2.2. Seed ........................................................................................................................26 6.2.2.1. Monthly Seed Potato Exports, Value.................................................................26 6.2.2.2. Monthly Seed Potato Exports, Volume ..............................................................26 6.2.2.3. Monthly Seed Potato Exports, 2009/10 to 2012/13 ...........................................27 6.2.2.4. Seed Potato Exports by Province, Value ..........................................................27

iv
6.2.2.5. Seed Potato Exports by Province, Volume........................................................28 6.2.2.6. Seed Potato Exporting Provinces – Percent Share ...........................................28 6.2.2.7. Seed Potato Export Destinations, Value ...........................................................29 6.2.2.8. Seed Potato Export Destinations, Volume ........................................................29
6.2.3. Frozen .....................................................................................................................30 6.2.3.1. Monthly Frozen Potato Exports, Value ..............................................................30 6.2.3.2. Monthly Frozen Potato Exports, Volume ...........................................................30 6.2.3.3. Monthly Frozen Potato Exports, 2009/10 to 2012/13 ........................................31 6.2.3.4. Frozen Potato Exports by Province, Value ........................................................31 6.2.3.5. Frozen Potato Exports by Province, Volume .....................................................32 6.2.3.6. Frozen Potato Exporting Provinces – Percent Share ........................................32 6.2.3.7. Frozen Potato Export Destinations, Value ........................................................33 6.2.3.8. Frozen Potato Export Destinations, Volume ......................................................33
6.2.4. Processed ...............................................................................................................34 6.2.4.1. Monthly Processed Potato Exports, Value ........................................................34 6.2.4.2. Monthly Processed Potato Exports, Volume .....................................................34 6.2.4.3. Monthly Processed Potato Exports, 2009/10 to 2012/13 ...................................35 6.2.4.4. Processed Potato Exports by Province, Value ..................................................35 6.2.4.5. Processed Potato Exports by Province, Volume ...............................................36 6.2.4.6. Processed Potato Export Destinations, Value ...................................................36 6.2.4.7. Processed Potato Export Destinations, Volume ................................................36
6.3. Canadian Potato Imports ................................................................................................37 6.3.1. Fresh .......................................................................................................................37
6.3.1.1. Monthly Fresh Potato Imports, Value ................................................................37 6.3.1.2. Monthly Fresh Potato Imports, Volume .............................................................37 6.3.1.3. Monthly Fresh Potato Imports, 2009/10 to 2012/13 ...........................................38 6.3.1.4. Fresh Potato Imports by Province, Value ..........................................................38 6.3.1.5. Fresh Potato Imports by Province, Volume .......................................................39 6.3.1.6. Fresh Potato Importing Provinces – Percent Share ..........................................39 6.3.1.7. Fresh Potato Imports by Country of Origin, Value .............................................40 6.3.1.8. Fresh Potato Imports by Country of Origin, Volume ..........................................40
6.3.2. Seed ........................................................................................................................41 6.3.2.1. Monthly Seed Potato Imports, Value .................................................................41 6.3.2.2. Monthly Seed Potato Imports, Volume ..............................................................41 6.3.2.3. Monthly Seed Potato Imports, 2009/10 to 2012/13 ...........................................42 6.3.2.4. Seed Potato Imports by Province, Value ...........................................................42 6.3.2.5. Seed Potato Imports by Province, Volume ........................................................43 6.3.2.6. Seed Potato Importing Provinces – Percent Share ...........................................43 6.3.2.7. Seed Potato Imports by Country of Origin, Value ..............................................44 6.3.2.8. Seed Potato Imports by Country of Origin, Volume ...........................................44
6.3.3. Frozen .....................................................................................................................45 6.3.3.1. Monthly Frozen Potato Imports, Value ..............................................................45 6.3.3.2. Monthly Frozen Potato Imports, Volume ...........................................................45 6.3.3.3. Monthly Frozen Potato Imports, 2009/10 to 2012/13 .........................................46 6.3.3.4. Frozen Potato Imports by Province, Value ........................................................46 6.3.3.5. Frozen Potato Imports by Province, Volume .....................................................47 6.3.3.6. Frozen Potato Imports by Country of Origin, Value ...........................................47 6.3.3.7. Frozen Potato Imports by Country of Origin, Volume ........................................47
6.3.4. Processed ...............................................................................................................48 6.3.4.1. Monthly Processed Potato Imports, Value ........................................................48 6.3.4.2. Monthly Processed Potato Imports, Volume .....................................................48

v
6.3.4.3. Processed Potato Imports by Province, Value ..................................................49 6.3.4.4. Processed Potato Imports by Province, Volume ...............................................49 6.3.4.5. Processed Potato Imports by Country of Origin, Value .....................................50 6.3.4.6. Processed Potato Imports by Country of Origin, Volume ..................................50
7. U.S. Production ...................................................................................................................51 7.1. U.S. National Statistics for Potatoes ...............................................................................51
8. World Production ................................................................................................................52 8.1. World Potato Production.................................................................................................52
9. World Trade .........................................................................................................................53 9.1. Top 20 Importers of Fresh Potatoes Worldwide ..............................................................53 9.2. Top 20 Exporters of Fresh Potatoes Worldwide .............................................................54 9.3. Top 20 Importers of Seed Potatoes Worldwide ..............................................................55 9.4. Top 20 Exporters of Seed Potatoes Worldwide ..............................................................56
10. Key Resources ..................................................................................................................57

1
Summary The potato is the most important vegetable crop in Canada, accounting for 32% of all vegetable farm cash receipts (FCR)1 and 16% of all horticultural2 farm cash receipts in Canada. This translates to FCRs of $1.01 billion in the 2012 calendar year, down 2% from 2011. Producers reported harvesting 142,189 hectares of potatoes in 2013, down 4% from 2012. The decreases were mostly due to cuts in processing contract volumes. British Columbia (BC) had the largest decrease in harvested area (13%), followed by New Brunswick (NB) (10%), and Manitoba (MB), (8%). Despite the drop in harvested area, potato production increased slightly in 2013, thanks to higher yields. The 2013 harvested potato crop was estimated at 4,660,105 tonnes, up 2% from 2012. The average yield in 2013 was 32.77 tonnes per hectare, up 7% from 2012. The major producing provinces were Prince Edward Island (PEI) (24%), MB (21%), Alberta (AB) (18%), NB (13%), Quebec (QC) (12%) and Ontario (ON) (8%). Canada has been a world leader in the production of seed potatoes for more than 90 years. About 150 potato varieties are registered in Canada for the production of seed. The varieties grown in each production area are selected to meet the needs of specific markets and local preferences. Russet Burbank, Shepody, Ranger Russet, CalWhite and Umatilla Russet are the main frying varieties; Superior, Atlantic, Kennebec and Snowden are the main chipping varieties; and Superior, Russet Norkotah, Chieftain, Yukon Gold, Norland, Ranger Russet, Goldrush, Sangre and Umatilla Russet are the leading table varieties. In the 2012–2013 crop year, exports of Canadian potatoes and potato products were estimated at $1.15 billion, up 2% from 2011–2012. Canada exported fresh potatoes (table stock and seed potatoes) worth $155 million and processed potatoes (frozen and other) worth $996 million in the same time period. By far, the largest export destination for Canadian potatoes and potato products is the United States (US). Canada’s neighbour to the South takes in 84% of Canadian potato exports, which were worth $965 million in 2012–2013. Japan (3%) and Mexico (2%) are the second- and third-largest export destinations respectively, mostly because of the volume of processed potato products that Canada ships to those two countries. Canada imported a total value of $350 million in potatoes in 2012–2013. Of that amount, $247 million was for processed potatoes, and the remaining $103 million was for fresh potatoes.
1 Farm cash receipts represent the income received from the sale of agricultural commodities as well as direct program payments made to support the agricultural sector. 2 The horticulture sector consists of greenhouse vegetables, other vegetables, potatoes, tree fruits, small fruits, floriculture, nursery, sod, Christmas trees, maple products, honey and ginseng.

2
Seasonal Review 2012 – 20133
Prince Edward Island In PEI, the 2012 planting season started out well, with favorable weather. Processing contracts were settled prior to and during planting. Overall contracted volumes for processing potatoes increased slightly over the previous year. The number of contract growers is continuing to decrease as the industry rationalizes. Statistics Canada estimated PEI’s planted acreage in 2012 at 89,500 acres, up just over 3% from 2011. Spring provided good growing conditions, but July and August brought heat stress and drought-like conditions, and September brought record rainfall to PEI. The result was one of the most variable crops in recent history. The first load of new-crop potatoes left the province on July 31, 2012. Statistics Canada estimated that after main-crop harvest, PEI growers left 2,000 acres in the ground, owing to the wet conditions. As well, Statistics Canada estimated the average yield to be 285 cwt
4/acre,
with total production of 24.94 million cwt. As the season progressed, it became apparent that the Statistics Canada estimate was too high. Therefore, before publishing the April 1 storage holdings, the PEI Potato Board used an adjusted production number of 23.94 million cwt to provide more accurate holdings numbers for the remainder of the season. Crop quality was variable, resulting in higher cullage than in the previous year. The wet fall made storability a major concern. A total of 741,380 cwt of potatoes were dumped in 2012–2013, significantly more than in the previous year. The opportunities that existed in the US Eastern Seaboard in 2011–2012 disappeared for the 2012–2013 season, because there was a surplus of domestic potatoes to meet the needs of those markets. As a result, PEI shipped less to North American markets than it had in the previous year (–12% to Canadian markets and –34% to US markets), and fresh shipments were down overall (–11%). Despite poor North American sales, export markets improved over the previous year by 74%. The average price for 10-lb paper bags for the 2012–2013 season was $1.44, down from the 2011–2012 average price of $2.00.
New Brunswick The 2012 NB potato crop was a success: although the dry growing season meant that yields were not optimal, quality was. Payables for the 2012 crop were above average for all processing varieties. Fresh prices were well below average due to excess potatoes on the North American market until late in the year, at which point prices began to strengthen. Seed quality was excellent, and markets for NB seed remained strong. The 2013 planting season was stretched out over a six-week period in NB, and as a result this year’s crop will be extremely variable. Processing contracts were settled prior to planting, and contracted volumes are on par with last year. NB’s planted acreage in 2013, at 48,500 acres, is down 4% from last year. A cold, wet start to the season delayed planting until June 17, and the first few months of the growing season brought rainfall that broke records, including 30-year averages. Although moisture has been present, there has fortunately been little pressure from diseases such as late blight.
3 Most of the data are based on crop years that run from August of one year to July of the following year and are expressed as such
(e.g. 2012–2013). Data based on calendar years are expressed as a single year (e.g. 2013). Seasonal reviews were prepared by provincial organizations; see Key Resources. Seasonal updates for Newfoundland and Labrador and for Nova Scotia were not available at the time of publication. 4 cwt: Hundredweight (short, US).

3
Yields in 2013 have been above average for many varieties, although minimal water-related issues such as rot and water soak was present as potatoes began to go into storage. Producers will have to exercise all the best management practices that they have learned over the years to make sure that the 2013 crop stores well. Any time Mother Nature delivers this much precipitation this early in the season, the tubers will experience stress, which in this case could cause hollow heart and other growth defects.
Quebec In 2012, QC producers planted 16,714 hectares of potatoes. Planting conditions were excellent but were followed by a hot, dry summer, which led to heavy irrigation demands. This resulted in yields equivalent to the average of the three previous years, good quality, and a slightly smaller-than-normal size. Total production was 196,148 metric tonnes, down 4% from 2011. Slightly over half (52%) of the crop was intended for the table potato market, 16% for potato chip production, 21% for pre-peeling, and 11% for seed production. Given the abundance of potatoes across North America, prices were lower in 2012-2013. From the start of the harvest in July, prices were down from the previous year. They remained low throughout the fall and winter, rallying slightly only in mid-May. For 2013, after warm temperatures in early May allowed early planting in the southernmost regions of the province, rains set in and delayed planting in the other regions. Producers had to wait until mid-June for conditions to improve. Statistics show that this was the wettest start to the season in five years. The rain also caused a lack of uniformity in certain fields, where cases of seed piece decay were reported. Nevertheless, quality is expected to be very good and yields should be average.
Ontario In 2012, ON potato growers produced 340,427 tonnes of potatoes from 15,986 harvested hectares. The value of the crop was about $100 million. Just over half the crop was used for potato chips, and the rest was used for table consumption. The 2012 growing season was an unusual one in ON. In most areas, potatoes were planted earlier than they had been for many years. However, the early, dry spring quickly turned wetter and cooler, and planting lasted until late June in some areas. Late frosts damaged some of the early potatoes. Conditions then became very hot and dry, and the crop suffered. Growers had to irrigate in most areas just to keep the crop alive. The harvest season brought more favourable weather, and the crop came out of the ground smoothly. Yields were well below normal, but the quality of the crop was decent considering the growing conditions. Market prices for the 2012 crop were depressed early on because of a huge surplus of potatoes in Idaho. Prices levelled out over the winter, but in the spring, when the Idaho crop came up short, there was a large jump in prices. The 2013 growing season started out wet and cold, but eventually ideal growing conditions emerged. The wet, cold spring resulted in some drowned-out areas and heavy frost damage to some of the early crops. Although most plants recovered, in some areas frost damage resulted in poor plant stands and small tubers. The summer brought ideal growing conditions, and the 2013 potato crop looked very healthy. Abundant rainfall at tuber set in June and July resulted in heavy tuber set, and above average yields are expected.

4
Manitoba In 2013, MB’s potato area decreased by 10%, to 28,328 hectares, owing to cuts in processing contract volumes. Planting was delayed by nearly two weeks, with the majority of the processing crop planted by the end of May. Seed and table growers extended their planting into the third week of June. With the exception of heavy rain events in some areas early in the season, excellent growing conditions combined with an open fall allowed the crop to recover from the late start, resulting in excellent yields and excellent quality. Timely rains, adequate irrigation and a cool July pushed yields to near-record numbers, resulting in significant surplus production. Harvest was extended into the second week of October because of late September rains and additional yield. Processing crop quality is better than it has been in recent years. Fresh market production and seed production have also fared well, with above average crops. Overall, the production year has been encouraging. The additional volume will need to be marketed within and beyond the province’s borders, a welcome change from the past two seasons.
Saskatchewan Prices for the 2012 crop were down from previous years. The decrease was more noticeable in fresh market potatoes, but seed prices were down slightly as well. With the exception of some Russet Burbank potatoes, the entire crop was marketed. Tuber quality was moderate. Producers across the province planted late and into wet soil and therefore had dirt clods to contend with at harvest, causing some bruising. The supply was down, as conditions were so wet that some producers could not plant all the acres that they had planned on. Spring came late to Saskatchewan (SK) in 2013. Cold weather persisted well into May, and again there was some localized flooding. For the most part, however, planting was timelier than in the previous three years. June and July were warm and mostly dry, creating better conditions than SK’s potato producers had seen in a long time. Almost everyone was able to seed the acres that they had planned on.
Alberta AB’s 22,530 hectares produced over 843,600 tonnes of potatoes in 2012, for an estimated farm gate value5 of over $165 million. The true economic value of potatoes to AB’s economy is over $1 billion each year. The number of processing hectares planted in the province was at an all-time high, with over 17,500 hectares planted in the spring. The crop went in early in all areas, under almost ideal conditions. June was somewhat cool and wet across the province, but the July heat made up for the time lost in June. The southern part of the province experienced some disease pressure during the latter part of July and into August, with the main concern being late blight. The harvest period was dry, and therefore some acres that should have been left behind went into storage. Some bins were lost over the winter as a result of storage issues, but there was still an overabundance of processing potatoes in the province, with plants running the old crop until early August 2013. This overabundance directly impacted the contracts for the 2013 crop year, as acres were cut back with processors by about 10% across the board.
5 Farm gate value represents production value, expressed as remuneration obtained at the “farm gate,” and concerns gross returns to growers.

5
The province’s seed sector had a good year as well, and all sales obligations were met, given that some varieties of seed had excess over sales. The fresh market in AB, although small, continues to grow. The province still does not produce enough potatoes to meet consumer demand and thus relies on out-of-province potatoes from BC and MB and sometimes the US. Alberta’s total production in 2013 was down by over 1,280 hectares as a result of the processing sector, given that seed and fresh market numbers both increased. The fresh market sector increased its acres by 10% this year alone. An excellent growing season, with the exception of some severe storms in the south in the first week of July, provided growers with above-average yields and a bountiful harvest.
British Columbia In 2012, cool, cloudy spring weather persisted over the Fraser Valley until after July 4, delaying the beginning of the early-crop potato harvest by two weeks. Early nugget potato quality was negatively affected by the high moisture levels in these potato fields. Later nuggets were not affected, as the soil had dried by the time the tubers were developing. The cool spring was followed by a hot summer with hardly any precipitation prior to harvest. These conditions decreased the tuber size profiles of many fields, especially those without adequate irrigation water supplies. In the western Fraser Valley, near the mouth of the river, low ditch-water levels allowed saline sea water to infiltrate irrigation pump stations, effectively ending irrigation by affected growers for the season. By the last week of September, most growers were waiting for rain to cool the soil and lower tuber pulp temperatures enough to allow potatoes to be dug up without excessive bruising and to be stored without the risk of deteriorating prior to being sold. The drought ended on September 21, after the driest August and September on record. Heavy rain a week after Thanksgiving delayed the continuation of harvesting until the soil had dried enough for tractors to re-enter fields. In the end, no fields were abandoned, and the quality of stored potatoes was average to good. The size profile was slightly below average. The weather in the spring of 2013 was temperate, with a reasonable mixture of sun, cloud and precipitation. Seeding was completed by the end of June, and no significant problems occurred. The summer weather was sunny but not overly hot, so crop development was normal. By summer’s end, some growers near the Fraser River delta had to stop pumped irrigation because their ditch-water sources had become saline. A heavy rain event in late September led to the abandonment of about 30 acres, mostly of yellow-fleshed potatoes, that had been immersed in water too long to ensure good potato quality going into storage. Otherwise, the harvest was almost complete under normal conditions by the end of the third week of October. From the beginning of the 2012–2013 crop marketing year until May 2013, prices were below average owing to a glut of most potato varieties in the states of Idaho and Washington. Inexpensive US Pacific Northwest Russets landed in BC and pressured the local market price below the cost of production until May, when the glut had been marketed too quickly, including to alternative-use consumption. By then, BC supplies were exhausted, and the price rebounded. During the 2013–2014 harvest season, prices returned to long-term averages. A slight shortage is anticipated once the autumn harvest is complete in all areas of North America.

6
1. Production
1.1. Number of Potato Farms in Canada (2006 and 2011) Province 2006 2011 % Change 2011/06
Newfoundland and Labrador 26 25 -4%
Prince Edward Island 330 262 -21%
Nova Scotia 17 13 -24%
New Brunswick 238 193 -19%
Quebec 274 224 -18%
Ontario 243 170 -30%
Manitoba 153 99 -35%
Saskatchewan 91 61 -33%
Alberta 162 149 -8%
British Columbia 73 127 74%
Canada 1,607 1,323 -18%
Source: Statistics Canada, Census of Agriculture (CANSIM Table 004-0014) Note: Number of farms includes all farms reported to be growing potatoes and on which potato production represents 50% or more of total farm cash receipts.
1.2. Canadian Potato Production
Province 2009 2010 2011 2012 2013 % Change 2013/12
Area Planted (Hectares)
Newfoundland and Labrador 243 202 202 202 202 0%
Prince Edward Island 34,400 34,804 35,047 36,221 36,018 -1%
Nova Scotia 931 809 809 769 769 0%
New Brunswick 22,259 20,842 20,963 21,651 19,426 -10%
Quebec 17,402 17,807 17,200 17,000 17,101 1%
Ontario 14,974 15,581 15,136 16,107 15,379 -5%
Manitoba 31,971 28,329 29,138 30,757 28,329 -8%
Saskatchewan 3,440 3,035 2,914 2,833 2,833 0%
Alberta 21,247 20,437 21,611 22,642 21,240 -6%
British Columbia 2,833 2,631 2,873 2,833 2,509 -11%
Canada 149,699 144,478 145,894 151,015 143,805 -5%
Source: Statistics Canada (CANSIM Table 001-0014)

7
1.2. Canadian Potato Production (cont’d)
Province 2009 2010 2011 2012 2013 % Change 2013/12
Area Harvested (Hectares)
Newfoundland and Labrador 243 202 202 202 202 0%
Prince Edward Island 33,185 34,804 34,804 35,411 36,018 2%
Nova Scotia 890 809 809 769 769 0%
New Brunswick 22,056 20,761 19,628 21,247 19,223 -10%
Quebec 16,916 17,281 16,714 16,801 16,900 1%
Ontario 14,731 15,379 14,772 15,986 15,176 -5%
Manitoba 31,364 27,520 28,329 30,555 28,127 -8%
Saskatchewan 3,238 2,833 2,833 2,631 2,631 0%
Alberta 20,114 18,212 20,275 22,135 20,673 -7%
British Columbia 2,833 1,416 2,792 2,833 2,469 -13%
Canada 145,571 139,217 141,159 148,569 142,189 -4%
Average Yield (t/ha)
Newfoundland and Labrador 15.69 19.73 20.17 19.73 19.73 0%
Prince Edward Island 33.62 33.62 31.94 31.11 31.50 1%
Nova Scotia 29.70 26.34 25.78 24.66 26.55 8%
New Brunswick 30.26 33.07 27.46 30.82 32.20 4%
Quebec 29.49 30.15 30.53 29.70 31.75 7%
Ontario 24.10 24.10 19.62 21.30 25.22 18%
Manitoba 31.38 31.38 28.02 30.82 34.75 13%
Saskatchewan 32.50 28.58 31.38 28.02 30.83 10%
Alberta 36.09 35.19 36.76 38.31 40.01 4%
British Columbia 32.50 33.62 30.83 30.82 31.38 2%
Canada 31.43 31.65 29.68 30.76 32.77 7%
Total Production (Tonnes)
Newfoundland and Labrador 3,810 3,992 4,082 3,992 3,992 0%
Prince Edward Island 1,115,856 1,170,288 1,111,774 1,101,522 1,134,408 3%
Nova Scotia 26,445 21,319 20,866 18,960 20,412 8%
New Brunswick 667,472 686,478 539,013 654,908 619,028 -5%
Quebec 498,869 521,005 510,300 499,005 536,609 8%
Ontario 354,987 370,591 289,760 340,427 382,748 12%
Manitoba 984,312 863,654 793,800 941,810 977,281 4%
Saskatchewan 105,235 80,968 88,906 73,710 81,104 10%
Alberta 725,896 640,937 745,401 848,005 827,094 -2%
British Columbia 92,081 47,628 86,093 87,318 77,475 -11%
Canada 4,574,964 4,406,860 4,189,994 4,569,612 4,660,105 2%
Source: Statistics Canada (CANSIM Table 001-0014)

8
1.2. Canadian Potato Production (cont’d) Province 2008 2009 2010 2011 2012 % Change 2012/11
Potatoes Sold, Consumed, Seeded or Fed to Livestock (Tonnes)
Newfoundland and Labrador 4,672 3,538 3,720 3,765 3,720 -1%
Prince Edward Island 1,109,914 1,098,801 1,158,132 1,103,110 1,079,296 -2%
Nova Scotia 23,905 25,583 20,503 19,686 17,872 -9%
New Brunswick 624,698 635,675 654,454 508,077 602,063 18%
Quebec 470,565 460,041 491,657 477,006 470,202 -1%
Ontario 316,159 312,485 326,093 260,729 313,165 20%
Manitoba 998,827 966,848 838,207 778,060 856,986 10%
Saskatchewan 109,726 96,299 74,889 82,782 68,856 -17%
Alberta 778,015 709,158 624,698 728,981 799,425 10%
British Columbia 97,206 82,963 42,230 78,700 78,473 0%
Canada 4,533,732 4,391,392 4,234,583 4,040,896 4,290,058 6%
Source: Statistics Canada (CANSIM Table 001-0014) Note: 2013 Potatoes Sold, Consumed, Seeded or Fed to Livestock (also referred to as marketed production) data were not available at the time of publication. The data will be published in November 2014.

9
1.3. Top 50 Registered Seed Potato Varieties Grown in Canada, Total Area (Ha) 2013
VARIETIES NFL PEI NS NB QC ON MB SK AB BC Total
Russet Burbank 1,398 676 61 1,179 266 1,729 9 5,318
Goldrush 21 726 114 803 23 37 3 38 1,764
Atlantic 3 341 12 560 8 18 7 3 153 4 1,108
Superior 1 446 43 252 13 3 757
Norland 137 40 146 1 188 147 80 10 749
Shepody 323 130 1 14 5 28 225 8 734
Prospect 537 37 77 650
Innovator 1 123 254 225 10 613
Russet Norkotah 174 1 30 87 203 33 528
Kennebec 332 114 15 23 1 12 28 524
Chieftain 91 82 193 13 0 27 78 483
Ranger Russet 134 22 121 52 138 15 483
Eva 1 395 17 412
Yukon Gold 111 47 35 19 73 6 31 89 411
HO2000 221 68 77 366
Umatilla Russet 158 44 117 320
Dakota Pearl 100 40 36 22 59 3 59 319
Envol 292 292
Ac Chaleur 1 177 2 92 7 279
Sangre 29 97 25 59 211
Baby Boomer 113 64 27 203
Satina 68 6 99 173
Snowden 9 126 11 5 8 158
Cal White 109 12 17 3 2 14 158
Piccolo 119 22 13 154
Bintje 2 41 108 1 152
Yukon Gem 131 8 4 1 144
Classic Russet 86 32 9 1 1 130
Gemstar Russet 6 45 21 32 5 2 110
Milva 102 102
Modoc 3 12 11 76 102
Sifra 49 10 18 16 93
Viking 1 76 8 5 90
Vivaldi 23 45 1 11 80
Red La Soda 6 34 8 27 76
Agata 39 35 75
Red Pontiac 52 14 1 1 5 73
Andover 9 41 19 1 70
Source: Canadian Food Inspection Agency, Potatoes Section

10
1.3. Top 50 Registered Seed Potato Varieties Grown in Canada, Total Area (Ha) 2013 (cont’d)
VARIETIES NFL PEI NS NB QC ON MB SK AB BC Total
Fabula 39 17 6 8 69
IPM-ABR 11 19 1 35 65
Alturas 63 63
Adora 21 12 22 6 61
Darkred Chieftain 28 24 1 1 55
Red Maria 54 54
AC Peregrine Red 28 10 6 44
Blazer Russet 22 22 43
Valor 23 4 15 1 42
Pacific Russet 5 7 26 2 40
Ampera 32 8 39
Navan 37 37
Total top 50
registered
varieties 28 6,315 48 2,961 2,220 251 2,401 1,067 3,454 331 19,077
Total other
varieties1 8 486 0 1,107 512 91 362 115 778 88 3,547
TOTAL ALL 36 6,801 48 4,067 2,732 343 2,762 1,182 4,232 419 22,623
Source: Canadian Food Inspection Agency, Potatoes Section Note: 1 Other varieties included non-registered varieties, varieties grown on smaller hectarage and varieties that
were not approved for release by the Canadian Food Inspection Agency Representative.
1.4. Area of Registered Varieties (Ha) – Five-Year Average
Province 2009 2010 2011 2012 2013 2009-2013
(5 years) Mean
Newfoundland and Labrador 60 57 27 40 36 44
Prince Edward Island 6,491 5,068 6,952 8,081 6,801 6,679
Nova Scotia 103 37 43 90 48 64
New Brunswick 5,430 4,705 4,224 4,374 4,067 4,560
Quebec 2,632 2,687 2,586 2,808 2,732 2,689
Ontario 278 270 246 284 343 284
Manitoba 2,767 2,454 2,928 3,223 2,762 2,827
Saskatchewan 1,558 1,415 1,213 1,187 1,182 1,311
Alberta 3,867 3,948 4,297 4,353 4,232 4,139
British Columbia 467 441 441 427 419 439
Total 23,653 21,080 22,957 24,868 22,623 23,036
Source: Canadian Food Inspection Agency, Potatoes Section

11
2. Canadian Potato Storage Holdings
2.1. Canadian Potato Storage by Province
Province Nov-12 Dec-12 Jan-13 Feb-13 Mar-13 Apr-13 May-13 Jun-13
Newfoundland and Labrador N/A N/A N/A N/A N/A N/A N/A N/A
Prince Edward Island 9,868 9,012 8,130 7,196 6,178 4,850 3,713 2,006
Nova Scotia N/A N/A N/A N/A N/A N/A N/A N/A
New Brunswick 5,186 4,662 4,324 3,764 3,278 2,778 2,160 1,066
Total Maritimes 15,054 13,674 12,454 10,960 9,455 7,628 5,873 3,072
Quebec 3,883 3,511 3,023 2,660 2,312 1,873 1,270 677
Ontario 2,330 2,175 1,891 1,574 1,217 982 628 297
Manitoba 7,503 6,922 6,091 5,308 4,623 3,933 2,476 1,355
Saskatchewan N/A N/A N/A N/A N/A N/A N/A N/A
Alberta 7,443 6,027 5,444 4,763 4,265 3,450 2,400 1,309
British Columbia 514 416 321 264 209 120 36 7
Total Canada 36,727 32,725 29,223 25,529 22,082 17,986 12,684 6,717
2012-2013 Crop Year
(Hundreds of metric tonnes)
Source: AAFC (Infohort) Notes: This table provides data by province across Canada as reported by the storage operators and represents volumes as of the first of each month from November to June. N/A: Data unavailable.
2.2. Canadian Potato Storage
0
5,000
10,000
15,000
20,000
25,000
30,000
35,000
40,000
Hu
nd
red
s o
f m
etr
ic t
on
ne
s
2012/2013 Canadian Potato Storage
Source: AAFC (Infohort)

12
2.3. Intended Utilization of Potatoes by Province
Prince
Edward
Island
New
Brunswick
Quebec Ontario Manitoba Saskatchewan Alberta British
Columbia
Fresh 2,889 915 2,117 731 613 N/A 222 292
Processed 5,945 3,036 1,324 1,534 6,106 N/A 6,013 89
Seed 1,034 1,235 442 66 784 N/A 1,207 132
Fresh 2,544 802 1,894 709 519 N/A 201 204
Processed 5,470 2,682 1,174 1,401 5,619 N/A 4,692 81
Seed 998 1,177 442 65 784 N/A 1,134 132
Fresh 2,199 752 1,640 533 371 N/A 123 126
Processed 4,976 2,418 941 1,281 5,159 N/A 4,187 69
Seed 954 1,155 442 76 561 N/A 1,134 126
Fresh 1,816 667 1,367 444 282 N/A 119 84
Processed 4,454 2,040 852 1,054 4,498 N/A 3,593 57
Seed 926 1,057 441 77 528 N/A 1,051 122
Fresh 1,396 587 1,152 334 217 N/A 104 52
Processed 3,875 1,699 726 806 3,885 N/A 3,196 46
Seed 907 991 434 77 522 N/A 965 111
Fresh 940 497 892 235 150 N/A 88 15
Processed 2,980 1,352 604 673 3,261 N/A 2,652 29
Seed 930 929 378 74 522 N/A 710 75
Fresh 586 344 635 141 81 N/A 45 5
Processed 2,293 1,020 448 440 1,913 N/A 2,084 16
Seed 834 796 187 47 482 N/A 271 15
Fresh 305 240 381 65 48 N/A 21 0
Processed 1,698 646 285 230 1,276 N/A 1,267 0
Seed 3 180 11 3 32 N/A 20 6
Jun-13
Nov-12
Dec-12
Jan-13
Feb-13
Mar-13
2012-2013 Crop Year(Hundreds of metric tonnes)
Apr-13
May-13
Source: AAFC (Infohort) Note: This table is done in conjunction with the storage holdings and indicates the intended utilization as reported by the storage operators by either the fresh market, seed market or processing market. The storage operator's intent may change during the month depending on the demand. N/A: Data unavailable.

13
2.4. Intended Utilization of Potatoes – Total
Seed13%
Processed66%
Fresh21%
Intended Utilization of Potatoes
Source: AAFC (Infohort) Note: Storage holdings as of November 1, 2012.
2.5. Percentage of Intended Utilization of Potato by Province
% Seed % Fresh % Processed2012 Total Production
('000 t)Prince Edward Island 10% 29% 60% 1,080New Brunswick 24% 18% 59% 655
Quebec 11% 55% 34% 499
Ontario 3% 31% 66% 340
Manitoba 10% 8% 81% 942
Alberta 16% 3% 81% 843
British Columbia 26% 57% 17% 87 Source: AAFC (Infohort) Note: Details of intended utilization are not available for Newfoundland and Labrador, Nova Scotia, Saskatchewan, and have therefore not been used in this section.

14
3. Revenue
3.1. Potato Farm Cash Receipts
Province 2008 2009 2010 2011 2012 % Change 2012/11
Newfoundland and Labrador 2.80 2.28 1.84 1.86 1.74 -6%
Prince Edward Island 202.42 215.84 203.76 257.42 246.23 -4%
Nova Scotia 5.41 8.62 6.23 5.51 5.12 -7%
New Brunswick 113.40 134.88 115.00 141.95 109.78 -23%
Quebec 117.56 125.78 123.86 143.01 132.30 -7%
Ontario 90.95 100.57 103.65 96.58 92.10 -5%
Manitoba 201.72 251.16 203.77 168.41 174.93 4%
Saskatchewan 39.47 53.82 36.11 39.21 33.67 -14%
Alberta 154.80 163.81 152.88 142.19 176.51 24%
British Columbia 42.67 42.53 28.75 32.58 37.28 14%
Canada 971.21 1,099.28 975.85 1,028.71 1,009.65 -2%
CAD $ Million
Source: Statistics Canada (CANSIM Table 002-0001) 3.2. Potato Farm Value
Province 2008 2009 2010 2011 2012 % Change 2012/11
Newfoundland and Labrador 2,975 2,248 1,996 1,981 1,810 -9%
Prince Edward Island 249,212 227,673 277,361 284,983 257,470 -10%
Nova Scotia 6,618 6,675 5,721 5,848 4,821 -18%
New Brunswick 144,940 129,054 146,455 117,384 152,540 30%
Quebec 152,737 116,681 155,622 148,154 130,636 -12%
Ontario 117,112 99,719 109,604 91,704 101,978 11%
Manitoba 236,927 251,318 176,288 171,390 205,175 20%
Saskatchewan 48,919 44,551 37,531 41,334 30,596 -26%
Alberta 191,154 170,177 147,293 180,745 195,980 8%
British Columbia 46,340 42,820 22,282 43,272 39,013 -10%
Canada 1,196,934 1,090,916 1,080,153 1,086,795 1,120,019 3%
Value (CAD $ ' 000)
Source: Statistics Canada (CANSIM Table 001-0014) Note: Farm value represents the value of the amount sold, consumed, seeded or fed to livestock.

15
4. Prices
4.1. Canadian Potato Average Prices
Province 2008 2009 2010 2011 2012 % Change 2012/11
Newfoundland and Labrador 636.76 635.37 536.63 526.18 486.62 -8%
Prince Edward Island 224.53 207.20 239.49 258.35 238.55 -8%
Nova Scotia 276.85 260.92 279.04 297.06 269.75 -9%
New Brunswick 232.02 203.02 223.78 231.04 253.36 10%
Quebec 324.58 253.63 316.53 310.59 277.83 -11%
Ontario 370.42 319.12 336.11 351.72 325.64 -7%
Manitoba 237.21 259.94 210.32 220.28 239.41 9%
Saskatchewan 445.83 462.63 501.15 499.31 444.34 -11%
Alberta 245.69 239.97 235.78 247.94 245.15 -1%
British Columbia 476.72 516.13 527.63 549.84 497.15 -10%
Canada 264.01 248.42 255.08 268.95 261.07 -3%
Average Price ($/t)
Source: Statistics Canada (CANSIM Table 001-0014) Note: The average price for potatoes is based on the transaction price received by the producer. If a portion of the crop is being utilized but the producer is receiving no compensation for that portion of the crop, the price is averaged into the average price at a zero value. The price is net of all deductions made before the producer is paid.

16
4.2. Monthly Summary of Daily Wholesale to Retail Market Prices
Crop Year 2012-2013
Red Russet White White Yukon
Gold
Red Russet White Yellow Yukon
Gold
Ctn 10x5
Lbs
Ctn 50
Lbs 100
Bag 10
Lbs
Bag 10x5
Lbs
Bag 10
Lbs
Ctn 10x5
Lbs
Ctn 10x5
Lbs
Bag 10x5
Lbs
Ctn 10x5
Lbs
Ctn 10x5
Lbs
Low $23.50 - $2.20 $17.00 $2.50 $15.00 $12.50 $12.50 $17.00 -
High $23.50 - $3.60 $22.40 $3.50 $26.60 $21.35 $22.40 $30.00 -
Low $23.50 $14.00 $2.10 $17.00 $2.10 $15.00 - $20.85 $17.00 -
High $23.50 $15.00 $3.60 $20.25 $3.00 $26.60 - $22.40 $28.25 -
Low $18.00 $14.00 $2.10 $13.00 $2.10 $12.50 - $20.90 $17.00 -
High $23.50 $14.00 $3.60 $20.25 $2.56 $25.85 - $22.40 $25.05 -
Low $18.00 $14.00 $2.00 $13.00 $2.15 $12.00 - $11.00 $17.00 -
High $23.50 $14.00 $3.60 $20.25 $2.50 $32.00 - $22.40 $25.05 -
Low $18.00 $14.00 $1.75 $13.00 $2.15 $12.00 - $11.00 $17.00 $13.00
High $23.50 $14.00 $3.60 $20.25 $2.25 $32.00 - $22.40 $23.45 $14.50
Low $18.00 $14.00 $1.75 $13.00 $2.15 $10.25 $10.25 $10.50 $20.50 $12.50
High $23.50 $14.00 $3.60 $20.25 $2.25 $20.50 $16.50 $17.75 $23.45 $14.50
Low $18.00 $14.00 $1.75 $20.25 $2.15 $10.50 $12.50 $10.00 $18.00 $12.50
High $23.50 $14.00 $3.60 $20.25 $2.25 $20.50 $16.50 $16.25 $23.45 $14.50
Low $18.00 $13.50 $1.75 $20.25 $2.15 $10.50 $12.50 $10.00 $18.00 $12.50
High $23.50 $18.75 $3.60 $20.25 $2.25 $19.00 $16.50 $16.25 $23.45 $14.50
Low $18.00 $13.50 $1.75 $20.25 $2.00 $11.50 $13.00 $10.50 $18.00 $12.50
High $23.50 $18.75 $3.60 $20.25 $2.25 $21.90 $18.70 $16.25 $23.45 $14.50
Low $18.00 $13.50 $1.50 $20.25 $2.00 $11.50 $13.00 $10.50 $18.00 $13.50
High $23.50 $18.75 $2.00 $20.25 $2.50 $25.20 $20.35 $16.25 $23.45 $14.50
Low $18.00 $14.00 $1.50 - $2.00 $16.00 $12.50 $13.50 $18.00 $13.50
High $23.50 $16.00 $2.00 - $2.50 $28.45 $22.45 $16.25 $23.45 $14.50
Low $22.40 - $1.50 - $2.00 $17.50 $15.50 $14.50 $18.00 $13.50
High $22.40 - $2.00 - $2.50 $29.10 $22.45 $21.50 $23.45 $14.50
Mar-2013
Apr-2013
May-2013
Jun-2013
Jul-2013
Feb-2013
Toronto Montreal
Variety
Unit Quantity
Aug-2012
Sep-2012
Oct-2012
Nov-2012
Dec-2012
Jan-2013
Source: Infohort (AAFC)
Notes: Ctn: Carton. Prices are based on Canada No. 1 grade potatoes. Daily Wholesale to Retail Market Prices refers to markets where the prices are reported on a daily basis from Monday to Friday. This data is not comparable across markets as varieties and package sizes (unit quantity) may differ.
17
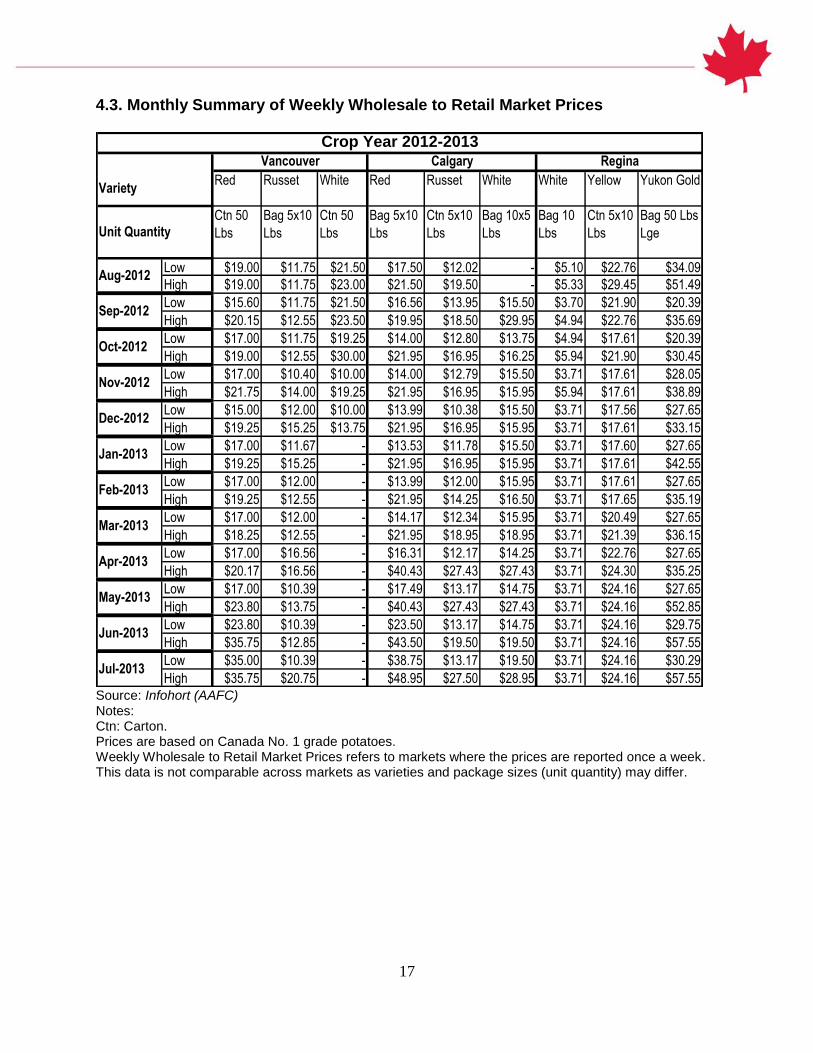
4.3. Monthly Summary of Weekly Wholesale to Retail Market Prices
Crop Year 2012-2013
Red Russet White Red Russet White White Yellow Yukon Gold
Ctn 50
Lbs
Bag 5x10
Lbs
Ctn 50
Lbs
Bag 5x10
Lbs
Ctn 5x10
Lbs
Bag 10x5
Lbs
Bag 10
Lbs
Ctn 5x10
Lbs
Bag 50 Lbs
Lge
Low $19.00 $11.75 $21.50 $17.50 $12.02 - $5.10 $22.76 $34.09
High $19.00 $11.75 $23.00 $21.50 $19.50 - $5.33 $29.45 $51.49
Low $15.60 $11.75 $21.50 $16.56 $13.95 $15.50 $3.70 $21.90 $20.39
High $20.15 $12.55 $23.50 $19.95 $18.50 $29.95 $4.94 $22.76 $35.69
Low $17.00 $11.75 $19.25 $14.00 $12.80 $13.75 $4.94 $17.61 $20.39
High $19.00 $12.55 $30.00 $21.95 $16.95 $16.25 $5.94 $21.90 $30.45
Low $17.00 $10.40 $10.00 $14.00 $12.79 $15.50 $3.71 $17.61 $28.05
High $21.75 $14.00 $19.25 $21.95 $16.95 $15.95 $5.94 $17.61 $38.89
Low $15.00 $12.00 $10.00 $13.99 $10.38 $15.50 $3.71 $17.56 $27.65
High $19.25 $15.25 $13.75 $21.95 $16.95 $15.95 $3.71 $17.61 $33.15
Low $17.00 $11.67 - $13.53 $11.78 $15.50 $3.71 $17.60 $27.65
High $19.25 $15.25 - $21.95 $16.95 $15.95 $3.71 $17.61 $42.55
Low $17.00 $12.00 - $13.99 $12.00 $15.95 $3.71 $17.61 $27.65
High $19.25 $12.55 - $21.95 $14.25 $16.50 $3.71 $17.65 $35.19
Low $17.00 $12.00 - $14.17 $12.34 $15.95 $3.71 $20.49 $27.65
High $18.25 $12.55 - $21.95 $18.95 $18.95 $3.71 $21.39 $36.15
Low $17.00 $16.56 - $16.31 $12.17 $14.25 $3.71 $22.76 $27.65
High $20.17 $16.56 - $40.43 $27.43 $27.43 $3.71 $24.30 $35.25
Low $17.00 $10.39 - $17.49 $13.17 $14.75 $3.71 $24.16 $27.65
High $23.80 $13.75 - $40.43 $27.43 $27.43 $3.71 $24.16 $52.85
Low $23.80 $10.39 - $23.50 $13.17 $14.75 $3.71 $24.16 $29.75
High $35.75 $12.85 - $43.50 $19.50 $19.50 $3.71 $24.16 $57.55
Low $35.00 $10.39 - $38.75 $13.17 $19.50 $3.71 $24.16 $30.29
High $35.75 $20.75 - $48.95 $27.50 $28.95 $3.71 $24.16 $57.55
Feb-2013
Vancouver Calgary Regina
Variety
Unit Quantity
Aug-2012
Sep-2012
Oct-2012
Nov-2012
Dec-2012
Jan-2013
Mar-2013
Apr-2013
May-2013
Jun-2013
Jul-2013
Source: Infohort (AAFC)
Notes: Ctn: Carton. Prices are based on Canada No. 1 grade potatoes. Weekly Wholesale to Retail Market Prices refers to markets where the prices are reported once a week. This data is not comparable across markets as varieties and package sizes (unit quantity) may differ.

18
4.3. Monthly Summary of Weekly Wholesale to Retail Market Prices (cont’d)
Red Russet White Red White Red Russet White Yellow
Ctn 10x5
Lbs
Bag 5x10
Lbs
Ctn 10x5
Lbs
Ctn 10x5
Lbs
Bag 10
Lbs
Ctn 5x10
Lbs
Bag 50
Lbs
Ctn 50
Lbs
Bag 10x5
Lbs
Low $18.50 $17.95 $19.95 $18.25 $2.50 - $17.00 - $28.00
High $21.50 $26.19 $33.85 $33.75 $3.95 - $18.00 - $28.00
Low $19.20 $13.95 $16.25 $16.50 $2.25 - $18.00 $18.75 $28.00
High $20.95 $19.16 $30.02 $22.75 $3.25 - $18.00 $23.25 $28.00
Low $15.99 $13.95 $16.25 $16.50 $2.45 - $18.00 $17.75 $28.00
High $19.95 $16.61 $30.02 $20.00 $3.25 - $18.00 $23.25 $28.00
Low $16.50 $13.75 $13.75 $11.00 $1.45 $22.00 $18.00 $16.75 $28.00
High $19.95 $16.95 $26.95 $20.00 $2.75 $22.00 $18.00 $23.25 $28.00
Low $17.90 $12.50 $15.50 $11.00 $1.45 $22.00 $18.00 $16.75 $28.00
High $19.80 $16.95 $28.50 $19.25 $2.75 $28.00 $18.00 $23.25 $28.00
Low $17.50 $13.40 $15.50 $11.00 $1.55 $22.00 $18.00 $16.00 $22.50
High $19.80 $24.27 $17.95 $17.75 $2.50 $22.00 $18.00 $23.25 $28.00
Low $17.95 $13.75 $15.95 $17.75 $1.55 $22.00 $18.00 $16.00 $28.00
High $22.36 $18.95 $26.19 $17.75 $2.50 $22.00 $18.00 $23.25 $28.00
Low $18.95 $13.95 $15.95 $17.75 $1.55 $22.00 $18.00 $16.00 $28.00
High $23.95 $18.80 $19.16 $17.75 $2.25 $22.00 $18.00 $23.25 $28.00
Low $19.80 $15.25 $14.25 $17.25 $2.00 $18.75 $18.00 $16.00 $28.00
High $27.47 $19.78 $19.16 $17.25 $2.25 $22.00 $18.00 $23.25 $28.00
Low $21.95 $15.25 $12.95 $17.25 $2.25 $22.00 $18.00 $16.00 $23.00
High $31.30 $18.52 $19.80 $17.25 $2.25 $22.00 $18.00 $23.25 $28.00
Low $26.75 $15.25 $14.75 $17.25 $2.25 $18.75 $18.00 $18.00 $28.00
High $33.80 $21.80 $19.80 $23.25 $2.25 $22.00 $18.00 $23.25 $28.00
Low $29.50 $15.95 - $23.25 - - $18.00 $21.00 $28.00
High $54.29 $28.11 - $23.25 - - $18.00 $23.25 $28.00
Feb-2013
Winnipeg Halifax St. John's
Variety
Unit Quantity
Aug-2012
Sep-2012
Oct-2012
Nov-2012
Dec-2012
Jan-2013
Mar-2013
Apr-2013
May-2013
Jun-2013
Jul-2013
Source: Infohort (AAFC) Notes: Ctn: Carton. Prices are based on Canada No. 1 grade potatoes. Weekly Wholesale to Retail Market Prices refers to markets where the prices are reported once a week. This data is not comparable across markets as varieties and package sizes (unit quantity) may differ.

19
5. Domestic Consumption
5.1. Potatoes Available for Consumption in Canada1,2
2008 2009 2010 2011 2012
Kilograms per person
Potatoes-chips 3.55 3.47 3.57 3.66 3.54
Potatoes-chips, fresh equivalent 12.43 12.16 12.50 12.82 12.38
Potatoes-frozen 8.04 8.40 7.13 6.99 6.61
Potatoes-frozen, fresh equivalent 13.67 14.28 12.12 11.88 11.23
Potatoes-other processed 4.30 4.16 3.90 4.02 3.86
Potatoes-other processed, fresh equivalent 11.53 11.21 9.95 10.31 9.89
Potatoes-total processed 15.89 16.03 14.60 14.67 14.01
Potatoes-total processed, fresh equivalent 37.63 37.65 34.57 35.01 33.50
Potatoes-white fresh 3,4
25.55 25.57 25.14 22.06 20.80
Potatoes-white fresh, fresh equivalent 3,4
25.55 25.57 25.14 22.06 20.80
Potatoes-white fresh and processed, fresh
equivalent 3,4
63.19 63.23 59.72 57.07 54.30 Source: Statistics Canada (CANSIM Table 002-0011 - Food available in Canada, annual (kilograms per person, per year unless otherwise noted)) Notes: 1 Does not adjust for losses, such as waste and/or spoilage, in stores, households, private institutions or
restaurants or losses during preparation. 2 In retail weight unless otherwise specified.
3 Import and export data for "potatoes white" processed products have been converted to fresh.
4 Manufacture data for "potatoes white" includes potatoes used for seed.

20
5.2. Potatoes Available for Consumption in Canada – 10 Year-Trend
0
10
20
30
40
50
60
70
80
2003 2004 2005 2006 2007 2008 2009 2010 2011 2012
Co
ns
um
pti
on
(kil
og
ram
pe
r p
ers
on
)
Year
Potatoes Available for Consumption
Source: Statistics Canada (CANSIM Table 002-0011 - Food available in Canada, annual (kilograms per person, per year unless otherwise noted)) Note: Potatoes-white fresh and processed, fresh equivalent.

21
6. Trade
6.1. Canadian Potatoes Trade Balance
CAD $
Exports 2009/10 2010/11 2011/12 2012/13
Fresh Potatoes (excluding seed potatoes) 130,143,355 179,467,656 151,811,909 120,190,978
Seed Potatoes 38,587,431 38,786,153 38,533,741 34,698,712
Frozen Potatoes 867,247,695 797,667,778 863,767,106 919,223,428
Processed Potatoes 90,169,157 85,937,973 79,688,652 77,007,066
Total Exports 1,126,147,638 1,101,859,560 1,133,801,408 1,151,120,184
Imports
Fresh Potatoes (excluding seed potatoes) 81,971,629 113,173,336 102,970,338 99,169,254
Seed Potatoes 3,144,199 3,685,657 4,081,916 3,767,654
Frozen Potatoes 103,215,627 108,859,630 97,221,280 97,538,725
Processed Potatoes 128,478,238 140,563,675 160,042,049 149,601,111
Total Imports 316,809,693 366,282,298 364,315,583 350,076,744
Trade Balance (Exports - Imports)
Fresh Potatoes (excluding seed potatoes) 48,171,726 66,294,320 48,841,571 21,021,724
Seed Potatoes 35,443,232 35,100,496 34,451,825 30,931,058
Frozen Potatoes 764,032,068 688,808,148 766,545,826 821,684,703
Processed Potatoes -38,309,081 -54,625,702 -80,353,397 -72,594,045
Overall Trade Balance 809,337,945 735,577,262 769,485,825 801,043,440
Source: Statistics Canada (CATSNet, January 2014) Notes: Frozen potatoes include uncooked potatoes, potatoes cooked by steaming or boiling water, prepared or preserved potatoes (other than by vinegar or acetic acid) in the frozen state. Processed potatoes include potato chips; potato starch, flakes, granules and pellets; potato flour, meal and powder; and dried potatoes.

22
6.2. Canadian Potato Exports
6.2.1. Fresh 6.2.1.1. Monthly Fresh Potato Exports, Value
Month 2009/10 2010/11 2011/12 2012/13
August 5,282,230 5,350,150 7,618,088 3,951,604
September 6,123,690 7,349,067 10,055,495 4,547,671
October 9,894,004 12,904,608 14,134,234 9,308,538
November 14,933,145 18,056,943 23,952,346 15,026,535
December 13,209,789 17,033,030 16,006,011 10,589,933
January 12,813,365 22,580,950 15,393,576 11,097,799
February 12,919,435 16,470,700 15,356,595 10,191,674
March 15,285,511 21,583,105 16,759,648 16,814,857
April 15,030,990 20,391,471 13,468,826 10,925,578
May 9,536,589 16,958,155 10,320,389 11,418,176
June 9,414,400 14,425,015 5,336,074 7,996,332
July 5,700,207 6,364,462 3,410,627 8,322,281
Total 130,143,355 179,467,656 151,811,909 120,190,978
CAD $
Source: Statistics Canada (CATSNet, January 2014) Note: Does not include seed potatoes.
6.2.1.2. Monthly Fresh Potato Exports, Volume
Month 2009/10 2010/11 2011/12 2012/13
August 13,726 13,255 20,220 9,561
September 13,882 17,792 22,257 12,603
October 23,239 31,173 30,794 23,986
November 37,239 46,528 49,348 38,821
December 36,989 46,760 34,925 28,124
January 36,689 87,974 37,970 33,631
February 37,903 45,217 38,185 28,758
March 44,919 59,793 39,361 46,087
April 47,462 58,335 34,281 33,048
May 30,598 50,320 28,725 38,072
June 30,369 44,896 13,520 20,624
July 15,669 13,956 10,558 18,752
Total 368,684 515,999 360,144 332,067
Tonnes
Source: Statistics Canada (CATSNet, January 2014) Note: Does not include seed potatoes.

23
6.2.1.3. Monthly Fresh Potato Exports, 2009/10 to 2012/13
0
5,000,000
10,000,000
15,000,000
20,000,000
25,000,000
30,000,000
Aug Sep Oct Nov Dec Jan Feb Mar Apr May Jun Jul
Monthly Fresh Potato Exports (CAD $)
2009/10 2010/11 2011/12 2012/13
Source: Statistics Canada (CATSNet, January 2014)
6.2.1.4. Fresh Potato Exports by Province, Value
Province 2009/10 2010/11 2011/12 2012/13
Newfoundland and Labrador 52,498 0 0 0
Prince Edward Island 36,687,624 74,704,186 60,874,580 45,598,948
Nova Scotia 30,108 305,022 44,341 154,528
New Brunswick 34,984,159 51,791,177 35,914,475 27,533,181
Quebec 9,657,239 15,331,814 17,557,207 9,970,225
Ontario 12,987,003 17,330,973 13,763,605 15,704,319
Manitoba 33,855,784 18,755,490 19,522,415 18,108,059
Saskatchewan 663,366 240,439 244,246 36,464
Alberta 359,334 239,801 1,741,436 890,892
British Columbia 866,240 768,754 2,149,604 2,194,362
Canada 130,143,355 179,467,656 151,811,909 120,190,978
CAD $
Source: Statistics Canada (CATSNet, January 2014) Note: Does not include seed potatoes.

24
6.2.1.5. Fresh Potato Exports by Province, Volume
Province 2009/10 2010/11 2011/12 2012/13
Newfoundland and Labrador 206 0 0 0
Prince Edward Island 91,907 209,524 124,635 110,640
Nova Scotia 69 824 76 329
New Brunswick 93,737 133,361 77,404 67,509
Quebec 23,371 37,525 41,534 26,216
Ontario 47,136 71,872 47,561 55,783
Manitoba 105,773 60,201 62,337 62,225
Saskatchewan 1,745 313 419 79
Alberta 878 254 964 4,579
British Columbia 3,862 2,125 5,214 4,707
Canada 368,684 515,999 360,144 332,067
Tonnes
Source: Statistics Canada (CATSNet, January 2014) Note: Does not include seed potatoes.
6.2.1.6. Fresh Potato Exporting Provinces - Percent Share
Prince Edward Island38%
New Brunswick23%
Manitoba15%
Ontario13%
Quebec8%
Others3%
Fresh Potato Exporting Provinces2012/2013 Value
Source: Statistics Canada (CATSNet, January 2014)

25
6.2.1.7. Fresh Potato Export Destinations, Value
Country 2009/10 2010/11 2011/12 2012/13
United States 115,601,479 141,586,586 136,884,641 97,982,988
Indonesia 2,438,062 5,424,215 5,098,656 6,717,130
Trinidad and Tobago 720,065 7,651,695 229,075 5,527,479
Thailand 5,119,450 4,367,218 6,830,420 4,486,483
Barbados 174,493 2,133,315 122,085 1,794,275
Others 6,089,806 18,304,627 2,647,032 3,682,623
Total 130,143,355 179,467,656 151,811,909 120,190,978
CAD $
Source: Statistics Canada (CATSNet, January 2014) Note: Does not include seed potatoes.
6.2.1.8. Fresh Potato Export Destinations, Volume
Country 2009/10 2010/11 2011/12 2012/13
United States 338,214 393,101 329,681 279,269
Indonesia 4,410 11,984 9,289 14,285
Trinidad and Tobago 2,570 21,598 2,610 14,096
Thailand 8,825 10,090 11,119 10,291
Barbados 503 6,848 1,580 5,421
Others 14,162 72,378 5,865 8,705
Total 368,684 515,999 360,144 332,067
Tonnes
Source: Statistics Canada (CATSNet, January 2014) Note: Does not include seed potatoes.

26
6.2.2. Seed 6.2.2.1. Monthly Seed Potato Exports, Value
Month 2009/10 2010/11 2011/12 2012/13
August 0 0 0 10,275
September 0 29,929 0 62,958
October 77,525 3,161,387 418,290 563,860
November 6,352,556 3,193,938 3,309,511 2,451,521
December 5,449,980 3,279,342 3,564,759 3,491,310
January 3,186,616 4,727,100 6,820,741 3,860,322
February 3,964,191 4,029,803 4,999,995 6,314,697
March 8,470,398 7,758,177 6,999,889 5,025,499
April 7,316,030 7,755,882 9,445,888 8,793,466
May 3,531,564 3,952,901 2,854,922 4,011,774
June 233,673 445,002 119,746 111,815
July 4,898 452,692 0 1,215
Total 38,587,431 38,786,153 38,533,741 34,698,712
CAD $
Source: Statistics Canada (CATSNet, January 2014)
6.2.2.2. Monthly Seed Potato Exports, Volume
Month 2009/10 2010/11 2011/12 2012/13
August 0 0 0 19
September 0 35 0 135
October 253 7,811 776 981
November 14,511 7,265 6,209 5,436
December 10,732 6,292 8,578 7,642
January 8,087 12,274 18,280 8,944
February 10,699 10,927 12,101 15,107
March 23,569 21,422 16,318 12,675
April 21,587 23,338 23,379 21,684
May 8,526 10,207 6,883 8,950
June 621 1,230 202 268
July 16 1,107 0 2
Total 98,601 101,908 92,726 81,843
Tonnes
Source: Statistics Canada (CATSNet, January 2014)
27
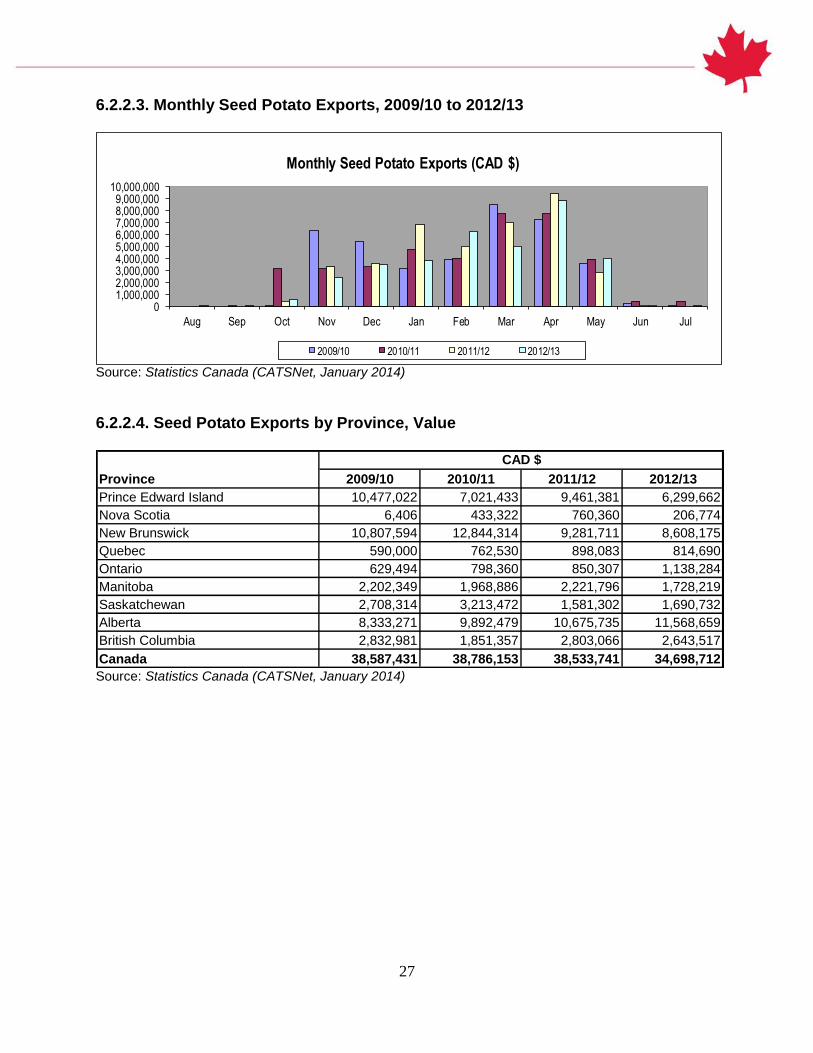
6.2.2.3. Monthly Seed Potato Exports, 2009/10 to 2012/13
01,000,0002,000,0003,000,0004,000,0005,000,0006,000,0007,000,0008,000,0009,000,000
10,000,000
Aug Sep Oct Nov Dec Jan Feb Mar Apr May Jun Jul
Monthly Seed Potato Exports (CAD $)
2009/10 2010/11 2011/12 2012/13
Source: Statistics Canada (CATSNet, January 2014)
6.2.2.4. Seed Potato Exports by Province, Value
Province 2009/10 2010/11 2011/12 2012/13
Prince Edward Island 10,477,022 7,021,433 9,461,381 6,299,662
Nova Scotia 6,406 433,322 760,360 206,774
New Brunswick 10,807,594 12,844,314 9,281,711 8,608,175
Quebec 590,000 762,530 898,083 814,690
Ontario 629,494 798,360 850,307 1,138,284
Manitoba 2,202,349 1,968,886 2,221,796 1,728,219
Saskatchewan 2,708,314 3,213,472 1,581,302 1,690,732
Alberta 8,333,271 9,892,479 10,675,735 11,568,659
British Columbia 2,832,981 1,851,357 2,803,066 2,643,517
Canada 38,587,431 38,786,153 38,533,741 34,698,712
CAD $
Source: Statistics Canada (CATSNet, January 2014)

28
6.2.2.5. Seed Potato Exports by Province, Volume
Province 2009/10 2010/11 2011/12 2012/13
Prince Edward Island 21,732 14,039 20,951 13,265
Nova Scotia 10 702 855 268
New Brunswick 30,662 38,002 25,844 24,700
Quebec 1,285 1,774 1,755 1,770
Ontario 1,366 1,567 1,777 1,959
Manitoba 5,155 5,676 5,027 4,341
Saskatchewan 7,659 9,353 4,214 3,706
Alberta 24,453 26,789 26,494 26,316
British Columbia 6,279 4,006 5,809 5,518
Canada 98,601 101,908 92,726 81,843
Tonnes
Source: Statistics Canada (CATSNet, January 2014) 6.2.2.6. Seed Potato Exporting Provinces – Percent Share
Others6%
Alberta33%
New Brunswick25%
Prince Edward Island18%
British Columbia8%
Manitoba5%
Saskatchewan5%
Seed Potato Exporting Provinces2012/2013 Value
Source: Statistics Canada (CATSNet, January 2014)

29
6.2.2.7. Seed Potato Export Destinations, Value
Country 2009/10 2010/11 2011/12 2012/13
United States 23,080,718 25,892,747 29,399,100 26,623,480
Venezuela 5,579,538 1,704,061 2,813,477 3,987,105
Mexico 2,523,065 2,127,822 2,209,606 1,481,776
Thailand 625,500 735,893 1,194,075 797,339
Uruguay 1,813,729 1,292,758 1,011,834 620,537
Others 4,964,881 7,032,872 1,905,649 1,188,475
Total 38,587,431 38,786,153 38,533,741 34,698,712
CAD $
Source: Statistics Canada (CATSNet, January 2014)
6.2.2.8. Seed Potato Export Destinations, Volume
Country 2009/10 2010/11 2011/12 2012/13
United States 68,657 75,460 74,161 66,293
Venezuela 12,821 3,908 6,402 9,117
Mexico 3,952 3,459 5,214 2,466
Thailand 830 1,162 1,894 1,201
Uruguay 2,806 1,678 1,212 825
Others 9,535 16,241 3,843 1,941
Total 98,601 101,908 92,726 81,843
Tonnes
Source: Statistics Canada (CATSNet, January 2014)

30
6.2.3. Frozen
6.2.3.1. Monthly Frozen Potato Exports, Value
Month 2009/10 2010/11 2011/12 2012/13
August 76,611,774 70,615,014 69,120,176 62,188,482
September 76,455,036 63,365,211 70,527,228 77,231,672
October 75,343,149 65,717,027 75,259,315 81,084,979
November 71,881,841 64,536,100 76,945,244 75,332,532
December 68,901,430 62,160,828 73,241,592 72,166,663
January 67,350,836 64,231,658 73,228,387 72,901,382
February 65,172,673 56,847,696 73,569,214 65,572,631
March 70,506,473 76,467,956 74,731,763 87,161,777
April 68,464,333 65,070,134 71,868,331 82,069,989
May 73,560,345 69,196,788 72,650,384 82,742,889
June 76,862,294 72,143,045 70,635,569 79,659,691
July 76,137,511 67,316,321 61,989,903 81,110,741
Total 867,247,695 797,667,778 863,767,106 919,223,428
CAD $
Source: Statistics Canada (CATSNet, January 2014) 6.2.3.2. Monthly Frozen Potato Exports, Volume
Month 2009/10 2010/11 2011/12 2012/13
August 78,916,475 73,972,747 73,932,627 62,925,547
September 78,624,107 68,854,030 73,574,427 81,397,568
October 78,160,341 72,083,817 78,120,320 82,646,039
November 74,647,442 70,769,784 77,433,086 76,272,611
December 72,087,241 67,277,434 74,674,439 72,658,209
January 71,058,535 70,118,824 74,063,646 74,179,211
February 65,754,926 61,037,814 74,776,393 64,842,341
March 74,461,189 84,828,048 75,827,102 84,543,962
April 72,732,500 73,639,010 73,030,720 81,286,191
May 76,095,182 75,995,877 74,284,098 80,982,367
June 78,928,639 79,362,897 70,425,085 78,409,916
July 79,614,545 75,145,077 61,518,129 79,173,035
Total 901,081,122 873,085,359 881,660,072 919,316,997
Kg
Source: Statistics Canada (CATSNet, January 2014)

31
6.2.3.3. Monthly Frozen Potato Exports, 2009/10 to 2012/13
0
10,000,000
20,000,000
30,000,000
40,000,000
50,000,000
60,000,000
70,000,000
80,000,000
90,000,000
100,000,000
Aug Sep Oct Nov Dec Jan Feb Mar Apr May Jun Jul
Monthly Frozen Potato Exports (CAD $)
2009/10 2010/11 2011/12 2012/13
Source: Statistics Canada (CATSNet, January 2014)
6.2.3.4. Frozen Potato Exports by Province, Value
Province 2009/10 2010/11 2011/12 2012/13
Newfoundland and Labrador 15,644 62,447 7,780 49,804
Prince Edward Island 211,608,503 165,928,801 190,794,590 194,750,921
Nova Scotia 1,466,454 323,657 125,845 629,501
New Brunswick 119,696,453 224,557,139 292,895,685 164,252,043
Quebec 14,743,174 13,040,808 10,847,901 10,567,272
Ontario 3,359,531 1,489,501 2,172,942 2,440,376
Manitoba 318,446,553 214,937,072 171,657,380 343,090,361
Alberta 197,340,902 176,804,315 194,075,839 194,924,598
British Columbia 570,481 524,038 1,189,144 8,518,552
Canada 867,247,695 797,667,778 863,767,106 919,223,428
CAD $
Source: Statistics Canada (CATSNet, January 2014)

32
6.2.3.5. Frozen Potato Exports by Province, Volume
Province 2009/10 2010/11 2011/12 2012/13
Newfoundland and Labrador 11,095 42,528 5,418 40,079
Prince Edward Island 223,485,357 186,078,766 196,714,794 193,266,383
Nova Scotia 1,467,398 249,322 119,823 553,386
New Brunswick 122,969,452 244,202,827 300,672,968 173,361,816
Quebec 11,177,579 14,000,054 10,172,520 10,148,697
Ontario 2,942,086 1,556,908 1,645,802 1,948,283
Manitoba 357,111,589 253,951,586 196,303,061 359,655,512
Alberta 181,441,872 172,735,543 175,287,272 171,790,322
British Columbia 474,694 267,825 738,414 8,552,519
Canada 901,081,122 873,085,359 881,660,072 919,316,997
Kg
Source: Statistics Canada (CATSNet, January 2014)
6.2.3.6. Frozen Potato Exporting Provinces – Percent Share
Manitoba37%
Alberta21%
Prince Edward Island21%
New Brunswick18%
Others3%
Frozen Potato Exporting Provinces2012/2013 Value
Source: Statistics Canada (CATSNet, January 2014)

33
6.2.3.7. Frozen Potato Export Destinations, Value
Country 2009/10 2010/11 2011/12 2012/13
United States 687,544,779 647,347,292 703,343,717 770,945,128
Japan 28,357,865 30,223,448 32,984,107 32,444,167
Mexico 38,376,132 28,332,989 28,313,257 18,801,712
China 3,115,229 5,617,052 4,712,711 10,578,733
Indonesia 4,917,709 4,474,296 7,447,251 9,700,562
Others 104,935,981 81,672,701 86,966,063 76,753,126
Total 867,247,695 797,667,778 863,767,106 919,223,428
CAD $
Source: Statistics Canada (CATSNet, January 2014)
6.2.3.8. Frozen Potato Export Destinations, Volume
Country 2009/10 2010/11 2011/12 2012/13
United States 706,999,971 703,377,071 717,141,582 759,271,797
Japan 27,921,504 32,456,819 32,483,668 37,288,100
Mexico 54,545,515 45,120,352 40,185,174 22,890,118
China 3,282,055 6,915,126 4,690,821 11,124,990
Indonesia 4,908,390 4,469,510 6,801,842 11,068,653
Others 103,423,687 80,746,481 80,356,985 77,673,339
Total 901,081,122 873,085,359 881,660,072 919,316,997
Kg
Source: Statistics Canada (CATSNet, January 2014)

34
6.2.4. Processed
6.2.4.1. Monthly Processed Potato Exports, Value
Month 2009/10 2010/11 2011/12 2012/13
August 7,507,591 9,017,560 6,526,588 5,760,697
September 7,215,605 6,194,776 5,131,354 5,559,475
October 6,201,412 6,607,446 5,833,954 6,470,189
November 7,309,243 7,582,980 6,818,151 5,900,885
December 6,596,650 7,139,288 6,356,878 5,793,230
January 7,202,209 6,919,634 6,816,576 5,911,503
February 7,226,907 6,358,195 6,205,448 5,552,906
March 7,827,310 7,201,778 7,200,816 8,271,610
April 7,466,581 6,764,680 6,903,353 7,636,114
May 8,816,321 7,948,294 8,034,231 7,423,071
June 8,292,230 8,063,459 7,785,442 6,112,745
July 8,507,098 6,139,883 6,075,861 6,614,641
Total 90,169,157 85,937,973 79,688,652 77,007,066
CAD $
Source: Statistics Canada (CATSNet, January 2014)
6.2.4.2. Monthly Processed Potato Exports, Volume
Month 2009/10 2010/11 2011/12 2012/13
August 4,067,200 5,194,117 4,221,907 3,093,878
September 4,174,971 3,739,280 3,485,252 3,281,428
October 3,658,548 4,103,917 4,061,006 4,062,639
November 4,149,375 5,001,619 4,355,139 3,144,802
December 3,478,363 4,294,088 4,413,626 3,579,106
January 3,865,472 3,892,255 4,357,003 3,440,386
February 4,359,638 4,125,211 4,350,267 3,239,515
March 4,518,471 4,975,525 4,554,908 4,633,048
April 4,313,428 4,325,258 4,114,171 4,424,979
May 4,484,433 4,892,062 4,573,668 4,013,274
June 4,674,019 4,927,482 4,455,330 3,542,234
July 5,046,176 4,561,187 3,604,583 3,775,823
Total 50,790,094 54,032,001 50,546,860 44,231,112
Kg
Source: Statistics Canada (CATSNet, January 2014)

35
6.2.4.3. Monthly Processed Potato Exports, 2009/10 to 2012/13
0
20,000,000
40,000,000
60,000,000
80,000,000
100,000,000
120,000,000
Aug Sep Oct Nov Dec Jan Feb Mar Apr May Jun Jul
Monthly Processed Potato Exports (CAD $)
2009/10 2010/11 2011/12 2012/13
Source: Statistics Canada (CATSNet, January 2014)
6.2.4.4. Processed Potato Exports by Province, Value
Province 2009/10 2010/11 2011/12 2012/13
Newfoundland and Labrador 698 4,451 30,003 0
Prince Edward Island 12,682,706 14,872,267 19,399,187 12,302,664
Nova Scotia 3,921,523 3,638,589 506,927 366,089
New Brunswick 10,931,343 17,121,432 15,222,877 12,551,503
Quebec 1,298,808 1,247,623 1,143,327 1,268,281
Ontario 41,098,858 32,874,259 31,854,104 35,568,148
Manitoba 1,432,106 1,760,427 955,537 1,910,119
Saskatchewan 61,932 337 462 96
Alberta 18,733,455 14,392,923 10,517,284 12,782,114
British Columbia 7,728 25,665 53,587 255,045
Canada 90,169,157 85,937,973 79,688,652 77,007,066
CAD $
Source: Statistics Canada (CATSNet, January 2014)

36
6.2.4.5. Processed Potato Exports by Province, Volume
Province 2009/10 2010/11 2011/12 2012/13
Newfoundland and Labrador 128 1,078 20,090 0
Prince Edward Island 11,826,390 13,429,997 15,050,210 10,166,020
Nova Scotia 1,143,789 1,233,774 584,796 488,067
New Brunswick 8,063,505 13,431,107 11,229,955 9,045,899
Quebec 1,618,844 2,213,960 1,659,137 1,833,874
Ontario 13,621,354 11,020,606 10,051,520 10,499,913
Manitoba 1,478,144 1,353,612 652,775 1,451,139
Saskatchewan 58,540 69 88 19
Alberta 12,977,530 11,337,788 11,288,345 10,722,982
British Columbia 1,870 10,010 8,701 22,609
Canada 50,790,094 54,032,001 50,546,860 44,231,112
Kg
Source: Statistics Canada (CATSNet, January 2014)
6.2.4.6. Processed Potato Export Destinations, Value
Country 2009/10 2010/11 2011/12 2012/13
United States 84,984,375 79,696,999 72,107,677 69,035,869
Japan 0 0 351,474 1,648,649
Chile 162,641 233,514 880,064 1,631,754
Belgium 946,023 1,326,385 1,244,387 1,566,317
Nigeria 0 449,646 681,336 921,938
Others 4,076,118 4,231,429 4,423,714 2,202,539
Total 90,169,157 85,937,973 79,688,652 77,007,066
CAD $
Source: Statistics Canada (CATSNet, January 2014)
6.2.4.7. Processed Potato Export Destinations, Volume
Country 2009/10 2010/11 2011/12 2012/13
United States 48,433,783 51,018,869 47,543,572 41,588,892
Japan 0 0 95,250 441,859
Chile 112,038 60,806 228,158 581,505
Belgium 222,971 315,596 385,142 525,617
Nigeria 0 260,368 373,750 534,000
Others 2,021,302 2,376,362 1,920,988 559,239
Total 50,790,094 54,032,001 50,546,860 44,231,112
Kg
Source: Statistics Canada (CATSNet, January 2014)

37
6.3. Canadian Potato Imports
6.3.1. Fresh
6.3.1.1. Monthly Fresh Potato Imports, Value
Month 2009/10 2010/11 2011/12 2012/13
August 7,262,245 7,556,157 12,876,641 10,010,652
September 4,015,874 4,669,155 5,843,217 3,570,978
October 3,088,822 5,109,859 5,025,645 4,131,708
November 3,823,406 5,032,673 5,210,635 4,155,548
December 4,728,225 7,004,165 5,938,117 4,393,859
January 4,059,981 5,219,735 4,802,694 4,176,351
February 4,473,514 6,068,510 5,147,815 4,981,551
March 5,575,188 8,668,797 6,049,746 6,461,447
April 6,185,124 10,537,244 7,602,478 8,449,445
May 11,337,490 15,790,667 13,699,155 12,963,666
June 13,152,063 18,981,381 15,160,335 17,518,196
July 14,269,697 18,534,993 15,613,860 18,355,853
Total 81,971,629 113,173,336 102,970,338 99,169,254
CAD $
Source: Statistics Canada (CATSNet, January 2014) Note: Does not include seed potatoes.
6.3.1.2. Monthly Fresh Potato Imports, Volume
Month 2009/10 2010/11 2011/12 2012/13
August 20,645 19,332 30,062 32,095
September 13,968 11,242 12,112 10,950
October 9,529 13,523 9,429 77,322
November 10,382 11,928 9,152 17,359
December 12,834 14,532 10,819 11,603
January 11,375 9,553 9,622 10,662
February 11,402 10,375 9,555 11,115
March 12,245 16,920 11,464 14,710
April 14,537 20,811 15,318 20,451
May 26,853 37,734 28,454 26,366
June 31,916 41,030 31,837 34,937
July 36,681 39,729 47,982 84,788
Total 212,367 246,709 225,806 352,358
Tonnes
Source: Statistics Canada (CATSNet, January 2014) Note: Does not include seed potatoes.

38
6.3.1.3. Monthly Fresh Potato Imports, 2009/10 to 2012/13
0
2,000,000
4,000,000
6,000,000
8,000,000
10,000,000
12,000,000
14,000,000
16,000,000
18,000,000
20,000,000
Aug Sep Oct Nov Dec Jan Feb Mar Apr May Jun Jul
Monthly Fresh Potato Imports (CAD $)
2009/10 2010/11 2011/12 2012/13
Source: Statistics Canada (CATSNet, January 2014) Note: Does not include seed potatoes.
6.3.1.4. Fresh Potato Imports by Province, Value
Province 2009/10 2010/11 2011/12 2012/13
Nova Scotia 0 94 735,233 1,167,839
New Brunswick 4,321,622 4,602,381 4,647,221 10,534,821
Quebec 2,691,969 2,165,275 2,626,779 2,189,329
Ontario 32,362,023 35,819,129 33,505,419 33,902,621
Manitoba 1,930,572 2,663,415 3,039,911 3,443,149
Saskatchewan 425,790 585,019 809,444 745,018
Alberta 7,594,125 8,683,082 8,544,204 8,986,480
British Columbia 32,645,528 58,654,941 49,062,127 38,199,997
Canada 81,971,629 113,173,336 102,970,338 99,169,254
CAD $
Source: Statistics Canada (CATSNet, January 2014) Note: Does not include seed potatoes.
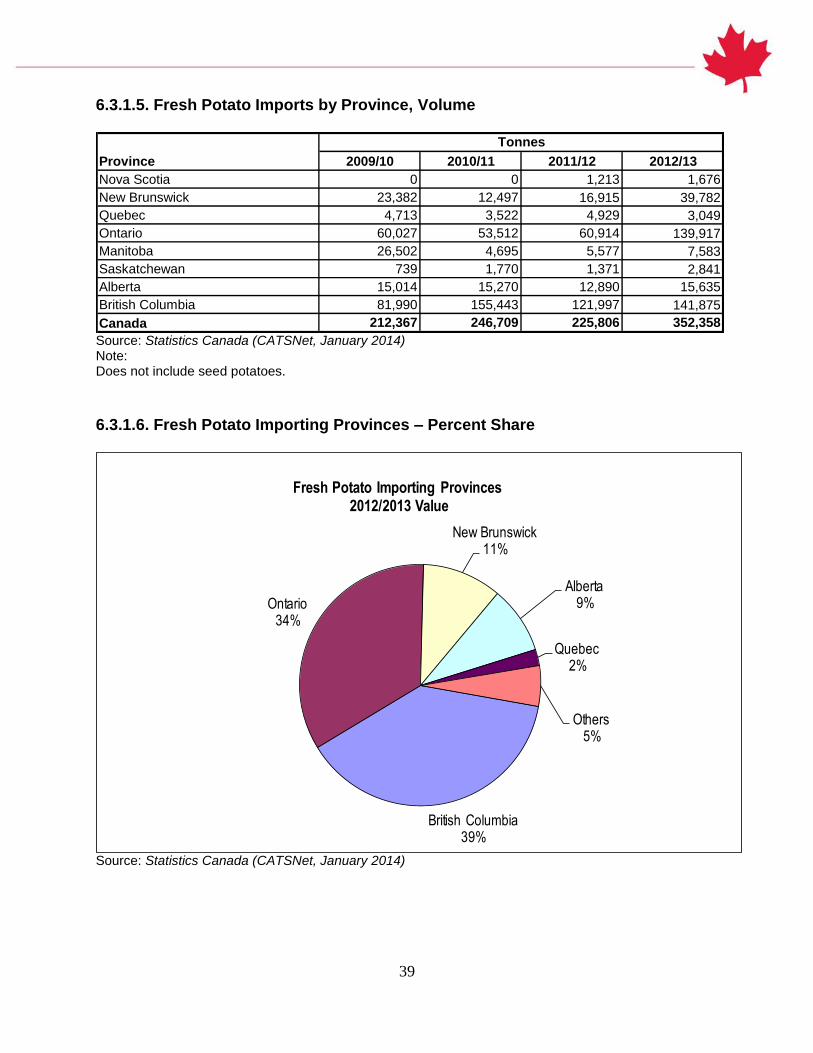
39
6.3.1.5. Fresh Potato Imports by Province, Volume
Province 2009/10 2010/11 2011/12 2012/13
Nova Scotia 0 0 1,213 1,676
New Brunswick 23,382 12,497 16,915 39,782
Quebec 4,713 3,522 4,929 3,049
Ontario 60,027 53,512 60,914 139,917
Manitoba 26,502 4,695 5,577 7,583
Saskatchewan 739 1,770 1,371 2,841
Alberta 15,014 15,270 12,890 15,635
British Columbia 81,990 155,443 121,997 141,875
Canada 212,367 246,709 225,806 352,358
Tonnes
Source: Statistics Canada (CATSNet, January 2014) Note: Does not include seed potatoes.
6.3.1.6. Fresh Potato Importing Provinces – Percent Share
British Columbia39%
Ontario34%
New Brunswick11%
Alberta9%
Quebec2%
Others5%
Fresh Potato Importing Provinces2012/2013 Value
Source: Statistics Canada (CATSNet, January 2014)

40
6.3.1.7. Fresh Potato Imports by Country of Origin, Value
Country 2009/10 2010/11 2011/12 2012/13
United States 81,884,894 113,109,761 102,848,578 99,118,117
Guatemala 286 0 2,650 1,515
France 80 0 0 678
United Kingdom 0 0 189 25
Chile 0 906 650 0
Others 86,369 62,669 118,271 48,919
Total 81,971,629 113,173,336 102,970,338 99,169,254
CAD $
Source: Statistics Canada (CATSNet, January 2014) Note: Does not include seed potatoes.
6.3.1.8. Fresh Potato Imports by Country of Origin, Volume
Country 2009/10 2010/11 2011/12 2012/13
United States 212,193 246,589 225,585 352,266
Guatemala 1 0 5 4
France 0 0 0 1
United Kingdom 0 0 0 1
Chile 0 2 1 0
Others 173 118 215 86
Total 212,367 246,709 225,806 352,358
Tonnes
Source: Statistics Canada (CATSNet, January 2014) Note: Does not include seed potatoes.

41
6.3.2. Seed
6.3.2.1. Monthly Seed Potato Imports, Value
Month 2009/10 2010/11 2011/12 2012/13
August 0 0 0 0
September 1,150 0 43,354 0
October 98,075 0 0 176,764
November 430,244 479,647 511,991 409,274
December 0 0 0 0
January 0 302 0 591
February 51,134 459 70,766 28,698
March 588,060 508,956 729,296 352,582
April 1,137,405 1,419,613 1,559,509 1,079,240
May 774,693 1,145,813 1,151,815 1,697,503
June 63,438 117,343 0 22,997
July 0 13,524 15,185 5
Total 3,144,199 3,685,657 4,081,916 3,767,654
CAD $
Source: Statistics Canada (CATSNet, January 2014)
6.3.2.2. Monthly Seed Potato Imports, Volume
Month 2009/10 2010/11 2011/12 2012/13
August 0 0 0 0
September 2 0 114 0
October 342 0 0 400
November 1,500 1,658 1,518 1,292
December 0 0 0 0
January 0 2 0 2
February 182 2 210 72
March 2,197 2,196 2,498 1,297
April 5,626 5,147 5,553 3,954
May 2,381 6,916 3,404 5,189
June 225 2,706 0 81
July 0 49 20 0
Total 12,455 18,676 13,317 12,287
Tonnes
Source: Statistics Canada (CATSNet, January 2014)

42
6.3.2.3. Monthly Seed Potato Imports, 2009/10 to 2012/13
0
200,000
400,000
600,000
800,000
1,000,000
1,200,000
1,400,000
1,600,000
1,800,000
Aug Sep Oct Nov Dec Jan Feb Mar Apr May Jun Jul
Monthly Seed Potato Imports (CAD $)
2009/10 2010/11 2011/12 2012/13
Source: Statistics Canada (CATSNet, January 2014)
6.3.2.4. Seed Potato Imports by Province, Value
Province 2009/10 2010/11 2011/12 2012/13
New Brunswick 1,237,951 1,302,658 906,195 1,289,347
Quebec 11,102 25,212 80,016 56,899
Ontario 365,025 300,312 1,218,484 442,164
Manitoba 1,109,144 1,580,126 1,438,643 1,738,248
Saskatchewan 260,807 188,341 68,173 33,689
Alberta 160,170 137,827 351,539 107,894
British Columbia 0 151,181 18,866 99,413
Canada 3,144,199 3,685,657 4,081,916 3,767,654
CAD $
Source: Statistics Canada (CATSNet, January 2014)

43
6.3.2.5. Seed Potato Imports by Province, Volume
Province 2009/10 2010/11 2011/12 2012/13
New Brunswick 4,549 4,911 2,576 4,792
Quebec 20 50 183 106
Ontario 1,421 1,558 4,947 1,489
Manitoba 5,209 10,785 4,437 5,165
Saskatchewan 831 626 259 119
Alberta 425 397 858 324
British Columbia 0 349 57 292
Canada 12,455 18,676 13,317 12,287
Tonnes
Source: Statistics Canada (CATSNet, January 2014)
6.3.2.6. Seed Potato Importing Provinces – Percent Share
Manitoba46%
New Brunswick34%
Ontario12%
Alberta3%
Others5%
Seed Potato Importing Provinces2012/2013 Value
Source: Statistics Canada (CATSNet, January 2014)

44
6.3.2.7. Seed Potato Imports by Country of Origin, Value
Country 2009/10 2010/11 2011/12 2012/13
United States 3,138,127 3,685,503 4,069,809 3,766,782
Others 6,072 154 12,107 872
Total 3,144,199 3,685,657 4,081,916 3,767,654
CAD $
Source: Statistics Canada (CATSNet, January 2014)
6.3.2.8. Seed Potato Imports by Country of Origin, Volume
Country 2009/10 2010/11 2011/12 2012/13
United States 12,434 18,675 13,285 12,285
Others 21 1 32 2
Total 12,455 18,676 13,317 12,287
Tonnes
Source: Statistics Canada (CATSNet, January 2014)

45
6.3.3. Frozen
6.3.3.1. Monthly Frozen Potato Imports, Value
Month 2009/10 2010/11 2011/12 2012/13
August 9,047,029 12,378,945 8,645,962 9,247,489
September 7,685,934 10,837,706 8,117,867 7,755,792
October 8,264,503 8,357,734 8,762,049 8,659,381
November 7,554,770 8,660,251 8,117,027 8,130,015
December 8,811,246 10,060,585 9,080,572 7,568,979
January 8,001,297 9,056,801 8,013,532 8,295,610
February 7,873,030 7,913,520 7,076,831 7,478,827
March 8,606,811 9,386,526 7,816,579 9,141,713
April 8,733,843 8,718,658 7,782,892 8,827,445
May 7,750,248 7,828,750 8,517,234 8,276,599
June 9,900,728 8,427,162 7,351,459 7,373,582
July 10,986,188 7,232,992 7,939,276 6,783,293
Total 103,215,627 108,859,630 97,221,280 97,538,725
CAD $
Source: Statistics Canada (CATSNet, January 2014)
6.3.3.2. Monthly Frozen Potato Imports, Volume
Month 2009/10 2010/11 2011/12 2012/13
August 5,540,505 9,318,115 5,349,593 5,776,888
September 4,708,883 8,148,628 4,949,443 4,776,690
October 5,101,564 5,471,517 5,579,449 4,921,048
November 5,440,759 6,209,744 5,534,880 4,828,411
December 6,533,272 7,306,506 5,937,100 4,613,843
January 5,347,769 6,142,229 5,242,765 5,046,102
February 5,342,363 5,920,401 4,573,245 4,242,343
March 5,888,333 7,223,773 4,742,113 5,563,670
April 6,183,840 6,195,863 4,895,217 5,596,821
May 4,914,065 5,121,768 5,316,575 5,068,245
June 6,572,513 4,968,006 4,381,269 4,549,092
July 8,230,810 4,488,733 4,653,619 3,459,440
Total 69,804,676 76,515,283 61,155,268 58,442,593
Kg
Source: Statistics Canada (CATSNet, January 2014)

46
6.3.3.3. Monthly Frozen Potato Imports, 2009/10 to 2012/13
0
2,000,000
4,000,000
6,000,000
8,000,000
10,000,000
12,000,000
14,000,000
Monthly Frozen Potato Imports (CAD $)
2009/10 2010/11 2011/12 2012/13
Source: Statistics Canada (CATSNet, January 2014)
6.3.3.4. Frozen Potato Imports by Province, Value
Province 2009/10 2010/11 2011/12 2012/13
Prince Edward Island 88 0 0 0
Nova Scotia 2,120 1,040 0 485
New Brunswick 27,235,869 34,503,563 20,769,471 19,864,652
Quebec 1,155,181 1,503,795 953,923 1,138,641
Ontario 30,737,048 25,631,123 34,410,224 37,433,081
Manitoba 4,663,535 3,123,849 3,357,808 3,334,517
Saskatchewan 871,753 1,209,640 1,478,052 865,424
Alberta 5,654,960 6,761,647 5,851,424 5,512,919
British Columbia 32,895,073 36,124,973 30,400,378 29,389,006
Canada 103,215,627 108,859,630 97,221,280 97,538,725
CAD $
Source: Statistics Canada (CATSNet, January 2014)

47
6.3.3.5. Frozen Potato Imports by Province, Volume
Province 2009/10 2010/11 2011/12 2012/13
Prince Edward Island 93 0 0 0
Nova Scotia 1,592 620 0 557
New Brunswick 28,749,890 37,044,946 21,474,595 19,407,409
Quebec 470,213 583,334 423,370 594,732
Ontario 16,714,079 13,770,874 17,381,311 17,994,466
Manitoba 3,949,601 2,605,344 2,371,036 2,672,015
Saskatchewan 809,582 963,044 1,366,056 720,468
Alberta 3,211,643 3,444,380 2,814,655 2,409,533
British Columbia 15,897,983 18,102,741 15,324,245 14,643,413
Canada 69,804,676 76,515,283 61,155,268 58,442,593
Kg
Source: Statistics Canada (CATSNet, January 2014)
6.3.3.6. Frozen Potato Imports by Country of Origin, Value
Country 2009/10 2010/11 2011/12 2012/13
United States 78,853,684 77,299,274 79,000,688 81,994,702
Belgium 717,511 1,167,041 534,174 631,119
France 138,659 135,288 354,628 208,713
Italy 0 105,873 127,780 58,723
Netherlands 4,555 133,316 237,423 55,367
Others 23,501,218 30,018,838 16,966,587 14,590,101
Total 103,215,627 108,859,630 97,221,280 97,538,725
CAD $
Source: Statistics Canada (CATSNet, January 2014)
6.3.3.7. Frozen Potato Imports by Country of Origin, Volume
Country 2009/10 2010/11 2011/12 2012/13
United States 44,219,753 42,857,597 41,861,079 42,930,277
Belgium 287,467 453,138 207,025 285,941
France 34,986 42,837 102,153 76,003
Italy 0 46,550 60,008 27,327
Netherlands 3,709 59,794 121,046 33,968
Others 25,258,761 33,055,367 18,803,957 15,089,077
Total 69,804,676 76,515,283 61,155,268 58,442,593
Kg
Source: Statistics Canada (CATSNet, January 2014)

48
6.3.4. Processed
6.3.4.1. Monthly Processed Potato Imports, Value
Month 2009/10 2010/11 2011/12 2012/13
August 11,595,956 11,730,153 14,304,804 15,415,538
September 10,417,636 10,476,796 11,949,008 13,578,207
October 10,628,259 11,012,211 12,523,437 11,124,885
November 9,814,862 9,633,893 11,074,033 11,458,298
December 11,147,870 11,607,247 12,661,929 11,809,128
January 9,826,624 9,630,857 11,560,785 9,440,098
February 8,594,926 10,059,541 11,237,798 9,791,397
March 9,204,820 12,522,188 13,328,719 11,627,117
April 10,486,208 12,522,307 13,188,121 11,770,744
May 11,908,038 13,383,192 16,101,278 14,395,993
June 12,386,428 14,980,455 15,593,503 14,174,828
July 12,466,611 13,004,835 16,518,634 15,014,878
Total 128,478,238 140,563,675 160,042,049 149,601,111
CAD $
Source: Statistics Canada (CATSNet, January 2014)
6.3.4.2. Monthly Processed Potato Imports, Volume
Month 2009/10 2010/11 2011/12 2012/13
August 4,171,984 4,482,827 6,596,261 5,833,403
September 3,781,143 3,947,967 4,052,327 4,398,381
October 3,926,727 4,031,706 4,117,753 3,615,842
November 3,865,832 4,093,691 3,634,176 3,754,703
December 3,886,894 3,945,556 4,170,701 3,890,871
January 3,776,469 3,192,032 4,025,681 3,051,664
February 3,600,488 3,740,103 3,969,618 3,158,937
March 3,894,962 4,434,015 5,017,689 4,147,896
April 4,183,097 4,430,426 4,956,141 3,987,452
May 4,588,654 4,724,100 6,035,638 5,168,110
June 4,473,001 5,239,321 5,574,244 4,469,191
July 4,820,469 4,599,556 6,416,046 5,041,541
Total 48,969,720 50,861,300 58,566,275 50,517,991
Kg
Source: Statistics Canada (CATSNet, January 2014)

49
6.3.4.3. Processed Potato Imports by Province, Value
Province 2009/10 2010/11 2011/12 2012/13
Newfoundland and Labrador 0 0 1,174 2,732
Prince Edward Island 0 0 0 3,339
Nova Scotia 29,222 24,869 3,153,346 787,893
New Brunswick 1,053,513 1,349,600 734,796 583,714
Quebec 5,574,793 5,732,864 6,646,554 6,698,248
Ontario 68,649,012 72,635,375 85,672,566 83,456,505
Manitoba 11,286,027 15,333,397 13,208,274 9,670,479
Saskatchewan 3,791,489 3,003,193 3,149,813 2,638,011
Alberta 5,585,756 7,157,430 9,750,737 6,899,701
British Columbia 32,508,426 35,326,947 37,724,789 38,860,489
Canada 128,478,238 140,563,675 160,042,049 149,601,111
CAD $
Source: Statistics Canada (CATSNet, January 2014)
6.3.4.4. Processed Potato Imports by Province, Volume
Province 2009/10 2010/11 2011/12 2012/13
Newfoundland and Labrador 0 0 117 258
Prince Edward Island 0 0 0 1,660
Nova Scotia 4,128 2,912 2,336,439 600,876
New Brunswick 646,177 1,008,767 363,530 335,659
Quebec 2,358,986 2,300,141 2,425,485 2,269,597
Ontario 24,518,732 25,186,504 30,063,504 26,901,170
Manitoba 3,542,313 4,728,952 3,785,860 2,812,145
Saskatchewan 3,496,224 1,531,465 1,294,621 1,182,704
Alberta 1,776,060 2,812,082 3,941,040 1,961,871
British Columbia 12,627,100 13,290,477 14,355,679 14,452,051
Canada 48,969,720 50,861,300 58,566,275 50,517,991
Kg
Source: Statistics Canada (CATSNet, January 2014)

50
6.3.4.5. Processed Potato Imports by Country of Origin, Value
Country 2009/10 2010/11 2011/12 2012/13
United States 118,929,224 130,139,542 142,118,449 132,267,278
Mexico 4,031,643 3,934,409 3,996,608 5,677,080
Netherlands 1,868,779 2,610,940 4,669,326 3,084,089
Denmark 932,299 775,936 885,033 2,148,541
United Kingdom 94,155 105,799 904,942 1,780,004
Others 2,622,138 2,997,049 7,467,691 4,644,119
Total 128,478,238 140,563,675 160,042,049 149,601,111
CAD $
Source: Statistics Canada (CATSNet, January 2014)
6.3.4.6. Processed Potato Imports by Country of Origin, Volume
Country 2009/10 2010/11 2011/12 2012/13
United States 41,706,421 43,790,245 47,939,926 40,736,944
Mexico 970,813 1,037,245 1,020,134 1,449,696
Netherlands 2,807,705 2,620,604 3,807,759 3,200,767
Denmark 1,520,039 1,041,715 866,544 2,048,639
United Kingdom 12,043 12,566 132,101 241,400
Others 1,952,699 2,358,925 4,799,811 2,840,545
Total 48,969,720 50,861,300 58,566,275 50,517,991
Kg
Source: Statistics Canada (CATSNet, January 2014)

51
7. U.S. Production
7.1. U.S. National Statistics for Potatoes
2009 2010 2011 2012 2013
Harvested Area (Acres) 1,044,000 1,008,000 1,077,000 1,131,900 1,052,000
Planted Area (Acres) 1,071,200 1,025,700 1,099,200 1,148,400 1,066,500
Production, Measured In US$
('000) 3,557,574 3,721,501 4,040,568 3,993,815 4,282,467
Production, Measured In CWT
('000) 432,601 404,273 429,647 462,766 437,483
Price Received, Measured In
US$/CWT 8.22 9.21 9.40 8.63 9.79
Yield, Measured In CWT / ACRE 414 401 399 409 416 Source: United States Department of Agriculture, National Agricultural Statistics Service - http://www.nass.usda.gov/ Note: CWT: Hundredweight (short, US).

52
8. World Production
8.1. World Potato Production
Country 2008 2009 2010 2011 2012 % Change 2012/11
China 70,840 73,282 81,594 88,350 85,920 -3%
India 34,658 34,391 36,577 42,339 45,000 6%
Russian Federation 28,846 31,134 21,141 32,681 29,533 -10%
Ukraine 19,545 19,666 18,705 24,248 23,250 -4%
United States of America 18,827 19,622 18,338 19,488 19,166 -2%
Germany 11,369 11,618 10,202 11,800 10,666 -10%
Bangladesh 6,648 5,268 7,930 8,326 9,740 17%
Poland 10,462 9,703 8,766 8,197 9,092 11%
Belarus 8,749 7,125 7,831 7,148 6,911 -3%
Netherlands 6,923 7,181 6,844 7,333 6,766 -8%
France 6,872 7,021 6,622 7,440 6,341 -15%
Kenya 2,900 2,299 2,726 2,365 5,600 137%
Turkey 4,197 4,398 4,548 4,613 4,822 5%
Iran (Islamic Republic of) 4,707 4,108 4,274 4,500 4,650 3%
Canada 4,724 4,581 4,422 4,168 4,590 10%
United Kingdom 5,999 6,396 6,056 6,115 4,553 -26%
Egypt 3,567 3,659 3,643 4,338 4,500 4%
Peru 3,597 3,765 3,814 4,072 4,474 10%
Algeria 2,171 2,636 3,300 3,862 4,219 9%
Pakistan 2,539 2,941 3,142 3,492 4,104 18%
Brazil 3,677 3,444 3,548 3,917 3,496 -11%
Malawi 2,994 3,428 3,674 3,124 3,256 4%
Kazakhstan 2,354 2,756 2,555 3,076 3,126 2%
Belgium 2,943 3,296 3,456 4,129 2,930 -29%
Nepal 2,055 2,424 2,518 2,508 2,584 3%
Other Countries 57,760 58,192 57,522 61,526 59,086 -4%
World Total 329,922 334,333 333,746 373,158 368,374 -1%
Thousands Tonnes
Source: Food and Agriculture Organization (FAO) of the United Nations | © FAO Statistics Division 2013 -31 January 2014 Notes: The figures for Canada in this table may differ slightly from the data provided by Statistics Canada as the latter are revised one year after the release. Includes seed potatoes.

53
9. World Trade
9.1. Top 20 Importers of Fresh Potatoes Worldwide
2008 2009 2010 2011 2012
Belgium 257,472 274,623 258,383 305,971 290,249
Netherlands 257,122 191,954 217,764 302,138 272,431
Russia 212,418 150,759 251,253 666,684 208,358
Germany 263,827 241,229 230,050 238,066 204,622
United Kingdom 234,124 143,548 111,569 125,659 185,580
Spain 244,996 184,379 203,022 204,660 172,261
Italy 171,565 176,119 205,672 202,459 164,108
United States 166,938 140,314 114,344 149,372 106,393
France 140,486 88,073 93,839 89,440 95,516
Canada 95,110 95,144 88,425 118,694 94,339
Malaysia 34,362 46,348 54,194 70,998 73,207
Portugal 88,359 76,972 88,318 100,680 66,367
Greece 66,263 74,536 50,787 81,339 46,042
Norway 38,853 20,048 28,313 31,752 41,409
Mexico 38,042 37,721 38,892 45,367 38,516
Ireland 37,811 33,077 32,503 33,548 37,356
Denmark 38,693 26,222 28,674 33,446 36,878
Poland 37,923 41,270 57,430 91,676 31,911
Indonesia 3,063 7,459 15,030 46,079 28,652
Sri Lanka 25,081 25,997 37,976 35,194 22,837
Others 293,424 307,433 325,006 443,067 290,836
Total 2,745,933 2,383,226 2,531,444 3,416,291 2,507,867
Country
Value (CAD $ '000)
Source: Global Trade Atlas (March 2014) Note: Does not include seed potatoes.

54
9.2. Top 20 Exporters of Fresh Potatoes Worldwide
2008 2009 2010 2011 2012
France 512,766 477,417 568,291 602,191 448,496
Germany 271,940 282,142 293,938 343,198 294,125
Netherlands 246,741 267,233 330,759 435,069 252,374
United States 164,948 156,561 160,418 208,904 196,546
Belgium 136,599 147,520 135,161 154,473 142,860
China 86,730 124,530 106,233 168,042 131,259
Canada 191,494 157,524 141,400 190,540 123,538
United Kingdom 89,586 84,918 103,335 112,266 88,833
Spain 147,140 122,295 97,352 96,536 88,071
Italy 131,448 93,144 98,432 85,214 64,853
Denmark 49,450 33,839 32,775 44,140 42,818
Cyprus 72,819 60,278 44,382 70,592 40,222
India 26,304 16,002 27,743 35,469 24,945
Australia 6,126 9,748 17,328 22,756 24,856
South Africa 8,096 10,559 14,972 16,569 20,439
Portugal 26,743 23,569 18,961 15,864 20,098
Austria 24,202 22,937 22,789 27,083 18,612
Czech Republic 10,980 13,054 17,020 20,776 14,933
New Zealand 13,003 11,093 12,462 14,983 11,194
Turkey 9,044 6,638 9,983 17,015 10,476
Others 114,534 117,420 127,492 169,386 95,216
Total 2,340,693 2,238,421 2,381,230 2,851,069 2,154,763
Country
Value (CAD $ '000)
Source: Global Trade Atlas (March 2014) Note: Does not include seed potatoes.

55
9.3. Top 20 Importers of Seed Potatoes Worldwide
2008 2009 2010 2011 2012
Algeria 104,453 97,460 77,639 81,543 107,064
Belgium 43,487 47,663 43,182 50,443 51,196
Spain 59,676 49,166 52,786 52,392 41,576
Germany 42,854 50,516 39,396 45,793 36,653
Italy 53,153 43,807 35,930 42,816 35,398
Portugal 35,759 30,763 24,198 32,522 28,315
United States 13,791 23,684 21,370 25,083 27,164
Morocco 30,538 29,211 21,601 32,092 26,879
Netherlands 21,877 19,644 20,049 23,636 24,333
France 32,163 29,281 17,571 19,988 20,605
Russia 19,183 12,760 18,828 36,417 18,523
United Kingdom 11,675 8,311 10,309 19,554 16,273
Greece 26,008 37,386 20,402 25,158 15,088
Turkey 11,777 8,413 16,354 17,978 14,712
Poland 7,786 8,482 8,574 11,078 7,030
Denmark 7,056 7,719 5,501 8,142 6,263
Croatia 7,689 6,362 5,556 6,522 6,123
Venezuela 5,542 7,495 4,727 6,520 5,457
Cyprus 6,686 5,549 5,978 5,204 5,115
Austria 9,526 7,475 4,466 5,764 5,020
Others 88,016 81,095 76,679 85,251 63,565
Total 638,695 612,245 531,095 633,894 562,352
Country
Value (CAD $ '000)
Source: Global Trade Atlas (March 2014)

56
9.4. Top 20 Exporters of Seed Potatoes Worldwide
2008 2009 2010 2011 2012
Netherlands 483,753 498,184 482,965 553,635 459,570
United Kingdom 67,169 59,000 59,525 77,863 97,674
France 82,892 76,540 74,128 77,503 69,920
Germany 41,475 41,229 39,545 56,671 41,262
Canada 27,935 41,200 36,372 36,422 37,821
Denmark 39,426 36,604 40,126 42,481 28,256
Belgium 27,863 25,762 20,687 24,730 20,091
Spain 3,816 1,605 1,608 2,531 14,480
United States 7,303 13,513 10,579 9,851 8,512
Portugal 5,297 5,865 3,857 5,652 4,909
Australia 4,890 8,973 4,978 4,469 4,714
Luxembourg 4,837 7,814 2,991 3,839 3,545
South Africa 1,586 1,855 1,217 3,077 3,318
Finland 3,346 2,541 2,753 2,833 2,956
Czech Republic 2,563 3,199 2,501 3,319 2,788
Austria 1,981 2,009 1,495 1,768 1,959
Cyprus 411 526 689 1,370 1,371
Argentina 240 439 602 2,174 1,273
China 522 457 1,125 1,700 1,064
Poland 1,602 1,027 709 824 928
Others 9,587 7,510 8,027 7,353 4,206
Total 818,493 835,852 796,480 920,064 810,618
Country
Value (CAD $ '000)
Source: Global Trade Atlas (March 2014)

57
10. Key Resources Agriculture and Agri-Food Canada, Infohort BC Vegetable Marketing Commission Canadian Food Inspection Agency, Potatoes Section Fédération des producteurs de pommes de terre du Québec Food and Agriculture Organization of the United Nations, Statistics Division Global Trade Atlas Keystone Potato Producers Association Inc. Ontario Potato Board Potato Growers of Alberta Potatoes New Brunswick Prince Edward Island Potato Board Saskatchewan Department of Agriculture Statistics Canada. 2011 Census of Agriculture Statistics Canada. CANSIM Table 001-0014 Statistics Canada. CANSIM Table 002-0001 Statistics Canada. CANSIM Table 002-0011 Statistics Canada. CATSNET United States Department of Agriculture, National Agricultural Statistics Service
Import and export data is based on the following Harmonized System Codes (H.S. Codes): Fresh Potato Export HS Codes: 07019000 Seed Potato Export HS Codes: 07011000 Frozen Potato Export HS Codes: 07101000, 20041000 Processed Export HS Codes: 07121000, 11051000, 11052000, 11081300, 20052000 Fresh Potato Import HS Codes: 0701900010, 0701900020 Seed Potato Import HS Codes: 0701100000 Frozen Potato Import HS Codes: 0710100000, 2004100000 Processed Import HS Codes: 0712909010, 1105100000, 1105200000, 1108130010, 1108130020, 2005200010, 2005200020, 2005200090