21st Annual BMO Capital Markets Global Metals & Mining Conference
Upload
potashcorpCategory
view
451download
1
PotashCorp.com
BMO Farm to Market Conference
May 21, 2015
Jochen Tilk
President and CEO
This presentation, including the documents incorporated by reference, contains “forward-looking statements" (within the meaning of the US
Private Securities Litigation Reform Act of 1995) or “forward-looking information” (within the meaning of appropriate Canadian securities
legislation) that relate to future events or our future performance. These statements can be identified by expressions of belief, expectation
or intention, as well as those statements that are not historical fact. These statements often contain words such as “should,” “could,”
“expect,” “may,” “anticipate,” “believe,” “intend,” “estimates,” “plans” and similar expressions. These statements are based on certain factors
and assumptions as set forth in this document, including with respect to: foreign exchange rates, expected growth, results of operations,
performance, business prospects and opportunities and effective tax rates. While we consider these factors and assumptions to be
reasonable based on information currently available, they may prove to be incorrect. Forward-looking statements are subject to risks and
uncertainties that are difficult to predict. The results or events set forth in forward-looking statements may differ materially from actual
results or events. Several factors could cause actual results or events to differ materially from those expressed in forward-looking
statements including, but not limited to, the following: variations from our assumptions with respect to foreign exchange rates, expected
growth, results of operations, performance, business prospects and opportunities, and effective tax rates; fluctuations in supply and
demand in the fertilizer, sulfur, transportation and petrochemical markets; changes in competitive pressures, including pricing pressures;
costs and availability of transportation and distribution for our raw materials and products, including railcars and ocean freight; risks and
uncertainties related to operating and workforce changes made in response to our industry and the markets we serve; risks and
uncertainties related to our international operations and assets; failure to prevent or respond to a major safety incident; adverse or
uncertain economic conditions and changes in credit and financial markets; the results of sales contract negotiations within major markets;
economic and political uncertainty around the world; risks associated with natural gas and other hedging activities; changes in capital
markets; unexpected or adverse weather conditions; catastrophic events or malicious acts, including terrorism; changes in currency and
exchange rates; imprecision in reserve estimates; adverse developments in new and pending legal proceedings or government
investigations; our prospects to reinvest capital in strategic opportunities and acquisitions; our ownership of non-controlling equity interests
in other companies; the impact of further technological innovation; increases in the price or reduced availability of the raw materials that we
use; security risks related to our information technology systems; strikes or other forms of work stoppage or slowdowns; timing and impact
of capital expenditures; rates of return on, and the risks associated with, our investments and capital expenditures; changes in, and the
effects of, government policies and regulations; certain complications that may arise in our mining process, including water inflows; our
ability to attract, retain, develop and engage skilled employees; risks related to reputational loss; earnings; and the decisions of taxing
authorities, which could affect our effective tax rates. These risks and uncertainties are discussed in more detail under the headings “Risk
Factors” and “Management’s Discussion and Analysis of Results and Operations and Financial Condition” in our Annual Report on Form
10-K for the fiscal year ended December 31, 2014 and in other documents and reports subsequently filed by us with the US Securities and
Exchange Commission and the Canadian provincial securities commissions. Forward-looking statements are given only as of the date
hereof and we disclaim any obligation to update or revise any forward-looking statements in this presentation, whether as a result of new
information, future events or otherwise, except as required by law.
Forward-looking Statements
Slide #2
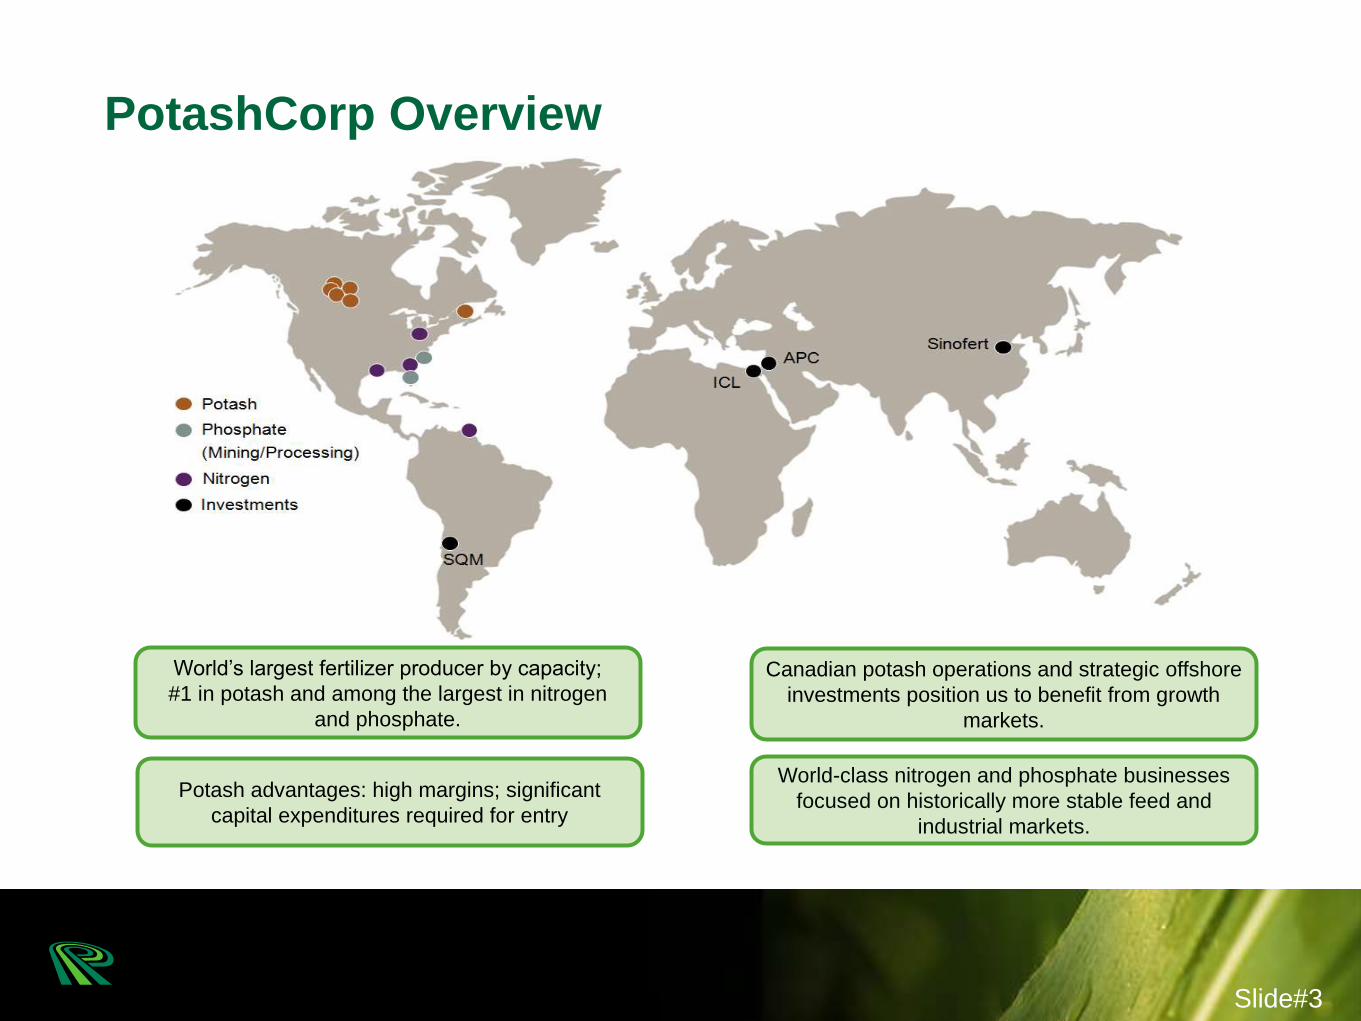
PotashCorp Overview
World’s largest fertilizer producer by capacity;
#1 in potash and among the largest in nitrogen
and phosphate.
Potash advantages: high margins; significant
capital expenditures required for entry
Canadian potash operations and strategic offshore
investments position us to benefit from growth
markets.
World-class nitrogen and phosphate businesses
focused on historically more stable feed and
industrial markets.
Slide#3

Current Topics
Encouraging Demand Trends Support Our Long-term Growth Potential
Global Potash Demand
Source: PotashCorp
Slide #5
20
25
30
35
40
45
50
55
60
65
70
2012 2013 2014 2015F
Million Tonnes KCl
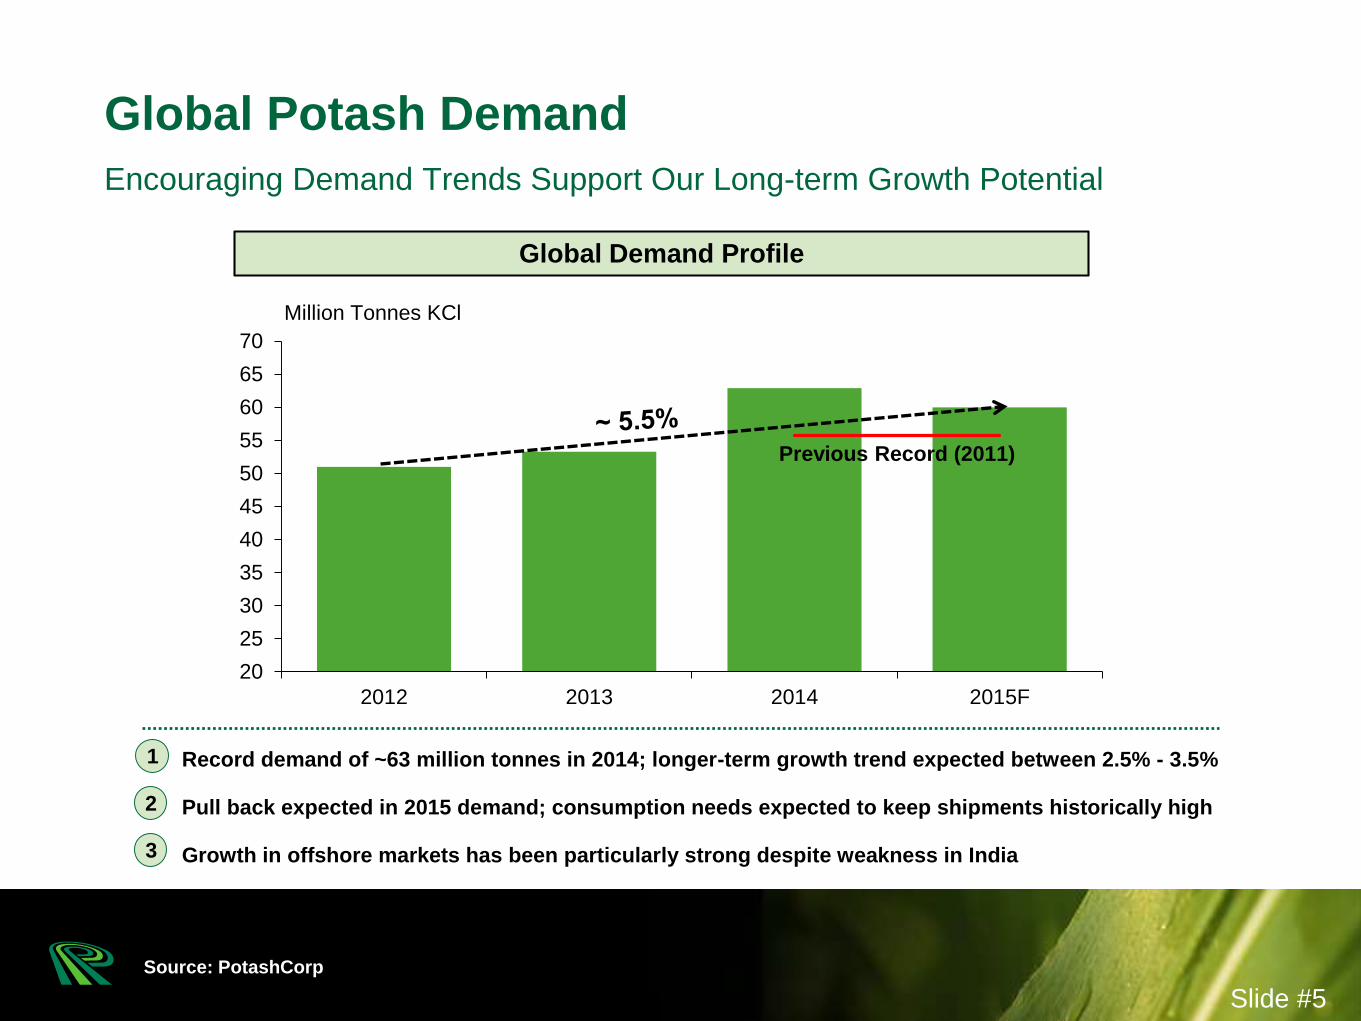
Global Demand Profile
• Record demand of ~63 million tonnes in 2014; longer-term growth trend expected between 2.5% - 3.5%
• Pull back expected in 2015 demand; consumption needs expected to keep shipments historically high
• Growth in offshore markets has been particularly strong despite weakness in India
1
2
3
Previous Record (2011)
0 1 2 3 4 5 6 7 8
2010-2014
2000s
1990s
1980s
Water Inflow Ore Depletion/Other
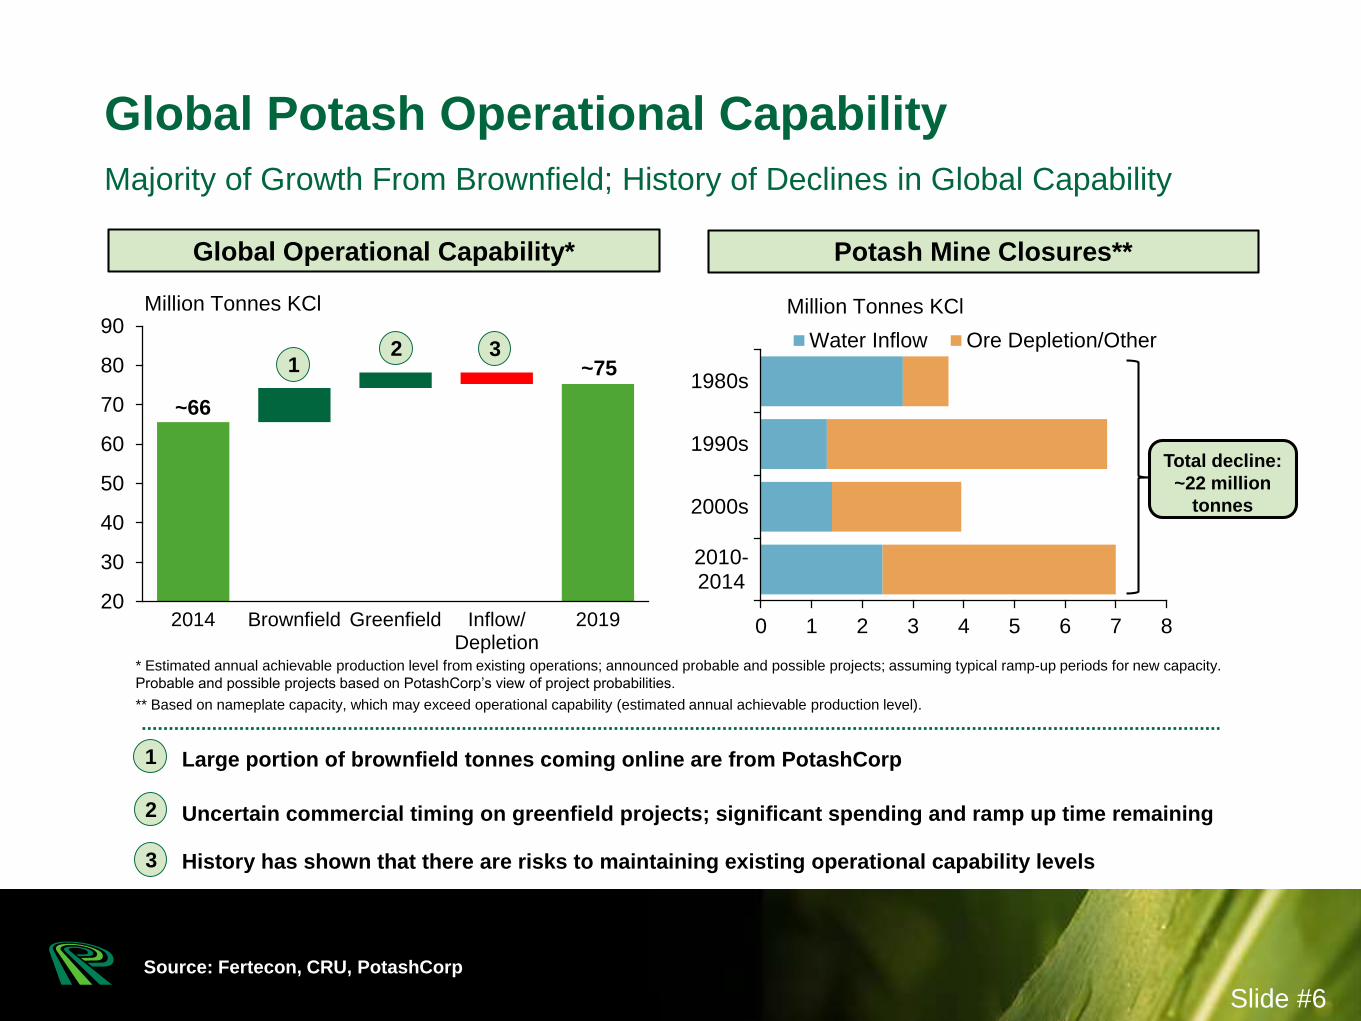
~66
~75
20
30
40
50
60
70
80
90
2014 Brownfield Greenfield Inflow/Depletion
2019
Million Tonnes KCl
• Large portion of brownfield tonnes coming online are from PotashCorp
• Uncertain commercial timing on greenfield projects; significant spending and ramp up time remaining
• History has shown that there are risks to maintaining existing operational capability levels
Majority of Growth From Brownfield; History of Declines in Global Capability
Global Potash Operational Capability
Source: Fertecon, CRU, PotashCorp
Slide #6
Global Operational Capability*
1
2
3
* Estimated annual achievable production level from existing operations; announced probable and possible projects; assuming typical ramp-up periods for new capacity.
Probable and possible projects based on PotashCorp’s view of project probabilities.
** Based on nameplate capacity, which may exceed operational capability (estimated annual achievable production level).
Potash Mine Closures**
Million Tonnes KCl
12 3
Total decline:
~22 million
tonnes
Source: Fertecon, CRU, Industry Publications, PotashCorp
2015 Demand Expected to Remain Strong; PotashCorp Well Positioned to Respond
Potash Market Positioning
Slide#7
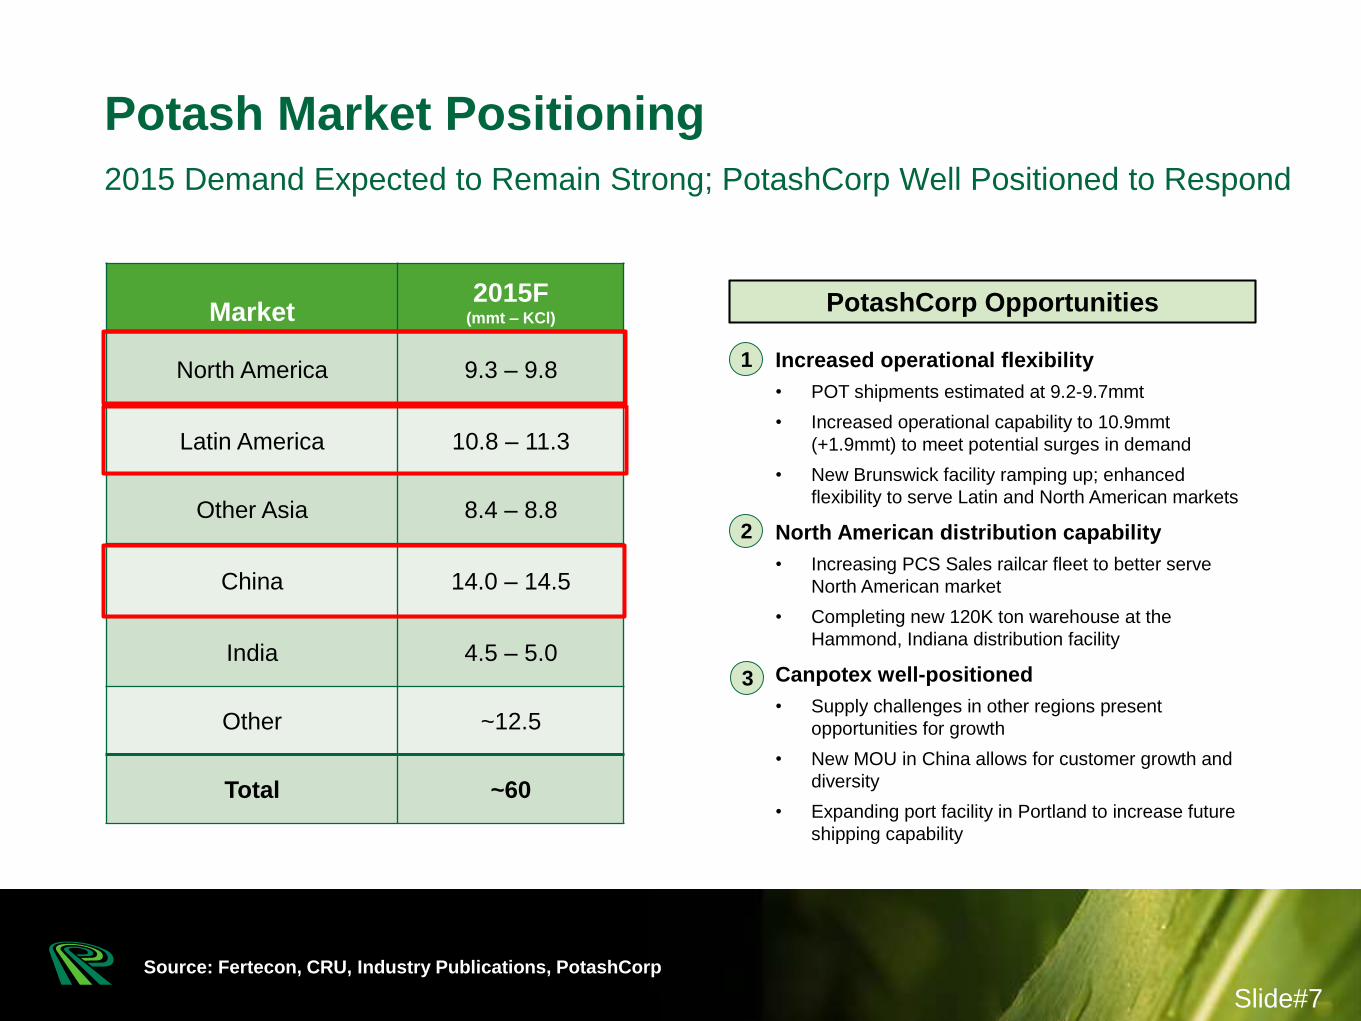
Market2015F
(mmt – KCl)
North America 9.3 – 9.8
Latin America 10.8 – 11.3
Other Asia 8.4 – 8.8
China 14.0 – 14.5
India 4.5 – 5.0
Other ~12.5
Total ~60
1. Increased operational flexibility
• POT shipments estimated at 9.2-9.7mmt
• Increased operational capability to 10.9mmt
(+1.9mmt) to meet potential surges in demand
• New Brunswick facility ramping up; enhanced
flexibility to serve Latin and North American markets
1. North American distribution capability
• Increasing PCS Sales railcar fleet to better serve
North American market
• Completing new 120K ton warehouse at the
Hammond, Indiana distribution facility
1. Canpotex well-positioned
• Supply challenges in other regions present
opportunities for growth
• New MOU in China allows for customer growth and
diversity
• Expanding port facility in Portland to increase future
shipping capability
PotashCorp Opportunities
1
2
3
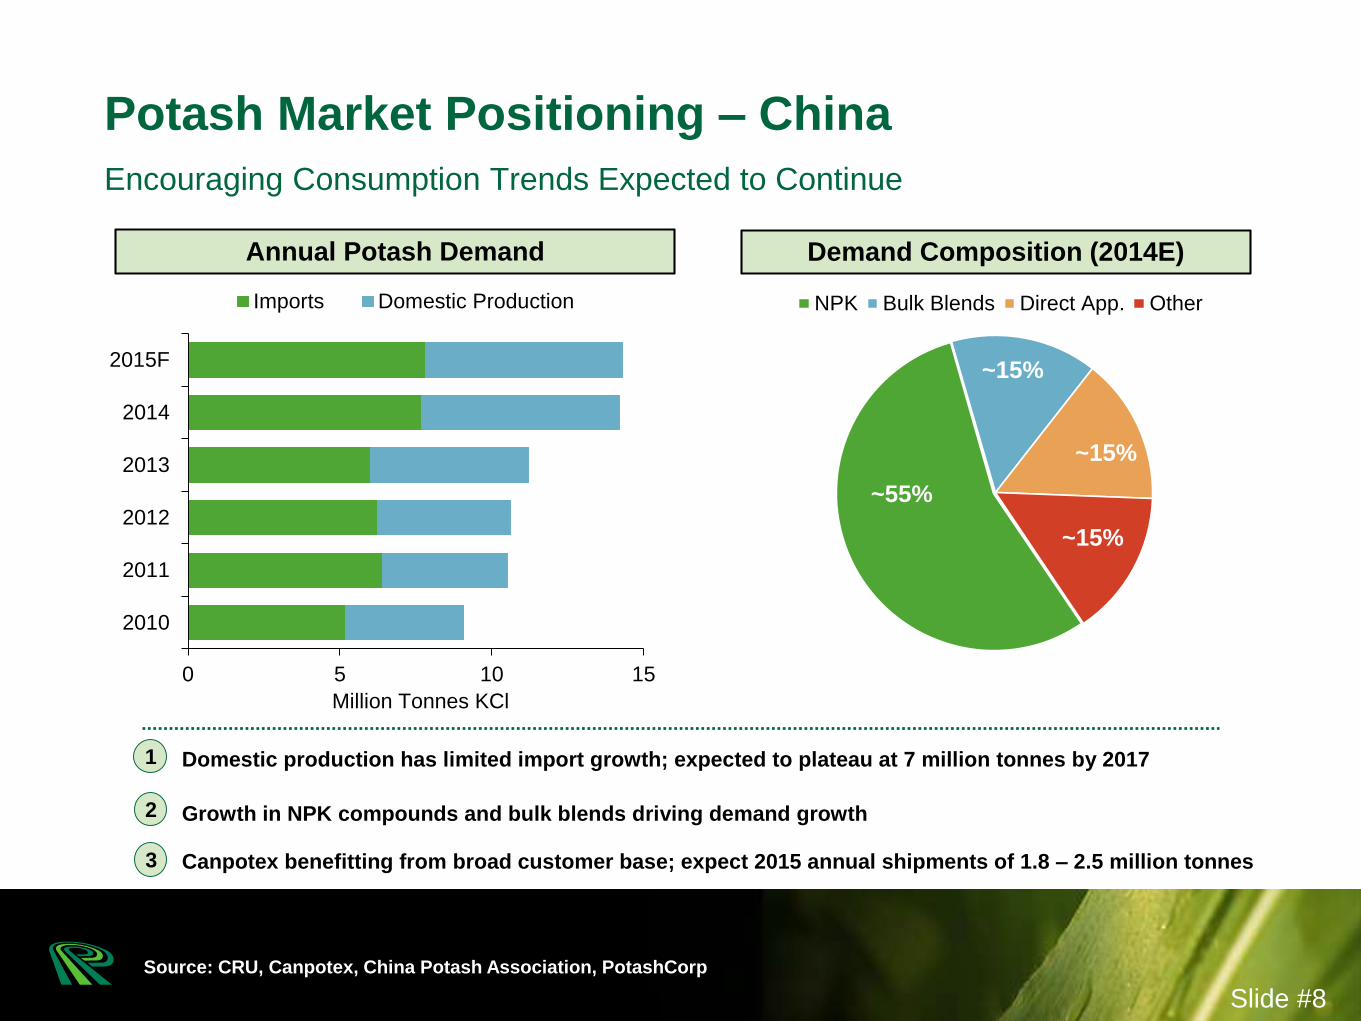
~55%
~15%
~15%
~15%
NPK Bulk Blends Direct App. Other
• Domestic production has limited import growth; expected to plateau at 7 million tonnes by 2017
• Growth in NPK compounds and bulk blends driving demand growth
• Canpotex benefitting from broad customer base; expect 2015 annual shipments of 1.8 – 2.5 million tonnes
Encouraging Consumption Trends Expected to Continue
Potash Market Positioning – China
Source: CRU, Canpotex, China Potash Association, PotashCorp
Slide #8
0 5 10 15
2010
2011
2012
2013
2014
2015F
Imports Domestic Production
Million Tonnes KCl
Annual Potash Demand
1
2
3
Demand Composition (2014E)

Heringer One of the Largest Fertilizer Distributors in Growing Brazilian Market
Potash Market Positioning – Latin America
Source: Potafertz, Brazil Customs Data
Slide #9
0.0
0.5
1.0
1.5
2010 2011 2012 2013 2014
Million Tonnes KCl
Heringer - Annual Potash Imports
• Heringer is a key distributor in growing Brazilian market; accounts for ~13% of Brazil’s potash imports
• Investment paves the way for long-term supply agreement for PotashCorp to be key supplier over time
• Enhances our position in Brazil and provides flexibility for our growing New Brunswick production
1
2
3
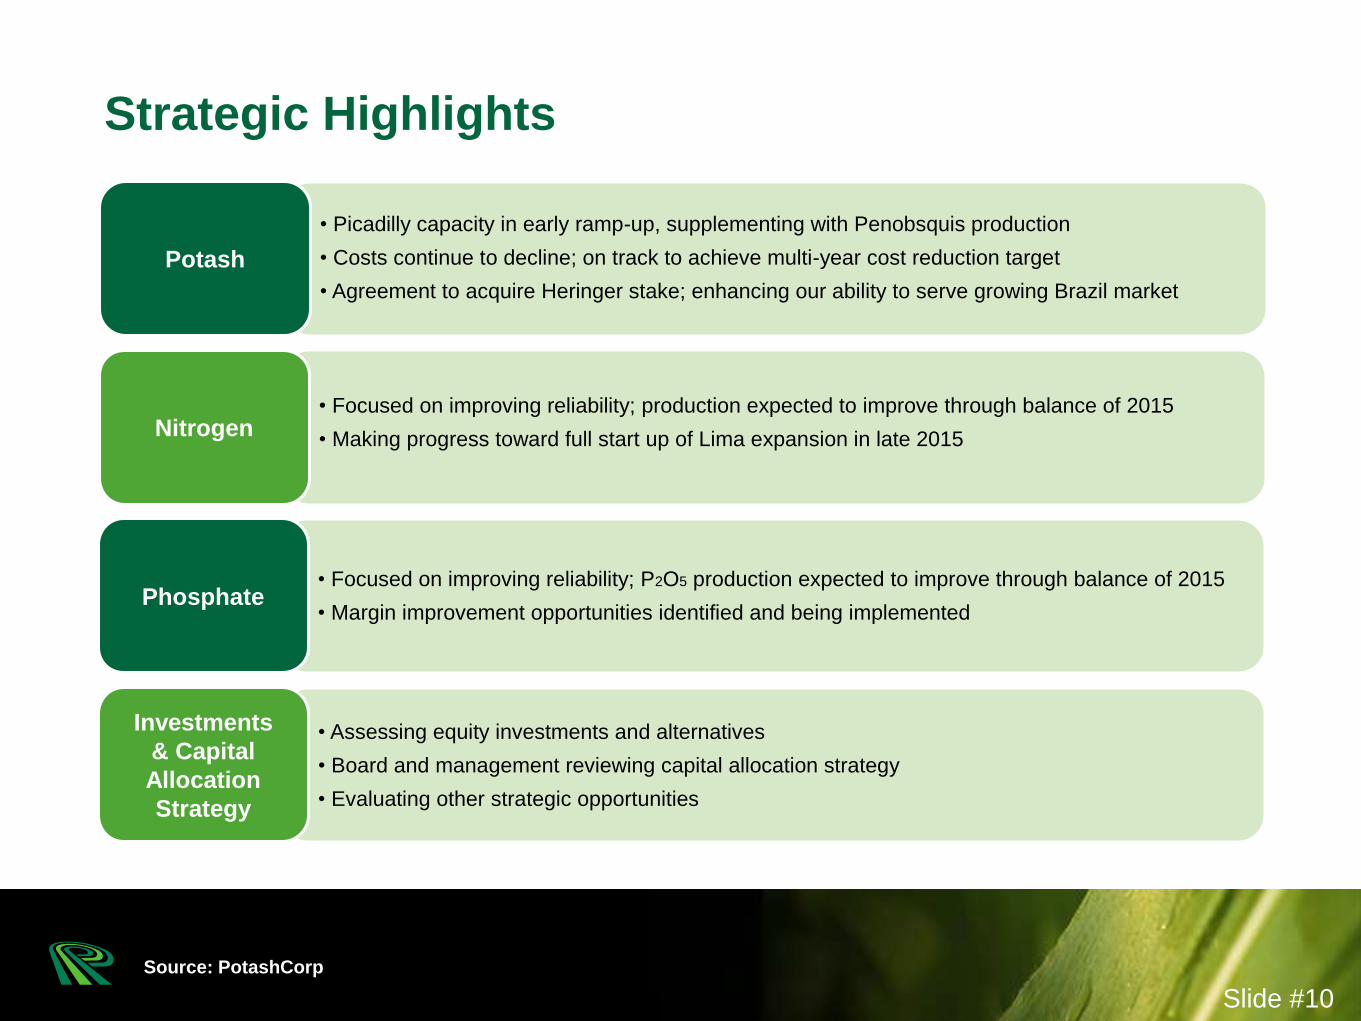
Strategic Highlights
Source: PotashCorp
• Picadilly capacity in early ramp-up, supplementing with Penobsquis production
• Costs continue to decline; on track to achieve multi-year cost reduction target
• Agreement to acquire Heringer stake; enhancing our ability to serve growing Brazil market
Potash
• Focused on improving reliability; production expected to improve through balance of 2015
• Making progress toward full start up of Lima expansion in late 2015Nitrogen
• Focused on improving reliability; P2O5 production expected to improve through balance of 2015
• Margin improvement opportunities identified and being implementedPhosphate
• Assessing equity investments and alternatives
• Board and management reviewing capital allocation strategy
• Evaluating other strategic opportunities
Investments
& Capital
Allocation
Strategy
Slide #10
Nutrient Highlights and Other Opportunities
0
2
4
6
8
10
12
14
16
China India Other Asia LatinAmerica
2012 2013 2014 2015F*
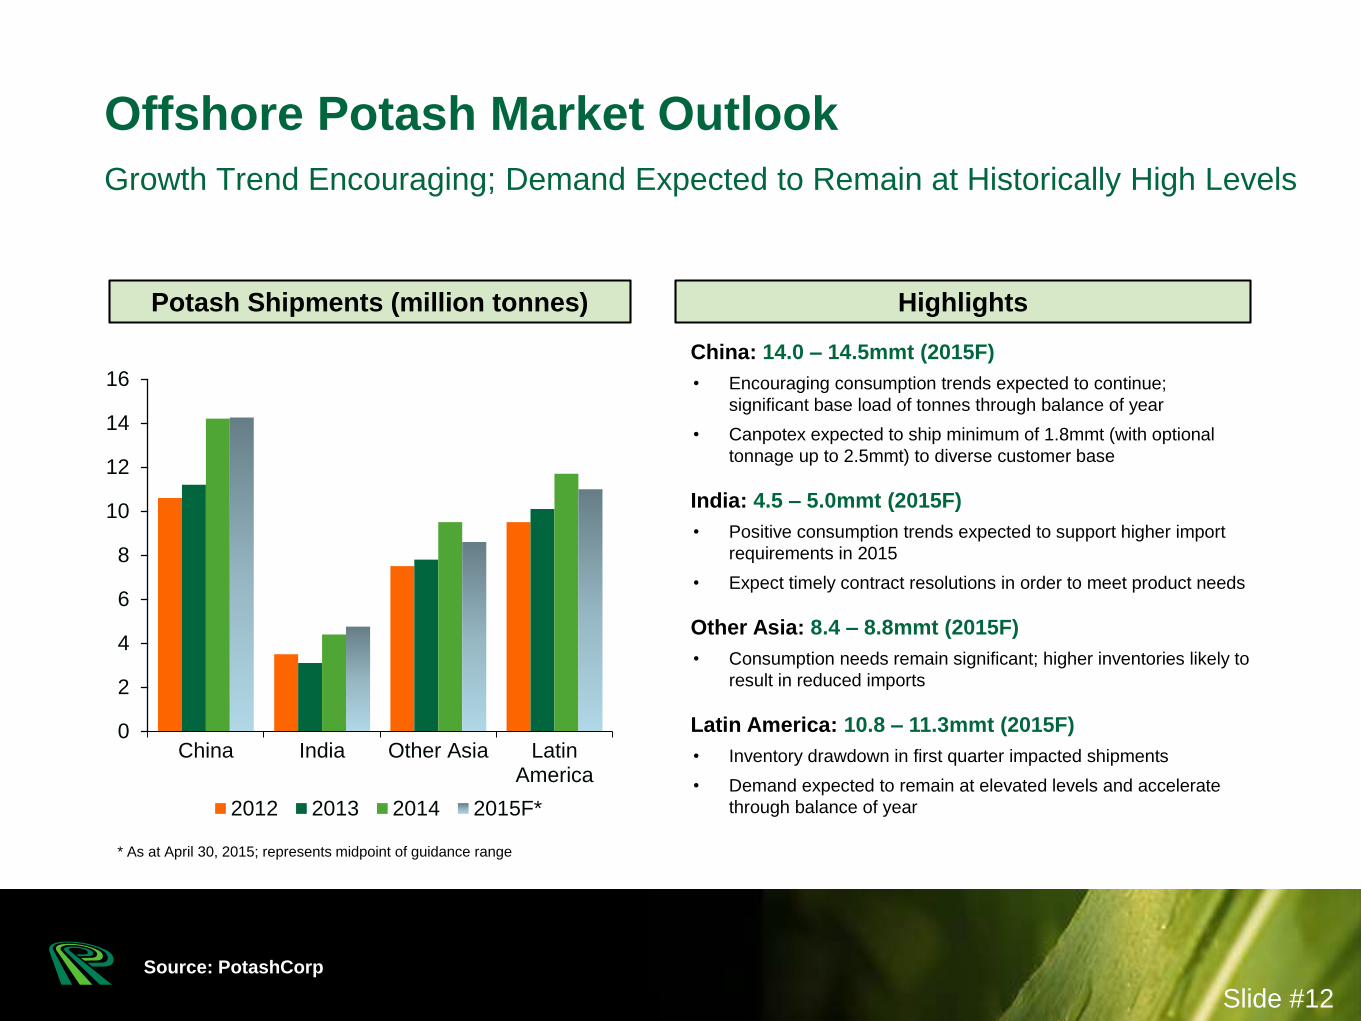
Growth Trend Encouraging; Demand Expected to Remain at Historically High Levels
Offshore Potash Market Outlook
Source: PotashCorp
Slide #12
Highlights
China: 14.0 – 14.5mmt (2015F)
• Encouraging consumption trends expected to continue;
significant base load of tonnes through balance of year
• Canpotex expected to ship minimum of 1.8mmt (with optional
tonnage up to 2.5mmt) to diverse customer base
India: 4.5 – 5.0mmt (2015F)
• Positive consumption trends expected to support higher import
requirements in 2015
• Expect timely contract resolutions in order to meet product needs
Other Asia: 8.4 – 8.8mmt (2015F)
• Consumption needs remain significant; higher inventories likely to
result in reduced imports
Latin America: 10.8 – 11.3mmt (2015F)
• Inventory drawdown in first quarter impacted shipments
• Demand expected to remain at elevated levels and accelerate
through balance of year
Potash Shipments (million tonnes)
* As at April 30, 2015; represents midpoint of guidance range
0
2
4
6
8
10
12
North America Offshore Imports
2012 2013 2014 2015F*
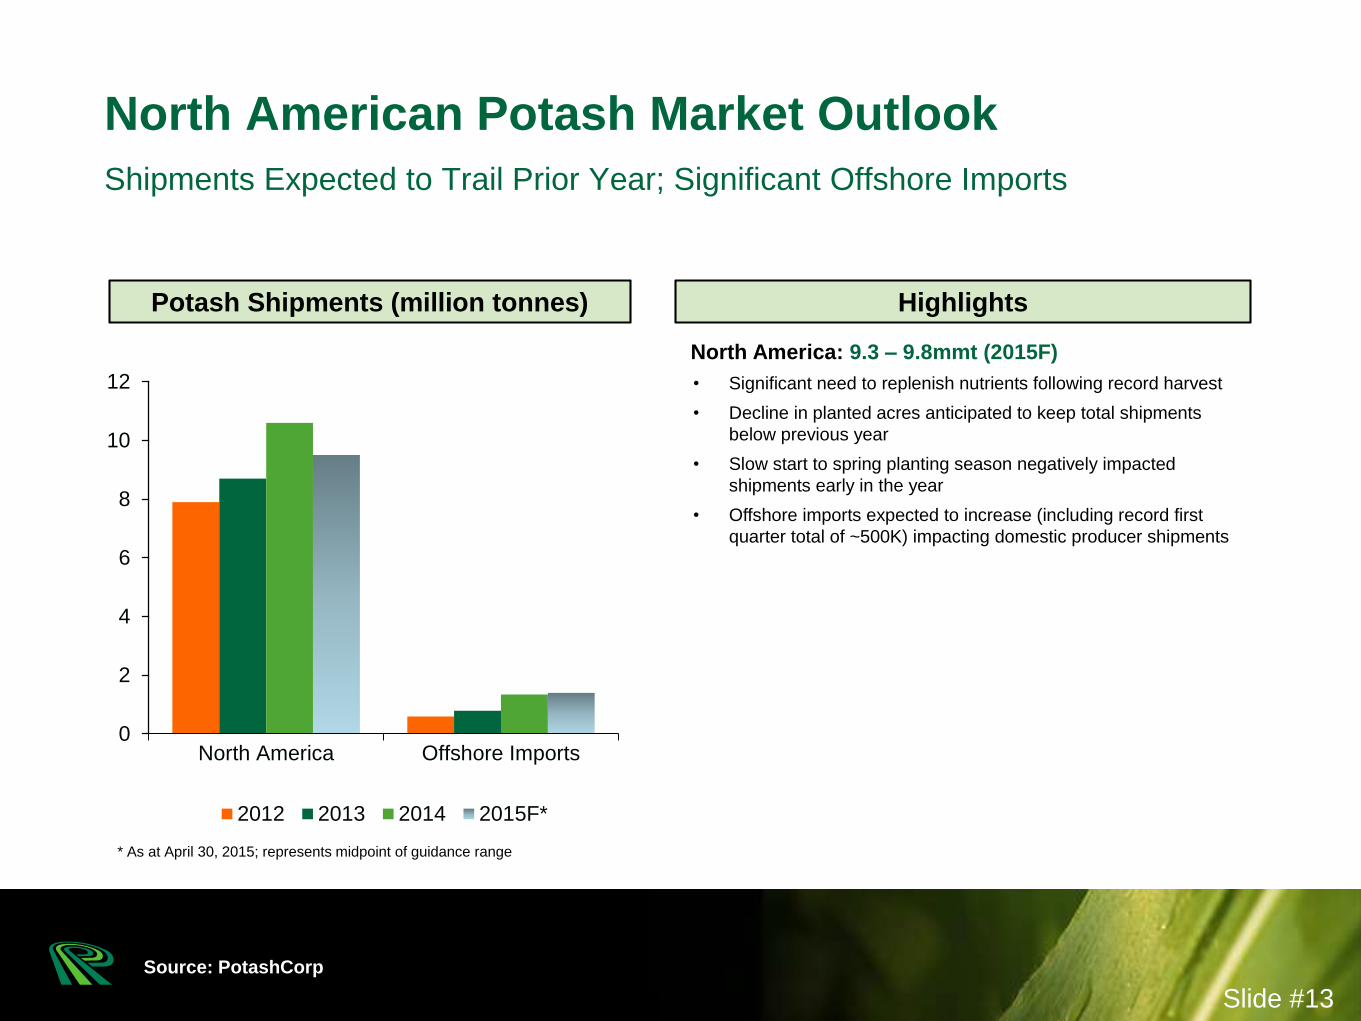
Shipments Expected to Trail Prior Year; Significant Offshore Imports
North American Potash Market Outlook
Source: PotashCorp
Slide #13
HighlightsPotash Shipments (million tonnes)
* As at April 30, 2015; represents midpoint of guidance range
North America: 9.3 – 9.8mmt (2015F)
• Significant need to replenish nutrients following record harvest
• Decline in planted acres anticipated to keep total shipments
below previous year
• Slow start to spring planting season negatively impacted
shipments early in the year
• Offshore imports expected to increase (including record first
quarter total of ~500K) impacting domestic producer shipments

Focused on Aligning Operational Capability with Demand Growth
PotashCorp Operational Capability
Source: PotashCorp
1. Rocanville• Tonnes:+2.7mmt
• Timeframe: Planned ramp-up by 2016
• Capital: Within project estimates
2. Other SK Mines• Tonnes: +2.9mmt
• Timeframe: 3-12 months (from decision point)
• Capital: Minimal (<$60M)
3. New Brunswick**• Tonnes: +0.7mmt
• Timeframe: ~30 months (from decision point)
• Capital: Within project estimates
Incremental Capability
0
4
8
12
16
20
2015F Rocanville Other SKMines
NewBrunswick
Potential*
Million tonnes KCl
* Anticipated operational capability upon completion of projects, assumes fully
staffed and ramped up operations. Operational capability will be staffed and ramped
up according to anticipated market demand and PotashCorp’s supply requirements
1
23 1
2
3
10.9
Slide#14
17.2
** Estimate assumes closure of Penobsquis and full ramp-up of Picadilly.
Option exists to reach 1.8mmt sooner by continuing to operate Penobsquis
in tandem with Picadilly ramp up
-$8/mt
-$17/mt
40
60
80
100
120
140
2013Cash Cost
ForeignExchange &
Royalties
OperationalEfficiencies
2014Cash Cost
2016Cash Cost
Target
Cash-related Cost of Goods Sold*
Depreciation and Amortization
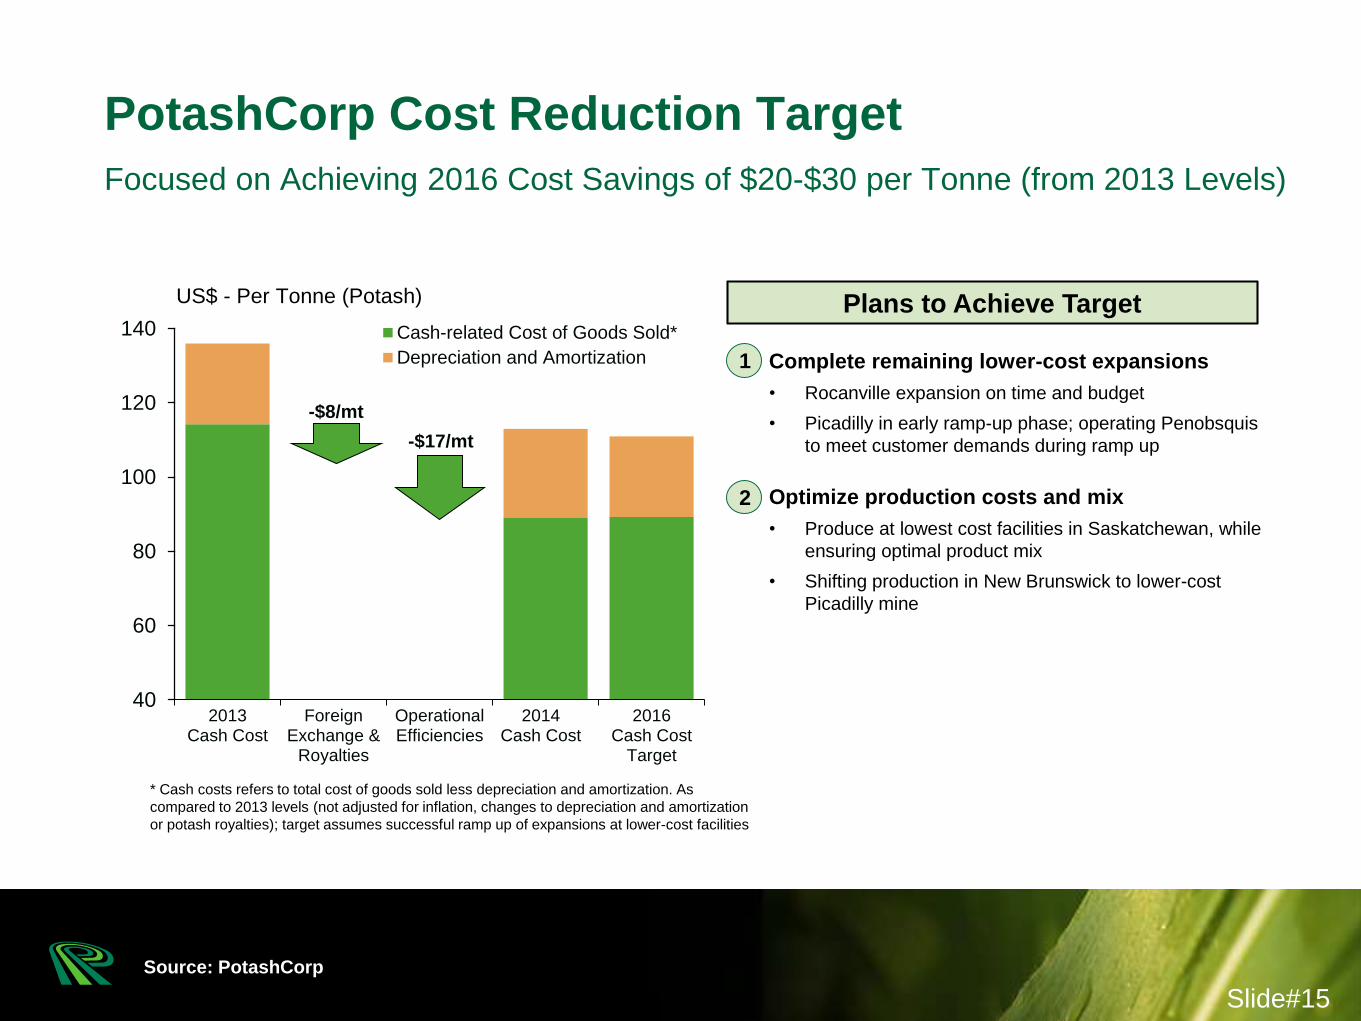
Focused on Achieving 2016 Cost Savings of $20-$30 per Tonne (from 2013 Levels)
PotashCorp Cost Reduction Target
Source: PotashCorp
US$ - Per Tonne (Potash)
* Cash costs refers to total cost of goods sold less depreciation and amortization. As
compared to 2013 levels (not adjusted for inflation, changes to depreciation and amortization
or potash royalties); target assumes successful ramp up of expansions at lower-cost facilities
Slide#15
Plans to Achieve Target
1. Complete remaining lower-cost expansions
• Rocanville expansion on time and budget
• Picadilly in early ramp-up phase; operating Penobsquis
to meet customer demands during ramp up
2. Optimize production costs and mix
• Produce at lowest cost facilities in Saskatchewan, while
ensuring optimal product mix
• Shifting production in New Brunswick to lower-cost
Picadilly mine
1
2
0
1
2
3
4
5
6
7
Ukraine Trinidad Pakistan Egypt Algeria Libya
Production
Curtailed Capacity
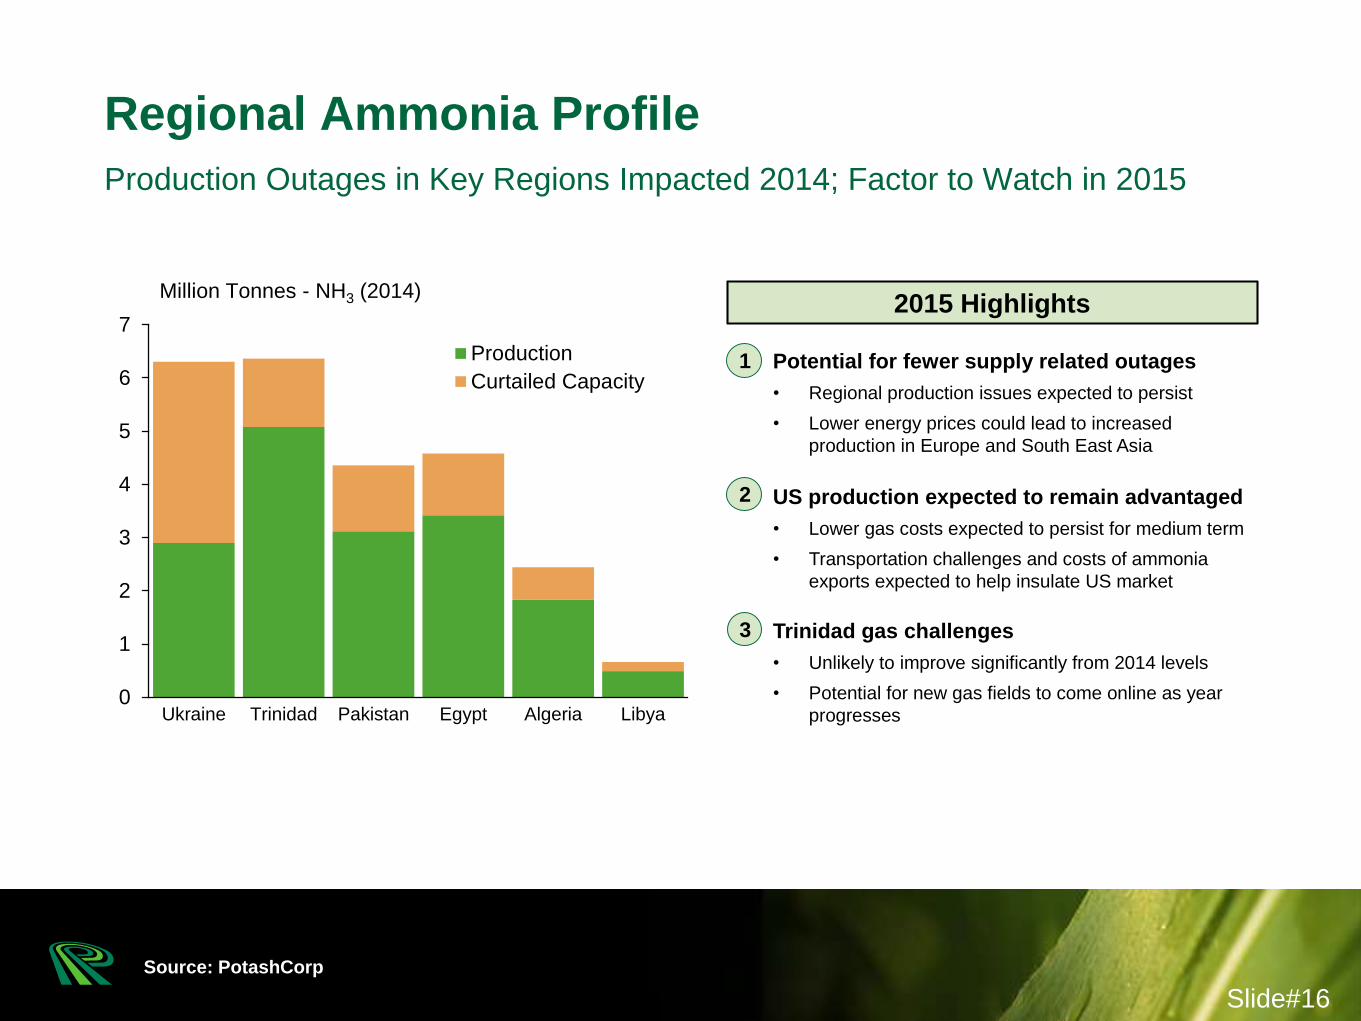
Million Tonnes - NH3 (2014)
Production Outages in Key Regions Impacted 2014; Factor to Watch in 2015
Regional Ammonia Profile
Source: PotashCorp
Slide#16
2015 Highlights
1. Potential for fewer supply related outages
• Regional production issues expected to persist
• Lower energy prices could lead to increased
production in Europe and South East Asia
2. US production expected to remain advantaged
• Lower gas costs expected to persist for medium term
• Transportation challenges and costs of ammonia
exports expected to help insulate US market
3. Trinidad gas challenges
• Unlikely to improve significantly from 2014 levels
• Potential for new gas fields to come online as year
progresses
1
2
3
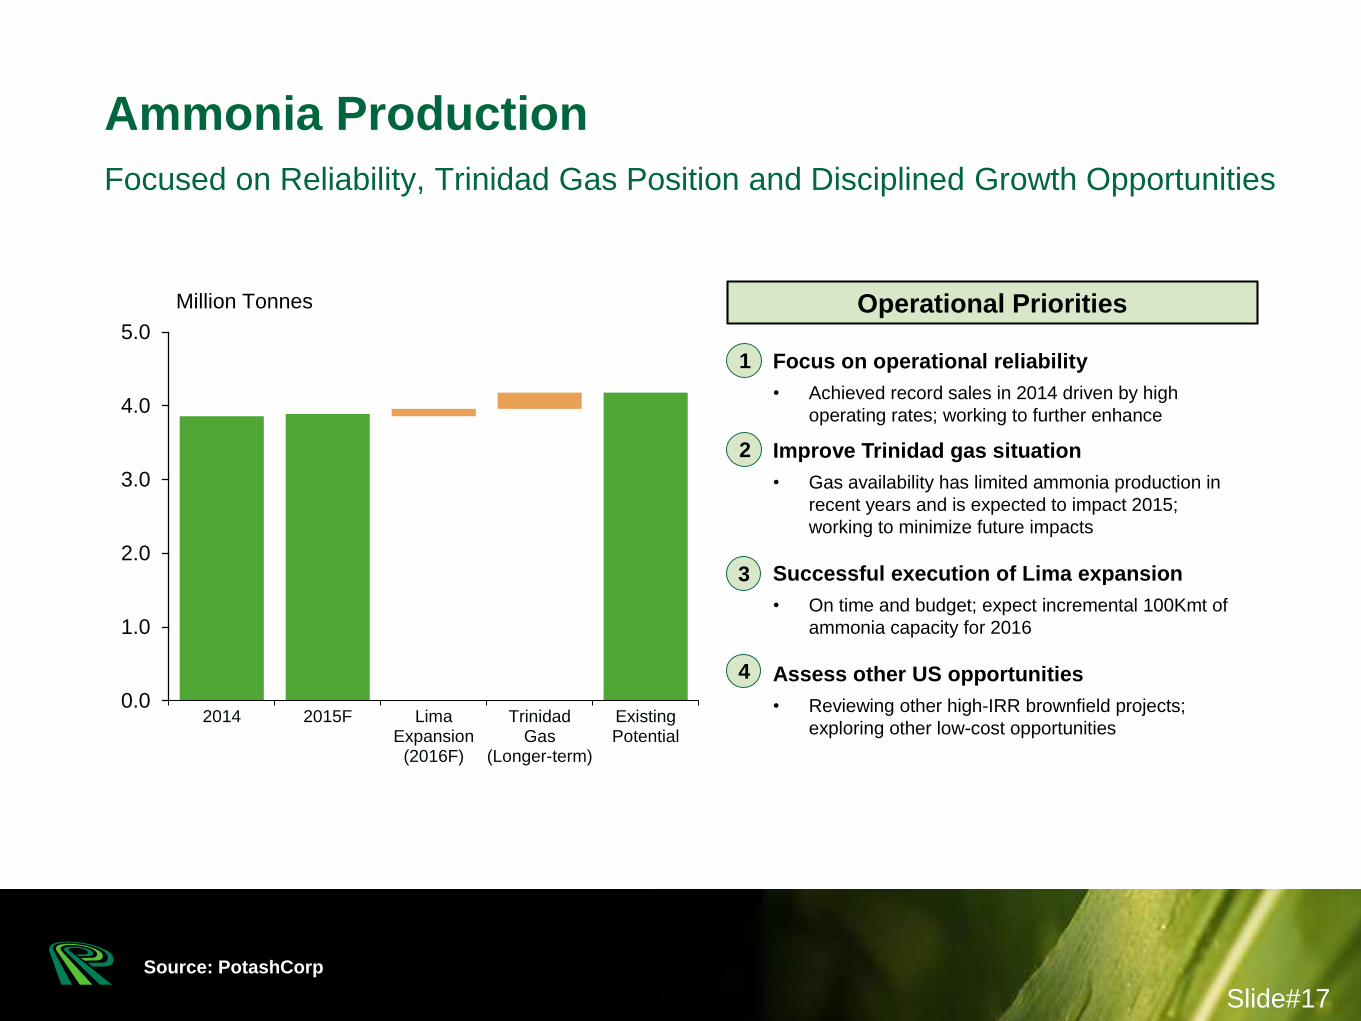
Focused on Reliability, Trinidad Gas Position and Disciplined Growth Opportunities
Ammonia Production
Source: PotashCorp
0.0
1.0
2.0
3.0
4.0
5.0
2014 2015F LimaExpansion
(2016F)
TrinidadGas
(Longer-term)
ExistingPotential
Million Tonnes
Slide#17
Operational Priorities
1. Focus on operational reliability
• Achieved record sales in 2014 driven by high
operating rates; working to further enhance
2. Improve Trinidad gas situation
• Gas availability has limited ammonia production in
recent years and is expected to impact 2015;
working to minimize future impacts
3. Successful execution of Lima expansion
• On time and budget; expect incremental 100Kmt of
ammonia capacity for 2016
1. Assess other US opportunities
• Reviewing other high-IRR brownfield projects;
exploring other low-cost opportunities
1
2
3
4
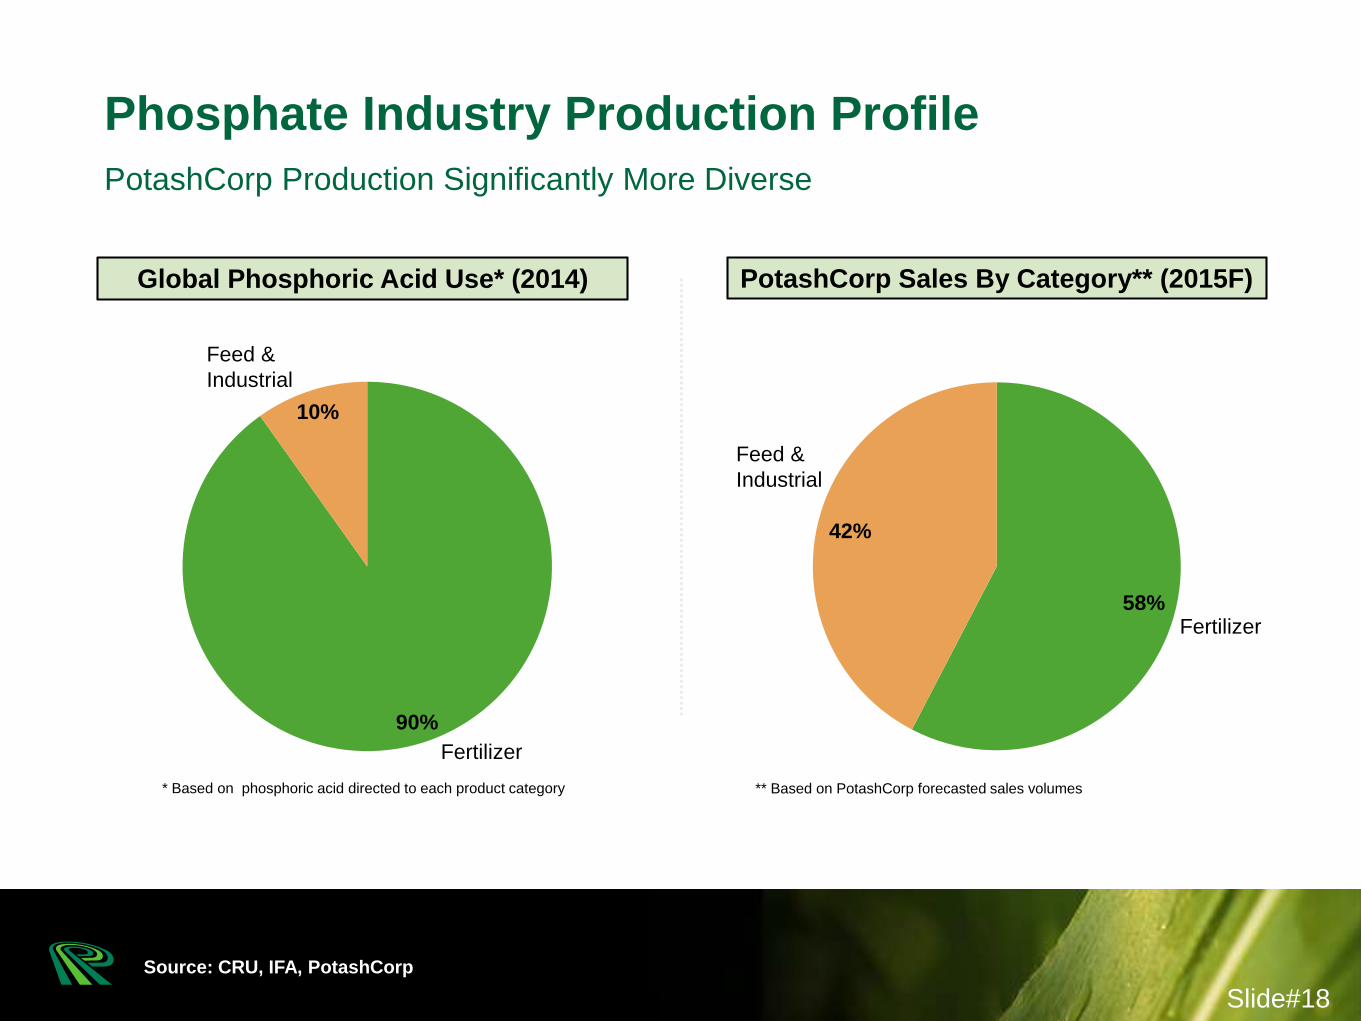
Source: CRU, IFA, PotashCorp
90%
10%
PotashCorp Production Significantly More Diverse
Phosphate Industry Production Profile
Fertilizer
Feed &
Industrial
58%
42%
Feed &
Industrial
PotashCorp Sales By Category** (2015F)Global Phosphoric Acid Use* (2014)
Fertilizer
* Based on phosphoric acid directed to each product category ** Based on PotashCorp forecasted sales volumes
Slide#18
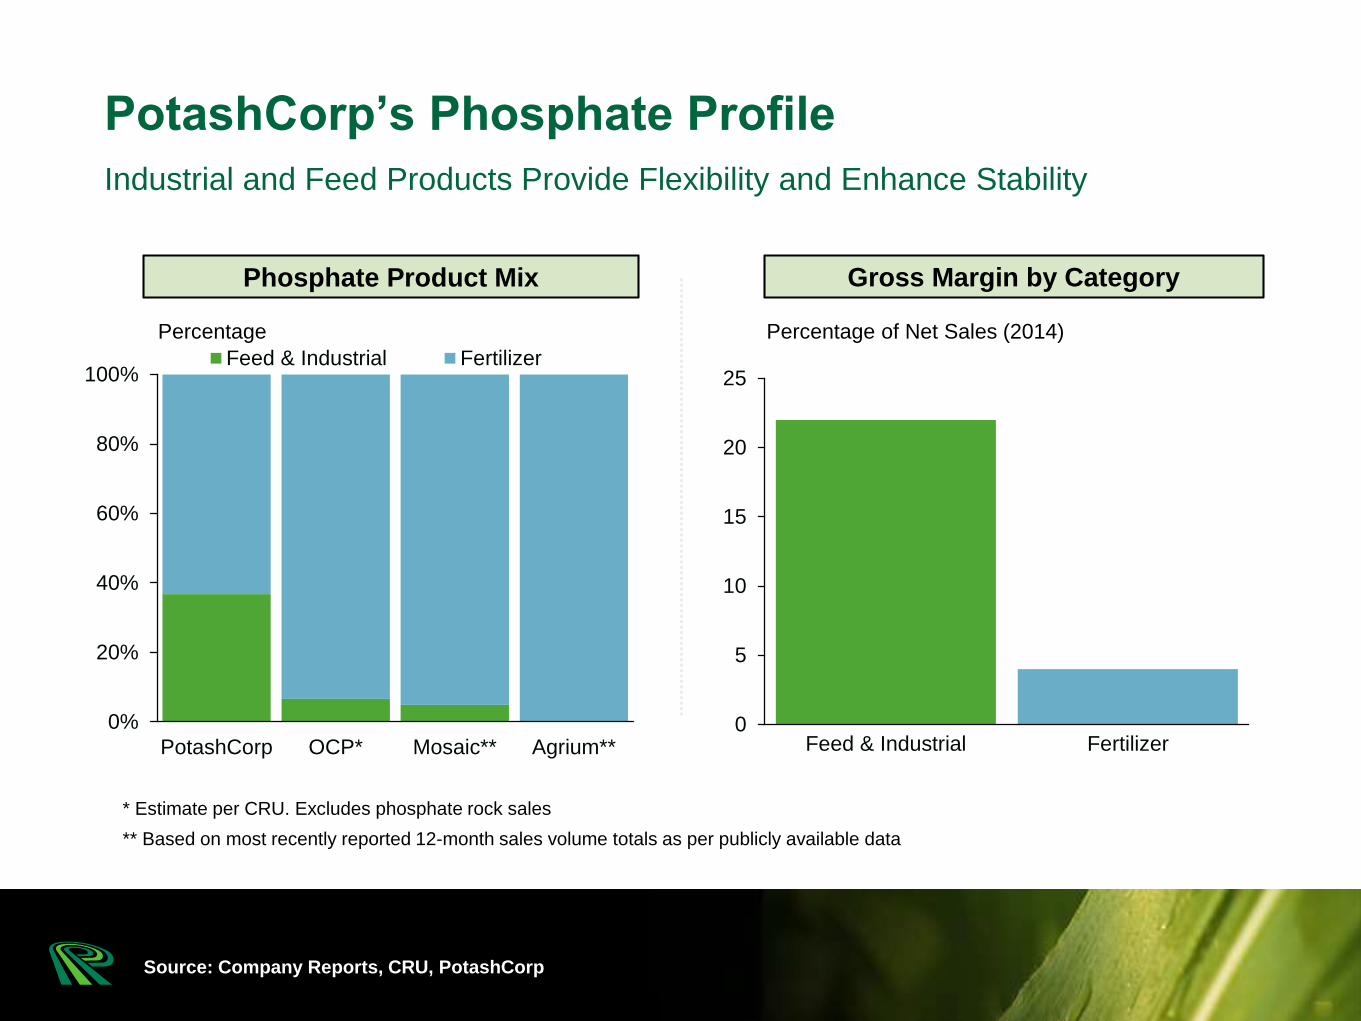
0%
20%
40%
60%
80%
100%
PotashCorp OCP* Mosaic** Agrium**
Feed & Industrial Fertilizer
Source: Company Reports, CRU, PotashCorp
* Estimate per CRU. Excludes phosphate rock sales
** Based on most recently reported 12-month sales volume totals as per publicly available data
Percentage of Net Sales (2014)Percentage
Industrial and Feed Products Provide Flexibility and Enhance Stability
PotashCorp’s Phosphate Profile
0
5
10
15
20
25
Feed & Industrial Fertilizer
Gross Margin by CategoryPhosphate Product Mix
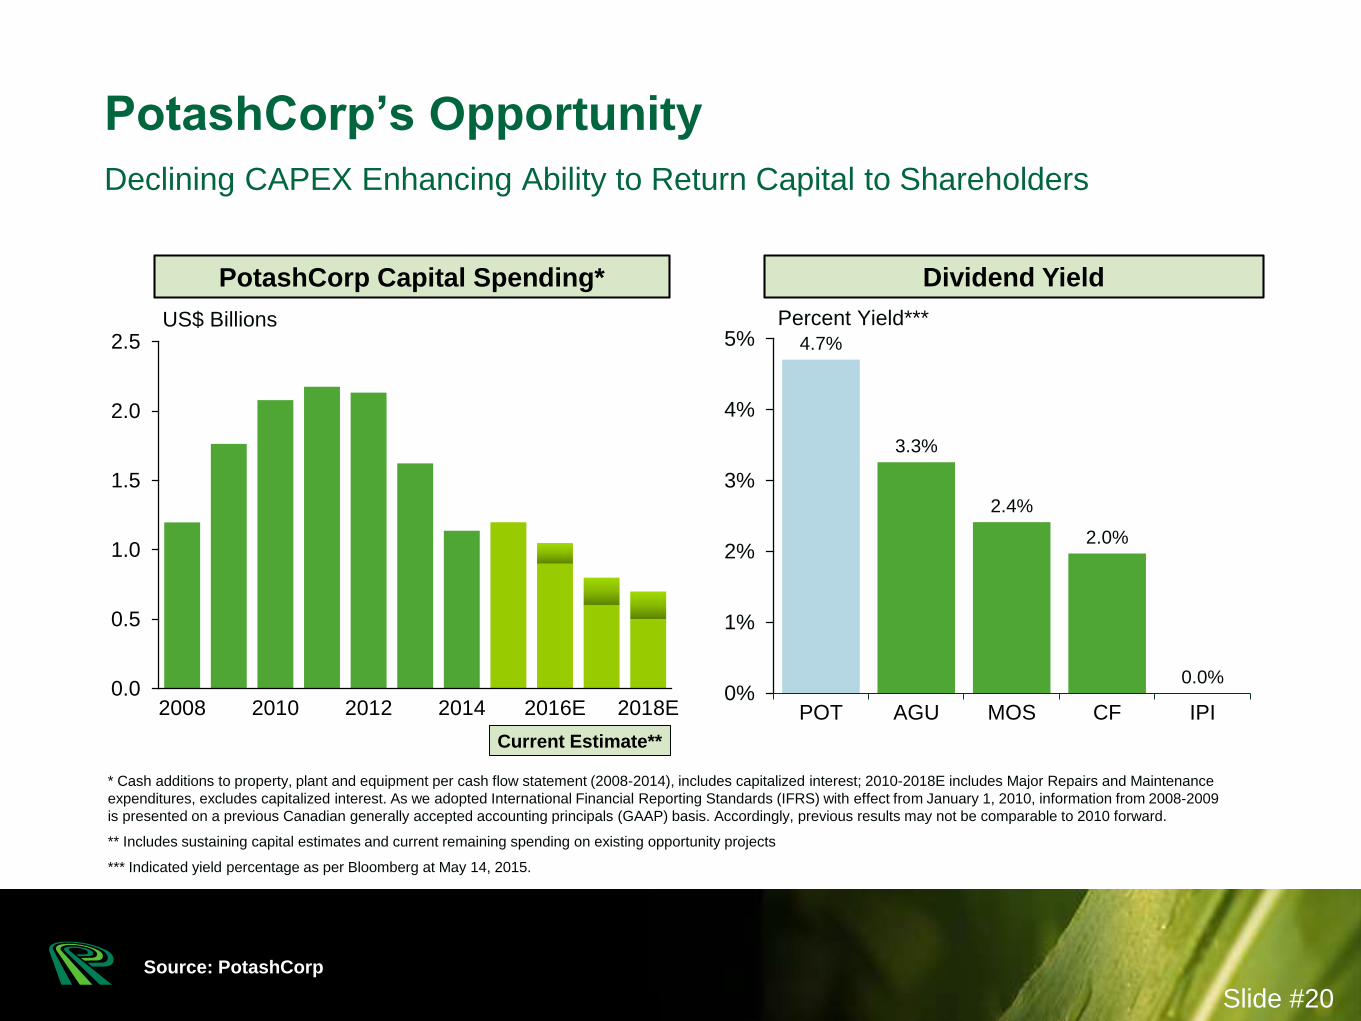
Dividend YieldPotashCorp Capital Spending*
0.0
0.5
1.0
1.5
2.0
2.5
2008 2010 2012 2014 2016E 2018E
Source: PotashCorp
Declining CAPEX Enhancing Ability to Return Capital to Shareholders
PotashCorp’s Opportunity
US$ Billions
* Cash additions to property, plant and equipment per cash flow statement (2008-2014), includes capitalized interest; 2010-2018E includes Major Repairs and Maintenance
expenditures, excludes capitalized interest. As we adopted International Financial Reporting Standards (IFRS) with effect from January 1, 2010, information from 2008-2009
is presented on a previous Canadian generally accepted accounting principals (GAAP) basis. Accordingly, previous results may not be comparable to 2010 forward.
** Includes sustaining capital estimates and current remaining spending on existing opportunity projects
*** Indicated yield percentage as per Bloomberg at May 14, 2015.
Current Estimate**
Slide #20
4.7%
3.3%
2.4%
2.0%
0.0%0%
1%
2%
3%
4%
5%
POT AGU MOS CF IPI
Percent Yield***
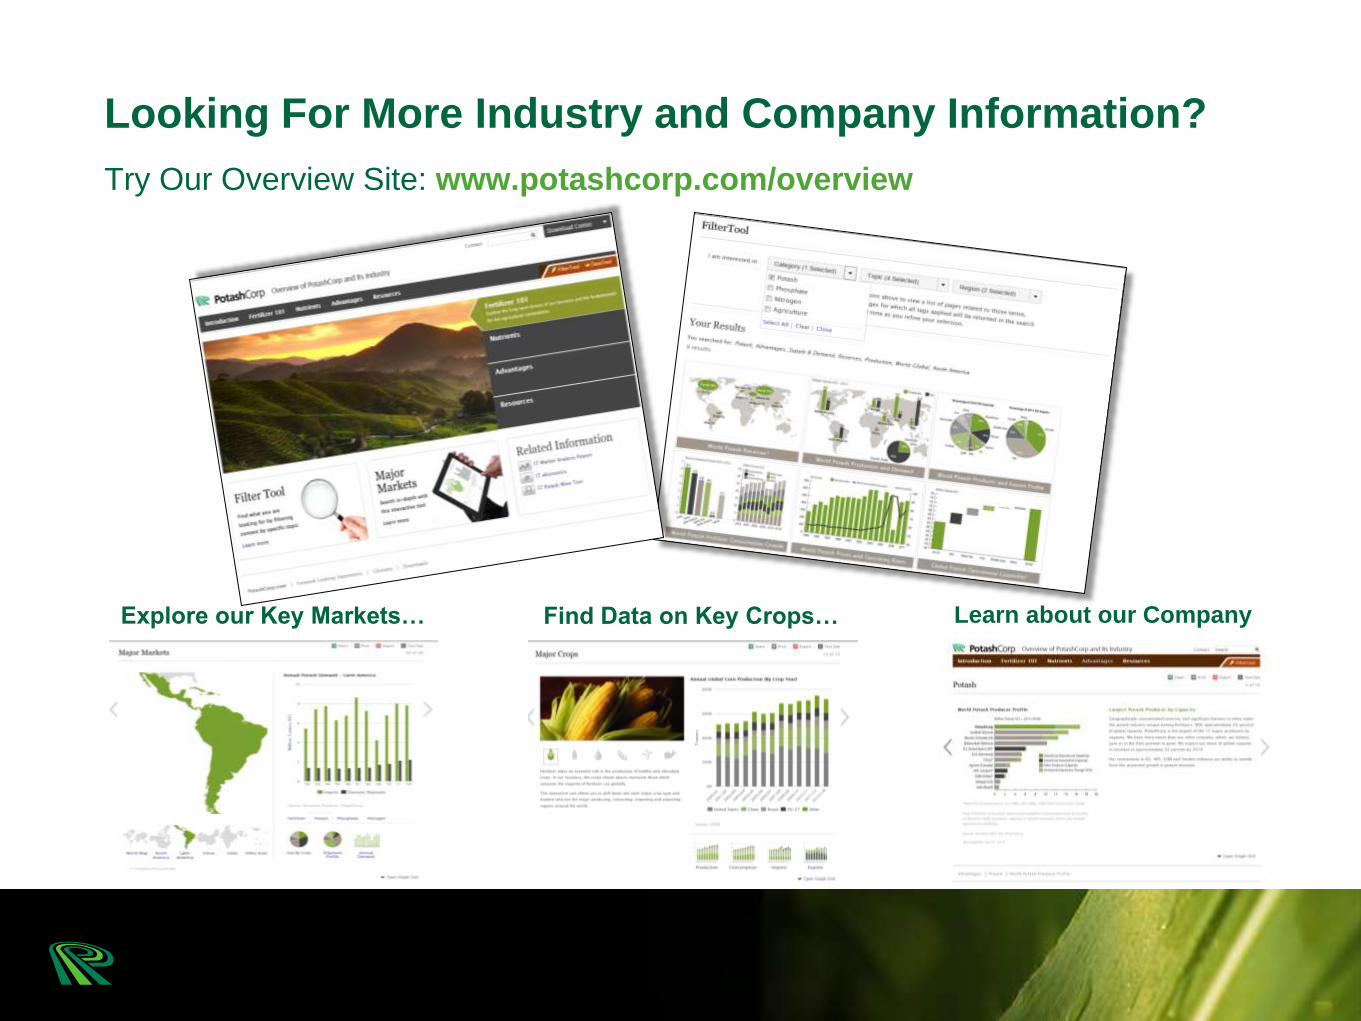
Try Our Overview Site: www.potashcorp.com/overview
Looking For More Industry and Company Information?
Explore our Key Markets… Find Data on Key Crops… Learn about our Company