BMO Capital Markets Global Metals & Mining Conference 2015
82
February 24, 2015
-
Upload
teckresourcesltd -
Category
Investor Relations
-
view
535 -
download
0
Transcript of BMO Capital Markets Global Metals & Mining Conference 2015

February 24, 2015
Forward Looking Information
Both these slides and the accompanying oral presentation contain certain forward-looking statements within the meaning of the United StatesPrivate Securities Litigation Reform Act of 1995 and forward-looking information within the meaning of the Securities Act (Ontario) andcomparable legislation in other provinces. Forward-looking statements can be identified by the use of words such as “plans”, “expects” or “doesnot expect”, “is expected”, “budget”, “scheduled”, “estimates”, “forecasts”, “intends”, “anticipates” or “does not anticipate”, or “believes”, orvariation of such words and phrases or state that certain actions, events or results “may”, “could”, “should”, “would”, “might” or “will” be taken,occur or be achieved. Forward-looking statements involve known and unknown risks, uncertainties and other factors which may cause the actualresults, performance or achievements of Teck to be materially different from any future results, performance or achievements expressed orimplied by the forward-looking statements. These forward-looking statements include statements relating to management’s expectations withrespect to our diversification and the benefits of diversification, our production, costs and sales targets and guidance, mine lives and resourcelives for our various commodities, costs for our projects, 2015 projected capital expenditures, timing of production at our Fort Hills project,anticipated economic benefits and contributions of Fort Hills project, including, but not limited to, yield and free cash flow, our dividend policyincluding our goal of paying a sustainable dividend, our investment rating, sensitivity of our profit, EBITDA and operating expenses to oil pricesand currency exchange rates, total liquidity, free cash flow examples, potential fuel cost reduction as a result of converting to LNG for trucks,expected work and expenditures in respect of the Elk Valley Water Quality Plan, expectation that we have access to cash and credit linessufficient to meet our capital commitments, our expectation that we should complete 2015 with over $1 billion in cash, demand and marketoutlook for commodities.
These forward-looking statements involve numerous assumptions, risks and uncertainties and actual results may vary materially. Thesestatements are based on a number of assumptions, including, but not limited to, assumptions regarding general business and economicconditions, interest rates, the supply and demand for, inventories of, and the level and volatility of prices of coal, zinc, copper and gold and otherprimary metals and minerals produced by Teck as well as steel, oil, natural gas and petroleum, the outcome of engineering studies currentlyunderway in connection with Teck’s development projects, the timing of receipt of regulatory and governmental approvals for Teck’sdevelopment projects and other operations, receipt of permits to mine, costs of production at our operations and production and productivitylevels, as well as those of Teck’s competitors, power prices, market competition, the accuracy of Teck’s reserve and resource estimates(including with respect to size, grade and recoverability) and the geological, operational and price assumptions on which these are based, theassumption that our board will approve dividends, the resolution of environmental and other proceedings, our ongoing relations with ouremployees and partners and joint venturers, the availability of financing for development projects and the future operational and financialperformance of the company generally. Assumptions regarding the sensitivity of EIBTDA and operating costs to oil prices are based onassumptions regarding the amount of diesel fuel used in operations and transporting our coal products, and is also based on an assumedCanadian/U.S. dollar exchange rate of $1.20. Assumptions regarding the impact of currency exchange are based on current commodity prices.Examples regarding cash flow are based on the commodity and exchange assumptions disclosed therein. Statements regarding our potentialcash position at the end of the year are based on assumptions that no unusual transactions occur over the year and on current commodityprices. The foregoing list of assumptions is not exhaustive.
2
Forward Looking Information
Events or circumstances could cause actual results to differ materially. Factors that may cause actual results to vary include, but are not limitedto: unanticipated developments in business and economic conditions in the principal markets for Teck’s products or in the supply, demand, andprices for metals and other commodities to be produced, changes in power prices, changes in interest or currency exchange rates, inaccurategeological or metallurgical assumptions (including with respect to the size, grade and recoverability of mineral or oil and gas reserves andresources), changes in taxation laws or tax authority assessing practices, legal disputes or unanticipated outcomes of legal proceedings,unanticipated operational difficulties (including failure of plant, equipment or processes to operate in accordance with specifications orexpectations, cost escalation, unavailability of materials and equipment, government action or delays in the receipt of permits or governmentapprovals, industrial disturbances or other job action, and unanticipated events related to health, safety and environmental matters),assumptions used to generate our economic analysis, decisions made by our partners or co-venturers, political events, social unrest, lack ofavailable financing for Teck or its partners or co-venturers, and changes in general economic conditions or conditions in the financial markets.Our Fort Hills project is not controlled by us and construction, sanction and production schedules may be adjusted by our partners. Creditagencies set our credit rating. The effect of the price of oil on operating costs will be influenced by the exchange rate between Canadian andU.S. dollars.
Statements concerning future production costs or volumes are based on numerous assumptions of management regarding operating mattersand on assumptions that demand for products develops as anticipated, that customers and other counterparties perform their contractualobligations, that operating and capital plans will not be disrupted by issues such as mechanical failure, unavailability of parts and supplies,labour disturbances, interruption in transportation or utilities, adverse weather conditions, and that there are no material unanticipated variationsin the cost of energy or supplies. Statements regarding anticipated coal sales volumes and average coal prices for the quarter depend on timelyarrival of vessels and performance of our coal-loading facilities, as well as the level of spot pricing sales.
Certain of these risks are described in more detail in Teck’s annual information form available at www.sedar.com and in public filings with theSEC at www.sec.gov. Teck does not assume the obligation to revise or update these forward-looking statements after the date of this documentor to revise them to reflect the occurrence of future unanticipated events, except as may be required under applicable securities laws.
3
Agenda
Teck Overview
Commodity Market Observations
Teck Update
4
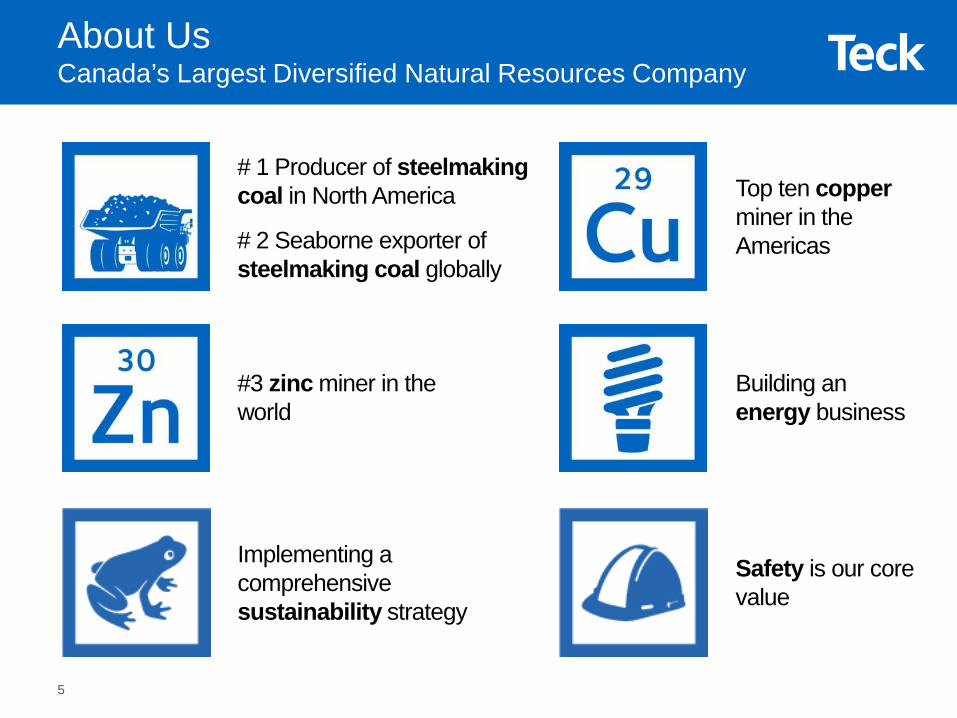
About UsCanada’s Largest Diversified Natural Resources Company
Top ten copper miner in the Americas
#3 zinc miner in the world
Building an energy business
# 1 Producer of steelmaking coal in North America
# 2 Seaborne exporter of steelmaking coal globally
Safety is our core value
Implementing a comprehensive sustainability strategy
5
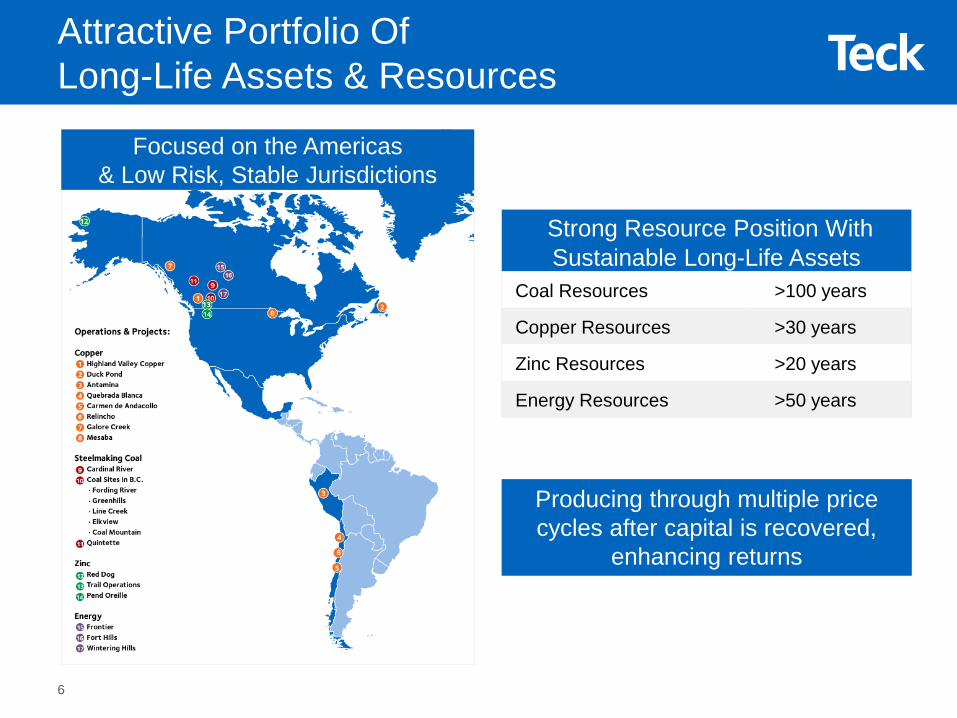
Attractive Portfolio Of Long-Life Assets & Resources
Producing through multiple price cycles after capital is recovered,
enhancing returns
Focused on the Americas & Low Risk, Stable Jurisdictions
Strong Resource Position With Sustainable Long-Life Assets
Coal Resources >100 years
Copper Resources >30 years
Zinc Resources >20 years
Energy Resources >50 years
6
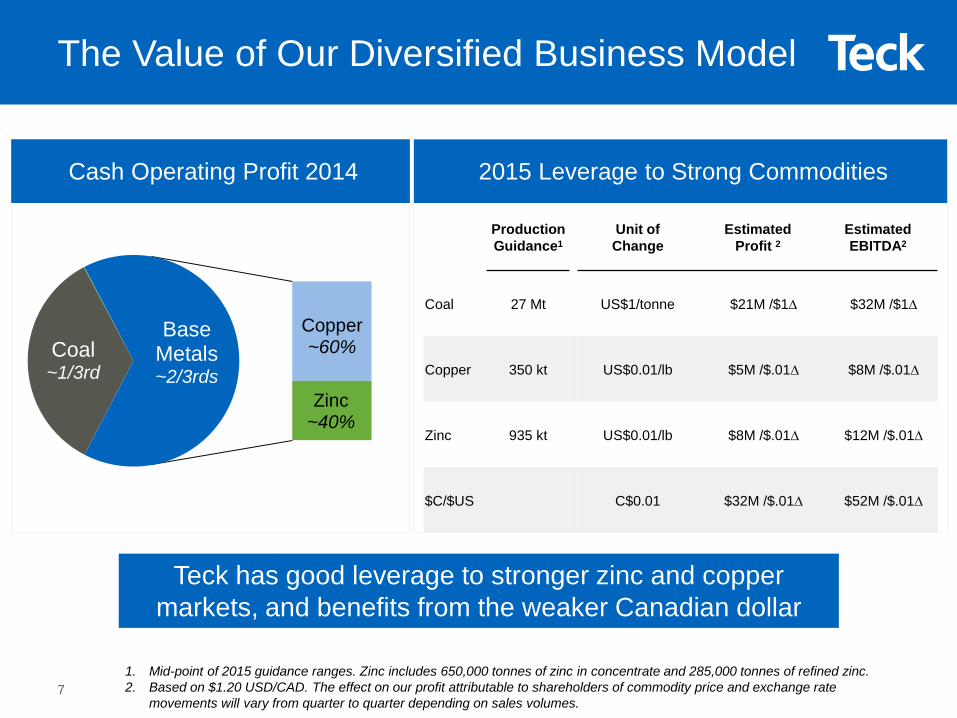
Teck has good leverage to stronger zinc and copper markets, and benefits from the weaker Canadian dollar
The Value of Our Diversified Business Model
Cash Operating Profit 2014
Coal~1/3rd
Copper~60%
Zinc~40%
Base Metals~2/3rds
Production Guidance1
Unit of Change
Estimated Profit 2
EstimatedEBITDA2
Coal 27 Mt US$1/tonne $21M /$1∆ $32M /$1∆
Copper 350 kt US$0.01/lb $5M /$.01∆ $8M /$.01∆
Zinc 935 kt US$0.01/lb $8M /$.01∆ $12M /$.01∆
$C/$US C$0.01 $32M /$.01∆ $52M /$.01∆
2015 Leverage to Strong Commodities
1. Mid-point of 2015 guidance ranges. Zinc includes 650,000 tonnes of zinc in concentrate and 285,000 tonnes of refined zinc.2. Based on $1.20 USD/CAD. The effect on our profit attributable to shareholders of commodity price and exchange rate
movements will vary from quarter to quarter depending on sales volumes.7
Agenda
Teck Overview
Commodity Market Observations
Teck Update
8
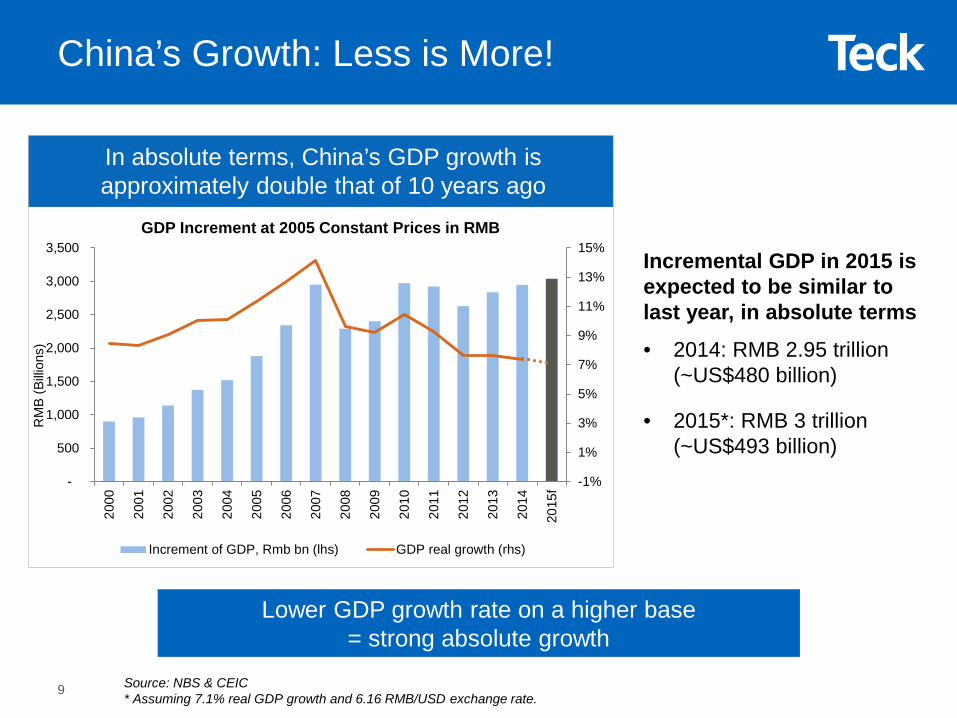
Source: NBS & CEIC* Assuming 7.1% real GDP growth and 6.16 RMB/USD exchange rate.
Lower GDP growth rate on a higher base = strong absolute growth
In absolute terms, China’s GDP growth is approximately double that of 10 years ago
China’s Growth: Less is More!
9
Incremental GDP in 2015 is expected to be similar to last year, in absolute terms
• 2014: RMB 2.95 trillion (~US$480 billion)
• 2015*: RMB 3 trillion (~US$493 billion)
-1%
1%
3%
5%
7%
9%
11%
13%
15%
-
500
1,000
1,500
2,000
2,500
3,000
3,500
200
0
200
1
200
2
200
3
200
4
200
5
200
6
200
7
200
8
200
9
201
0
201
1
201
2
201
3
201
4
2015
f
GDP Increment at 2005 Constant Prices in RMB
Increment of GDP, Rmb bn (lhs) GDP real growth (rhs)
RM
B (B
illion
s)

100
110
120
130
140
150
160
Jan-
14
Feb-
14
Mar
-14
Apr
-14
May
-14
Jun-
14
Jul-1
4
Aug
-14
Sep
-14
Oct
-14
Nov
-14
Dec
-14
Jan-
15
Feb-
15
$ / t
onne
Stronger US dollar has increased coal prices in C$ terms
Sources: Argus, Bank of Canada
• ~30 Mt cutbacks announced, slowly being implemented
• Require additional cutbacks to achieve market balance
• US coal production high end of cost curve and no currency benefit
• Continued closure announcements promising for last half of 2015
Met Coal Market Rebalancing; Higher Prices in C$ Terms
Coal Prices By CurrencyArgus FOB Australia
AUS$
CDN$
US$
10
0
100
200
300
400
500
600
700
800
900
Thou
sand
Ton
nes
0
100
200
300
400
500
600
700
800
900
Apr
-12
Jun-
12A
ug-1
2O
ct-1
2D
ec-1
2Fe
b-13
Apr
-13
Jun-
13A
ug-1
3O
ct-1
3D
ec-1
3Fe
b-14
Apr
-14
Jun-
14A
ug-1
4O
ct-1
4D
ec-1
4
Thou
sand
Ton
nes
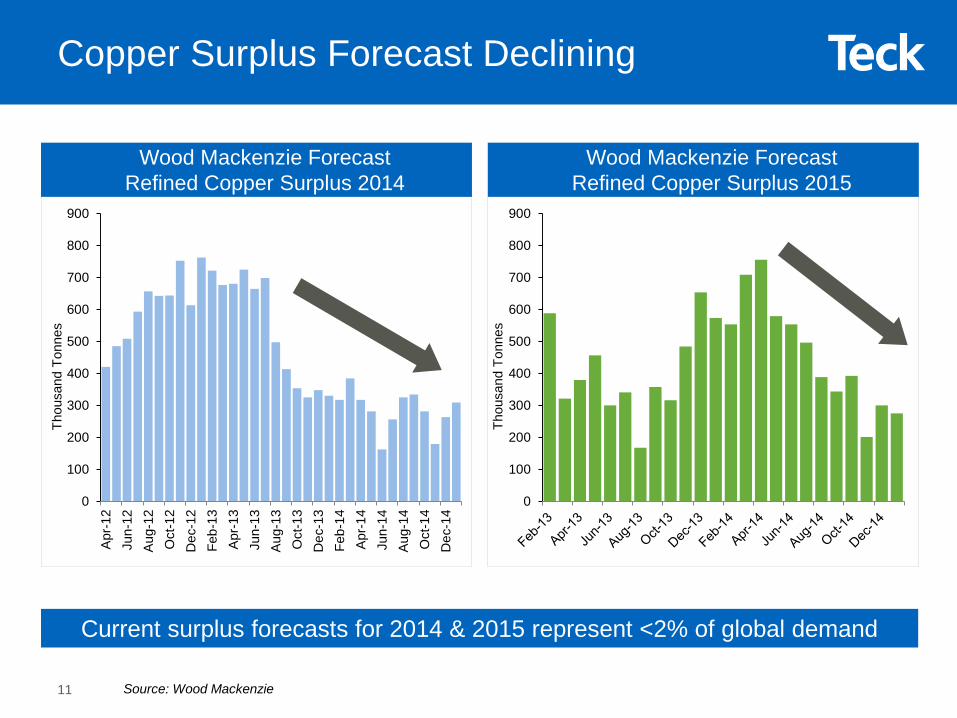
Source: Wood Mackenzie
Copper Surplus Forecast Declining
Wood Mackenzie Forecast Refined Copper Surplus 2015
Wood Mackenzie Forecast Refined Copper Surplus 2014
Current surplus forecasts for 2014 & 2015 represent <2% of global demand
11
500
600
700
800
900
1,000
1,100
1,200
0¢
20¢
40¢
60¢
80¢
100¢
120¢
Dec
-12
Jan-
13Fe
b-13
Mar
-13
Apr
-13
May
-13
Jun-
13Ju
l-13
Aug
-13
Sep
-13
Oct
-13
Nov
-13
Dec
-13
Jan-
14Fe
b-14
Mar
-14
Apr
-14
May
-14
Jun-
14Ju
l-14
Aug
-14
Sep
-14
Oct
-14
Nov
-14
Dec
-14
Jan-
15Fe
b-15
Stocks Price
0
200
400
600
800
1,000
1,200
1,400
0¢
50¢
100¢
150¢
200¢
250¢
2003
2004
2005
2006
2007
2008
2009
2010
2011
2012
2013
2014
2015
Stocks Price
US
¢/lb
thou
sand
tonn
esplotted to
Feb 16, 2015
US
¢/lb
thou
sand
tonn
es
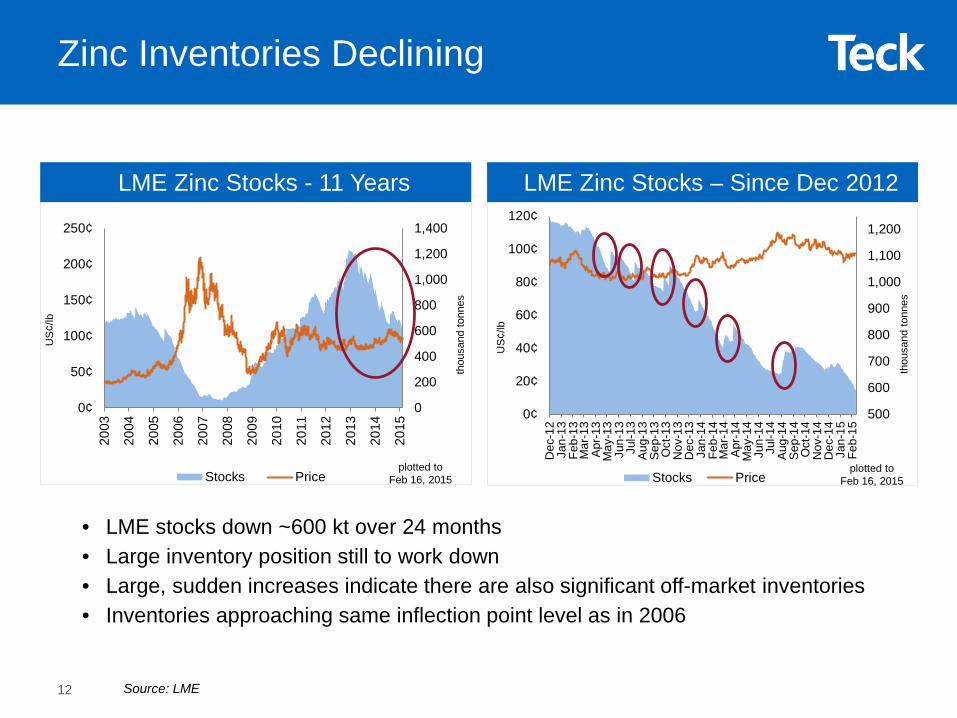
• LME stocks down ~600 kt over 24 months• Large inventory position still to work down• Large, sudden increases indicate there are also significant off-market inventories • Inventories approaching same inflection point level as in 2006
LME Zinc Stocks – Since Dec 2012
plotted to Feb 16, 2015
LME Zinc Stocks - 11 Years
Zinc Inventories Declining
Source: LME12
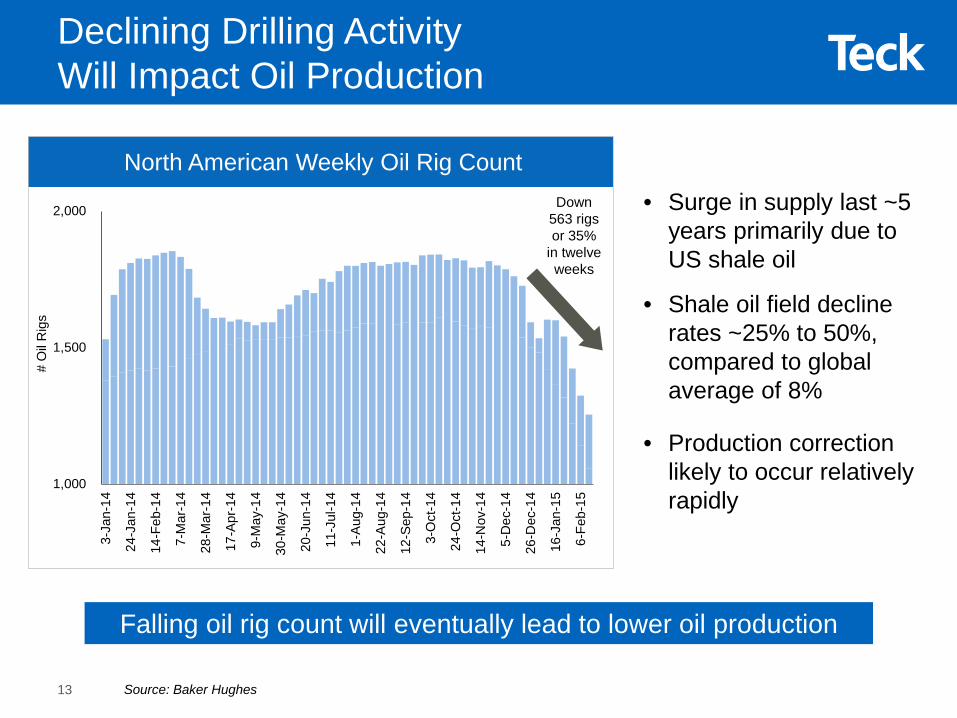
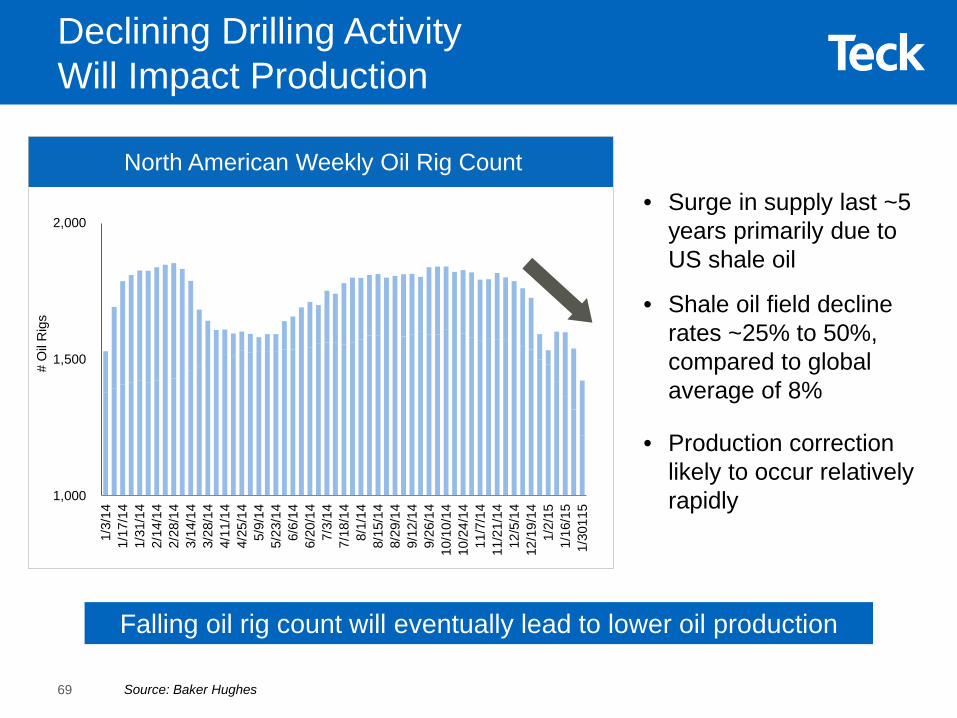
Source: Baker Hughes
Falling oil rig count will eventually lead to lower oil production
North American Weekly Oil Rig Count
Declining Drilling Activity Will Impact Oil Production
13
• Surge in supply last ~5 years primarily due to US shale oil
• Shale oil field decline rates ~25% to 50%, compared to global average of 8%
• Production correction likely to occur relatively rapidly
1,000
1,500
2,000
3-Ja
n-14
24-J
an-1
4
14-F
eb-1
4
7-M
ar-1
4
28-M
ar-1
4
17-A
pr-1
4
9-M
ay-1
4
30-M
ay-1
4
20-J
un-1
4
11-J
ul-1
4
1-A
ug-1
4
22-A
ug-1
4
12-S
ep-1
4
3-O
ct-1
4
24-O
ct-1
4
14-N
ov-1
4
5-D
ec-1
4
26-D
ec-1
4
16-J
an-1
5
6-Fe
b-15
# O
il R
igs
Down 563 rigs or 35%
in twelve weeks
Agenda
Teck Overview
Commodity Market Observations
Teck Update
14
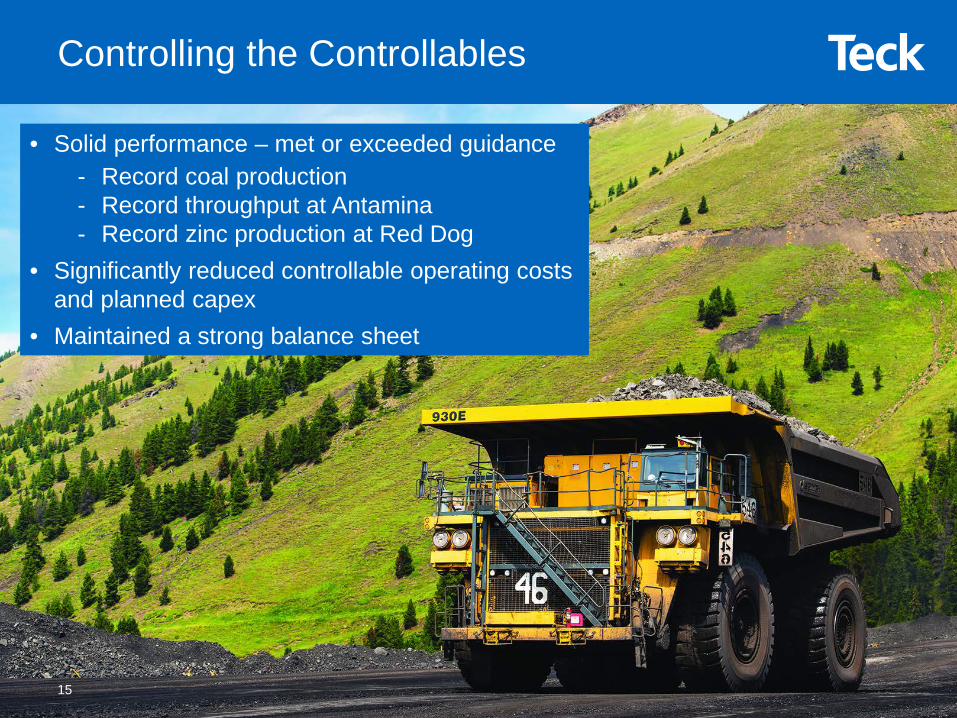
Controlling the Controllables
• Solid performance – met or exceeded guidance- Record coal production- Record throughput at Antamina- Record zinc production at Red Dog
• Significantly reduced controllable operating costs and planned capex
• Maintained a strong balance sheet
15
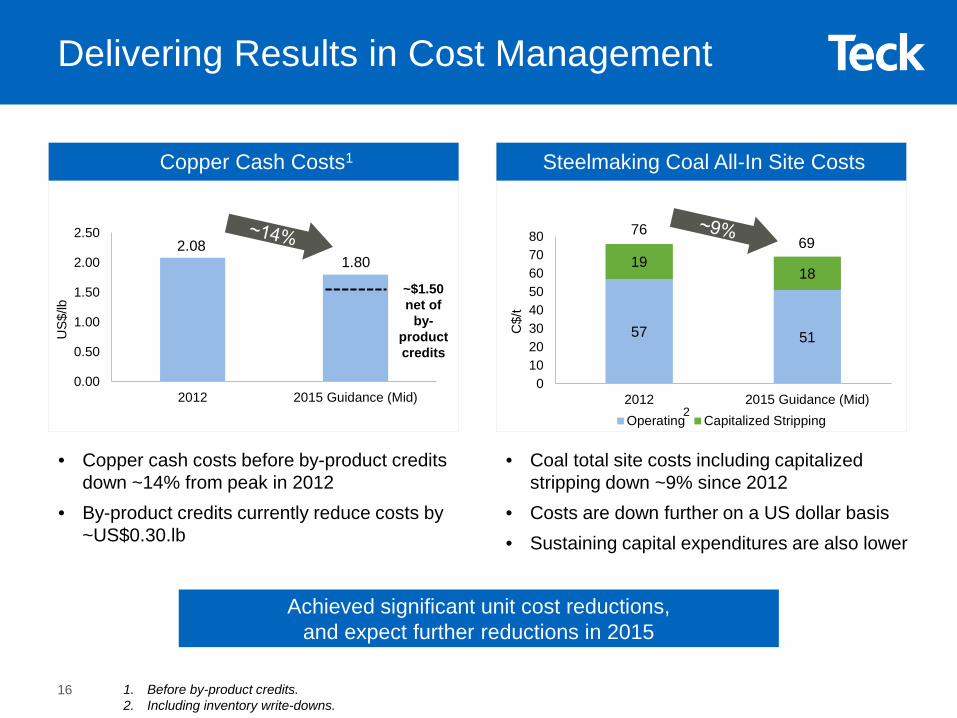
57 51
1918
01020304050607080
2012 2015 Guidance (Mid)Operating Capitalized Stripping
C$/
t
0.00
0.50
1.00
1.50
2.00
2.50
2012 2015 Guidance (Mid)
US$
/lb
Copper Cash Costs1
Delivering Results in Cost Management
1. Before by-product credits.2. Including inventory write-downs.
2.081.80
7669
Steelmaking Coal All-In Site Costs
• Copper cash costs before by-product credits down ~14% from peak in 2012
• By-product credits currently reduce costs by ~US$0.30.lb
• Coal total site costs including capitalized stripping down ~9% since 2012
• Costs are down further on a US dollar basis• Sustaining capital expenditures are also lower
Achieved significant unit cost reductions, and expect further reductions in 2015
2
~$1.50 net of
by-product credits
16

Fort Hills’ Economics Robust1
Source: Teck Resources Limited1. Estimates are based on exchange rates as shown, expected bitumen netbacks, and operating costs of C$25 per barrel, including
sustaining capital of C$3-5 per barrel. 2. Per barrel of bitumen.3. Go-forward capital is the go-forward amount from the date of the Fort Hills sanction decision (October 30, 2013), denominated in
Canadian dollars and on a fully-escalated basis. 4. Pre-tax free cash flow yield during capital recovery period.
The Fort Hills project is expected to have significant free cash flow yield across a range of WTI prices
Fort Hills Free Cash Flow Yield4
Sensitivity to WTI PricePotential Contribution
from Fort Hills
$70 WTI & $0.80
CAD/USD
$90 WTI & $0.90
CAD/USD
Teck’s share of annual production (36,000 bpd) 13 Mbpa 13 Mbpa
Estimated netback2 ~$54/bbl ~$63/bbl
Estimated operating margin2 ~$29/bbl ~$38/bbl
Alberta oil royalty – Phase 1 (prior to capital recovery) 2 ~$2/bbl ~$4/bbl
Estimated net margin2 ~$26/bbl ~$34/bbl
Annual pre-tax cash flow ~$350 M ~$444 M
Teck’s share of go-forward capex3 ~$2,940 M ~$2,940 M
Free cash flow yield4 ~12% ~15%
0%
5%
10%
15%
20%
25%
60 70 80 90 100 110 120
Free
Cas
h Fl
ow Y
ield
WTI $/bbl
$0.90 CAD/USD
$0.80 CAD/USD
17
$0
$1,000
$2,000
$3,000
2014
2015
2016
2017
2018
2019
2020
2021
2022
2023
2024
2025
2026
2027
2028
2029
2030
2031
2032
2033
2034
2035
2036
2037
2038
2039
2040
2041
2042
2043
US$
M
Cash position Debt Maturity
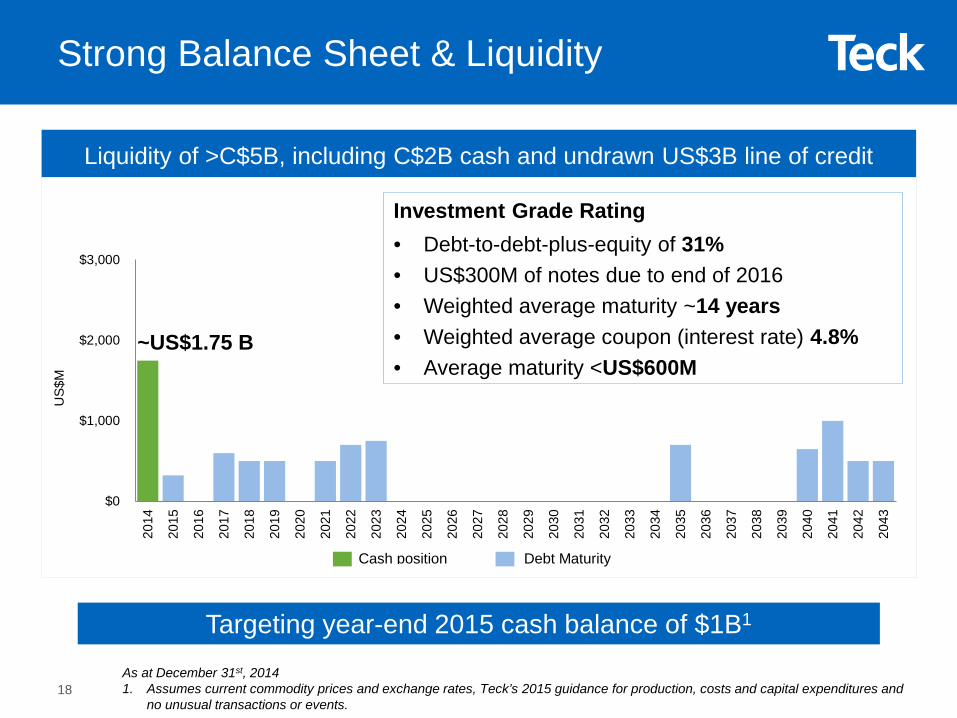
Liquidity of >C$5B, including C$2B cash and undrawn US$3B line of credit
~US$1.75 B
18As at December 31st, 20141. Assumes current commodity prices and exchange rates, Teck’s 2015 guidance for production, costs and capital expenditures and
no unusual transactions or events.
Strong Balance Sheet & Liquidity
Investment Grade Rating• Debt-to-debt-plus-equity of 31%• US$300M of notes due to end of 2016• Weighted average maturity ~14 years• Weighted average coupon (interest rate) 4.8%• Average maturity <US$600M
Targeting year-end 2015 cash balance of $1B1
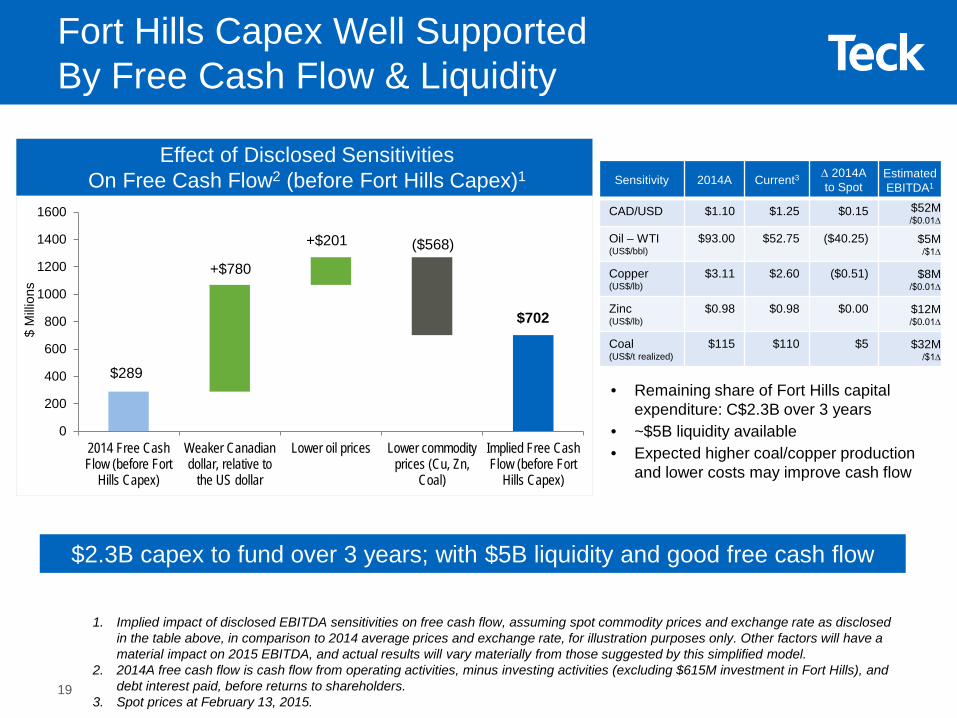
Fort Hills Capex Well Supported By Free Cash Flow & Liquidity
0
200
400
600
800
1000
1200
1400
1600
2014 Free CashFlow (before Fort
Hills Capex)
Weaker Canadiandollar, relative to
the US dollar
Lower oil prices Lower commodityprices (Cu, Zn,
Coal)
Implied Free CashFlow (before Fort
Hills Capex)
$ M
illion
s
$289
+$201 ($568)
$702
+$780
Effect of Disclosed Sensitivities On Free Cash Flow2 (before Fort Hills Capex)1
$2.3B capex to fund over 3 years; with $5B liquidity and good free cash flow
1. Implied impact of disclosed EBITDA sensitivities on free cash flow, assuming spot commodity prices and exchange rate as disclosed in the table above, in comparison to 2014 average prices and exchange rate, for illustration purposes only. Other factors will have a material impact on 2015 EBITDA, and actual results will vary materially from those suggested by this simplified model.
2. 2014A free cash flow is cash flow from operating activities, minus investing activities (excluding $615M investment in Fort Hills), and debt interest paid, before returns to shareholders.
3. Spot prices at February 13, 2015.
Sensitivity 2014A Current3 ∆ 2014A to Spot
Estimated EBITDA1
CAD/USD $1.10 $1.25 $0.15 $52M /$0.01∆
Oil – WTI (US$/bbl)
$93.00 $52.75 ($40.25) $5M /$1∆
Copper (US$/lb)
$3.11 $2.60 ($0.51) $8M /$0.01∆
Zinc (US$/lb)
$0.98 $0.98 $0.00 $12M/$0.01∆
Coal (US$/t realized)
$115 $110 $5 $32M /$1∆
• Remaining share of Fort Hills capital expenditure: C$2.3B over 3 years
• ~$5B liquidity available• Expected higher coal/copper production
and lower costs may improve cash flow
19
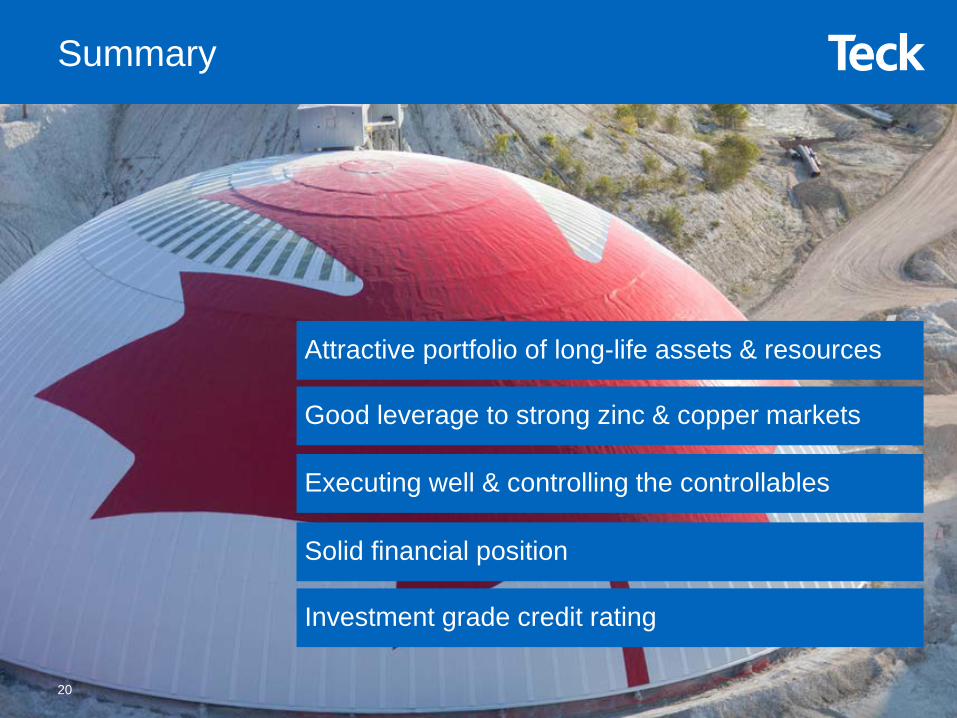
Summary
Attractive portfolio of long-life assets & resources
Good leverage to strong zinc & copper markets
Executing well & controlling the controllables
Solid financial position
Investment grade credit rating
20
February 24, 2015

Additional Information
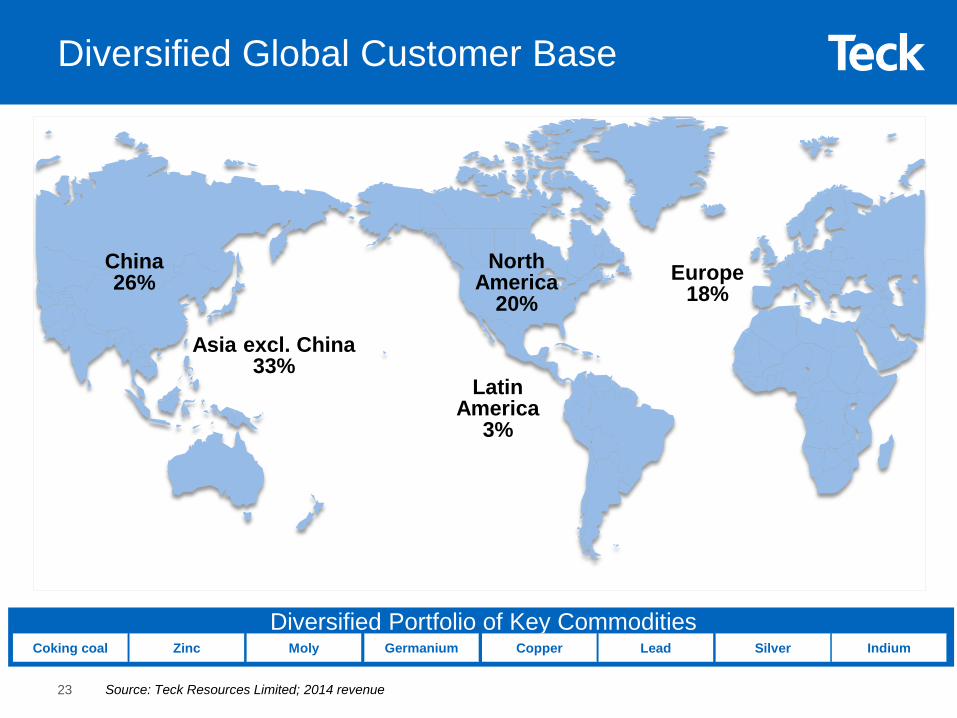
Diversified Portfolio of Key Commodities
NorthAmerica
20%Europe
18%
LatinAmerica
3%
China26%
Asia excl. China33%
Source: Teck Resources Limited; 2014 revenue23
Diversified Global Customer Base
Coking coal CopperZinc LeadMoly SilverGermanium Indium
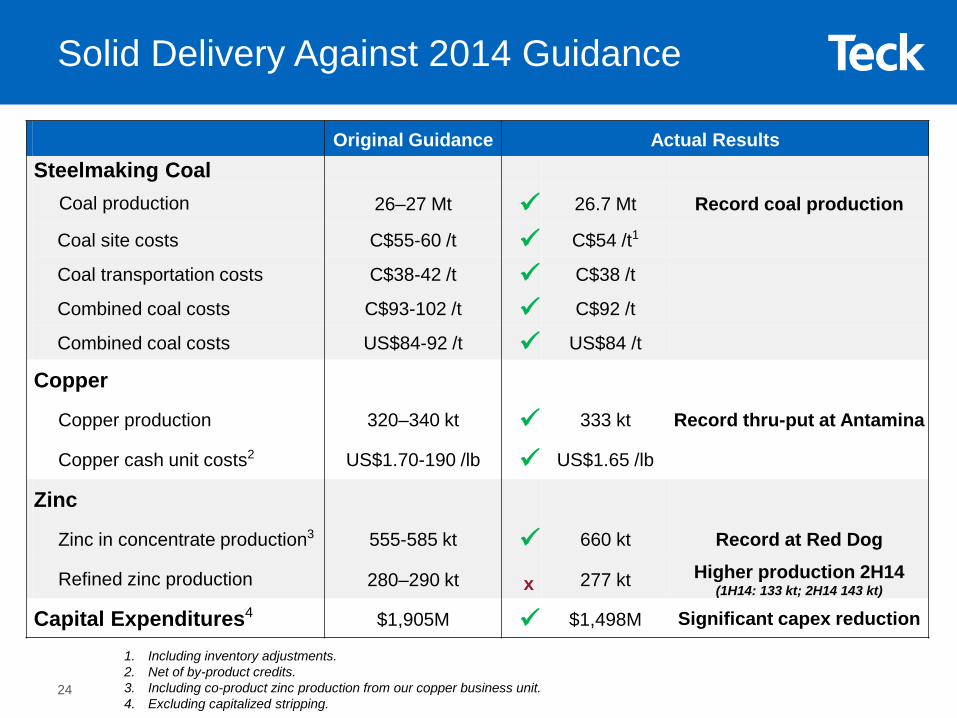
Original Guidance Actual ResultsSteelmaking Coal
Coal production 26–27 Mt 26.7 Mt Record coal production
Coal site costs C$55-60 /t C$54 /t1
Coal transportation costs C$38-42 /t C$38 /t
Combined coal costs C$93-102 /t C$92 /t
Combined coal costs US$84-92 /t US$84 /t
Copper
Copper production 320–340 kt 333 kt Record thru-put at Antamina
Copper cash unit costs2 US$1.70-190 /lb US$1.65 /lb
Zinc
Zinc in concentrate production3 555-585 kt 660 kt Record at Red Dog
Refined zinc production 280–290 kt x 277 kt Higher production 2H14(1H14: 133 kt; 2H14 143 kt)
Capital Expenditures4 $1,905M $1,498M Significant capex reduction
Solid Delivery Against 2014 Guidance
1. Including inventory adjustments.2. Net of by-product credits.3. Including co-product zinc production from our copper business unit.4. Excluding capitalized stripping.
24
Actual 2014 2015 GuidanceSteelmaking Coal
Coal production 26.7 Mt 26.5-27.5 MtCoal site costs C$54 /t1 C$49-53 /tCoal transportation costs C$38 /t C$37-40 /tCombined coal costs C$92 /t C$86-93 /tCombined coal costs US$84 ~US$69-74 /t2
CopperCopper production 333 kt 340-360 ktCopper cash unit costs3 US$1.65 /lb US$1.45-1.55 /lb
ZincZinc in concentrate production4 660 kt 635-665 ktRefined zinc production 277 kt 280–290 kt
2015 Production & Site Cost Guidance
1. Including inventory adjustments.2. At $1.25 CAD/USD.3. Net of by-product credits.4. Including co-product zinc production from our copper business unit.
25
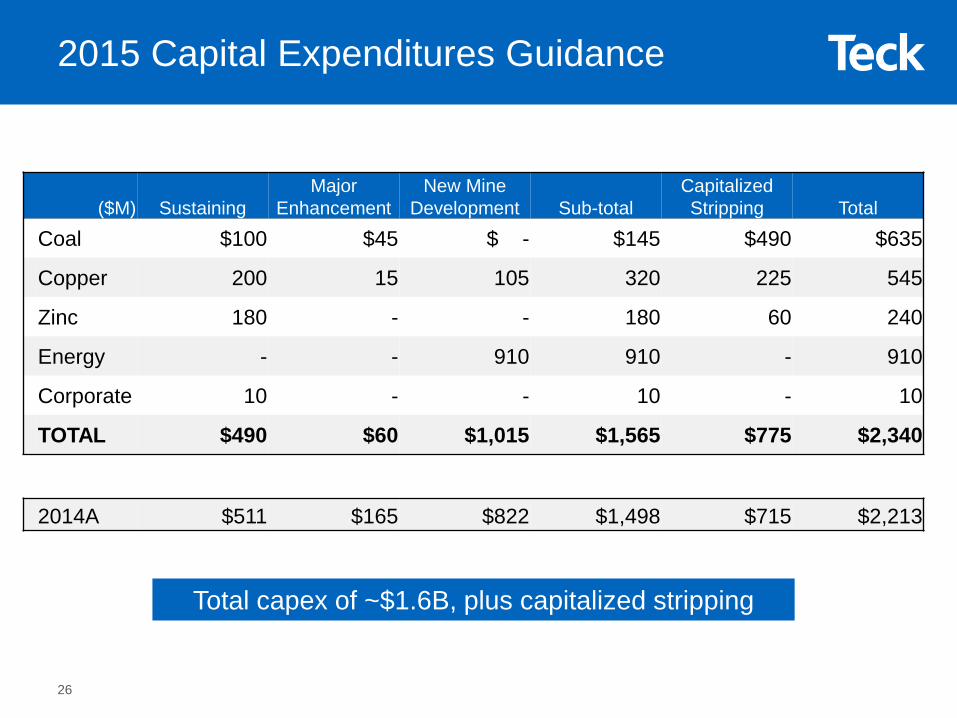
($M) SustainingMajor
EnhancementNew Mine
Development Sub-totalCapitalized Stripping Total
Coal $100 $45 $ - $145 $490 $635
Copper 200 15 105 320 225 545
Zinc 180 - - 180 60 240
Energy - - 910 910 - 910
Corporate 10 - - 10 - 10
TOTAL $490 $60 $1,015 $1,565 $775 $2,340
Total capex of ~$1.6B, plus capitalized stripping
2014A $511 $165 $822 $1,498 $715 $2,213
2015 Capital Expenditures Guidance
26

Low oil price benefits Teck overall in the near-term• Reduces operating costs by hundreds of millions of dollars annually1
• Accompanied weaker Canadian dollar improves EBITDA by hundreds of millions of dollars annually2
Reduces budget and schedule pressure on the Fort Hills project• Reduces capex and drilling activity by the sector, which eases
pressure on skilled labour and contractors• Reduces competition for pipeline capacity
Forces cutbacks in oil production and exploration• Starts the correction to higher long-term oil prices, due to the sector’s
decline rates and cuts to capex /drilling activity
Provides positive macro-economic stimulus • Drives additional metal consumption, benefiting Teck’s base metals
businesses
Significant Benefits from Low Oil Prices
1. Each US$1/bbl change in oil price impacts our operating costs by ~$5M on an annual basis, based on $1.20 CAD/USD.2. Each $0.01 change in the CAD/USD exchange rate impacts our EBITDA by ~$52M on an annual basis.27
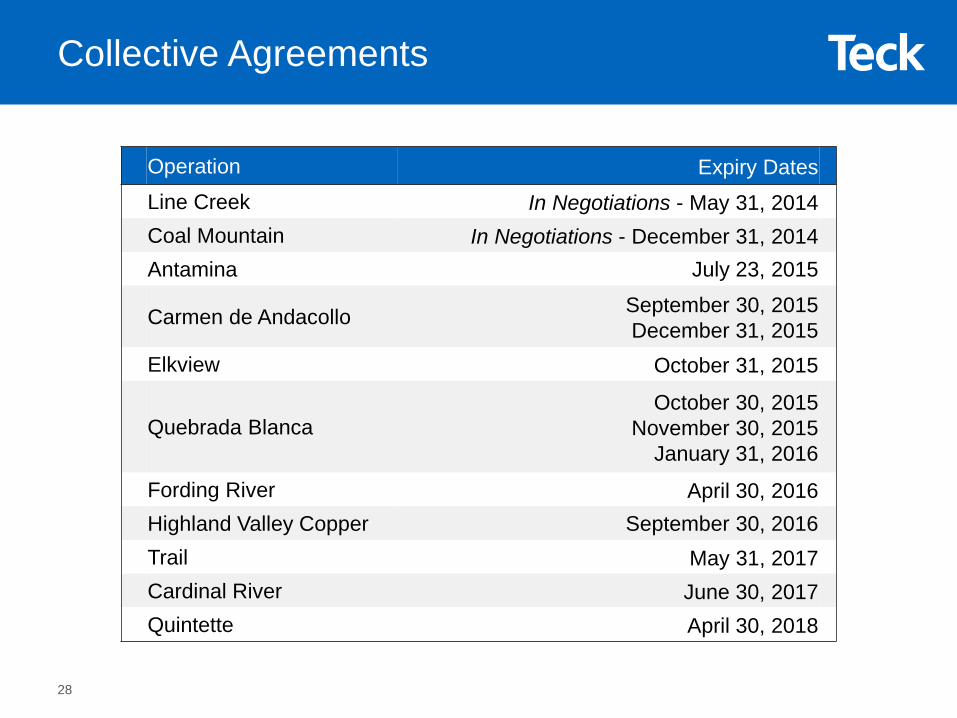
Operation Expiry DatesLine Creek In Negotiations - May 31, 2014Coal Mountain In Negotiations - December 31, 2014Antamina July 23, 2015
Carmen de Andacollo September 30, 2015December 31, 2015
Elkview October 31, 2015
Quebrada BlancaOctober 30, 2015
November 30, 2015January 31, 2016
Fording River April 30, 2016Highland Valley Copper September 30, 2016Trail May 31, 2017Cardinal River June 30, 2017Quintette April 30, 2018
Collective Agreements
28
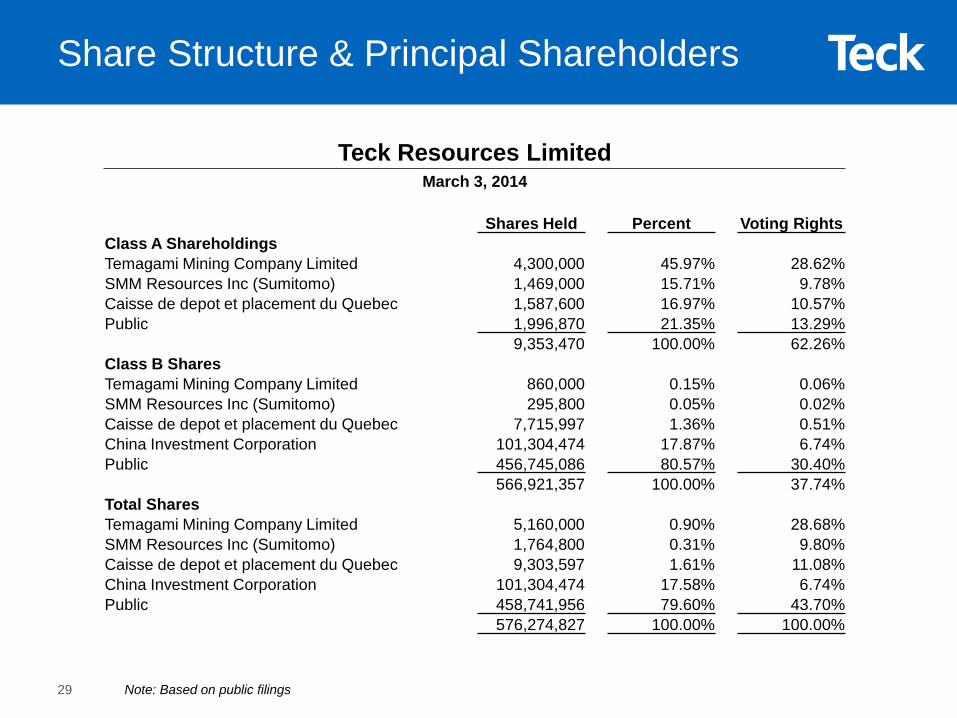
Note: Based on public filings
Teck Resources LimitedMarch 3, 2014
Shares Held Percent Voting RightsClass A ShareholdingsTemagami Mining Company Limited 4,300,000 45.97% 28.62%SMM Resources Inc (Sumitomo) 1,469,000 15.71% 9.78%Caisse de depot et placement du Quebec 1,587,600 16.97% 10.57%Public 1,996,870 21.35% 13.29%
9,353,470 100.00% 62.26%Class B SharesTemagami Mining Company Limited 860,000 0.15% 0.06%SMM Resources Inc (Sumitomo) 295,800 0.05% 0.02%Caisse de depot et placement du Quebec 7,715,997 1.36% 0.51%China Investment Corporation 101,304,474 17.87% 6.74%Public 456,745,086 80.57% 30.40%
566,921,357 100.00% 37.74%Total SharesTemagami Mining Company Limited 5,160,000 0.90% 28.68%SMM Resources Inc (Sumitomo) 1,764,800 0.31% 9.80%Caisse de depot et placement du Quebec 9,303,597 1.61% 11.08%China Investment Corporation 101,304,474 17.58% 6.74%Public 458,741,956 79.60% 43.70%
576,274,827 100.00% 100.00%
Share Structure & Principal Shareholders
29
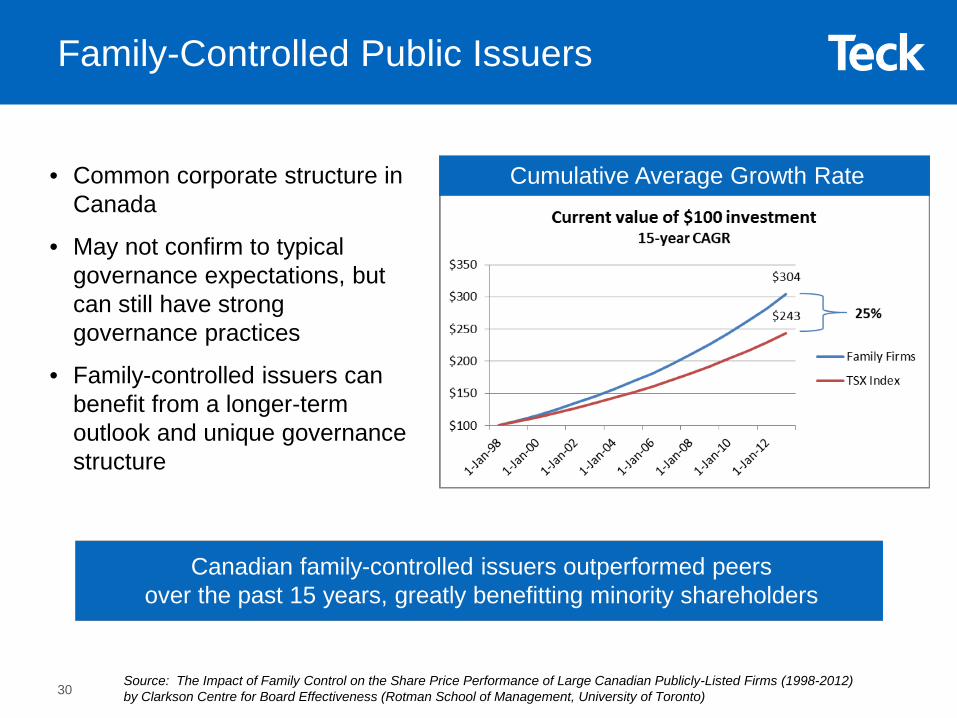
• Common corporate structure in Canada
• May not confirm to typical governance expectations, but can still have strong governance practices
• Family-controlled issuers can benefit from a longer-term outlook and unique governance structure
Source: The Impact of Family Control on the Share Price Performance of Large Canadian Publicly-Listed Firms (1998-2012) by Clarkson Centre for Board Effectiveness (Rotman School of Management, University of Toronto)
Canadian family-controlled issuers outperformed peers over the past 15 years, greatly benefitting minority shareholders
Cumulative Average Growth Rate
Family-Controlled Public Issuers
30
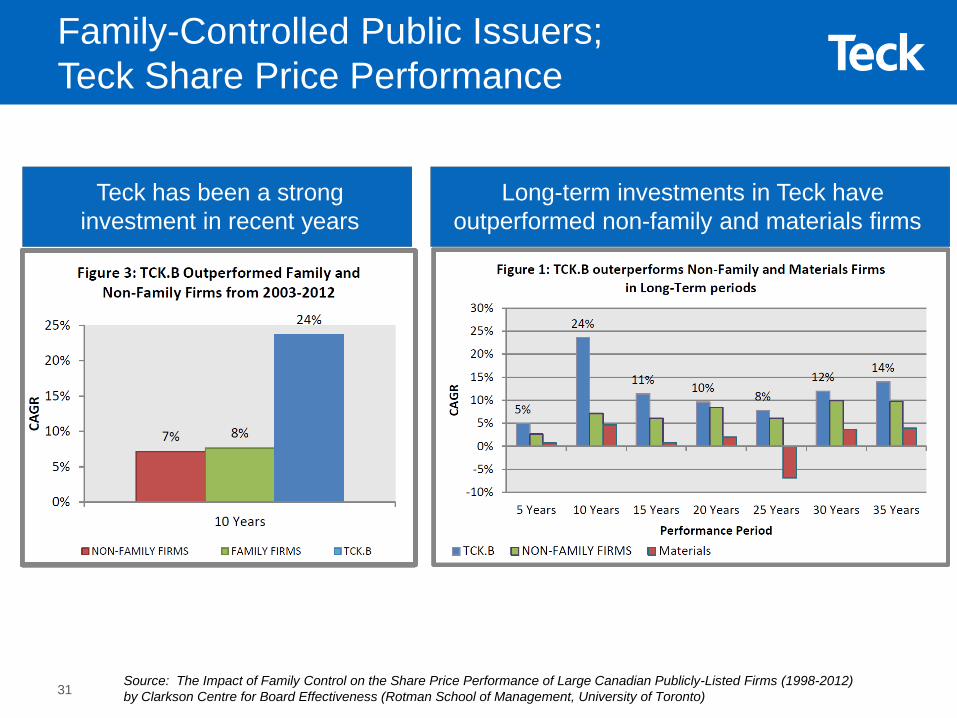
Teck has been a strong investment in recent years
Long-term investments in Teck have outperformed non-family and materials firms
Family-Controlled Public Issuers;Teck Share Price Performance
Source: The Impact of Family Control on the Share Price Performance of Large Canadian Publicly-Listed Firms (1998-2012) by Clarkson Centre for Board Effectiveness (Rotman School of Management, University of Toronto)31
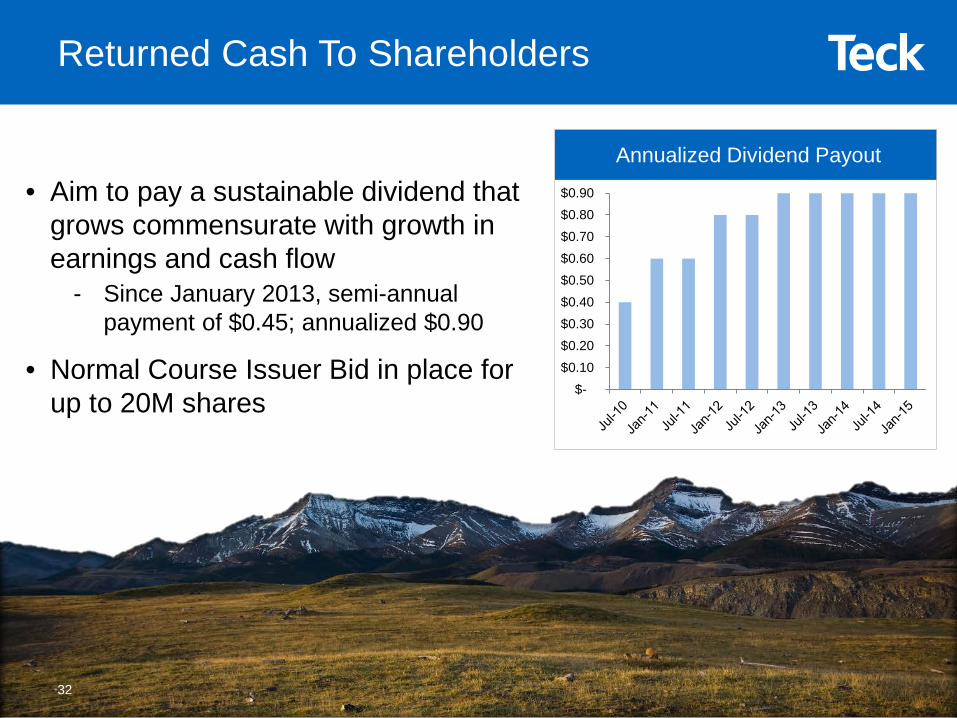
Annualized Dividend Payout
• Aim to pay a sustainable dividend that grows commensurate with growth in earnings and cash flow
- Since January 2013, semi-annual payment of $0.45; annualized $0.90
• Normal Course Issuer Bid in place for up to 20M shares
32
Returned Cash To Shareholders
$- $0.10 $0.20 $0.30 $0.40 $0.50 $0.60 $0.70 $0.80 $0.90

Economic Outlook
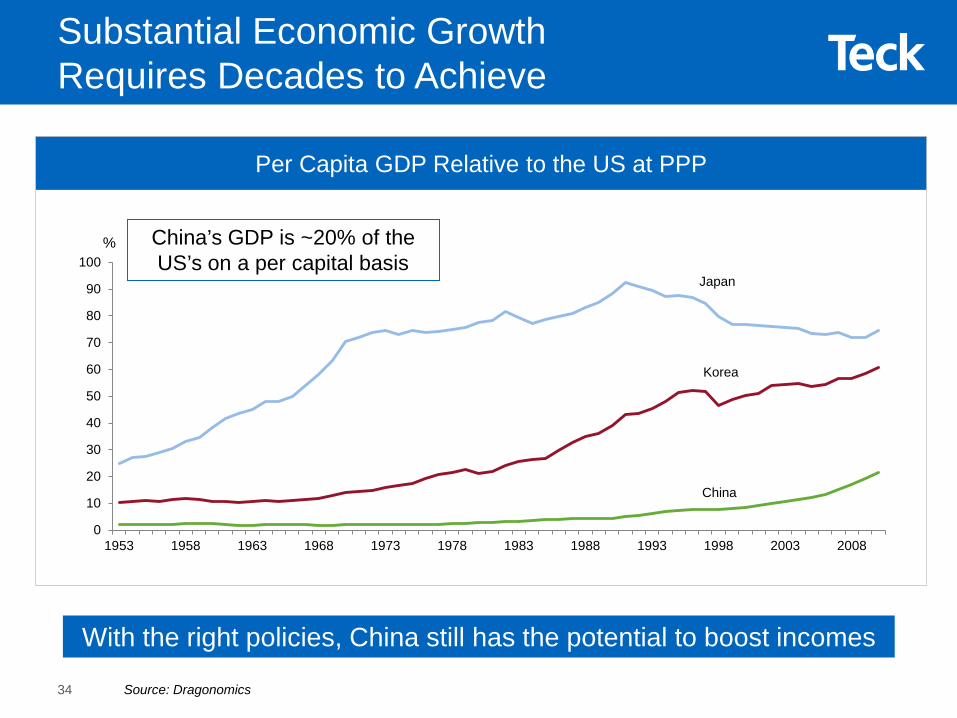
Source: Dragonomics
With the right policies, China still has the potential to boost incomes
China’s GDP is ~20% of the US’s on a per capital basis
Substantial Economic Growth Requires Decades to Achieve
Per Capita GDP Relative to the US at PPP
China
Japan
Korea
0
10
20
30
40
50
60
70
80
90
100
1953 1958 1963 1968 1973 1978 1983 1988 1993 1998 2003 2008
%
34
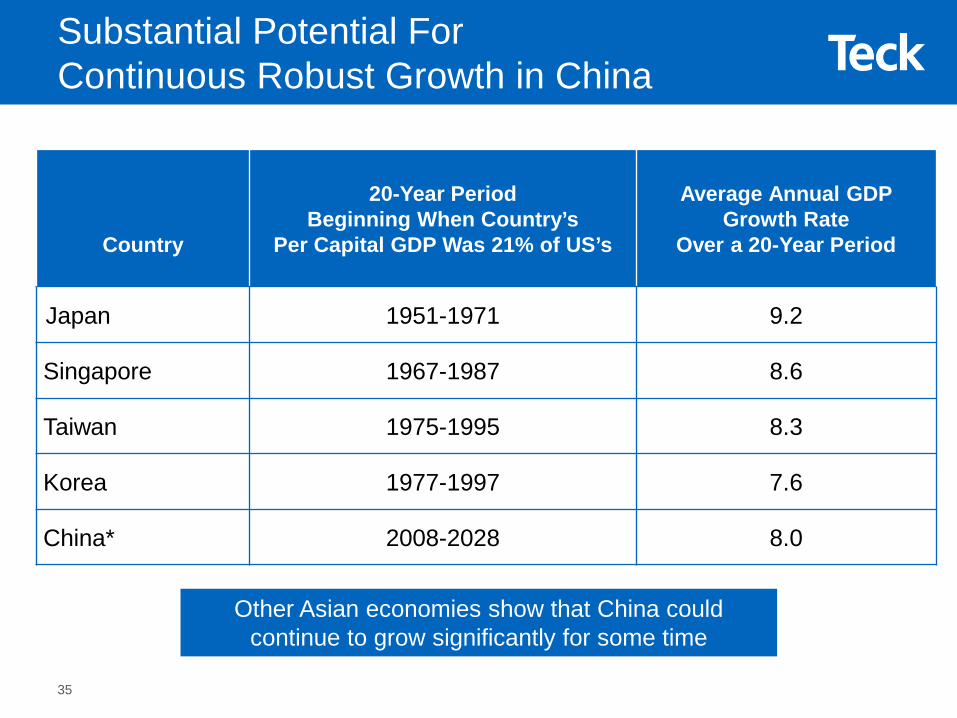
Country
20-Year Period Beginning When Country’s
Per Capital GDP Was 21% of US’s
Average Annual GDP Growth Rate
Over a 20-Year Period
Japan 1951-1971 9.2
Singapore 1967-1987 8.6
Taiwan 1975-1995 8.3
Korea 1977-1997 7.6
China* 2008-2028 8.0
Other Asian economies show that China could continue to grow significantly for some time
Substantial Potential For Continuous Robust Growth in China
35
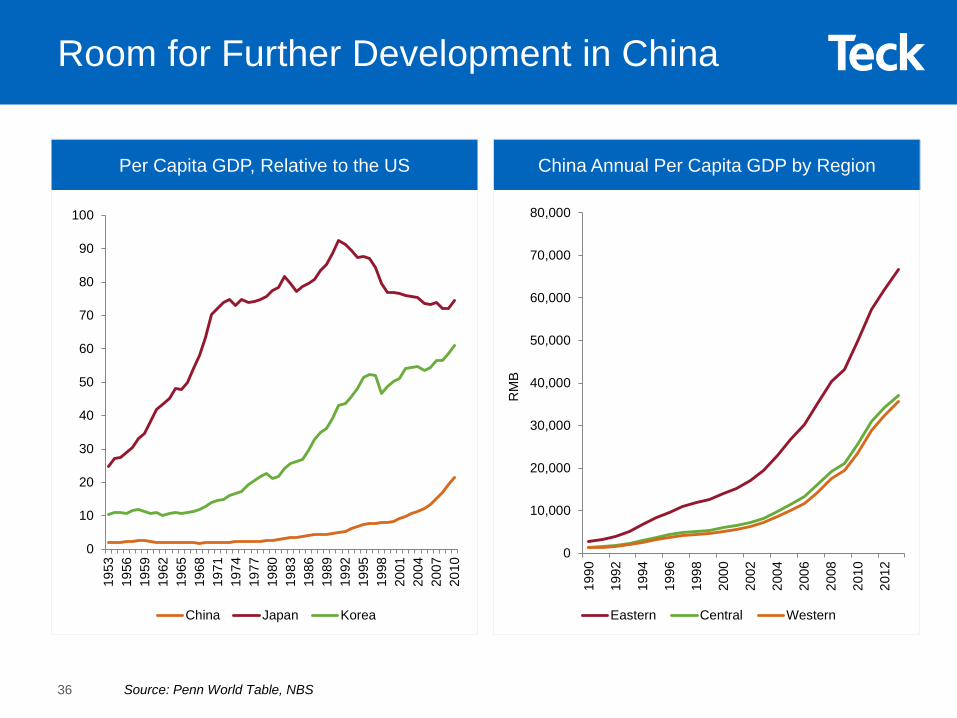
Room for Further Development in China
0
10
20
30
40
50
60
70
80
90
100
1953
1956
1959
1962
1965
1968
1971
1974
1977
1980
1983
1986
1989
1992
1995
1998
2001
2004
2007
2010
China Japan Korea
0
10,000
20,000
30,000
40,000
50,000
60,000
70,000
80,000
199
0
199
2
199
4
199
6
199
8
200
0
200
2
200
4
200
6
200
8
201
0
201
2
Eastern Central Western
RM
B
China Annual Per Capita GDP by RegionPer Capita GDP, Relative to the US
Source: Penn World Table, NBS36
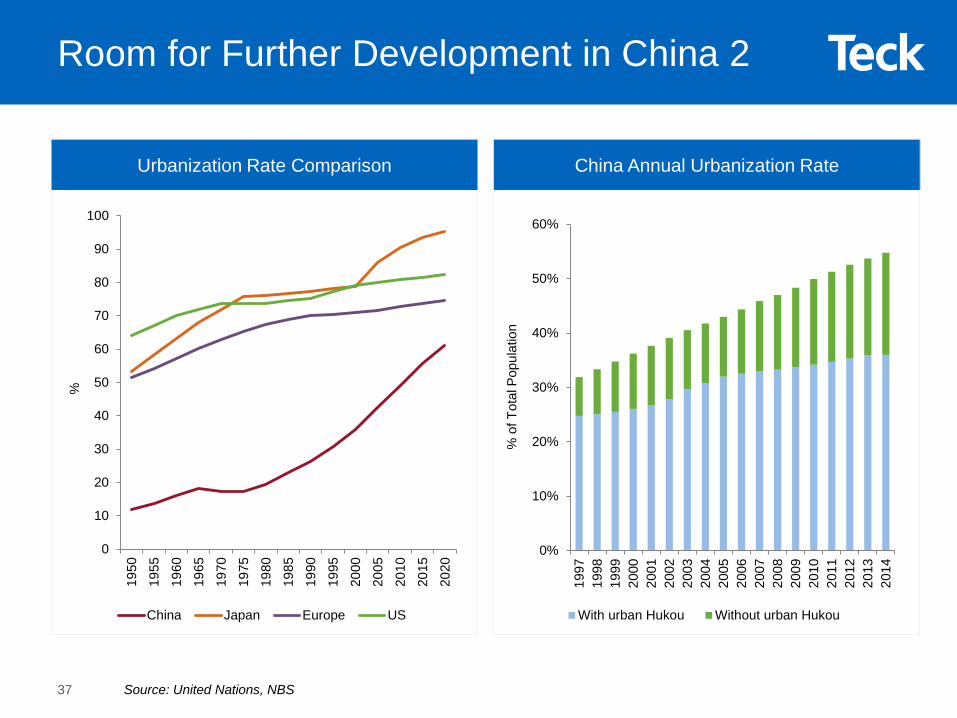
Room for Further Development in China 2
0%
10%
20%
30%
40%
50%
60%
199
7 1
998
199
9 2
000
200
1 2
002
200
3 2
004
200
5 2
006
200
7 2
008
200
9 2
010
201
1 2
012
201
3 2
014
With urban Hukou Without urban Hukou
% o
f Tot
al P
opul
atio
n
0
10
20
30
40
50
60
70
80
90
100
1950
1955
1960
1965
1970
1975
1980
1985
1990
1995
2000
2005
2010
2015
2020
China Japan Europe US
%
China Annual Urbanization RateUrbanization Rate Comparison
Source: United Nations, NBS37
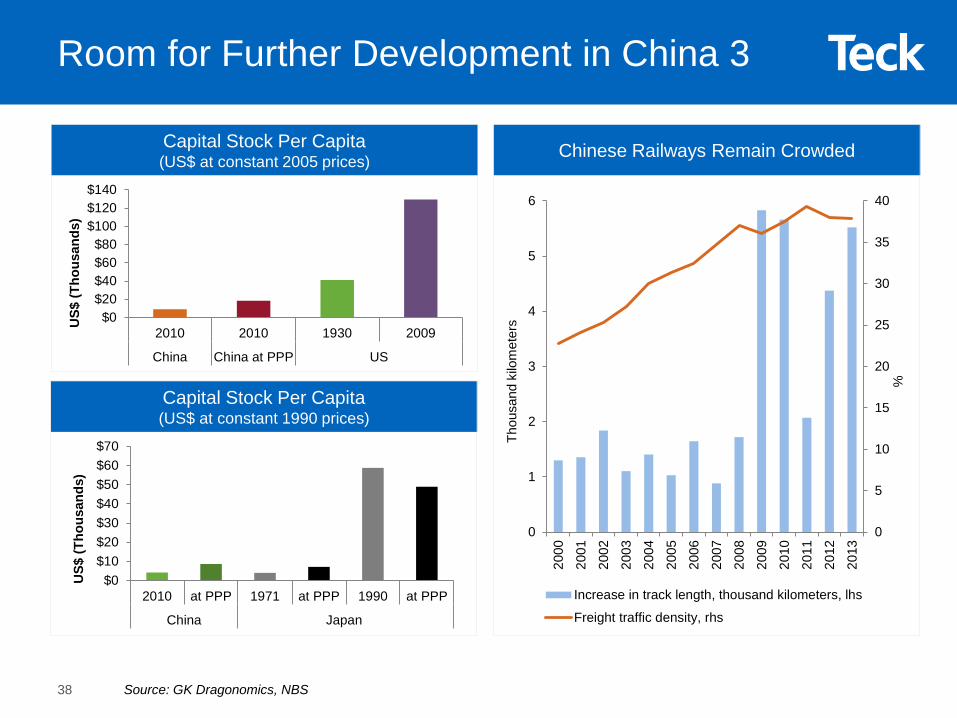
Room for Further Development in China 3
0
5
10
15
20
25
30
35
40
0
1
2
3
4
5
6
200
0
200
1
200
2
200
3
200
4
200
5
200
6
200
7
200
8
200
9
201
0
201
1
201
2
201
3
Increase in track length, thousand kilometers, lhs
Freight traffic density, rhs
Thou
sand
kilo
met
ers
%
$0$20$40$60$80
$100$120$140
2010 2010 1930 2009
China China at PPP US
US$
(Tho
usan
ds)
$0$10$20$30$40$50$60$70
2010 at PPP 1971 at PPP 1990 at PPP
China Japan
US$
(Tho
usan
ds)
Source: GK Dragonomics, NBS
Chinese Railways Remain CrowdedCapital Stock Per Capita (US$ at constant 2005 prices)
Capital Stock Per Capita (US$ at constant 1990 prices)
38

• Despite China’s rapid urbanization over the past decade (to 54.77% in 2014), it is still lower than the Western world who are all ~80%- China’s current urbanization rate is
comparable to Japan’s in the 1950s- China was previously a drag on Asia’s
urbanization statistics. Today, it is the driving force, with room for further urbanization
• India’s urbanization was 32% in 2013, up from 26% in 1990- It is expected to grow to 33% by 2015,
35% by 2020 and 37% by 2025
Global UrbanizationChina and India Leading the Way
0%
10%
20%
30%
40%
50%
60%
70%
80%
90%
1950
1955
1960
1965
1970
1975
1980
1985
1990
1995
2000
2005
2010
2015
2020
2025
2030
2035
2040
2045
2050
China India Asia
Europe S.America N.America
Urbanization Rates
Source: United Nations, World Bank39
Steelmaking CoalBusiness Unit & Markets
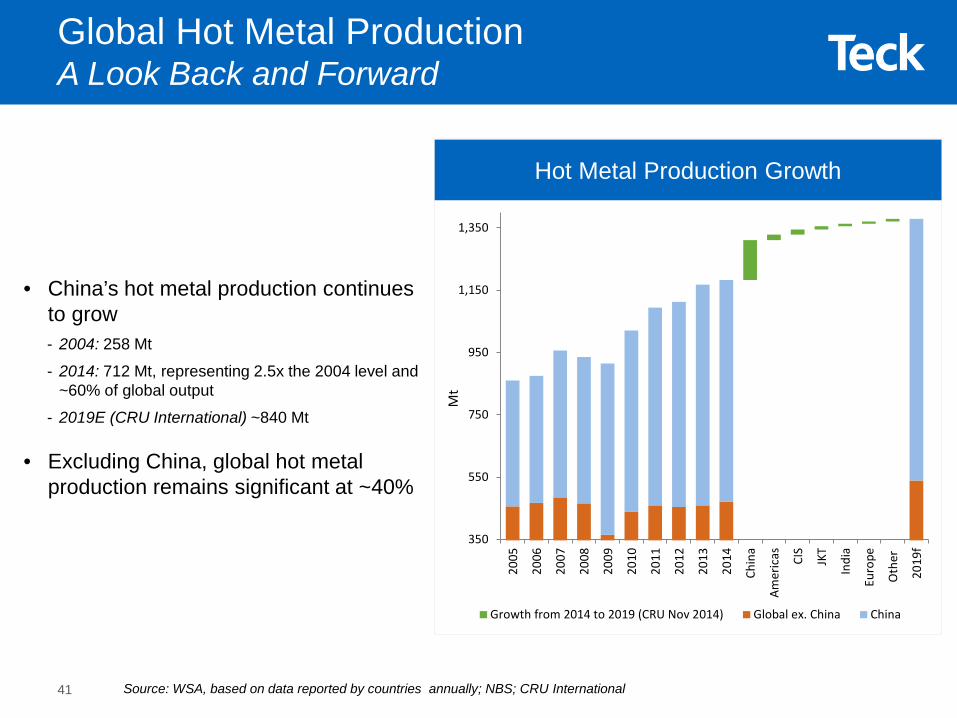
• China’s hot metal production continues to grow- 2004: 258 Mt
- 2014: 712 Mt, representing 2.5x the 2004 level and ~60% of global output
- 2019E (CRU International) ~840 Mt
• Excluding China, global hot metal production remains significant at ~40%
Hot Metal Production Growth
Source: WSA, based on data reported by countries annually; NBS; CRU International
Global Hot Metal ProductionA Look Back and Forward
350
550
750
950
1,150
1,350
2005
2006
2007
2008
2009
2010
2011
2012
2013
2014
Chin
a
Amer
icas CIS
JKT
Indi
a
Euro
pe
Oth
er
2019
f
Growth from 2014 to 2019 (CRU Nov 2014) Global ex. China China
Mt
41
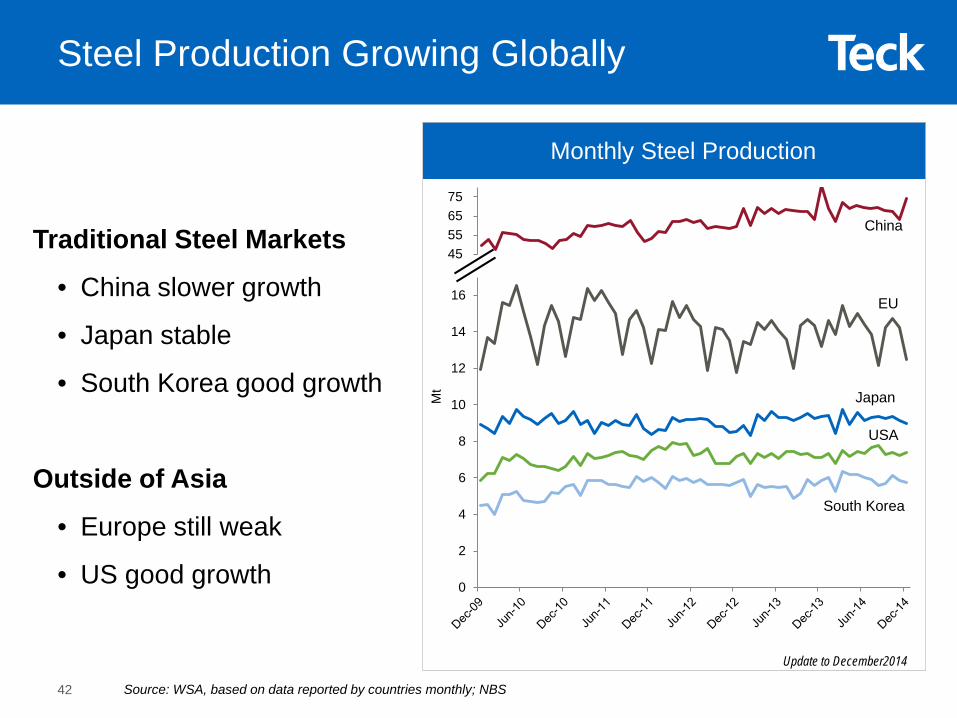
Traditional Steel Markets
• China slower growth
• Japan stable
• South Korea good growth
Outside of Asia
• Europe still weak
• US good growth
Monthly Steel Production
Source: WSA, based on data reported by countries monthly; NBS
Mt
Steel Production Growing Globally
Update to December2014
45 55 65 75
China
0
2
4
6
8
10
12
14
16
Japan
USA
South Korea
EU
42
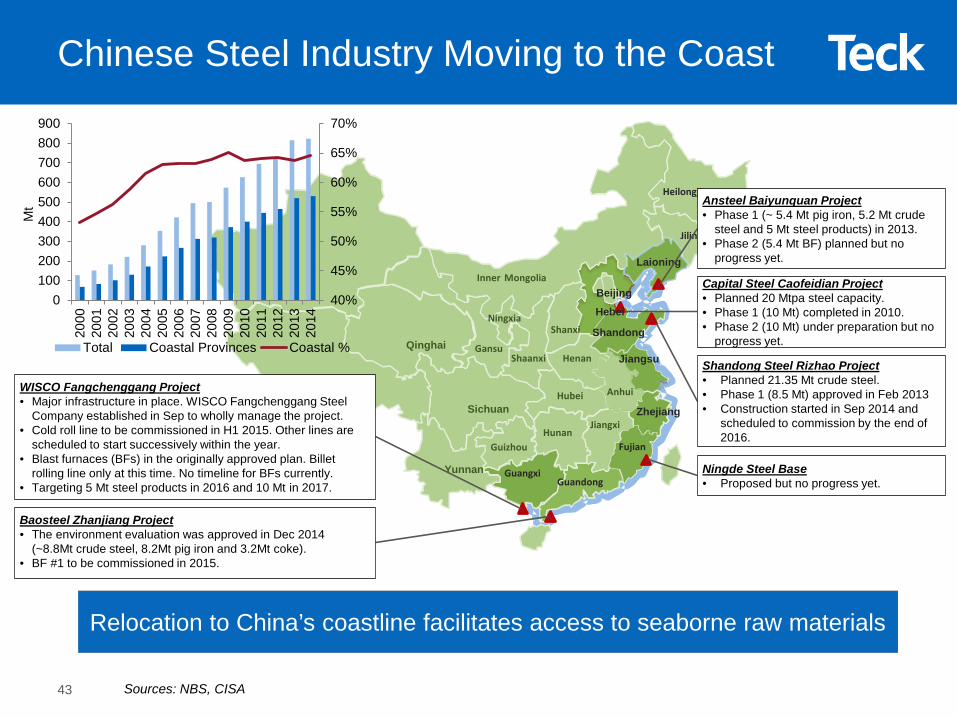
Xinjiang
Tibet
Qinghai
Sichuan
Inner Mongolia
Henan
Shanxi
GuangxiGuandong
Fujian
Zhejiang
Jiangsu
Shandong
Laioning
Jilin
Heilongjiang
GuizhouHunan
Hubei
Jiangxi
Anhui
ShaanxiGansu
Ningxia
Qinghai
Sichuan
Yunnan
Beijing
Hebei
WISCO Fangchenggang Project• Major infrastructure in place. WISCO Fangchenggang Steel
Company established in Sep to wholly manage the project.• Cold roll line to be commissioned in H1 2015. Other lines are
scheduled to start successively within the year.• Blast furnaces (BFs) in the originally approved plan. Billet
rolling line only at this time. No timeline for BFs currently.• Targeting 5 Mt steel products in 2016 and 10 Mt in 2017.
Baosteel Zhanjiang Project• The environment evaluation was approved in Dec 2014
(~8.8Mt crude steel, 8.2Mt pig iron and 3.2Mt coke).• BF #1 to be commissioned in 2015.
Ningde Steel Base• Proposed but no progress yet.
Relocation to China’s coastline facilitates access to seaborne raw materials
Sources: NBS, CISA
Ansteel Baiyunquan Project• Phase 1 (~ 5.4 Mt pig iron, 5.2 Mt crude
steel and 5 Mt steel products) in 2013.• Phase 2 (5.4 Mt BF) planned but no
progress yet.
Capital Steel Caofeidian Project• Planned 20 Mtpa steel capacity. • Phase 1 (10 Mt) completed in 2010.• Phase 2 (10 Mt) under preparation but no
progress yet.
Shandong Steel Rizhao Project• Planned 21.35 Mt crude steel. • Phase 1 (8.5 Mt) approved in Feb 2013• Construction started in Sep 2014 and
scheduled to commission by the end of 2016.
Chinese Steel Industry Moving to the Coast
43
40%
45%
50%
55%
60%
65%
70%
0100200300400500600700800900
2000
2001
2002
2003
2004
2005
2006
2007
2008
2009
2010
2011
2012
2013
2014
Mt
Total Coastal Provinces Coastal %
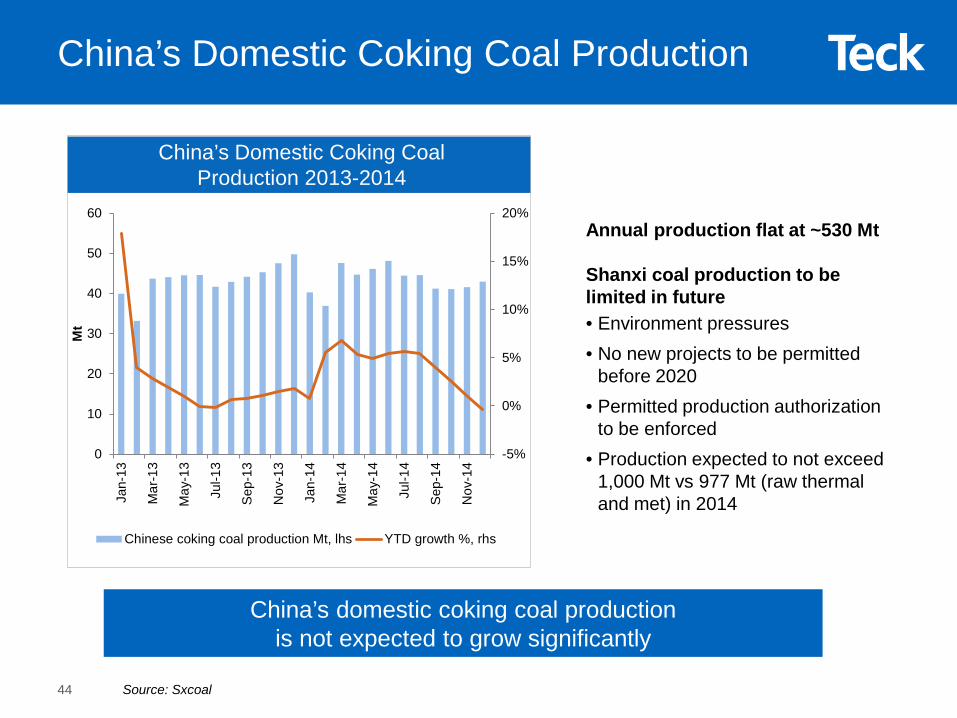
China’s domestic coking coal production is not expected to grow significantly
China’s Domestic Coking Coal Production 2013-2014
China’s Domestic Coking Coal Production
44 Source: Sxcoal
Annual production flat at ~530 Mt
Shanxi coal production to be limited in future• Environment pressures • No new projects to be permitted
before 2020 • Permitted production authorization
to be enforced • Production expected to not exceed
1,000 Mt vs 977 Mt (raw thermal and met) in 2014
-5%
0%
5%
10%
15%
20%
0
10
20
30
40
50
60
Jan-
13
Mar
-13
May
-13
Jul-1
3
Sep
-13
Nov
-13
Jan-
14
Mar
-14
May
-14
Jul-1
4
Sep
-14
Nov
-14
Mt
Chinese coking coal production Mt, lhs YTD growth %, rhs

Further Cuts Needed in the Coal Market
Source: Wood Mackenzie, Platts, TEX Report, AME, company & news reports and Teck Resources estimates1. On an operating basis, excluding sustaining capital costs
Seaborne Metallurgical Coal Margin Curve at Spot Price of US$115/t
Brackets indicate producers closed or still
supplying but due to close or deplete inventory
Teck
• ~30 Mt of production cuts announced- Slightly less than half
implemented by year end
• Margin curve shows around one third of seaborne met coal is operating at negative margin1
- Implies further cuts are warranted
• Market balance dependent on additional production cuts
45
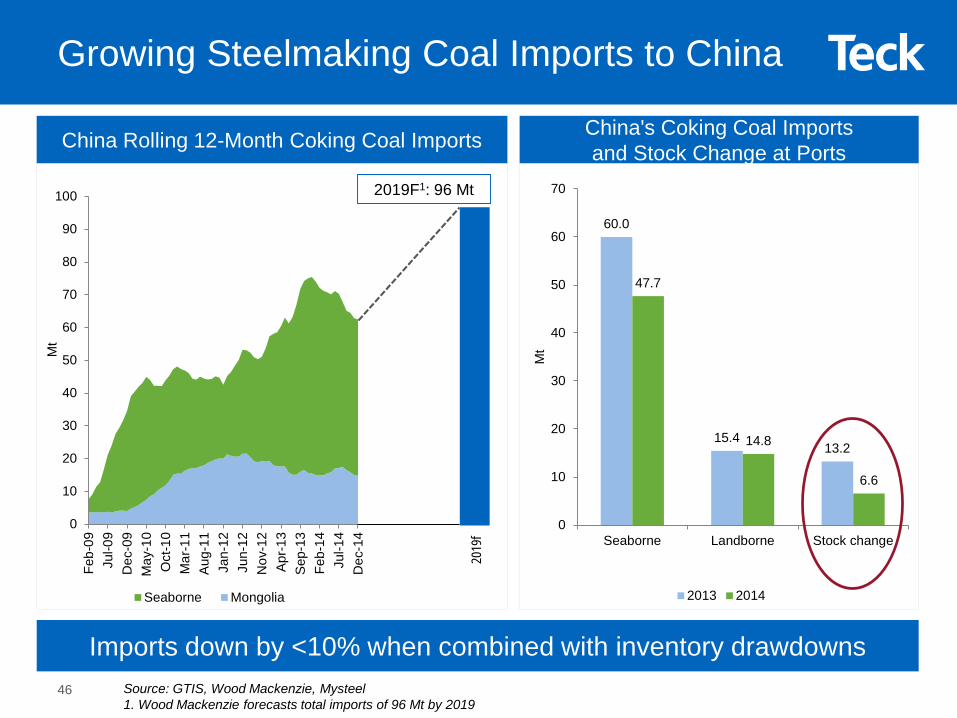
60.0
15.413.2
47.7
14.8
6.6
0
10
20
30
40
50
60
70
Seaborne Landborne Stock changeM
t
2013 2014
Source: GTIS, Wood Mackenzie, Mysteel1. Wood Mackenzie forecasts total imports of 96 Mt by 2019
China Rolling 12-Month Coking Coal Imports
46
Growing Steelmaking Coal Imports to China
2019
f
2019F1: 96 Mt
China's Coking Coal Imports and Stock Change at Ports
Imports down by <10% when combined with inventory drawdowns
0
10
20
30
40
50
60
70
80
90
100
Feb-
09Ju
l-09
Dec
-09
May
-10
Oct
-10
Mar
-11
Aug
-11
Jan-
12Ju
n-12
Nov
-12
Apr
-13
Sep
-13
Feb-
14Ju
l-14
Dec
-14
Mt
Seaborne Mongolia
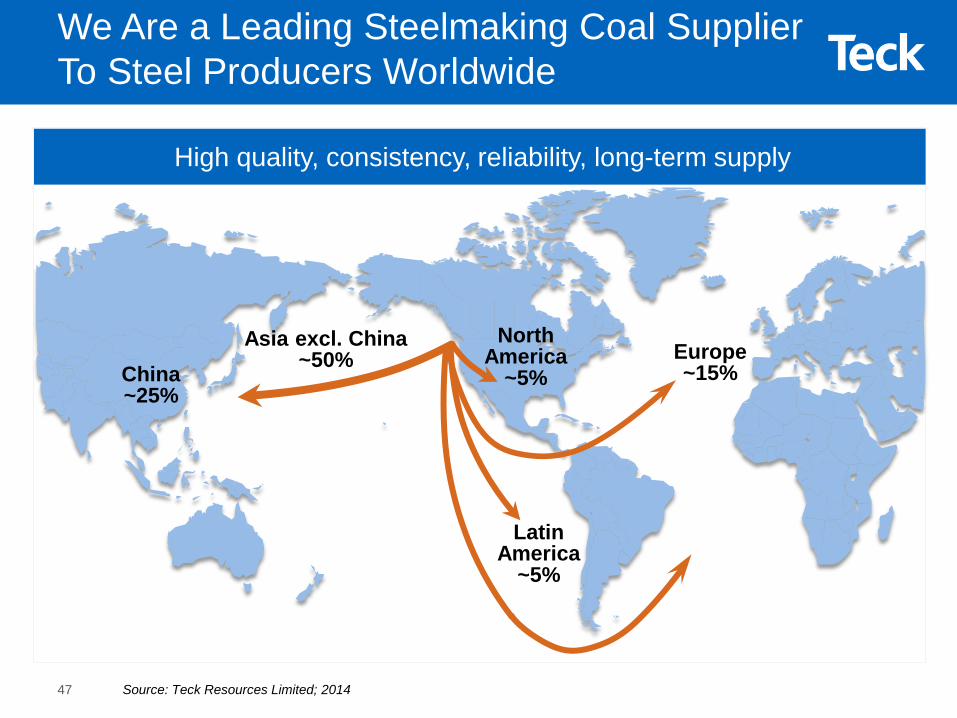
NorthAmerica
~5%Europe~15%
LatinAmerica
~5%
China~25%
High quality, consistency, reliability, long-term supply
Asia excl. China~50%
Source: Teck Resources Limited; 201447
We Are a Leading Steelmaking Coal Supplier To Steel Producers Worldwide

0
50
100
150
200
250
300
350
Q1
2010
Q2
2010
Q3
2010
Q4
2010
Q1
2011
Q2
2011
Q3
2011
Q4
2011
Q1
2012
Q2
2012
Q3
2012
Q4
2012
Q1
2013
Q2
2013
Q3
2013
Q4
2013
Q1
2014
Q2
2014
Q3
2014
Q4
2014
US$
/ to
nne
Teck Realized Price (US$) Benchmark Price
Average realized price discount to benchmark is a function of:1. Product mix: over 90% is hard
coking coal
2. Carry over sales volumes
3. Direction of quarterly benchmark prices and spot prices- Q1 2015 benchmark for
premium products is US$117/t
Hard Coking Coal Benchmark Price
Premium Steelmaking Coal Product
Average realized price discount of ~8%
96%
88%
93%
94%92%
48
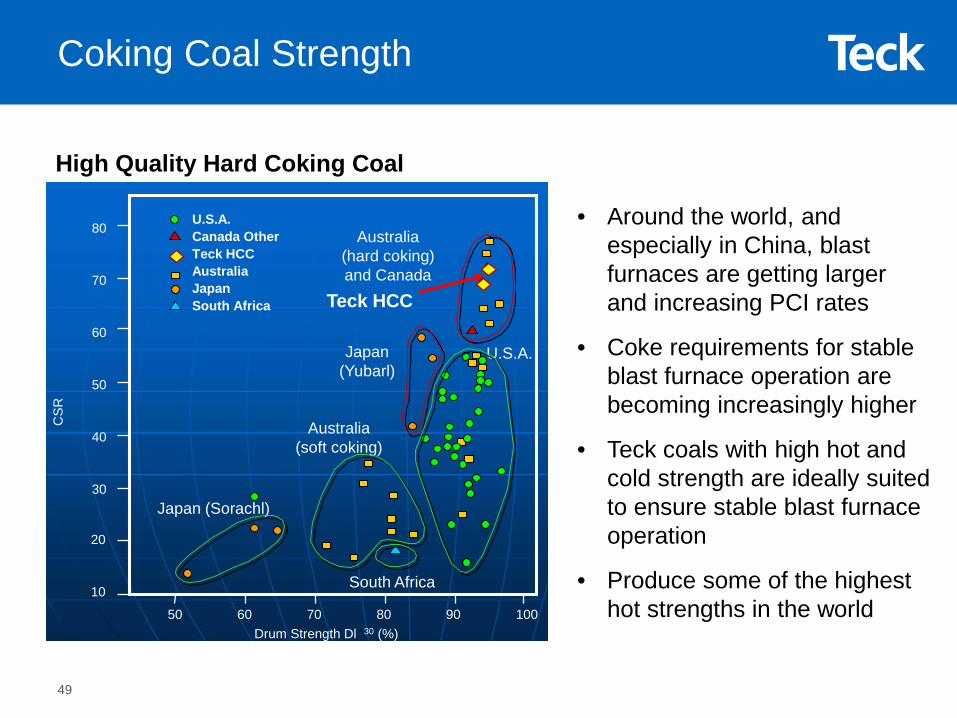
• Around the world, and especially in China, blast furnaces are getting larger and increasing PCI rates
• Coke requirements for stable blast furnace operation are becoming increasingly higher
• Teck coals with high hot and cold strength are ideally suited to ensure stable blast furnace operation
• Produce some of the highest hot strengths in the world50 60 70 80 90 100
South Africa
Japan (Sorachl)
Japan(Yubarl)
U.S.A.Canada OtherTeck HCCAustraliaJapanSouth Africa
Australia(hard coking)and Canada
U.S.A.
Australia(soft coking)
10
20
30
40
50
60
70
80
Drum Strength Dl 30 (%)
CSR
Teck HCC
49
Coking Coal Strength
High Quality Hard Coking Coal
0
20
40
60
80
100
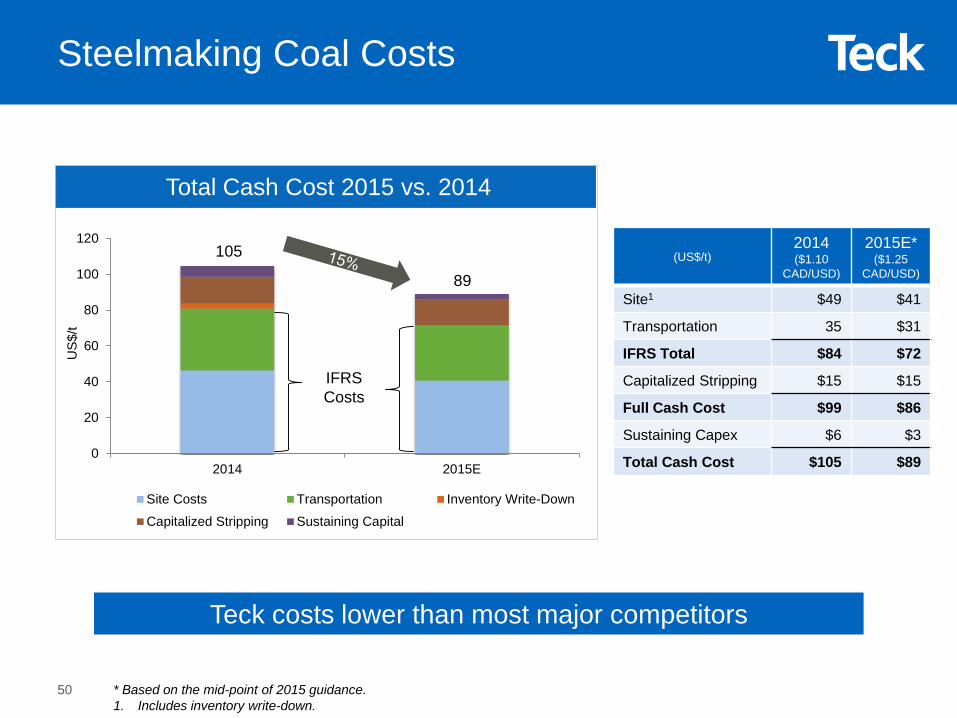
120
2014 2015E
US$
/t
Site Costs Transportation Inventory Write-Down
Capitalized Stripping Sustaining Capital
105
89
Teck costs lower than most major competitors
Total Cash Cost 2015 vs. 2014
Steelmaking Coal Costs
50
(US$/t)2014($1.10
CAD/USD)
2015E*($1.25
CAD/USD)
Site1 $49 $41
Transportation 35 $31
IFRS Total $84 $72
Capitalized Stripping $15 $15
Full Cash Cost $99 $86
Sustaining Capex $6 $3
Total Cash Cost $105 $89
* Based on the mid-point of 2015 guidance.1. Includes inventory write-down.
IFRS Costs
0
1
2
3
4
5
6
7
8
Q2/
09Q
3/09
Q4/
09Q
1/10
Q2/
10Q
3/10
Q4/
10Q
1/11
Q2/
11Q
3/11
Q4/
11Q
1/12
Q2/
12Q
3/12
Q4/
12Q
1/13
Q2/
13Q
3/13
Q4/
13Q
1/14
Q2/
14Q
3/14
Milli
on T
onne
s
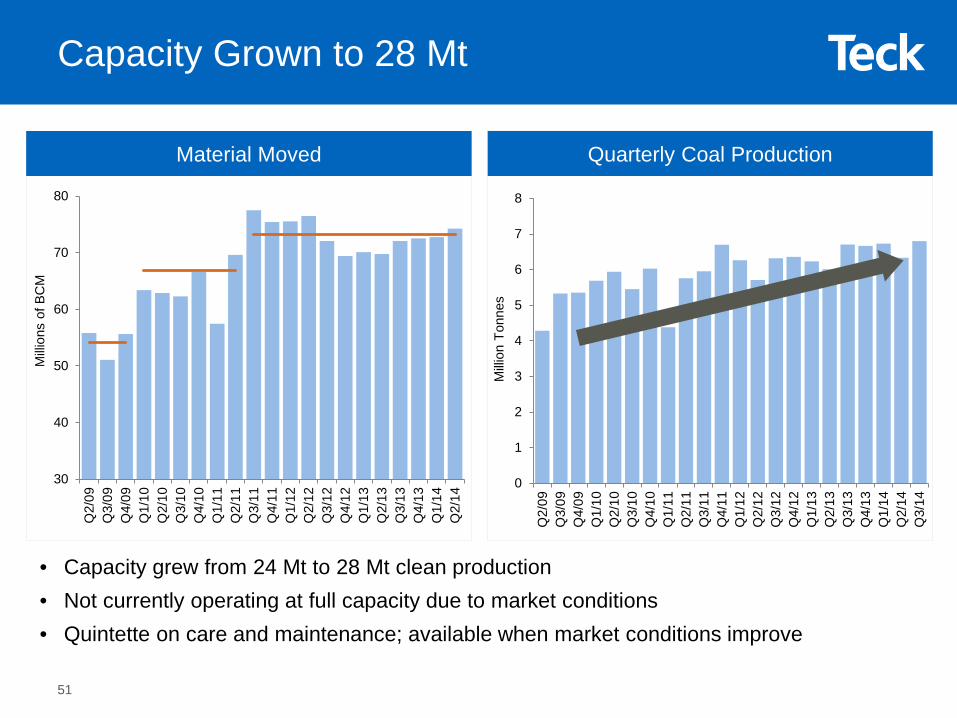
Capacity Grown to 28 Mt
30
40
50
60
70
80
Q2/
09Q
3/09
Q4/
09Q
1/10
Q2/
10Q
3/10
Q4/
10Q
1/11
Q2/
11Q
3/11
Q4/
11Q
1/12
Q2/
12Q
3/12
Q4/
12Q
1/13
Q2/
13Q
3/13
Q4/
13Q
1/14
Q2/
14
Milli
ons
of B
CM
• Capacity grew from 24 Mt to 28 Mt clean production• Not currently operating at full capacity due to market conditions• Quintette on care and maintenance; available when market conditions improve
Material Moved Quarterly Coal Production
51
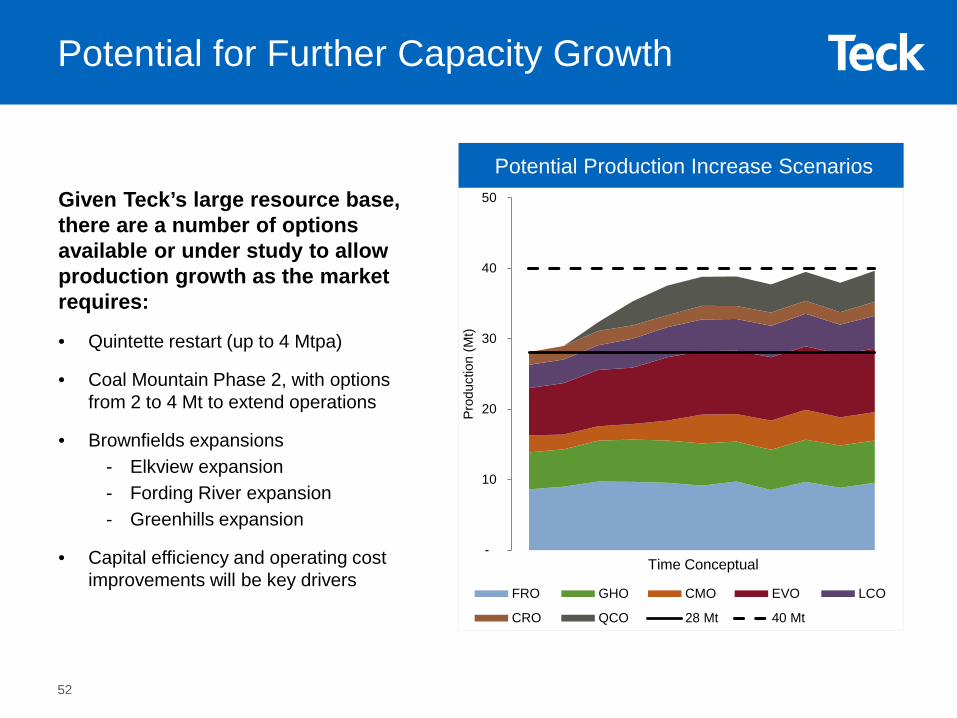
Potential for Further Capacity Growth
Potential Production Increase ScenariosGiven Teck’s large resource base, there are a number of options available or under study to allow production growth as the market requires:
• Quintette restart (up to 4 Mtpa)
• Coal Mountain Phase 2, with options from 2 to 4 Mt to extend operations
• Brownfields expansions- Elkview expansion - Fording River expansion- Greenhills expansion
• Capital efficiency and operating cost improvements will be key drivers
-
10
20
30
40
50
Prod
uctio
n (M
t)
FRO GHO CMO EVO LCO
CRO QCO 28 Mt 40 Mt
Time Conceptual
52
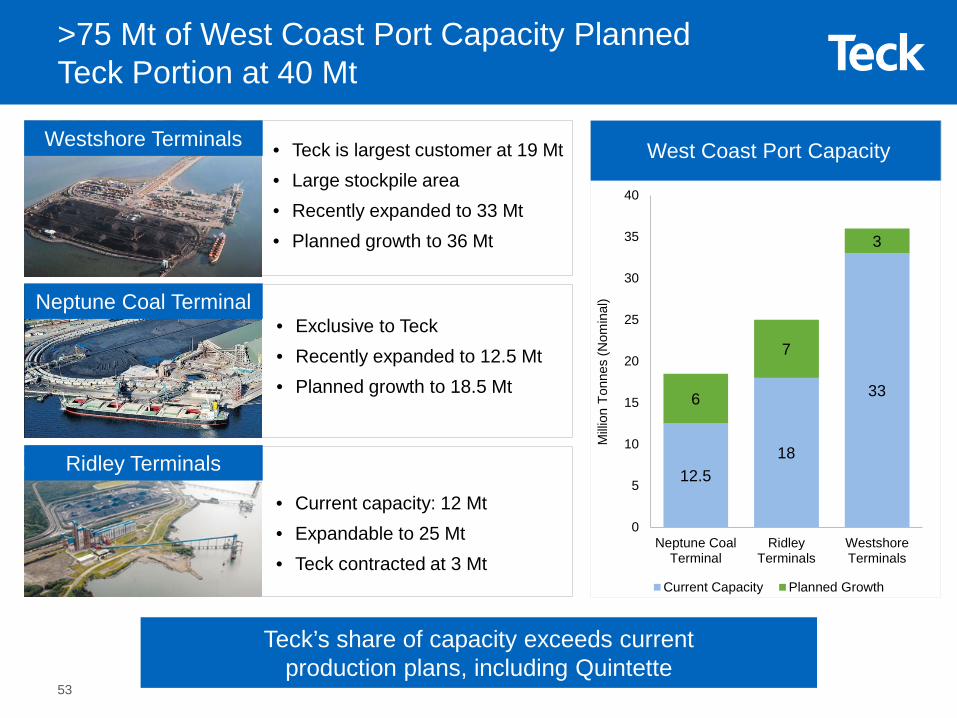
>75 Mt of West Coast Port Capacity PlannedTeck Portion at 40 Mt
• Exclusive to Teck • Recently expanded to 12.5 Mt • Planned growth to 18.5 Mt
Westshore Terminals
Neptune Coal Terminal
Ridley Terminals
West Coast Port Capacity
• Current capacity: 12 Mt• Expandable to 25 Mt• Teck contracted at 3 Mt
• Teck is largest customer at 19 Mt• Large stockpile area• Recently expanded to 33 Mt• Planned growth to 36 Mt
Milli
on T
onne
s (N
omin
al)
Teck’s share of capacity exceeds current production plans, including Quintette
12.518
336
7
3
0
5
10
15
20
25
30
35
40
Neptune CoalTerminal
RidleyTerminals
WestshoreTerminals
Current Capacity Planned Growth
53
0%
20%
40%
60%
80%
100%
CO2 NOx Particulate SOxDiesel Natural Gas
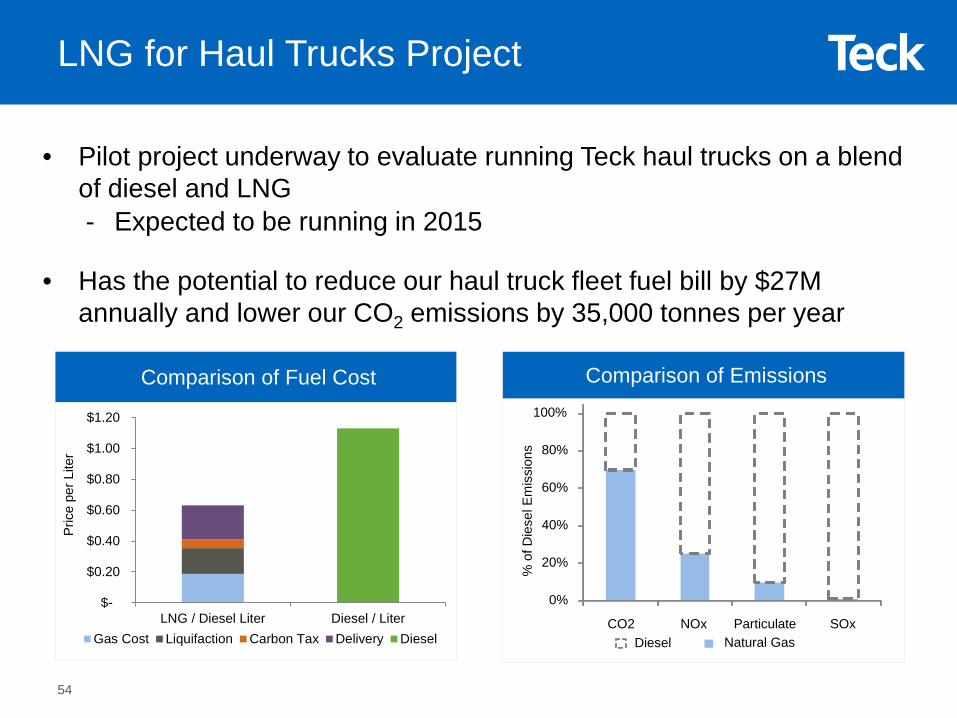
LNG for Haul Trucks Project
• Pilot project underway to evaluate running Teck haul trucks on a blend of diesel and LNG- Expected to be running in 2015
• Has the potential to reduce our haul truck fleet fuel bill by $27M annually and lower our CO2 emissions by 35,000 tonnes per year
Comparison of Fuel Cost
$-
$0.20
$0.40
$0.60
$0.80
$1.00
$1.20
LNG / Diesel Liter Diesel / LiterGas Cost Liquifaction Carbon Tax Delivery Diesel
Pric
e pe
r Lite
r
Comparison of Emissions
% o
f Die
sel E
mis
sion
s
54

Copper Business Unit & Markets

0
200
400
600
800
1000
0¢
100¢
200¢
300¢
400¢
500¢
2003 2004 2005 2006 2007 2008 2009 2010 2011 2012 2013 2014 2015
LME Stocks Price
US¢
/lb
thou
sand
tonn
es
plotted to February 6, 2015
Source: LME
Copper Prices & Stocks
LME Daily Copper Prices & Stocks
56
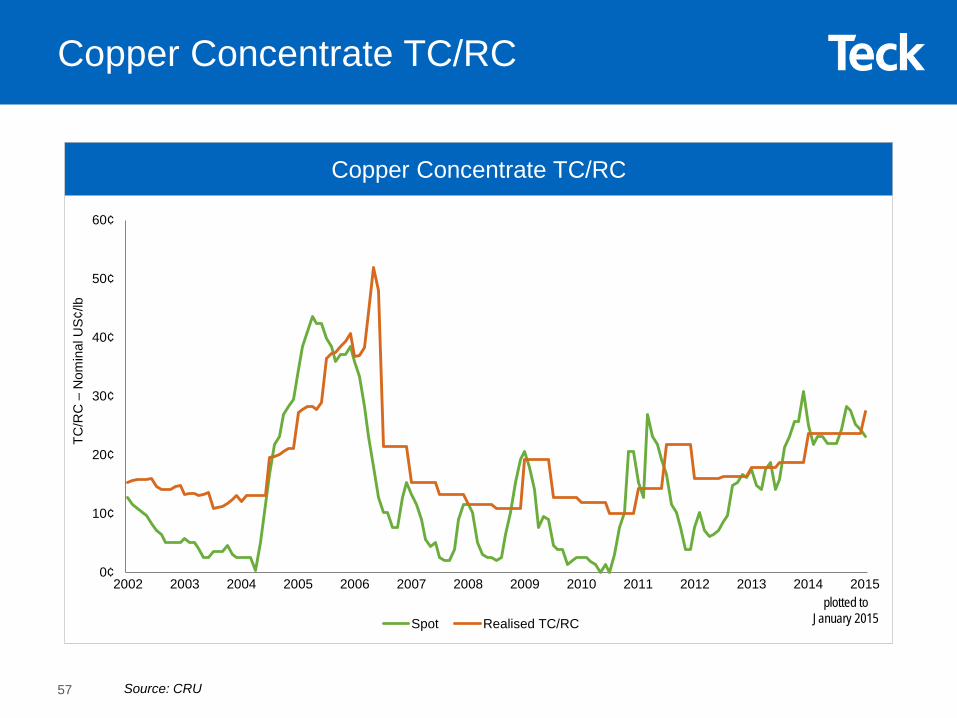
Copper Concentrate TC/RC
0¢
10¢
20¢
30¢
40¢
50¢
60¢
2002 2003 2004 2005 2006 2007 2008 2009 2010 2011 2012 2013 2014 2015
Spot Realised TC/RC
TC/R
C –
Nom
inal
US¢
/lb
Source: CRU
plotted to January 2015
Copper Concentrate TC/RC
57
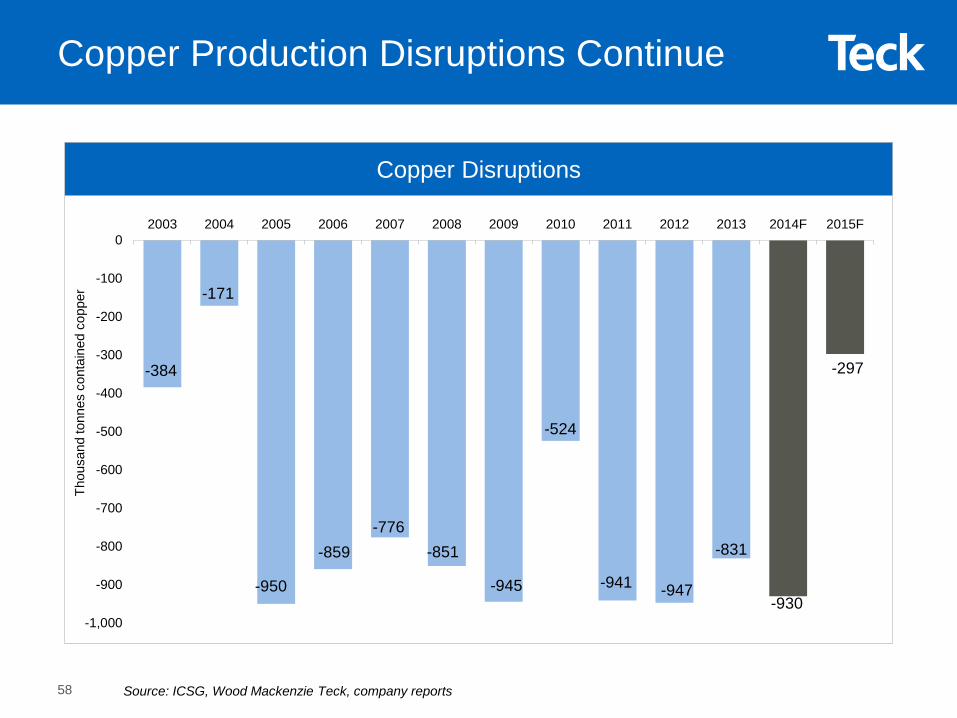
Copper Production Disruptions Continue
-384
-171
-950
-859-776
-851
-945
-524
-941 -947
-831
-930
-297
-1,000
-900
-800
-700
-600
-500
-400
-300
-200
-100
02003 2004 2005 2006 2007 2008 2009 2010 2011 2012 2013 2014F 2015F
Thou
sand
tonn
es c
onta
ined
cop
per
Source: ICSG, Wood Mackenzie Teck, company reports
Copper Disruptions
58
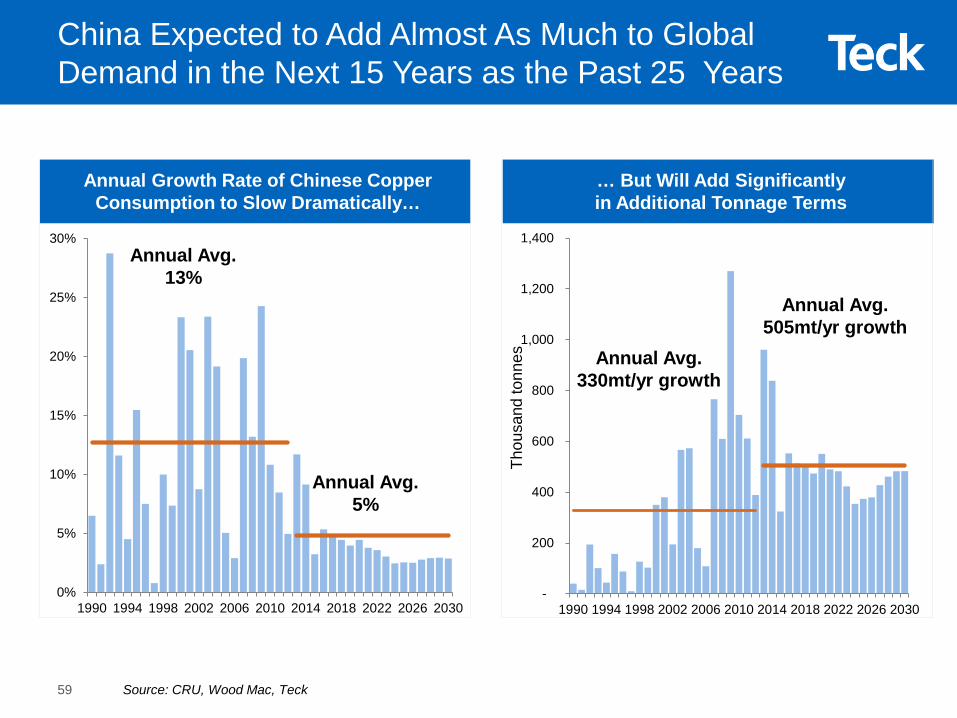
China Expected to Add Almost As Much to Global Demand in the Next 15 Years as the Past 25 Years
-
200
400
600
800
1,000
1,200
1,400
1990 1994 1998 2002 2006 2010 2014 2018 2022 2026 20300%
5%
10%
15%
20%
25%
30%
1990 1994 1998 2002 2006 2010 2014 2018 2022 2026 2030
Annual Avg. 13%
Annual Avg. 5%
Annual Avg. 330mt/yr growth
Annual Avg. 505mt/yr growth
Thou
sand
tonn
es
Source: CRU, Wood Mac, Teck
Annual Growth Rate of Chinese Copper Consumption to Slow Dramatically…
… But Will Add Significantly in Additional Tonnage Terms
59
0
100
200
300
400
500
600
700
800
900
1,000
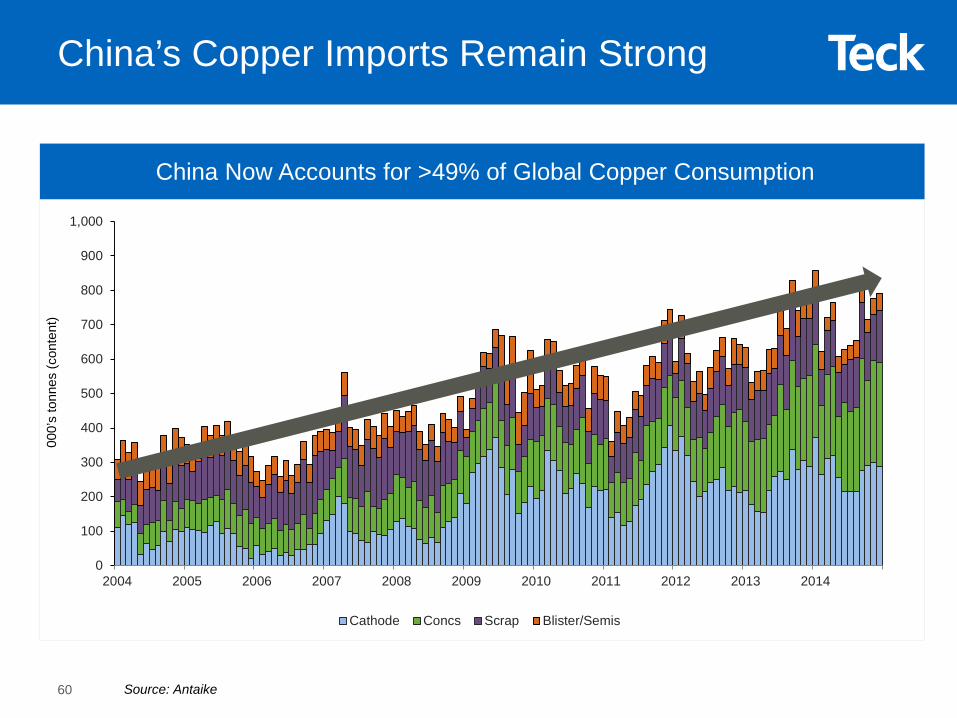
2004 2005 2006 2007 2008 2009 2010 2011 2012 2013 2014
Cathode Concs Scrap Blister/Semis
000’
s to
nnes
(con
tent
)
China Now Accounts for >49% of Global Copper Consumption
Source: Antaike
China’s Copper Imports Remain Strong
60
0
500
1,000
1,500
2,000
0
50
100
150
200
Jan Feb Mar Apr May Jun Jul Aug Sep Oct Nov Dec0
100
200
300
400
500
600
700
0102030405060708090
Jan Feb Mar Apr May Jun Jul Aug Sep Oct Nov Dec
0
500
1,000
1,500
2,000
2,500
3,000
3,500
0
50
100
150
200
250
300
350
Jan Feb Mar Apr May Jun Jul Aug Sep Oct Nov Dec0
500
1,000
1,500
2,000
2,500
3,000
3,500
050
100150200250300350400
Jan Feb Mar Apr May Jun Jul Aug Sep Oct Nov Dec
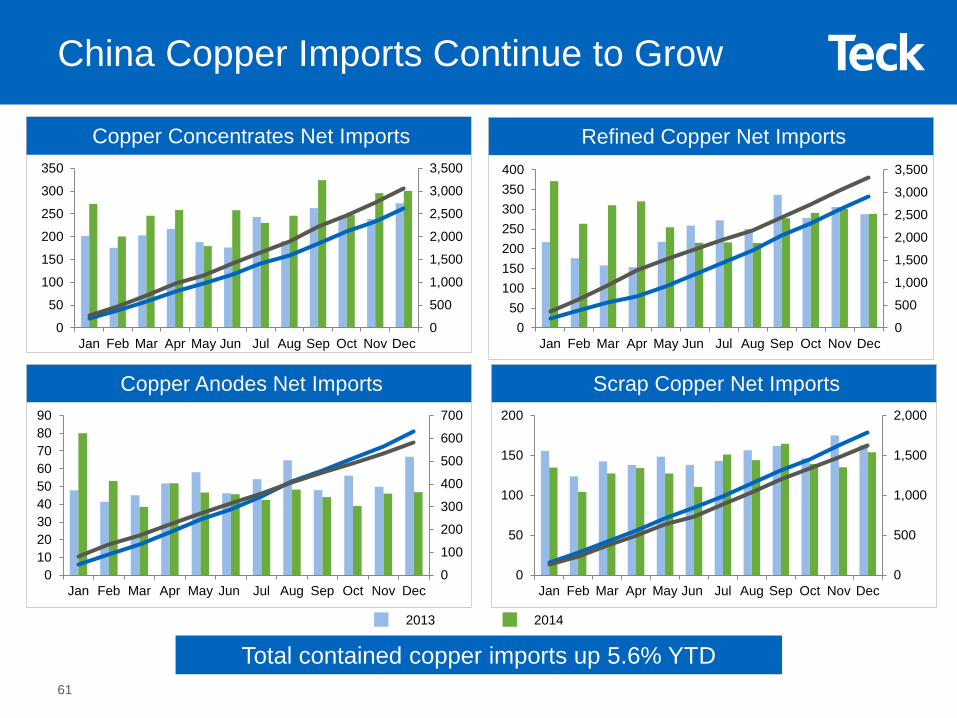
China Copper Imports Continue to Grow
Total contained copper imports up 5.6% YTD
Copper Concentrates Net Imports Refined Copper Net Imports
Copper Anodes Net Imports Scrap Copper Net Imports
20142013
61
ZincBusiness Unit & Markets
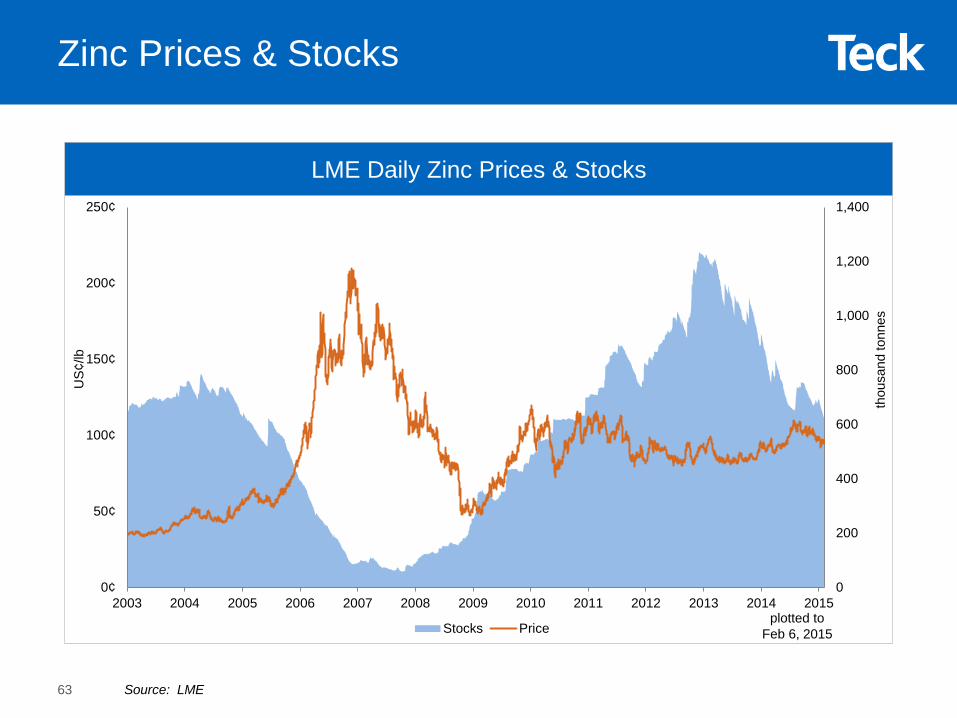
Zinc Prices & Stocks
0
200
400
600
800
1,000
1,200
1,400
0¢
50¢
100¢
150¢
200¢
250¢
2003 2004 2005 2006 2007 2008 2009 2010 2011 2012 2013 2014 2015
Stocks Price
Source: LME
US¢
/lb
thou
sand
tonn
es
plotted to Feb 6, 2015
LME Daily Zinc Prices & Stocks
63
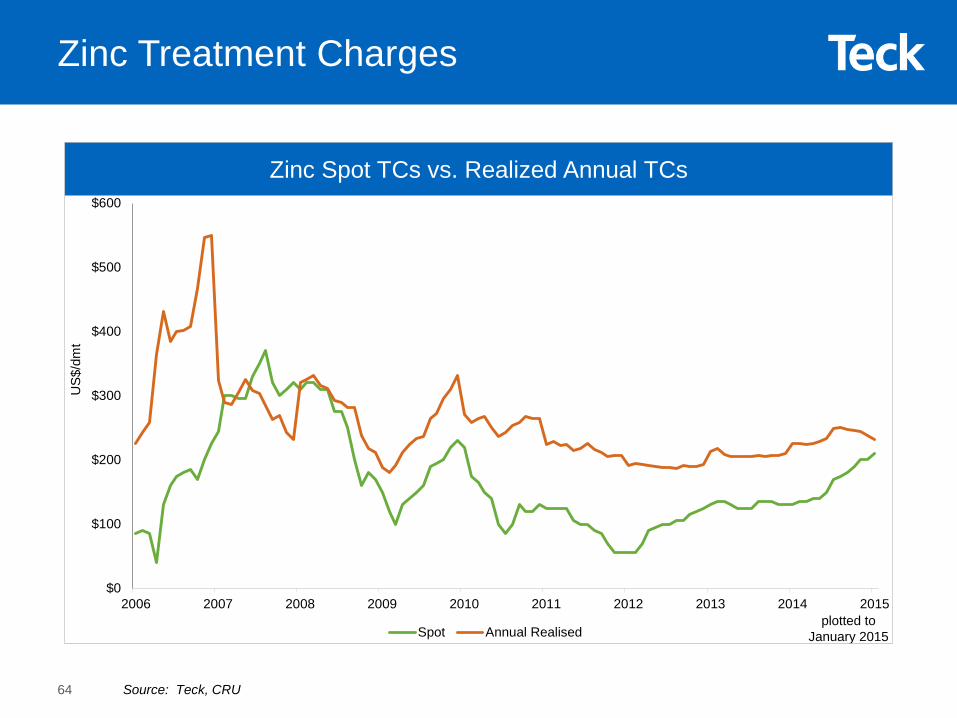
Zinc Treatment Charges
$0
$100
$200
$300
$400
$500
$600
2006 2007 2008 2009 2010 2011 2012 2013 2014 2015
Spot Annual Realised
US$
/dm
t
Source: Teck, CRU
plotted to January 2015
Zinc Spot TCs vs. Realized Annual TCs
64
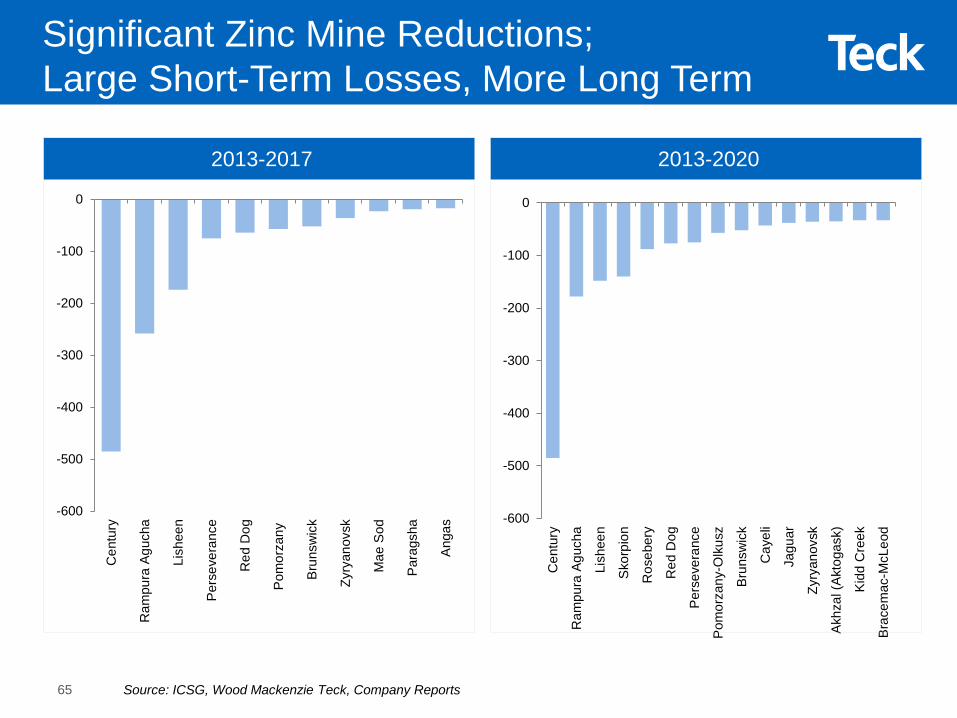
Significant Zinc Mine Reductions;Large Short-Term Losses, More Long Term
-600
-500
-400
-300
-200
-100
0
Cen
tury
Ram
pura
Agu
cha
Lish
een
Per
seve
ranc
e
Red
Dog
Pom
orza
ny
Bru
nsw
ick
Zyry
anov
sk
Mae
Sod
Par
agsh
a
Ang
as
-600
-500
-400
-300
-200
-100
0
Cen
tury
Ram
pura
Agu
cha
Lish
een
Sko
rpio
n
Ros
eber
y
Red
Dog
Per
seve
ranc
e
Pom
orza
ny-O
lkus
z
Bru
nsw
ick
Cay
eli
Jagu
ar
Zyry
anov
sk
Akh
zal (
Akt
ogas
k)
Kid
d C
reek
Bra
cem
ac-M
cLeo
d
Source: ICSG, Wood Mackenzie Teck, Company Reports
2013-2017 2013-2020
65
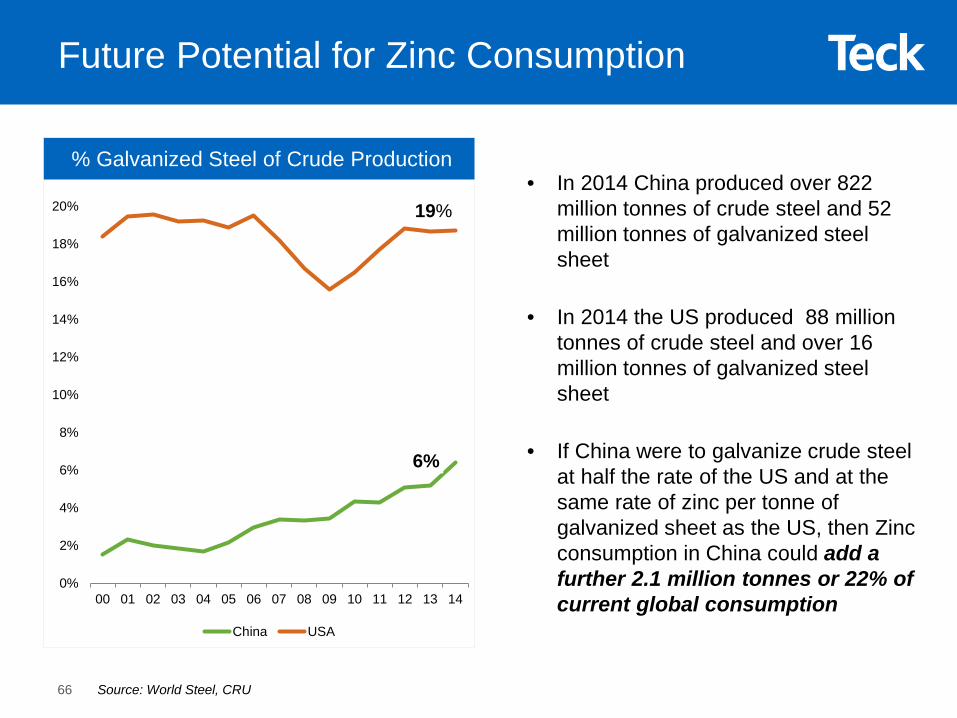
Future Potential for Zinc Consumption
6%
19%
0%
2%
4%
6%
8%
10%
12%
14%
16%
18%
20%
00 01 02 03 04 05 06 07 08 09 10 11 12 13 14
China USA
• In 2014 China produced over 822 million tonnes of crude steel and 52 million tonnes of galvanized steel sheet
• In 2014 the US produced 88 million tonnes of crude steel and over 16 million tonnes of galvanized steel sheet
• If China were to galvanize crude steel at half the rate of the US and at the same rate of zinc per tonne of galvanized sheet as the US, then Zinc consumption in China could add a further 2.1 million tonnes or 22% of current global consumption
Source: World Steel, CRU66
% Galvanized Steel of Crude Production

EnergyBusiness Unit & Markets
$-
$20
$40
$60
$80
$100
$120
$-
$20
$40
$60
$80
$100
$120
$140
$160
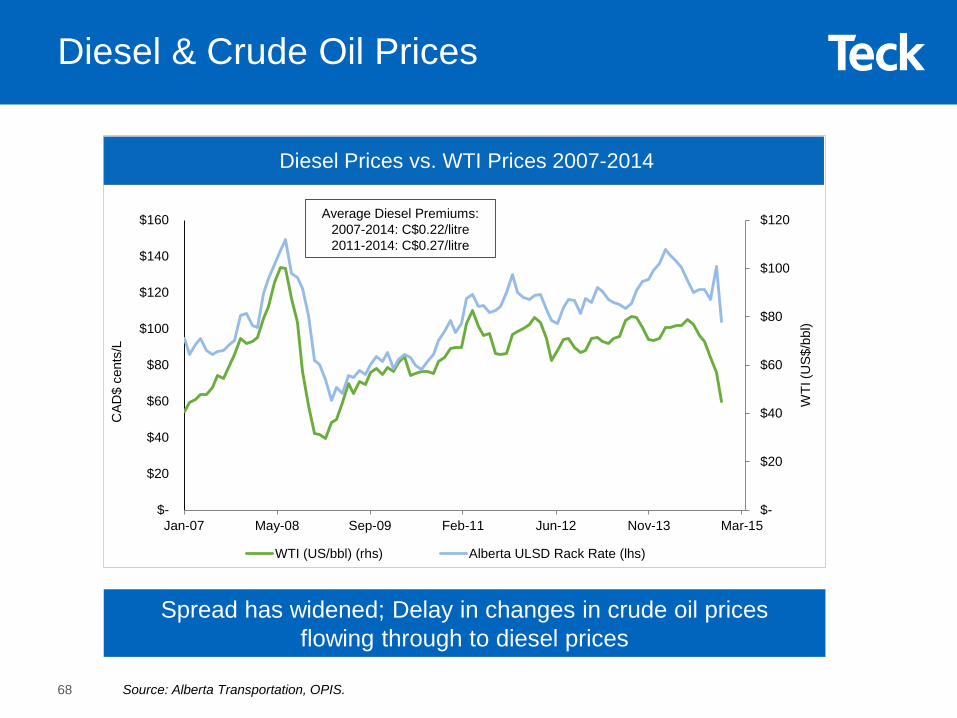
Jan-07 May-08 Sep-09 Feb-11 Jun-12 Nov-13 Mar-15
WTI
(US$
/bbl
)
CAD
$ ce
nts/
L
WTI (US/bbl) (rhs) Alberta ULSD Rack Rate (lhs)
Diesel & Crude Oil Prices
Spread has widened; Delay in changes in crude oil prices flowing through to diesel prices
Diesel Prices vs. WTI Prices 2007-2014
Source: Alberta Transportation, OPIS.
Average Diesel Premiums:2007-2014: C$0.22/litre2011-2014: C$0.27/litre
68
Source: Baker Hughes
Falling oil rig count will eventually lead to lower oil production
North American Weekly Oil Rig Count
Declining Drilling Activity Will Impact Production
69
• Surge in supply last ~5 years primarily due to US shale oil
• Shale oil field decline rates ~25% to 50%, compared to global average of 8%
• Production correction likely to occur relatively rapidly1,000
1,500
2,000
1/3/
141/
17/1
41/
31/1
42/
14/1
42/
28/1
43/
14/1
43/
28/1
44/
11/1
44/
25/1
45/
9/14
5/23
/14
6/6/
146/
20/1
47/
3/14
7/18
/14
8/1/
148/
15/1
48/
29/1
49/
12/1
49/
26/1
410
/10/
1410
/24/
1411
/7/1
411
/21/
1412
/5/1
412
/19/
141/
2/15
1/16
/15
1/30
115
# O
il R
igs
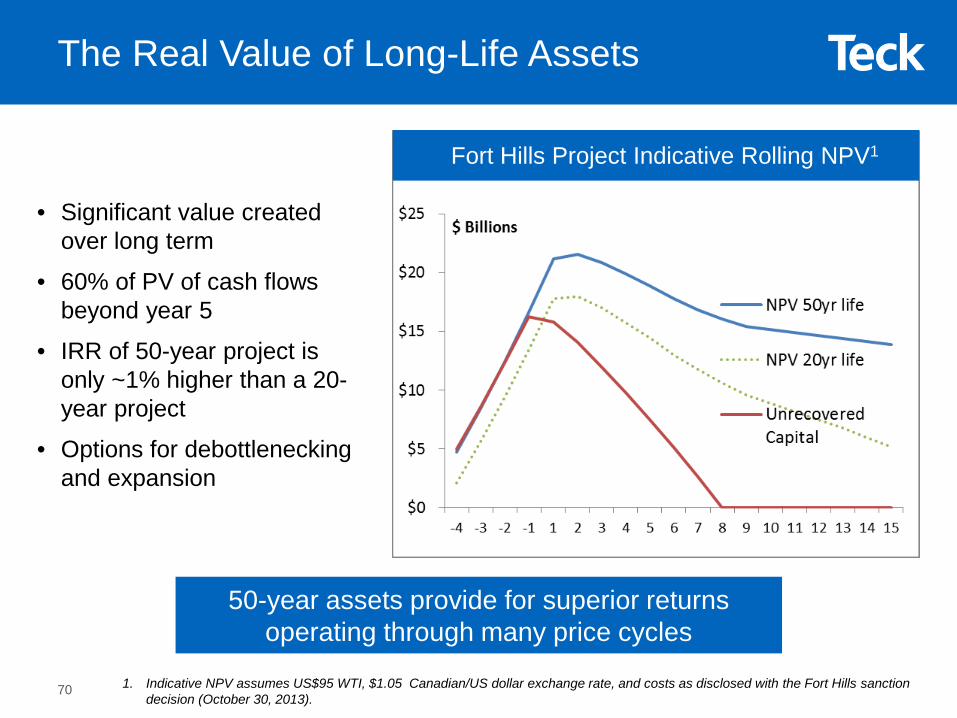
• Significant value created over long term
• 60% of PV of cash flows beyond year 5
• IRR of 50-year project is only ~1% higher than a 20-year project
• Options for debottlenecking and expansion
50-year assets provide for superior returns operating through many price cycles
The Real Value of Long-Life Assets
Fort Hills Project Indicative Rolling NPV1
1. Indicative NPV assumes US$95 WTI, $1.05 Canadian/US dollar exchange rate, and costs as disclosed with the Fort Hills sanction decision (October 30, 2013).
70

Building An Energy Business
Strategic diversification
Large truck & shovel mining projects
World-class resources
Long-life assets
Mining-friendly jurisdiction
Competitive margins
Minimizing execution risk
Tax effective
71
Mined bitumen is in Teck’s ‘sweet spot’

1. GLJ Petroleum Consultants, December 20132. There is no certainty that it will be commercially viable to produce any portion of the contingent bitumen resources. For more information
about contingent bitumen resources, see Teck’s annual information form dated March 3, 2014 available at www.sedar.com.3. Sproule, December 2013
World-Class Energy Reserves & Resources
No Exploration Risk – No Large Finding Costs
Bitumen ReservesTeck’s Share
(million bbl) Proved Probable Proved Plus Probable
Fort Hills1 414 194 608
Contingent Bitumen Resources2
Project Teck’s Share (million bbl) Low Best High Low Best High
Fort Hills1 0 128 752 0 26 150
Frontier32,360 3,047 3,465 2,360 3,047 3,465
Lease 421
Total 2,360 3,175 4,217 2,360 3,073 3,615
Still to be declared
World Class Energy Reserves & Resources
72
Fort Hills Is One of the Best Undeveloped Oil Sands Mining Leases
Ore grade is a function of the bitumen quantity in the deposit
TV:BIP is a ratio of the total volume of bitumen in place to the total volume of material required to be moved (like a strip ratio)
Strip Ratio vs. Ore Grade
Source: Teck
9.5
10
10.5
11
11.5
12
8910111213
Ore
Gra
de (w
t% b
itum
en)
TV:BIP
Fort Hills
Frontier
• >3 billion bbls of proven plus probable reserves of bitumen
- Production 180,000 barrels per day (bpd) of bitumen
- Teck’s share is significant at 36,000 bpd; equivalent to 13 million barrels per year (Mbpy)
• World-class resource- Average ore grade of 11.4%- Strip ratio of 1.5:1 and TV:BIP of 10.5
• Consistent production year-over-year through multiple decades
- Scheduled to produce first oil as early as Q4 2017
- Expect 90% of planned production capacity within 12 months
73
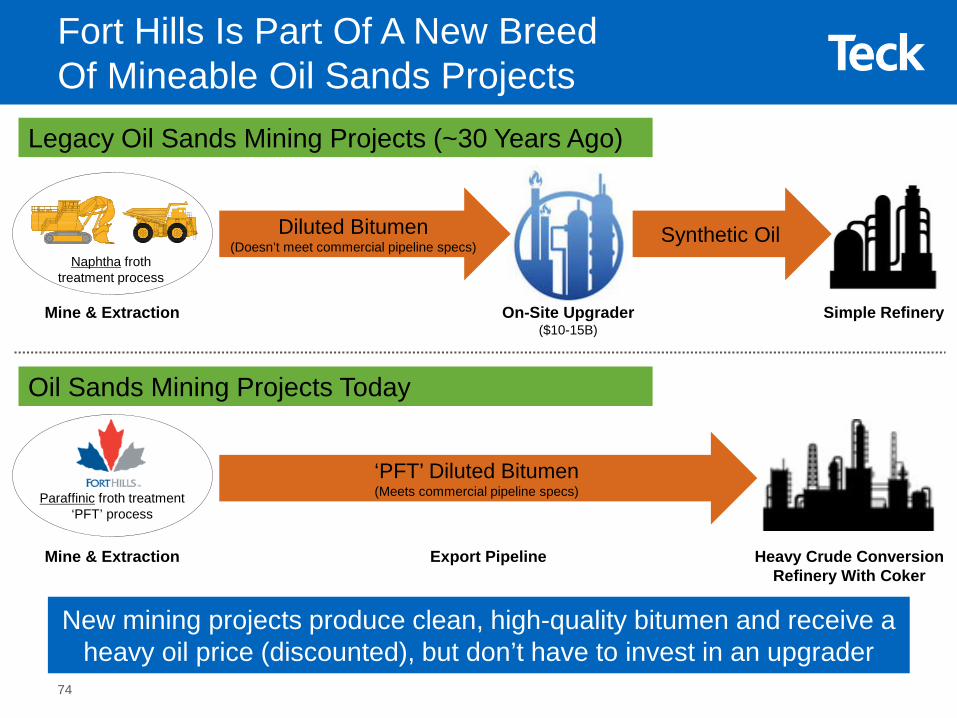
Fort Hills Is Part Of A New Breed Of Mineable Oil Sands Projects
Mine & Extraction
Diluted Bitumen(Doesn’t meet commercial pipeline specs)
Heavy Crude Conversion Refinery With Coker
Simple RefineryOn-Site Upgrader($10-15B)
New mining projects produce clean, high-quality bitumen and receive a heavy oil price (discounted), but don’t have to invest in an upgrader
‘PFT’ Diluted Bitumen (Meets commercial pipeline specs)
Export Pipeline
Synthetic Oil
Legacy Oil Sands Mining Projects (~30 Years Ago)
Oil Sands Mining Projects Today
Naphtha froth treatment process
Paraffinic froth treatment ‘PFT’ process
Mine & Extraction
74

Suncor has demonstrated strong project execution with Firebag 4, Extraction Plant 300, TROTM, and North Steepbank Extension completed at or below initial projected costs
Suncor is the largest operator in the oil sands and has been developing projects in close proximity to Fort Hills for 50 years
▪ Leveraging Suncor’s project execution experience and deep contractor relationships
▪ Experience in managing large workforces of comparable size in this region
▪ Deploying existing, proven technology
Project Bitumen Capacity1
Millennium/North Steepbank Mine 310-330 kb/d
Firebag In Situ Stages 1-4 180 kb/d
MacKay River In Situ 30 kb/d
Fort Hills 180 kb/d
75 Source: Suncor1. Capacity targets provided above do not necessarily equate to daily production.
Fort Hills’ Project Operator Has A Proven Track Record
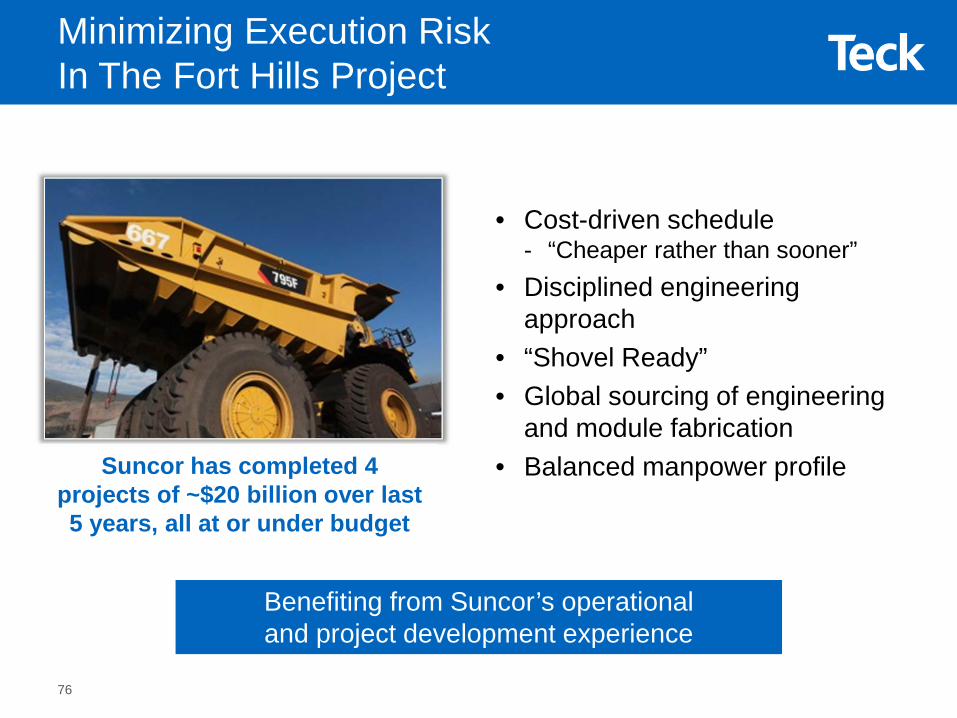
Minimizing Execution Risk In The Fort Hills Project
• Cost-driven schedule- “Cheaper rather than sooner”
• Disciplined engineering approach
• “Shovel Ready” • Global sourcing of engineering
and module fabrication• Balanced manpower profileSuncor has completed 4
projects of ~$20 billion over last 5 years, all at or under budget
Benefiting from Suncor’s operational and project development experience
76
1. All costs and capital are based on Suncor’s estimates.2. Go-forward capital is the go-forward amount from the date of the Fort Hills sanction decision (October 30, 2013),
denominated in Canadian dollars and on a fully-escalated basis.
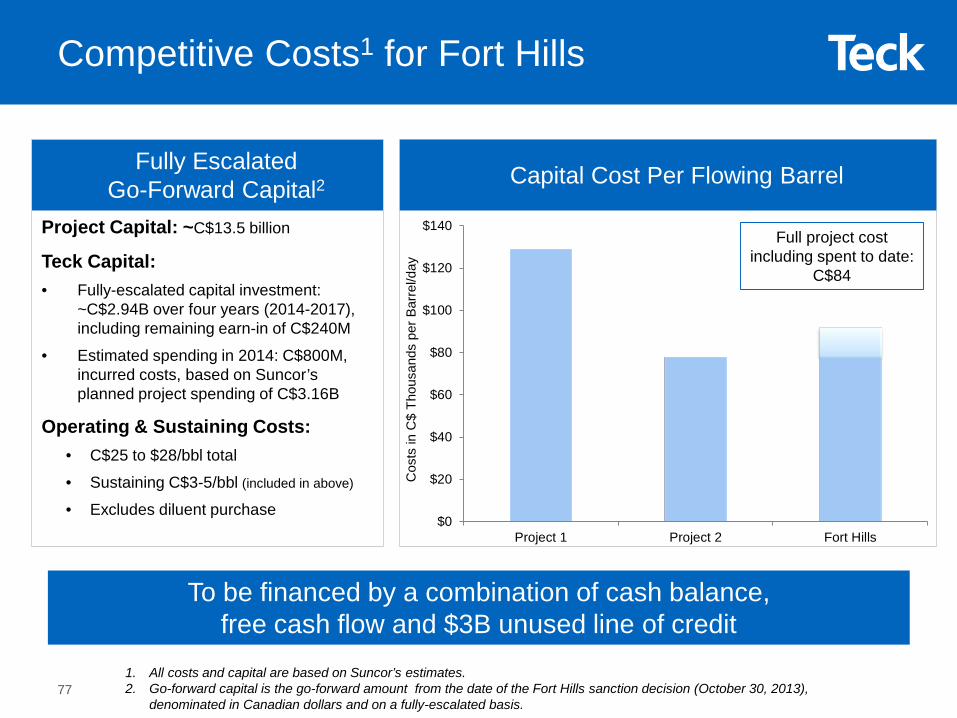
Competitive Costs1 for Fort Hills
Project Capital: ~C$13.5 billion
Teck Capital:• Fully-escalated capital investment:
~C$2.94B over four years (2014-2017), including remaining earn-in of C$240M
• Estimated spending in 2014: C$800M, incurred costs, based on Suncor’s planned project spending of C$3.16B
Operating & Sustaining Costs:• C$25 to $28/bbl total
• Sustaining C$3-5/bbl (included in above)
• Excludes diluent purchase
To be financed by a combination of cash balance, free cash flow and $3B unused line of credit
Fully EscalatedGo-Forward Capital2
$0
$20
$40
$60
$80
$100
$120
$140
Project 1 Project 2 Fort Hills
Cos
ts in
C$
Thou
sand
s pe
r Bar
rel/d
ay
Capital Cost Per Flowing Barrel
Full project cost including spent to date:
C$84
77
Source: Alberta Energy bitumen valuation methodology (http://www.energy.alberta.ca/OilSands/1542.asp)* Based on example exchange rate of $1.25 CAD/USD
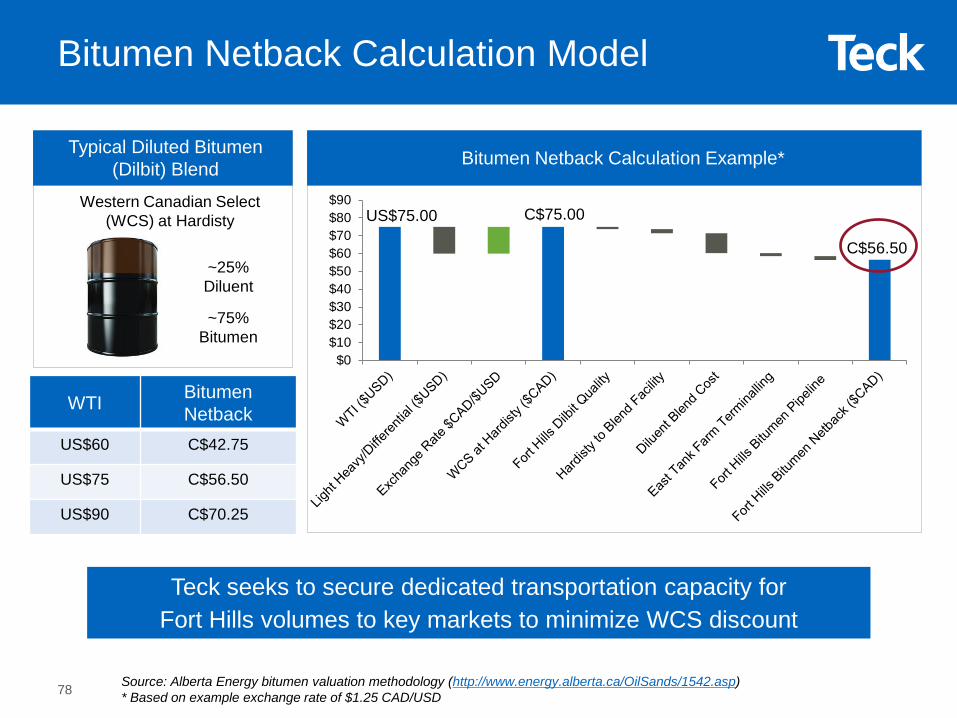
Bitumen Netback Calculation Example*
Teck seeks to secure dedicated transportation capacity for Fort Hills volumes to key markets to minimize WCS discount
Bitumen Netback Calculation Model
US$75.00
C$56.50
C$75.00
$0$10$20$30$40$50$60$70$80$90
~75%Bitumen
~25%Diluent
Typical Diluted Bitumen (Dilbit) Blend
Western Canadian Select (WCS) at Hardisty
WTI BitumenNetback
US$60 C$42.75
US$75 C$56.50
US$90 C$70.25
78
$0
$5
$10
$15
$20
$25
$30
$35
$40
$45
Jan-10 Jan-11 Jan-12 Jan-13 Jan-14 Jan-15
Differential WTI-WCS
US$
/bar
rel
$0
$20
$40
$60
$80
$100
$120
Jan-10 Jan-11 Jan-12 Jan-13 Jan-14 Jan-1
WCS Hardisty WTI Cushing
US$
/bar
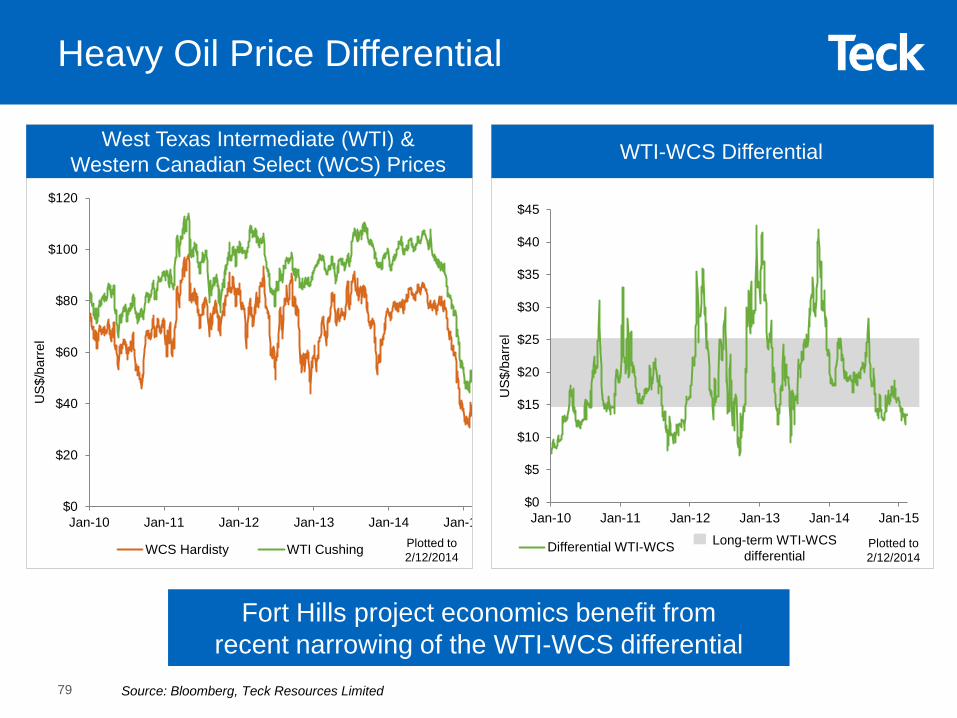
rel
Heavy Oil Price Differential
West Texas Intermediate (WTI) & Western Canadian Select (WCS) Prices WTI-WCS Differential
Source: Bloomberg, Teck Resources Limited
Fort Hills project economics benefit from recent narrowing of the WTI-WCS differential
Plotted to 2/12/2014
Plotted to 2/12/2014
Long-term WTI-WCS differential
79
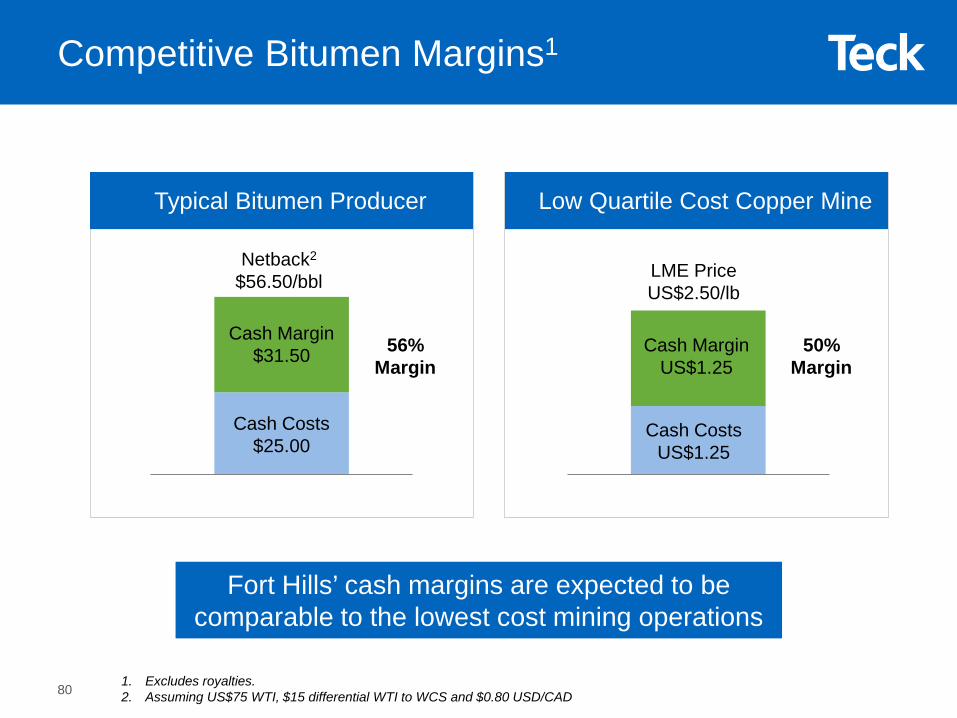
Netback2
$56.50/bbl
Cash Margin$31.50
Cash Costs$25.00
LME PriceUS$2.50/lb
Cash MarginUS$1.25
Cash CostsUS$1.25
Competitive Bitumen Margins1
Typical Bitumen Producer
56% Margin
Low Quartile Cost Copper Mine
50% Margin
Fort Hills’ cash margins are expected to be comparable to the lowest cost mining operations
1. Excludes royalties.2. Assuming US$75 WTI, $15 differential WTI to WCS and $0.80 USD/CAD80
Wood Buffalo Pipeline
Extension
NorliteDiluent Pipeline
East Tank Farm Blending w/Condensate
Cheecham Terminal
Hardisty Terminal
Wood Buffalo Pipeline
AthabascaPipeline
WaupisooPipeline
Edmonton Terminal
Fort HillsMine Terminal
Northern CourierHot Bitumen Pipeline
Pipeline LegendExisting New
Logistics Solutions Planned Between Fort Hills, Edmonton and Hardisty
Pipeline/Terminal OperatorNominal Capacity
(kbpd)
TeckCapacity
(kbpd)
Northern Courier Hot Bitumen TransCanada 202 40.4
East Tank Farm- Blending Suncor 292 58.4
Wood Buffalo Blend Pipeline Enbridge 490 58.4
Wood Buffalo Blend Pipeline Extension Enbridge 490 58.4
Norlite Diluent Pipeline Enbridge 130 18
Hardisty Blend Tankage TBD
Teck
OptionsExport Pipe
Rail
Local Market
81
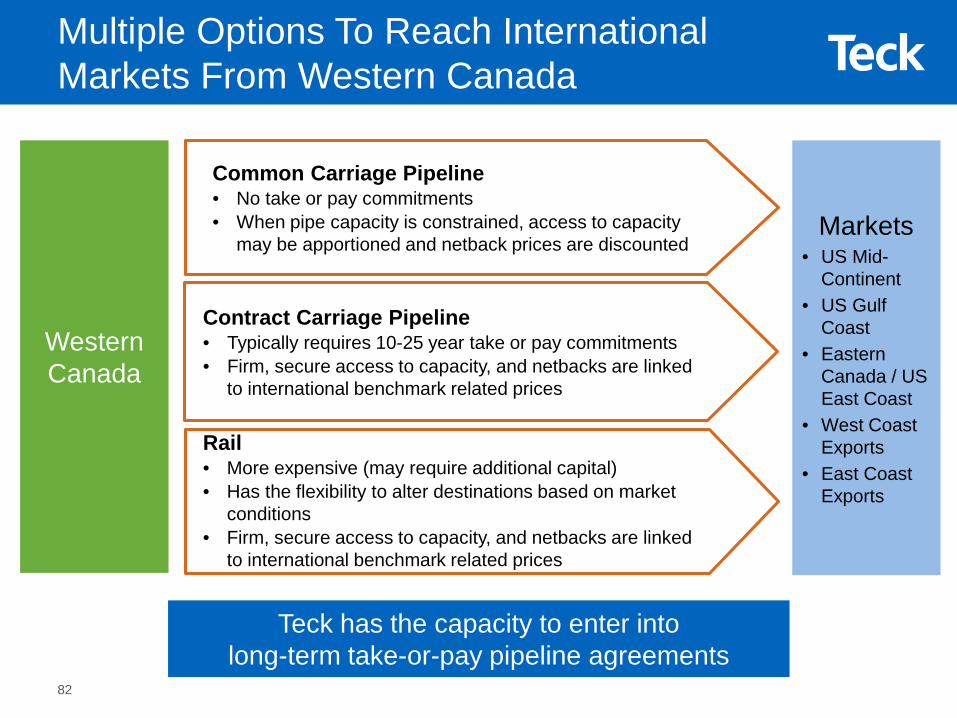
Common Carriage Pipeline• No take or pay commitments• When pipe capacity is constrained, access to capacity
may be apportioned and netback prices are discountedMarkets
• US Mid-Continent
• US Gulf Coast
• Eastern Canada / US East Coast
• West Coast Exports
• East Coast Exports
Western Canada
Contract Carriage Pipeline• Typically requires 10-25 year take or pay commitments• Firm, secure access to capacity, and netbacks are linked
to international benchmark related prices
Rail• More expensive (may require additional capital)• Has the flexibility to alter destinations based on market
conditions• Firm, secure access to capacity, and netbacks are linked
to international benchmark related prices
Multiple Options To Reach International Markets From Western Canada
Teck has the capacity to enter into long-term take-or-pay pipeline agreements
82