Postwar Economic Perspectives
15
Postwar Economic Perspectives IV. Aftermath of the War By W. S. Woytinsky* This article concludes a series summarizing a study of post- war perspectives undertaken to cast light on the setting for planning social security measures. In the three preceding issues, discussion dealt with the postwar outlook in terms of experience after World War I and of economic trends just before World War II; here, postwar projections are based on the war economy. As in all Bulletin articles, expressions of opinion represent views of the author and do not necessarily reflect conclusions of the Social Security Board. THE ROAD from the prewar slump in 1940 to hypothetical full employment in 1950 leads over the hump of the war boom. This road has three sec- tions: The upward slope: Mobilization of human and technical resources for total war; full utilization of the idle labor force and productive facilities, and expansion of both far beyond the peacetime pattern. The high plateau and peak: All-out war economy; more-than-full em- ployment; diversion of 40 to 45 per- cent of the gross national product to the war. The downward slope: Economic and military demobilization; return to peacetime patterns of life and work; shift of production from swords to ploughshares. Only after it has completed the descent from the peak of war effort to the valley of peacetime normalcy will the United States be able to re- sume its long-range ascent to higher and higher standards of production and consumption. On the last lap of this journey, the Nation will not necessarily retrace previous steps. As after all the major wars in the past, the comparatively brief spell of the war economy is bound to exercise a deep influence on the economic life of the United States, and it is likely that there will be a break between the long-range trends before the war and those prevailing after its end. To visualize postwar economic perspectives, it is necessary to analyze the influence of the war on the postwar labor force, on employ- ment, hours of work, the productivity of labor, the gross national product, wages, and so forth, and to investigate the probable effect of the war economy and its sudden end on the economic climate during and after reconversion. * Principal Consulting Economist, Bu- reau of Employment Security. The pre- ceding articles in the series appeared in the issues for December 1945 (pp. 18-29), January 1946 (pp. 8-16), and February 1946 (pp. 9-16). Chart 1.—Expansion of the labor force during the war and its reduction during reconversion The Labor Force Expansion of the labor force, in- cluding the armed forces, began in the middle of 1941, before the United States entered the war. Although no general shortage of labor was then in sight, work opportunities increased under the impact of the defense pro- gram, Selective Service enrolled about 100,000 men a month, and some "non- workers" began to look for jobs (table 1 and chart 1). The growth of the labor force was greatly accelerated after Pearl Harbor. By the end of 1942 the labor force included about 5 million persons who would not have had or sought paid work under normal conditions. The number of these emergency workers rose to more than 6 million by the summer of 1943, to 7 million in 1944, and continued to rise in 1945. As shown in an earlier article in this series, most of the wartime addition to manpower is temporary. 1 The problem here is to examine the probable course of the readjustment of the overexpanded labor force to peacetime conditions. Changes in the labor force from 1945 to 1950 may follow various pat- terns. The general tendency will probably be toward less-than-sea- sonal gains in spring and more-than- seasonal losses in autumn during sev- eral years of transition. I t is also possible that the labor force will de- crease for 2 or 3 years and then re- main stable for several years except for seasonal variations (chart 1). The reduction of the surplus labor force may be painful for millions of individuals. Some workers will draw unemployment benefits for a time 1 See the Bulletin, January 1946, pp. 10-11.
Transcript of Postwar Economic Perspectives

Postwar Economic Perspectives IV. Aftermath of the War
By W. S. Woytinsky* This article concludes a series summarizing a study of post
war perspectives undertaken to cast light on the setting for planning social security measures. In the three preceding issues, discussion dealt with the postwar outlook in terms of experience after World War I and of economic trends just before World War II; here, postwar projections are based on the war economy. As in all Bulletin articles, expressions of opinion represent views of the author and do not necessarily reflect conclusions of the Social Security Board.
T H E ROAD f rom the prewar slump i n 1940 to hypothetical full employment i n 1950 leads over the hump of the war boom. This road has three sections:
The upward slope: Mobilization of human and technical resources for to ta l war; fu l l ut i l izat ion of the idle labor force and productive facilities, and expansion of both far beyond the peacetime pattern.
The high plateau and peak: A l l -ou t war economy; more- than-ful l employment; diversion of 40 to 45 percent of the gross national product to the war.
The downward slope: Economic and mi l i t a ry demobilization; re turn to peacetime patterns of life and work; shif t of production f r o m swords to ploughshares.
Only after i t has completed the descent from the peak of war effort to the valley of peacetime normalcy w i l l the United States be able to resume its long-range ascent to higher and higher standards of production and consumption.
On the last lap of this journey, the Nation w i l l not necessarily retrace previous steps. As after al l the major wars i n the past, the comparatively brief spell of the war economy is bound to exercise a deep influence on the economic life of the United States, and i t is l ikely tha t there w i l l be a break between the long-range trends before the war and those prevailing after its end. To visualize postwar
economic perspectives, i t is necessary to analyze the influence of the war on the postwar labor force, on employment, hours of work, the productivity of labor, the gross national product, wages, and so fo r th , and to investigate the probable effect of the war economy and its sudden end on the economic climate during and after reconversion.
* Principal Consul t ing Economist, B u reau of Employment Security. The preceding articles in the series appeared i n the issues for December 1945 (pp. 18-29), January 1946 (pp. 8-16), and February 1946 (pp. 9-16).
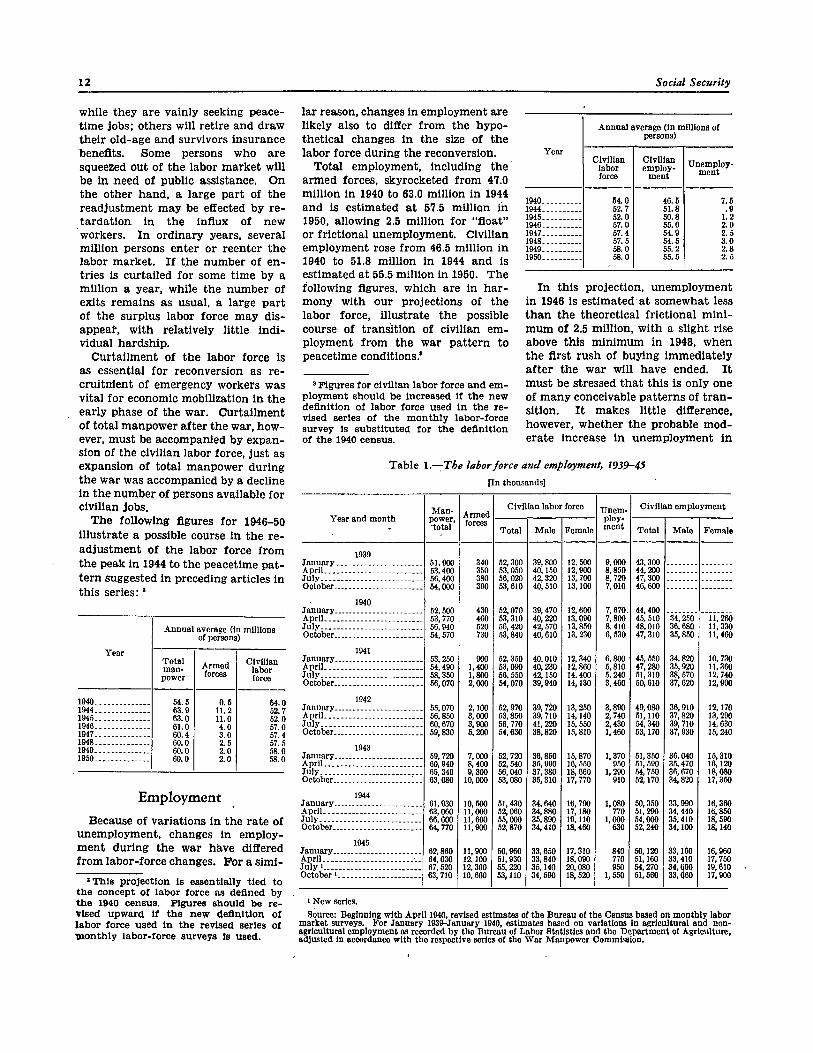
Chart 1.—Expansion of the labor force during the war and its reduction during reconversion
The Labor Force Expansion of the labor force, i n
cluding the armed forces, began i n the middle of 1941, before the United States entered the war. Al though no general shortage of labor was then i n sight, work opportunities increased under the impact of the defense program, Selective Service enrolled about
100,000 men a month , and some "non-workers" began to look for jobs (table 1 and chart 1) . The growth of the labor force was greatly accelerated after Pearl Harbor. By the end of 1942 the labor force included about 5 mi l l ion persons who would not have had or sought paid work under normal conditions. The number of these emergency workers rose to more than 6 mi l l ion by the summer of 1943, to 7 mi l l ion i n 1944, and continued to rise i n 1945. As shown i n an earlier article i n this series, most of the wartime addition to manpower is temporary. 1
The problem here is to examine the probable course of the readjustment of the overexpanded labor force to peacetime conditions.
Changes i n the labor force from 1945 to 1950 may follow various patterns. The general tendency w i l l probably be toward less-than-sea-sonal gains i n spring and more-than-seasonal losses i n autumn during several years of transit ion. I t is also possible tha t the labor force w i l l decrease for 2 or 3 years and then remain stable for several years except for seasonal variations (chart 1) .
The reduction of the surplus labor force may be painful for millions of individuals. Some workers w i l l draw unemployment benefits for a time
1 See the Bulletin, January 1946, pp . 10-11.
while they are vainly seeking peacetime jobs; others w i l l retire and draw their old-age and survivors insurance benefits. Some persons who are squeezed out of the labor market w i l l be i n need of public assistance. On the other hand, a large part of the readjustment may be effected by retardat ion i n the inf lux of new workers. I n ordinary years, several mi l l ion persons enter or reenter the labor market. I f the number of entries is curtailed for some t ime by a mi l l ion a year, while the number of exits remains as usual, a large par t of the surplus labor force may disappear, w i t h relatively l i t t l e i n d i vidual hardship.
Curtai lment of the labor force is as essential for reconversion as re-crui tment of emergency workers was vi ta l for economic mobilization i n the early phase of the war. Curtai lment of total manpower after the war, however, must be accompanied by expansion of the civil ian labor force, just as expansion of total manpower during the war was accompanied by a decline i n the number of persons available for civi l ian jobs.
The following figures for 1946-50 il lustrate a possible course i n the readjustment of the labor force from the peak i n 1944 to the peacetime pattern suggested i n preceding articles i n this series: 2
2 This project ion is essentially t ied to the concept of labor force as defined by the 1940 census. Figures should be revised upward i f the new def in i t ion of labor force used i n the revised series of m o n t h l y labor-force surveys is used.
Year
Annual average (in millions of persons)
Year Tota l manpower
Armed forces
Civi l ian labor force
1940 54.5 0.5 54.0 1944 63.9 11.2 52.7 1945 63.0 11.0 52.0 1946 61.0 4.0 57.0 1947 60.4 3.0 57.4 1948 60.0 2.5 57.5 1949 60.0 2.0 58.0 1950 60.0 2.0 58.0
Employment Because of variations i n the rate of
unemployment, changes i n employment dur ing the war have differed f rom labor-force changes. For a s imi
lar reason, changes i n employment are l ikely also to differ f rom the hypothetical changes i n the size of the labor force during the reconversion.
Total employment, including the armed forces, skyrocketed f rom 47.0 mi l l ion i n 1940 to 63.0 mi l l ion i n 1944 and is estimated at 57.5 mi l l ion i n 1950, allowing 2.5 mi l l ion for "float" or fr ict ional unemployment. Civi l ian employment rose from 46.5 mi l l ion i n 1940 to 51.8 mi l l ion i n 1944 and is estimated at 55.5 mi l l ion in 1950. The following figures, which are i n harmony w i t h our projections of the labor force, i l lustrate the possible course of t ransi t ion of civil ian employment from the war pat tern to peacetime conditions. 3
3 Figures for c iv i l i an labor force and employment should be increased i f the new def in i t ion of labor force used i n the revised series of the m o n t h l y labor-force survey is substi tuted for the def ini t ion of the 1940 census.
Year
Annual average ( in millions of persons)
Year Civ i l i an
labor force
Civ i l i an employ
ment Unemploy
ment
1940 54.0 46.5 7.5 1944 52.7 51.8 .9 1945 52.0 50.8 1.2 1946 57.0 55.0 2.0 1947 57.4 54.9 2.5 1948 57.5 54.5 3.0 1949 58.0 55.2 2.8 1950 58.0 55.5 2.5
I n this projection, unemployment i n 1946 is estimated at somewhat less than the theoretical f r ic t ional m i n i m u m of 2.5 mi l l ion , w i t h a slight rise above this m in imum i n 1948, when the first rush of buying immediately after the war w i l l have ended. I t must be stressed tha t this is only one of many conceivable patterns of t r a n sition. I t makes l i t t l e difference, however, whether the probable moderate increase i n unemployment i n
Table 1.—The labor force and employment, 1939-45 [ I n thousands]
Year and month M a n
power, total
Armed forces
Civi l ian labor force Unemployment
Civi l ian employment Year and month
M a n power,
total Armed forces
Total Male Female
Unemployment Total Male Female
1939 January 51,900 340 52,300 39,800 12,500 9,000 43,300 ---- ---A p r i l 53,400 350 53,050 40,150 12,900 8,850 44,200 --- ---July 56,400 380 56,020 42,320 13,700 8,720 47,300 --- ---October 54,000 390 53,610 40,510 13,100 7,010 46,600 --- ---
1940 January 52,500 430 52,070 39,470 12,600 7,670. 44,400 --- ---A p r i l 53,770 460 53,310 40,220 13,090 7,800 45,510 34,250 11,260 July 56,940 520 56,420 42,570 13,850 8.410 48,010 36,680 11,330 October 54,570 730 53,840 40,610 13.230 6,530 47,310 35,850 11,460
1941 January 53,250 900 52,350 40.010 12,340 6,800 45,550 34,820 10,730 A p r i l 54,490 1,400 53,090 40,230 12,860 5,810 47,280 35,920 11,360 July 58,350 1,800 56,550 42,150 14.400 5,240 51,310 38,570 12,740 October 56,070 2,000 54,070 39,940 14,130 3,460 50,610 37,620 12,990
1942 January 55,070 2,100 52,970 39,720 13,250 3,890 49,080 36,910 12,170 A p r i l 56,850 3,000 53,850 39,710 14,140 2,740 51,110 37,820 13,290 July 60,670 3,900 56,770 41,220 15,550 2,430 54,340 39,710 14,630 October 59,830 5,200 54,630 38,820 15,810 1,460 53,170 37,930 15,240
1943 January 59,720 7,000 52,720 36,850 15,870 1,370 51,350 36,040 15,310 A p r i l 60,940 8,400 52,540 35,990 16,550 950 51,590 35,470 16,120 July 65,340 9,300 56,040 37,380 18,660 1,290 54,750 36,670 18,080 October 63,080 10,000 53,080 35,310 17,770 910 52,170 34,820 17,350
1944 January 61,930 10,500 51,430 34,640 16,790 1,080 50,350 33,990 16,360 A p r i l 63,060 11,000 52,060 34,880 17,180 770 51,290 34,440 16,850 July 66,600 11,600 55,000 35,890 19,110 1,000 54,000 35,410 18,590 October 64,770 11,900 52,870 34,410 18,460 630 52,240 34,100 18,140
1945 January 62,860 11,900 50,960 33,650 17,310 840 50,120 33,160 16,960 A p r i l 64,030 12,100 51,930 33,840 18,090 770 51,160 33,410 17,750 July 1 67,520 12,300 55,220 35,140 20,080 950 54,270 34,660 19,610 October 1 63,710 10,600 53,110 34,590 18,520 1,550 51,560 33,660 17,900
1 New series.
Source: Beginning w i t h A p r i l 1940, revised estimates of the Bureau of the Census based on monthly labor market surveys. For January 1939-January 1940, estimates based on variations in agricultural and non-agricultural employment as recorded by the Bureau of Labor Statistics and the Department of Agriculture, adjusted in accordance w i t h the respective series of the War Manpower Commission.

Table 2.—Distribution of employment, 1939-45
[ I n thousands]
Year and month Agri culture
Govern
ment
Employment i n private nonagricultural establishments adjusted for seasonal variations
Year and month Agri culture
Govern
ment Tota l
Manufactur
ing M i n
ing
Transportation and
public utili t ies
Construction
Trade Finance, service,
and miscellaneous
1939 March --- 3,930 25,837 9,738 875 2,870 1,711 6,523 4,120 June --- 3,960 26,272 9,924 855 2,905 1,828 6,599 4,161 September --- 4,020 26,817 10,334 874 2,935 1,794 6,670 4,210 December --- 4,090 27,167 10,641 923 2,090 1,603 6,791 4,219
1940 March --- 4,090 26,926 10,439 916 2,990 1,496 6,821 4,264 June 11,000 4,110 27,265 10,458 908 2,998 1,736 6,865 4,300 September 10,400 4.160 28,010 11,017 918 3,025 1.758 6,951 4,341 December 8,700 4,200 29,195 11,589 926 3,076 2,135 7,076 4,393
1941 March 7,620 4,310 30,097 12,174 943 3,131 2,260 7,192 4,397 June 10,100 4,430 31,324 13,032 970 3,254 2,239 7,388 4,441 September 9,300 4,530 32,240 13,580 1,000 3,331 2,327 7,548 4,454 December 7,500 4,650 32,212 13,748 1,002 3,367 2,115 7,487 4,493
1942 March 7,690 4,870 32,522 14,255 976 3,382 2,055 7,331 4,523 June 10,230 5,140 33,060 14,865 981 3,419 2,057 7,206 4,532 September 8,860 5.430 33,740 15,644 962 3,448 2,077 7,227 4,382 December 7,380 5,700 34,197 16,333 933 3,525 2,041 7,136 4,229
1943 March 7,230 5,910 34,155 16,831 915 3,574 1,604 7,110 4,121 June 9,820 5,960 33,813 16,908 893 3,620 1,263 7,017 4,112 September 9,050 5.810 33,665 17,051 876 3,633 1,020 7,006 4,079 December 6,820 5,980 33,498 16,995 863 3,687 864 6,962 4,127
1944 March 6,910 5,900 33,222 16,642 852 3,780 737 7,046 4,165
June 9.560 5,900 32,870 16,093 848 3,765 677 7,012 4,475 September 8,670 5,890 32,500 15,771 824 3,732 635 7,058 4,480 December 7,090 6,080 32,082 15,552 802 3,790 619 7,015 4,304
1945 March 7,290 6,030 32,430 15,445 796 3,846 691 7,214 4,438 June 8,300 5,953 31,596 14,534 794 3,830 845 7,004 4,589 September 1 8,800 5,933 29,401 12,097 784 3,834 945 7,138 4,603 December 1 7,192 5,769 30,550 11,914 802 3,896 1,042 7,962 4,936
1 Wi thout seasonal adjustment. Source: War Manpower Commission, Manpower Statistics, July 1945. For September and December 1945,
Monthly Labor Review.
tha t phase of the postwar economy is visualized i n 1948 or somewhat earlier or later.
A l l i n a l l , the number of civi l ian jobs i n 1950 is estimated at almost 20 percent more than i n 1940 and 7 percent more than i n 1944. Since, however, the hypothetical figure for 1950 is related to a population about 5 percent larger than i n 1944, a 7-percent increase i n civi l ian employment f rom 1944 to 1950 implies only that , i n relat ion to population, there should be about as many civi l ian jobs i n 1950 as in 1944.
This statement does not mean tha t a peacetime job should be substituted for each terminated war job i n the course of the industr ial reconversion. To ensure jobs to veterans re turning to civilian life, the civi l ian economy should expand through the whole period of mi l i t a ry demobilization. Such a course would be impossible i f
civi l ian production were increased to the l i m i t prematurely, i n the early phase of reconversion. I n other words, a smooth reconversion demands a lag between contraction of war production and the expansion of peacetime activities.
The task of reconversion, i n terms of employment, w i l l differ f rom i n dustry to industry. I n some industries, the" level of act ivi ty at the end of the war was well above the goal of the peacetime fu l l employment, and the task of reconversion w i l l be to deflate wartime expansion. I n others, the level of production was far below the peacetime patterns; here the task is to increase production. For the United States as a whole, increases i n civil ian employment w i l l probably exceed decreases.
Civi l ian employment during the war was characterized by precipitous growth of manufacturing industries,
especially production of airplanes, ships, tracks, tanks, guns, and m u n i tions; expansion of Government agencies; and contraction of building activities (table 2 ) . I n comparison w i t h the hypothetical demand for labor i n 1950, Government and manufacturing each had a surplus of 2 mi l l ion jobs i n 1944. On the other hand, 1944 recorded an acute shortage of labor i n agriculture, building construction, and trade and service industries i n comparison w i t h postwar requirements.
For salary and wage workers i n p r i vate nonagricultural establishments, fu l l employment i n 1950 presumes some 34.9 mi l l ion jobs, 2.2 mi l l ion more than i n 1944. W i t h reservation for a wide margin of error i n a projection of this type, the demand for labor i n 1950 may differ f rom tha t i n 1944 as follows:
Industry
Number of employees (in thousands)
Industry
1944 1
1950, hypothetical 2
Increase ( + ) or
decrease ( - ) from
1944 to 1950
Total 32,670 34,900 +2,230
Manufacturing 16,010 14,000 -2,010 M i n i n g 830 900 +70 Construction 670 3,000 +2,330 Transportation and pub
lic utilities 3. 770 3,500 -270 Trade 7, 030 8,000 +970 Finance, service, miscel
laneous 4, 360 5,500 +1,140
1 See table 2, column 4. 2 For the basis of these projections, see the Bulletin,
January 1940, pp. 15-16.
Hours of Work Because of the labor shortage, hours
of work were increased during the war. M a n y industries—especially munitions industries—shifted f rom the customary 40-hour week to 48 or 50 hours. The average weekly n u m ber of hours of work i n manufacturing industries increased from 37.5 i n 1940 to 45.5 i n 1944. The input of work of factory workers rose f rom 412.5 m i l l ion man-hours per week i n 1940 to 728 mi l l ion i n 1944. The increase i n man-hours was 76.5 percent, as compared w i t h a rise of 44.5 percent i n man-years of employment.
Considerable increases i n hours of work were also recorded i n mining, transportation, public utili t ies, and service industries. A l l i n al l , i n 1944

approximately 20 mi l l ion persons i n nonagricultural establishments averaged an extra hour a day, as compared w i t h prewar working hours, and their additional work was equivalent to the employment of 4 mi l l ion workers. Tha t figure rises to 5 mi l l ion when account is taken of the strenuous work on farms during the war. 4 Thus, the 51.8 mi l l ion persons employed through 1944 performed the number of man-hours of work tha t would have required 56.8 mi l l i on workers under prewar work schedules. I n 1940, employment represented some 46.5 m i l l ion man-years of work, so tha t the rise from 1940 to 1944 i n "normal" man-years of work, w i t h the prewar work schedule, was more than 22 percent.
F rom the standpoint of social progress, the wart ime increase i n the workweek was a deplorable set-back, wiping out the results of a quarter century's efforts to secure better working hours and greater leisure. Probably the t rend toward further reduction of the workweek w i l l be resumed when agreements have been reached on wages and salaries. I t is also likely tha t paid vacations w i l l become increasingly common. The t rend toward shorter hours of work may be somewhat offset, however, by reduction of part-t ime work, which before the war kept the average weekly number of hours of work per worker below 40. The over-all decline i n average hours of work from 1940 to 1950 may therefore be comparatively small, say 3 percent. Using that figure, the changes outlined above i n civil ian employment would result i n the following changes i n i n put of work i n terms of "1940" man-years.
Year "1940"
man-years (in millions)
Index 1940=100
1940 46.5 100 1944 56.8 122 1950 53.8 115
Thus, fu l l employment i n 1950 i m plies about 5.3 percent fewer man-hours of civi l ian labor than were per
formed i n 1944: release of servicemen and growth of population are likely to be more than offset by wi thdrawal of emergency workers and reduction i n hours of work.
4 Th is estimate makes no allowance for overtime work of self-employed persons and members of the i r families i n non-agr icul tura l pursui ts and for increased hours of work i n indus t r i a l establishments for wh ich no reliable statistics are available.
Productivity of Labor Variations i n the productivity of
labor i n wart ime are usually concealed by changes i n patterns of production, deterioration of quality, and erratic movements of uncontrolled prices. Though the achievements of munitions industries, especially i n airplane production and shipbuilding, have been spectacular, i t is questionable whether other industries have kept pace during the war w i t h the long-range trend of technological progress.
Although war contracts were heavi ly concentrated i n durable-goods i n dustries, some nondurable goods also were required for mi l i t a ry purposes. The part played by war production i n the reported gains i n output per man-hour i n the two groups of industries is unknown, but i t is recognized tha t w i t h i n an industry war contracts were awarded to the most efficient and best-equipped factories; tha t war production had pr ior i ty i n obtaining skilled labor, raw materials, and transportation; and tha t war plants had the. advantage of mass product ion of standardized goods. On the other hand, producers of civil ian goods had to struggle w i t h al l kinds of shortages and bottlenecks.
I t is l ikely, therefore, tha t war production had the lion's share i n the visible over-all gain i n output per man-hour and tha t technological progress i n civi l ian production as a whole was insignificant. I t is even questionable whether any appreciable increase i n productivity of labor could be discerned i n this field of production i f deterioration i n the quality of f i n ished goods is taken in to account.5
I n any event, i t is rather doubtful whether the productivity of labor i n peacetime industries increased f rom 1940 to 1945 at the annual rate of 2.5 percent corresponding to the long-
range t rend i n technological progress i n the Uni ted States. I n the long run, however, the experience gained i n war production is l ikely to accelerate technical and economic progress generally, as i t d id after the Civi l W a r and Wor ld W a r I . A comparatively rapid rise i n the productivity of labor is likely to occur i n the years just ahead. Therefore, i f distr ibution of the labor force by industries and occupation remained the same as i n 1944, the over-all output per man-hour i n 1950 migh t be at least 15 percent higher than i n 1944. This estimate is, however, subject to an i m portant reservation: industr ial and occupational dis tr ibut ion of the labor force is bound to change when the Nation shifts f rom war to a peacetime economy.
As far as the national product is concerned, gains i n the product ivi ty of labor wi l l be par t ly offset by the shift of millions of workers f rom h igh -wage and high-output industries to low-wage and low-output pursuits. The Nation's losses f rom such shifts may be measured very roughly by losses i n earnings of workers. According to current wage rates, workers shift ing f rom the machinery and i r o n and steel industries to textile factories would lose about 40 percent of their wartime hourly take-home pay; those shift ing from factory work to bui lding construction or retai l trade would take cuts of 15 percent; women leaving factory jobs for domestic service would receive less than hal f their wartime earnings. Assuming that about 30 percent of the workers change their jobs i n the course of reconversion and tha t their wart ime hourly output declines 30 percent (proportionately to their earnings), the over-all output per man-hour would rise from 1944 to 1950 not by 15 percent but by only 4.6 percent. Under this assumption, the t ransi t ion to a peacetime economy may be described roughly by the following i n dexes:
I t e m 1944 1950
Man-hours of civil ian work performed 100.0 94.7
Product iv i ty of labor (output per man-hour) 100.0 104.6
Output of civi l ian goods and services 100.0 99.1
5 Cf. "Nat ional Product, War and Prewar: Some Comments on Professor K u z -nets' Study and a Reply by Professor Kuznets," Review of Economic Statistics, August 1944, pp. 109-135 (articles by M i l t o n Gilbert , Hans Staehle, W. S. Woy-t insky, and Simon Kuzne ts ) .

Table 3.—Gross national product and national income, 1939-June 1945
[ I n billions, at current prices]
I t em 1939 1940 1941 1942 1943 1944 1945
Gross national product or expenditures: Total $88.6 $97.0 $120.2 $152.3 $187.4 $197.6 $197.3
Government, total 16.0 16.7 26.5 62.7 93.5 97.1 83.0 Federal: War 1.4 2.7 13.5 50.3 81.3 83.7 69.0
Nonwar 6.5 6.1 5.3 5.0 4.9 5.7 6.1 State and local 8.1 7.9 7.9 7.4 7.4 7.7 7.9
Available for private use 72.6 80.4 93.7 89.6 93.9 100.5 114.3 Private gross capital formation 10.9 14.7 19.1 7.6 2.5 2.0 9.4 Consumers' goods and services 61.7 65.7 74.6 82.0 91.3 98.5 04.9
Durable goods 6.4 7.4 9.1 6.3 6.6 6.7 7.4 Nondurable goods 32.6 34.4 40.1 47.9 55.1 60.0 64.4 Services 22.7 23.9 25.4 27.8 29.7 31.8 33.1
Relation of gross national product to national income:
Gross national product 88.6 97.0 120.2 152.3 187.4 197.6 197.3 Less: Business taxes, etc -10 .4 -12 .4 -18 .5 - 2 3 . 1 -27 .4 -29 .7 -28 .6 Less: Capital charges, etc - 7 . 0 - 7 . 3 - 7 . 8 - 8 . 2 - 8 . 5 - 8 . 7 - 8 . 7 Adjustment - . 4 + . 5 + 3 . 0 +1 .2 - 2 . 1 +1.5 + 1 . 0
Equals: National income 70.8 77.8 96.9 122.2 149.4 160.7 161.0 National income by distributive shares: Tota l 70.8 77.8 96.9 122.2 149.4 160.7 161.0
Compensation of employees 48.1 52.4 64.5 84.1 106.3 116.0 114.5 Salaries and wages 44.2 48.7 60.8 80.8 103.1 112.8 111.4 Supplements 3.8 3.7 3.7 3.3 3.2 3.2 3.1
Net income of proprietors 11.2 12.2 15.8 20.6 23.5 24.1 25.6 Agriculture 4.3 4.4 6.3 9.7 11.9 11.8 12.5 Nonagriculture 6.9 7.8 9.6 10.9 11.6 12.3 13.1
Interest and net rents 7.4 7.5 8.0 8.8 9.7 10.6 11.8 Net corporate profits 4.2 5.8 8.5 8.7 9.8 9.9 9.0
Dividends 3.8 4.0 4.5 4.3 4.3 4.5 4.5 Savings .4 1.8 4.0 4.4 5.5 5.4 4.5
Disposition of national income: Tota l 70.8 77.8 96.9 122.2 149.4 160.7 161.0
A d d : Transfer payments +2 .4 +2 .6 +2 .5 +2 .7 + 3 . 2 +5.3 + 8 . 1 Less: Social security contributions - 2 . 0 - 2 . 1 - 2 . 6 - 3 . 2 - 3 . 8 - 3 . 9 - 3 . 8 Less: Corporate savings - . 4 - 1 . 8 - 4 . 0 - 4 . 4 - 5 . 5 - 5 . 4 - 4 . 5
Equals: Income payments to individuals 70.8 76.5 92.7 117.3 143.1 156.8 160.7 Less: Personal taxes, etc - 3 . 1 - 3 . 3 - 4 . 0 - 6 . 7 -18 .6 -19.4 -21 .0
Equals: Disposable income of individuals 67.7 73.2 88.7 110.6 124.6 137.4 139.7 Consumers' expenditures 61.7 65.7 74.6 82.0 91.3 93.5 104.9 Net savings of individuals 6.0 7.5 14.2 28.6 33.3 38.9 34.9
Source: Survey of Current Business, March 1943-February 1945, and February 1946.
W i t h allowance for a considerable margin of error, i t appears tha t a full-employment civi l ian economy i n 1950 would yield an over-all civi l ian output somewhat less t h a n i n 1944.
Gross National Product I n addition to goods and services
produced by the civi l ian economy, the gross national product includes services of the armed forces. This i t em would have been hardly less than $25 bil l ion i f subsistence costs of the armed forces were added to their salaries and the sum interpreted as an equivalent of their services. However, only the money payments to the armed forces amounting to $14 bi l l ion are listed i n 1944 gross national product as determined by the Department of Commerce. The comparable i tem for 1950 may amount to $3 bi l l ion. Excluding the services of the armed forces, the gross national product i n 1944 amounted to $184 bi l l ion. W i t h the slight decline as suggested above, the value of goods and services pro
duced i n the civil ian sector of the national economy would be close to $182 bi l l ion i n 1950. Adding $3 bi l l ion for services of the armed forces, the total would be $185 bil l ion—at 1944 prices, which is slightly more than tha t indicated by another projection using 1940 as a bench mark without regard to changes i n national income during the war. The disparity between the two computations falls w i t h i n the unavoidable margin of error. The essential point is tha t fu l l employment i n 1950 does not postulate tha t the gross national product must be as great as i n 1944 but only tha t i t should not lag more than 10 percent behind what i t was at the peak of the war effort. A reconversion f rom the war boom to peacetime fu l l employment presumes therefore a downh i l l movement. A smooth and successful reconversion requires tha t the descent be no t too abrupt and tha t i t stop when production returns to the level of peacetime prosperity.
Moreover, the slope may be somewhat steeper than i t appears from comparison of the gross national product of $199 bi l l ion i n 1944 w i t h the hypothetical $180 bi l l ion i n 1950. W i t h correction for the growth i n population and the long-range trend i n technological progress, $180 bi l l ion i n 1950 represents hardly more than $165 bi l l ion i n 1946. Reconversion to peacetime fu l l employment therefore implies an appreciable contraction of the overexpanded war economy i n terms of output per head of population or per un i t of available productive forces.
I n fact, because of expansion of active manpower (including the armed forces) during the war and the longer workweek, the inpu t i n man-hours was at least 20 percent higher i n 1944 than i t would be i n fu l l employment under normal conditions. The ret u r n to normalcy would require a considerable cut i n inpu t of work as measured i n man-hours, and this postulate is expressed by the contract ion tha t would occur i f the gross nat ional product sinks f rom $199 bi l l ion to $165 bi l l ion.
The task of reconversion is not to minimize this decline during the shift to a peacetime economy but to effect the necessary readjustment i n such a way as to avoid a deflationary spiral and to ensure a smooth upward expansion of the civil ian economy from its hypothetical low point.
To visualize the road f rom war to peace i n terms of annual variations of gross national product and national income, their variations during the war should be recapitulated (table 3 ) . The gains from 1939 to 1941 marked essentially the l iquidation of the prewar slump which had interrupted the recovery tha t had been i n progress since the spring of 1933. I n fact, appreciable rise of employment and expansion of production related to the war did not begin un t i l the second half of 1941. The subsequent growth of the national product, expressed i n dollars, reflected to some extent the rise of prices, but i t is practically impossible to isolate this factor. 6
The indexes of wholesale prices and of consumers' prices prepared by the
6 Cf. Kuznets, Simon, National Product in Wartime, National Bureau of Economic Research, 1945, pp. 38 ff.

Bureau of Labor Statistics rose above the 1939 averages as follows:
Year Index of
wholesale prices
Index of goods purchased by
wage earners
1939 100 100 1940 102 101 1941 113 106 1942 128 117 1943 134 124 1944 135 126 1945 137 128
I f half the gross national product is deflated by the wholesale price index and the other by the consumer price index, nominal and real gross national income increased as follows:
Year
Nominal gross
income, current
prices ( in billions)
Real gross income,
1944 prices (in billions)
1939 $88.6 $115.6 1940 97.0 124.7 1941 120.2 143.2 1942 152.3 162.2 1943 187.4 189.6 1944 197.6 197.6 1945 197.3 194.3
I f the gross national product i n 1950 amounts to $180 bi l l ion, at 1944 prices, i t w i l l be not much lower than i n 1943. W i t h the regearing of product ion to peacetime needs, i t would provide a higher standard of l iv ing than the United States has ever known.
I n table 4, a distr ibution of the hypothetical gross national product i n 1950 is contrasted w i t h tha t i n 1S44. The hypothetical distr ibution of consumers' expenditures among durable goods, nondurable goods, and services shown i n this table rests on the f o l lowing considerations. Because of the re turn of servicemen to civil ian life
and cumulative effect of war and postwar marriages, the number of households wi l l rapidly increase. Assuming a 15-percent rise i n the number of consumer units and the same pattern of consumption as i n 1944, the demand for consumers' goods and services would rise from $98.5 bi l l ion i n 1944 to $113.3 bi l l ion i n 1950 ($7.7 bi l l ion for durable goods, $69 bil l ion for nondurable goods, and $36.6 b i l l ion for services). A n additional $15.5 bi l l ion is assigned mainly to those fields of consumption which did not expand during the war—that is, to durable goods and to services. The t rend would be to re tu rn to the prewar pattern of distr ibution, but on a higher level.
The hypothetical changes i n the distr ibution of national expenditures from 1944 to 1950 may be interpolated under the assumption tha t the l i qu i dation of the war economy w i l l contract production considerably i n the last quarter of 1945 and the first half of 1946; that losses wi l l be part ly offset by, the expansion of peacetime production i n the second half of 1946; tha t the upward t rend w i l l continue through 1947; tha t the expansion w i l l be slowed down i n 1948 by a temporary set-back related to readjustment of prices; and tha t production w i l l rise i n 1949 and 1950.
This concept of general trends i n the postwar economy may be combined w i t h the assumptions of varying rates of change for different items of the gross national product (table 5) . I t is not unlikely, for example, that capital outlays w i l l be par t icular ly heavy i n 1947 and decline slightly thereafter; tha t private consumption wi l l be somewhat lower i n 1946 than i n 1945 and w i l l expand after reconversion is completed; tha t Federal expenditures wi l l drop i n 1946 to about ha l f the 1944 peak and decline gradually later.
The set-back i n 1946 indicated i n the projection i n table 5 marks the
l iquidation of the overexpansion of the economic system that is characteristic of wartime. W i t h the w i t h drawal of temporary workers, reduct ion of hours of work, and re turn of workers from wart ime jobs to less lucrative peacetime pursuits, nat ional output of goods and services must go down and tha t decline may be only par t ly offset by the r is ing productivi t y of labor. This downward movement does not necessarily imply mass unemployment. O n the contrary, the suggested variations i n gross national product were computed under the assumption of nearly fu l l employment of the available labor force as i n d i cated i n chart 1 and i n projections for civil ian employment on page 12.
As far as our figures rest on th is computation they are hypothetical and to some extent i l lustrative of what would occur under the postulated conditions which may exist or not i n the future. However, the hypothesis of an expansive economy i n postwar years has not been picked up at r a n dom from the mult i tude of arbi t rary assumptions. I t has been selected rather on the basis of economic and historical analysis tha t pointed to this type of development as most probable. I n this sense, figures i n table 5 indicate the probable economic trends i n the United States i n the years ahead.
Table 4.—Gross national product in 1944 and 1950
[ I n billions, at 1944 pricesl
I t em 1944 1 1050 2
Gross national product, total $197.6 $180. 0
Government share 97.1 28.4 Federal 89.4 17.6 State and local 7.7 10.8
Available for private use 100.5 151.6 Private gross capital forma
tion (business share) 2.0 22.8 Consumers' goods and services 98.5 128.8
Durable goods 6.7 14.5 Nondurable goods 60.0 70.0
Services 31.8 44.3
1 Survey of Current Business, July 1945, p. 12. 2 See the Bulletin, February 1946, p . 14 (figures in
table 3, recomputed at 1944 prices).
Table 5.—Hypothetical changes in gross national product, 1944–50 [ I n billions, at 1944 prices]
I tem 1944 1945 1946 1947 1948 1949 1950
Total $197.6 $194.3 $160 $170 $170 $175 $180.0
Government 97.1 81.8 50 35 32 30 28.4 Private use 100.5 112.5 110 135 138 145 151.6 Capital formation 2.0 9.2 20 30 28 25 22.8 Consumer goods and services 98.5 103.3 90 105 110 120 128.8
The probable national income for each year may be derived by deducting business taxes and capital charges f rom the hypothetical gross nat ional product (table 6) .
I n these estimates, national income is 14 percent less in 1946 than i n 1944, rises i n 1947 to about 92 percent of the 1944 amount, and declines slightly i n 1948. Such a set-back would parallel the anticipated variations i n employment and would be somewhat analogous to the "primary postwar depression" i n 1920-21. After W o r l d War I , however, the country went th rough a violent inflation followed by

the collapse of prices, while this t ime the rise of prices has been kept u n der control both during the war and i n the early phase of the reconversion. Unless the controls collapse, a setback i n 1948 is likely to be less violent t han i n 1920-21. This assumption underlies projections of economic conditions i n 1946-50 i n this study.
Table 6.—Hypothetical changes in national income, 1944-50 [ I n billions, at 1944 prices]
I t e m 1944 1945 1946 1947 1948 1949 1950
Gross national product $197.6 $194.3 $160.0 $170.0 $170.0 $175.0 $180.0 Less: Business taxes, etc. -29 .7 -28 .2 -12.5 -13 .0 -13.4 -13.8 -14 .2
Less: Capital charges - 8 . 7 - 8 . 6 - 9 . 5 - 9 . 7 -10 .0 -10 .4 -10.8 Adjustments +1 .5 +1 .0 --- --- --- --- ---
Equals: National income 160.7 158.5 138.0 147.3 146.6 150.8 155.0
Wages The war-caused significant changes
i n the distr ibution of national income. Compensation of employees ( including pay of the armed forces but excluding Government allowances to servicemen's dependents) increased f rom 67.4 percent of total national i n come i n 1940 to 72.2 percent i n 1944; the farmers' share rose f rom 5.7 percent to, 7.3 percent, while tha t of proprietors i n nonagricultural pursuits (nonincorporated business) fell f rom 10.0 percent to 7.7 percent. There was also a substantial decline i n the relative share of interest and net rents ( f rom 9.6 percent to 6.6 percent) and of net corporate profits (from 7.5 percent to 6.2 percent).
I t is likely tha t the distr ibution of nat ional income after the war w i l l neither duplicate tha t of 1944 nor ret u r n to the prewar pattern. The new distr ibution w i l l probably lie between these two extremes but be more l ike the prewar pattern. Table 7 shows a tentative distr ibution of hypothetical national income i n 1945-50 under the assumption tha t the relative shares of employees and farmers, apart f rom annual fluctuations, decline i n comparison w i t h 1944 but remain somewhat higher than i n 1940; tha t the share of interest and net rents is greater t h a n before the war and i n creases steadily; t ha t the share of proprietor income i n nonagricultural industries and dividends increases, and tha t of nondistributed corporate profits (corporate savings) declines.
Salaries and wages of civi l ian work
ers (excluding the armed forces but including civilians i n public service) i n 1950 are set i n table 7 at $99.3 (=102.3—3.0) bi l l ion, slightly more than the 1944 amount ($98.8 b i l l i on ) . On the other hand, i t is anticipated that , i n terms of man-hours, the vo l ume of c ivi l ian work w i l l be appreciably less i n 1950 than i n 1944. Consequently i t is assumed tha t average straight hourly wage rates i n 1950 w i l l be sufficiently higher than i n 1944 to more t h a n offset e l iminat ion of overt ime bonuses and the shift of workers f rom high-wage war industries to less lucrative peacetime jobs.
Closer analysis shows than an upward revision of wage rates is not only compatible w i t h the stabili ty of prices but is a premise of such stability. I n fact, though the national wage b i l l i n creased greatly during the war, hourly wage rates could not be adjusted adequately to the growing product ivi ty of labor and the rising cost of l iv ing. The increase i n the total was due mainly to the increase i n employment, the longer workweek, overt ime pay, and expansion of high-wage industries, and only to a small degree to the rise of basic wage rates.
I n the manufacturing industries, for example, where the weekly wage pay ro l l increased, according to the Department of Commerce, f rom $178
mi l l ion i n January 1939 to $597 m i l l i o n i n A p r i l 1945, $116 mi l l ion of the i n crease was due to increased employment, $103 mi l l ion to the longer workweek (apart f rom overtime pay and changes i n inter- industry distr ibut ion of workers), and $76 mi l l ion to overt ime pay and shift of workers to h igh -paying industries. Straight hourly wage rates rose 42.2 percent. 7 This average rate of increase was higher than tha t of the official cost-of-living index (30 percent, i n round numbers) but hardly much higher than the actual advance of prices i f the hidden inflat ion is taken into account. Thus, re tu rn to the 1939 industr ial dis t r ibut ion of the labor force and 1939 hours would have cut the real hour ly earnings of factory workers to the prewar level. I n view of the rise i n product i v i t y of labor, this would mean a substantial decline i n the relative share of workers i n the value of the output. Apart f rom considerations of social policy, such a decline would threaten the equilibrium between production and consumption and undermine the stabil i ty of prices. Dur ing the war, prices have been adjusted to product ion costs, and i t therefore seems l o g i cal tha t wage rates be revised after cessation of overtime work, e l iminat ion of wartime bottlenecks, and replacement of marginal emergency workers by regular personnel.
The trend i n wages tha t conforms to the postulate of economic equilibr i u m and to the suggested projections of national output and employment may be estimated f rom the following considerations.
I f the pay of the armed forces is
7 Survey of Current Business, September 1945, p. 5.
Table 7.—Hypothetical changes in distributive shares of national income, 1944-50 [ In billions, at 1944 prices]
I t em 1944 1945 1946 1947 1948 1949 1950
National income $160.7 $158.5 $138.0 $147.3 $146.6 $150.8 $155.0
Compensation of employees: Salaries and wages 112.8 109.7 91.5 98.7 98.2 100.3 102.3
Supplements 3.2 3.1 2.8 3.2 3.1 3.0 3.1
Net income of proprietors: Agriculture 11.8 12.3 9.7 10.6 10.6 10.7 10.8
Nonagriculture 12.3 12.9 11.0 11.8 12.5 13.0 13.5
Interest and net rents 10.6 11.6 11.0 12.5 13.2 14.3 15.5
Net corporate profits: Dividends 4.5 4.4 5.9 5.5 5.4 6.2 7.0 Savings 5.4 4.4 6.1 5.0 3.6 3.3 2.8
excluded from total salaries and wages as shown i n table 7, earnings of c i v i l i an workers would vary approximately as follows:
[ I n billions, at 1944 prices]
1944 1945 1946 1947 1948 1949 1950
$99 $97 $85 $93 $94 $96 $99
According to this projection the civi l ian pay ro l l would decline about 12 percent i n 1946 and re turn to the 1944 level i n 1950. This variat ion i n pay r o l l should be compared w i t h the number of hours of work performed. I t has been assumed tha t withdrawal of emergency war workers would proceed rapidly i n 1946-47 and at a declining rate thereafter, tha t i n 1948-50 withdrawals wi l l be offset by the growth of the population, and tha t average weekly hours of work i n 1950 w i l l be about 3 percent less than i n 1940. According to these assumptions, the number of hours of civi l ian work would drop 5 or 6 percent f rom 1944 to 1948 and fluctuate i n a narrow range thereafter.
Under these conditions, average hourly earnings would drop slightly— perhaps 4 or 5 percent—in 1946 but recover rapidly. They may be i n 1949 5 to 6 percent higher than i n 1944 and rise 3 percent i n 1950. The rise i n i n dividual industries should be considerably larger, perhaps between 15 and 20 percent i n 1946 to offset the effect of el imination of overtime bonuses and of shifts of workers f rom high-wage to low-wage industries.
These figures are, of course, purely il lustrative and are intended merely to show one of the patterns of variat ion i n wages tha t conforms to the assumed pattern of economic development after the war.
Menace of Deflation Reconversion f rom war to a peace
time economy implies a sudden reduct ion i n Federal expenditures and production. I t might appear tha t the shrinkage i n jobs and current earnings of workers would cause a general contraction of consumer expenditures. I n this event, lay-offs i n m u nitions factories would be followed by lay-offs i n civilian-goods industries, and a secondary wave of unemployment would sweep over the country.
Moreover, the productive capacity of industr ial plants expanded during the war might appear too large for ut i l izat ion under peacetime conditions. After postponed repairs and necessary adjustments are completed, there would be no further demand for i n vestments. Production of capital goods would be cut to the bone or discontinued, leading to fur ther growth of unemployment, further loss in purchasing power, and eventual collapse of agricultural prices. As i n the 1930's, depression i n the industr ial sector of the economic system would be aggravated by the misery of the farmers.
Such, i n general terms, is the theory of the deflationary spiral i n the course of reconversion, a theory tha t suggested the possibility of unemployment total ing 6-8 mi l l ion i n the last quarter of 1945, 8-10 mi l l ion i n the first quarter of 1946, and 12-15 m i l l ion i n 1947.
According to this theory, war savings would be no defense against the coming deluge. Because of the lack of opportunities for profitable investment, the business reserves piled up during the war would be frozen. Because of the fear of further deteriorat ion i n business conditions and work opportunity, private consumers would be reluctant to spend their savings.
Contrary to this theory, the end of the war failed to touch off a deflat ionary spiral. Not only was there no contraction i n civil ian consumption, but department-store sales skyrocketed and reached i n January 1946 a level 15 to 20 percent higher than i n the same season i n 1945. The demand for investment goods showed a similar trend. Unemployment i n creased slightly i n comparison w i t h 1943-44 but throughout 1945 remained below the theoretical normal "float" of 2.0 or 2.5 mi l l ion . I t rose somewhat i n January-February 1946 but was s t i l l below the theoretical min imum for this season. The comparatively l ight unemployment i n this phase of reconversion is the more remarkable because reconversion was proceeding under rather unfavorable conditions. Because of the sudden surrender of Japan and the unexpected speed i n repatr iat ion of troops, the supply of civil ian labor increased more rapidly than had been assumed i n the most pessimistic projections. A t the same
time, internat ional relations remained unsettled, perspectives of foreign trade and investments were uncertain, labor disputes slowed down reconversion i n key industries, and the cut i n 1946 taxes led some industrialists to postpone expansion of production u n t i l after New Year's.
I n spite of these handicaps, reconversion has followed, as after a l l the major wars i n the past, a pat tern characterized by an expansion almost immediately after the end of the fighting. The theoretical explanation of this pat tern is simple. The war originates expansive forces i n the economic system and, as long as these forces prevail, basic dislocations created by the war economy remain hidden. The expansive character of a postwar economy is due to the fact tha t after a major war a comparatively long period must elapse before output catches up w i t h the accumulated demand. A deflationary spiral, which presumes tha t the demand lags behind output, cannot develop during this period; i t develops later, not as a direct aftermath of the war economy but as a result of dislocations accumulated i n the postwar expansion. 8
Apar t f r o m business taxes and capi t a l charges, the value of civilian production dur ing a war equals wages, interest, and profits paid out i n the respective industries. Par t of the purchasing power of people engaged i n these industries is taxed away and par t is diverted to saving, reducing their share i n civi l ian goods to, say, ha l f of the to ta l available output. The other ha l f of the output goes to people engaged i n the war effort.
Assume that , when a war ends, m i l i tary expenditures, war taxes, and wartime controls are abolished overnight. I n such an event the demand for c i v i l i an goods w i l l be controlled by the current earnings of the population engaged i n the civi l ian sector of the economy, plus the reduced expenditures of the rest of the Nation, f i nanced by savings, borrowing, relief, and the like. The to ta l necessarily exceeds the value of available goods and services. A sellers' market not only stimulates production of consumer goods on a steadily increasing
8 See the Bulletin, December 1945, pp. 26-27.

scale but also opens br ight opportunities for investment and calls for expanding production of capital goods. Even i f expansion of economic activities is temporari ly interrupted by shortage of raw materials, maladjustments i n prices and wages, changes i n production patterns, and the l ike, the general t rend i n the economic system is necessarily upward. I n brief, after a major war the economic system tends to expand to the l imi t s of its productive capacity, practically to the l imits of the available labor-force, which makes mass unemployment i n this phase of economic development highly improbable, i f not impossible.
How long may such a situation last? And what is the chance of stabilizing production at the level of postwar fu l l employment?
These questions lead to the problem of deferred demand and accumulated purchasing power as an aftermath of the war economy.
War Savings One of the most important conse
quences of the war, indeed one of the decisive factors of the postwar economic development of this country, is the unprecedented accumulation of savings and reserves by individuals and business enterprises.
The Origin of War Savings To appraise the role of war savings
i n the postwar economy, one should recall conditions tha t accounted for the accumulation of savings during the war.
Individuals generally use par t of their "disposable income" 9 for direct consumption and part for savings and investment. Eventually money put aside at some previous time flows back to consumption; such belated spending is the essential purpose of saving. "Net savings" represent the remainder of current savings after subtracting the expenditure of formerly accumulated reserves. As long as net savings of individuals and incorporated enterprises f ind their way in to investments, and Government expenditures
chargeable to the gross national product are met by taxes levied on current income, the total demand for consumer and capital goods is i n balance w i t h the aggregate of wages, profits, other income, and capital charges, and this aggregate, i n t u rn , is i n bal ance w i t h the total amount of prices for al l goods and services produced. I n this event, producers may sell their products at the prices they have anticipated and are therefore wi l l ing to risk further investment. On the contrary, i f individuals and business put aside more money than is absorbed by investment, total expenditures must f a l l short of the current supply of goods and services—the value of the nat ional output—and available goods and services cannot be sold at the prices expected by producers. Since this situation is l ikely to cause a deflationary contraction of economic activities, oversavings may be described as a "deflationary gap." On the other hand, an " inf lat ionary gap" develops when the aggregate of goods and services avai lable for private use fails to keep pace w i t h a rise i n disposable income.
A slight surplus of disposable i n come over available goods and services does not necessarily endanger equil i b r ium of the economic system but serves rather to stimulate i ts expansion. O n the other hand, a considerable surplus can throw the whole structure of prices out of balance. This danger becomes imminent i n a war economy when the disposable i n come of individuals increases under the impact of Government expenditures, while the supply of consumer goods and services declines.
Theoretically, heavy taxation is the simplest method for closing or narrowing the inflationary gap. This method, however, cannot be used i n definitely; a point is reached at which the free purchasing power of i n d i viduals cannot be taxed away without destroying the economic incentive for work. Then i t is left to individuals to close the inflationary gap by saving their surplus earnings or lending them to the Government. They can lend •their savings to the Nation directly, by buying bonds, or indirectly, th rough banks. Even hoarding currency is a fo rm of lending to the Government, since each banknote is a loan obligat ion. Generally speaking, each dol
lar put aside by consumers i n any way lessens inflat ionary danger. Wha t is essential is the consumer's decision to abstain—at least temporari ly—from using a par t of his current purchasing power.
9 Disposable income of individuals is determined by deduct ing f r o m the aggregate of nat ional income corporate savings (undistr ibuted prof i t s ) , social secur i t y contributions, and personal and income taxes.
The Amount of War Savings A l l i n al l , the net savings of ind iv id
uals and business enterprises dur ing a war approximate the sum of net capital format ion and the par t of war expenses met through borrowing—that is, the increase i n the nat ional debt. I f we entered the war w i t h a national debt of $50 bi l l ion and have a debt of $270 bi l l ion at the end of demobilization, net savings accumulated during tha t period ( i n cluding business reserves) w i l l to ta l approximately $220 bi l l ion, plus the amount of net capital formation during the war. 1 0
Accumulation of individual net savings from 1939 to 1944 is i l lustrated by table 8. Inc luding net savings of
10 This relat ionship may be proved using the fo l lowing symbols t o indicate items i n the flow of the gross na t iona l product :
Gross na t iona l p r o d u c t — G N P Share of Government i n GNP—G Share of private consumption
i n G N P — C Net capital formation—F Capital c h a r g e s — A
So t h a t G N P = G + C + F + A — ( 1 )
Fur ther : Business t a x e s — T b
Direct t a x e s — T d
National i n c o m e — I Disposable income of i n d i v i d
uals and business enterp r i s e s — D
So tha t I = G N P - A - T b — ( 2 )
and D = I - T d = G N P - A - T b - T d — ( 3 ) Then savings of individuals and b u s i
ness enterprises w i l l equal the difference S = D - C — ( 4 )
Subs t i tu t ing (3) for D we f i n d S = G N P - A - C - T b - T d — ( 5 )
Subs t i tu t ing (1) for GNP i n the last equation S = G + P - T b - T d — ( 6 )
Or S = ( G - T b - T d ) + F — ( 7 ) I t w i l l be noticed t h a t ( G - T b - T d )
represents the difference of Government spending for goods and services (G) over i ts receipts i n business and direct taxes ( T b and T d ) . Since th i s difference is covered by borrowing, fo rmula (7) indicates t h a t ne t savings of ind iv idua l s and bus i ness equal the sum of Government borrowing and net private capital format ion.
I n al l these equations, allowance should be made for adjustment factors.

corporations (undistributed profits) total ing $26.1 bi l l ion (table 3 ) , about $190 bi l l ion was put aside by the end of 1945. This amount is bound to increase further i n the period of reconversion as long as the shortage of durable goods on the market compels consumers to postpone or restrict their postwar purchases.
A run-away inflat ion like tha t which had developed under much less pressure during the last war has been prevented this t ime by economic controls and the sober behavior of the major i ty of the population. Price control and rat ioning assured consumers of essentials at prices reasonably near the prewar level. These measures eliminated the pressure of free purchasing power on prices i n the controlled section of the economic system but did not reduce the disparity between disposable income and expenditures. The gap, rather, was stabilized by the fact tha t consumer expenditures for essentials could not increase. To some extent, controls were facilitated by the fact tha t consumption was maintained at a very high level—higher indeed than had ever been reached before the war. Sacrifices demanded from the populat ion were not heavy i n comparison w i t h those i n other belligerent countries. I n addition, consumers showed a considerable amount of self-discipline and were wi l l ing to defer spending by buying war bonds or otherwise put t ing money aside.
The contrast between wart ime and peacetime savings is presented i n a nutshell by the statement tha t under normal conditions a consumer saves mainly for a ra iny day while i n wartime he saves mainly for a br ight day. He thinks of the day when the war wi l l be over, when new cars, refrigerators, washing machines, radios, and other coveted durable goods w i l l re
appear on the market; when he w i l l be able to buy or bui ld a home to his taste; when he again can buy gasoline freely; when the horrors of war w i l l no longer interfere w i t h his desire for leisure and pleasure. Bu t these are not the only motives for saving i n wartime. Some consumers are reluctant to spend their earnings because they do not know what w i l l happen to them and their families i n the coming months or years. Others spend less because they have no t ime or opportunity for spending or because they choose to adopt the more austere manner of l iv ing tha t develops under the strain of war. St i l l others fear the future, when the war boom is over. Of course, war and easy money also stimulate lavish spending. There is no evidence, however, tha t the great major i ty of consumers i n the Uni ted States were eager to acquire more than their proper share of the wart ime output of c iv i l ian goods and services.
Table 8.—Distribution of income payments among expenditures, taxes, and saving, 1939-45
[ I n billions, at current prices]
I t em 1939 1940 1941 1942 1943 1944 1945
Income payments to individuals $70.8 $76.5 $92.7 $117.3 $143.1 $156. 8 $160.6
Consumer expenditures 61.7 65.7 74.6 82.0 91.3 98.5 104.9 Surplus of incomes over expenditures 9.1 10.8 18.1 35.3 51.8 58.3 55.7
Dis t r ibut ion of surplus incomes: Personal taxes 3.1 3.3 4.0 6.7 18.6 19.4 21.0
Net savings 6.0 7.5 14.2 28.6 33.2 38.9 34.7
Source: Survey of Current Business, January 1944, February 1945.
Table 9—Distribution of income, expenditures, and savings of households, by income class, 1942
Income class
Households
(in m i l
lions)
M o n ey in
come Taxes
Expenditures 1
Savings
Income class
Households
(in m i l
lions) ( In billions)
A l l classes 41.2 $105.4 $4.3 $75.7 $25.4
Less than $1,500 16.7 14.4 . 1 14.4 ( 2 )
1,500-2,999 13.9 29.7 .2 24.8 4.7 3,000-4,999 7.3 27.7 .4 20.4 6.8 5,000-9,999 2.5 17.0 .5 10.4 6.0 10,000 or more .8 16.6 3.1 5.6 7.9
1 Including gifts to organizations. 2 Less than $50 mi l l ion .
Source: Office of Price Administrat ion, Civilian Spending and Saving, 1941 and 1942, Mar . 1, 1943, p . 4.
The Distribution of War Savings The impact of war savings on eco
nomic and social conditions after the war depends largely on the dis t r ibut ion of savings among the population. Before the war, savings were concentra ted i n the hands of a relatively few well-to-do persons. O n the basis of the Consumer Purchases Study, the National Resources Committee found that approximately 60 percent of the 39.5 mi l l i on households i n the United States had incomes of less than $1,250 in 1935-36 and not only did not put money aside but were unable to make ends meet; they made no current savings and had to use earlier savings, rely on public or private aid, or go into debt. I n the next higher 10 percent of the households, w i t h annual incomes of $1,250-1,500, the rate of
savings was less than 2 percent of i n come; i t increased steadily i n higher income groups, and households w i t h incomes of $20,000 or more saved more than half their incomes. I n 1935-36, sizable savings were put aside by approximately 4 mi l l ion households; among these, some 331,000 families and single individuals w i t h incomes of $10,000 or more made more than 60 percent of the aggregate savings.
The situation has changed during the war. According to the Office of Price Adminis t ra t ion, incomes, taxes, expenditures, and savings were dist r ibuted i n 1942 by broad income classes as shown i n table 9.11 Some 800,000 households w i t h incomes of $10,000 or more made 31 percent of the aggregate savings; 2.5 mi l l i on i n the upper-middle income brackets had 24 percent; and the remaining 45 percent was held by 21.2 mi l l ion families w i t h incomes f rom $1,500 to $5,000. On the other hand, the 16.7 mi l l ion families w i t h incomes under $1,500 were, as a group, i n the red.
For 1944 the Bureau of Labor Statistics has collected data on dis t r ibut ion of families and single persons i n urban communities by income level (table 10). These data, not s t r ic t ly comparable w i t h those for 1942 as shown i n table 9, indicate tha t about 30 percent of the city households
1 1 Totals of incomes, taxes, expenditures, and savings i n table 9 differ f rom respective items for 1942 i n tables 3 and 8. The difference is largely due to the fact t h a t table 9 is restricted to money i n comes of households while tables 3 and 8 refer t o a l l kinds of income and i n d i viduals, inc luding persons no t i n pr ivate households.

Table 10.—Average money income, expenditures, and savings of households in cities, by income class, 1944
Money income after personal taxes
Percentage distribution of
all households
Per household Money income
after personal taxes
Percentage distribution of
all households
Money income Taxes Expendi
tures 1 Savings
All classes 100.0 --- --- --- ---
Less than $500 4.2 $292 $1 $611 -$320 500-999 7.7 787 23 970 -206 1,000-1,499 7.1 1,313 70 1,369 -126 1,500-1,999 11.9 1,893 124 1,772 -3 2,000-2,499 13.9 2,449 198 2,038 213 2,500-2,999 13.2 3,030 283 2,511 236 3,000-3,999 19.9 3,888 407 2,943 538 4,000-4,999 9.6 4,970 564 3,639 767 5,000 or more 12.5 9,991 2,357 4,778 2,856
1 Includes gifts and contributions. Source: "Expenditures and Savings of C i ty Families i n 1944," Monthly Labor Review, January 1946, pp. 1-5.
made no savings i n tha t year; about an equal group saved less than 10 percent of their annual money i n come; 20 percent put aside 15-20 percent; and 20 percent had more substantial savings.
A comparison of the distr ibution of incomes and savings i n 1942 and 1944 w i t h their distr ibution i n 1935-36 shows tha t during the war years a large number of families i n the United States enjoyed increases i n income tha t brought them to levels at which they could make appreciable savings.
Many city families tha t had annual incomes of $1,250-1,500 and practically no savings i n 1935-36, for example, may have risen to the $2,500-3,000 bracket by 1944 and put aside the average of $236 i n tha t year. Through the 4 years of the war, cumulative savings of such a household may have amounted to $800.
A wider distr ibution of savings was furthered also by the drastic rise of taxes on the higher incomes during the war, which contributed to a less uneven distr ibution of disposable i n come. Estimates of the deciles of the disposable income i n 1942 and 1944 are shown i n table 11.
W i t h such differences i n the rise i n disposable income at different economic levels, i t seems reasonable to assume tha t the amount of free money and savings i n the middle income groups increased at a higher rate than i n the prosperous groups.
The contention tha t mill ions of households shared i n war savings is confirmed by numerous sample surveys. The survey of incomes and savings of Braddock steelworkers made by the United Steelworkers of Amer
ica (CIO) i n January 1945 is typical . Cumulative l iquid savings of a representative cross section of steelworkers averaged $800 at the t ime of the survey. Only 18 percent reported savings of less than $100; 20 percent had f rom $100 to $300; 20 percent had put aside from $300 to $500; 23 percent f rom $500 to $1,000, and 19 percent, $1,000 or more. 1 2 The survey points out that only one-fourth of reported savings represented rainy-day money, while the rest was put aside because of the particular conditions of war economy, as deferred purchasing power.
A survey made by the Indust r ia l Union of Marine and Shipbuilding Workers of America suggests tha t savings of shipyard workers averaged $382 before they entered the industry and $652 on July 15, 1944. This i n crease i n savings was allegedly offset by the growth of debts, which averaged $262 when the workers entered the shipyard jobs and $561 when the survey was taken. The lat ter amount, however, includes mortgages which workers gave on property they had bought at the new location. Since i t is highly improbable tha t the mor t gages represented more than the actual value of the property, the rise i n
debts recorded by the survey can hardly be regarded as an i tem offsett ing l iquid savings of workers.
This survey also reports tha t more than 90 percent of the shipyard workers had war bonds averaging $484 per holder.
The accumulation of l iquid savings by farmers deserves particular at tent ion. Tota l equities i n farms i n creased from $53.8 b i l l ion as of January 1, 1940, to $90.8 bi l l ion on January 1, 1945. More specifically, landowners' equity i n real estate advanced from $27.1 bi l l ion to $45.0 bi l l ion, and farmers' equity i n other property, f rom $26.7 bi l l ion to $45.8 bil l ion. 1 3
The gain i n landowners' equity reflected the rise i n real-estate prices and the decline i n mortgages. The gain of farmers' equity i n other property was due par t ly to reevaluation of livestock and equipment but mainly to improvements on farms and accumulat ion of l iquid financial assets such as currency, deposits, and U . S. savings bonds: these last totaled $5.2 bi l l ion on January 1, 1940, and $16.8 bi l l ion on January 1, 1945. A t the same t ime, liabilities of farmers (including real-estate mortgages and other debts) dropped f rom $10 bi l l ion to $9 bil l ion. Before the war the financial assets of farmers were $4.7 bi l l ion less than their liabilit ies; on January 1, 1945, their assets exceeded their liabilities by $7.8 bi l l ion.
Market conditions were highly f a vorable for farmers i n 1945 and are l ikely to remain favorable during the t ransi t ion to a peacetime economy. By the end of 1946 their l iquid financial assets may readily increase to about $25 bi l l ion, about five times the prewar size and five times as much
12 Uni ted Steelworkers of America, The Braddock Steelworker, p . 22.
13 Department of Agricul ture , Bureau of Agr icu l tu ra l Economics, The Impact of the War on the Financial Structure of Agriculture, 1945, (Misc. Pub. No. 567); and The Balance Sheet of Agriculture, 1945. December 1945 (Misc. Pub. No. 583).
Table 11.—Decile disposable incomes of nonfarm families of two or more (after deduction of taxes), 1942 and 1944 1
Year First decile
Second decile
T h i r d decile
Fourth decile
Fi f th decile
Sixth decile
Seventh decile
Eighth decile
N i n t h decile
1942 $550 $920 $1,285 $1,570 $1,895 $2,220 $2,570 $3,070 $4,000 1944 1,040 1,400 1,755 2,025 2,235 2,550 2,890 3,260 4,000
Gain 490 480 470 455 340 330 320 190 ---
1 For method of estimating taxes see Woyt insky, W . S., "Economic Perspectives, 1943-48," Social Security Board, Bureau of Research and Statistics (Memorandum No . 52), p. 93.

Table 12.—Hypothetical distribution of war savings at the end of 1945, by income class in 1942
Income class in 1942
Number of households, 1945 ( in millions) Savings at the end of 1945
Income class in 1942 A l l house
holds House
holds w i t h savings
Total ( in billions)
Average per household Income class in 1942 A l l house
holds House
holds w i t h savings
Total ( in billions) A l l house
holds House
holds w i t h savings
To ta l 42.0 31.5 $150 $3,571 $4,762
Less than $1,500 17.0 7.6 6 294 667 1,500-2,999 14.2 13.5 40 2,817 2.963 3,000-4,999 7.7 7.2 42 5,455 5,833 5,000-9,999 2.5 2.5 31 12,400 12,400 10,000 or more .8 .8 32 40,000 40,000
as the annual income of farmers i n the late 1930's.
Valuable information on the dist r ibu t ion of war savings is provided by the survey of hopes and fears of the population taken by Fortune i n the summer of 1945.
The following question was asked: Sometimes it is interesting to think of what we might be able to do under different circumstances. For instance, suppose your whole income suddenly stopped for awhile. Could you live for six months just the way you are now living if you used your savings, war bonds, investments, and ready cash?
The answers were tabulated as f o l lows: 1 4
Answer
Economic level
Answer Total
Prosperous
U p per
middle
Lower
middle
Poor Negroes
(Percentage distribution)
Yes 49.2 82.1 69.9 47.4 28.8 25.9 No 45.5 16.3 27.1 47.0 63.3 67.2 D o n ' t know 5.3 1.6 3.0 5.6 7.9 6.9
Fortune comments on these revealing figures: "So about ha l f of the people i n the country t h i n k they could live for six months the way they are now l iv ing i f their present income were suddenly cut off. Bu t naturally, as the economic breakdowns reveal, the people most l ikely to be affected by a postwar depression and consequent unemployment are the people who i n large par t lack funds to keep themselves going for a period of six months."
Table 12 shows a hypothetical dis
t r ibu t ion of individual war savings accumulated by the end of 194515
among families grouped according to their 1942 income. The estimates have been made by taking in to account the distribution of savings i n 1942 (table 9) and the subsequent changes i n the distr ibution of disposable income (table 11).
On the basis of this estimate of savings by income group, American households would be distributed by amount of war savings as follows:
Amount of war savings
Households
Amount of war savings Number (in thousands)
Percentage dis
tr ibut ion
A l l classes 42,000 100.0
No war savings 10,500 25.0 Less than $500 3,150 7.5 500-999 3,150 7.5 1,000-1,999 5,250 12.5 2,000-2,999 4,200 10.0 3,000-3,999 3,780 9.0 4,000-4,999 3,570 8.5 5,000-7,499 5,250 12.5 7,500 or more 3,150 7.5
Source: Free-hand interpolation of the estimated distribution of savings by income classes.
W i t h reservation for a considerable margin of error i n computations of this type, i t seems not unlikely tha t by the end of 1945 about 50 percent of a l l households had savings at least equal to their prewar annual earnings; 10 to 15 percent had saved an equivalent of 6 to 11 months of their prewar earnings; an equal proportion had the equivalent of 6 months' earnings; and 25 percent had no appreciable financial reserves.
Wart ime saving w i l l not t ransform
the Uni ted States into a Nat ion of capitalists nor w i l l i t eliminate poverty or i ron out economic inequality. Bu t savings have brought a new feeling of individual security to many households. I n some cases the reserves may be dissipated by a long spell of unemployment or a serious sickness. For other households, war savings may become an impor tant and lasting factor i n determining their manner of life after the war.
"14 Fortune, August 1945, p. 257.
15 As shown i n table 8, net savings of individuals f rom 1939 th rough 1945 totaled $163.3 b i l l i o n . I t is assumed t h a t $150 b i l l i o n was held by ind iv idua l households.
The Role of Savings After the War The l iquidi ty of savings after the
war w i l l natural ly vary according to the fo rm i n wh ich they are held. I t may be anticipated tha t cash savings w i l l be spent more freely than demand deposits; demand deposits w i l l be more l iquid than t ime deposits; war bonds may be cashed earlier t han other securities; securities w i l l be more l iquid than equities i n homes; and so on. I t may be anticipated also tha t war savings held by persons i n the lower income groups w i l l be spent sooner t h a n those held by the r ich .
By the end of 1945, nearly $50 b i l l ion was invested i n U . S. savings bonds; increases during the war i n the amount of currency i n circulation (cash held) and i n demand and t ime deposits represented $20 b i l l ion and $40 bi l l ion , respectively, i n round numbers. W i t h deposits i n savings banks and government securities other than war bonds, the amount of i n d i vidual savings which may be at any t ime converted in to purchasing power may have totaled $120 bi l l ion. Other savings (other securities, reduction of debts, purchase of insurance) are less l iquid. Even the least l iquid, however, may enable the holder to spend his current earnings more freely.
Inquiries conducted by various organizations indicate that most people, even those who had no reason for saving but the lack of opportunity for spending, gave thought to the purposes for which they might use their savings after the war and tha t their plans changed as t ime went on.
There are also indications tha t persons who invested a part of their war savings i n war bonds and kept the rest i n bank deposits or cash made part icular plans for the different parts of their reserves. A l l inquiries point t o ward the conclusion tha t the bulk of

war savings w i l l be expended w i t h considerable forethought and p r u dence.
The t i m i n g of the ma tu r i ty of war bonds w i l l encourage holders to stretch their spending over a comparatively long period of t ime. People who did not cash war bonds dur ing the war, when there was much pressure for buying them and relatively l i t t l e for keeping them, w i l l forget t h a t they had paid $75 for each $100 bond and w i l l feel tha t they are losing money unless they can cash a bond for its ma tu r i ty value. This psychological inducement for wait ing for the mat u r i t y of the bond may be much stronger than the accruing interest.
A l l i n al l , the stored-up purchasing power represented by war savings exceeds by far the deferred demand for durable goods. Overdue home repairs and purchase of cars, refrigerators, and radio sets w i l l absorb only a small fraction of the war savings. The remaining reserves wi l l give to holders a feeling of security and enable them to improve their standard of l iv ing .
A t the same t ime, the reserves tha t business enterprises have accumulated wi l l increase the stabili ty of the whole economic system. The weak point of our economy i n the 1920's was accumulation of debts. Consumers were indebted to retai l dealers, ret a i l dealers to manufacturers, manufacturers and farmers to banks. The whole Nation was i n the red, and the first major shock brought down the house of cards of fictitious prosperity. I n s tr iking contrast, consumers now meet the postwar economy w i t h debts largely paid up and w i t h solid titles to a higher standard of l iv ing .
We do not know what part of war savings wi l l re turn annually to c i rculation. Theoretically, the rat io may range between 0 and 100 percent, but extremes are h ighly improbable. I f i n each year one-fifth of the holders spend one-fifth of their war savings, $5-6 bil l ion w i l l be injected in to the flow of the economy, which is about as much as the economic system can absorb without serious trouble.
I n fact, apart f rom transfer of t i t le f rom one group of the population to another—from persons i n middle i n come classes to banks, for example— the l iquidation of war savings is bound to keep pace w i t h the l iquidat ion of the national debt, jus t as the
pi l ing up of savings during the war kept pace w i t h the growth of tha t debt. Completion of this operation i n a couple of years or even a decade is not likely.
A more rapid l iquidation of war savings would be a run-away inflat ion tha t would cut down the real purchasing power of the dollar and might result also i n depreciation of stocks and economic losses like those of the early 1930's.
As long as the national economy runs on an even keel, only small amounts of savings can be added to current expenditures. The Nation as a whole w i l l therefore be i n the posit ion of the fabulous hero w i t h an u n l imi ted amount of money who discovered how narrow were the l imits of his capacity to spend. Unless war savings are dissipated i n economic turmoi l , they w i l l act as a revolving and equalization fund for a considerable period of t ime.
Moreover, i n planning for postwar prosperity one can rely as l i t t l e on the l iquidation of savings by individuals as on the excess of exports over i m ports, deficit spending by the Government, or a continuous rise on the stock exchange. Lasting prosperity can be ensured only by a sound relationship between the various factors i n the flow of national income—production and consumption, wages and profits, technological progress and hours of work, current savings and investments, private and public expenditures, agr i cul tural and industr ial prices, exports and imports, and so for th .
Menace of Inflation A n economic system based on i n d i
vidual ini t ia t ive is exposed to the double danger of deflationary contract ion and inflationary overexpan-sion. Inf la t ion endangers employment not only by depreciating savings and real income but s t i l l more by s t imulat ing expansion of certain branches of production to a point tha t cannot be maintained. Since such expansion is bound to end i n a more or less violent contraction, i t carries seeds of a deflation. Experience shows tha t economic losses during a depression depend largely on the extent of over-expansion i n the preceding phase of the business cycle. There is therefore a danger tha t the postwar expansion kindled by accumulated war sav
ings and business reserves w i l l develop in to a boom, as i t d id after Wor ld War I , w i t h the same disastrous conclusion.
I n fact, whatever may be the cycl i cal ups and downs after the war, financial reserves and savings piled up during the war w i l l exercise i n fluence i n a l l phases of each cycle, s t imulat ing expansion, retarding a downturn, cushioning contraction, and accelerating revival. I n this way the cyclical fluctuations w i l l be superimposed on the ascending slope of postwar economic growth.
This type of development has considerable advantages, but its weak point is tha t maladjustments i n prices, wages, investments, distr ibution of productive forces, and the like, tha t are accumulated i n the expansive phase of a cycle are not ful ly corrected by a m i l d set-back. Hidden i n flation may progress, as i n the 1920's, un t i l the postwar expansive forces exhaust themselves and the overinflated economy collapses. This danger would be greatly increased by an over-expansion of bank credits tha t is i n vited by the accumulation of war savings. Indeed, protecting our economy against the immediate deflationary danger, war savings tend, at the same time, to increase the danger of a deflationary collapse after a period of inflationary expansion.
Phases of the Postwar Economy As was indicated at the beginning
of this article, the road of reconversion goes downhil l , f rom the war boom to peacetime ful l employment. Perhaps the main economic consequence of the war i n the United States is tha t the slope of the t r a i l has been turned: the goal which seemed to be almost inaccessible when i t lay above the deep valley of depression appears nearer when we look down on i t f rom the lof ty peak of the war boom. I t would be pernicious, however, to overestimate the advantages of the present situation. I n economics—as i n mountain climbing—the descent is often as dangerous as the ascent and requires as much care.
The immediate task of reconversion i n terms of employment is summarized i n table 13. The reconversion to fu l l employment visualized i n this projection does not presume tha t peacetime production must expand

sufficiently to provide jobs for a l l 20 mi l l i on persons added to civi l ian labor supply. I t is anticipated, rather, tha t the dwindl ing demand for manpower by munitions industries and the armed forces w i l l be largely offset by withdrawals of emergency workers, vacancies which remained unfil led during the war, and new openings due to curtai lment of hours of work. The number of withdrawals dur ing the first year after Japan's surrender is estimated at 4 mi l l i on (1.5 mi l l ion young workers, 0.5 mi l l ion service wives, 1 mi l l i on other marr ied women, and 1 mi l l ion superannuated and handicapped persons). The number of openings due to cur ta i l ment of hours of work is set at 2.5 mi l l ion and tha t of vacancies open, when f ight ing stopped, a t 2 mi l l ion . These factors would take care of 8.5 mi l l ion displaced persons. A n addit iona l 10 m i l l i o n peacetime jobs must be made available i n reconverted establishments or other industries i f
unemployment is to remain merely fr ict ional , i n accordance w i t h the concept of fu l l employment.
Taking account of the level of employment i n civilian-goods industries when the war was approaching its end, i t seems tha t these industries may readily provide the desired number of jobs: about 4 mi l l i on openings might be expected i n manufacturing and mining, 2 to 3 mi l l i on i n building construction and related trades, 0.5 to 1 mi l l ion i n agriculture, as many i n independent nonagricultural pursuits, and the remainder i n trade, service industries, professions, and domestic services. The success of reconversion depends on the speed of reabsorption of laid-off war workers and re turning veterans. Progress during the first 6 months after the surrender of Japan has been highly encouraging.
By the end of February 1946, 6 months after VJ-day, practically a l l munitions production was at an end and about 9 mi l l ion civi l ian workers lost their wartime jobs. A t the same time more than 6.5 mi l l ion persons had been released f rom the armed forces. W i t h allowance for the lag between separation of men from mi l i t a ry service and their re turn to civi l ian work, 15-15.5 mi l l i on persons joined the civi l ian labor supply. Since unemployment—including veterans claiming readjustment allowances—increased by only 2.5 millions, 12.5-13 mi l l ion additions to the c i v i l ian labor force i n those 6 months remain to be accounted for. Hardly more t h a n 2.5 or 3 mi l l i on emergency workers withdrew from the labor force, and some 10 mi l l ion former war workers and servicemen found jobs i n peacetime industries. This total i n cludes about 3 mi l l i on workers who shifted to peacetime work i n the same establishments i n which they had worked during the war, without interrupt ion of employment, and 7 mi l l i on persons who found new jobs after a short search. The distr ibut ion of these jobs is unknown; they may have included a mi l l ion open vacancies, about a mi l l ion jobs made available by the reduction of hours of work, and about 5 mi l l ion jobs i n expanding civil ian production. This dis t r ibution, however, is merely i l lustrative. Of crucial importance is the fact tha t 6 months after VJ-day unemployment in the United States did not exceed
the theoretical m i n i m u m "float" of the labor force tha t corresponds, i n this season of the year, to the concept of fu l l employment. Many i n dustries continued to work 45 hours a week, most of the emergency war workers remained i n the labor market, and help was wanted i n service industries as urgently as before, though expansion of peacetime production had been slowed down by labor disputes.
These conditions cast l igh t on the perspectives of the next phase of reconversion, say from March 1 to A u gust 31, 1946. I n these months, about 5 mi l l ion may be added to the civi l ian labor force, including 500,000 representing the normal addi t ion to the labor force as a result of population growth and a backlog of some 1 or 1.5 mi l l ion persons who had been released f rom the armed forces before March 1, 1946, but had not looked for work immediately.
Assuming tha t 1.5-2 mi l l i on emergency workers wi thdraw from the labor market, an additional 3-3.5 m i l l ion jobs w i l l be required to keep u n employment f rom rising above the theoretical m i n i m u m of 2.5 mi l l ion . On the other hand, apart f rom jobs now vacant and new jobs created by continued curtai lment of hours of work, about 500,000 men w i l l be demanded by agriculture, 2 mi l l i on by expanding building construction, and as many by other industries, not to mention opportunities i n independent pursuits, i n trade, services, and professions.
I n brief, i t appears tha t the completion of reconversion w i l l find the labor market t igh t , and i t is not u n likely tha t a general shortage of labor w i l l persist not only throughout 1946 but also 1947.
Despite the. small volume of unemployment i n the last quarter of 1945 and early months of 1946, this period probably w i l l prove to be the demobilization set-back analogous to the short spell of contraction i n the first ha l f of 1919. I t can hardly be called a "pr imary postwar depression" because the economic si tuation lacks the characteristics of a depression.
The second hal f of 1946 and 1947 would mark the beginning of postwar expansion. A set-back analogous to tha t i n 1920-21 may appear i n 1948 or 1949, when the first rush of post-
Table 13.—High lights of the reconversion
I t e m Number of persons ( in millions)
I . Manpower, August 19451
Tota l 66.5
I n mi l i t a ry service 12.2 Civi l ian labor force available, total 54.3
Unemployed .8 Employed, total 53.5
Peacetime activities 42.6 Muni t ions and related indus
tries 9.0 War agencies 1.9
I I . Assumed changes, August 1945-August 1946:
A . Increase in civi l ian labor supply, total 20.0
Cut-backs i n munitions and related industries 9.0
Cut-backs i n war agencies 1.5 Ex-servicemen returning to
civi l ian occupation (net) 9.0 Increase in labor force from
population growth .5 B . Absorption of labor displaced
by demobilization of indust r y and the armed forces, total 18.5
F i l l i ng open vacancies 2.0 Openings due to curtailment
of hours of work 2.5 Withdrawal of emergency workers
4.0 New peacetime jobs:
I n same establishment (without interruption of employment) 3.0
Created through reconversion 7.0
C. Unemployment: Increase 1.5 Tota l at end of reconversion 2.3
1 Based on figures of the War Manpower Commission.
2 Including 800,000 out of work on VE-day.

war buying is over, industry is provided w i t h labor-saving devices, and the productivi ty of labor begins to rise more rapidly than consumer demand.
I n the projections for 1945-50 (tables 5 and 6 ) , economic difficulties i n 1948 are marked by an in ter rupt ion i n the growth of the gross nat ional product. The set-back would be much more serious i f run-away inflat ion should develop i n 1946-47. I f tha t is avoided, a set-back i n 1948 would be analogous to tha t i n 1920-21, i n tha t i t would serve to liquidate certain m a l adjustments left by the war economy, but i t would be less destructive and cause less unemployment.
The projections developed i n this study suggest tha t the industr ial expansion characteristic of postwar economy would probably be resumed after a brief spell of contraction. I t s momentum w i l l be determined by the
available reserves of productive forces and accumulated purchasing power. Such a t rend does not preclude cycl i cal ups and downs. National policy w i l l largely determine whether such fluctuations are kept w i t h i n a nar row range or develop into a succession of violent booms and depressions.
The present projections are op t i mistic i n the sense t h a t they assume only a moderate advance i n the expansive phase of the first postwar cycle. Under this assumption, a setback tha t migh t occur at some t ime i n the early 1950's would be comparatively mi ld , as i n 1927 for example. The occurrence or t i m i n g of such a set-back is unpredictable, since developments w i l l be determined by factors now nonexistent. I n any event, i f i t occurred before, say, 1955, expansive forces generated by the war economy would not have been exhausted; housing construction a l
most certainly would be i n fu l l swing; the rebuilding and rezoning of cities w i l l have gained momentum; probably only a small par t of war savings would have been l iquidated; the bulk of the war bonds would be reaching matur i ty , inv i t ing holders to use their cash holdings for investment i n durable goods. A l l these factors would accelerate revival. I t seems more than probable tha t postwar expansion w i l l last a t least th rough an other business cycle, probably to the end of the 1950's or to the beginning of the 1960's.
To sum up, the Uni ted States has a fa i r chance of winning the peace and enjoying a long spell of prosperity and fu l l employment w i t h only minor temporary set-backs i f—and this is a big i f — i t keeps under control the inflat ionary forces t h a t pave the way for deflationary collapse and major depressions.