Pairwise alignment 2: Scoring matrices and gaps BLAST, BLAT and FASTA
Position-specific scoring matrices (PSSM)
Regulatory Sequence Analysis
Jacques van Helden
[email protected] Université d’Aix-Marseille, France
Technological Advances for Genomics and Clinics (TAGC, INSERM Unit U1090)
http://jacques.van-helden.perso.luminy.univmed.fr/
FORMER ADDRESS (1999-2011) Université Libre de Bruxelles, Belgique
Bioinformatique des Génomes et des Réseaux (BiGRe lab) http://www.bigre.ulb.ac.be/
1
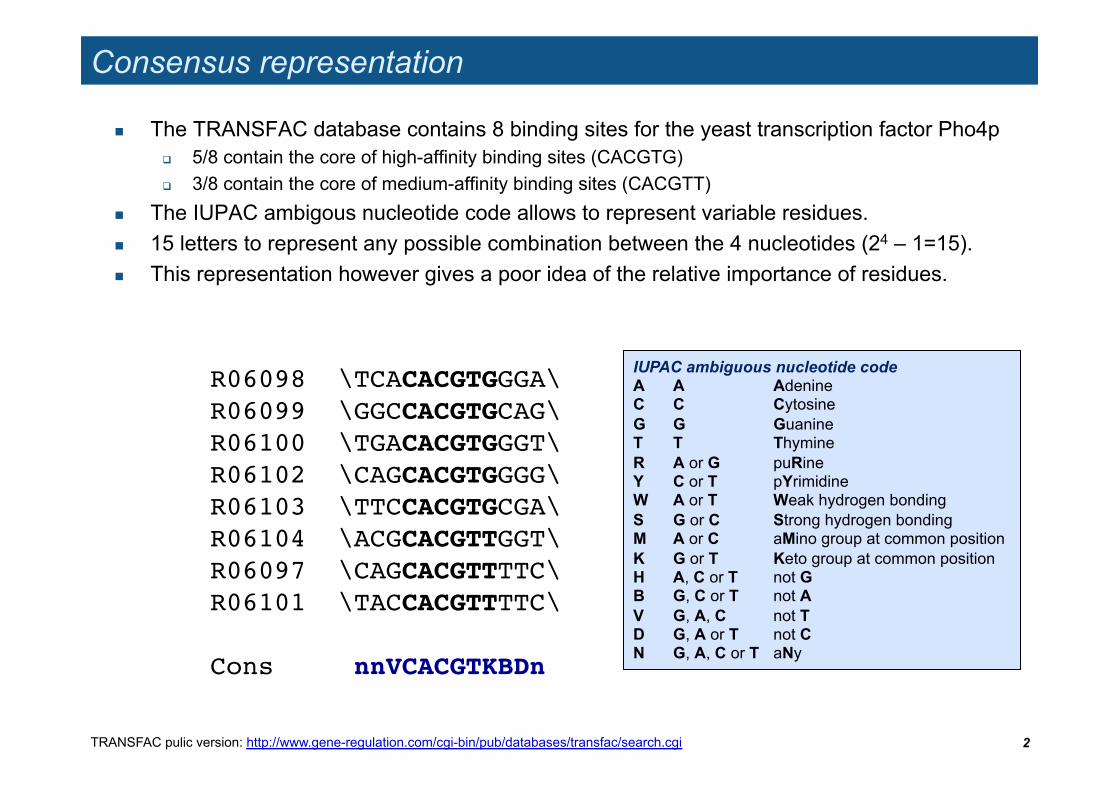
Consensus representation
The TRANSFAC database contains 8 binding sites for the yeast transcription factor Pho4p 5/8 contain the core of high-affinity binding sites (CACGTG) 3/8 contain the core of medium-affinity binding sites (CACGTT)
The IUPAC ambigous nucleotide code allows to represent variable residues. 15 letters to represent any possible combination between the 4 nucleotides (24 – 1=15). This representation however gives a poor idea of the relative importance of residues.
2
R06098 \TCACACGTGGGA\!R06099 \GGCCACGTGCAG\!R06100 \TGACACGTGGGT\!R06102 \CAGCACGTGGGG\!R06103 \TTCCACGTGCGA\!R06104 \ACGCACGTTGGT\!R06097 \CAGCACGTTTTC\!R06101 \TACCACGTTTTC\!!Cons nnVCACGTKBDn!
TRANSFAC pulic version: http://www.gene-regulation.com/cgi-bin/pub/databases/transfac/search.cgi
IUPAC ambiguous nucleotide code A A Adenine C C Cytosine G G Guanine T T Thymine R A or G puRine Y C or T pYrimidine W A or T Weak hydrogen bonding S G or C Strong hydrogen bonding M A or C aMino group at common position K G or T Keto group at common position H A, C or T not G B G, C or T not A V G, A, C not T D G, A or T not C N G, A, C or T aNy

From alignments to weights
Regulatory Sequence Analysis
3
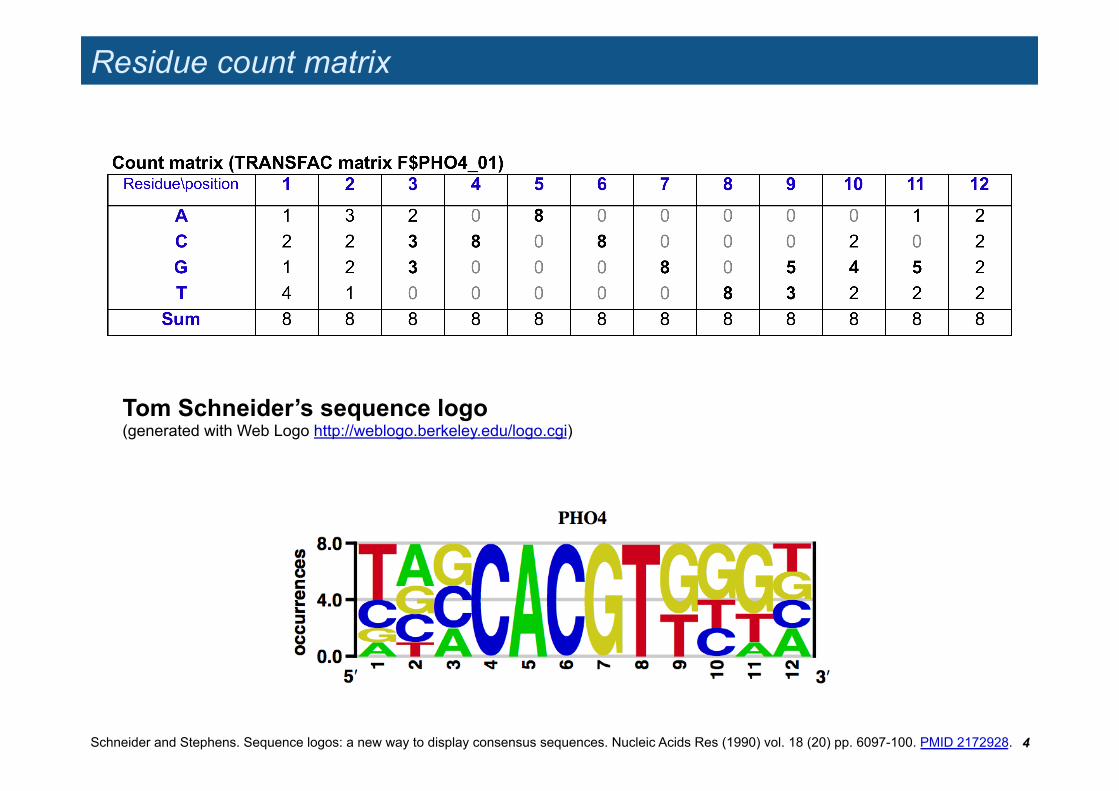
Residue count matrix
4
Tom Schneider’s sequence logo (generated with Web Logo http://weblogo.berkeley.edu/logo.cgi)
Schneider and Stephens. Sequence logos: a new way to display consensus sequences. Nucleic Acids Res (1990) vol. 18 (20) pp. 6097-100. PMID 2172928.
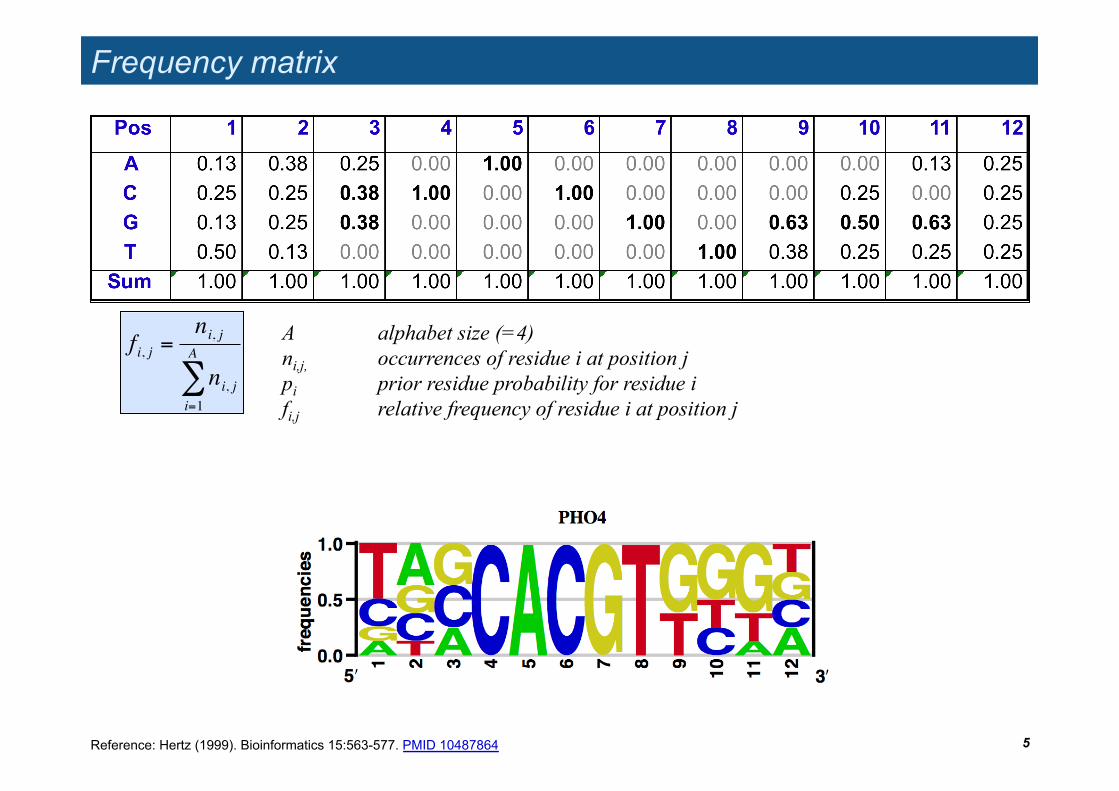
Frequency matrix
5
A alphabet size (=4) ni,j, occurrences of residue i at position j pi prior residue probability for residue i fi,j relative frequency of residue i at position j
!
fi, j =ni, j
ni, ji=1
A
"
Reference: Hertz (1999). Bioinformatics 15:563-577. PMID 10487864
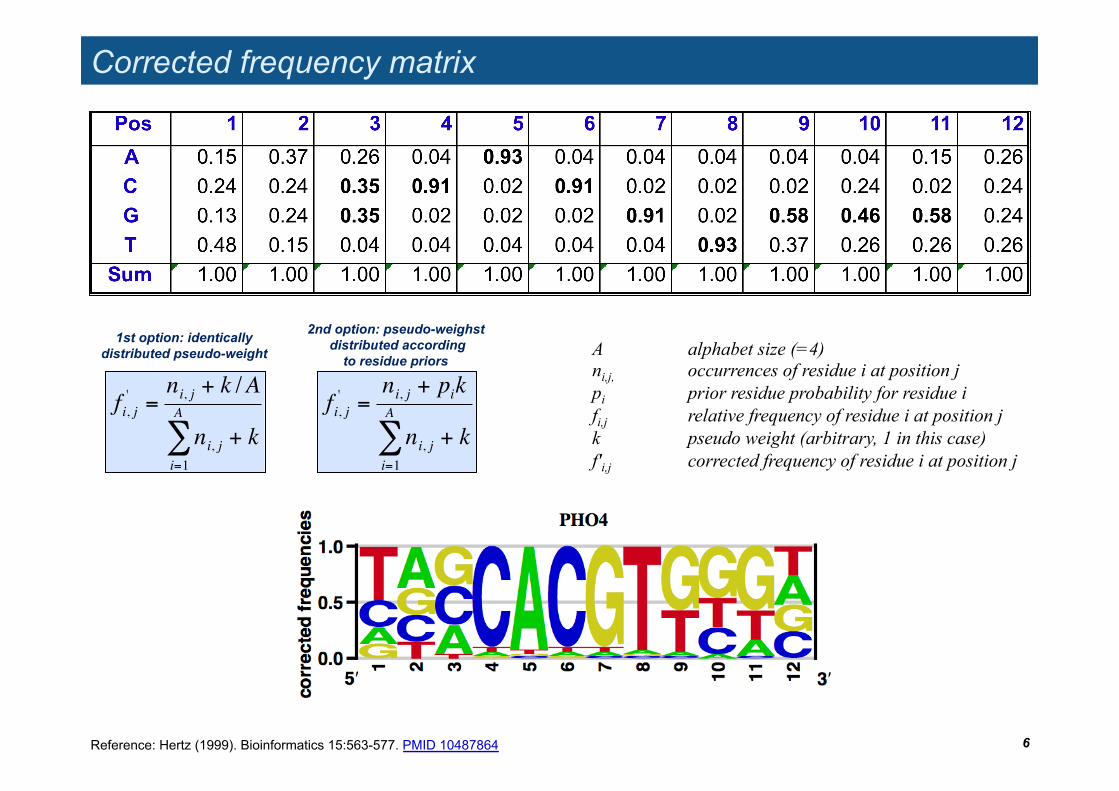
Corrected frequency matrix
6
A alphabet size (=4) ni,j, occurrences of residue i at position j pi prior residue probability for residue i fi,j relative frequency of residue i at position j k pseudo weight (arbitrary, 1 in this case) f'i,j corrected frequency of residue i at position j
!
fi, j' =
ni, j + k /A
ni, ji=1
A
" + k
1st option: identically distributed pseudo-weight
!
fi, j' =
ni, j + pik
ni, ji=1
A
" + k
2nd option: pseudo-weighst distributed according
to residue priors
Reference: Hertz (1999). Bioinformatics 15:563-577. PMID 10487864
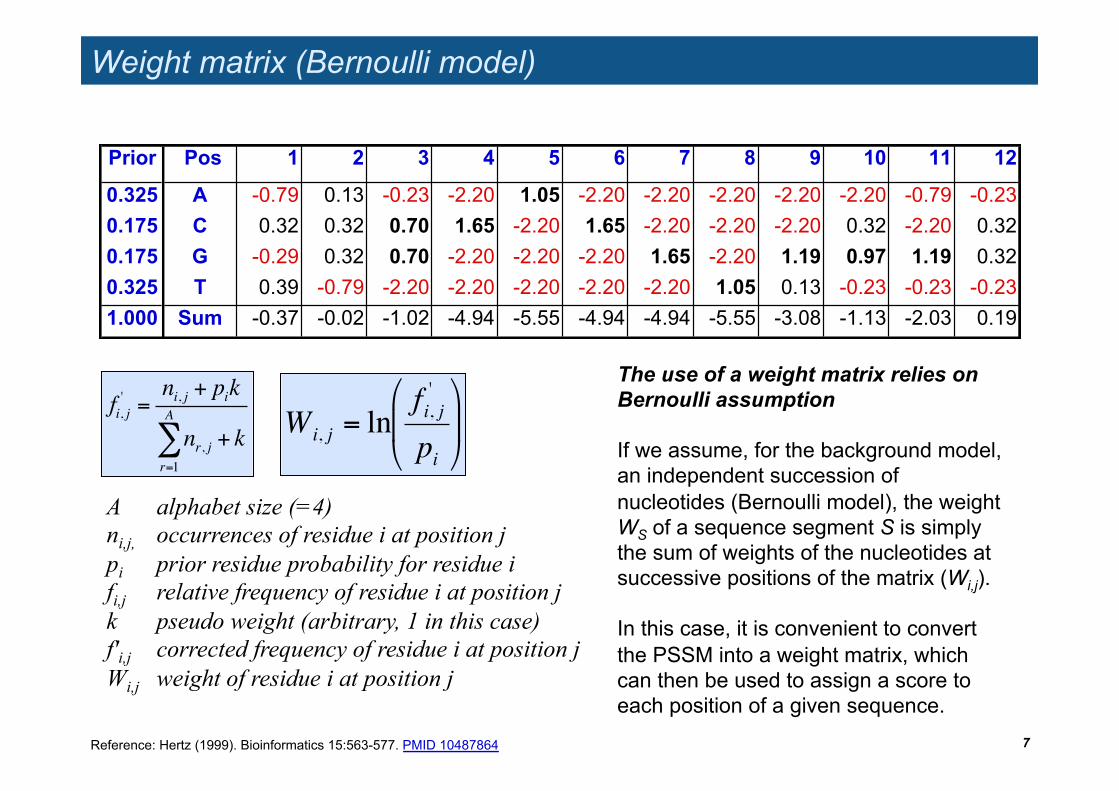
Weight matrix (Bernoulli model)
7
Prior Pos 1 2 3 4 5 6 7 8 9 10 11 12
0.325 A -0.79 0.13 -0.23 -2.20 1.05 -2.20 -2.20 -2.20 -2.20 -2.20 -0.79 -0.23 0.175 C 0.32 0.32 0.70 1.65 -2.20 1.65 -2.20 -2.20 -2.20 0.32 -2.20 0.32 0.175 G -0.29 0.32 0.70 -2.20 -2.20 -2.20 1.65 -2.20 1.19 0.97 1.19 0.32 0.325 T 0.39 -0.79 -2.20 -2.20 -2.20 -2.20 -2.20 1.05 0.13 -0.23 -0.23 -0.23 1.000 Sum -0.37 -0.02 -1.02 -4.94 -5.55 -4.94 -4.94 -5.55 -3.08 -1.13 -2.03 0.19
A alphabet size (=4) ni,j, occurrences of residue i at position j pi prior residue probability for residue i fi,j relative frequency of residue i at position j k pseudo weight (arbitrary, 1 in this case) f'i,j corrected frequency of residue i at position j Wi,j weight of residue i at position j
!
Wi, j = lnfi, j'
pi
"
# $
%
& '
fi, j' =
ni, j + pik
nr, jr=1
A
! + k
Reference: Hertz (1999). Bioinformatics 15:563-577. PMID 10487864
The use of a weight matrix relies on Bernoulli assumption If we assume, for the background model, an independent succession of nucleotides (Bernoulli model), the weight WS of a sequence segment S is simply the sum of weights of the nucleotides at successive positions of the matrix (Wi,j). In this case, it is convenient to convert the PSSM into a weight matrix, which can then be used to assign a score to each position of a given sequence.
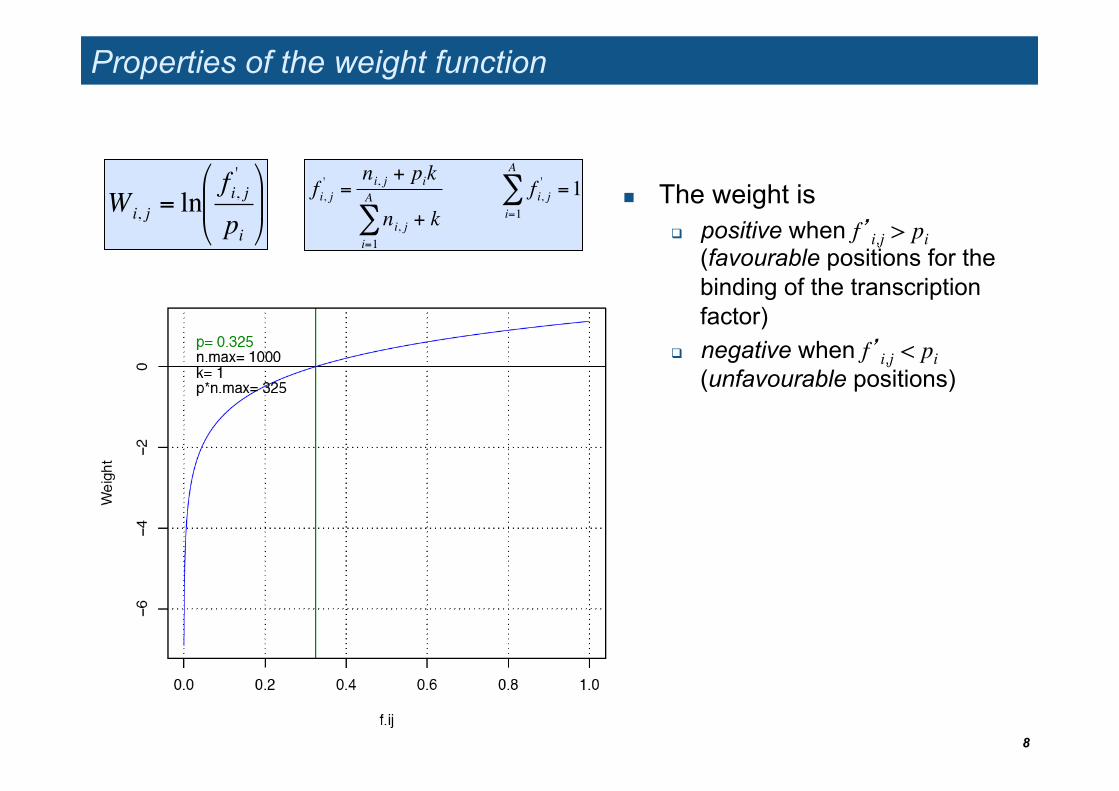
Properties of the weight function
8
The weight is positive when f’i,j > pi
(favourable positions for the binding of the transcription factor)
negative when f’i,j < pi���(unfavourable positions)
!
Wi, j = lnfi, j'
pi
"
# $
%
& '
!
fi, j' =
ni, j + pik
ni, ji=1
A
" + kfi, j'
i=1
A
" =1
Information content
Regulatory Sequence Analysis
9
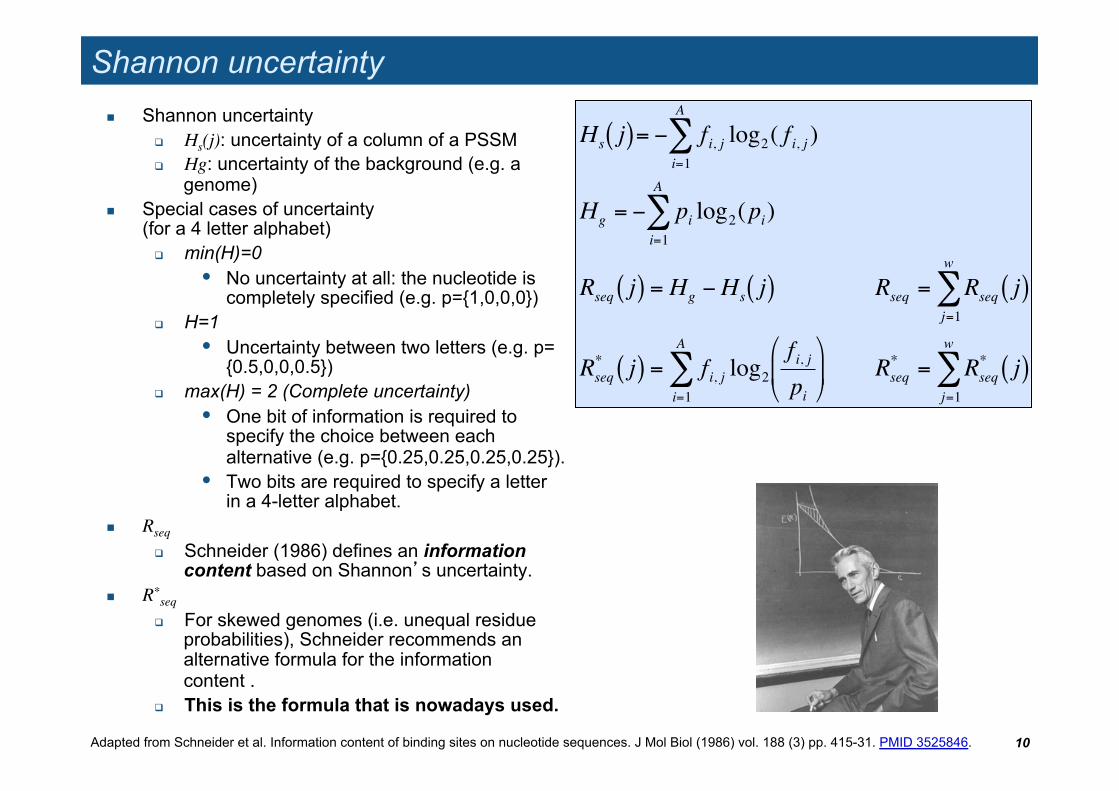
Shannon uncertainty Shannon uncertainty
Hs(j): uncertainty of a column of a PSSM Hg: uncertainty of the background (e.g. a
genome) Special cases of uncertainty
(for a 4 letter alphabet) min(H)=0
• No uncertainty at all: the nucleotide is completely specified (e.g. p={1,0,0,0})
H=1 • Uncertainty between two letters (e.g. p=
{0.5,0,0,0.5}) max(H) = 2 (Complete uncertainty)
• One bit of information is required to specify the choice between each alternative (e.g. p={0.25,0.25,0.25,0.25}).
• Two bits are required to specify a letter in a 4-letter alphabet.
Rseq Schneider (1986) defines an information
content based on Shannon’s uncertainty. R*
seq For skewed genomes (i.e. unequal residue
probabilities), Schneider recommends an alternative formula for the information content .
This is the formula that is nowadays used.
10 Adapted from Schneider et al. Information content of binding sites on nucleotide sequences. J Mol Biol (1986) vol. 188 (3) pp. 415-31. PMID 3525846.
!
Hs j( )= " fi, j log2( f i, j )i=1
A
#
Hg = " pi log2(pi)i=1
A
#
Rseq j( ) = Hg "Hs j( ) Rseq = Rseq j( )j=1
w
#
Rseq* j( ) = fi, j log2
f i, jpi
$
% &
'
( )
i=1
A
# Rseq* = Rseq
* j( )j=1
w
#
Shannon
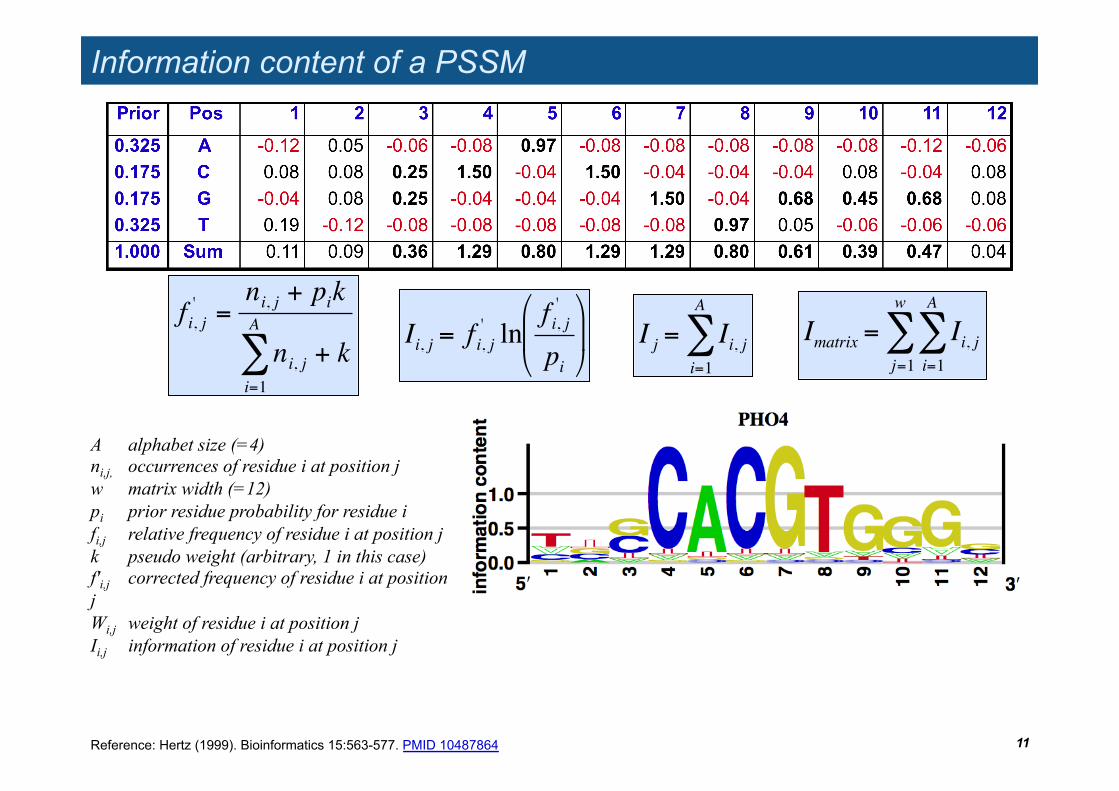
Information content of a PSSM
11
!
Imatrix = Ii, ji=1
A
"j=1
w
"
A alphabet size (=4) ni,j, occurrences of residue i at position j w matrix width (=12) pi prior residue probability for residue i fi,j relative frequency of residue i at position j k pseudo weight (arbitrary, 1 in this case) f'i,j corrected frequency of residue i at position j Wi,j weight of residue i at position j Ii,j information of residue i at position j
!
fi, j' =
ni, j + pik
ni, ji=1
A
" + k
!
Ii, j = f i, j' ln
f i, j'
pi
"
# $
%
& '
!
I j = Ii, ji=1
A
"
Reference: Hertz (1999). Bioinformatics 15:563-577. PMID 10487864
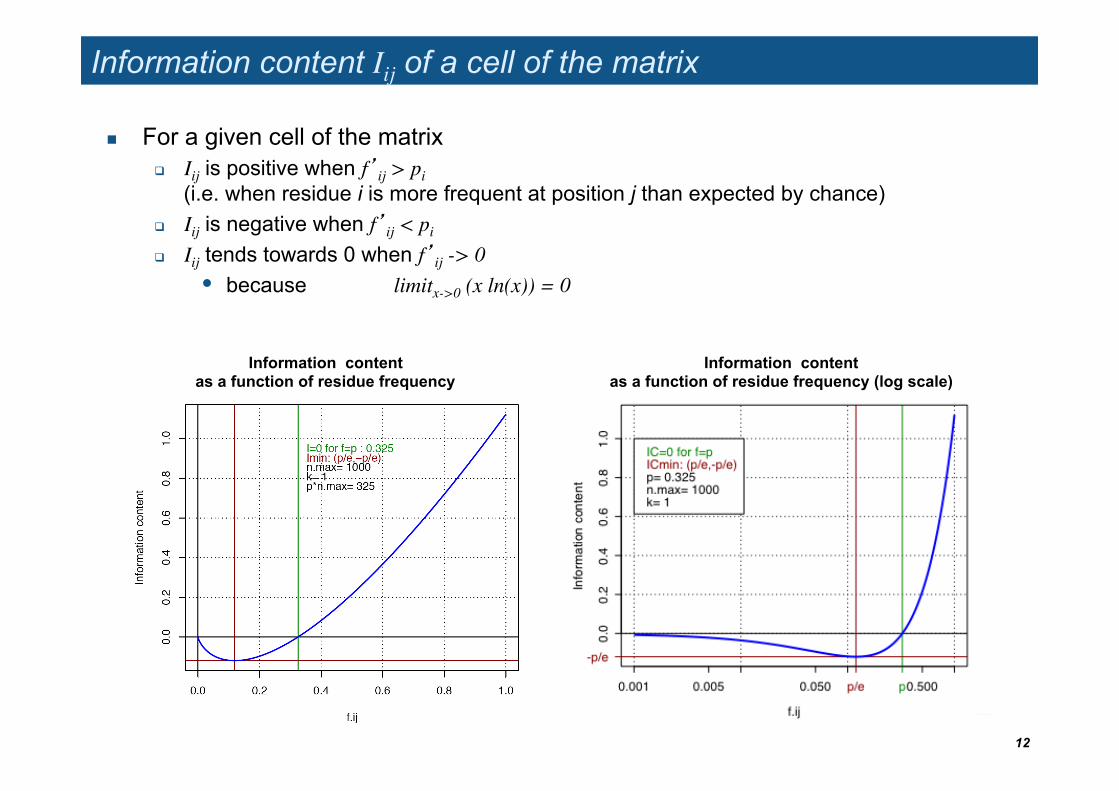
Information content Iij of a cell of the matrix
For a given cell of the matrix Iij is positive when f’ij > pi
(i.e. when residue i is more frequent at position j than expected by chance)
Iij is negative when f’ij < pi
Iij tends towards 0 when f’ij -> 0 • because limitx->0 (x ln(x)) = 0
12
Information content as a function of residue frequency
Information content as a function of residue frequency (log scale)
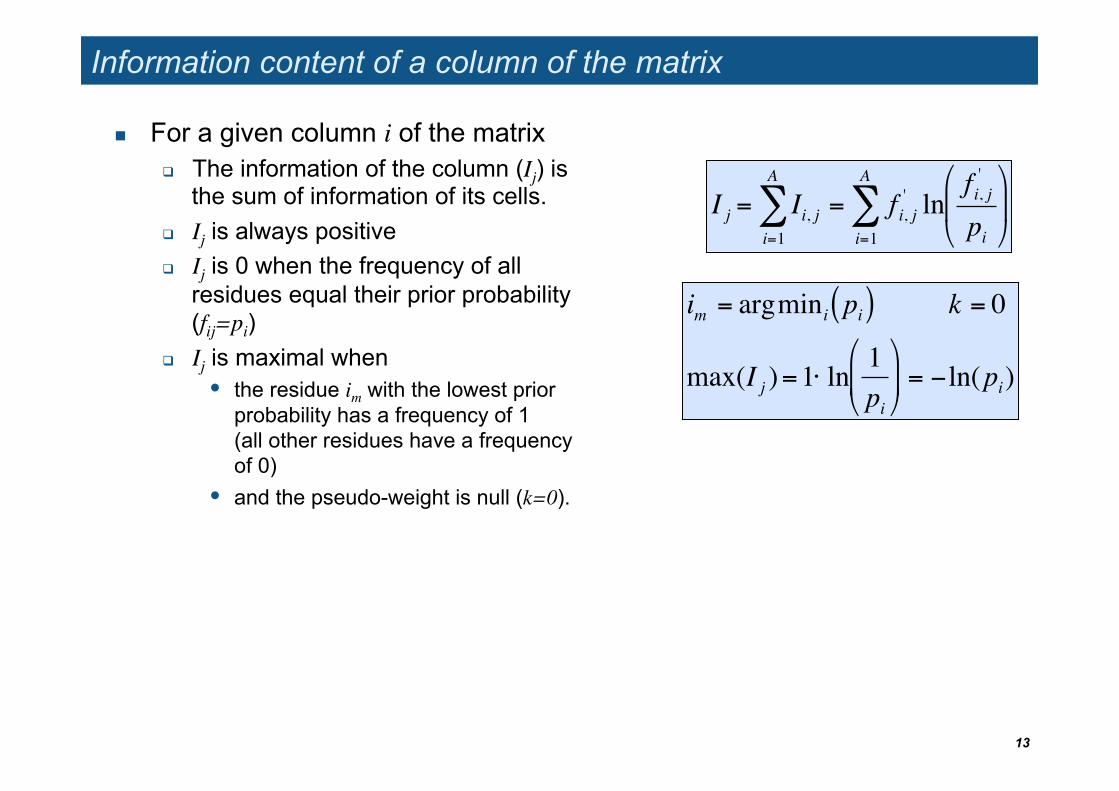
Information content of a column of the matrix
For a given column i of the matrix The information of the column (Ij) is
the sum of information of its cells. Ij is always positive Ij is 0 when the frequency of all
residues equal their prior probability (fij=pi)
Ij is maximal when • the residue im with the lowest prior
probability has a frequency of 1 (all other residues have a frequency of 0)
• and the pseudo-weight is null (k=0).
13
!
I j = Ii, ji=1
A
" = f i, j' ln
f i, j'
pi
#
$ %
&
' (
i=1
A
"
!
im = argmini pi( ) k = 0
max(I j )=1" ln1pi
#
$ %
&
' ( = )ln(pi)
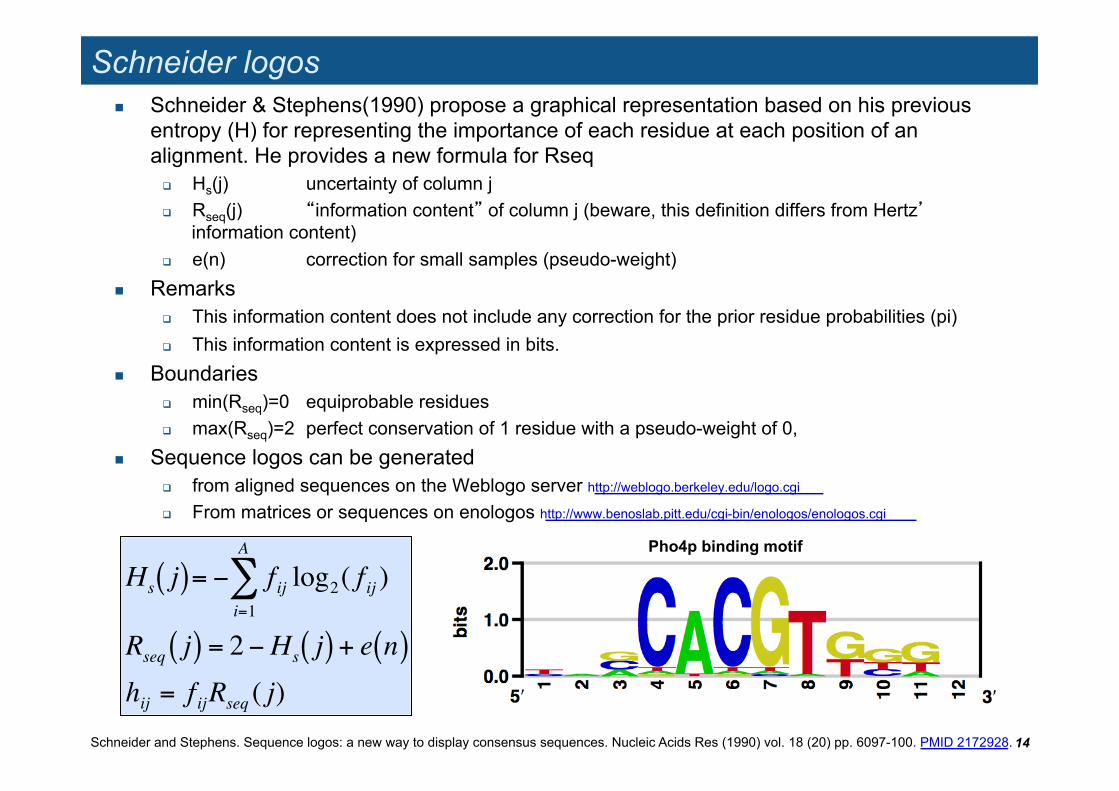
Schneider logos Schneider & Stephens(1990) propose a graphical representation based on his previous
entropy (H) for representing the importance of each residue at each position of an alignment. He provides a new formula for Rseq
Hs(j) uncertainty of column j Rseq(j) “information content” of column j (beware, this definition differs from Hertz’
information content) e(n) correction for small samples (pseudo-weight)
Remarks This information content does not include any correction for the prior residue probabilities (pi) This information content is expressed in bits.
Boundaries min(Rseq)=0 equiprobable residues max(Rseq)=2 perfect conservation of 1 residue with a pseudo-weight of 0,
Sequence logos can be generated from aligned sequences on the Weblogo server http://weblogo.berkeley.edu/logo.cgi
From matrices or sequences on enologos http://www.benoslab.pitt.edu/cgi-bin/enologos/enologos.cgi
14
!
Hs j( )= " fij log2( f ij )i=1
A
#
Rseq j( ) = 2 "Hs j( ) + e n( )hij = f ijRseq ( j)
Pho4p binding motif
Schneider and Stephens. Sequence logos: a new way to display consensus sequences. Nucleic Acids Res (1990) vol. 18 (20) pp. 6097-100. PMID 2172928.
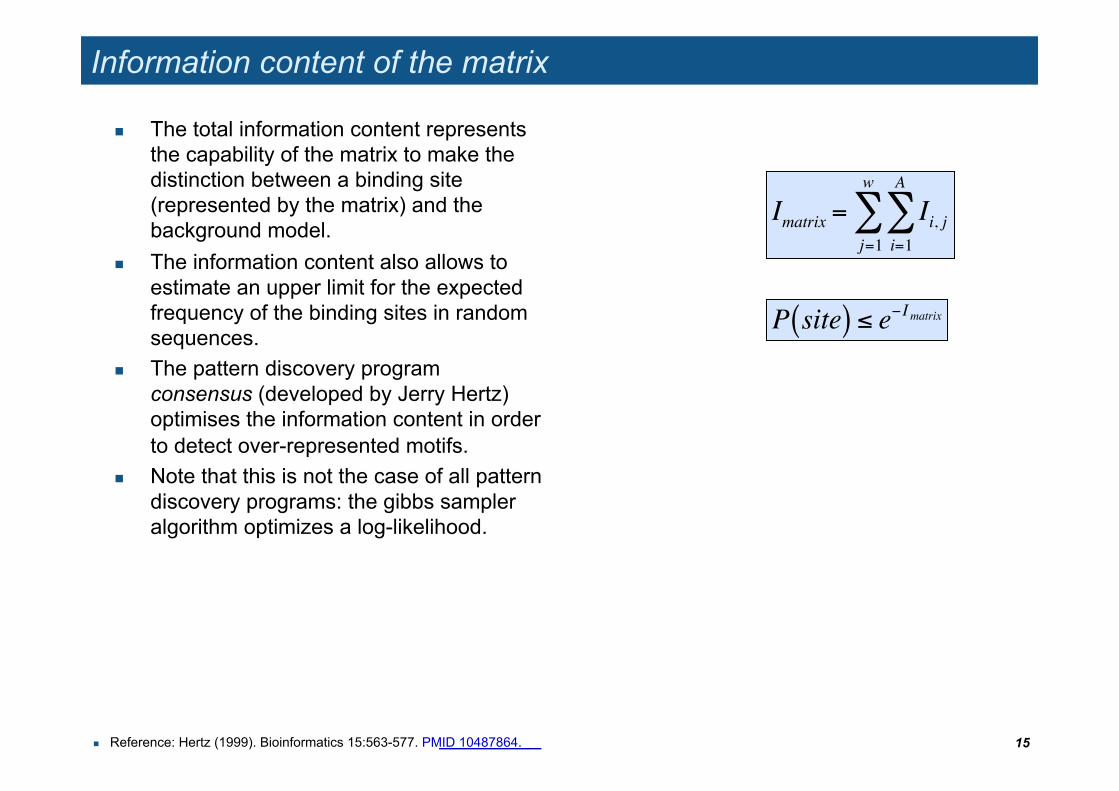
Information content of the matrix
The total information content represents the capability of the matrix to make the distinction between a binding site (represented by the matrix) and the background model.
The information content also allows to estimate an upper limit for the expected frequency of the binding sites in random sequences.
The pattern discovery program consensus (developed by Jerry Hertz) optimises the information content in order to detect over-represented motifs.
Note that this is not the case of all pattern discovery programs: the gibbs sampler algorithm optimizes a log-likelihood.
Reference: Hertz (1999). Bioinformatics 15:563-577. PMID 10487864. 15
!
Imatrix = Ii, ji=1
A
"j=1
w
"
!
P site( ) " e#I matrix
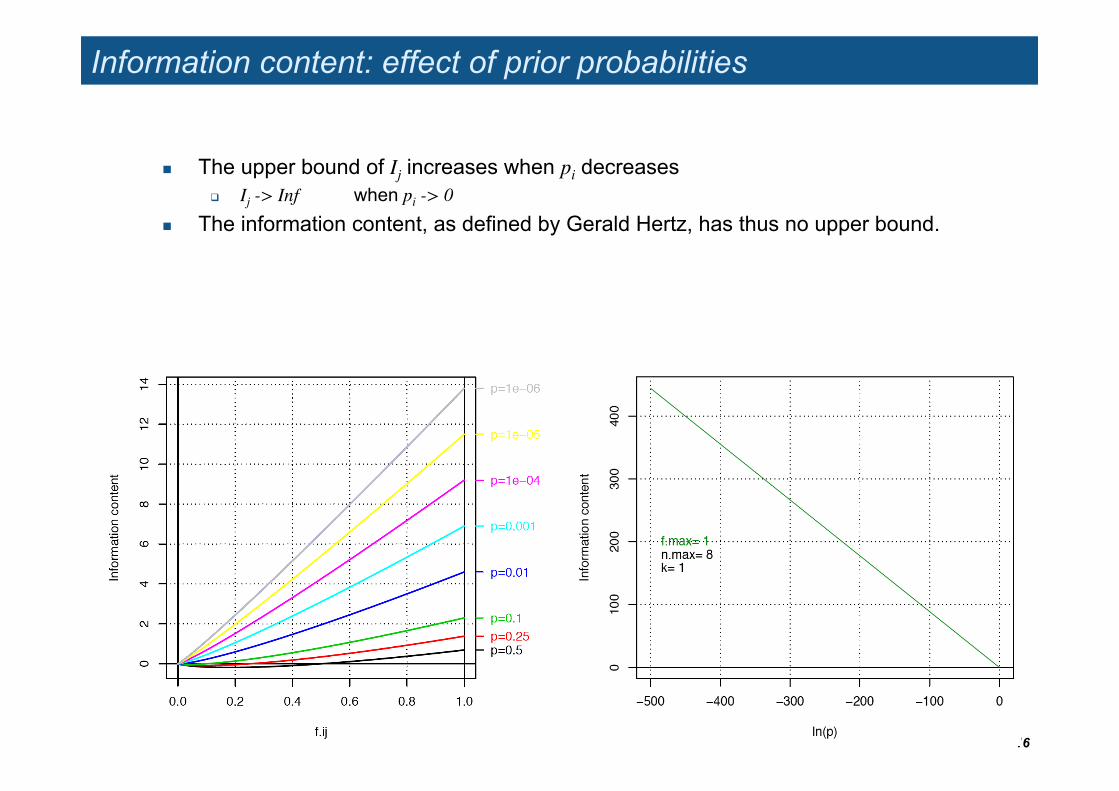
Information content: effect of prior probabilities
The upper bound of Ij increases when pi decreases Ij -> Inf when pi -> 0
The information content, as defined by Gerald Hertz, has thus no upper bound.
16
References - PSSM information content
Seminal articles by Tom Schneider Schneider, T.D., G.D. Stormo, L. Gold, and A. Ehrenfeucht. 1986. Information content
of binding sites on nucleotide sequences. J Mol Biol 188: 415-431. Schneider, T.D. and R.M. Stephens. 1990. Sequence logos: a new way to display
consensus sequences. Nucleic Acids Res 18: 6097-6100. Tom Schneider’s publications online
• http://www.lecb.ncifcrf.gov/~toms/paper/index.html Seminal article by Gerald Hertz
Hertz, G.Z. and G.D. Stormo. 1999. Identifying DNA and protein patterns with statistically significant alignments of multiple sequences. Bioinformatics 15: 563-577.
Software tools to draw sequence logos Weblogo
• http://weblogo.berkeley.edu/logo.cgi Enologos
• http://biodev.hgen.pitt.edu/cgi-bin/enologos/enologos.cgi
17