Scoring Matrices
23
Scoring Matrices Scoring matrices, PSSMs, and HMMs BIO520 Bioinformatics Jim Lund Reading: Ch 6.1
-
Upload
genevieve-foley -
Category
Documents
-
view
163 -
download
4
description
Scoring Matrices. Scoring matrices, PSSMs, and HMMs. Reading: Ch 6.1. BIO520 BioinformaticsJim Lund. Alignment scoring matrix. DNA matrix: A C G T A 5 -4 -4 -4 C -4 5 -4 -4 G -4 -4 5 -4 T -4 -4 -4 5. Alignment scoring matrix. Protein matrix:. Use of a scoring matrix. - PowerPoint PPT Presentation
Transcript of Scoring Matrices
Scoring Matrices
Scoring matrices, PSSMs, and HMMs
BIO520 Bioinformatics Jim Lund
Reading: Ch 6.1
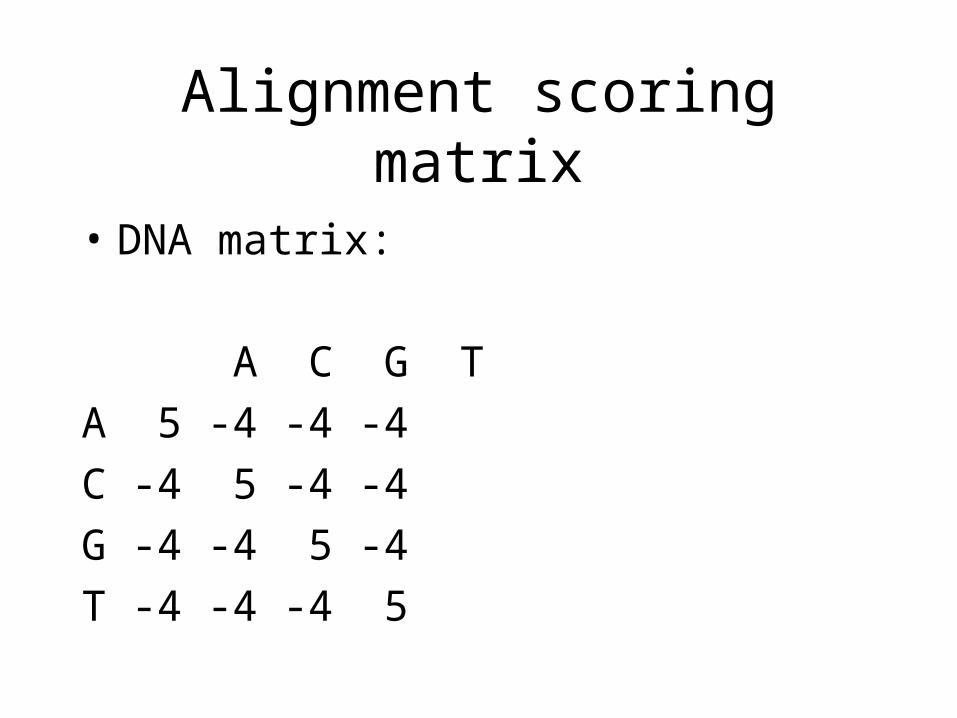
Alignment scoring matrix
• DNA matrix:
A C G T
A 5 -4 -4 -4
C -4 5 -4 -4
G -4 -4 5 -4
T -4 -4 -4 5
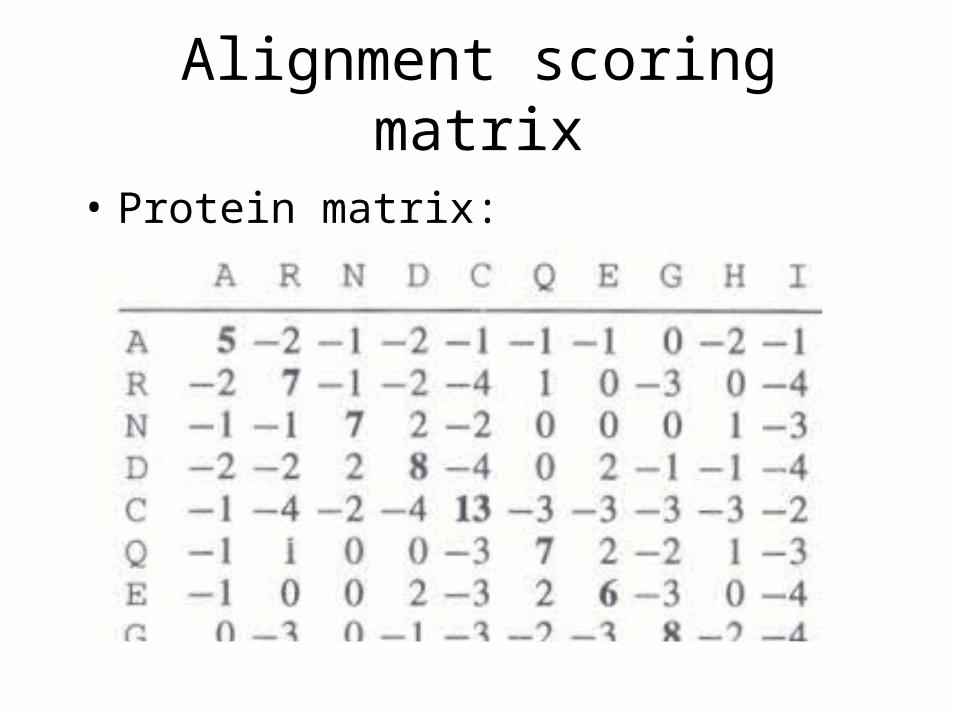
Alignment scoring matrix
• Protein matrix:
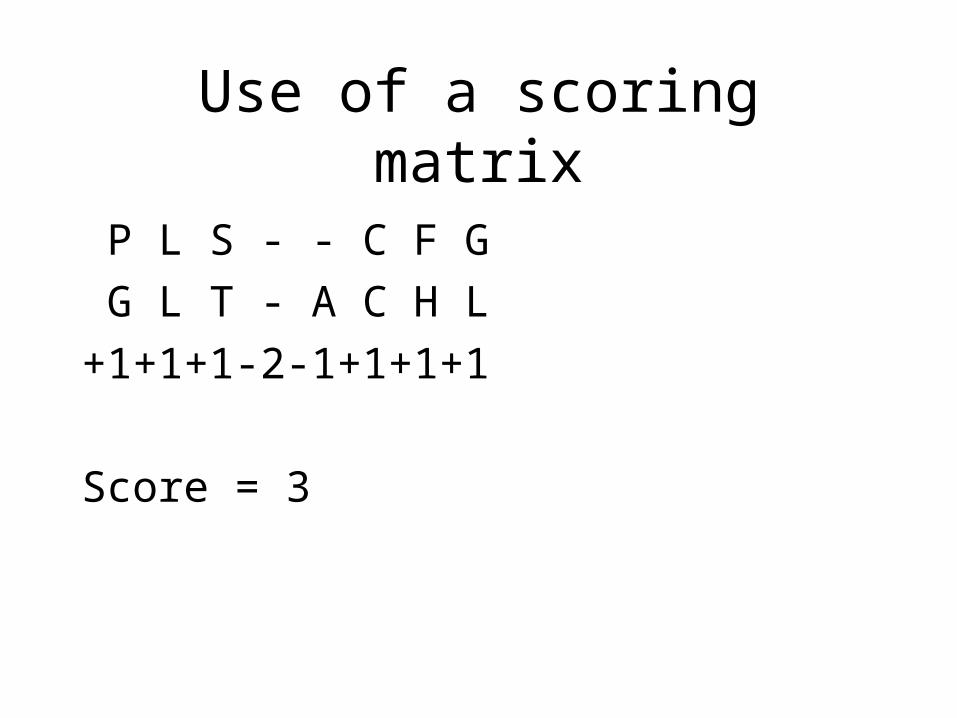
Use of a scoring matrix
P L S - - C F G
G L T - A C H L
+1+1+1-2-1+1+1+1
Score = 3
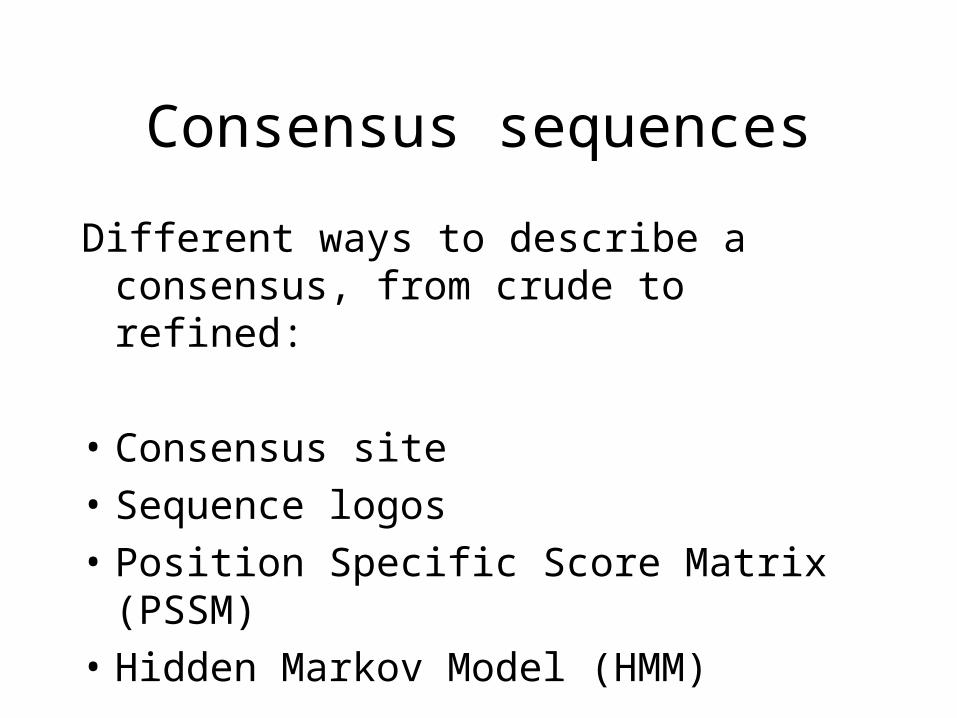
Consensus sequences
Different ways to describe a consensus, from crude to refined:
• Consensus site
• Sequence logos
• Position Specific Score Matrix (PSSM)
• Hidden Markov Model (HMM)
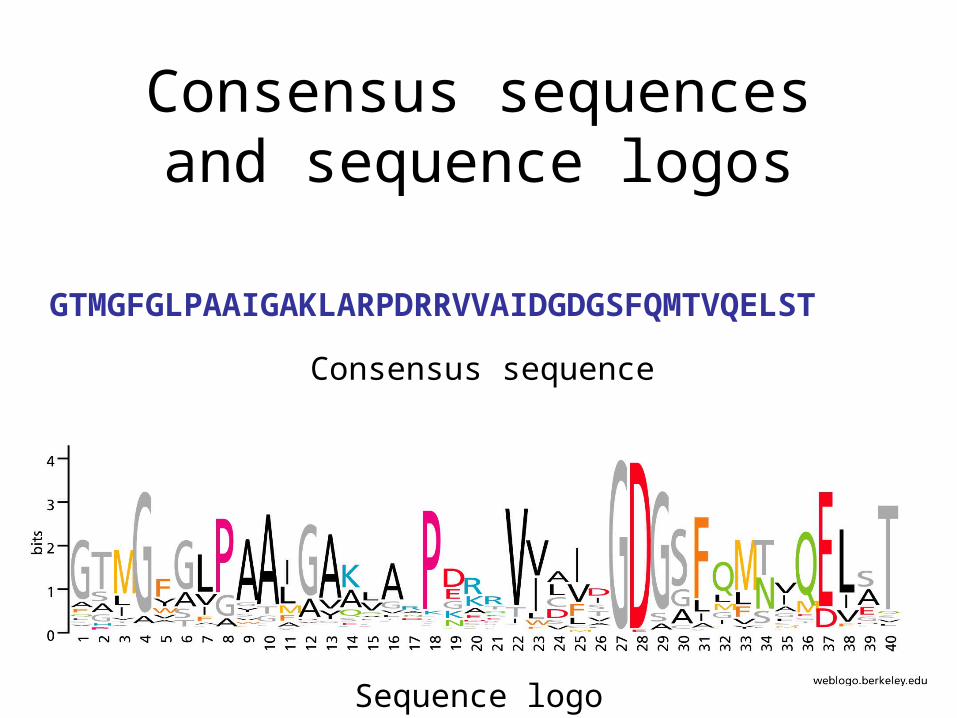
Consensus sequences and sequence logos
Sequence logo
Consensus sequence
GTMGFGLPAAIGAKLARPDRRVVAIDGDGSFQMTVQELST
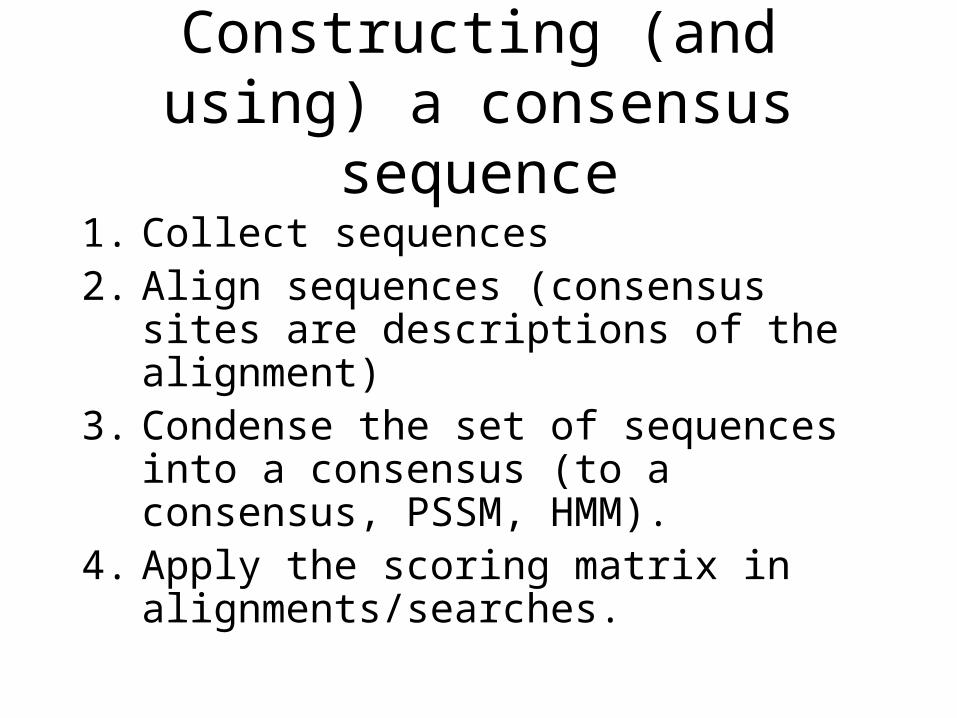
Constructing (and using) a consensus sequence
1. Collect sequences2. Align sequences (consensus sites are
descriptions of the alignment)3. Condense the set of sequences into a
consensus (to a consensus, PSSM, HMM).
4. Apply the scoring matrix in alignments/searches.
Position Specific Score Matrix (PSSM)
• A position specific scoring matrix (PSSM) is a matrix based on the amino acid frequencies (or nucleic acid frequencies) at every position of a multiple alignment.
• From these frequencies, the PSSM that will be calculated will result in a matrix that will assign superior scores to residues that appear more often than by chance at a certain position.
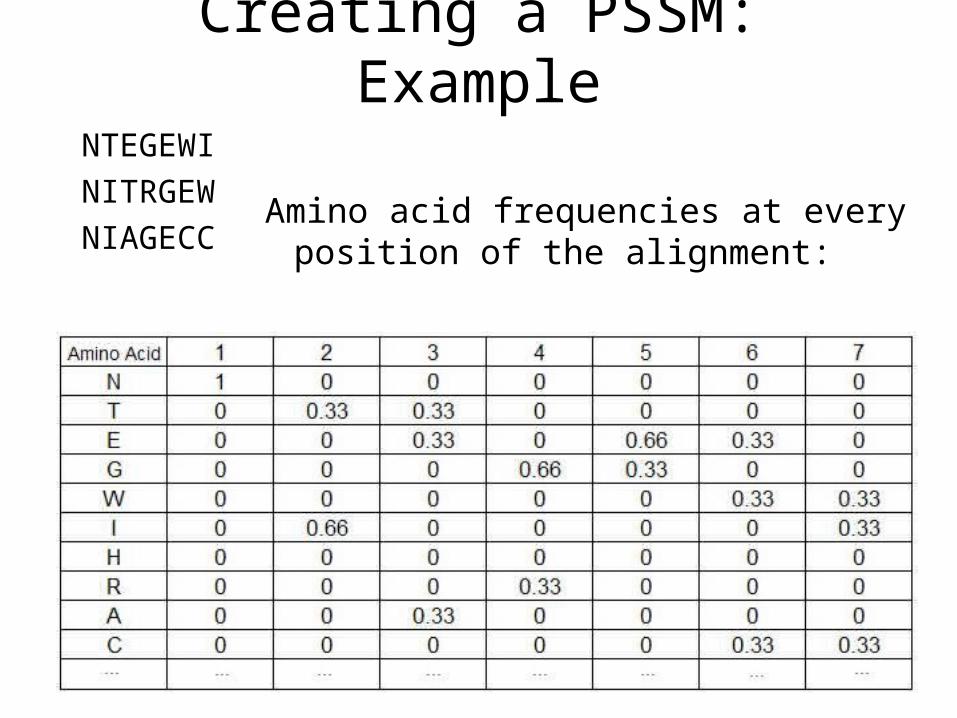
Creating a PSSM: Example
NTEGEWI
NITRGEW
NIAGECCAmino acid frequencies at every
position of the alignment:
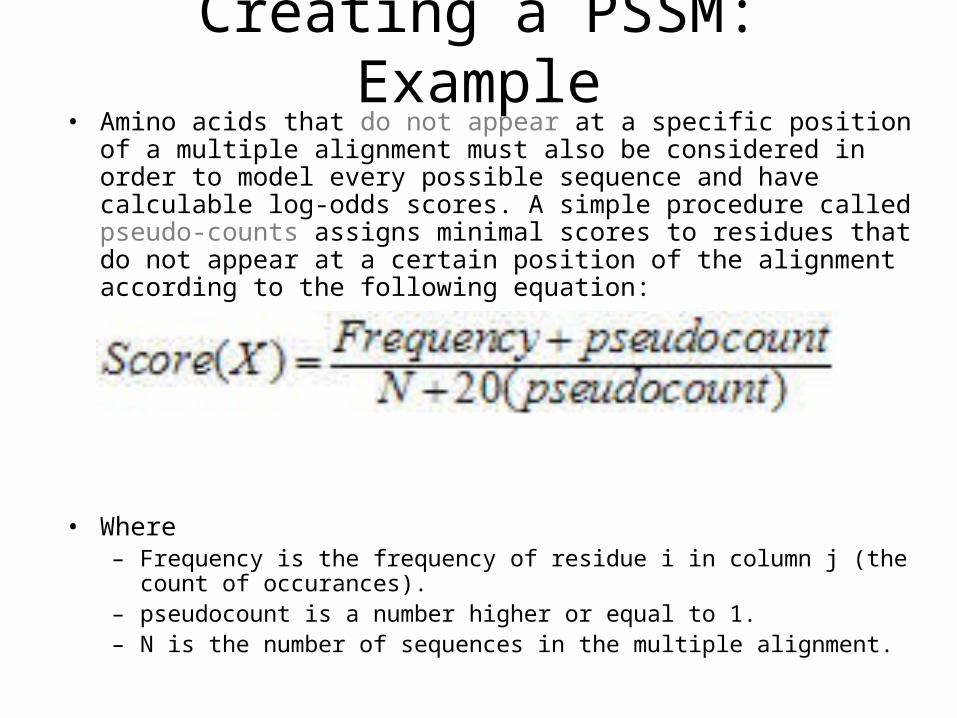
Creating a PSSM: Example• Amino acids that do not appear at a specific position of a multiple
alignment must also be considered in order to model every possible sequence and have calculable log-odds scores. A simple procedure called pseudo-counts assigns minimal scores to residues that do not appear at a certain position of the alignment according to the following equation:
• Where– Frequency is the frequency of residue i in column j (the count of
occurances).– pseudocount is a number higher or equal to 1.– N is the number of sequences in the multiple alignment.
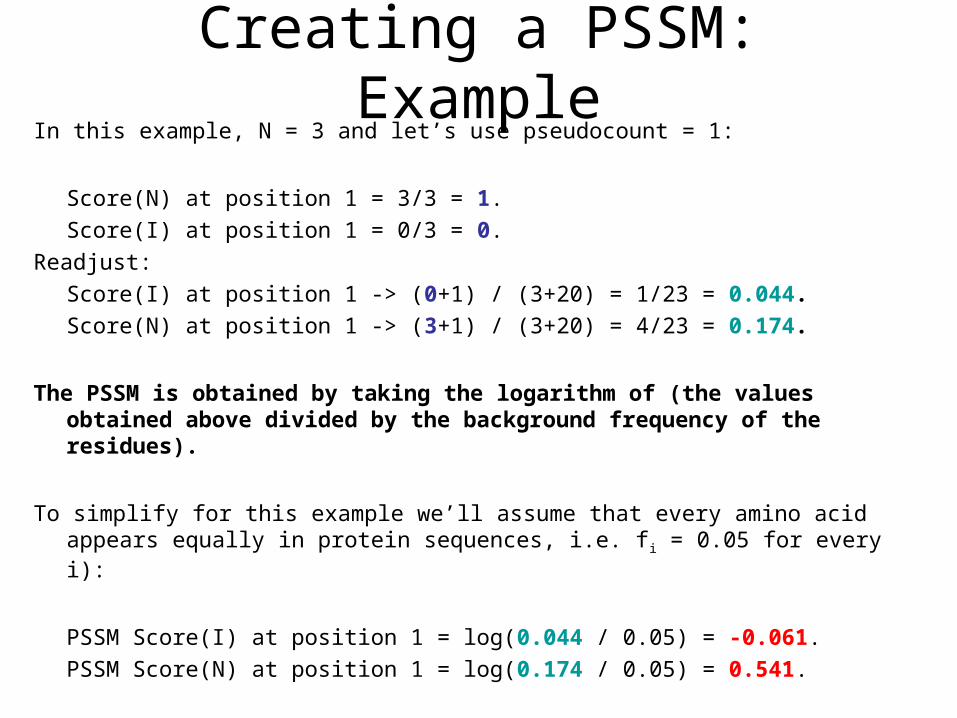
In this example, N = 3 and let’s use pseudocount = 1:
Score(N) at position 1 = 3/3 = 1.
Score(I) at position 1 = 0/3 = 0.
Readjust:
Score(I) at position 1 -> (0+1) / (3+20) = 1/23 = 0.044.
Score(N) at position 1 -> (3+1) / (3+20) = 4/23 = 0.174.
The PSSM is obtained by taking the logarithm of (the values obtained above divided by the background frequency of the residues).
To simplify for this example we’ll assume that every amino acid appears equally in protein sequences, i.e. fi = 0.05 for every i):
PSSM Score(I) at position 1 = log(0.044 / 0.05) = -0.061.
PSSM Score(N) at position 1 = log(0.174 / 0.05) = 0.541.
Creating a PSSM: Example
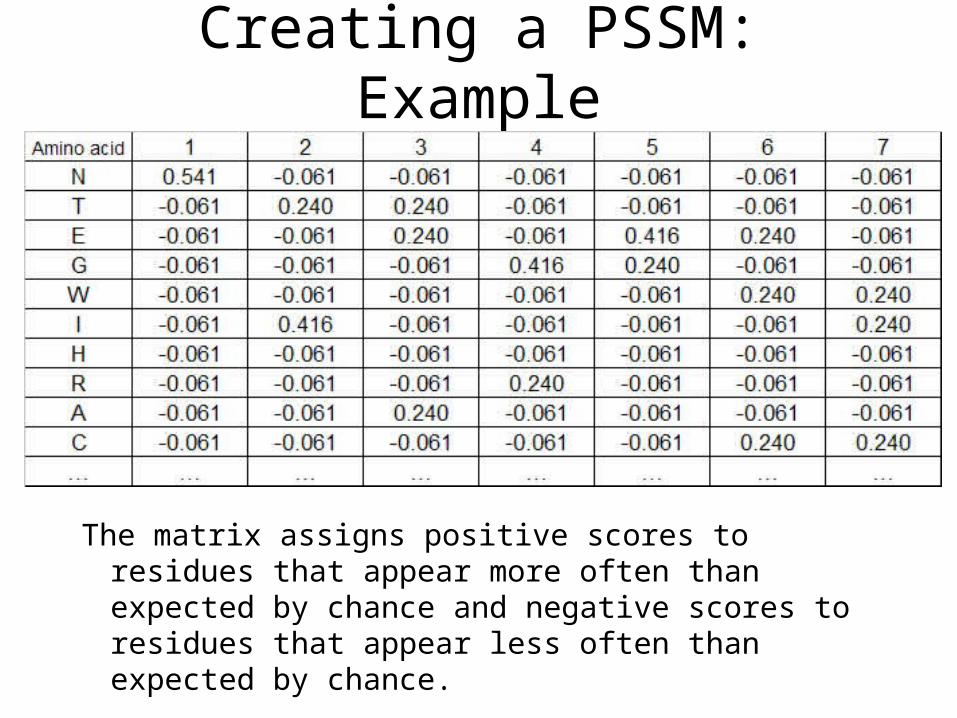
The matrix assigns positive scores to residues that appear more often than expected by chance and negative scores to residues that appear less often than expected by chance.
Creating a PSSM: Example
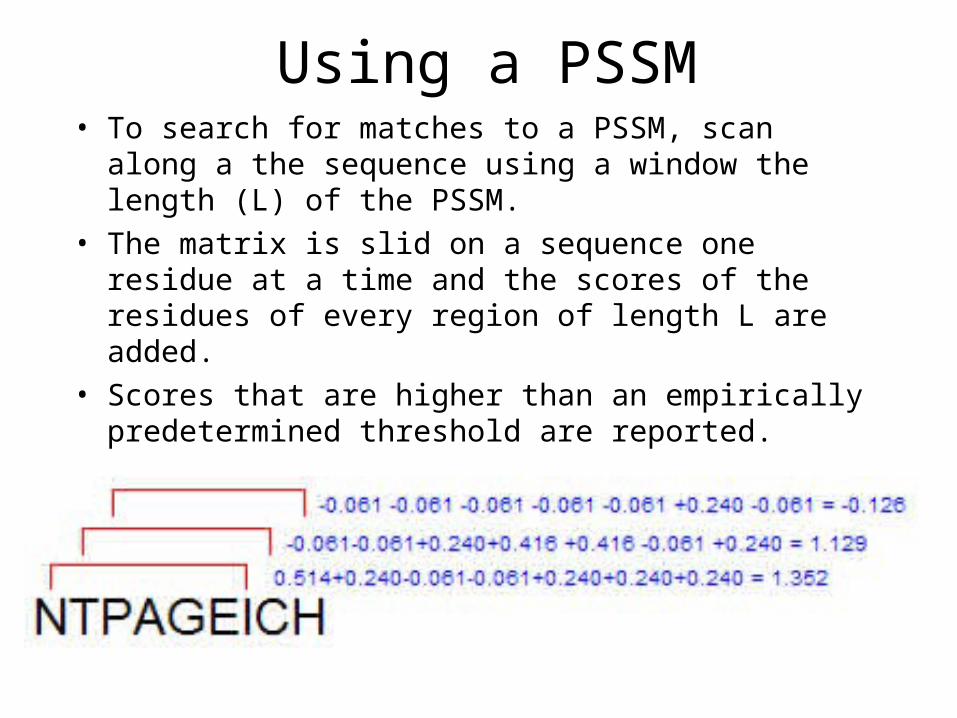
Using a PSSM• To search for matches to a PSSM, scan along a the
sequence using a window the length (L) of the PSSM.
• The matrix is slid on a sequence one residue at a time and the scores of the residues of every region of length L are added.
• Scores that are higher than an empirically predetermined threshold are reported.
Advantages of PSSM
• Weights sequence according to observed diversity specific to the family of interest
• Minimal assumptions
• Easy to compute
• Can be used in comprehensive evaluations.
More sophisticated PSSMs
1. PSSM with pseudocounts.2. Giving pseudocounts less weight when more
alignment data is available.3. Weight pseudocount amino acids by their
frequency of occurrence in proteins.4. Instead of giving pseudocounts all the same
value, weight them by their similarity to the consensus (like BLOSUM62 does) at each position. (PSI-BLAST method).
5. Combine 2 & 4 (Dirichlet mixture method).
From less to more complicated
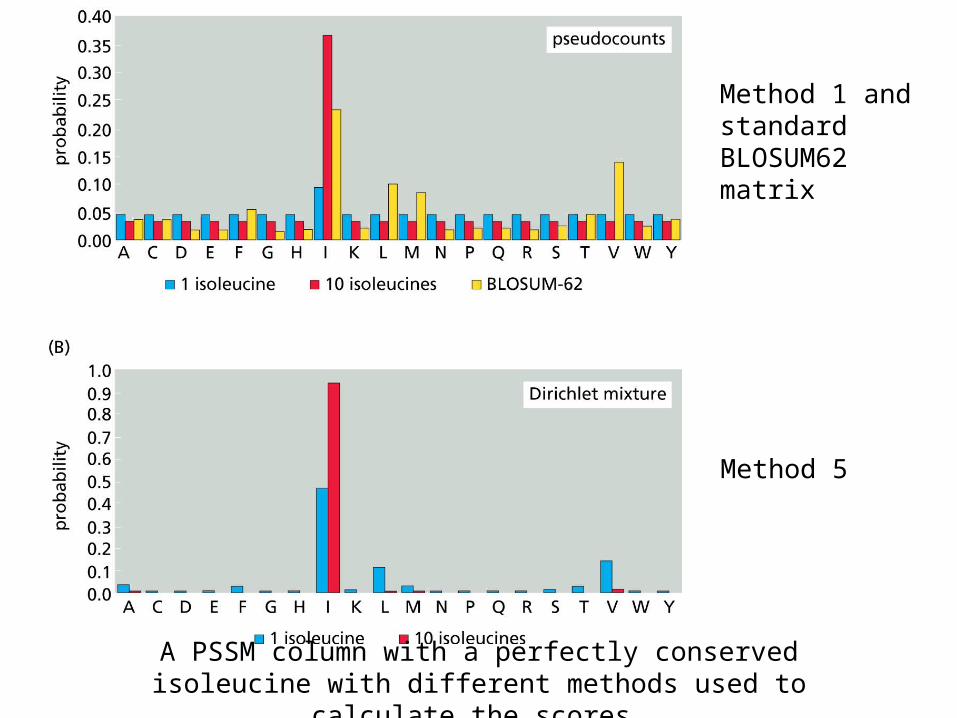
Method 1 and standard BLOSUM62 matrix
Method 5
A PSSM column with a perfectly conserved isoleucine with different methods used to calculate the scores.
Using Hidden Markov models to describe sequence alignment profiles
• A profile HMM can represent a sequence alignment profile similar to how a PSSM does.
• A profile HMM includes information on the amino acid consensus at each position in the alignment like a PSSM.
• A profile HMM also has position-specific scores for gap insertion and extensions.
Background: Creating HMMs
To create an HMM to model data we need to determine two things:
• The structure/topology of the HMM—states and transitions
• The values of the parameters—emission and transition probabilities.
• Determining the parameters is called “training”.
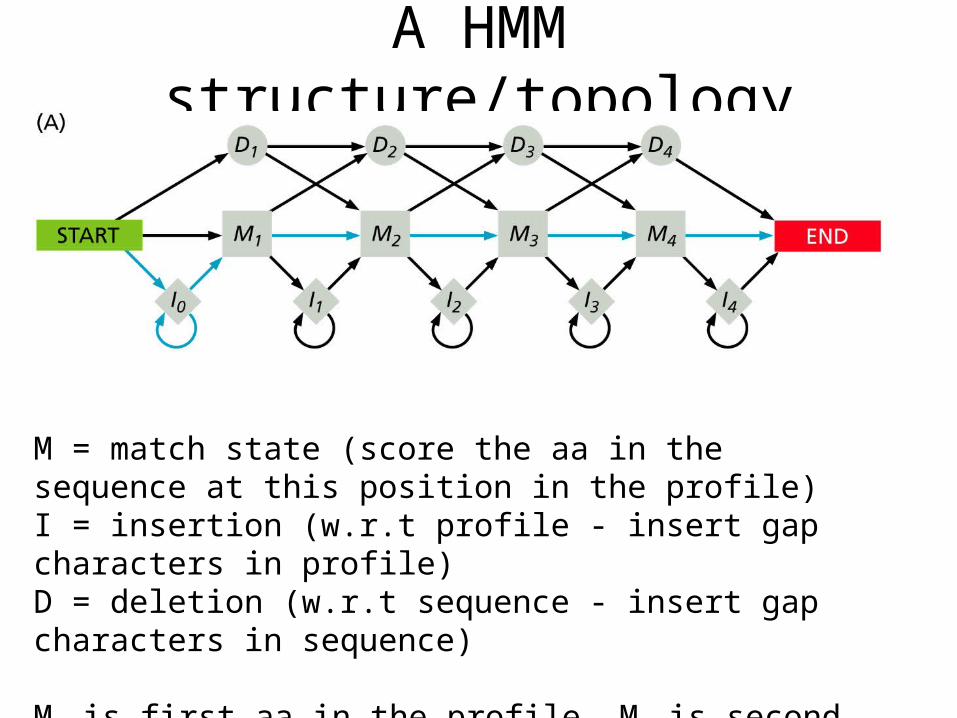
A HMM structure/topology
M = match state (score the aa in the sequence at this position in the profile)I = insertion (w.r.t profile - insert gap characters in profile)D = deletion (w.r.t sequence - insert gap characters in sequence)
M1 is first aa in the profile, M2 is second, etc.
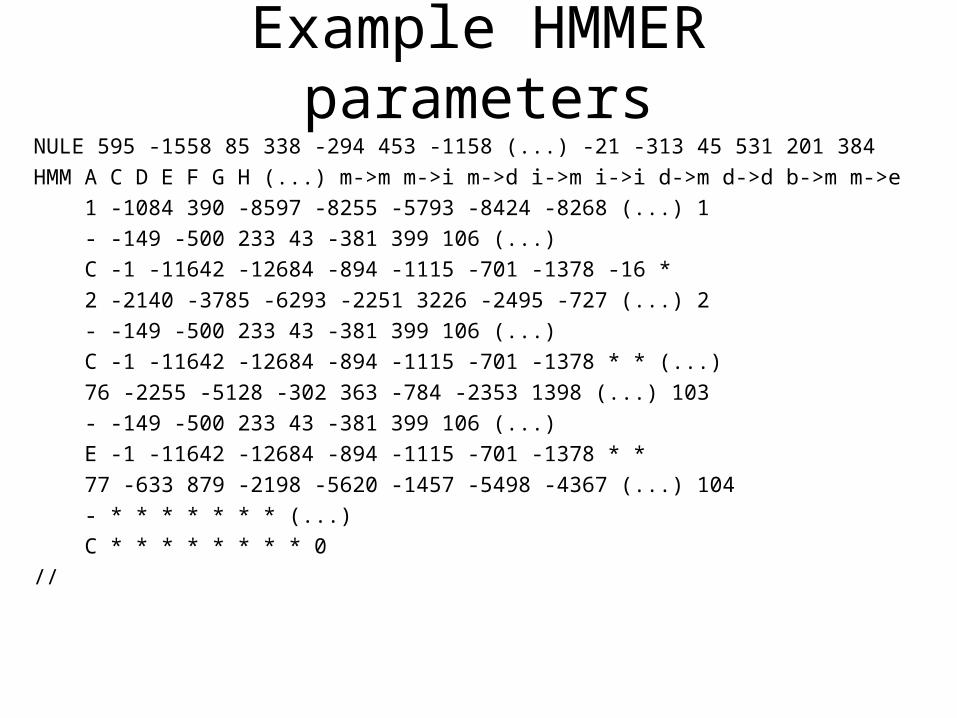
Example HMMER parametersNULE 595 -1558 85 338 -294 453 -1158 (...) -21 -313 45 531 201 384
HMM A C D E F G H (...) m->m m->i m->d i->m i->i d->m d->d b->m m->e
1 -1084 390 -8597 -8255 -5793 -8424 -8268 (...) 1
- -149 -500 233 43 -381 399 106 (...)
C -1 -11642 -12684 -894 -1115 -701 -1378 -16 *
2 -2140 -3785 -6293 -2251 3226 -2495 -727 (...) 2
- -149 -500 233 43 -381 399 106 (...)
C -1 -11642 -12684 -894 -1115 -701 -1378 * * (...)
76 -2255 -5128 -302 363 -784 -2353 1398 (...) 103
- -149 -500 233 43 -381 399 106 (...)
E -1 -11642 -12684 -894 -1115 -701 -1378 * *
77 -633 879 -2198 -5620 -1457 -5498 -4367 (...) 104
- * * * * * * * (...)
C * * * * * * * * 0
//
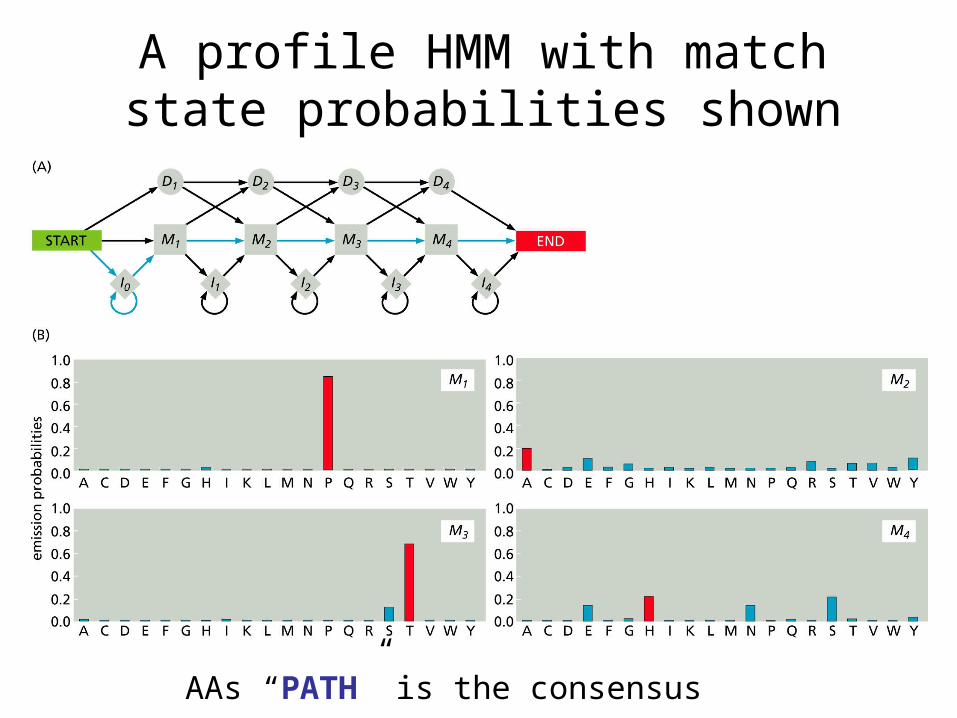
A profile HMM with match state probabilities shown
AAs “PATH” is the consensus sequence.
Building a profile HMM
• Pick a HMM structure/topology.• Estimate initial parameters.• Train the HMM by running sequences
through it. • Transitions that get used are given
higher probabilities, those rarely used are given lower probabilities.
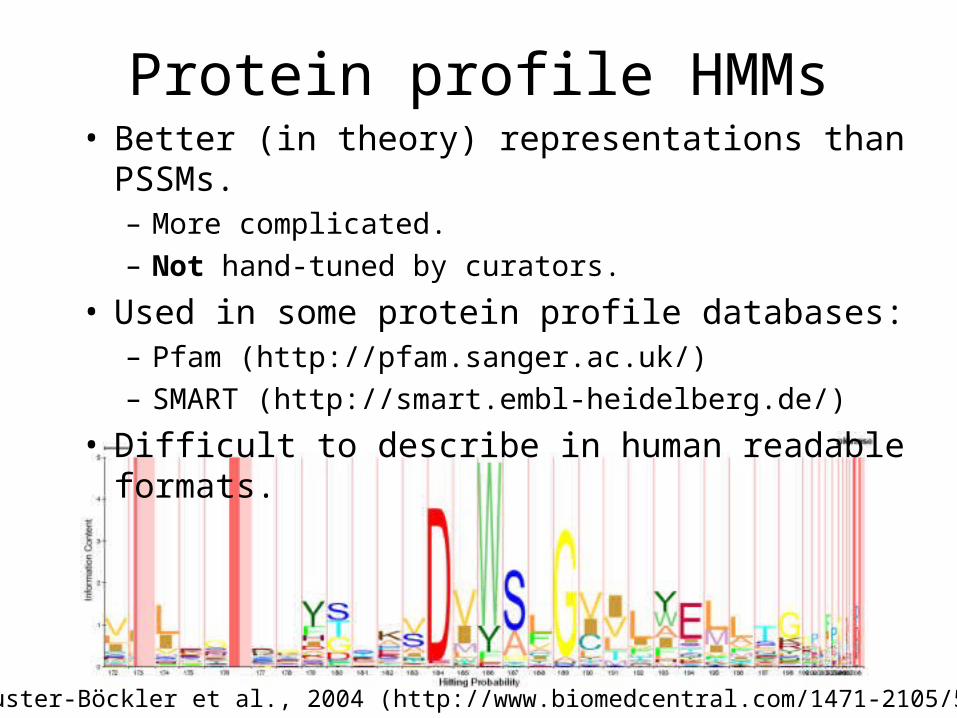
Protein profile HMMs• Better (in theory) representations than PSSMs.
– More complicated.– Not hand-tuned by curators.
• Used in some protein profile databases:– Pfam (http://pfam.sanger.ac.uk/)– SMART (http://smart.embl-heidelberg.de/)
• Difficult to describe in human readable formats.
Schuster-Böckler et al., 2004 (http://www.biomedcentral.com/1471-2105/5/7)