Population pharmacokinetics and dos ing optimization...
34
1 Population pharmacokinetics and dosing optimization of vancomycin 1 in children with malignant hematological disease 2 3 Wei Zhao 1,2 # , Daolun Zhang 1 , May Fakhoury 1 , Mony Fahd 3 , Frederique 4 Duquesne 3 , Thomas Storme 4 , André Baruchel 3,5 , Evelyne Jacqz-Aigrain 1,2,5# 5 1. Department of Pediatric Pharmacology and Pharmacogenetics, Hôpital Robert Debré, 6 APHP, Paris, France 7 2. Clinical Investigation Center CIC9202, INSERM, Paris, France 8 3. AP-HP, Department of Pediatric Hemato-Oncology, Hôpital Robert Debré, Paris, 9 France 10 4. Department of Pharmacy, Hôpital Robert Debré, APHP, Paris, France 11 5. Université Paris Diderot, Sorbonne Paris Cité, Paris, France 12 13 Address for correspondence: 14 Doctor Wei Zhao 15 Professor Evelyne Jacqz-Aigrain, 16 Department of Pediatric Pharmacology and Pharmacogenetics, Hôpital Robert Debré 17 Clinical Investigation Center CIC9202, INSERM 18 48 Boulevard Sérurier, 75935 Paris Cedex 19, France 19 Phone: 0033 140033656 Fax: 0033 140035779 20 E-mail: 21 [email protected] 22 [email protected] 23 AAC Accepts, published online ahead of print on 24 March 2014 Antimicrob. Agents Chemother. doi:10.1128/AAC.02564-13 Copyright © 2014, American Society for Microbiology. All Rights Reserved. on February 1, 2019 by guest http://aac.asm.org/ Downloaded from
Transcript of Population pharmacokinetics and dos ing optimization...

1
Population pharmacokinetics and dosing optimization of vancomycin 1
in children with malignant hematological disease 2
3
Wei Zhao1,2 #, Daolun Zhang1, May Fakhoury1, Mony Fahd3, Frederique 4
Duquesne3, Thomas Storme4, André Baruchel3,5, Evelyne Jacqz-Aigrain1,2,5# 5
1. Department of Pediatric Pharmacology and Pharmacogenetics, Hôpital Robert Debré, 6
APHP, Paris, France 7
2. Clinical Investigation Center CIC9202, INSERM, Paris, France 8
3. AP-HP, Department of Pediatric Hemato-Oncology, Hôpital Robert Debré, Paris, 9
France 10
4. Department of Pharmacy, Hôpital Robert Debré, APHP, Paris, France 11
5. Université Paris Diderot, Sorbonne Paris Cité, Paris, France 12
13
Address for correspondence: 14
Doctor Wei Zhao 15
Professor Evelyne Jacqz-Aigrain, 16
Department of Pediatric Pharmacology and Pharmacogenetics, Hôpital Robert Debré 17
Clinical Investigation Center CIC9202, INSERM 18
48 Boulevard Sérurier, 75935 Paris Cedex 19, France 19
Phone: 0033 140033656 Fax: 0033 140035779 20
E-mail: 21
AAC Accepts, published online ahead of print on 24 March 2014Antimicrob. Agents Chemother. doi:10.1128/AAC.02564-13Copyright © 2014, American Society for Microbiology. All Rights Reserved.
on February 1, 2019 by guest
http://aac.asm.org/
Dow
nloaded from

2
Short title: Pharmacokinetics of vancomycin in children 24
Abstract: 249 words; Manuscript: 3442 words; References: 25; Figures: 4; Tables: 4. 25
Keywords: Vancomycin, Pharmacokinetics, Population pharmacokinetics, dosing 26
optimization, pediatrics, malignant hematological disease. 27
28
on February 1, 2019 by guest
http://aac.asm.org/
Dow
nloaded from

3
Background: Increased vancomycin dose has been proposed in adults with malignant 29
hematological disease. As pediatric data are limited, our aim was to evaluate the 30
population pharmacokinetics of vancomycin in order to define the appropriate dosing 31
regimen in children with malignant hematological disease. 32
Methods: Vancomycin concentrations were collected prospectively during therapeutic 33
monitoring. Population pharmacokinetic analysis was performed using NONMEM 34
software. 35
Results: Seventy children (age range: 0.3-17.7 years) were included. With current 36
recommended dosing regimen of 40-60 mg/kg/day, 53 children (76%) had sub-37
therapeutic steady-state trough concentrations (Css,min<10mg/L). A one-compartment 38
model with first-order elimination was developed. Systematic covariate analysis identified 39
that weight significantly influenced clearance (CL) and volume of distribution (V) with 40
power functions of 0.677 for CL and 0.838 for V. Vancomycin CL also significantly 41
increased with increasing of creatinine clearance and seems to be higher in children with 42
malignant hematological disease than in general pediatric population. The model was 43
validated internally. Its predictive performance was further confirmed in an external 44
validation by Bayesian estimation. The patient-tailored dosing regimen was developed 45
based on the final pharmacokinetic model, and showed that higher proportion of patients 46
reached the target Css,min compared to traditional mg/kg basis dose (60% versus 49%) 47
and reduced the risks associated with underdose or overdose. 48
Conclusion: This is the first population pharmacokinetic study of vancomycin in children 49
with malignant hematological disease. An optimized dosing regimen, taking into account 50
on February 1, 2019 by guest
http://aac.asm.org/
Dow
nloaded from

4
patient’s weight, creatinine clearance and susceptibility of the pathogens involved, could 51
routinely be used to individualize vancomycin therapy in this vulnerable population. 52
53
on February 1, 2019 by guest
http://aac.asm.org/
Dow
nloaded from

5
Introduction 54
Vancomycin is primarily effective against gram-positive cocci. Staphylococcus aureus 55
and Staphylococcus epidermidis, including both methicillin-susceptible (MSSA & MSSE) 56
or resistant-species (MRSA & MRSE), are usually sensitive to vancomycin. It is often 57
included in the initial empirical antibiotic therapy in patients with malignant 58
hematological disease (1). 59
Vancomycin is administered intravenously. It is 25-50% protein bound, mainly to 60
albumin and IgA, and is almost exclusively eliminated by the renal route. The 61
pharmacokinetic-pharmacodynamic breakpoint of vancomycin was defined as a ratio of 62
the area under the concentration-time curve in 24h (AUC0-24) over the minimum 63
inhibitory concentration (MIC) and is at least 400 h in adults with Staphylococcus aureus 64
pneumonia (2). 65
The pharmacokinetics of vancomycin has shown large inter-individual variability, 66
primarily linked to patients’ age, clinical condition and disease (3, 4). Patients in 67
oncology represent a critical population, in whom inadequate empirical antibacterial 68
therapy may result in infection-related morbidity and increased mortality. In addition, 69
pharmacokinetics often present different characteristics compared with non-oncology 70
patients (5-7), making optimization of dosing regimen essential. Vancomycin was 71
reported to have an increased clearance in adults with malignant hematological disease 72
compared with adults without cancer (8, 9). In children with cancer, pharmacokinetic 73
data are limited (10, 11) and the optimal dosing regimen remains undefined. Innovative 74
strategies, such as modeling and simulation approaches, were initiated to individualize 75
dose of vancomcyin in neonates and adults based on identified covariates (12). Thus, 76
on February 1, 2019 by guest
http://aac.asm.org/
Dow
nloaded from

6
the objectives of the present work were to evaluate the population pharmacokinetics of 77
vancomycin in children with malignant haematological disease and to optimize 78
vancomycin therapy based on defined pharmacokinetic-pharmacodynamic breakpoint. 79
80
Patients and Methods 81
Children with malignant hematological disease, receiving vancomycin as intravenous 82
infusion were included in the department of pediatric hematolo-oncology at Robert Debré 83
Hospital between 2010 and 2011 if at least one vancomycin serum concentration was 84
assayed for therapeutic drug monitoring (TDM). The following data, collected 85
prospectively by a trained research assistant, included: age, weight, serum creatinine 86
concentration, details of vancomycin administration (dose, infusion start and stop times), 87
type of hematological disease and bone marrow transplantation. Patients with incomplete 88
dosing information were excluded. This study was designed in accordance with legal 89
requirements and the Declaration of Helsinki, registered at the CNIL (Commission 90
Nationale Informatique et Liberté) and approved by the local research ethics committee 91
(CEERB Robert Debré Hospital, Paris France). 92
Dosing regimen and sampling 93
Vancomycin (Sandoz, Levallois-Perret, France) was administered as an intravenous 94
infusion over 60 min. The empirically initial dosing regimen is 40 to 60 mg/kg/day in 4 95
divided doses. Monitoring of vancomycin concentrations was performed in order to 96
maintain a steady-state trough concentration (Css,min) between 10 and 20 mg/L. 97
on February 1, 2019 by guest
http://aac.asm.org/
Dow
nloaded from

7
Assay of serum vancomycin and creatinine 98
The serum vancomycin concentrations were determined by a fluorescence polarization 99
immunoassay method (FPIA) using the Cobas Integra 400 plus system (Roche 100
Diagnostics, Meylan, France). The calibration curve ranged from 0.74 to 80 mg/L. The 101
accuracy and coefficients of variation (CVs) of controls (7.2, 21.4 and 35.6 mg/L) were 102
90%-110% and <3.9%, respectively. The lower limit of quantification (associated CV) 103
was 0.74 mg/L (CV<3.3%). Serum creatinine concentrations were measured by an 104
enzymatic method using the Advia 1800 chemistry system (Siemens Medical Solutions 105
Diagnostics, Puteaux, France). 106
Pharmacokinetic modeling 107
Pharmacokinetic analysis was carried out using the nonlinear mixed effects modelling 108
program NONMEM 7.2.0 (Icon Development Solutions, Ellicott City, MD, USA). First 109
order conditional estimation (FOCE) method with interaction option was used to 110
estimate the pharmacokinetic parameters and their variability. 111
Structure model 112
One or two-compartment open models with first order elimination were compared. The 113
basic model was evaluated through visual inspection of routine diagnostic plots. Inter-114
individual variability of the pharmacokinetic parameters was estimated using an 115
exponential model and was expressed as follows: 116
θ i= θ TV*eηi (equation 1) 117
on February 1, 2019 by guest
http://aac.asm.org/
Dow
nloaded from

8
where θ i represents the parameter value of the ith subject, θTV the typical value of the 118
parameter in the population and ηi the variability between subjects, which is assumed to 119
follow a normal distribution with a mean of zero and variance ω2. 120
Residual variability (additive, proportional, exponential or mixed) model was selected 121
according to improvement of the objective function value (OFV) and visual inspection of 122
routine diagnostic plots. 123
Covariate Analysis 124
The effects of age, weight, serum creatinine concentration, creatinine clearance and 125
type of hematological disease (leukemia or lymphoma) were investigated as potential 126
variables on pharmacokinetic parameters. The stepwise covariate modelling and 127
likelihood ratio test were used to test the effect of each variable. 128
The selection of covariates was based on a forward-backward process and biological 129
plausibility. During forward selection, a covariate was selected if a significant (p<0.05, χ2 130
distribution with one degree of freedom) decrease (reduction>3.84) in the OFV from the 131
basic model was obtained. At the end, all the significant covariates were added 132
simultaneously into a ‘full’ model. The importance of each covariate was re-assessed by 133
backward selection and independently removed from the full model if the increase in the 134
OFV was less than 7.88 (p<0.005, χ2 distribution). The resulting model was considered 135
the ‘final’ population pharmacokinetic model. 136
Model Validation 137
on February 1, 2019 by guest
http://aac.asm.org/
Dow
nloaded from

9
Model validation was based on graphical and statistical criteria. Goodness-of-fit plots, 138
including observed (DV) versus individual prediction (IPRED), DV versus population 139
prediction (PRED), conditional weighted residuals (CWRES) versus time and CWRES 140
versus PRED were used initially for diagnostic purposes (13). The stability and 141
performance of the final model were also assessed by means of a nonparametric 142
bootstrap with re-sampling and replacement. Re-sampling was repeated 500 times and 143
the values of estimated parameters from the bootstrap procedure were compared with 144
those estimated from the original data set. The entire procedure was performed in an 145
automated fashion, using PsN (14). The final model was also evaluated graphically and 146
statistically by visual predictive checks (VPC) and normalized prediction distribution 147
errors (NPDE) (15). One thousand datasets were simulated using the final population 148
model parameters. For the VPCs, the 5th, 50th and 95th percentile of the simulated 149
concentrations were processed by R, plotted against elapsed time and compared to 150
observed concentrations. For a model in which random effects are well estimated 151
approximately 90% of the observed data are expected to be within the 5th-95th prediction 152
interval. NPDE results were summarised graphically by default as provided by the 153
NPDE R package (v1.2) (16): (i) QQ-plot of the NPDE; (ii) histogram of the NPDE; 154
Given the objective of the analysis aiming to use of the final model for prediction 155
purposes, the predictive performance of developed model was further evaluated in an 156
independent group of children with malignant hematological disease. The individual 157
concentrations was predicted by Bayesian estimation (‘MAXEVAL = 0’ in the 158
ESTIMATION step) with NONMEM using the population pharmacokinetic parameters. 159
on February 1, 2019 by guest
http://aac.asm.org/
Dow
nloaded from

10
The predictive performance was evaluated by calculating the prediction error (PE) and 160
absolute prediction error (APE) using the following equations: 161
PE (%) = (Bayesian estimated concentration – measured concentration) / measured 162
concentration (equation 2) 163
APE (%) = ABS (Bayesian estimated concentration – measured concentration)/ 164
measured concentration (equation 3) 165
Dosing optimisation based on pharmacokinetic model 166
Monte Carlo simulations were performed using the parameter estimates obtained from 167
the final model in order to define optimal dosing regimen able to attain the target 168
AUC/MIC of 400 h in about 50% of patients, under the assumption of a comparable 169
safety profile. 170
Traditional pediatric dose (mg/kg basis) simulation approach 171
In this traditional approach, the paediatric dose of vancomycin was simulated on a 172
mg/kg basis according to different age group. Thus, various mg/kg dosing regimens (40, 173
50, 60, 70, 80, 90, 100 mg/kg) were simulated in each pediatric group: infants (28 days- 174
23 months), children (2-11 years) and adolescents (12-18 years). One thousand 175
simulations were performed using the original dataset, and AUC0-24 and Css,min at steady 176
state were calculated for each simulated patient. The target attainment rate was then 177
calculated for each dosing regimen to definite the optimal dose regimen in each 178
pediatric group. 179
Patient-tailored dose 180
on February 1, 2019 by guest
http://aac.asm.org/
Dow
nloaded from

11
Patient-tailored dose was assessed to evaluate the advantage of personalised therapy. 181
In this simulation scenario, the individual dose was calculated based on population 182
pharmacokinetic parameters and covariates in each patient as follow: 183
Optimized daily dosing i (mg/d) = target AUC0-24 × CLi (equation 4) 184
where CLi is calculated using the equation developed from the model; i stands for 185
individual. Target AUC0-24 was defined according to pharmacokinetic-pharmacodynamic 186
breakpoint of vancomycin: AUC0-24/MIC ≥400 h. For example, if the MIC was 1 mg/L, 187
the target AUC0-24 should be at least 400 mg•h/L. 188
The simulation process was similar to that described above for dose simulation on a 189
mg/kg basis. At the end, we compared the variability of AUC0-24 and Css,min between 190
mg/kg basis and patient-tailored dose. 191
192
Results 193
Serum concentrations of intravenous vancomycin infusion over 60 min were monitored 194
in 70 children (41 boys): mean (SD) age was 6.8 (4.8) (range 0.3 – 17.7) years and the 195
mean (SD) weight was 25.7 (15.5) (range 5.6 – 71.0) kg. A total of 98 vancomycin 196
concentrations were analyzed. A summary of patients’ demographic and clinical 197
characteristics is presented in table 1 198
Blood samples were drawn at the median of 54 hours after initiation of treatment. The 199
concentrations ranged from 1.8 to 27.3 mg/L. The number of patients in the 200
on February 1, 2019 by guest
http://aac.asm.org/
Dow
nloaded from

12
concentrations ranges (<5, 5-10, 10-15, >15 mg/L) were 12 (17%), 41 (59%), 11 (16%) 201
and 6 (9%), respectively. 202
Population pharmacokinetic Modelling 203
A total of 98 vancomycin concentrations were available for population modelling. Data 204
fitted a one-compartment model with first order elimination. Inter-individual variability 205
was best described by an exponential model and was then estimated for V and CL. 206
Residual variability was best described by a combined proportional and additive model. 207
The systematic covariate analysis identified bodyweight as the most important covariate 208
implemented on V, which caused a significant drop in the OFV of 35.5 points. For 209
clearance, bodyweight was also identified as significant covariate, causing a significant 210
drop in the OFV of 46.3 points. The model was further significantly improved by 211
introducing creatinine clearance (ΔOFV 26.3 points) on CL (Table 2). Therefore, the 212
influence of covariates on CL and V was retained in the model as follows: 213
CLi=CLref × (WTi / WTref) θ1× (CLCRi / CLCRref)
θ2 (equation 5) 214
Vi= Vref × (WTi / WTref) θ3 (equation 6) 215
where CLi and Vi are respectively the CL and V of the ith individual, WTi and CLCRi the 216
weight and creatinine clearance of the ith individual, WTref and CLCRref the reference 217
weight and creatinine clearance. The subscript “ref” indicates the individual with a 218
reference weight and creatinine clearance. In our study, the reference weight and 219
creatinine clearance were the median values of our population 20.2 kg and 191 mL/min. 220
The exponents were estimated by the model. 221
on February 1, 2019 by guest
http://aac.asm.org/
Dow
nloaded from

13
After incorporation of all significant covariates, inter-individual variability decreased from 222
61.6 to 34.8% for CL and from 117.9 to 77.0% for V. The shrinkage was 21% for CL and 223
23% for V. The final population pharmacokinetic parameters are given in table 3. 224
Model diagnostics showed acceptable goodness-of-fit criteria for the final model. As 225
shown in Figure 1A-D, population and individual predictions are acceptable. In addition, 226
the mean parameter estimates resulting from the bootstrap procedure very closely 227
agreed with the respective values from the final population model, indicating that the 228
final model is stable and can re-determine the estimates of population pharmacokinetic 229
parameters. The results of 500 bootstrap replicates are summarized in table 3. The 230
NPDE distribution and histogram indicates that the assumption of normal distribution of 231
the differences between individual predictions and observed data is acceptable (p=0.45 232
Shapiro-Wilk test of normality, Figure 1E-F). No trends were observed on the diagnostic 233
plots of NPDE versus time or predicted concentrations. The VPC (Figure 1G) shows 234
that observed concentrations were well predicted by the model (Exact Binomial Test, 235
11.2% out of limits observed, 95% confidence interval [5.7% – 19.2%]). Box plots of the 236
distributions of observed and predicted C0 from 1000 simulations derived from the final 237
model are presented are presented in Figure 1H. The median values of Css,min from the 238
observed data and the simulation as well as the interquartile range were similar, 239
indicating acceptable predictive capability of the final model. Figure 2 shows the 240
relationship between individual vancomycin clearance and covariates (body weight and 241
creatinine clearance). The typical CLs of patients weighting 20, 40 and 60 kg were 4.3, 242
6.9 and 9.1 L/h, respectively. 243
on February 1, 2019 by guest
http://aac.asm.org/
Dow
nloaded from

14
The performance of the developed model was further evaluated in an independent 244
group of 20 children with malignant hematological disease, with a mean (SD) age of 8.1 245
(4.1) (range 2.4 – 17.2) years, a mean (SD) weight of 28.8 (11.6) (range 13.9 – 62.0) kg 246
and a mean (SD) clearance creatinine of 191.3 (61.2) (range 84.0 – 350.7, Schwartz 247
formula) mL/min. 25 concentrations consisting of peak, trough and scavenged samples 248
were available and ranged from 4.1 to 67.2 mg/L. The Bayesian estimated 249
concentrations were highly correlated with measured concentrations (r2= 0.99). The 250
mean PE and APE were 1.0 % (5th-95th percentile: -4.7% – 8.7%) and 4.7%, 251
respectively, indicating a good predictive performance of developed model on new 252
patients. The estimates of population pharmacokinetic parameters did not change 253
obviously after inclusion of validation dataset into the model. 254
Dosing optimisation based on pharmacokinetic model 255
Traditional paediatric dose (mg/kg basis) 256
The target attainment rates as a function of dose and age groups for a standard MIC 257
susceptibility breakpoint of 1 mg/L is shown in Figure 3. The current recommended 258
dose of 60 mg/kg/day results in only 15% of infants and 24% of children and 259
adolescents achieving the target AUC/MIC. These simulated values were in agreement 260
with the observed values in the present study. In fact, 76% of our patients had risk of 261
underdose (Css,min <10 mg/L). To reach the target AUC/MIC of 400 h in about 50% of 262
patients, 90 mg/kg/day was required for infants and 80 mg/kg/day for children and 263
adolescents (Figure 3). The proportion of patients with risks of overdose (Css,min >20 264
mg/L) are 26% for the new proposed dosing regimen (Figure 3). 265
on February 1, 2019 by guest
http://aac.asm.org/
Dow
nloaded from
15
Patient-tailored dose 266
Patient-tailored dose was calculated for each patient based on equations 4 and 7: 267
CL= 4.37 × (Bodyweight / 20.2) 0.677 × (Creatinine clearance / 191) 1.03 (equation 7) 268
Where bodyweight is in kg and creatinine clearance is in mL/min (Schwartz formula). 269
The expected AUC0-24 and Css,min at steady state in simulated trials for infants receiving 270
90 mg/kg/day, and children and adolescents receiving 80 mg/kg/day in comparison to 271
patient-tailored dose are shown in Figure 4. The proportion of patients achieving target 272
Css,min (10-20 mg/L) is 60% using patient-tailored dose, which is higher than traditional 273
mg/kg basis dose (49%). The proportion of patients with risks of underdose (Css,min <10 274
mg/L) or overdose (Css,min >20 mg/L) are 20% and 20%, respectively, using patient-275
tailored dose, which is lower than traditional mg/kg basis dose (24% underdose and 276
26% overdose). 277
278
279
Discussion 280
In the present study, the population pharmacokinetics of vancomycin was evaluated for 281
the first time in children with malignant hematological disease. The high variability of 282
vancomycin concentrations emphasizes the need for dosing optimization and TDM-283
based dosage adaptation in this high-risk population. 284
The population pharmacokinetic model offered a practical tool to optimize vancomycin 285
dosing in children with malignant hematological disease. The rational dosing of 286
on February 1, 2019 by guest
http://aac.asm.org/
Dow
nloaded from

16
antimicrobials should take into account pharmacokinetics in the target population, the 287
relationship between drug exposure and outcome, and the susceptibility of the 288
pathogens involved. In children, the standard dose evaluation studies of antimicrobials 289
are usually based on a “non-selected” pediatric population and do not take into account 290
the potential impact of the disease and disease state which are the main factors that 291
ultimately influence drug exposure in the clinical setting (17). For the purposes of 292
comparison, the demographics and pharmacokinetic parameters of vancomycin 293
obtained from different pediatric studies (10, 18, 19) are summarized in table 4. The 294
magnitude of the differences provides strong argument for studying pharmacokinetics in 295
selected sub-groups of patients. Indeed, the estimated vancomycin CL in children with 296
malignant hematological disease was higher than that reported in general non-selected 297
pediatric populations. Such impact of hematological malignancies was previously 298
reported with vancomycin (8, 9) and additional antimicrobials in adult patients (5-7). 299
According to regulatory guidelines (20, 21), vancomycin is a good example of a drug for 300
which the modelling and simulation approach can be used to establish optimal dosage 301
recommendations in children. The pharmacokinetic-pharmacodynamic breakpoint of 302
vancomycin was defined as an AUC0-24/MIC ratio of at least 400 h in adults with 303
Staphylococcus aureus pneumonia (2), in which 76% (n=28) of methicillin-resistant 304
Staphylococcus aureus infected patients have a MIC of 0.5 mg/L, 24% (n=9) have a 305
MIC of 1mg/L. The pharmacokinetic-pharmacodynamic breakpoint is postulated to be 306
similar in children and is therefore used for dosing optimisation in children. 307
The current recommended pediatric dose of vancomycin 40-60 mg/kg/day (i.e. on a 308
classical mg/kg basis dose) and resulted in high risk of underdose in our target 309
on February 1, 2019 by guest
http://aac.asm.org/
Dow
nloaded from

17
population, as 76% patients had Css,min <10 mg/L. The dose simulation was in 310
agreement with this observation, and showed that the dose of 60 mg/kg/day resulted in 311
15% of infants and 24% of children and adolescents achieving the target AUC/MIC. 312
Therefore, in order to increase likelihood of treatment, vancomycin dose needs to be 313
increased in children with malignant haematological disease. In the present study, the 314
simulation approach demonstrated that the doses of 90 mg/kg/day for infants, and 80 315
mg/kg for children and adolescents, allow near to 50% patients to achieve the AUC/MIC 316
target, with the standard MIC susceptibility breakpoint of 1 mg/L, clinically validated 317
primarily in adult pneumonia studies in MRSA. However, according to recent data, there 318
is a trend to a decrease of vancomycin efficacy, linked to the increase of vancomycin 319
MIC during MRSA infection(22, 23). Indeed, to obtain similar efficacy, treatment of 320
MSRA with a higher MIC would require a higher AUC. Increase in vancomycin CL 321
together with creep in MIC values will require an increase of vancomycin daily dosage 322
to overcome the risk of therapeutic failure. However, up to now, the pharmacokinetic 323
parameters and safety of increased vancomycin dosing are not available. The dosing 324
simulation was based on the assumption of liner pharmacokinetics. Extrapolation of 325
dosing regimen outside of the observed range cannot preclude the possibility of non-326
liner pharmacokinetics and should be evaluated in further study. In addition, when 327
administering increased vancomycin dosing, the infusion-related adverse events (i.e. 328
red man syndrome) need to be evaluated and slowing the rate of infusion to at least 329
over two hours should be recommended. 330
One of the main advantages of modelling and simulation approaches is to optimize 331
personalized therapy. Therefore, in the second simulation scenario, we evaluated the 332
on February 1, 2019 by guest
http://aac.asm.org/
Dow
nloaded from

18
patient-tailored dose. Traditionally, pediatric dose is defined on a mg/kg basis according 333
to the different age groups, as we have done in the first simulation scenario. This 334
approach assumes an “average child” with an “average weight in each age group 335
(neonates, infants, children and adolescent) and a standard mg/kg dose is calculated 336
accordingly. However, both developmental factors and clinical conditions have a 337
profound impact on pharmacokinetics. Many demographic, biological and clinical 338
covariates are known to influence vancomycin pharmacokinetics. In our data, 339
vancomycin clearance increased with body weight and creatinine clearance, showing 340
that in children, the standard weight-based dosing (mg/kg) is not adapted to the whole 341
range of pediatric ages. This could be explained by the non-linear correlation between 342
bodyweight and developmental changes in vancomycin clearance (24). Furthermore, 343
the individual dose needs optimization according to abnormal renal function. Therefore, 344
weight and renal function have the most important impact in vancomycin 345
pharmacokinetics in children (3) providing the scientific basis for rational patient-tailored 346
dosing schemes. The simulation clearly supports the use of patient-tailored dose, which 347
showed a narrow spread AUC and Css,min compared with traditional mg/kg basis dose. 348
Patient-tailored dose resulted in higher proportion of patients within the target trough 349
concentrations, associate with lower risk of underdose or overdose. Individual dosage 350
prescription and adjustment based on these covariates will require a computer-based 351
tool. This practice has been set up in our NICU to individualize vancomycin dose in 352
neonates (25) and undoubtedly will be implemented for the treatment of pediatric 353
patients with “selected diseases”. 354
on February 1, 2019 by guest
http://aac.asm.org/
Dow
nloaded from

19
A limitation of our study was that the population pharmacokinetic model was developed 355
based on vancomycin TDM data, the prediction of maximum concentration at steady-356
state will likely shrink towards population mean values, reducing the ability to identify 357
“special” patient. Taking scavenged pharmacokinetic sample should improve individual 358
parameter estimation without increasing burden of pediatric clinical practice. 359
360
Conclusion 361
In the present study, we developed a population pharmacokinetic model of vancomycin 362
in children with malignant hematological disease. Vancomycin clearance was markedly 363
higher than that in children without cancer, with weight and creatinine clearance being 364
significant covariates. We have shown that the patient-tailored dose reduced variability 365
in vancomycin AUC and Css,min compared to the mg/kg basis dose, making the modeling 366
approach an important tool for dosing individualization. Explaining residual variability 367
requires the identification of additional covariates. A prospective study is warranted to 368
evaluate the potential clinical benefits and safety of this optimized dosing regimen. 369
370
371
Acknowledgments 372
We acknowledge the technicians (Christel Grondin, Michel Popon, Samira Benakouche 373
and Yves Médard) for technical support. This work was supported by Global Research 374
in Paediatrics – Network of Excellence (GRIP, EU-funded FP7 project, Grant 375
on February 1, 2019 by guest
http://aac.asm.org/
Dow
nloaded from

20
Agreement number 261060). The authors declare no conflict of interest related to this 376
work. 377
378
on February 1, 2019 by guest
http://aac.asm.org/
Dow
nloaded from

21
References: 379
1. Hughes WT, Armstrong D, Bodey GP, Bow EJ, Brown AE, Calandra T, Feld R, 380
Pizzo PA, Rolston KV, Shenep JL, Young LS. 2002. 2002 guidelines for the use of 381
antimicrobial agents in neutropenic patients with cancer. Clin. Infect. Dis. 34:730-751. 382
2. Moise-Broder PA, Forrest A, Birmingham MC, Schentag JJ. 2004. 383
Pharmacodynamics of vancomycin and other antimicrobials in patients with 384
staphylococcus aureus lower respiratory tract infections. Clin. Pharmacokinet. 43:925-385
942. 386
3. Marsot A, Boulamery A, Bruguerolle B, Simon N. 2012. Vancomycin: a review of 387
population pharmacokinetic analyses. Clin. Pharmacokinet. 51:1-13. 388
4. Zhao W, Kaguelidou F, Biran V, Zhang D, Allegaert K, Capparelli E, Holford N, 389
Kimura T, Lo YL, Peris JE, Thomson A, van den Anker JN, Fakhoury M, Jacqz-390
Aigrain E. 2013. External evaluation of population pharmacokinetic models of 391
vancomycin in neonates: The transferability of published models to different clinical 392
settings. Br. J. Clin. Pharmacol. 75:1068-1080. 393
5. Bubalo JS, Munar MY, Cherala G, Hayes-Lattin B, Maziarz R. 2009. Daptomycin 394
pharmacokinetics in adult oncology patients with neutropenic fever. Antimicrob. Agents. 395
Chemother. 53:428-434. 396
6. Romano S, Fdez de Gatta MM, Calvo MV, Caballero D, Dominguez-Gil A, Lanao 397
JM. 1999. Population pharmacokinetics of amikacin in patients with haematological 398
malignancies. J. Antimicrob. Chemother. 44:235-242. 399
7. Zeitany RG, El Saghir NS, Santhosh-Kumar CR, Sigmon MA. 1990. Increased 400
aminoglycoside dosage requirements in hematologic malignancy. Antimicrob. Agents. 401
Chemother. 34:702-708. 402
on February 1, 2019 by guest
http://aac.asm.org/
Dow
nloaded from

22
8. Buelga DS, del Mar Fernandez de Gatta M, Herrera EV, Dominguez-Gil A, García 403
MJ. 2005. Population pharmacokinetic analysis of vancomycin in patients with 404
hematological malignancies. Antimicrob. Agents. Chemother. 49:4934-4941. 405
9. Fernández de Gatta Mdel M, Santos Buelga D, Sánchez Navarro A, Dominguez-406
Gil A, García MJ. 2009. Vancomycin dosage optimization in patients with malignant 407
haematological disease by pharmacokinetic/pharmacodynamics analysis. Clin. 408
Pharmacokinet. 48:273-280. 409
10. Chang D. 1995. Influence of malignancy on the pharmacokinetics of vancomycin in 410
infants and children. Pediatr. Infect. Dis. J. 14:667–673. 411
11. Piro CC, Crossno CL, Collier A, Ho R, Koyama T, Frangoul H. 2009. Initial 412
vancomycin dosing in pediatric oncology and stem cell transplant patients. J. Pediatr. 413
Hematol. Oncol. 31:3-7. 414
12. Jacqz-Aigrain E, Zhao W, Sharland M, van den Anker JN. 2013. Use of 415
antibacterial agents in the neonate: 50 years of experience with vancomycin 416
administration. Semin. Fetal. Neonatal. Med. 18:28-34. 417
13. Hooker AC, Staatz CE, Karlsson MO. 2007. Conditional weighted residuals 418
(CWRES): a model diagnostic for the FOCE method. Pharm. Res. 24:2187-2197. 419
14. Lindbom L, Ribbing J, Jonsson EN. 2004. Perl-speaks-NONMEM (PsN)--a Perl 420
module for NONMEM related programming. Comput. Methods. Programs. Biomed. 421
75:85-94. 422
15. Brendel K, Comets E, Laffont C, Laveille C, Mentré F. 2006. Metrics for external 423
model evaluation with an application to the population pharmacokinetics of gliclazide. 424
Pharm. Res. 23:2036-2049. 425
on February 1, 2019 by guest
http://aac.asm.org/
Dow
nloaded from

23
16. Comets E, Brendel K, Mentré F. 2008. Computing normalised prediction 426
distribution errors to evaluate nonlinear mixed-effect models: the npde add-on package 427
for R. Comput. Methods. Programs. Biomed. 90:154-166. 428
17. Zhao W, Fakhoury M, Fila M, Baudouin V, Deschênes G, Jacqz-Aigrain E. 2012. 429
Individualization of valganciclovir prophylaxis for cytomegalovirus infection in pediatric 430
kidney transplant patients. Ther. Drug. Monit. 34:326-330. 431
18. Lamarre P, Lebel D, Ducharme MP. 2000. A population pharmacokinetic model for 432
vancomycin in pediatric patients and its predictive value in a naive population. 433
Antimicrob. Agents. Chemother. 44:278–282. 434
19. Wrishko RE, Levine M, Khoo D, Abbott P, Hamilton D. 2000. Vancomycin 435
pharmacokinetics and Bayesian estimation in pediatric patients. Ther. Drug. Monit. 436
22:522-531. 437
20. EMA. Points to consider on Pharmacokinetics and Pharmacodynamics in the 438
development of antibacterial medicinal products (Doc. Ref. CPMP/EWP/2655/99). 439
Available at http://www.ema.europa.eu/docs/en_GB 440
/document_library/Scientificguideline/2009 /09/WC500003420.pdf 441
21. FDA. Guidance for Industry: Exposure-Response Relationships — Study Design, 442
Data Analysis, and Regulatory Applications. Available at 443
http://www.fda.gov/downloads/Drugs/GuidanceComplianceRegulatoryInformation/Guida444
nces/ucm072109.pdf 445
22. Ho PL, Lo PY, Chow KH, Lau EH, Lai EL, Cheng VC, Kao RY. 2010. Vancomycin 446
MIC creep in MRSA isolates from 1997 to 2008 in a healthcare region in Hong Kong. J. 447
Infect. 60:140-145. 448
on February 1, 2019 by guest
http://aac.asm.org/
Dow
nloaded from

24
23. Steinkraus G, White R, Fredrich L. 2007. Vancomycin MIC creep in non-449
vancomycin-intermediate Staphylococcus aureus (VISA), vancomycin-susceptible 450
clinical methicillin-resistant S. aureus (MRSA) blood isolates from 2001-2005. J. 451
Antimicrob. Chemo. 60:788-794. 452
24. Anderson BJ, Allegaert K, Van den Anker JN, Cossey V, Holford NH. 2007. 453
Vancomycin pharmacokinetics in preterm neonates and the prediction of adult 454
clearance. Br. J. Clin. Pharmacol. 63:75-84. 455
25. Zhao W, Lopez E, Biran V, Durrmeyer X, Fakhoury M, Jacqz-Aigrain E. 2013. 456
Vancomycin continuous infusion in neonates: therapeutic drug monitoring and dosing 457
optimization. Arch. Dis. Child. 98:449-53. 458
on February 1, 2019 by guest
http://aac.asm.org/
Dow
nloaded from
25
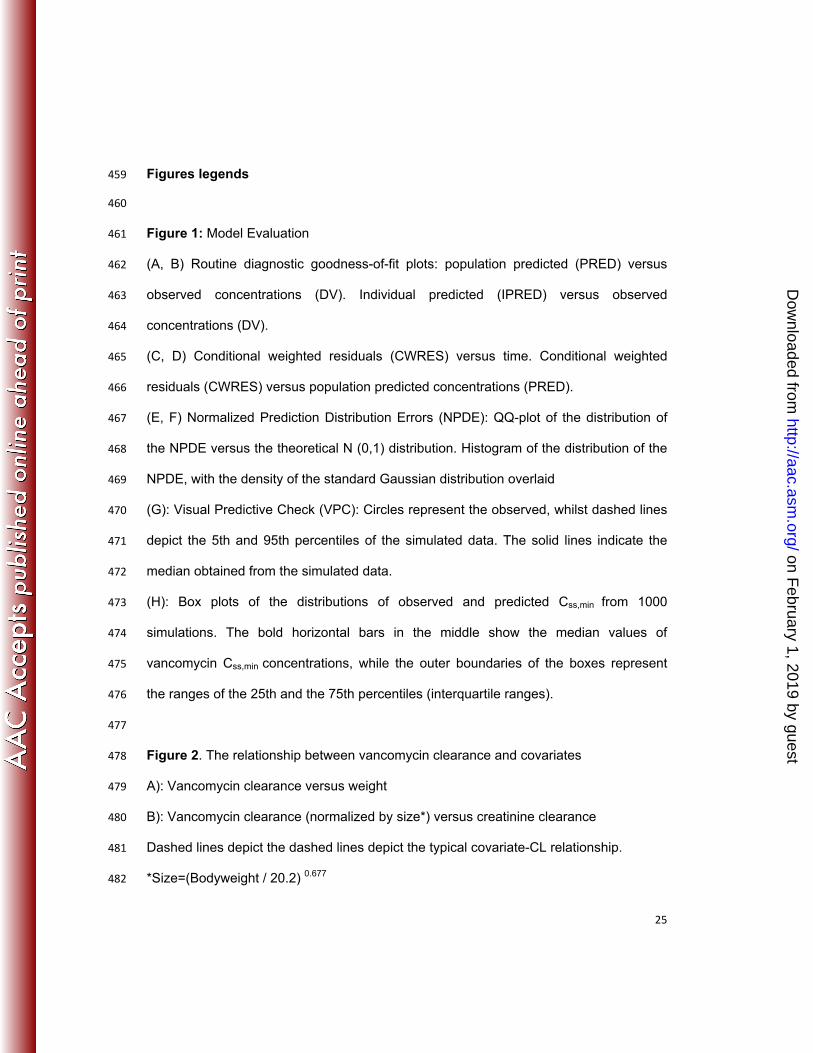
Figures legends 459
460
Figure 1: Model Evaluation 461
(A, B) Routine diagnostic goodness-of-fit plots: population predicted (PRED) versus 462
observed concentrations (DV). Individual predicted (IPRED) versus observed 463
concentrations (DV). 464
(C, D) Conditional weighted residuals (CWRES) versus time. Conditional weighted 465
residuals (CWRES) versus population predicted concentrations (PRED). 466
(E, F) Normalized Prediction Distribution Errors (NPDE): QQ-plot of the distribution of 467
the NPDE versus the theoretical N (0,1) distribution. Histogram of the distribution of the 468
NPDE, with the density of the standard Gaussian distribution overlaid 469
(G): Visual Predictive Check (VPC): Circles represent the observed, whilst dashed lines 470
depict the 5th and 95th percentiles of the simulated data. The solid lines indicate the 471
median obtained from the simulated data. 472
(H): Box plots of the distributions of observed and predicted Css,min from 1000 473
simulations. The bold horizontal bars in the middle show the median values of 474
vancomycin Css,min concentrations, while the outer boundaries of the boxes represent 475
the ranges of the 25th and the 75th percentiles (interquartile ranges). 476
477
Figure 2. The relationship between vancomycin clearance and covariates 478
A): Vancomycin clearance versus weight 479
B): Vancomycin clearance (normalized by size*) versus creatinine clearance 480
Dashed lines depict the dashed lines depict the typical covariate-CL relationship. 481
*Size=(Bodyweight / 20.2) 0.677 482
on February 1, 2019 by guest
http://aac.asm.org/
Dow
nloaded from

26
483
Figure 3. Target attainment rates and fraction of patients above maximum 484
recommended Css,min 485
486
The target attainment rates and fraction of patients above the maximum recommended 487
C0 for the 100 simulated trials is presented as a function of dose and age group. 488
AUC/MIC target is 400 h. MIC is 1 mg/L. The maximum recommended Css,min is 20 489
mg/L. 490
491
Figure 4. AUC and Css,min distribution. Simulated vancomycin AUC and Css,min 492
distribution in infants, and children and adolescents receiving mg/kg basis dose and 493
patient-tailored dose. 494
on February 1, 2019 by guest
http://aac.asm.org/
Dow
nloaded from

(A, B) Routine diagnostic goodness-of-fit plots: population predicted (PRED) versusobserved concentrations (DV). Individual predicted (IPRED) versus DV(C, D) Conditional weighted residuals (CWRES) versus time. CWRES versus PRED.(E F) Normalized Prediction Distribution Errors (NPDE): QQ-plot of the distribution of
Figure 1: Model Evaluation
(E, F) Normalized Prediction Distribution Errors (NPDE): QQ plot of the distribution ofthe NPDE versus the theoretical N (0,1) distribution. Histogram of the distribution ofthe NPDE, with the density of the standard Gaussian distribution overlaid(G): Visual Predictive Check (VPC): Circles represent the observed, whilst dashedlines depict the 5th and 95th percentiles of the simulated data. The solid lines indicatethe median obtained from the simulated data.(H): Box plots of the distributions of observed and predicted Css,min from 1000simulations. The bold horizontal bars in the middle show the median values ofvancomycin Css,min concentrations, while the outer boundaries of the boxes representthe ranges of the 25th and the 75th percentiles (interquartile ranges).
on February 1, 2019 by guest
http://aac.asm.org/
Dow
nloaded from

Figure 2. The relationship betweenvancomycin clearance and covariatesvancomycin clearance and covariatesA): Vancomycin clearance versus weightB): Vancomycin clearance (normalized by size*)versus creatinine clearance
Dashed lines depict the dashed lines depict thet i l i t CL l ti hitypical covariate-CL relationship.Size=(Bodyweight / 20.2) 0.677
on February 1, 2019 by guest
http://aac.asm.org/
Dow
nloaded from

Figure 3. Target attainment rates and fraction of patients above maximum recommended Css,min
The target attainment rates and fraction of patients above the maximum recommended Css,min for the 100 simulated trials is presented as a function of dose andsimulated trials is presented as a function of dose and age group. AUC/MIC target is 400 h. MIC is 1 mg/L. The maximum recommended Css,min is 20 mg/L.
on February 1, 2019 by guest
http://aac.asm.org/
Dow
nloaded from

Figure 4. AUC and Css,min distribution. Simulated vancomycin AUC and Css min distribution in infants, and children and adolescents ss,minreceiving mg/kg basis dose and patient-tailored dose.
on February 1, 2019 by guest
http://aac.asm.org/
Dow
nloaded from

1
Table 1: Baseline characteristics of 70 children 1
Number Mean SD Median Range
Patients 70
Gender 29 F/41 M
Bone Marrow Transplantation 25
Samples 98
Vancomycin dose (mg) 327 203 250 50 –950
Vancomycin dose (mg/kg) 13.0 3.4 13.6 7.0 – 31.5
Vancomycin concentration (mg/L) 9.4 5.3 8.1 1.8 – 27.3
Weight (kg) 25.7 15.5 20.2 5.6 – 71.0
Age (years) 6.8 4.8 5.6 0.3 – 17.7
Serum Creatinine (µmol/L) 32 17 30 10 – 141
Creatinine Clearance (mL/min)# 199.8 63.3 191.0 48.7- 457.0
Hematology disease
Acute Lymphoblastic Leukemia 40
Acute Myeloblastic Leukemia 17
Juvenile Myelomonocytic Leukemia 5
Lymphoma 5
Other 3
2
# Creatinine clearance was calculated by Schwartz formula. 3
4
on February 1, 2019 by guest
http://aac.asm.org/
Dow
nloaded from

2
Table 2: Covariate analysis 5
PK parameters
OFV ΔOFV
Structure model 398.6
Body weight CL 352.3 -46.3
Age CL 368.8 -29.8
Creatinine clearance CL 377.2 -21.4
Serum creatinine CL 397.0 -1.6
Type of hematological disease (leukemia or lymphoma)
CL 396.6 -2.0
Body weight, age and creatinine clearance
CL 323.6 -75.0
Age and creatinine clearance CL 351.3 -47.3
Body weight and creatinine clearance
CL 326.0 -72.6
Body weight V 363.2 -35.5
Age V 364.4 -34.2
Body weight and age V 357.9 -40.7
Allometric model (Body weight on CL and V with allometric scaling, and creatinine clearance on CL)
314.4 -84.2
Final model (Body weight on CL and V, and creatinine clearance on CL)
312.8 -85.8
6
on February 1, 2019 by guest
http://aac.asm.org/
Dow
nloaded from

3
Table 3: population pharmacokinetic parameters of vancomycin and bootstrap results 7
(n=500) 8
RF is the renal function; CLcr is creatinine clearance (mL/min), which was calculated by Schwartz 9
formula. 10
PK
parameters RSE(%) Bootstrap
Median 2.5th 97.5th
Volume of distribution (L) V
V=θ1×(Bodyweight / 20.2) θ2
θ1 119 13.4 116 81 157
θ2 0.838 25.1 0.803 0.401 1.32
Clearance (L/h) CL
CL=θ3×(Bodyweight / 20.2) θ4×RF
θ3 4.37 4.8 4.33 4.01 4.76
θ4 0.677 12.2 0.668 0.505 0.878
RF= (CLcr / 191) θ5
θ5 1.03 21.2 1.03 0.585 1.55
Inter-individual variability (%)
V 77.0 35.9 69.3 43.4 96.2
CL 34.8 22.9 32.7 22.2 39.8
Residual variability
Proportional (%) 5.3 79.2 6.0 2.0 16.0
Additive (mg/L) 1.17 26.6 1.15 0.68 1.54
on February 1, 2019 by guest
http://aac.asm.org/
Dow
nloaded from

4
Table 4. Pharmacokinetics of vancomycin in children 11
12
Pediatric patients
with vancomycin
TDM (ref 18)
Pediatric patients
with vancomycin
TDM (ref 19)
Children with
cancer (ref 10)
Pediatric patients
with vancomycin
TDM (ref 10)
Children with malignant
hematologic disease
(the present study)
Number of patients 78 6 33 31 70
Age (years) 7 # 6.9 6.8 (0.3-17.7)
Weight 25 # 21.2 25.7 (5.6-71.0)
CL (L/h/kg) 0.103 0.11 (0.08-0.14) 0.149 0.114 0.22 (0.04-0.73)
13
Values are expressed as mean (range) 14
on February 1, 2019 by guest
http://aac.asm.org/
Dow
nloaded from