General Issues & Reporting Guidance Emissions Inventory Workshop 2014 1.

UNCLASSIFIED
Pollution inventory reporting - general guidance notes
Environmental Permitting (England and Wales) Regulations 2010
Regulation 60(1)
LIT 7665 - 1200_10
Version 5 December 2012

UNCLASSIFIED
UNCLASSIFIED 2 of 22
We are the Environment Agency. We protect and improve the environment and make it a better place for people and wildlife. We operate at the place where environmental change has its greatest impact on people’s lives. We reduce the risks to people and properties from flooding; make sure there is enough water for people and wildlife; protect and improve air, land and water quality and apply the environmental standards within which industry can operate. Acting to reduce climate change and helping people and wildlife adapt to its consequences are at the heart of all that we do. We cannot do this alone. We work closely with a wide range of partners including government, business, local authorities, other agencies, civil society groups and the communities we serve. Published by:
Environment Agency Horizon house, Deanery Road, Bristol BS1 5AH Email: [email protected] www.environment-agency.gov.uk
© Environment Agency 2011
All rights reserved. This document may be reproduced with prior permission of the Environment Agency.
Further copies of this report are available from our publications catalogue: http://publications.environment-agency.gov.uk or our National Customer Contact Centre: T: 03708 506506
Email: [email protected].

UNCLASSIFIED
UNCLASSIFIED 3 of 22
Contents Pollution inventory reporting - general guidance notes ............................................................ 1
Contents ........................................................................................................................................ 3
1. Introduction ...................................................................................................................... 4
2. Who is this guidance for? ................................................................................................. 4
3. How to report .................................................................................................................... 4
4. Guidance for specific sectors ............................................................................................ 5
5. Low impact installations .................................................................................................... 5
6. Completing the PI form ..................................................................................................... 5
6.1. Part 1 - About you and your site ................................................................................. 5 6.1.1. Question 1.2 - Authorisation, licence or permit number ....................................... 5 6.1.2. Question 1.5 – NACE and NOSE-P codes .......................................................... 5 6.1.3. Question 1.6 ........................................................................................................ 6
6.2. Completing parts 2 to 5 – Releases and transfers ...................................................... 6 6.2.1. Part 2 - releases to air ......................................................................................... 7 6.2.2. Part 3 - releases to land....................................................................................... 7 6.2.3. Part 4 - releases to controlled waters: .................................................................. 7 6.2.4. Part 5 - off-site transfers in wastewater: ............................................................... 8 6.2.5. Reporting conventions - help to complete the table ............................................. 8 6.2.6. Reporting substances – general principles: ....................................................... 10
6.3. Completing parts 6 and 7 – Waste transfers ............................................................ 10 6.3.1. Part 6 - Within country waste transfers .............................................................. 10 6.3.2. Part 7 - Overseas waste transfers ..................................................................... 11
6.4. Completing Part 8 – Resource efficiency ................................................................. 11 7. Further guidance ............................................................................................................ 11
7.1. Guidance on monitoring techniques ......................................................................... 11 7.2. Sources of information for emission factors and release determination .................... 12
7.2.1. Releases to air (in priority order for UK use) ...................................................... 12 7.2.2. Releases to water .............................................................................................. 12 7.2.3. Other sources of information ............................................................................. 13
7.3. Additional PI Guidance............................................................................................. 13 Annex 1: Additional technical guidance for certain industrial sites ........................................................................... 14 1. Quantification of emissions to air .......................................................................................................................... 14
1.1 Sampling data ........................................................................................................... 14 1.2 Continuous emission monitoring systems (CEMS) data ............................................ 15 1.3 Emission factors........................................................................................................ 16 1.4 Carbon dioxide factors .............................................................................................. 17 1.5 Reporting basis ......................................................................................................... 19
2. Quantification of emissions to water ..................................................................................................................... 19 3. Substances 'reported as’ ...................................................................................................................................... 20 4. Conversion factors ................................................................................................................................................ 21
4.1 Converting air emissions - ppm to mg/m3 and vice versa .......................................... 21 4.2 Converting emissions to water .................................................................................. 21

UNCLASSIFIED
UNCLASSIFIED 4 of 22
1. Introduction
The Pollution Inventory (PI) provides information about the releases and transfers of substances from the industrial activities we regulate.
This helps:
• provide the public with easy access to environmental information from industrial activities in their locality
• protect the environment by providing information to assist us in developing regulation • government to meet its national and international environmental reporting commitments, such
as the European Pollutant Release and Transfer Register
Each relevant industrial activity must report annually the quantities of specified substances released to air, land and controlled waters and in transfers off-site in wastewater. We also require details of the quantity, type and fate of wastes transferred off-site. Most industrial sectors also have to report data on resource efficiency.
2. Who is this guidance for? This guidance is for operators who have received an EPR Regulation 60 notice or a Direction from the Secretary of State to report discharges from sewage treatment works. It provides information to help you to make an accurate return and outlines some general principles.
You can find more detailed advice in the sector guidance notes and Annex 1 to this document includes additional information on quantifying emissions. You will need to refer to the PI reporting codes document which contains a comprehensive list of all codes used.
3. How to report Try to make your PI return online using the electronic data capture system on our website. You can access this via http://www.environment-agency.gov.uk/pi If you have any problems using or gaining access to this system, please contact us on 03708 506 506 for help and advice. If you cannot use the electronic system, please use the Adobe Acrobat reporting form. You can print this and use it as a standard paper form or you can fill it in on your computer and save it along with your data.
You will need to report every year, by the 28 February, on discharges for the previous year. The Regulation 60 Notice remains effective until replaced or the permit ceases.
You need to use the best data and techniques available to you, including any samples analysed and monitoring data. We do not require you to do additional monitoring and this guidance will help you to quantify releases where you do not have site-specific data available.
If you need help filling in the form, please call our general enquiries number or you can speak to your local Environment Agency contact.
General enquiries: 03708 506 506 (Monday to Friday 8am to 6pm)
Minicom: 08702 422 549 (Monday to Friday 8am to 6pm)
Email: [email protected]

UNCLASSIFIED
UNCLASSIFIED 5 of 22
4. Guidance for specific sectors You can find specific guidance for the following sectors on the PI website:
• combustion • refineries • cement and lime • incineration • paper and pulp • landfill • hazardous waste transfer stations • chemical treatment of waste, including waste oil • food & drink • intensive agriculture • mines and quarries
5. Low impact installations If you hold a permit for a low impact installation we would not normally expect you to have any emissions above the reporting thresholds. If a notifiable incident occurs you need to report the emissions for that year, as shown in section 6.2.5 of this guidance.
6. Completing the PI form 6.1. Part 1 - About you and your site
You must answer questions 1.1 – 1.6 as a minimum. Answering questions 1.7 to 1.9 is optional.
6.1.1. Question 1.2 - Authorisation, licence or permit number
Please respond according to your current regulatory regime as follows:
• use the original permit number (in the format AB1234XY) if you are a permitted site • use the Pollution Inventory reference number if you are not a permitted site
If you're uncertain, please contact us.
6.1.2. Question 1.5 – NACE and NOSE-P codes
Please select the correct 4-figure NACE code and the 5-figure NOSE-P code from the PI reporting codes document. This is available on our website.

UNCLASSIFIED
UNCLASSIFIED 6 of 22
6.1.3. Question 1.6
Add in the E-PRTR code for your main activity. These are available in table 3 of the PI reporting codes document. If appropriate, you can include additional codes for other activities that you carry out.
6.2. Completing parts 2 to 5 – Releases and transfers
Parts 2 to 5 require you to report annual mass releases of specified substances to air, land and controlled waters, and off-site transfers in wastewater from the 'reporting unit' specified in Part 1.
The PI reporting process for emissions to air and water follows four basic steps:
Step 1 - identification of relevant pollutants
Step 2 - identification of emission sources
Step 3 - quantification of emissions
Step 4 - completing the PI return
These steps are shown in the following flowchart. The process is described in more detail in the Annex to this note.
You should use an appropriate release estimation technique (RET) to quantify your emissions.
There are four types of RET:
• sampling or direct monitoring; • emission factors; • fuel analysis or other engineering calculations; and • mass balance.
Depending on the particular site, pollutant or process, any of the above techniques may be the most appropriate. You should have an understanding of the factors that lead to the selection of the most appropriate RET and be able to justify why the technique has been selected. You should always select the RET based on the application for which it has been designed.

UNCLASSIFIED
UNCLASSIFIED 7 of 22
Some mandatory RETs exist, such as when reporting emissions under EU Directives or in accordance with permit conditions. An example is the reporting requirement under the European Emissions Trading Scheme (2003/87/EC) for greenhouse gases.
In the absence of mandatory or industry methodologies, you should use site-specific data in the form of monitored emission concentrations or mass balance techniques where appropriate. Ideally measured emission concentrations should be based on data obtained using appropriately certified equipment, and/or accredited services. You should normally use continuous monitoring data in preference to periodically sampled data.
Where emission factors are used, you should give preference to site-specific emission factors rather than those developed from other representative plant. However, to develop a site-specific emission factor you will need to relate the level of emissions to an activity within the process. This is normally achieved by sampling and monitoring, from the manufacturer’s information or by calculation.
Some emissions from a process will have more impact on the environment than others. You need to concentrate efforts, and use the most accurate RETs, on those emissions that have associated emission limit values in a permit and also on those which exceed the PI reporting threshold values the most.
The four RETs relate principally to representative operating conditions. Emissions resulting from significant operating deviations (for instance failure of abatement plant) and/or accidental events, such as spills, also need to be estimated. In the case of air emissions from spillage events, it may be necessary to make an estimate of the amounts of substances released as vapour. For all spills you should report the net emission, that is, the quantity of the substance spilled minus the quantity recovered or consumed during clean-up operations.
Contact us if an emission factor or other emission estimation technique is not available.
6.2.1. Part 2 - releases to air
In this context, ‘air’ includes both the inside and outside of a building. Take care not to double count when you are quantifying the amounts released from a given point. For example if you have vapours coming off a process inside a building which are then collected and discharged through a stack, only count the emissions from the stack. If you have some collected vapours and some which are not collected but escape through doors and windows, you will need to count both.
6.2.2. Part 3 - releases to land
This only applies to waste that is subject to the disposal operations ‘land treatment’ or ‘deep injection’. If waste is treated in this way, substance specific releases must be reported by the operator of the installation producing the waste, regardless of the disposal location. You do not have to report accidental releases of substances onto the soil of the installation, for example, as spillages.
6.2.3. Part 4 - releases to controlled waters:
These include:
• Groundwaters (G) - any waters contained in underground strata. • Rivers and inland waters (R) - this includes surface fresh waters, that is those inland surface
fresh waters which are not part of, and are upstream of, an estuary. • Estuary (E) - the transitional area at the mouth of a river between fresh water and coastal
waters. The UK has established estuary boundaries and we hold maps of these.

UNCLASSIFIED
UNCLASSIFIED 8 of 22
• Sea (S) - coastal waters up to three miles from the coast with respect to a landward baseline. We hold maps of this baseline.
6.2.4. Part 5 - off-site transfers in wastewater:
This comprises all relevant substances transferred to wastewater treatment plant via sewer or other means, for example by tanker. As with air emissions, take care not to double count. For example, if you transfer effluent within your site, or pre-treat it before discharge to sewer, only count the final discharge from the site.
6.2.5. Reporting conventions - help to complete the table
Total releases (including notifiable releases): You must report your total annual mass releases or transfers for each specified substance and each medium in the ‘Total releases’ column. Include point source, fugitive and any notifiable releases in this figure.
Enter a release value, ‘n/a’ or ‘brt’ in the ‘total releases’ column as appropriate:
• Release - When the annual release exceeds the reporting threshold enter the total annual mass released or transferred. Please do not report releases below the reporting threshold.
• n/a (not applicable) - no release or transfer of the substance occurred in the reporting year to that medium.
• brt (below reporting threshold) - the annual releases or transfers have been determined and found to be below the reporting threshold.
Limit of Detection (LOD)
If the best available information indicates that a substance is not released from your process, report n/a for that substance. Where a substance may be released but at a release concentration that is below the limit of detection, you also need to report n/a unless an alternative release estimation technique, such as mass balance, produces an applicable result. By limit of detection we mean the lowest concentration which can be measured by the analytical method prescribed in the Permit, or such other method as we approve.
We recognise that there may be circumstances where some analyses in a series do not detect a substance but others do. Provided that no more than 5% of the readings show a positive value, and the values obtained are not more that 20% above the accepted limit of detection, you can treat them as if they were also reported as below the limit of detection. In any other case, use the values obtained and make the assumption that where the substance is reported as not detected it is present at 50% of the LOD. In these cases, you need to multiply each concentration (that is, those measured at above the LOD as measured and those measured at below the LOD as ½ of the LOD) by the total flow during the period that the measurement relates to in order to determine the mass emission.
In some cases we may have agreed a different methodology with you for a particular substance or process. If so, use this in place of the procedure above.
If as a result of this methodology a positive result is obtained that is below the reporting threshold, it should be reported as below reporting threshold (brt) rather than n/a.
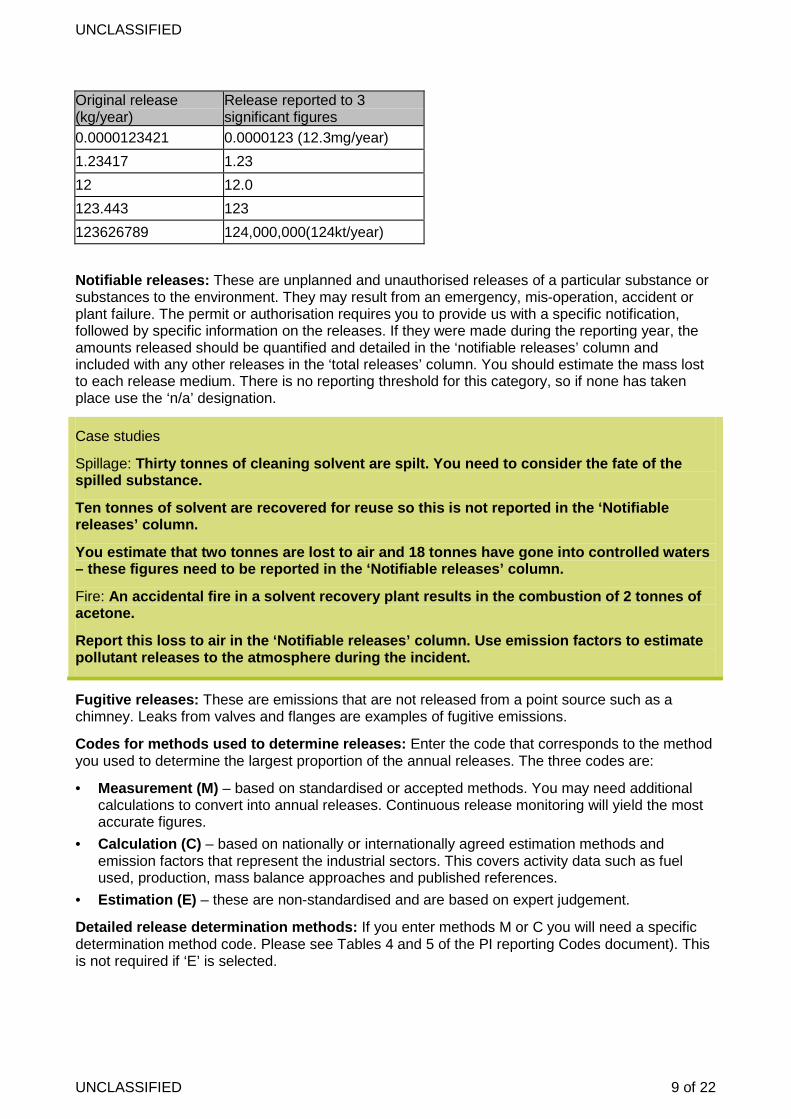
Mass units and significant figures: Quote all releases in kilotonnes ‘kt’, tonnes ‘t’, kilograms ‘kg’, grams ‘g’ or milligrams ‘mg’ per year with three significant figures. Rounding to three significant figures does not refer to the statistical or scientific uncertainty but provides a common standard for all reported data. When rounding the figures, please note that the numbers 5 and higher should be revised up and 4 or lower should be revised down. Examples of rounding raw data to 3 significant figures are shown below:
UNCLASSIFIED
UNCLASSIFIED 9 of 22
Original release (kg/year)
Release reported to 3 significant figures
0.0000123421 0.0000123 (12.3mg/year) 1.23417 1.23 12 12.0 123.443 123 123626789 124,000,000(124kt/year)
Notifiable releases: These are unplanned and unauthorised releases of a particular substance or substances to the environment. They may result from an emergency, mis-operation, accident or plant failure. The permit or authorisation requires you to provide us with a specific notification, followed by specific information on the releases. If they were made during the reporting year, the amounts released should be quantified and detailed in the ‘notifiable releases’ column and included with any other releases in the ‘total releases’ column. You should estimate the mass lost to each release medium. There is no reporting threshold for this category, so if none has taken place use the ‘n/a’ designation.
Case studies
Spillage: Thirty tonnes of cleaning solvent are spilt. You need to consider the fate of the spilled substance.
Ten tonnes of solvent are recovered for reuse so this is not reported in the ‘Notifiable releases’ column.
You estimate that two tonnes are lost to air and 18 tonnes have gone into controlled waters – these figures need to be reported in the ‘Notifiable releases’ column.
Fire: An accidental fire in a solvent recovery plant results in the combustion of 2 tonnes of acetone.
Report this loss to air in the ‘Notifiable releases’ column. Use emission factors to estimate pollutant releases to the atmosphere during the incident.
Fugitive releases: These are emissions that are not released from a point source such as a chimney. Leaks from valves and flanges are examples of fugitive emissions.
Codes for methods used to determine releases: Enter the code that corresponds to the method you used to determine the largest proportion of the annual releases. The three codes are:
• Measurement (M) – based on standardised or accepted methods. You may need additional calculations to convert into annual releases. Continuous release monitoring will yield the most accurate figures.
• Calculation (C) – based on nationally or internationally agreed estimation methods and emission factors that represent the industrial sectors. This covers activity data such as fuel used, production, mass balance approaches and published references.
• Estimation (E) – these are non-standardised and are based on expert judgement.
Detailed release determination methods: If you enter methods M or C you will need a specific determination method code. Please see Tables 4 and 5 of the PI reporting Codes document). This is not required if ‘E’ is selected.

UNCLASSIFIED
UNCLASSIFIED 10 of 22
Worked examples – how to obtain method codes
Example 1: The annual release of a substance to air from a plant was determined purely from monitoring data of stack releases, and there were no other sources of this substance to air from the plant – enter M.
Then select the appropriate detailed measurement method from the reporting codes document.
Example 2: The annual release of a substance to air was determined from three processes by different approaches
• 30% of the total from measurement (releases from a stack) • 15% of the total by estimation (fugitive releases) • 55% of the total by calculation (releases from vents)
The greatest proportion of the total annual releases to air was determined by calculation – enter C.
Then select the appropriate detailed measurement method from the reporting codes document.
6.2.6. Reporting substances – general principles:
• For inorganics and organics you should report the total mass of the specified substance. • For metals and compounds you should convert the mass of each relevant compound to the
mass of the metal it contains. • For other substance groups you should normally report the total mass although there are some
specified exceptions (for example dioxins and furans).
You can find guidance on reporting specific substances and substance groups in the sector guidance notes and in the Annex below.
6.3. Completing parts 6 and 7 – Waste transfers
6.3.1. Part 6 - Within country waste transfers
Report the annual tonnages of wastes arising from process-related activities and transferred off-site for disposal or recovery. Exclude liquid wastes transferred via sewer or other means to wastewater treatment plant (report these as substance-specific off-site transfers in wastewater).
Ensure that waste is described accurately as being sent for recovery or disposal. Recovery of waste includes recycling, re-use, processing to extract secondary raw materials or use primarily as a fuel to generate energy (co-incineration).
Examples include land spreading of sludges for agricultural benefit.
Disposal covers operations other than recovery, for example landfill or burning of waste in an incineration plant.
• Step 1: Complete the relevant 6-figure List of Wastes (LOW) Regulations codes in the first column in the format XX-XX-XX.

UNCLASSIFIED
UNCLASSIFIED 11 of 22
• Step 2: Complete the relevant Waste Framework Directive Disposal or Recovery codes in the first row.
• Step 3: Enter waste tonnages or ‘brt’ (below reporting threshold) as appropriate. There is no need to insert ‘n/a’ in the boxes where no waste is transferred off site.
You can find full lists of Lists of Wastes (LOW) and Disposal and Recovery (D&R) codes in the PI reporting codes document.
You should not report wastes that are temporarily stored on site by yourself, as these are not classed as off-site waste transfers for the PI return. However, waste transferred to third parties (even if stored on your site), should be reported.
6.3.2. Part 7 - Overseas waste transfers
If you have sent any hazardous waste overseas for disposal or recovery, you need to tell us in section 7. You will have reported this already in section 6, but we need more details for overseas transfers. You are unlikely to have transferred hazardous waste overseas for disposal.
6.4. Completing Part 8 – Resource efficiency
We require operators of A(1) installations (except landfills and intensive agriculture installations) to tell us about their resource efficiency. You should report in one of three ways:
• If you are reporting under an approved scheme (a scheme administered by a third party that provides information concerning your resource efficiency and which has been formally agreed with the Environment Agency) please fill in the details in Section 1 of Part 8.
• If you have your own system for your site that you prefer to tell us about, please answer the questions in Section 2.
• If you are reporting under REPI, please use the tables in the Section 3 which apply to you. Find additional guidance on the website at http://www.environment-agency.gov.uk/pi
7. Further guidance 7.1. Guidance on monitoring techniques
If you are using source monitoring data to generate annual mass releases, you can download best practice guidance from our series of Monitoring Technical Guidance Notes. Use the links below to go straight to the publication.
Report number Report title M1 Sampling requirements for stack-emissions
monitoring M2 Monitoring of stack emissions to air M17 Monitoring ambient particulate matter in ambient air
around waste facilities M18 Monitoring discharges to water and sewer M20 Quality assurance of continuous emissions
monitoring systems

UNCLASSIFIED
UNCLASSIFIED 12 of 22
Additionally, a range of documents on good monitoring practice has been published by the International Standards Organisation (ISO), the European Committee for Standardisation (CEN), the British Standards Institute (BSI) and a number of other organisations including the German and American standards organisations (DIN & ASTM respectively). You can find details via the following web links.
ISO http://www.iso.org CEN http://www.cen.eu/cenorm/homepage.htm BSI http://www.bsigroup.com DIN http://www2.din.de/index.php?lang=en ASTM http://www.astm.org
7.2. Sources of information for emission factors and release determination
7.2.1. Releases to air (in priority order for UK use)
The National Atmospheric Emissions Inventory (NAEI): This includes estimates of releases of 19 atmospheric pollutants. It is useful for estimating releases from industrial combustion processes and for VOC speciation. http://www.naei.org.uk/
Atmospheric Emission Inventory Guidebook: A task force on emission inventories within the UNECE’s EMEP programme maintains this. It contains updated chapters for specific source sectors, where all available emission factors and calculation methods are collected. It is a useful source of emission factors which are not available from the NAEI. http://www.eea.europa.eu/publications/emep-eea-emission-inventory-guidebook-2009
Intergovernmental Panel on Climate Change (IPCC): The IPCC has produced guidelines for the establishment of emission inventories of greenhouse gases within its National Greenhouse Gas Inventory Programme (NGGIP). The revised IPCC guidelines (1996) for national greenhouse gas inventories contain emission factors and release estimation methods for all sectors as defined in the United Nations Framework convention on Climate Change. Furthermore, the IPCC developed a report on ‘Good practice guidance and uncertainty management in national greenhouse gas inventories’. This can be downloaded from the website. http://www.ipcc-nggip.iges.or.jp/
USEPA Office of Air Quality Planning and Standards: USEPA maintains a comprehensive website where all material on emission factors and release estimation methods in the US can be viewed and, in many cases, downloaded. In general, emission factors from these sources should only be used in the absence of appropriate UK or European values. http://www.epa.gov/ttn/chief/
Environment Australia: Australian Emission Estimation Technique industry manuals. http://www.npi.gov.au/publications/emission-estimation-technique/index.html
7.2.2. Releases to water
OSPAR Commission: Information on the releases and pollutants to water covered by this agreement http://www.ospar.org/
Norwegian Pollution Control Authority: Their project ‘Harmonised quantification and reporting procedures for hazardous substances (HARP)’ contains information on the releases and pollutants

UNCLASSIFIED
UNCLASSIFIED 13 of 22
to water. http://www.sft.no/artikkel____33492.aspx?cid=30041
7.2.3. Other sources of information
European IPPC bureau and BREF documents: The IPPC Directive states the conditions of permits Member States issue on Annex I activities must be based on Best Available Techniques (BAT) to achieve a high level of protection of the environment as a whole. The European IPPC Bureau in Seville collects information from a number of sources and drafts reference documents for the Commission to inform the permitting authorities, industry and other interested people. The Bureau is developing, in co-operation with Member States and industry, a series of reference documents to cover, as far as practicable, most of the Annex I activities. These documents are called BAT Reference Documents – BREFs.
They contain information on: • production processes and techniques • current release levels • release reduction measures and techniques in the determination of BAT
The BREF documents are posted on the European IPPC Bureau website: http://eippcb.jrc.es/index.html
UNEP: United Nations Environment Programme, ‘Inventory on information sources on chemicals’: http://www.chem.unep.ch/irptc/invent/igo.html
7.3. Additional PI Guidance
You can download guidance for specific sectors and on using the electronic reporting system (PIEDC) from our webpage: www.environment-agency.gov.uk/pi
Guidance for completing Radioactive Substance returns is contained within the reporting form and is available to download from our webpage.

UNCLASSIFIED
UNCLASSIFIED 14 of 22
Annex 1: Additional technical guidance for certain industrial sites
This guidance may be useful to operators of installations in the paper and pulp, food and drink, combustion, chemicals, metals, refineries and fuel production as well as other industrial sectors.
1. Quantification of emissions to air 1.1 Sampling data
To use sampling data to estimate emissions, information is required on both the flow rate and pollutant concentration. To determine annual emissions accurately, sampling for PI reporting should be performed under conditions representative of annual operations and, ideally, in accordance with methods or standards that we have approved.
Take care with relying on the results of one spot sample in order to report annual emissions, unless you are certain that the process conditions are representative of annual average operations. Where a process has a number of steady state conditions, it may be necessary to take samples under each operating condition and average the result according to the length of time the process operates at each condition. Similarly, where process conditions at the time of the spot sampling are uncertain, it may be necessary to take several samples and to average the results in order to provide the final annual emission estimate. Use good engineering judgement to select the most appropriate sampling time and data to use. You need to be able to justify the sampling programme selected.
Sampling as part of a permit condition may require that the monitoring be undertaken at maximum load (that is, higher than annual operating conditions) and this should be taken into account in the annual emission estimates. When in doubt, the proposed sampling protocols should be confirmed with us.
To estimate annual emissions from sampling data, the first step is to multiply the measured emission concentrations by the volumetric flow rates of the emission source at the time of the test. Assuming that representative sampling has been undertaken, these emission rates are then aggregated together for the annual operating period.
Take care to ensure that the emission concentration and flow rate are compatible. For example, normalised emission concentrations should be multiplied by normalised volumetric flow rates or actual, measured emission concentrations multiplied by actual, measured volumetric flow rates. Normalised emission rates are quoted in terms of a standard oxygen concentration, and are usually dry gas, at a temperature of 273K and a pressure of 101.3 kPa. It is always good practice to confirm the basis of measured data.
Sampled emission concentrations are also often reported in parts per million (ppm). In order to estimate annual emissions, these need to be converted to mg/m3 at the emission temperature at which the volumetric flow rate is measured. Formulae for converting ppm to mg/m3 are contained in Section 4 of this Appendix.
The following section shows how to calculate emissions based on stack sampling data expressed in mg/m3. An example involving PM10 emissions is included, although the same general methodology is applicable for the majority of the substances listed on the PI.

UNCLASSIFIED
UNCLASSIFIED 15 of 22
(1) E = C x Q x 0.0036 x [Op Hours]
Where: E = emission rate of pollutant in kg/yr C = pollutant concentration (mg/m3) Q = volumetric flow rate of the emission (m3/s) 0.0036 = the conversion factor from mg/s to kg/hr Op hours = the operating hours of the activity per year Where the pollutant concentration is consistent over the averaging period (i.e. one year), equation 1 can be written as: (2) E = C x M x V x 10-6 Where: E = emission rate of pollutant in kg/yr C = average pollutant concentration (mg/m3) M = mass of feedstock in one year (kg feedstock) V = standard volume of flue gas per tonne of feedstock (m3/kg feedstock) Example 1: PM10 emissions using equation (1): Operating hours = 24 hours/day, 280 days per year PM10 emission concentration = 20 mg/m3 (normalised to 273K, dry, 11% oxygen) Emission volumetric flow rate = 10 m3/s (normalised to 273K, dry, 11% oxygen) E = C x Q x 0.0036 x 24 x 280 = 20 x 10 x 0.0036 x 24 x 280 = 4,838 kg/yr = 4.84 te/yr
The use of continuous emission monitoring systems (CEMS) is considered below. In essence, this follows the same principles as using spot sampling data.
1.2 Continuous emission monitoring systems (CEMS) data
Although CEMS can report real-time emissions over a variety of time periods automatically, it may be necessary to determine annual emissions manually from such data, especially for periods where data may be out of tolerance. In any case, where annual emissions are calculated within the software of a CEMS, it is good practice to check the data manually in order to ensure that the automatic calculations are accurate.
Confidence Intervals must not be subtracted from the average values generated from the raw emissions data, prior to calculation of annual mass emissions (unless part of an over-riding written agreement with us).
Prior to using CEMS to determine emissions, we would prefer you to agree the methodology for collecting and averaging the data with us.
The basic equation for determining emissions is Equation 1, adjusted for the appropriate time period of the measurement. It must be applied for each time period for which emission measurements are available in the year, following the guidance given in Section 1.1. Normally, the measurement time periods are the same, such that it is possible simply to multiply the average

UNCLASSIFIED
UNCLASSIFIED 16 of 22
emission rate by the operating time per year to obtain the annual emission. However, it may be that the measurement time periods vary, and then Equation 3 should be used.
(3) E= |n∑ (E x t)
Where: E = emission rate of pollutant in kg/yr Ei = emission rate of pollutant over time period t t = time period for emission measurement Example 2: SO2 emissions calculated using equation (3) based on the average CEMS data for 6 days of a week. It is assumed that the process operates for 24 hours per day, 48 weeks per year and that the CEMS data are representative of annual operations. E1 = 13.2 kg/hr E4 = 12.2 kg/hr E2 = 12.6 kg/hr E5 = 14.0 kg/hr E3 = 11.2kg/hr E6 = 13.4 kg/hr E = [(13.2 x 24) + (12.6 x 24) + (11.2 x 24) + (12.2 x 24)+ (14 x 24) + (13.4 x24)]kg/week x 48 weeks/year 88,243 kg/yr 88.2t/yr
1.3 Emission factors
Emission factors can be used to estimate emissions to the environment. In this note, they relate the quantity of substances emitted from a source by some common activity associated with those emissions. General emission factors have been developed from a variety of sources, but this guidance draws upon UK information in particular.
Provided that unit operations remain consistent, representative monitoring data can be used to generate site specific emission factors. The emission factor will be the ratio of the measured or calculated pollutant emission to the process activity (e.g. per tonne of pulp produced). Site-specific emission factors should be verified periodically to ensure their continued validity, especially where raw material quality varies throughout the year.
Where an emission factor, or other release estimation technique, is not available for a particular substance you may review published information or use the emission factors referred to in this Note. However, care needs to be taken in selecting appropriate emission factors to ensure that the conditions under which the emission factor has been determined are representative of the sites’ operations.
Emission factors are usually expressed as the mass of a substance emitted multiplied by the unit mass, volume or duration of the activity emitting the substance.
Emission factors are used to estimate an activity’s emissions by the general equation:
(4) E = [A x Op hours] x EF

UNCLASSIFIED
UNCLASSIFIED 17 of 22
Where: E = emission rate of pollutant in kg/yr A = activity rate of process, t/hr or m3/hr Op hours = operating hours per year of activity, hr/yr EF = controlled emission factor of pollutant per activity, kg/t or kg/m3
Within Equation 4 it is important to note that EF is the emission factor for the pollutant released to atmosphere, that is, after the emission has been abated.
Depending on the availability of information, equation 4 can be rewritten as:
(5) E = M x EF Where: E = emission rate of pollutant in kg/yr M = activity rate in terms of mass of product produced in the year (t/yr) EF = controlled emission factor of pollutant per activity, (kg/t of product) The following examples show how to estimate annual emissions using Equation 5. Example 3: Air dried unbleached production of paper pulp: Estimating (SO2) emissions from a recovery system (typically includes recovery furnace, evaporator, acid fortification tower, scrubbers) per tonne of air dried unbleached pulp produced serves as an example of the use of emission factors. It is assumed that the pulping mill operates for 8000 hours per year and that 5 tonnes of pulp is produced per hour during the reporting year. The SO2 emission factor (assuming scrubber control) is assumed to be 4.5 kg of SO2 per tonne of air-dried unbleached pulp produced. A = 5 tonnes per hour Op hours = 8,000 hr/yr EF = 4.5 kg/tonne E = 5 x 8,000 x 4.5 = 180,000 kg/yr = 180 t/yr
Emission factors developed from measurements for a specific location can sometimes be used to estimate emissions at other sites provided that the processes are comparable in size and operation. As previously mentioned, where there is any doubt it is advisable to have an emission factor reviewed and approved by us prior to its use for PI submissions.
In the case of new or modified processes, initial emission factors can be obtained from manufacturers’ data with sampling undertaken during commissioning to confirm the assumed values.
1.4 Carbon dioxide factors
The European Commission has established guidelines for the monitoring and reporting of greenhouse gas emissions pursuant to European Directive 2003/87/EC (Emissions Trading Scheme (EU ETS)). These Guidelines (see web link below) set out the approved methodology for estimating CO2 emissions based on emissions from regular operations and abnormal events, including start-up and shut-down and emergency situations over the reporting period.
http://ec.europa.eu/environment/climat/emission/mrg_en.htm

UNCLASSIFIED
UNCLASSIFIED 18 of 22
If you are a participant in the EU EUTS, use the procedure below. If not, you can use the emission factors for CO2 in the H2 Energy efficiency guidance (http://www.environment-agency.gov.uk/business/topics/permitting/36414.aspx)
Under the EU ETS guidelines, estimation of CO2 emissions from combustion is based on the following formula.
(6) ECO2 = Ae x EFCO2 x OFCO2
Where: ECO2 = emission of CO2, t/yr Ae = activity rate (either in terms of annual energy consumption, TJ/yr, or mass/volume consumption, t/yr or m3/yr) EFCO2 = emission factor for CO2, (tCO2/TJ, or tCO2/t or tCO2/ m3) OFCO2 = oxidation factor
The guidelines refer to tiers for activity data, emission factors and oxidation factors. The higher the tier, the greater the accuracy.
The oxidation factor takes into account the fact that when energy is consumed not all of the carbon in the fuel oxidises to CO2. The oxidation factor expresses the proportion of carbon in the fuel that is oxidised to CO2.
Under the guidelines, operators can choose the most appropriate oxidation factor tier:
Tier 1 – an oxidation factor of 1.0 is used
Tier 2 – the operator applies oxidation factors for the respective fuel as reported in the UK Greenhouse Gas Inventory (country-specific factors)
Tier 3 – for fuels activity specific factors are derived by the operator using approved methodologies.
Country-specific factors are available from: http://www.decc.gov.uk/en/content/cms/what_we_do/change_energy/tackling_clima/emissions/eu_ets/euets_phase_ii/monitoring/monitoring.aspx
In some cases the emission factor may already take into account the proportion of carbon in the fuel that is oxidised and you should verify if this is the case. If so, the oxidation factor in Equation 6 is equal to 1.
It is possible to use an emission factor based on the amount of fuel used in energy terms, or mass/volume, in essence Equation 5.
The EU ETS provides specific guidance regarding the determination of activity-specific emission factors for defined fuels. In the absence of activity-specific factors, general emission factors for the combustion of various fossil fuels are provided in the EU ETS guidance.
By contrast with combustion sources of CO2 emissions, the EU ETS allows process emissions (emissions of CO2 from non-combustion activities) to be derived from activity data based on raw material inputs, throughputs and outputs. The basic calculation equation remains multiplication of activity data by appropriate emission factors, but uses conversion factors (CFs) in place of oxidation factors.
Biomass is considered to be CO2 -neutral in terms of the EU ETS, but the mass of CO2 emitted from its combustion or use is a PI reporting requirement. Emissions of CO2 attributable to biomass should be reported in the qualification box of the PI reporting form.
The EU ETS allows CO2 emissions to be determined by two methodologies: a calculation methodology or a measurement methodology. However, where a measurement methodology is
UNCLASSIFIED
UNCLASSIFIED 19 of 22
used, a requirement exists to verify the measured emissions by calculation. In both cases however, it is likely that measurements of fuel burned or material flow will be available and these can be used for the determination of other emission quantities when combined with appropriate emission factors.
The EU ETS reporting system is under review. You should use the guidelines given above, if appropriate, for reporting 2012 emissions and check our website for 2013 onwards
1.5 Reporting basis
Certain substances on the PI return are required to be reported as the main constituent, for example,. ‘Nitrogen oxides, NO and NO2 as NO2’. When a conversion needs to be made, the emission concentration or emission rate should be multiplied by the molar mass of the ‘reported as’ substance, and divided by the molar mass of the emitted substance. This is illustrated in the following example.
Example 4: Assume a discharge concentration of NO is 50 mg/m3. Using the molar masses of NO and NO2, the equivalent discharge concentration of NO2 can be determined. Molar mass of NO = 30 Molar mass of NO2 = 46 Concentration of NO as NO2 = 50 x 46 / 30 = 76.7 mg/m3 The mass of NO2 equivalent released can then be determined in accordance with Equation 1.
2. Quantification of emissions to water There is less choice in the techniques for use in the determination of emissions to water than for emissions to air. The most appropriate method is to use direct measurement. You may use other release estimation techniques, particularly mass balances or site-specific emission factors, where these are appropriate. Mass balances can often be used when emissions to water are very complex and difficult to quantify with other approaches. A mass balance calculation is still likely to require direct measurement of emissions from some of the water pathways in order to verify the calculations. Site-specific emission factors are determined from the ratio of the measured or calculated pollutant emission to the water discharge flow rate.
This note advises on the use of direct measurement techniques as these are likely to be applicable to the majority of operators.
Using the direct measurement technique requires information on both the flow rate and pollutant concentration. Measurement of flows and pollutant concentrations need to be carried out at the same time during representative operating conditions. Take particular care when relying on the results of one spot sample in order to report annual emissions unless you can be certain that the process conditions are representative. Where a process has a number of operating conditions, it may be necessary to take samples at each condition and average the results according to the length of time the process operates at each condition. Similarly, where process conditions at the time of the spot sampling are uncertain, then it may be necessary to take several samples and average the results in order to provide the final annual emission estimate.

UNCLASSIFIED
UNCLASSIFIED 20 of 22
The frequency of sampling will depend on the variability of the data. Initially, it may be necessary to take several samples and average the results to yield an annual result. If, however, the results indicate that a concentration and flow are reasonably constant, then the frequency of sampling may be reduced to a practical minimum of once per year. You need to be able to justify the sampling regime selected and this may be supported by a history of previous measurements. The sampling requirements will usually be set out in the EPR permit and it is important to note that no additional sampling and monitoring is required solely for the purposes of reporting to the PI.
The background load of a reportable substance in water may be taken into account. For example, if water is collected at the site of the installation from a neighbouring river, lake or sea for use as process or cooling water which is afterwards released from the site of the facility into the same river, lake or sea, the “release” caused by the background load of that substance can be subtracted from the total release of the installation. The measurements of pollutants in collected inlet water and in released outlet water must be carried out in a way that ensures that they are representative of the conditions occurring over the reporting period.
It may also be necessary to take account of the fact that evaporation of water from the process will lead to an increase in the pollutant concentration. This can be done by using the following equation:
(9) PC = OC– [IC x VF] Where: PC = the pollutant emission concentration from the process, mg/l OC = the measured pollutant concentration in the discharge, mg/l IC = the measured pollutant concentration in the feedwater, mg/l VF = the ratio of volume of water entering the process to volume of water discharged If the additional load results from the use of extracted groundwater or drinking-water, it should not be subtracted since it increases the load of the pollutant in the river, lake or sea. To estimate the mass emission to water, the appropriate pollutant concentration is then multiplied by the flow rate for that particular discharge point. These representative discharge rates are then aggregated together based on the time for which the water is discharged at that rate. The estimated mass emissions from all discharge points to either controlled waters or in wastewater transfers should then be summed for each individual pollutant for each reporting medium. For emission points fitted with continuous monitors, calculations of mass emissions from a particular discharge point can be made automatically. For cooling water it may also be necessary to adjust the measured data to take account of input pollutant concentrations as described above, and it is good practice to check automatic calculations manually to ensure that they are accurate.
3. Substances 'reported as' Certain substances on the PI return are required to be 'reported as' the main, or most environmentally significant, constituent. For instance chloride salts are reported in terms of their chloride content under the heading ‘Chlorides – total as Cl’. When a conversion needs to be made, the emission concentration should be multiplied by the relative atomic/molar mass of the key constituent and divided by the total molar mass of the substance. This is illustrated in the following example.

UNCLASSIFIED
UNCLASSIFIED 21 of 22
4. Conversion factors 4.1 Converting air emissions - ppm to mg/m3 and vice versa
The conversion between ppm and mg/m3 is dependent on both the molar mass of the substance and the temperature and pressure at which the conversion is made. The assumption is that the pollutant behaves as an ideal gas and as such, 1 mole of the substance occupies 22.4 litres at standard temperature (273K) and pressure (101.3 kPa). This is consistent with normalised concentrations and it is, therefore, not normally necessary to take account of the temperature or pressure difference in the conversion. When converting ppm to mg/m3 under actual discharge conditions it is important to take account of these factors.
To convert from ppm to mg/m3 the following formula should be used:
mg/m3 = ppm x (MM/22.4) x (273/T) x (P/101.3)
Where: MM is the molar mass of the substance (in grams) T is the temperature at which the conversion is to be made (degrees Kelvin) P is the pressure at which the conversion is to be made (kPa) To convert from mg/m3 to ppm use the following formula: ppm = mg/m3 x (22.4/MM) x (T/273) x (101.3/P)
4.2 Converting emissions to water
The conversion between ppm and mg/l for water is straightforward in that it is normally assumed that water has a density of 1000 kg/m3. On this basis, 1 ppm = 1 mg/l = 1 g/m3 = 1 mg/kg.
Example 6: An effluent is calculated to contain 50mg/l of sodium chloride and the total volume released is 1,000 m3 Relative atomic mass of sodium = 23 Relative atomic mass of chlorine = 35 Molar mass of sodium chloride = 58 Concentration of sodium chloride as chloride = 50 x 35 / 58 = 30.2 mg/l = 30.2 g/m3 The mass as chloride released is (30.2 x 10-3) x 1000 = 30.2 kg which is below the reporting threshold

UNCLASSIFIED
UNCLASSIFIED 22 of 22