
Political Studies - Anthony Kevins
49
1 Numbers and attitudes towards welfare state generosity Carsten Jensen (Department of Political Science, Aarhus University) Anthony Kevins (School of Governance, Utrecht University)* Published in Political Studies Abstract: Between pro-retrenchment politicians and segments of the media, exaggerated claims about the generous benefits enjoyed by those on welfare are relatively common. But to what extent, and under what conditions, can they actually shape attitudes toward welfare? This study explores these questions via a survey experiment conducted in the UK, examining: (1) the extent to which the value of the claimed figure matters; (2) if the presence of anchoring information about minimum wage income has an impact; and (3) whether these effects differ based on egalitarianism and political knowledge. Results suggest that increasing the size of the claimed figure decreases support in a broadly linear fashion, with anchoring information important only when (asserted) benefit levels are modestly above the minimum wage income. Egalitarianism, in turn, primarily matters when especially low figures are placed alongside information about minimum wage, while low- knowledge respondents were more susceptible to anchoring effects than high-knowledge ones. Key Words: welfare state; benefit generosity; public opinion; United Kingdom. *Corresponding Author
Transcript of Political Studies - Anthony Kevins
1
Numbers and attitudes towards welfare state generosity
Carsten Jensen (Department of Political Science, Aarhus University)
Anthony Kevins (School of Governance, Utrecht University)*
Published in Political Studies
Abstract: Between pro-retrenchment politicians and segments of the media, exaggerated claims
about the generous benefits enjoyed by those on welfare are relatively common. But to what extent,
and under what conditions, can they actually shape attitudes toward welfare? This study explores
these questions via a survey experiment conducted in the UK, examining: (1) the extent to which
the value of the claimed figure matters; (2) if the presence of anchoring information about minimum
wage income has an impact; and (3) whether these effects differ based on egalitarianism and
political knowledge. Results suggest that increasing the size of the claimed figure decreases support
in a broadly linear fashion, with anchoring information important only when (asserted) benefit
levels are modestly above the minimum wage income. Egalitarianism, in turn, primarily matters
when especially low figures are placed alongside information about minimum wage, while low-
knowledge respondents were more susceptible to anchoring effects than high-knowledge ones.
Key Words: welfare state; benefit generosity; public opinion; United Kingdom.
*Corresponding Author
2
There is a long history of politicians trotting out claims about the generosity of welfare programmes
in order to create public support for retrenching them. Ronald Reagan’s famous “welfare queen”,
raking in over $150 000 a year, is but one example of this use of massaged or even falsified
statistics about welfare benefit levels. Whether these figures are meant to highlight benefit fraud –
as with Reagan – or inequities in the welfare system – as with former British Chancellor of the
Exchequer George Osborne’s complaint about families receiving “£100 000 a year in benefit” –
their persistence as a trope is striking. And not only are these campaigns clearly viewed as vote-
winners, but they also often give rise to real policy changes as well: the benefit cap, introduced in
2013 under the Conservative-Liberal Democrat coalition in the UK, was precisely intended to
ensure that benefit levels never exceeded a threshold that the government designated the “average
earned income of working households” (see Kennedy et al., 2016).
But to what extent do these sorts of claims about welfare generosity actually affect public
opinion? Clearly, at least part of the intention in emphasizing overly generous benefits is to generate
a reaction among the public, attracting both votes and support for welfare reform. Yet this raises
another question: at what point do citizens find benefits to be “overly” generous? To take the British
example, £100 000 is obviously a lot of money for someone on social assistance, since it is multiple
times larger than the average income in Britain – but how would people react to a more realistic yet
still substantial, figure of, say, a quarter of that size?
Drawing theoretical inspiration from existing research on public opinion formation (e.g.
Bartels, 2005; Cruces et al., 2013; Petersen, 2015) and attitudes toward the welfare state (e.g.
Wenzelburger and Hörisch, 2016; Giger and Nelson, 2013; Jæger, 2012), we explore these
questions using an experiment conducted via a nationally representative survey of just under 2000
Britons. In doing so, we investigate: (1) the extent to which claims about benefit levels affect beliefs
about whether the welfare system is too generous; and (2) the impact of receiving information about

3
the minimum wage alongside these claims. In combination with validated measures of respondents’
egalitarianism and political knowledge, this survey provides important insights into how numerical
information affects attitudes about the right levels of welfare generosity.
We find a number of interesting patterns. First, claims about benefit levels do indeed have
an impact on whether or not people think benefits are too generous. Broadly speaking, the higher
the claimed level of benefits, the more people believe benefits are too generous. Respondents told
that the typical family on benefits get £29 000 per year are notably more likely to think that benefits
are too generous than those told that the typical family on benefits get £9000. Second, situating
these claims alongside information about the minimum wage matters, but only for those told that
benefits were modestly higher than minimum wage income. Third, respondent egalitarianism
primarily makes a difference when especially low figures are placed alongside information about
minimum wage income. Finally, low-knowledge respondents appear to have been particularly
susceptible to anchoring effects.
Our findings, in brief, underscore how powerful using (inflated) figures can be for garnering
support for welfare state cutbacks. By contrast, objective reference points – or at least the minimum
wage income – matter rather less. These findings add to an emerging literature on “benefit myths”
and how these may affect popular attitudes toward the welfare state (Jensen and Tyler, 2015;
Geiger, 2017a; 2017b). More broadly, we also contribute to the literatures on information (e.g.
Kuklinski et al., 2000; Leeper and Slothuus, 2017) and framing (e.g. Chong and Druckman, 2007)
in public opinion formation by indicating how the strategic use of construed information can shift
attitudes. As such, our results will be relevant not just for scholars preoccupied with the politics of
the welfare state, but for all those concerned with the interaction between elite communication and
citizen opinion formation.
4
Preferences for benefit generosity in the welfare state literature
The starting point of the contemporary welfare state literature on public preferences dates back to
Pierson’s (1994) seminal Dismantling the Welfare State? The core proposition of Pierson is that the
welfare state has become hugely popular among the majority of voters, and that politicians have
therefore been forced to either hide their cutbacks or refrain from retrenchment altogether. Indeed,
assumptions about the welfare state’s broad popularity have been borne out repeatedly by surveys
documenting that voters usually prefer increased spending on the welfare state, and that they
typically believe it is the government’s responsibility to provide protection in cases of
unemployment, sickness, and other misfortunes (e.g. Van Oorschot, 2006; Jensen, 2014; Jæger,
2012). This is frequently the case even when respondents are confronted with trade-offs between
social spending and taxation: the British Social Attitudes Survey, for example, documents that the
proportion of Britons wanting to spend less on the welfare state in order to reduce taxation has
never surpassed ten percent since polling began in 1983. By 2016, fully 48 percent wanted the
government to spend more on the welfare state, while less than five percent wanted cuts (Curtice,
2017: 1-2).
Yet the broadly pro-welfare state stance of citizenries has quite obviously not meant that
welfare cuts have been off the table, and analysis of large-N datasets has documented the
considerable rollback of entitlements in many western welfare states (Korpi and Palme, 2003; Allan
and Scruggs, 2004). The sheer frequency of retrenchment would seem to fly in the face of Pierson’s
claim that citizens love the welfare state so much that any attempt at cutting it back will lead to
electoral disaster. Giger and Nelson (2011) and Schumacher et al. (2013), moreover, found that
governments’ vote shares did not systematically drop from one election to the next in the wake of
cutbacks; voters occasionally seem to have reacted to reforms, but much of the time cutbacks had
no effect on aggregated vote shares. Yet regardless of the precise extent to which voters are
5
bothered by retrenchment (c.f. Lee et al., 2017), these debates raise the possibility that voters’
preferences might be less one-dimensional than Pierson’s argument suggests. As a consequence,
micro-level analysis of welfare preferences offers a particularly valuable route forward.
For our purposes, the key consideration here is that for many citizens, pro-welfare state
stances exist in balance with other considerations, often moral or economic in nature (e.g. Ryan,
2014). In a simple but analytically powerful move that highlights this complexity, Giger and Nelson
(2013) argue that voters can care both about the welfare state and a sound economy, but that the
weight given to each dimension varies among people. Some are “unconditional believers” of the
welfare state, while others are more “conditional believers”, meaning that they ascribe roughly
equal value to the welfare state and the economy (empirically speaking, few individuals ascribe
more weight to the economy than the welfare state). The authors find that only unconditional
believers punish governments for cutbacks.
The fact that many people cherish multiple goals is important because it underscores the
potential impact of using moral or economic cues to shape support for cutbacks. Framing studies
have a long history in political science (Chong and Druckman, 2007), and have recently also been
employed to study welfare state preferences. Using survey experiments, Slothuus (2007) and
Petersen et al. (2011), for instance, show that framing recipients as undeserving (“lazy”) makes
people less supportive of generous welfare state benefits. Similarly, Wenzelburger and Hörisch
(2016) and Naumann (2017) find that people become more accepting of cuts if they are framed as
economic necessities. And in a related strand of research, authors such as Lergetporer et al. (2016)
and Stanley and Hartman (2017) have shown how information about how much is spent on the
welfare state – and whether undeserving groups get a comparably large share of that spending –
affect public preferences.
6
This strand of research suggests that voters are open to elite messages that present the social
policy programmes as a burden. If voters accept the narrative, they tend to become less supportive
of the welfare state (see, for example, Geiger, 2017a). In our reading, this is what politicians, as
well as varied media outlets, are trying to achieve when they use inflated figures on benefit
generosity (see Baumberg et al., 2012); yet it is, of course, not terribly surprising that people will
become more sceptical of the welfare state if they think recipients receive some outlandish amount
in benefits. The more interesting question is at what point people find benefits to be overly
generous. Benefit levels lie on a continuum of generosity without a clear a priori dividing line
between “suitable” and “outlandish”. It is an empirical question where on this continuum voters
think benefits become too generous. At the same time, it may well be that different groups of voters
have fundamentally distinct responses to different levels of benefit generosity, as well as the
presence or absence of information about relative economic benchmarks like the minimum wage.
These questions are far from trivial and have, to our knowledge, not been investigated previously.
Expectations about the effect of claimed welfare benefit generosity on support
It is well established that citizens exhibit substantial biases when processing informational claims.
For one thing, they generally possess limited factual knowledge (Delli Carpini and Keeter, 1996),
which complicates the assessment and incorporation of new information. Recent research suggests,
for example, that citizens are ignorant of both the distribution of income in society and where they
themselves might fit into that distribution (Bartels, 2005; Norton and Ariely, 2011). Citizens are
similarly in the dark when it comes to issue such as spending on welfare, benefits fraud, and the
demographic composition of benefit claimants as a group (e.g. Jacobs and Shapiro, 1999; Kuklinski
et al., 2000; Taylor-Gooby et al, 2003). As Geiger (2017b: 17), concludes, “[k]nowledge about the
benefits system is low, as even where the public are right on average, on almost no measure do
7
more than one-third of individuals provide a correct answer as we define it; and the public are often
not right on average” (emphasis in original). But if this is the case, how do people assess when
benefit levels are “too generous”, and under what conditions can claims about generosity impact
people’s preference?
Numbers are, in and of themselves, neutral – so understanding the importance of number-
based claims requires us to focus on characteristics of the targeted audience. Existing research
suggests that several contextual factors will be central. First, given that citizens have limited
knowledge about the distribution of income in society, we assume that they will be uncertain as to
how a specific level of benefits compares to the income of the typical employed person. At the same
time, there is some research to suggest that providing factual information about the shape of the
income distribution, correcting for misconceptions, can change people’s opinions about the
appropriate level of redistribution (cf. Cruces et al., 2013; Lawrence and Sides, 2014). To us, this
suggests that citizens’ assessments of the appropriateness of welfare benefit levels will, in the
absence of any additional information about the income distribution, reflect the level of asserted
benefits income, such that greater amounts engender increasingly anti-generous positions (H1). The
flipside of this expectation is that respondents may be affected by information about how welfare
income compares to well-known yardsticks, such as the income of those working for the minimum
wage. Inspired by Petersen (2015), we expect that many individuals will view income levels at the
minimum wage as a natural ceiling that benefits should not surpass, as the idea that the claimants
can make more on welfare benefits than while working will generate perceptions of unfairness
and/or economic disincentives (“welfare traps”, in common parlance) (H2).
Second, as mentioned above, many citizens harbour strong opinions about the welfare state,
especially when it comes to programmes aimed at the working-age poor (the ones under study
here). Ideologically left-leaning individuals tend to view the jobless as more deserving than right-
8
leaning individuals do (Skitka and Tetlock, 1993; Jensen and Petersen, 2017) and, possibly as a
consequence, they are also more supportive of generous welfare programmes (Zaller and Feldman,
1992; Jacoby, 1994). Citizens are also prone to engage in motivated reasoning: information is used
not to update pre-existing beliefs, but rather to strengthen them – either by discounting inconvenient
information (Taber and Lodge, 2006) or by only seeking out information that fits these beliefs
(Druckman et al., 2012).
In particular, we expect egalitarianism to be the key value orientation shaping how citizens
evaluate information about welfare generosity. In particular, information suggesting that welfare
benefits are relatively high are most likely to play into the predispositions of anti-egalitarians, since
the claim aligns with their prior belief that the jobless are relatively lazy and undeserving of the
support they receive. Among egalitarians, by contrast, we would expect welfare state support to be
relatively less affected by claims about benefit levels, given a higher baseline level of support for
social programmes and a likely predisposition to discount assertions about high benefit levels.
There are good reasons to expect, in sum, that increasing the claimed level of benefits will have a
greater effect on anti-egalitarian individuals than egalitarian ones (H3).
Citizens’ egalitarian orientations and the presence (or absence) of meaningful yardsticks
may interact. One expectation, in light of the literature referenced above, is that egalitarianism
matters most in the absence of yardsticks (H4). When a yardstick is provided, by contrast, we would
expect these patterns to be modified. Assuming that the minimum wage signals some sort of
common-sense ceiling for benefit generosity, attitudes of egalitarian individuals should approach
the opinions of anti-egalitarians when they are presented with claims that benefit levels are equal to
or greater than the income of those working at the minimum wage. On the other hand, we expect
much greater divergence when egalitarians are informed that benefit levels are (substantially) below
the minimum wage (H5).
9
Finally, we started out by noting that people’s knowledge about politics in general and the
welfare state in particular is limited. While this is undoubtedly true in the abstract, there is
nevertheless substantial variation in how knowledgeable people are. Knowledge, or political
sophistication, has been shown to matter for opinion formation in a great many contexts and ways.
From this strand of the literature, we draw the expectation that political knowledge will diminish the
effect of assertions about welfare benefit levels; thus, we expect that higher levels of political
knowledge will lead to smaller differences across the treatment groups, with or without the
minimum wage information included (H6). Table 1 summarizes the six hypotheses that lay out our
expectations.
[Table 1 about here]
Data and methods
Our experiment was conducted via a survey carried out by YouGov on 1952 Britons. Data were
collected using YouGov’s online panels, with respondents quota-sampled to achieve
representativeness in terms of gender, age, education, and geographical region (defined according to
the European Union’s NUTS 2 regional classification); in other words, the standard set of socio-
demographic variables that most surveys aim to obtain representativeness upon. This approach is
clearly inferior to the gold-standard random sample, as YouGov’s basin of self-selected respondents
may differ in meaningful ways from the general population, and the overall accuracy of the data
relies heavily upon the correctness of the survey weights. Nevertheless, Ansolabehere and Schaffner
(2014) have shown that conducting online surveys in this way yields similar coefficient estimates
and total survey error when compared to traditional telephone and mail interviews.
10
The experiment was set up to assess the extent to which attitudes about welfare generosity
are affected by statements about the purported level of current welfare benefits. Specifically, we
examine how responses are affected by the two factors discussed in the above sections: (1) the
welfare income quoted in the treatment, with monetary values of (approximately) 50%, 75%, 100%,
125%, and 150% of the yearly minimum wage income for a “typical family”; and (2) the inclusion
of a reference point in the treatment, namely the current yearly minimum wage income for a
“typical family”. (Note that in no instance were respondents provided with the percentages; all
prompts include only amounts in pounds sterling.) In light of our use of deception, all respondents
were presented a debrief statement at the conclusion of the survey.
The experiment’s “no minimum wage information” treatments thus took the following form:
According to the Office for National Statistics, the typical family on welfare
received about £[amount] worth of benefits per year.
While the “minimum wage information” treatments took the form of:
According to the Office for National Statistics, the typical family on welfare
received about £[amount] worth of benefits per year, while the typical family
working for minimum wage took home about £19000.
Based on this, the respondents were asked to indicate their agreement with the statement, “to what
extent do you disagree or agree that benefits for the typical family on welfare are too generous?” on
a five-point scale going from “disagree strongly”, “disagree somewhat”, “neither agree nor
disagree”, “agree somewhat” to “agree strongly”. Alternatively, respondents could record their
response as “don’t know”.1
1 The mean length of time spent on the survey experiment page was approximately 30 seconds, but there are several
outliers who clearly left the page open while doing something else (standard deviation: 324). The median length is thus
11
A couple of points are worth noting here. First, the contrast between welfare benefit levels
and take-home pay in the “minimum wage information” treatments is clearly misleading, since low-
wage families would in reality also be receiving welfare state support (e.g. housing benefits, child
benefits, etc.). Second, the use of the term “typical family” in the treatment prompt is purposefully
vague, with the intention that respondents would not find the values a priori unbelievable. In both
instances, however, these wordings reflect the real-world practices of politicians, think tanks, and
journalists, who use these sorts of ambiguities to construct comparisons and “typical” values
designed to elicit strong reactions, while at the same time referring to official government sources to
obscure their machinations (e.g. Jensen and Tyler, 2015). Indeed, we draw clear inspiration here
from debates in Britain around the implementation of the benefit cap in 2013; initially set at
£26 000 (for households) and then lowered to £20 000 (£23 000 in London), the policy was
justified, in the words of former Chancellor of the Exchequer George Osborne, by the argument that
“families out of work should not get more than the average family in work”.2
In calculating our baseline reference value (i.e. the amount the “typical family working for
minimum wage took home”), we employed the following parameters: first, we input the current
minimum wage (£7.20 an hour); second, we assumed two earners, with one working the national
full-time average of 37 hours and the other working the national part-time average of 16 hours;
third, we assumed both workers to be under the state pension age; and finally, we situated them
outside of Scotland. We then used the UK government’s tax calculator,3 employing the most
common tax code (1150L), to calculate the level of each of the two worker’s take home earnings.
To be clear, we do not suggest that this figure actually represents the “typical family’s” income, as
more instructive, at 17 seconds. As we would hope, respondents presented with the additional minimum wage
information text spent longer on the page (median time: 19 seconds) than those who were not (median time: 15
seconds).
2 https://www.gov.uk/government/speeches/chancellor-george-osbornes-summer-budget-2015-speech 3 https://www.gov.uk/estimate-income-tax
12
all of our specific parameter choices can be debated; rather, what is important here is that
respondents are provided with a figure that serves as a believable stand-in for the minimum wage
income – not that the figure represents the “true” amount.
The result of these calculations was a net income of £12 702 for the full-time worker and
£5990 for the part-time worker, giving us a total of £18 692. (For reference, the median household
income in the UK was £26 300 in 2016). The final values employed in the treatments were then
rounded to the nearest thousand, giving us values of £9000 (50% of the minimum wage), £14 000
(75%), £19 000 (100%), £24 000 (125%), and £29 000 (150%). Since respondents were randomly
sorted into treatment groups receiving one of these five monetary values with or without
information about the minimum wage income, this gives us a total of ten treatments.
As highlighted by our hypotheses above, two additional concepts are central to our analysis:
egalitarianism (capturing the value orientation that is most relevant for our purposes) and political
knowledge. Both variables are constructed on the basis of Item Response Theory (IRT), which
allows us to assess the presence of a latent trait using a series of question responses (see, for
example, Treier and Hillygus, 2009). Given our use of ordinal variables (in the case of
egalitarianism) and binary variables (in the case of political knowledge), IRT offers a more
appropriate approach to estimating latent measures than traditional factor analysis, as the latter
assumes a normal distribution of the variables included in the index construction (Kaplan, 2004).4
For our egalitarianism measure, we use a set of questions validated by previous work
(Feldman and Johnston, 2014). Specifically, respondents began the survey by answering the
4 Nevertheless, we confirm that our key findings are not affected by using conventional factor analysis instead.
13
following six questions, all of which could be answered on a five-point scale ranging from “strongly
disagree” to “strongly agree” (once again with an alternative “don’t know” category):5
• Our society should do whatever is necessary to make sure that everyone has an
equal opportunity to succeed.
• We have gone too far in pushing equal rights in this country.
• One of the big problems in this country is that we don't give everyone an equal
chance.
• This country would be better off if we worried less about how equal people are.
• It is not really that big a problem if some people have more of a chance in life
than others.
• If people were treated more equally in this country, we would have many fewer
problems.
Responses to the individual items were then recoded such that stronger agreement with egalitarian
viewpoints always corresponded to higher values on the five-point scale. Finally, respondents were
then assigned individual IRT scores and divided based on whether they fell below or above the
mean (below described as anti-egalitarian and egalitarian groups).
Similarly, our political knowledge index is based off of previous work using the
Comparative Study of Electoral Systems (see, for example, Grönlund and Milner, 2006) and testing
respondents factual knowledge about quantities (e.g. Ansolabehere et al., 2017). Respondents were
thus presented the five following questions: “Which of these persons was the Chancellor of the
Exchequer before the recent election?”; “Which party came in second in seats in the parliamentary
elections of June 2017?”; “Who is the current Secretary-General of the United Nations?”; “What
was the unemployment rate in the United Kingdom as of August 2017?”; and “What was the
average household income in the United Kingdom in 2016?”. In each instance, there were five
potential responses: the right answer; three wrong answers; and “don’t know”. Those who answered
correctly were then assigned a score of 1, while all others were given a 0. (The median number of
5 Note that respondents were presented with these questions two pages prior to the experiment, with one survey question
in between.
14
correct responses was 3, with a roughly normal distribution.) Finally, as above, each respondent was
given an IRT score and the sample was divided based on whether they fell below or above the mean
(below described as low- and high-knowledge groups).
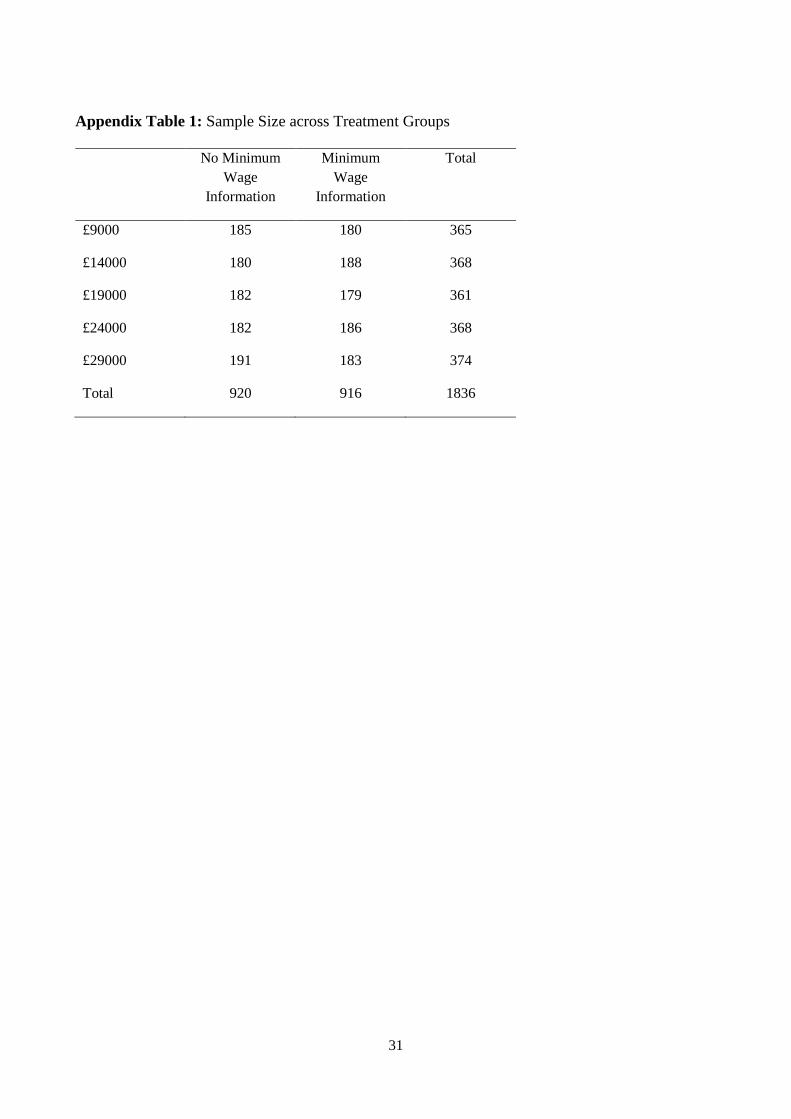
As Appendix Table 1 illustrates, each of our treatment groups contained between 179 and
191 respondents, for a total of 1836 in the sample, once we exclude respondents who answered our
key question (i.e. regarding benefit generosity) with “don’t know”. Responses to our dependent
variable have a weighted mean of 3.22 and a standard deviation of 1.31.
Findings
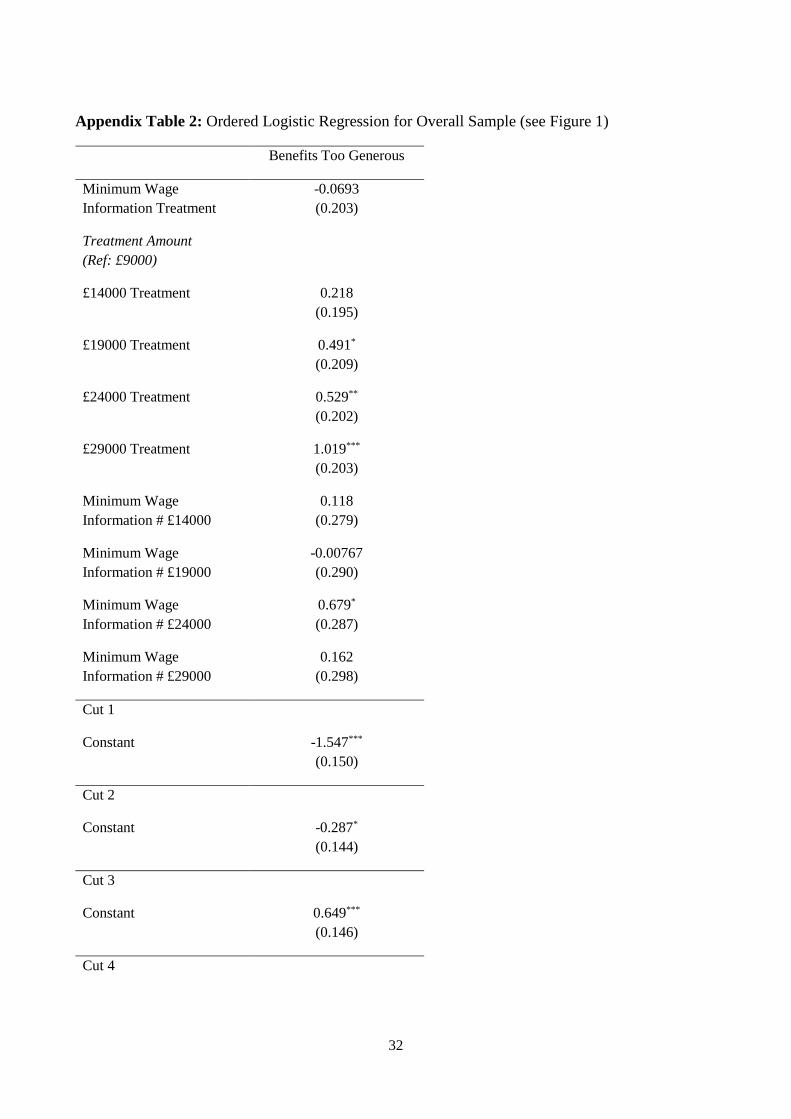
On the basis of these data, we constructed a series of ordered logistic regressions, all of which
incorporate survey design weights. We begin by laying out the overall results from the experiment,
which allow us to assess H1 (without minimum wage information, increasing the claimed level of
benefits will decrease support in a roughly linear fashion) and H2 (claims that benefits are higher
than the minimum wage will reduce support among all respondents). At this point, we want to
know: (1) did respondents change their attitudes regarding welfare generosity as the claimed levels
of benefits increased?; and (2) did information about the minimum wage affect preferences?
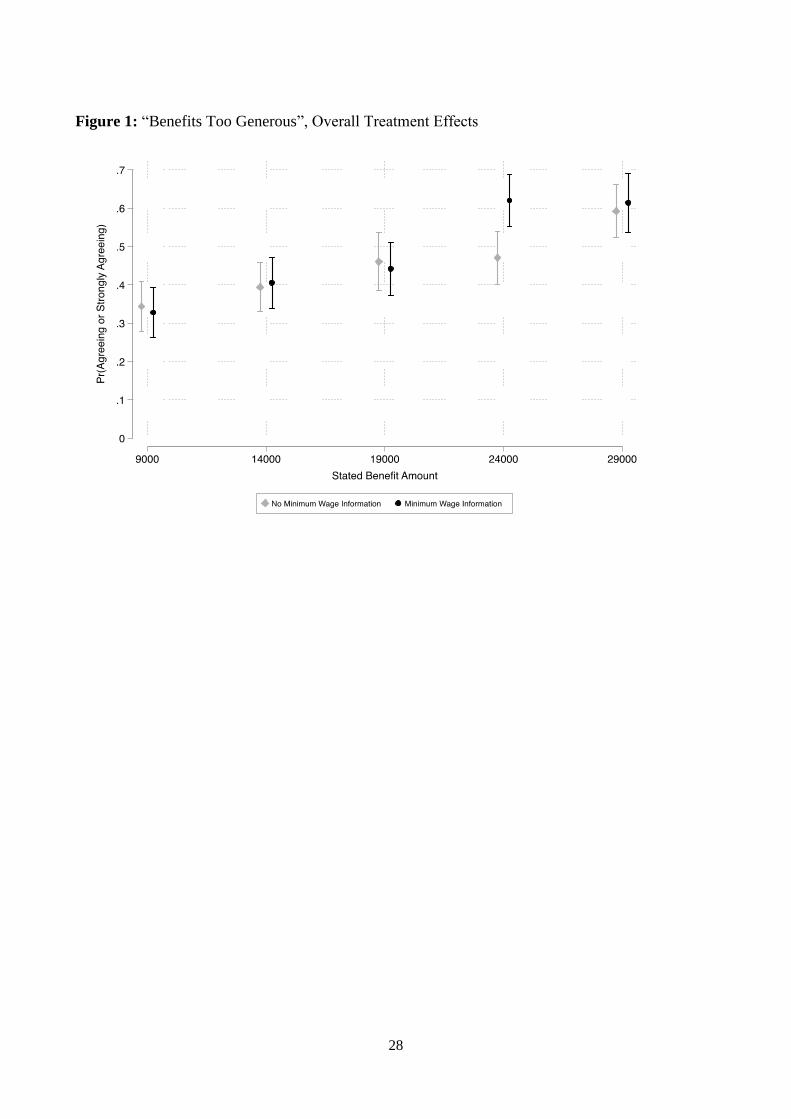
Figure 1 displays the probability of agreement or strong agreement with the statement
“benefits for the typical family on welfare are too generous?”, broken down for each of the 10
treatment groups and with the associated 95% confidence intervals illustrated in each instance.6 On
the horizontal axis we see the levels of claimed benefits (ranging from £9000 to £29 000, with
intervals of £5000). On the vertical axis, one finds the predicted probability of either agreeing or
strongly agreeing that benefits are too generous. Finally, the light grey bars represent those
treatment groups that did not receive information about the minimum wage income, while the black
6 Figures created using the mplotoffset package (Winter, 2017) and plotplainblind (Bischof, 2017).
15
bars represent those that did. Given the setup of survey experiment, results are best illustrated via
figures; here and below, we therefore discuss a set of post-estimation plots, while the tables laying
out the ordered logistic regression results that underlie them are relegated to the appendix (see
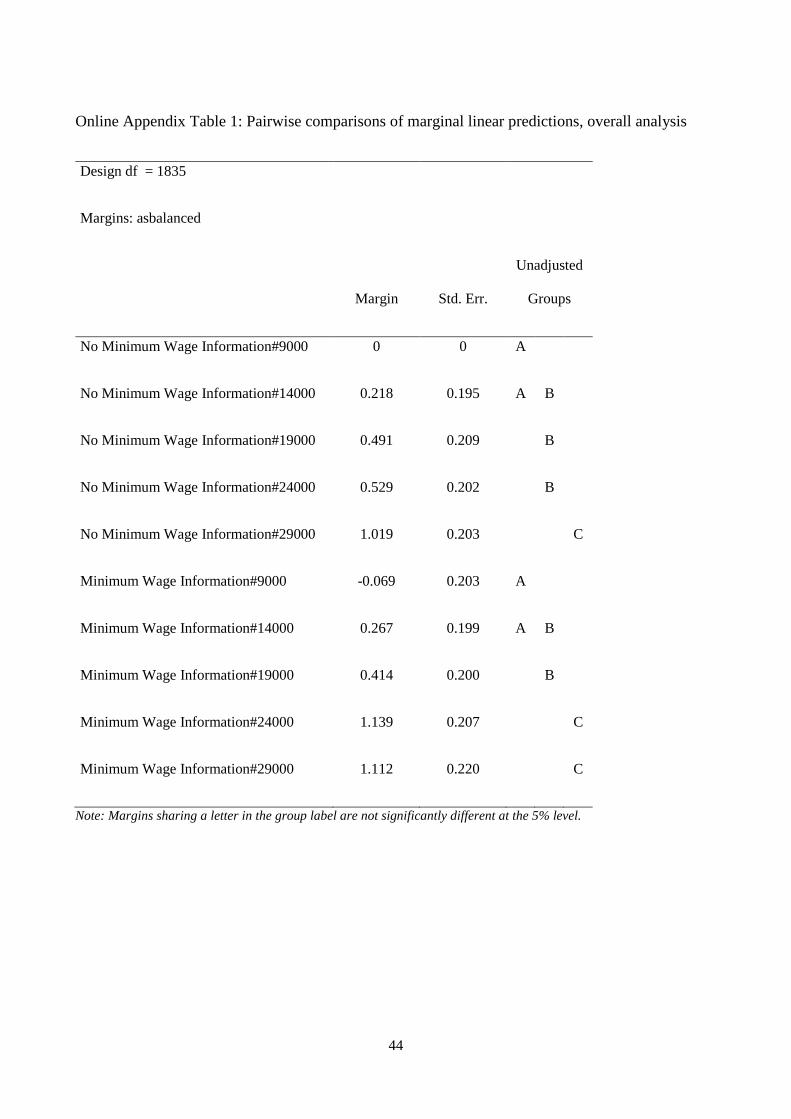
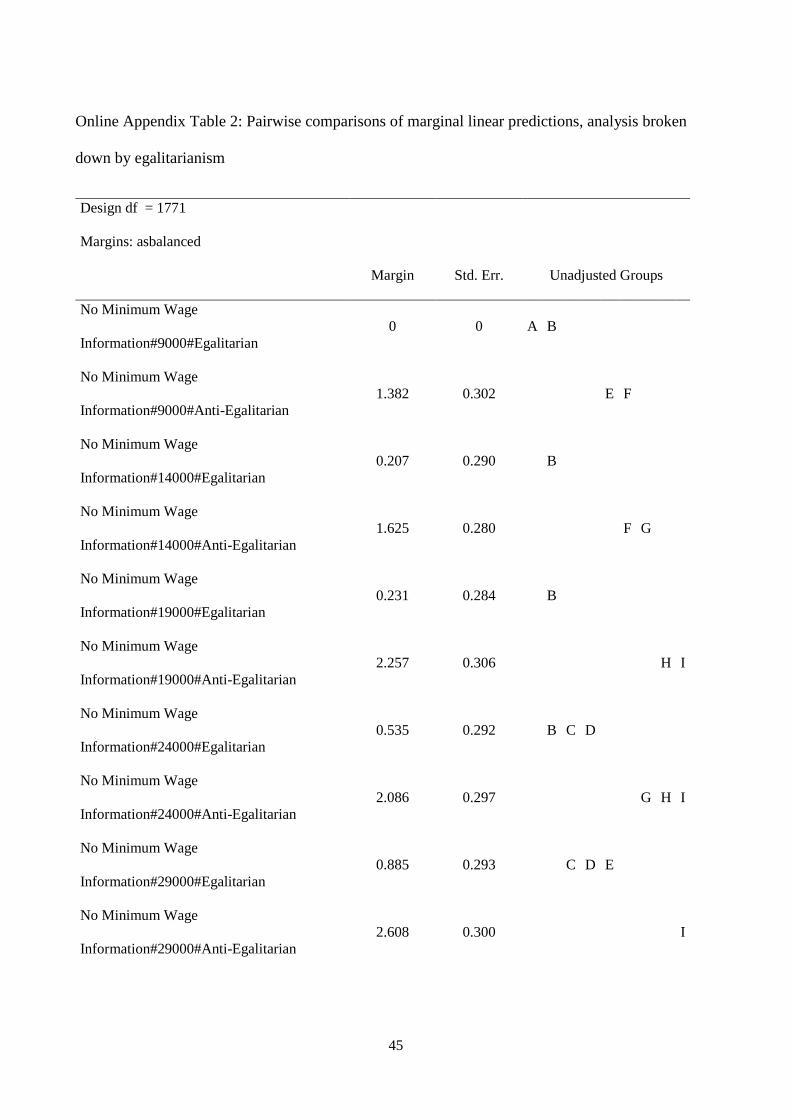
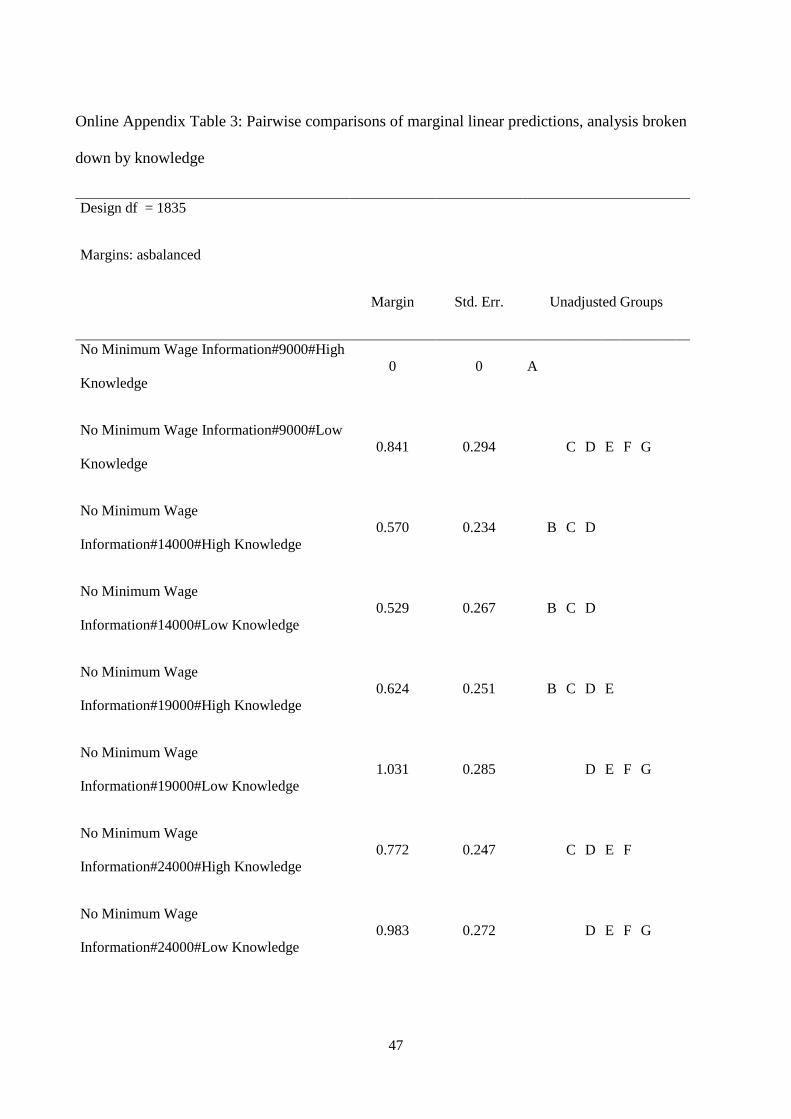
Appendix Tables 2, 3, and 4). Finally, note that pair-wise comparisons are employed throughout the
analysis to ensure the statistical significance of the contrasts discussed below, with the results of
these tests visible in Online Appendix Tables 1, 2, and 3.
[Figure 1 about here]
Several observations are noteworthy. First, across the conditions there is a positive and
roughly linear gradient in the predicted probability of feeling that benefits are too generous. In other
words, the likelihood of thinking benefits are too generous increases gradually, suggesting that the
respondents reflected on the claimed benefits and made up their minds accordingly (as per H1). If
numbers had no informational value for respondents, such a pattern would not be visible, instead
replaced by a flat line (i.e. with high-benefit treatment groups as supportive as low-benefit groups).
Instead, we see that probability of agreement rises from around 0.33 in the £9000 treatment groups
to about 0.61 in the £29 000 treatment group.7
Second, information about the minimum wage income for the “typical family” (here situated
at approximately £19 000) does indeed have an effect (as per H2), but only for the £24 000
treatment group: the probability of agreeing or strongly agreeing moves from 0.47 without the
minimum wage treatment to 0.62 with it (with the difference statistically significant at the p<0.01
7 The 95 percent confidence intervals for the £9000 treatment groups are: .28 to .41 without minimum wage
information; and .26 .to .39 with it. For the £29 000 groups, these values are: .52 to .66 without minimum wage
information; and .54 .to .69 with it.
16
level).8 The effect disappears for the £29 000 treatment group, for which the minimum wage and
non-minimum wage group responses are statistically indistinguishable. The special character of the
£24 000 treatment suggests Britons may be relatively knowledgeable about where low to average
income levels lie. This could be driving our results if respondents generally recognise that,
regardless of whether minimum wage information is included, the £9000, £14 000, and £19 000
benefit figures are clearly low, while the £29 000 figure is clearly high. (Recall that this latter figure
is larger than the median household income in Britain, at about £26 300.) It may be that additional
information, such as on the minimum wage income, is only valuable to respondents when the
claimed benefit level starts to near assumed low- to average-household income levels (i.e., in the
low- to mid-£20 000 range).
It is also noteworthy that respondents do not seem to care if benefits levels are said to be less
than half of the minimum wage income, nor are they bothered if they are equally as generous as the
minimum wage. This latter finding is particularly interesting, as it suggests that people do not buy
into the oft-heard argument that there must be a monetary incentive for the unemployed to accept
jobs at the minimum wage, since that would imply that benefits would have to be lower. Rather,
Figure 1 suggests that people do not want benefit recipients to earn more than those working for the
minimum wage do.
[Figure 2 about here]
8 The 95 percent confidence intervals here are: .40 to .54 without the minimum wage treatment; and .55 to .69 with it.
17
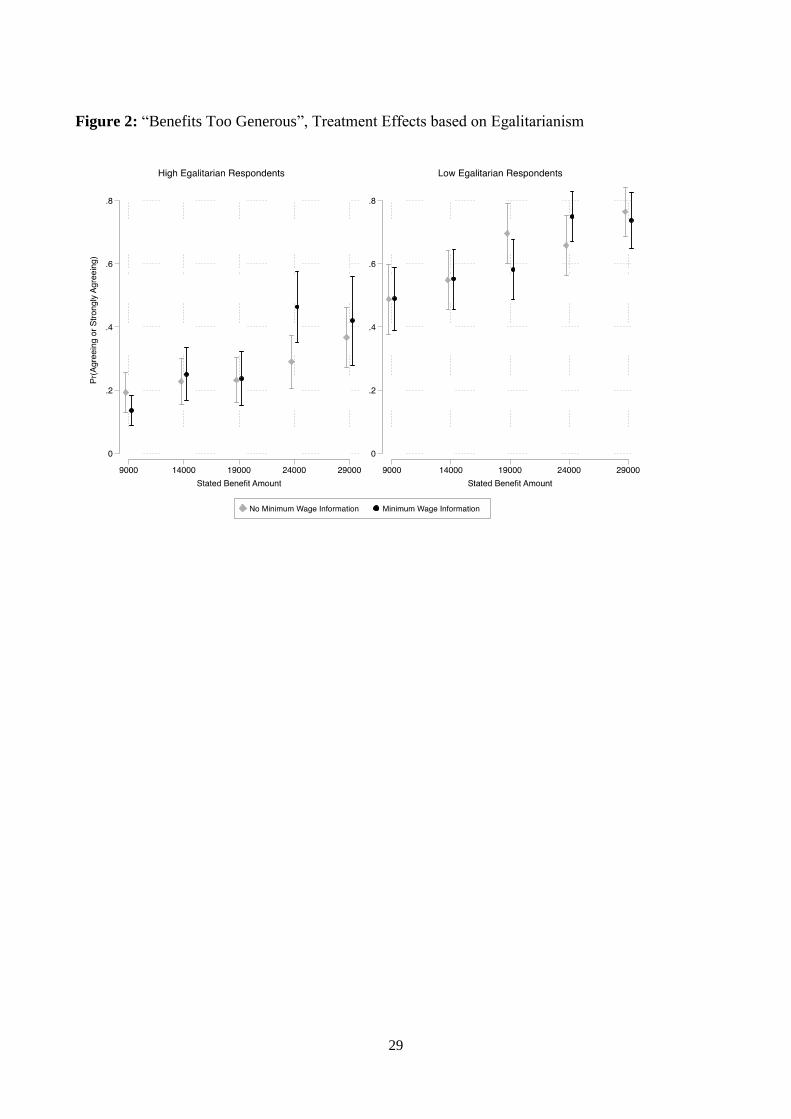
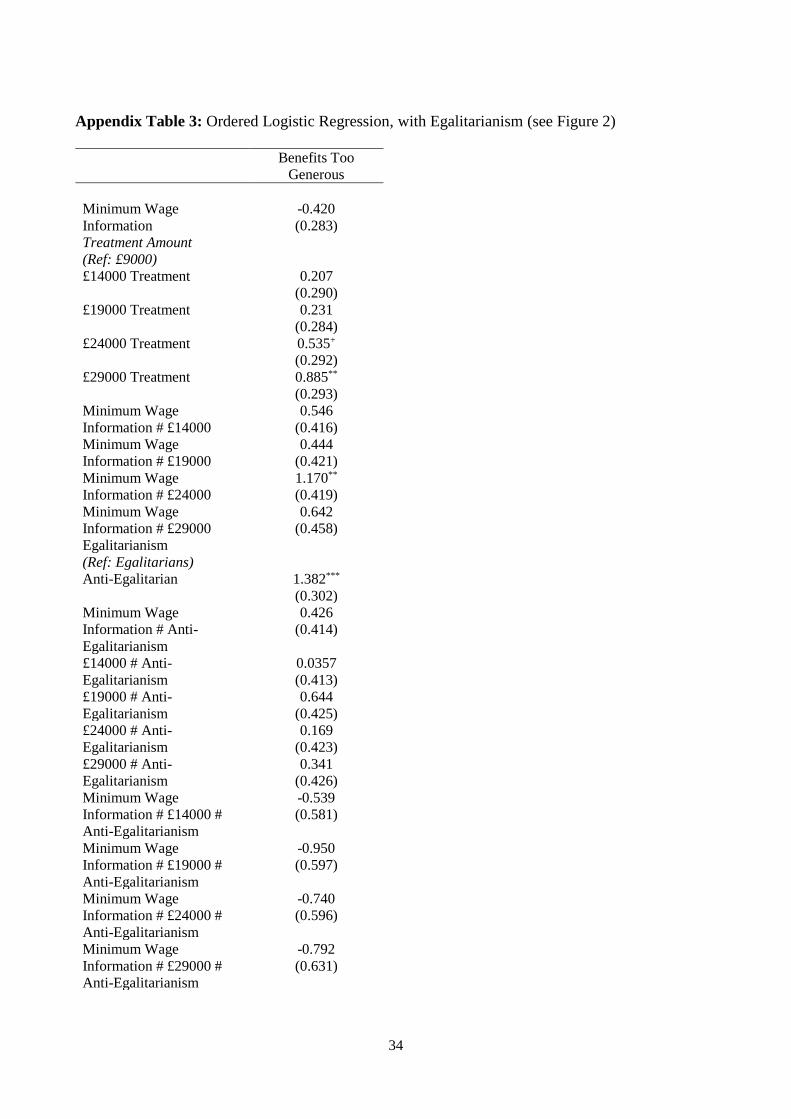
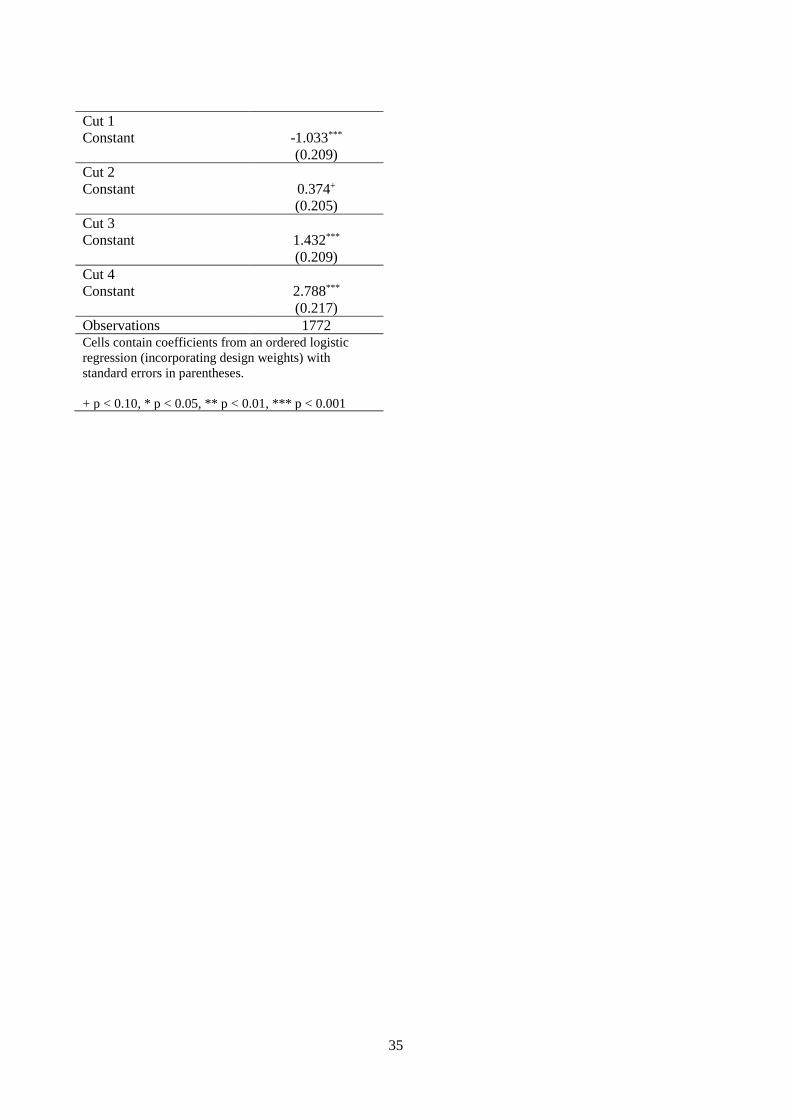
We then break down the treatment effects by egalitarianism.9 This allows us to test H3
(increasing the claimed level of benefits affects anti-egalitarians more than egalitarians), H4 (the
effect of egalitarianism on support is strongest in the absence of information about the minimum
wage) and H5 (claims that benefits are substantially below the minimum wage will lead the
attitudes of egalitarians and anti-egalitarians to diverge).
Figure 2 lays out the probability of agreement or strong agreement across the treatment
groups for egalitarians (on the left panel) and anti-egalitarians (on the right). We begin by noting
that we do not find support for H3: the difference between the £9000 and £29 000 treatment groups
for both egalitarians and anti-egalitarians is just over 0.2, regardless of whether or not minimum
wage information is included. Despite differences in the levels of agreement across the two groups,
the slopes are substantively indistinguishable. This is true regardless of whether minimum wage
information is included, suggesting a lack of support for H4 as well. Indeed, the presence or
absence of minimum wage information makes a limited difference for the effect of egalitarianism,
with the exception of the £24 000 figure (where we find a clear effect only among egalitarians).
Instead, it is primarily when respondents were informed about the minimum wage income
that they responded in a non-linear fashion to increases in the claimed benefit income level. For
egalitarians, the suggestion that benefit income was only £9000 resulted in a lower likelihood of
agreement relative to all other treatment groups when minimum wage information was present. For
anti-egalitarians, by contrast, such a bump occurred only where the asserted benefit levels were
above the minimum wage income (i.e., with the £24 000 and £29 000 amounts), with respondents
considerably more likely to agree that benefits were too generous – but a similar effect is also noted
9 When broken down by egalitarianism, the treatment group samples range in size from 79 (anti-egalitarians with the
£19 000, minimum wage treatment) to 95 (anti-egalitarians with the £9000, no minimum wage treatment), with most
subsamples in the 80s.
18
among egalitarians. (See Online Appendix Table 2 for full details.) On the whole, then, the results
offer partial support for H5.
[Figure 3 about here]
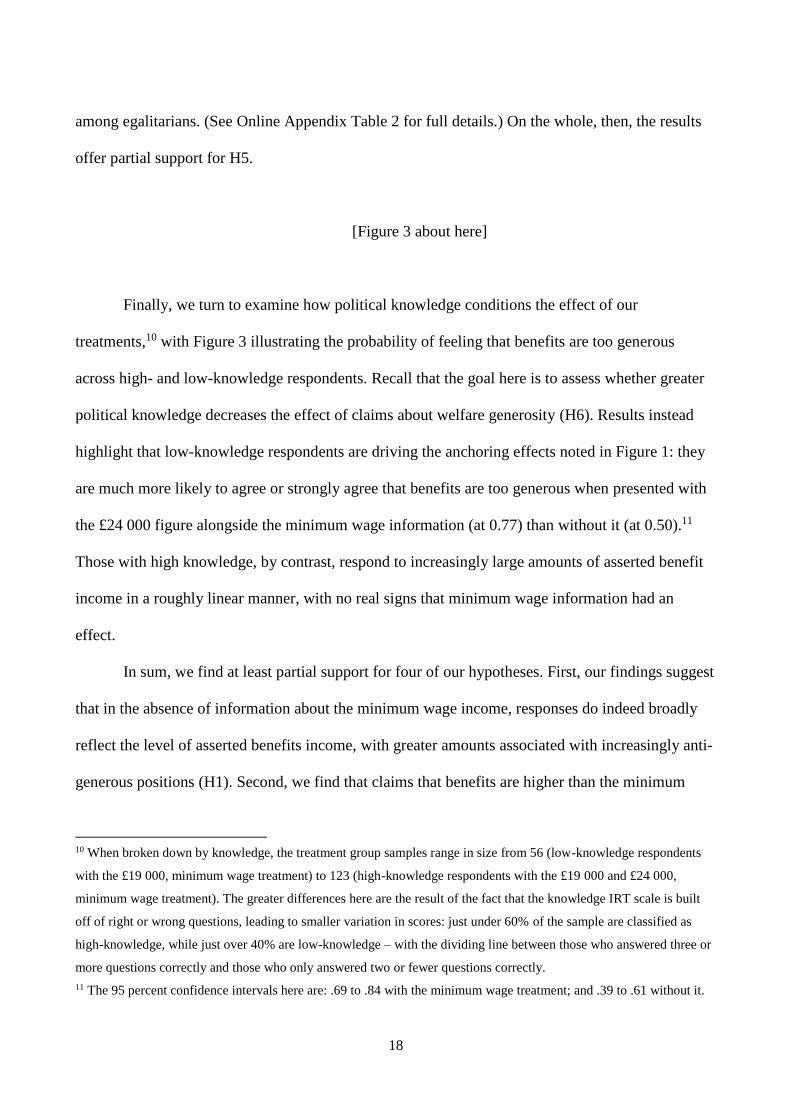
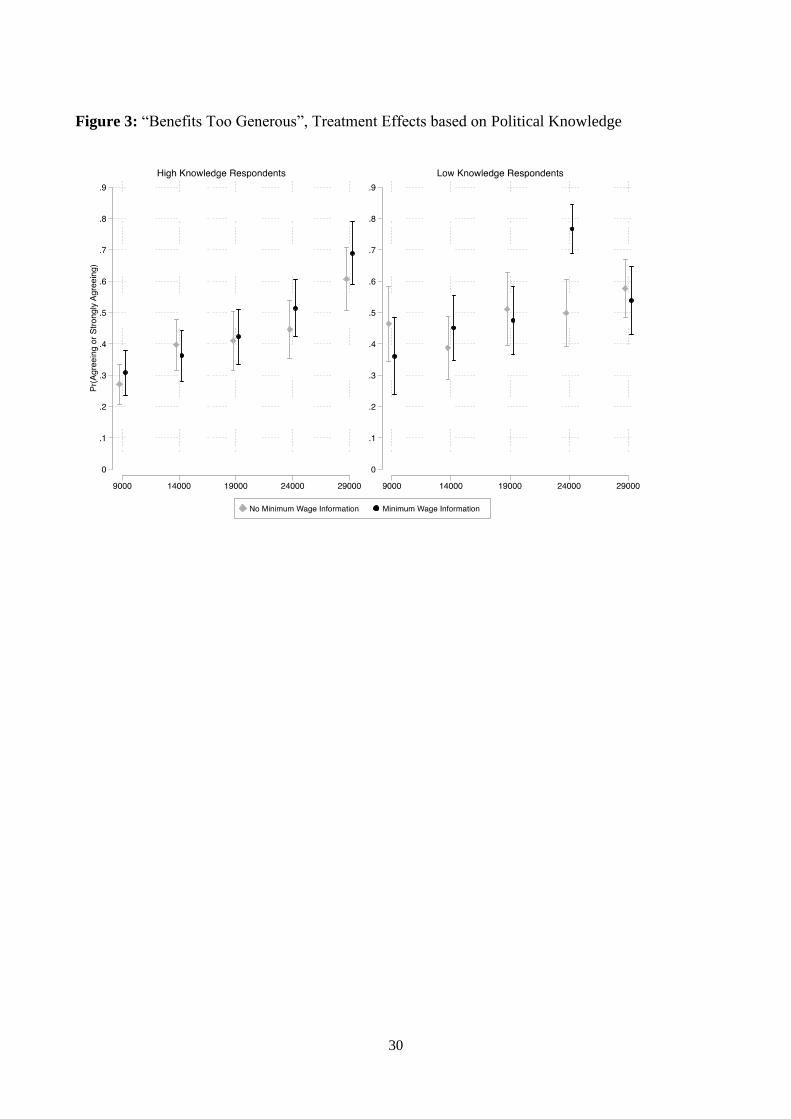
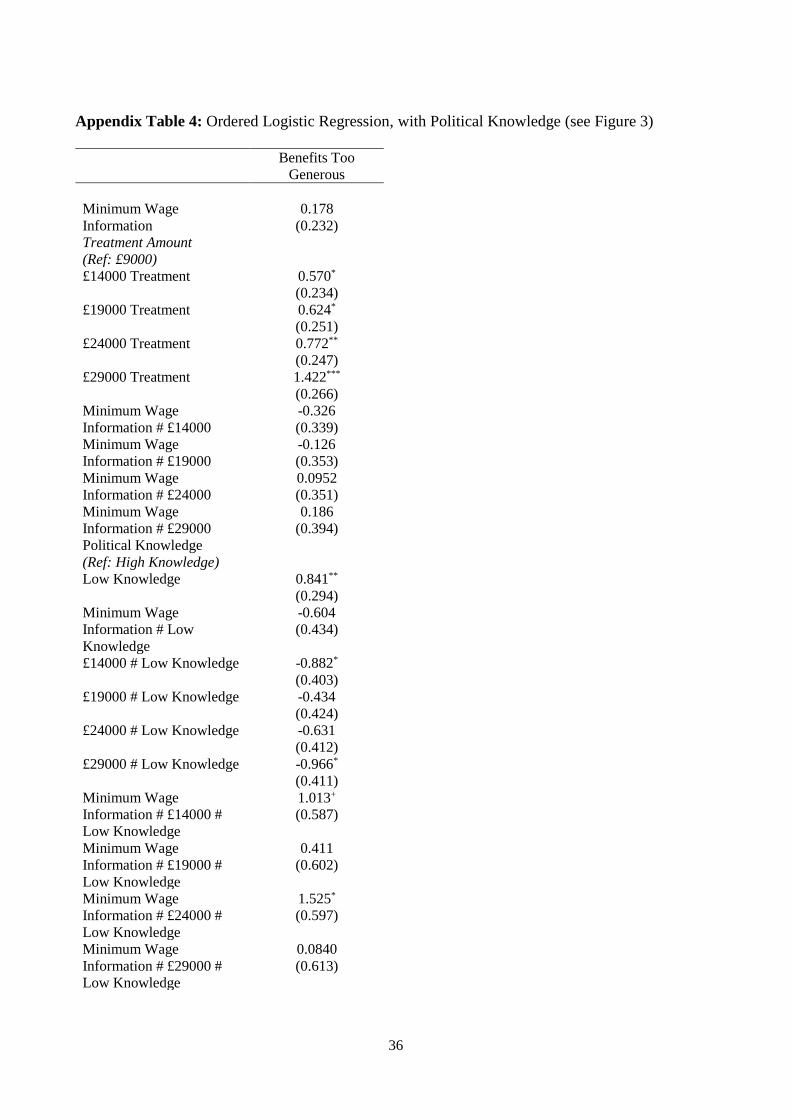
Finally, we turn to examine how political knowledge conditions the effect of our
treatments,10 with Figure 3 illustrating the probability of feeling that benefits are too generous
across high- and low-knowledge respondents. Recall that the goal here is to assess whether greater
political knowledge decreases the effect of claims about welfare generosity (H6). Results instead
highlight that low-knowledge respondents are driving the anchoring effects noted in Figure 1: they
are much more likely to agree or strongly agree that benefits are too generous when presented with
the £24 000 figure alongside the minimum wage information (at 0.77) than without it (at 0.50).11
Those with high knowledge, by contrast, respond to increasingly large amounts of asserted benefit
income in a roughly linear manner, with no real signs that minimum wage information had an
effect.
In sum, we find at least partial support for four of our hypotheses. First, our findings suggest
that in the absence of information about the minimum wage income, responses do indeed broadly
reflect the level of asserted benefits income, with greater amounts associated with increasingly anti-
generous positions (H1). Second, we find that claims that benefits are higher than the minimum
10 When broken down by knowledge, the treatment group samples range in size from 56 (low-knowledge respondents
with the £19 000, minimum wage treatment) to 123 (high-knowledge respondents with the £19 000 and £24 000,
minimum wage treatment). The greater differences here are the result of the fact that the knowledge IRT scale is built
off of right or wrong questions, leading to smaller variation in scores: just under 60% of the sample are classified as
high-knowledge, while just over 40% are low-knowledge – with the dividing line between those who answered three or
more questions correctly and those who only answered two or fewer questions correctly.
11 The 95 percent confidence intervals here are: .69 to .84 with the minimum wage treatment; and .39 to .61 without it.
19
wage reduce support among all respondents (H2), but that this effect is present only with the
£24 000 figure. Third, claims that benefits were substantially below the minimum wage do indeed
appear to lead the attitudes of egalitarians and anti-egalitarians to diverge, though we only see
evidence of this effect with the £9000 figure (H5). Finally, the analysis suggests that high political
knowledge decreases the effect of anchored claims about welfare generosity (H6).
More generally, our results also indicate that information about the minimum wage income
primarily made a difference only with the £24 000 treatment. As highlighted above, one explanation
for this finding could be that Britons on the whole may be capable of assessing the generosity of a
given level of welfare benefits, perhaps because they have a reasonably good sense of where low- to
average-household income levels broadly lie. In support of this interpretation, we observed that the
main effect of the minimum wage information treatment was located among less knowledgeable
respondents. Yet it is of course also possible that this result is simply the product of random noise in
the data, and further research on the matter is therefore required.
At the same time, we find no support for our two remaining hypotheses: increasing the
claimed level of benefits does not impact anti-egalitarians more than egalitarians (H3); and the
effect of egalitarianism on support is not shaped by the presence or absence of information about
the minimum wage (H4). Taken together, the overarching impression is that egalitarianism affects
responses to benefit claims considerably less than one might expect. This is arguably because
people’s egalitarianism is such a powerful guide for policy preferences to begin with.
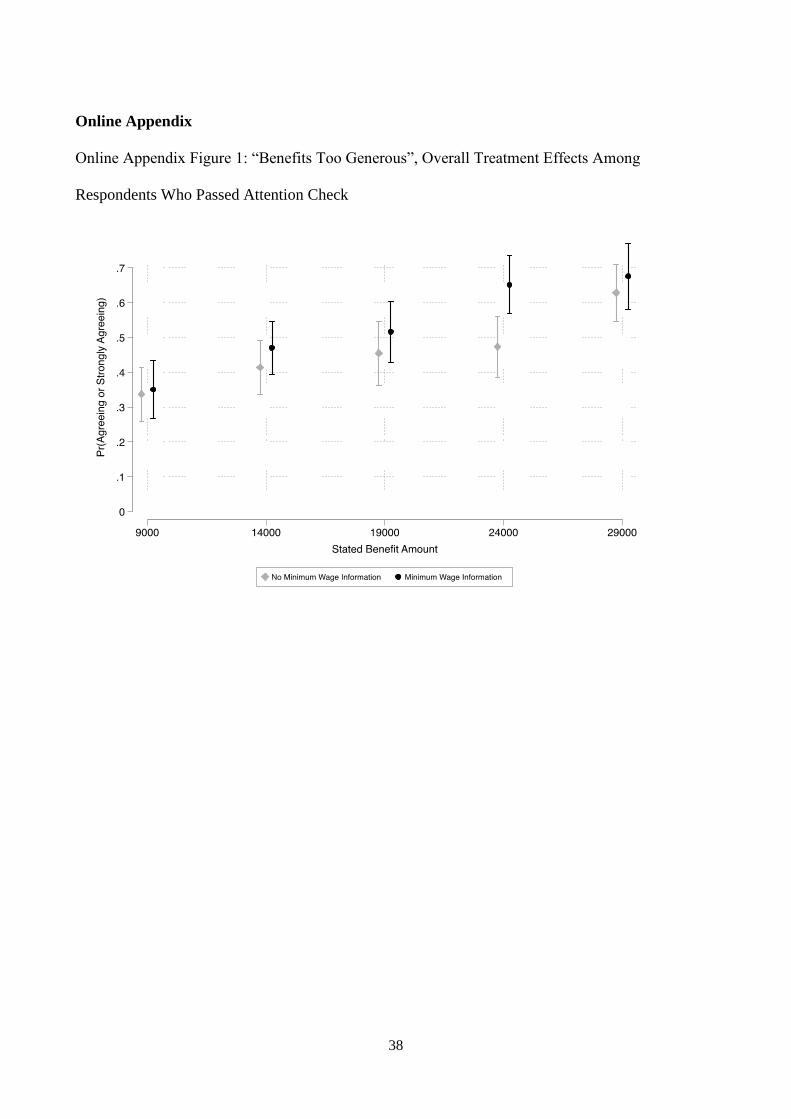
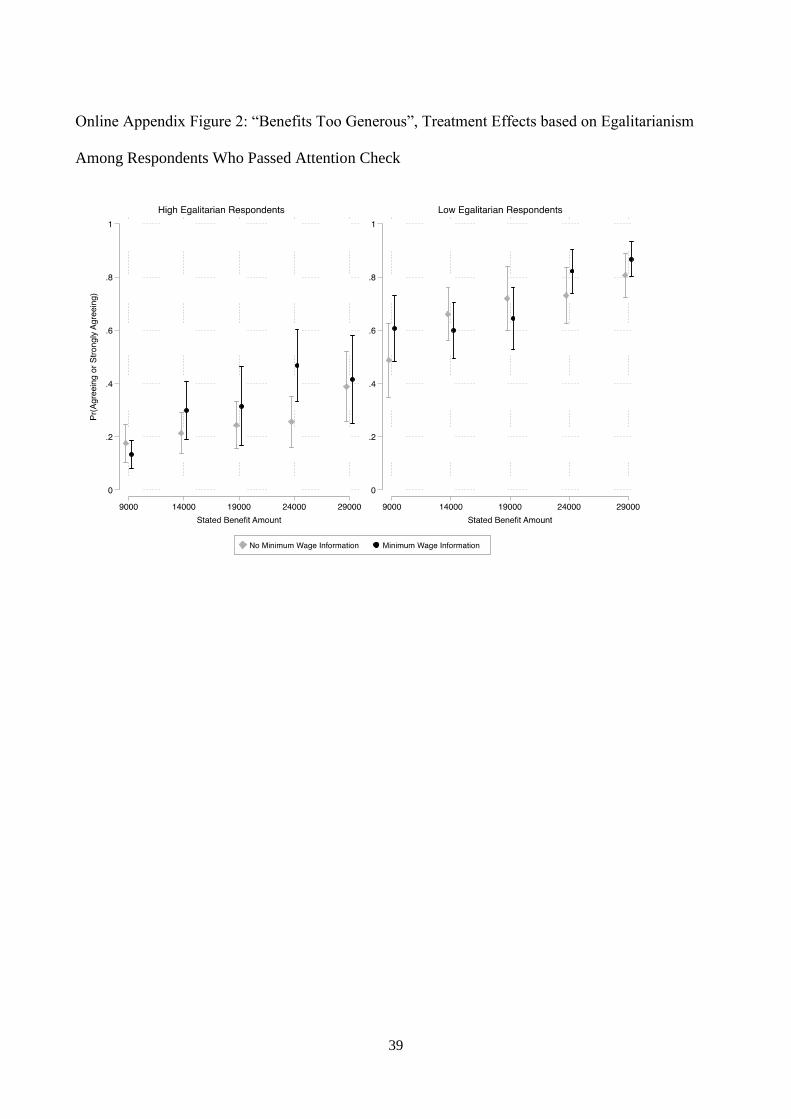
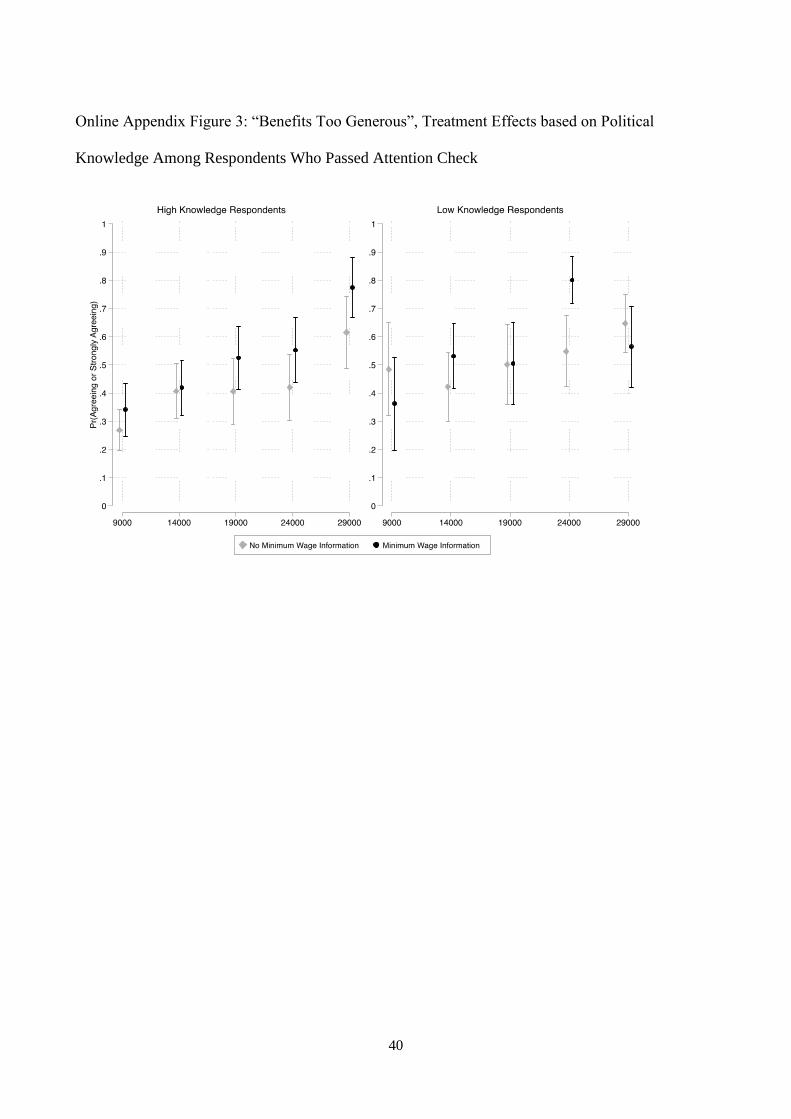
To assess the validity of these findings, we performed several robustness checks. First and
foremost, in order to minimise the risk that our results are spurious, we reran all of the above
analysis on a sample that only included respondents who clearly received the treatment. To do so,
we used responses to an open-ended attention check question asking “About how much does the
typical family on welfare receive in benefits per year?” This question was presented to respondents
20
four questions after the treatment, and just over 65 percent of the sample entered the exact figure
that was stated in their treatment group. Restricting our analysis to that 65 percent clearly reduces
our power substantially, but it does not notably alter the patterns or results presented above. (See
Online Appendix Figures 1, 2, and 3.)
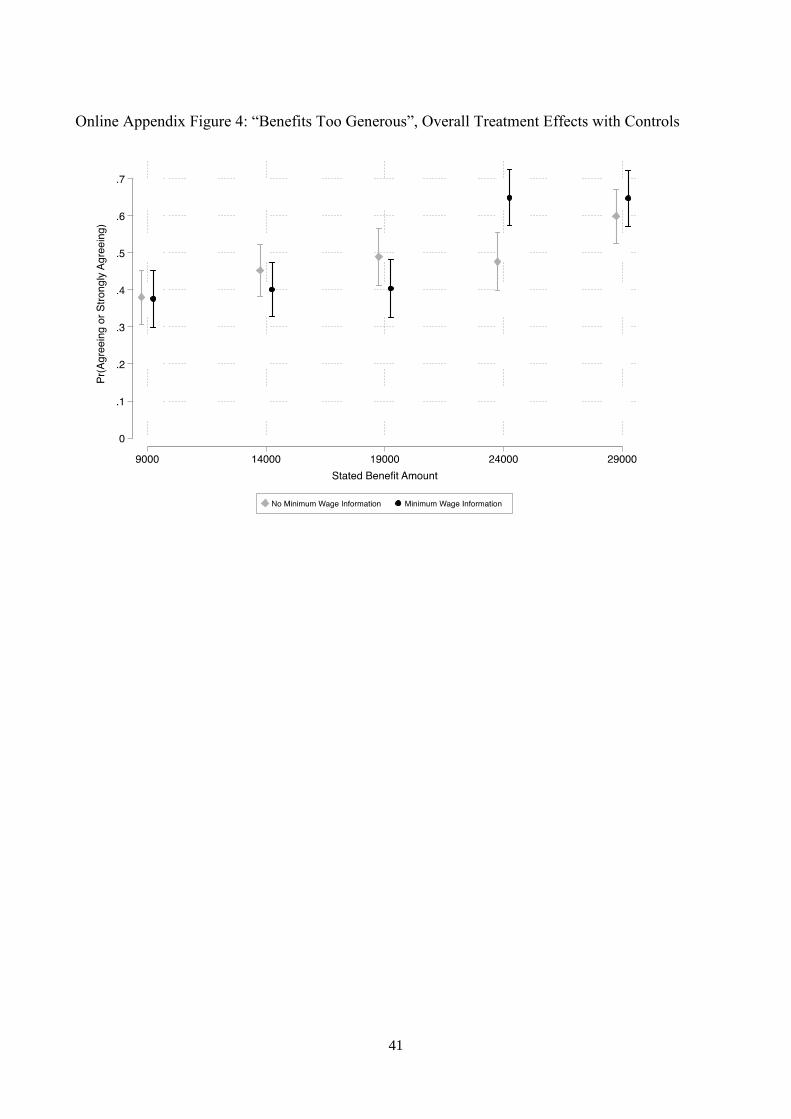
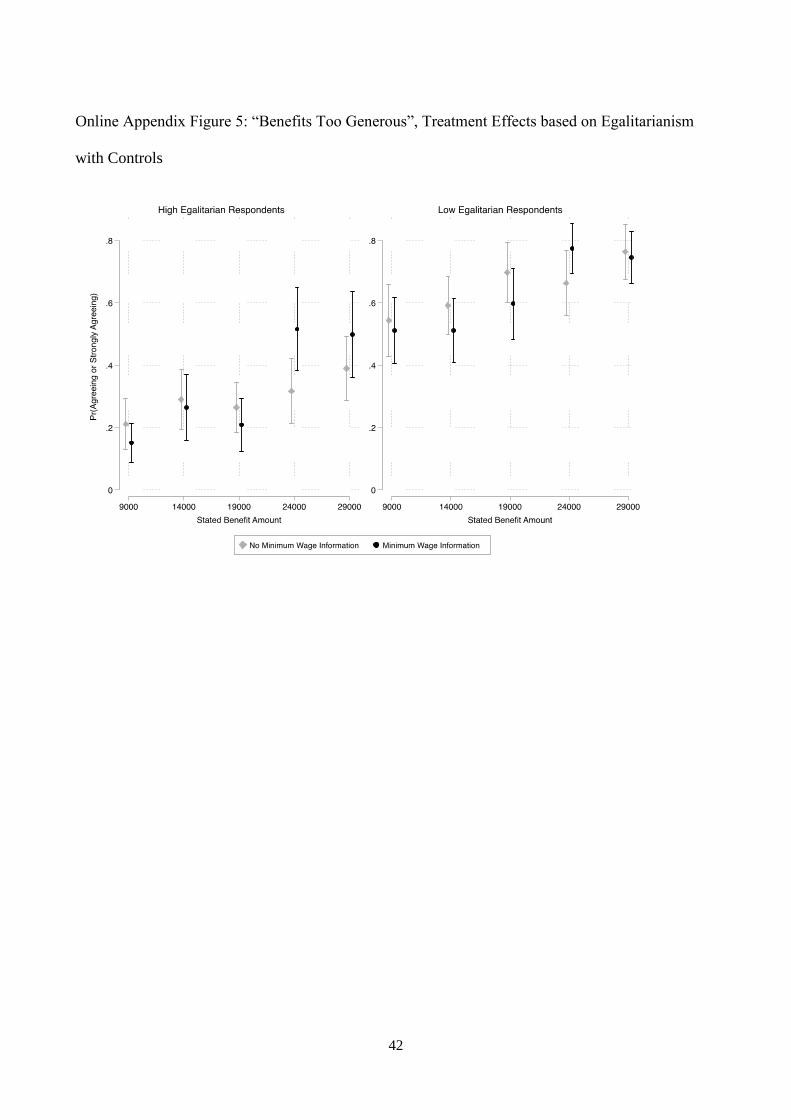
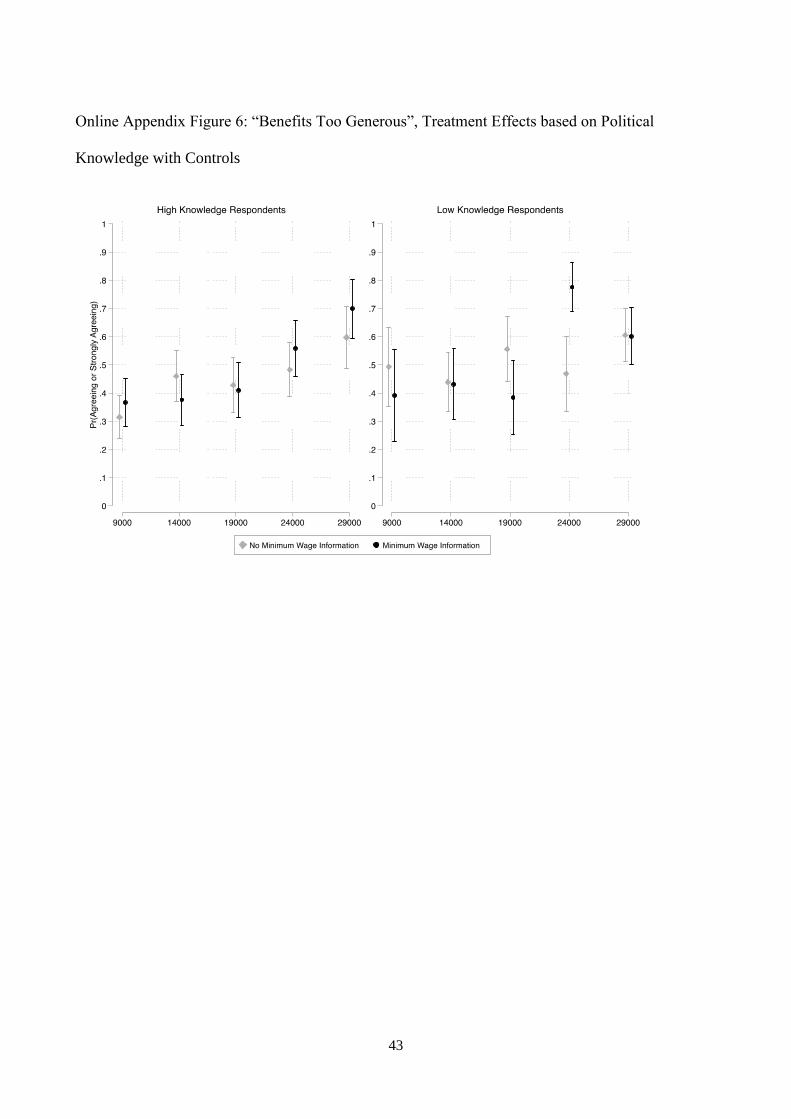
Next, we confirmed that the key results in Figure 1 were unaffected by including controls
for factors related to experienced vulnerability, as this factor may shape responses to asserted
benefit levels. This led us to reconstruct the models from our main analysis with controls for
household income, education levels, geographic region, and having one’s income come primarily
from benefits. As Online Appendix Figures 4, 5, and 6 illustrate, doing so has no meaningful impact
on the results, save for in one instance: responses among egalitarians exposed to the £9000,
£14 000, and £19 000 claims with minimum wage information become statistically
indistinguishable – though these treatment responses still remain distinct from those with higher
claimed values. Finally, we also ensured that smaller potential changes to the modelling had no
impact on the findings. Most notably, this included: constructing the egalitarianism and political
knowledge categories using standard factor analysis rather than IRT; and running logistic (rather
than ordered logistic models), collapsing the dependent variable’s response categories into a binary
variable dividing those who agree from everyone else (leaving aside the “don’t know” category). In
no instance were results substantially effected by the changes.
Conclusion
We began this article with the observation that (inflated) claims about benefit generosity appear to
be a rather commonplace rhetorical weapon employed by politicians. We speculated that claims
such as these are common because politicians and other politically-motivated actors expect they can
generate a sense of outrage with the status quo that will help justify welfare state cutbacks. For
21
better and for worse, the empirical findings reported above suggest that this is a highly viable
strategy: our experiment, conducted on a survey of just under 2000 Britons, indicate that larger
figures stimulate increasingly negative sentiments regardless of pre-existing egalitarianism level.
Our results also suggest that claiming that benefits are more generous than the minimum wage may
boost scepticism toward benefits where the claimed benefit level is not so high as to already strike
citizens as prima facie outrageous (in our study, at £24 000). On that point, it is worth noting that
the highest asserted figure used in the experiment (£29 000) is much lower than some of the real-
life values put forth by prominent politicians such as Ronald Reagan and George Osborne; to the
extent that the public is indeed relatively cognisant of where low- to average-income levels
approximately lie, it seems likely that extremely exaggerated figures may have a limited influence
on attitudes.
From the perspective of the welfare state literature, our findings help us to understand a
long-standing tension drawn out by existing research: the welfare state remains highly popular (e.g.
Jensen, 2014; Jæger, 2012), yet retrenchment has long been a government practice that very
frequently goes unpunished (e.g. Giger and Nelson, 2010; Schumacher et al., 2013). Rather than
suggesting a disconnect between public opinion and welfare reform (c.f. Soroka and Wlezien, 2010;
Brooks and Manza, 2007), our results point to one route politicians may take – despite broadly pro-
welfare state preferences – to garner support for their desired reforms. It is clearly wrongheaded to
equate general expressions of support for the welfare state with support for benefits no matter their
(real or asserted) generosity. In particular, our findings suggest that many people believe benefits
should not be more generous than the minimum wage. The flipside of this result, however, is that
there is limited support for reining in benefits if these are below or even approximately equal to the
minimum wage. One potential explanation for this may be that the minimum wage, at least in a
22
British context, signals the lowest income upon which people can maintain a decent standard of
living.
Overall, our results point to several potentially valuable avenues for future research. On the
one hand, studies might seek to unpack the mechanism(s) driving the effects behind our analysis.
Doing so could involve exploring the economic and/or moral dimensions of citizen preferences that
seem to be in tension with their generally pro-welfare state stances, applying related research (e.g.
Giger and Nelson, 2013; Ryan, 2014) to discussions of political discourse. Such work might also
tap into existing research on labour market vulnerability (e.g. Kevins, 2017; 2018), as an
individual’s risk of going on benefits may well shape their response to asserted benefit levels.
Finally, research in this vein might also help to uncover the explanation behind the seemingly
distinct character of the £24 000 treatment.
On the other hand, our study also highlights the value of research examining the effects of
political rhetoric on these sorts of preferences in the “real world”. In that regard, it could be
especially valuable to investigate the over-time relationship between media discourse and public
opinion, in the process building upon studies focussed on popular welfare myths (e.g. Geiger,
2017a; Geiger and Meueleman, 2016). Such research could also help to address real-world
questions that our experimental setup does not allow us to answer, in the process establishing the
external validity of the findings presented here (see Gaines et al., 2007). Just how durable are the
effects we uncover, for example, and are they robust to the presence of counter-arguments and
counter-frames (e.g. Jerit, 2009)?
Acknowledgements: This paper benefited from helpful feedback provided by Troels Bøggild,
Kristina Jessen Hansen, Lasse Laustsen, Brian Schaffner, James Wilhelm, four anonymous
reviewers, and the editors of Political Studies. The project was made possible thanks to funding

23
from the Department of Political Science at Aarhus University and the Independent Research Fund
Denmark (4003-00013). Anthony Kevins received financial support from a Marie Skłodowska-
Curie Individual Fellowship (750556).
Supplementary Files: Data and do file are available at the Harvard Dataverse.
24
Works Cited:
Allan, J. P. and Scruggs, L. (2004) ‘Political Partisanship and Welfare State Reform in Advanced
Industrial Societies’, American Journal of Political Science, 48 (3): 496-512.
Ansolabehere, S., Meredith, M. and Snowberg, E. (2017) ‘Asking About Numbers: Why and How’,
Political Analysis, 21 (1): 48-69.
Ansolabehere, S. and Schaffner, B. F. (2014) ‘Does Survey Mode Still Matter? Findings from a
2010 Multi-Mode Comparison’, Political Analysis, 22 (3): 285-303.
Bartels, L. M. (2005) ‘Homer Gets a Tax Cut: Inequality and Public Policy in the American Mind’,
Perspectives on Politics, 3 (01): 15-31.
Baumberg, B., Bell, K. and Gaffney, D. (2012) Benefits Stigma in Britain. London, UK: Elizabeth
Finn Care.
Bischof, D. (2017), ‘New Figure Schemes for Stata: Plotplain &Plottig’, The Stata Journal, 17 (3):
748-759.
Brooks, C. and Manza, J. (2007) Why Welfare States Persist: The Importance of Public Opinion in
Democracies. Chicago, IL: The University of Chicago Press.
Chong, D. and Druckman, J. N. (2007) ‘Framing Public Opinion in Competitive Democracies’,
American Political Science Review, 101 (4): 637-655.
Cruces, G., Perez-Truglia, R. and Tetaz, M. (2013) ‘Biased Perceptions of Income Distribution and
Preferences for Redistribution: Evidence from a Survey Experiment’, Journal of Public
Economics, 98 (Supplement C): 100-112.
Curtice, J. (2017) ‘Role of Government’. In: Phillips M, Taylor EA and Simpson I (eds) British
Social Attitudes. 1-18.
Delli Carpini, M. X. and Keeter, S. (1996) What Americans Know About Politics and Why It
Matters. Yale University Press.
Druckman, J. N., Fein, J. and Leeper, T. J. (2012) ‘A Source of Bias in Public Opinion Stability’,
American Political Science Review, 106 (02): 430-454.
Feldman, S. and Johnston, C. (2014) ‘Understanding the Determinants of Political Ideology:
Implications of Structural Complexity’, Political Psychology, 35 (3): 337-358.
Gaines, B. J., Kuklinski, J. H. and Quirk, P. J. (2007) ‘The Logic of the Survey Experiment
Reexamined’, Political Analysis, 15 (1): 1-20.
Geiger, B. B. (2017a) ‘False Beliefs and the Perceived Deservingness of Social Security Benefit
Claimants’. In: Oorschot Wv, Roosma F, Meueleman B, et al. (eds) The Social Legitimacy
of Targeted Welfare: Attitudes to Welfare Deservingness. Cheltenham, UK: Edward Elgar,
73-92.
Gieger, B. B. (2017b). ‘Benefit 'myths'? The accuracy and inaccuracy of public beliefs about the
benefits systems’, Social Policy & Administration, Early View.
Geiger, B. B. and Meueleman, B. (2016) ‘Beyond 'Mythbusting': How to Respond to Myths and
Perceived Undeservingness in the British Benefits System’, Journal of Poverty and Social
Justice, 24 (3): 291-306.
Giger, N. and Nelson, M. (2010) ‘The Electoral Consequences of Welfare State Retrenchment:
Blame Avoidance or Credit Claiming in the Era of Permanent Austerity?’, European
Journal of Political Research, 50 (1): 1-23.
Giger, N. and Nelson, M. (2013) ‘The Welfare State or the Economy? Preferences, Constituencies,
and Strategies for Retrenchment’, European Sociological Review, 29 (5): 1083-1094.
Grönlund, K. and Milner, H. (2006) ‘The Determinants of Political Knowledge in Comparative
Perspective’, Scandinavian Political Studies, 29 (4): 386-406.
25
Jacobs, L. R. and Shapiro, R. Y. (1999) Myths and Misunderstandings About Public Opinion
toward Social Security: Knowledge, Support, and Reformism. Century Foundation.
Jacoby, W. G. (1994) ‘Public Attitudes toward Government Spending’, American Journal of
Political Science, 38 (2): 336-361.
Jæger, M. M. (2012) ‘Do We All (Dis) Like the Same Welfare State? Configurations of Public
Support for the Welfare State in Comparative Perspective’, Changing Social Equality: The
Nordic Welfare Model in the 21st Century: 45.
Jensen, C. (2014) The Right and the Welfare State. Oxford, UK: Oxford University Press.
Jensen, C. and Petersen, M. B. (2017) ‘The Deservingness Heuristic and the Politics of Health
Care’, American Journal of Political Science, 61 (1): 68-83.
Jensen, T., and Tyler, I. (2015). ‘‘Benefits broods’: The cultural and political crafting of anti-
welfare commonsense’, Critical Social Policy, 35 (4): 470-491.
Jerit, J. (2009) ‘How Predictive Appeals Affect Policy Opinions’, American Journal of Political
Science, 53 (2): 411-426.
Kaplan, D. (2004) The Sage Handbook of Quantitative Methodology for the Social Sciences. Sage.
Kennedy, S., Wilson, W., Apostolova, V., et al. (2016) The Benefit Cap. London, UK: House of
Commons Library.
Kevins, A. (2017) Expanding Welfare in an Age of Austerity: Increasing Protection in an
Unprotected World. Amsterdam, NL: Amsterdam University Press.
Kevins, A. (2018) ‘Dualized Trust: Risk, Social Trust and the Welfare State’, Socio-Economic
Review, OnlineFirst.
Korpi, W. and Palme, J. (2003) ‘New Politics and Class Politics in the Context of Austerity and
Globalization: Welfare State Regress in 18 Countries, 1975-95’, American Political Science
Review, 97 (3): 425-446.
Kuklinski, J., Quirk, P. J., Jerit, J., et al. (2000). ‘Misinformation and the currency of democratic
citizenship’, Journal of Politics, 62 (3): 790-816.
Lawrence, E. D. and Sides, J. (2014) ‘The Consequences of Political Innumeracy’, Research &
Politics, 1 (2): 1-8.
Lee, S., Jensen, C., Arndt, C., et al. (2017) ‘Risky Business? Welfare State Reforms and
Government Support in Britain and Denmark’, British Journal of Political Science: 1-20.
Leeper, T., and Slothuus, R. (2017). Can Citizens Be Framed? How Information More than
Emphasis Changes Opinions. Working paper.
Lergetporer, P., Schwerdt, G., Werner, K., et al. (2016). Information and Preferences for Public
Spending: Evidence from Representative Survey Experiments. Bonn: IZA.
Naumann, E. (2017) ‘Do Increasing Reform Pressures Change Welfare State Attitudes? An
Experimental Study on Population Ageing, Pension Reform Preferences, Political
Knowledge and Ideology’, Ageing and Society, 37 (2): 266-294.
Nelson, K. (2011) ‘Social Assistance and Eu Poverty Thresholds 1990–2008: Are European
Welfare Systems Providing Just and Fair Protection against Low Income?’, European
Sociological Review, first published online October 5, 2011 doi:10.1093/esr/jcr080.
Norton, M. I. and Ariely, D. (2011) ‘Building a Better America—One Wealth Quintile at a Time’,
Perspectives on Psychological Science, 6 (1): 9-12.
Petersen, M. B. (2015) ‘Evolutionary Political Psychology: On the Origin and Structure of
Heuristics and Biases in Politics’, Political Psychology, 36 (S1): 45-78.
Petersen, M. B., Slothuus, R., Stubager, R., et al. (2011) ‘Deservingness Versus Values in Public
Opinion on Welfare: The Automaticity of the Deservingness Heuristic’, European Journal
of Political Research, 50 (1): 24-52.
26
Pierson, P. (1994) Dismantling the Welfare State? Reagan, Thatcher, and the Politics of
Retrenchment. Cambridge, UK: Cambridge University Press.
Ryan, T. J. (2014) ‘Reconsidering Moral Issues in Politics’, The Journal of Politics, 76 (2): 380-
397.
Schumacher, G., Vis, B. and van Kersbergen, K. (2013) ‘Political Parties’ Welfare Image, Electoral
Punishment and Welfare State Retrenchment’, Comparative European Politics, 11 (1): 1-21.
Skitka, L. J. and Tetlock, P. E. (1993) ‘Providing Public Assistance: Cognitive and Motivational
Processes Underlying Liberal and Conservative Policy Preferences’, Journal of Personality
and Social Psychology, 65 (6): 1205-1223.
Slothuus, R. (2007) ‘Framing Deservingness to Win Support for Welfare State Retrenchment’,
Scandinavian Political Studies, 30 (3): 323-344.
Soroka, S. N. and Wlezien, C. (2010) Degrees of Democracy: Politics, Public Opinion, and Policy.
New York, NY: Cambridge University Press.
Stanley, L. and Hartman, T. K. (2017). ‘Tax preferences, fiscal transparency, and the meaning of
welfare: An experimental study’, Political Studies, early view.
Taber, C. S. and Lodge, M. (2006) ‘Motivated Skepticism in the Evaluation of Political Beliefs’,
American Journal of Political Science, 50 (3): 755-769.
Taylor‐Gooby, P., Hastie, C. and Bromley, C. (2003) ‘Querulous Citizens: Welfare Knowledge and
the Limits to Welfare Reform’, Social Policy & Administration, 37 (1): 1-20.
Treier, S. and Hillygus, D. S. (2009) ‘The Nature of Political Ideology in the Contemporary
Electorate’, Public Opinion Quarterly, 73 (4): 679-703.
Van Oorschot, W. (2006) ‘Making the Difference in Social Europe: Deservingness Perceptions
among Citizens of European Welfare States’, Journal of European Social Policy, 16 (1): 23-
42.
Wenzelburger, G. and Hörisch, F. (2016) ‘Framing Effects and Comparative Social Policy Reform:
Comparing Blame Avoidance Evidence from Two Experiments’, Journal of Comparative
Policy Analysis: Research and Practice, 18 (2): 157-175.
Winter, N. (2017) ‘MPLOTOFFSET: Stata module to produce marginsplots with offset plotting
symbols’, Statistical Software Components S458344, Boston College Department of
Economics.
Zaller, J. (1992) The Nature and Origins of Mass Opinion. Cambridge, UK: Cambridge university
press.
Zaller, J. and Feldman, S. (1992) ‘A Simple Theory of the Survey Response: Answering Questions
Versus Revealing Preferences’, American Journal of Political Science, 36 (3): 579-616.
27
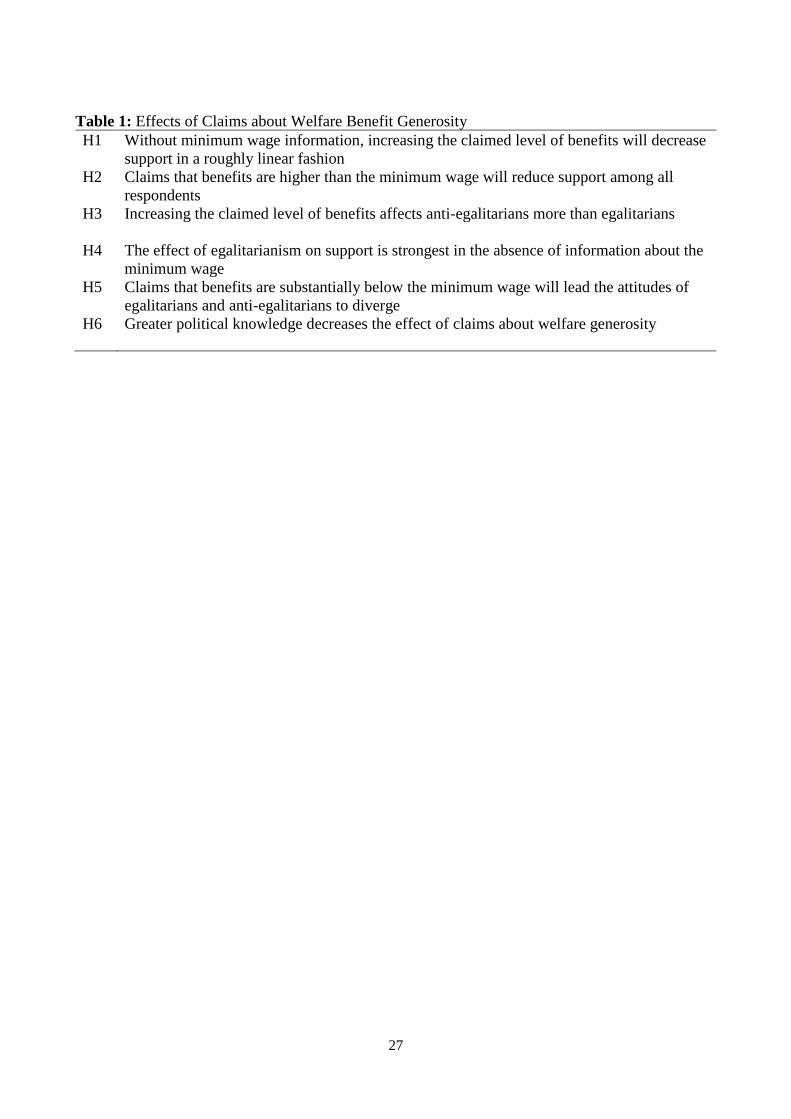
Table 1: Effects of Claims about Welfare Benefit Generosity
H1 Without minimum wage information, increasing the claimed level of benefits will decrease
support in a roughly linear fashion
H2 Claims that benefits are higher than the minimum wage will reduce support among all
respondents
H3 Increasing the claimed level of benefits affects anti-egalitarians more than egalitarians
H4 The effect of egalitarianism on support is strongest in the absence of information about the
minimum wage
H5 Claims that benefits are substantially below the minimum wage will lead the attitudes of
egalitarians and anti-egalitarians to diverge
H6 Greater political knowledge decreases the effect of claims about welfare generosity
28
Figure 1: “Benefits Too Generous”, Overall Treatment Effects
29
Figure 2: “Benefits Too Generous”, Treatment Effects based on Egalitarianism
30
Figure 3: “Benefits Too Generous”, Treatment Effects based on Political Knowledge
31
Appendix Table 1: Sample Size across Treatment Groups
No Minimum
Wage
Information
Minimum
Wage
Information
Total
£9000 185 180 365
£14000 180 188 368
£19000 182 179 361
£24000 182 186 368
£29000 191 183 374
Total 920 916 1836
32
Appendix Table 2: Ordered Logistic Regression for Overall Sample (see Figure 1)
Benefits Too Generous
Minimum Wage
Information Treatment
-0.0693
(0.203)
Treatment Amount
(Ref: £9000)
£14000 Treatment 0.218
(0.195)
£19000 Treatment 0.491*
(0.209)
£24000 Treatment 0.529**
(0.202)
£29000 Treatment 1.019***
(0.203)
Minimum Wage
Information # £14000
0.118
(0.279)
Minimum Wage
Information # £19000
-0.00767
(0.290)
Minimum Wage
Information # £24000
0.679*
(0.287)
Minimum Wage
Information # £29000
0.162
(0.298)
Cut 1
Constant -1.547***
(0.150)
Cut 2
Constant -0.287*
(0.144)
Cut 3
Constant 0.649***
(0.146)
Cut 4

33
Constant 1.895***
(0.155)
Observations 1836
Cells contain coefficients from an ordered logistic regression
(incorporating design weights) with standard errors in
parentheses.
+ p < 0.10, * p < 0.05, ** p < 0.01, *** p < 0.001
34
Appendix Table 3: Ordered Logistic Regression, with Egalitarianism (see Figure 2)
Benefits Too
Generous
Minimum Wage
Information
-0.420
(0.283)
Treatment Amount
(Ref: £9000)
£14000 Treatment 0.207
(0.290)
£19000 Treatment 0.231
(0.284)
£24000 Treatment 0.535+
(0.292)
£29000 Treatment 0.885**
(0.293)
Minimum Wage
Information # £14000
0.546
(0.416)
Minimum Wage
Information # £19000
0.444
(0.421)
Minimum Wage
Information # £24000
1.170**
(0.419)
Minimum Wage
Information # £29000
0.642
(0.458)
Egalitarianism
(Ref: Egalitarians)
Anti-Egalitarian 1.382***
(0.302)
Minimum Wage
Information # Anti-
Egalitarianism
0.426
(0.414)
£14000 # Anti-
Egalitarianism
0.0357
(0.413)
£19000 # Anti-
Egalitarianism
0.644
(0.425)
£24000 # Anti-
Egalitarianism
0.169
(0.423)
£29000 # Anti-
Egalitarianism
0.341
(0.426)
Minimum Wage
Information # £14000 #
Anti-Egalitarianism
-0.539
(0.581)
Minimum Wage
Information # £19000 #
Anti-Egalitarianism
-0.950
(0.597)
Minimum Wage
Information # £24000 #
Anti-Egalitarianism
-0.740
(0.596)
Minimum Wage
Information # £29000 #
Anti-Egalitarianism
-0.792
(0.631)
35
Cut 1
Constant -1.033***
(0.209)
Cut 2
Constant 0.374+
(0.205)
Cut 3
Constant 1.432***
(0.209)
Cut 4
Constant 2.788***
(0.217)
Observations 1772 Cells contain coefficients from an ordered logistic
regression (incorporating design weights) with
standard errors in parentheses.
+ p < 0.10, * p < 0.05, ** p < 0.01, *** p < 0.001
36
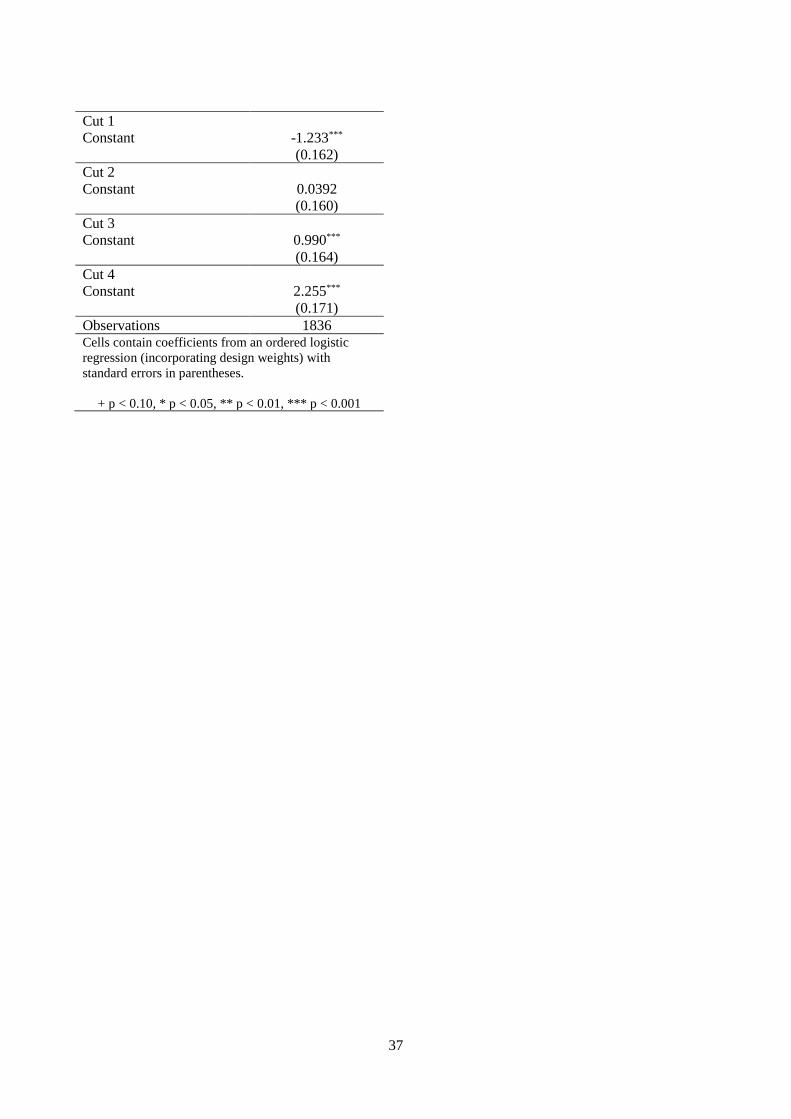
Appendix Table 4: Ordered Logistic Regression, with Political Knowledge (see Figure 3)
Benefits Too
Generous
Minimum Wage
Information
0.178
(0.232)
Treatment Amount
(Ref: £9000)
£14000 Treatment 0.570*
(0.234)
£19000 Treatment 0.624*
(0.251)
£24000 Treatment 0.772**
(0.247)
£29000 Treatment 1.422***
(0.266)
Minimum Wage
Information # £14000
-0.326
(0.339)
Minimum Wage
Information # £19000
-0.126
(0.353)
Minimum Wage
Information # £24000
0.0952
(0.351)
Minimum Wage
Information # £29000
0.186
(0.394)
Political Knowledge
(Ref: High Knowledge)
Low Knowledge 0.841**
(0.294)
Minimum Wage
Information # Low
Knowledge
-0.604
(0.434)
£14000 # Low Knowledge -0.882*
(0.403)
£19000 # Low Knowledge -0.434
(0.424)
£24000 # Low Knowledge -0.631
(0.412)
£29000 # Low Knowledge -0.966*
(0.411)
Minimum Wage
Information # £14000 #
Low Knowledge
1.013+
(0.587)
Minimum Wage
Information # £19000 #
Low Knowledge
0.411
(0.602)
Minimum Wage
Information # £24000 #
Low Knowledge
1.525*
(0.597)
Minimum Wage
Information # £29000 #
Low Knowledge
0.0840
(0.613)
37
Cut 1
Constant -1.233***
(0.162)
Cut 2
Constant 0.0392
(0.160)
Cut 3
Constant 0.990***
(0.164)
Cut 4
Constant 2.255***
(0.171)
Observations 1836 Cells contain coefficients from an ordered logistic
regression (incorporating design weights) with
standard errors in parentheses.
+ p < 0.10, * p < 0.05, ** p < 0.01, *** p < 0.001
38
Online Appendix
Online Appendix Figure 1: “Benefits Too Generous”, Overall Treatment Effects Among
Respondents Who Passed Attention Check
39
Online Appendix Figure 2: “Benefits Too Generous”, Treatment Effects based on Egalitarianism
Among Respondents Who Passed Attention Check
40
Online Appendix Figure 3: “Benefits Too Generous”, Treatment Effects based on Political
Knowledge Among Respondents Who Passed Attention Check
41
Online Appendix Figure 4: “Benefits Too Generous”, Overall Treatment Effects with Controls
42
Online Appendix Figure 5: “Benefits Too Generous”, Treatment Effects based on Egalitarianism
with Controls
43
Online Appendix Figure 6: “Benefits Too Generous”, Treatment Effects based on Political
Knowledge with Controls
44
Online Appendix Table 1: Pairwise comparisons of marginal linear predictions, overall analysis
Design df = 1835
Margins: asbalanced
Margin Std. Err.
Unadjusted
Groups
No Minimum Wage Information#9000 0 0 A
No Minimum Wage Information#14000 0.218 0.195 A B
No Minimum Wage Information#19000 0.491 0.209
B
No Minimum Wage Information#24000 0.529 0.202
B
No Minimum Wage Information#29000 1.019 0.203
C
Minimum Wage Information#9000 -0.069 0.203 A
Minimum Wage Information#14000 0.267 0.199 A B
Minimum Wage Information#19000 0.414 0.200
B
Minimum Wage Information#24000 1.139 0.207
C
Minimum Wage Information#29000 1.112 0.220
C
Note: Margins sharing a letter in the group label are not significantly different at the 5% level.
45
Online Appendix Table 2: Pairwise comparisons of marginal linear predictions, analysis broken
down by egalitarianism
Design df = 1771
Margins: asbalanced
Margin Std. Err. Unadjusted Groups
No Minimum Wage
Information#9000#Egalitarian
0 0 A B
No Minimum Wage
Information#9000#Anti-Egalitarian
1.382 0.302 E F
No Minimum Wage
Information#14000#Egalitarian
0.207 0.290 B
No Minimum Wage
Information#14000#Anti-Egalitarian
1.625 0.280 F G
No Minimum Wage
Information#19000#Egalitarian
0.231 0.284 B
No Minimum Wage
Information#19000#Anti-Egalitarian
2.257 0.306 H I
No Minimum Wage
Information#24000#Egalitarian
0.535 0.292 B C D
No Minimum Wage
Information#24000#Anti-Egalitarian
2.086 0.297 G H I
No Minimum Wage
Information#29000#Egalitarian
0.885 0.293 C D E
No Minimum Wage
Information#29000#Anti-Egalitarian
2.608 0.300 I
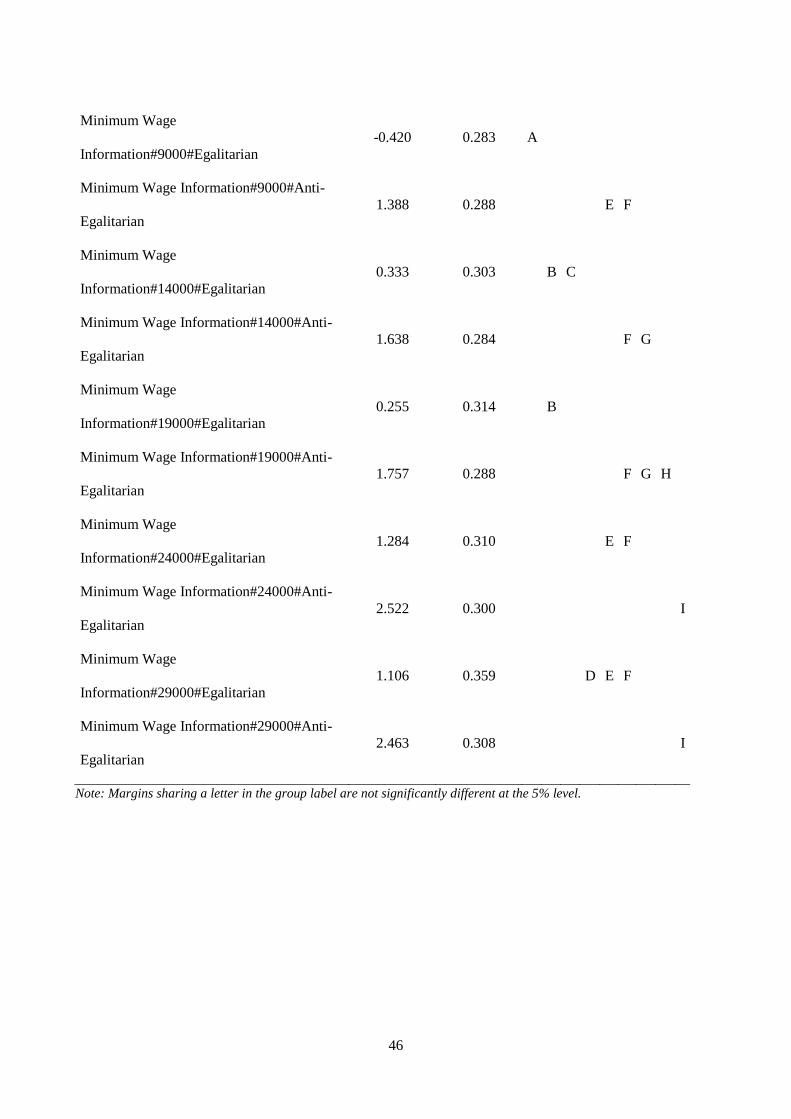
46
Minimum Wage
Information#9000#Egalitarian
-0.420 0.283 A
Minimum Wage Information#9000#Anti-
Egalitarian
1.388 0.288 E F
Minimum Wage
Information#14000#Egalitarian
0.333 0.303 B C
Minimum Wage Information#14000#Anti-
Egalitarian
1.638 0.284 F G
Minimum Wage
Information#19000#Egalitarian
0.255 0.314 B
Minimum Wage Information#19000#Anti-
Egalitarian
1.757 0.288 F G H
Minimum Wage
Information#24000#Egalitarian
1.284 0.310 E F
Minimum Wage Information#24000#Anti-
Egalitarian
2.522 0.300 I
Minimum Wage
Information#29000#Egalitarian
1.106 0.359 D E F
Minimum Wage Information#29000#Anti-
Egalitarian
2.463 0.308 I
Note: Margins sharing a letter in the group label are not significantly different at the 5% level.
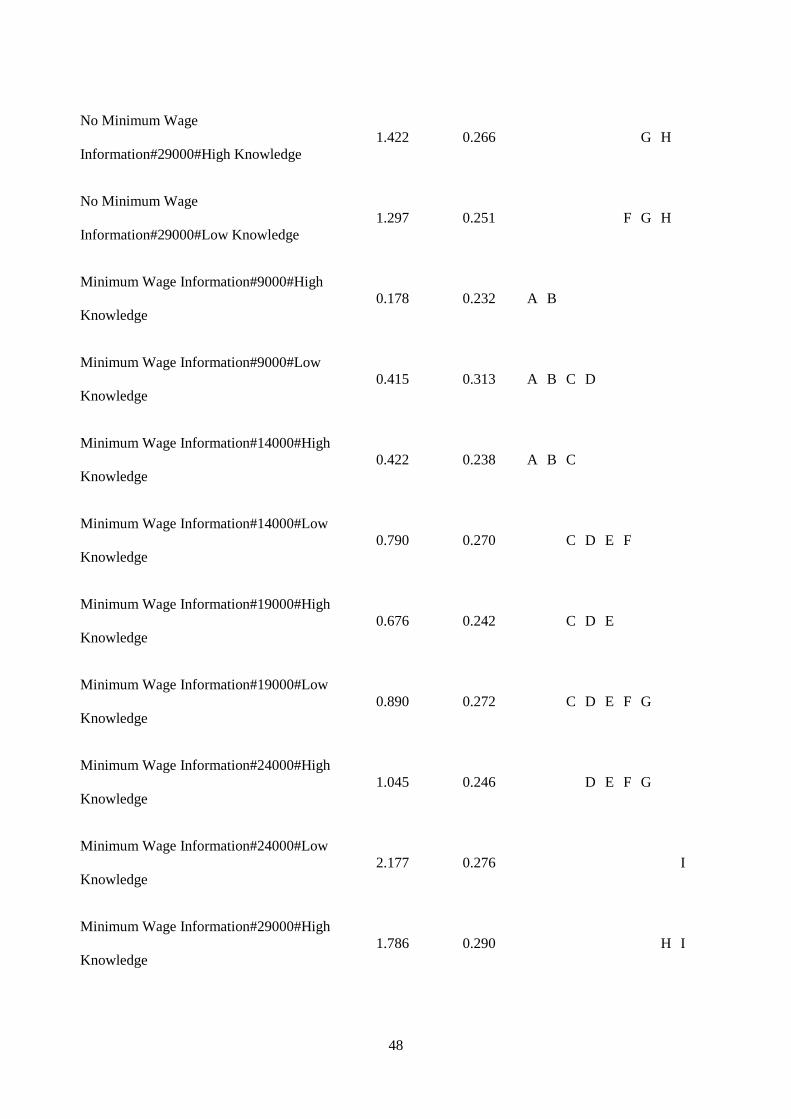
47
Online Appendix Table 3: Pairwise comparisons of marginal linear predictions, analysis broken
down by knowledge
Design df = 1835
Margins: asbalanced
Margin Std. Err. Unadjusted Groups
No Minimum Wage Information#9000#High
Knowledge
0 0 A
No Minimum Wage Information#9000#Low
Knowledge
0.841 0.294
C D E F G
No Minimum Wage
Information#14000#High Knowledge
0.570 0.234
B C D
No Minimum Wage
Information#14000#Low Knowledge
0.529 0.267
B C D
No Minimum Wage
Information#19000#High Knowledge
0.624 0.251
B C D E
No Minimum Wage
Information#19000#Low Knowledge
1.031 0.285
D E F G
No Minimum Wage
Information#24000#High Knowledge
0.772 0.247
C D E F
No Minimum Wage
Information#24000#Low Knowledge
0.983 0.272
D E F G
48
No Minimum Wage
Information#29000#High Knowledge
1.422 0.266
G H
No Minimum Wage
Information#29000#Low Knowledge
1.297 0.251
F G H
Minimum Wage Information#9000#High
Knowledge
0.178 0.232 A B
Minimum Wage Information#9000#Low
Knowledge
0.415 0.313 A B C D
Minimum Wage Information#14000#High
Knowledge
0.422 0.238 A B C
Minimum Wage Information#14000#Low
Knowledge
0.790 0.270
C D E F
Minimum Wage Information#19000#High
Knowledge
0.676 0.242
C D E
Minimum Wage Information#19000#Low
Knowledge
0.890 0.272
C D E F G
Minimum Wage Information#24000#High
Knowledge
1.045 0.246
D E F G
Minimum Wage Information#24000#Low
Knowledge
2.177 0.276
I
Minimum Wage Information#29000#High
Knowledge
1.786 0.290
H I

49
Minimum Wage Information#29000#Low
Knowledge
1.142 0.273
E F G
Note: Margins sharing a letter in the group label are not significantly different at the 5% level.


![Political Party – DEFINED!!! Anthony Downs: “team of men [and women] seeking to control the governing apparatus by gaining office in a duly constituted.](https://static.fdocuments.in/doc/165x107/56649e595503460f94b533cc/political-party-defined-anthony-downs-team-of-men-and-women.jpg)
![[Anthony Pagden (Ed.)] the Languages of Political](https://static.fdocuments.in/doc/165x107/54509996af795903098b4dba/anthony-pagden-ed-the-languages-of-political.jpg)