POLITECNICO DI MILANO · Magistrale at the Politecnico di Milano and as Trabalho de Formatura para...
80
POLITECNICO DI MILANO Facoltà di Ingegneria Civile, Ambientale e Territoriale Corso di Laurea Magistrale in Ingegneria Civile Analysis on the integration of soybean flow from Mato Grosso to the port of Santos in Brazil with a Modalohr multimodal system Relatore: Roberto Maja Tesina di laurea di: Bruno Giovanni CHOI Matricola 813261 Anno Accademico 2014 - 2015
Transcript of POLITECNICO DI MILANO · Magistrale at the Politecnico di Milano and as Trabalho de Formatura para...

POLITECNICO DI MILANO
Facoltà di Ingegneria Civile, Ambientale e Territoriale
Corso di Laurea Magistrale in
Ingegneria Civile
Analysis on the integration of soybean flow from Mato Grosso to the port of
Santos in Brazil with a Modalohr multimodal system
Relatore: Roberto Maja
Tesina di laurea di:
Bruno Giovanni CHOI
Matricola 813261
Anno Accademico 2014 - 2015

2

3
“Intelligence is the ability to adapt to change”
Stephen Howking

4

5
Acknowledgements
I would first like to thank my thesis advisor professor Roberto Maja from Politecnico
di Milano. During my double degree program, I enrolled two courses lectured by him:
“Transport System and Economy” and “Railway Design and Operation”. Through these
courses, he was able to abet my interest regarding those subjects and resulting in the
production of this material.
I would also like to thank my thesis advisor from my home university professor
Claudio Luiz Marte, who strongly supported me to develop this study in order to promote new
technologies in Brazil.
Finally, I must express my very profound gratitude to my parents Ana Lucia
D’Ascanio and Jin Suk Choi, my grandparents Rocco D’Ascanio and Finalba Pelusi
D’Ascanio and my beloved brother Gianluca Ramalho, always providing me with unfailing
support and continuous encouragement throughout my years of study and through the process
of researching and writing this thesis. This accomplishment would not have been possible
without them. Thank you.
6
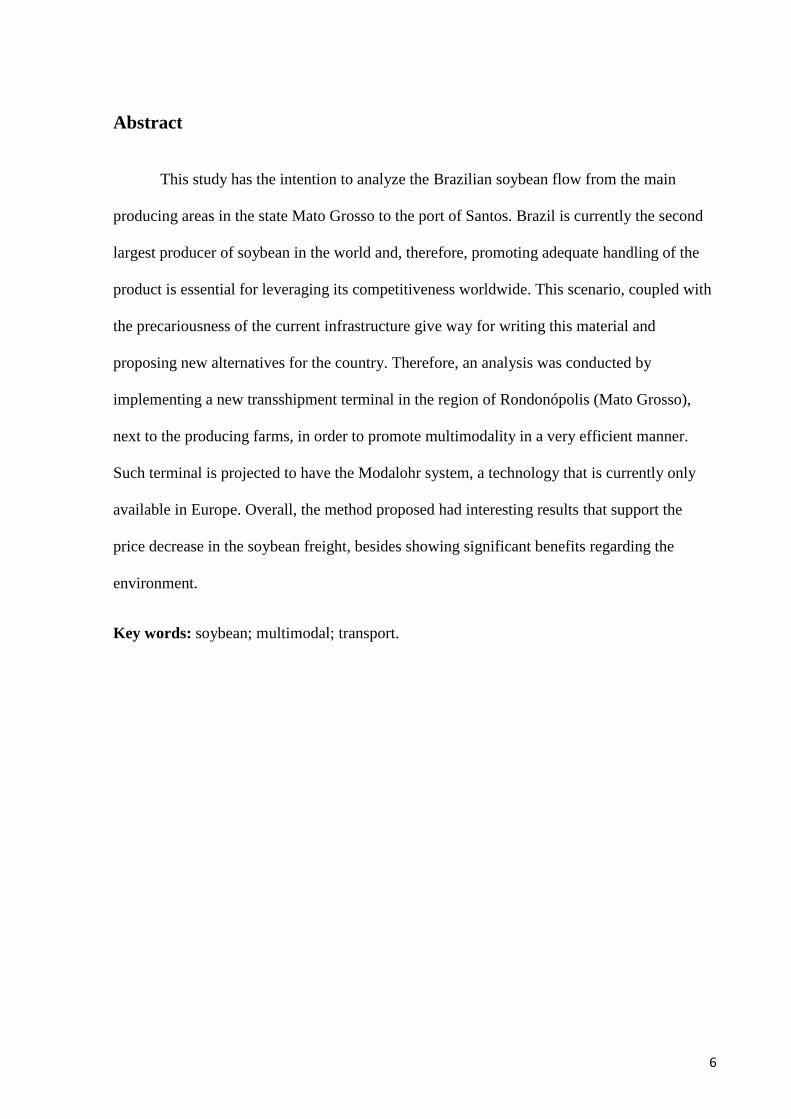
Abstract
This study has the intention to analyze the Brazilian soybean flow from the main
producing areas in the state Mato Grosso to the port of Santos. Brazil is currently the second
largest producer of soybean in the world and, therefore, promoting adequate handling of the
product is essential for leveraging its competitiveness worldwide. This scenario, coupled with
the precariousness of the current infrastructure give way for writing this material and
proposing new alternatives for the country. Therefore, an analysis was conducted by
implementing a new transshipment terminal in the region of Rondonópolis (Mato Grosso),
next to the producing farms, in order to promote multimodality in a very efficient manner.
Such terminal is projected to have the Modalohr system, a technology that is currently only
available in Europe. Overall, the method proposed had interesting results that support the
price decrease in the soybean freight, besides showing significant benefits regarding the
environment.
Key words: soybean; multimodal; transport.

7
Foreword
This project is intended to be an effort of bringing new technologies to Brazil and is
part of a study developed with a multiple-background academic view taking into
consideration the Brazilian state of Mato Grosso as the analyzed region.
This thesis has been produced by the leading author and supervised by professors
Roberto Maja and Cláudio Marte. This work is the one submitted as Tesina di Laurea
Magistrale at the Politecnico di Milano and as Trabalho de Formatura para Engenharia Civil
at the Escola Politécnica da Universidade de São Paulo.

8
List of Figures
Figure 1. Brazilian soybean production by state ...................................................................... 16
Figure 2. Productivity of the Brazilian states ........................................................................... 17
Figure 3 . Location of the multimodal terminal in Rondonópolis ............................................ 19
Figure 4. Brazilian soybean production by region (1977 – 2014) ............................................ 22
Figure 5. Soybean production (2014/2015 crop) – world and main producers ........................ 23
Figure 6. Soybean production worldwide (2007 – 2013) ......................................................... 24
Figure 7. Soybean exports worldwide (2007 - 2013) ............................................................... 25
Figure 8. Soybean imports worldwide (2007 – 2013) .............................................................. 26
Figure 9. Routes for the soybean flow in the Center-West region ........................................... 33
Figure 10. Routes for the soybean flow in Rio Grande do Sul (to the left) and in Paraná (to the
right) ......................................................................................................................................... 33
Figure 11. Section Aiton - Turin / Orbassano .......................................................................... 40
Figure 12. Modalohr system routes (existing and under project) in Europe ............................ 41
Figure 13. Truck engagement inside the Modalohr wagon ...................................................... 42
Figure 14. Modalohr loading system ........................................................................................ 42
Figure 15. Simultaneous loading .............................................................................................. 43
Figure 16. Loading and unloading system ............................................................................... 45
Figure 17. Schematic loading and unloading system ............................................................... 46
Figure 18. Special Modalohr wagons ....................................................................................... 47
Figure 19. Types of Modalohr wagons – characteristics .......................................................... 48
Figure 20. Aiton terminal ......................................................................................................... 49
Figure 21. Orbassano terminal ................................................................................................. 49
Figure 22. Le Boulou terminal ................................................................................................. 50
Figure 23. Bettembourg terminal.............................................................................................. 51

9
Figure 24. Port of Calais terminal ............................................................................................ 52
Figure 25. Current situation of Modalohr terminals (except for the Port of Calais terminal) .. 52
Figure 26. Freight ratio (Sorriso to Santos) and soybean price in Sorriso ............................... 57
Figure 27. Rotation scheme of a standard Modalohr wagon .................................................... 69
Figure 28. CO² emissions by transport mode in Brazil ............................................................ 73
Figure 29. Distances between Sorriso (Mato Grosso) and the port of Santos - road and road-
rail options ................................................................................................................................ 74
Figure 30. Maximum CO² emissions........................................................................................ 75

10
List of equations
Equation 1. Soybean price paid for the producer ..................................................................... 55
Equation 2. CO² annual emission by roadways ........................................................................ 60
Equation 3. Total fuel consumption ......................................................................................... 61
Equation 4. CO² annual emission by road-rail systems ............................................................ 61

11
List of tables
Table 1. Intelligent Transport Maturity Model matrix ............................................................. 59
Table 2. CO² emission factors for trucks .................................................................................. 61
Table 3. Monthly consumption of fuel and cargo handling ..................................................... 63
Table 4. Emission factor for railways ....................................................................................... 64
Table 5. Total capacity of the existing Rondonópolis terminal ................................................ 65
Table 6. Soybean handling of the existing Rondonópolis terminal (estimates) ....................... 65
Table 7. Operational data of a terminal in Rondonópolis with the Modalohr technology ....... 66
Table 8. Raod freight between Sorriso - port of Santos ........................................................... 66
Table 9. Road freight between Sorriso - Rondonópolis ........................................................... 66
Table 10. Historical railway freight between Rondonópolis - port of Santos .......................... 67
Table 11 Maturity assessment through the IBM matrix ........................................................... 71
Table 12. Railway energetic efficiency .................................................................................... 74

12
Table of contents
1.Introduction ........................................................................................................................... 14
2.Objective ................................................................................................................................ 15
3.Rationale ................................................................................................................................ 16
3.1.General overview ..................................................................................................... 16
3.2.The Brazilian soybean ............................................................................................. 21
3.3.International panorama ............................................................................................ 23
3.4.Soybean transport infrastructure in Brazil ............................................................... 29
3.5.Brazilian railway system ......................................................................................... 34
3.6.Combined transport ................................................................................................. 37
3.7.Modalohr system ..................................................................................................... 39
4.Methodological review .......................................................................................................... 53
4.1.Freight to the port .................................................................................................... 53
4.2.Intelligent transport systems .................................................................................... 57
4.3.Analysis on CO2 emissions ..................................................................................... 60
5.Case study .............................................................................................................................. 64
5.1.Capacity analysis on the existing terminal in Rondonópolis ................................... 64
5.2.Capacity analysis on the proposed terminal with the Modalohr technology ........... 65
5.3.Analysis on freight rates in the soybean flow.......................................................... 66
5.4.Analysis on the application of ITS tools in the Modalohr terminal ........................ 68

13
5.5.Evaluation on environmental impact caused by implementing the Modalohr
terminal .......................................................................................................................... 72
6.Conclusions ........................................................................................................................... 76
7.References ............................................................................................................................. 78

14
1. Introduction
The Brazilian railway system has approximately 29,706 km, with the first meters of
this extensive network, originated in the “Estrada de Ferro Mauá” in 1854. The whole project
aims to connect several states, focusing on regions close to the ports in Parati, Angra dos Reis
and Santos.
In 1996, there was the privatization of many railways, which accounted for 28,840
kilometers no longer being owned by the government. In the last 10 years R$3.1 billion was
invested in the sector, providing the leverage in transport production by 80% and a continuous
reduction of the incidents ratio (currently 50% less compared to past Figures). Despite all
these improvements, it is still very evident the infrastructure problems in the Brazilian railway
system which preclude the raise on productivity levels in order to be comparable to developed
regions such as United States and many European countries. These state-of-the-art
infrastructures have an average speed of 80 km/h and advanced communication systems
allowing constant monitoring of the routes. Whereas in Brazil, the railway has a structure
from the 19th
and early 20th
century, with different gauges and layouts 30% longer than
roadways, generating an average speed of 23km/h. Besides the considerably lower speed, the
communication system is outdated and not integrated as a unified system across the country.
Continuous improvement in rail transport and logistics in strategic corridors would
have a direct influence on the Brazilian trade balance, as these railways carry annually 390
million tons: iron ore and coal accounting for 66%; soybean for 6%, steel products, 4%,
agricultural products other than soybean, 1%, and other products, 23%. Out of the total, 78%
is originated by imports / exports handling and only 22% refer to the internal market. In this
scenario, the proper use of the railway is compulsory to aggregate value to Brazilian products
and making it more competitive worldwide.

15
The Brazilian cargo transport registered only 20% share of the rail transport compared
to 60% made by roads, resulting on loss of productive chain due to the current low efficient
system.
An average wagon is capable of handling up to three time the cargo of trucks and is
also able to operate on a much higher scale, making prices up to six times cheaper on tons /
1,000 kilometers. This reduction is also sensible to greenhouse gases emissions such as
carbon dioxide, generating environmental benefits.
Given the current scenario, a more detailed discussion of the Brazilian railway system
and the implementation of new technologies are fundamental in order to leverage the
country’s economy worldwide, particularly in the soybean segment.
2. Objective
The purpose of this research is to analyze the implementation of a multimodal terminal
to outflow soybean from the state of Mato Grosso (main production region) to the port of
Santos (main hub for exports).
The idea is to show the impact of the referred terminal on reducing the commodity
price in order to make it more competitive in the global market.

16
3. Rationale
3.1. General overview
The Brazilian soybean production in the 2013 / 2014 crop was estimated by
approximately 86 million tons, 30.9% of which was originated in the state of Mato Grosso
(largest producer). The importance of the state can also be seen by noting that this crop
generated around 42 million tons of soybean in the Center-West region and Mato Grosso had
a share of 63.5% of this total. The Figure 1 presents the historical data of soybean production
through 2007 – 2012 (Agrianual, 2015).
Figure 1. Brazilian soybean production by state
Estimate by Informa Economics FNP
60.017.305 57.165.322
68.688.183
75.324.008
66.382.796
81.499.714
0
20.000.000
40.000.000
60.000.000
80.000.000
100.000.000
2007 2008 2009 2010 2011 2012
Rondônia Roraima Pará Tocantins
Maranhão Piauí Bahia Minas Gerais
São Paulo Paraná Santa Catarina Santa Catarina
Rio Grande do Sul Mato Grosso do Sul Mato Grosso Goiás
Distrito Federal

17
In this context, it can be noticed that the state of Mato Grosso has one of the highest
productiveness ratio of soybean among its peers states with an average of 3,120 Kg/ha, being
placed as 5th
in the same crop of 2014 / 2015, according to estimates provided by the
Agrianual, 2015 (Figure 2).
Figure 2. Productivity of the Brazilian states
Several factors allowed the shift of soybean production to the Center-West from the
Southern regions. Among others, it should be featured the low land value in the area
compared to the South states between 1960 and 1980; the existence of tax incentives available
for opening new agricultural production areas, acquisition of machinery and construction of
silos and warehouses; favorable topography for automation; and improvements in the regional
production transport system – establishment of new export corridors through road, rail and
waterways (EMBRAPA, 2004).
However, despite the many benefits provided to the soybean production in the
Brazilian region, the road transportation has been suffering for some time due to the lack of
public investments (OJIMA, 2006).
As of August / 2014
3.300 3.210
3.120 3.120 3.120 3.060 3.060 3.042 2.940 2.940 2.910 2.880 2.880 2.820 2.820
2.700
2.000
2.200
2.400
2.600
2.800
3.000
3.200
3.400

18
The roadway transportation is the most used system for the soybean flow – especially
for the sections of highways BR-163 and BR-364 – to the ports located in the Center-South
complex (CAIXETA FILHO, 2010).
With the fiscal crisis in the 1980s, the participation of public investments in the road
network was affected, resulting in less competitive advantage among international players for
the Center-West soybean (CORREA, 2008).
The weakness in the flow system of agricultural products relies on precarious
conditions of the roadways, low efficiency and lack of capacity of railways, clutter and
excessive bureaucracy at the ports. These facts lead to increase in truck queues at major ports,
long waiting for ships maneuver (berthing and unberthing) and therefore, non-fulfillment of
the shipping delivery schedules. Thus, the costs are leveraged and international
competitiveness of the Brazilian products is inevitably jeopardized (FLEURY, 2008).
The current railway and waterway infrastructure is insufficient for the grain
transportation in Brazil, which motivates the use of roadways for the soybean flow, even for
long distances. This scenario shows lack of efficiency, once a train can carry up to 150 times
more than a truck and a convoy of barges can reach up to 600 times a truck capacity in a
waterway as the one in Rio Madeira (OJIMA, 2004).
The need of reduction on logistic costs for the soybean production is due to the fact
that it is produced with low aggregated value and, thus, needs a transportation solution less
expensive. It is also important to emphasize that the handling cost is usually paid by the
farmers (CAIXETA FILHO, 2006).
The Center-West corridor, with the notable participation of highways BR-163 and BR-
364, the railways ALL Malha Norte (former Ferronorte), ALL Malha Oeste (former

19
Novoeste) and ALL Malha Paulista (former Ferroban), have the best infrastructure, in the
country, for the soybean flow from Mato Grosso, as well as the best port infrastructure, such
as the port of Santos (São Paulo) and Paranaguá (Paraná).
The transport of soybean originated in Mato Grosso towards the port of Santos occurs
through several routes. The main option for handling this cargo is through roadways all the
way from the producing area to Santos. Moreover, a recent multimodal terminal installed in
the city of Rondonópolis (Mato Grosso), allowed producers to have the possibility of
transporting the soybean by roads up to the terminal and then, shifting the commodity from
the roads to the rail by transferring it through dumpers. The cargo then continues the trip with
destination to the port of Santos (Figure 3).
Figure 3 . Location of the multimodal terminal in Rondonópolis
However, despite the good infrastructure of the road network in the state of São Paulo,
the intense use of this alternative for the soybean transportation has its consequences and can
be noticed by the formation of bottlenecks due to the large amount of surrounding cities and
elevated car traffic (LOTO and LOPES, 2005).
In the case of choosing the roadway transportation for the whole route, the most
commonly used are highways BR-163 and BR-364. However, the downside of using such

20
infrastructure is its lack of investments and low conditions of use. Furthermore, the existence
of toll roads also adds up to the total transportation cost, making it more expensive (LORETI,
2011).
Another alternative for the soybean flow to Santos is via the waterway Tietê-Paraná up
to Pederneiras (São Paulo) and then railway transportation through the ALL Malha Paulista
network to the port of Santos. Further, less used, alternative, would be using the waterway of
São Simão (Goiás) to Panorama (São Paulo) and then, shifting to roadway up to Santos, or
even unberth by the waterway in Anhembi (São Paulo) and transport the commodity with the
ALL Malha Paulista (ALMEIDA, 2011).
Table 1 shows the percentage distribution of the soybean exported by the Brazilian
ports in 2010 and 2013. The main port considering the volume exported is located in Santos
(São Paulo), followed by the port of Rio Grande (Rio Grande do Sul), and the port of
Paranaguá (Paraná), port of São Francisco do Sul (Santa Catarina) and port of Itaqui
(Maranhão). In this context, the port of Santos accounted for approximately 30% of the
Brazilian soybean exported during the data shown.

21
Table 1. Amount (in tons) of soybean exported through Brazilian ports (2010-2013)
Export ports 2010 2011 2012 2013
Tons % Tons % Tons % Tons %
Santos 8,226,982 28.3% 9,230,508 28.0% 10,396,325 31.6% 12,893,109 30.1%
Rio Grande 4,564,075 15.7% 5,755,691 17.4% 3,540,700 10.8% 8,206,122 19.2%
Paranaguá 5,333,970 18.3% 6,924,388 21.0% 6,954,322 21.1% 7,735,132 18.1%
São Francisco
do Sul 3,044,282 10.5% 2,609,398 7.9% 2,880,518 8.8% 4,032,264 9.4%
São Luís -
Port 2,063,214 7.1% 2,514,376 7.6% 2,750,687 8.4% 2,974,624 7.0%
Vitória – Port
of Itaqui 2,379,156 8.2% 2,452,879 7.4% 2,392,146 7.3% 2,823,224 6.6%
Salvador -
Port 1,232,150 4.2% 1,525,901 4.6% 1,721,014 5.2% 1,778,558 4.2%
Manaus - Port 1,283,034 4.4% 1,086,216 3.3% 1,364,627 4.1% 1,278,985 3.0%
Santarém 809,619 2.8% 789,584 2.4% 873,005 2.7% 996,879 2.3%
Ilhéus 130,865 0.5% 89,029 0.3% 37,547 0.1% 71,205 0.2%
Others 5,808 0.0% 7,589 0.0% 5,525 0.0% 6,002 0.0%
Total 29,073,155 100.0% 32,985,559 100.0% 32,916,416 100.0% 42,796,104 100.0%
3.2. The Brazilian soybean
From the 1970s, Brazil definitely entered the soybean international market. Until this
period, the United States controlled around 95% of the commodity exports. However, in order
to meet domestic demand, the North Americans established an export embargo for the
product, forcing worldwide prices to artificially raise until it became profitable for producers,
even for the most inefficient farmers, paving the way for international competition
(SAMPAIO et al., 2012; BROWN-LIMA; COONEY; CLEARY, 2010).
In the 1980s, the Brazilian Agricultural Research Corporation (EMBRAPA) allowed
the development of crops adapted to the Cerrado climate and therefore, expanding the
production to the Center-West, featuring the state of Mato Grosso. At this point, there was a
Empresa Brasileira de Pesquisa Agropecuária

22
displacement of part of the production from the Southern areas, mainly from the states of Rio
Grande do Sul and Paraná, to the Cerrado. This migration can be noticed in the Figure 4:
Figure 4. Brazilian soybean production by region (1977 – 2014)
On the demand side, increasing production followed the national and international
trend. On the supply side, the expansion occurred due to: natural conditions of the Brazilian
Cerrado; availability of large arable lands in the region; technological development, allowing
similar productivity compared to North American farms; automation, enabling operational
efficiency; investments, even if restricted, on transport infrastructure (GOLDSMITH, P.,
2008; COSTA; ROSSON, 2007).
Meanwhile, this shift of soybean production towards the Cerrado evidenced the
infrastructure and the logistics problems as a whole. The increase on distances from
production and export hub in the port of Santos, coupled with an inefficient infrastructure in
terms of roadways, terminals, railways, ports, warehouses and toll roads affected significantly
the handling costs and, therefore, final competitiveness of the soybean (AFONSO, 2006).
0
10.000
20.000
30.000
40.000
50.000
60.000
70.000
80.000
90.000
100.000
19
77
19
78
19
79
19
80
19
81
19
82
19
83
19
84
19
85
19
86
19
87
19
88
19
89
19
90
19
91
19
92
19
93
19
94
19
95
19
96
19
97
19
98
19
99
20
00
20
01
20
02
20
03
20
04
20
05
20
06
20
07
20
08
20
09
20
10
20
11
20
12
20
13
20
14
North Northeast Center-West Southeast South

23
3.3. International panorama
The world production of soybean has undergone expressive changes since the 1060s.
Until this period, the world production had as major references the United States as producer
and China as importer.
With the entrance of Argentina among the main players in the soybean production
segment, mainly around the 1980s, the world soybean market underwent a change from
almost a monopoly to a stage with higher competition. In this scenario, Brazil and Argentina
became major competitors for the former North American “single player” (SAMPAIO et al.,
2012).
In few decades, Brazil has become the world’s second largest producer of soybean as
shown in Figure 5 (AFONSO, 2006).
Figure 5. Soybean production (2014/2015 crop) – world and main producers
World
• Production: 317.3 million of tons
• Productivity: 2,686 kg/ha
United States
• Production: 108.0 million of tons
• Productivity: 3,213 kg/ha
Brazil
• Production: 95.1 million of tons
• Productivity: 3,011 kg/ha

24
Furthermore, the shift on the production scenario of soybean worldwide can be seen in
the Figure 6.
Figure 6. Soybean production worldwide (2007 – 2013)
Regarding global exports of soybean, the United States hegemony was present until
the Brazilian insertion in the 1970s. From this moment, Brazil started to capture market share
and appears as a potential competitor in the sector. Moreover, with Argentina also starting as
a prospective player, by the end of the 1970s, both Brazil and Argentina began to occupy
similar positions in the export framework. Nevertheless, around the mid-1990s, Brazil
assumed second position considering the global exports, through an accelerated growth
process, which peaked recently, approaching the United States (Figure 7).
0
10.000
20.000
30.000
40.000
50.000
60.000
70.000
80.000
90.000
100.000
2007 2008 2009 2010 2011 2012 2013
United States
Brazil
Argentina
China
India
Paraguay
Canada
Ukraine
Uruguay
Russia
Bolivia
European union

25
Figure 7. Soybean exports worldwide (2007 - 2013)
From the importers point of view, China holds a major position as it overcomes more
than 14 times the other major countries that import the commodity such as: Netherlands,
Japan, Germany, Spain, and Italy. Mexico and Thailand complete the group of the eight
largest soy importers (Figure 8).
0
5.000
10.000
15.000
20.000
25.000
30.000
35.000
40.000
45.000
50.000
2007 2008 2009 2010 2011 2012 2013
United States
Brazil
Argentina
Paraguay
Canada
Uruguay
Others

26
Figure 8. Soybean imports worldwide (2007 – 2013)
The competitive power of the Brazilian soybean relies on its production costs, usually
lower than producers in the United States. In 2010, the production costs were between 57%
and 61% of the North American’s (USITC, 2012).
The main factors that interfere in the wide gap in production costs between the United
States and Brazil are the ones regarding land and seeds. The costs tied to the land are much
higher in the United Stated compared to Brazil. Moreover, the high dimensions of rural
properties in Brazil help to reduce the soybean unit costs. As for the seeds, the North
American costs are also much higher for the use of genetically modified seeds, which
increases these costs, once royalty payments are compulsory. This technology is not
widespread in the Brazilian soils (USITC, 2012).
On the other hand, minimizing elements of the North American disadvantages are
higher prices for fertilizers and chemical products in Brazil. In this discussion, the
discrepancy can be explained by the dark red and red-yellow soil encountered in the Center-
0
10.000
20.000
30.000
40.000
50.000
60.000
70.000
80.000
2007 2008 2009 2010 2011 2012 2013
China
União Europeia
México
Japão
Taiwan
Indonésia
Outros

27
West, composed by a low pH and lack of nutrients, requiring extra expenditures around 10%
of the American fertilizers. Besides that, Brazil imports around 80% of the necessary
pesticides and applies higher quantities compared to the U.S. due to the tropical climate
(USITC, 2012).
Although production costs are expressively lower compared to the United States,
transport costs in Brazil, from the main production zones to the ports, are very high, which
reduce significantly the advantage gained in the rural properties. Factors such as lack on
transport options with more interesting prices than the roadway; low maintenance of the
roads; long distances for the product handling; insufficient capacity of storage in rural
properties during crop seasons (to avoid peak freight prices); high diesel prices; among others,
sums up to the total cost of the Brazilian soybean, resulting in higher final prices compared to
the U.S. soybean.
The transportation costs in the United States are substantially lower than the ones in
the Brazilian Center-West. The reason is that in the U.S., the soybean handling is mainly
made through barges along the Mississippi river to the Gulf ports. The effect of such modal
differences implicates on the participation of transport costs of 8% to 10% on the North
American soybean and 25 % to 30% on the commodity originated in Mato Grosso (USITC,
2012).
Although in the U.S. the soybean production is mainly transported by barges, the
handling occurs through a multimodal system, combining trucks which carry the product from
the rural properties to the nearest grain elevator along the Mississippi river (most common
route adopted for the exported soybean). Throughout the route, hundreds of inland terminals
can be found to set up the multimodal system (USSEC, 2012).

28
The United States has a comprehensive channel system, starting from upper reaches of
the Mississippi river and its affluents and features four coastal areas: the Gulf of Mexico, the
Atlantic Coast, the Pacific Northwest and the Great Lakes. The Gulf of Mexico corresponds
to the most relevant hub. However, due to the fact that travel time is lower through the Pacific
Northwest in the maritime course, it makes this path important when the demand pressure
increases maritime freights, as well as on the Atlantic Coast (USSEC, 2012).
Argentina, on the other hand, possesses shallow rivers in the Panama river connection
at the departure area of the port of Rosário; This requires constant dredging to maintain
optimal depth for navigation. Nevertheless, delivery of high amounts of soybean is not
permitted, unlike its competitors. These conditions increase transport costs in Argentina
(HUERTA, 2002).
In the 1970-1990 period, the soybean production in Argentina achieved significant
growth through increase on productivity, with soybean yields increasing by 3% annually.
Regarding productivity, the better performance involved the use on new lands and the transfer
of other cultures to the soybean production. Furthermore, the economic opening of the
country, during the 1990s, also played its part, by increasing imports of agricultural supplies
and, therefore, encouraging producers to invest in new technologies in order to enhance
productivity (DOHLMAN; SCHNEPF; BOLLING, 2001).
The sudden expansion of soybean production in Argentina was also associated to the
adoption of genetically modified seeds implemented in the 1990s. The similarity to the North
American climate allowed the technology to be transferred rapidly from the U.S. to the
country (DOHLMAN; SCHNEPF; BOLLING, 2001).
In addition, most of the soybean in Argentina is exported by ports located in the
Paraná river. The epicenter of the most important production region is located around 160

29
kilometers from the port of Rosário and the ports of San Lorenzo and San Martin. In the
United States, the distance from the production farms of the North Central Iowa and a port
through the Mississippi river is around 1,000 kilometers, which is considerably greater than
the distance in Argentina (LENCE, 2000).
Given the proximity of the main producing areas of soybean in Argentina to the ports,
the product is usually handled by roadways, even though more expensive. However, the
commodity also uses the waterway system Paraná-Paraguay. It is important to emphasize the
existence of warehouses for storage alongside the Paraná river (DOHLMAN; SCHNEPF;
BOLLING, 2001).
Likewise the Brazilian soybean production encounter disadvantages in terms of
infrastructure when compared to the United States. The less favorable condition is due to the
fact that mostly of the production in Brazil is located in the Mato Grosso region, which
implicates on distances superior to 1,000 kilometers to reach the main ports. Moreover, when
the product arrives at the ports, it can also face long waiting queues of more than 30
kilometers. Adding up to the competitive handicap, the environmental restriction prevails in
the tropical soil when compared to its main competitors. It can be verified by the requirement
of preserving 30 to 50 meters of the riparian forest depending on the region, whereas, in the
U.S. and in Argentina, such specification does not apply (BROWN-LIMA, COONEY;
CLEARY, 2010).
3.4. Soybean transport infrastructure in Brazil
Certain aspects of the transport infrastructure for the soybean flow in Brazil will be
discussed in this topic in order to portray the thereof deficiencies. Further on that, will be
presented the flow routes of the soybean from Mato Grosso.

30
The soybean price in the global market and the maritime freight are seen as
exogenous, given it is a commodity and it is exported from Brazil through ships with foreign
flags. Therefore, participants involved in the production activity and in the transport system
should be able to minimize the costs in these steps (FILLARDO et al., 2005).
The soybean has the specificity of being a low added value product and of being
traded in large volumes. This requires the use of transport that supports such amounts as well
as possesses low unit cost (FLEURY, 2005).
From the 1980s, the state fiscal crisis in Brazil resulted in reduction of investments on
roadway expansion, maintenance and restoration. This interfered directly in the soybean
competitiveness and the inevitable need to use the BR-163 and BR-364 network. The long
distances coupled with the infrastructure inefficiency generated losses of around 25 % of the
sales revenue, impacting the opportunity cost of the product (CORREA; RAMOS, 2010).
According to Caixeta Filho et al. (1998), comparing several transport options should
be seen as a combination of modes in order to handle the cargo from its origin to the final
destination. Thus, railway and waterway system should not be considered separately, but as to
promote the intermodality.
The roadway option is recommended for short distance transportation once it promotes
capillarity for the system. In this case, short distances are considered as being less than 300
kilometers. As for this context, roadways would have the role of transporting the soybean
from the producing areas up to the warehouses or railway or waterway terminals, in order to
enable cost reduction (HIJJAR, 2004).
The international competitiveness of the Brazilian soybean is affected by the logistic
costs due to two factors. Firstly by the excessive use of the roadway option, considered to be
inadequate to be used as the only mean of transportation; Second, the precariousness in the

31
roads, due to the already mentioned lack of investments by the public sector since the tax
problems from 1980 (CORREA; RAMOS, 2010).
The revitalization of railways in Brazil was not effective due to the emphasis of the
roadway system in a moment of scarce investments and due to the automotive industry appeal
(CORREA; RAMOS, 2010).
Galvão (1996) argues that the historical inexistence of other transport options was
associated to the absence of a strong internal market to economically support the viability for
railway and waterway companies.
Regarding each modal, the railway infrastructure is characterized by elevated fixed
costs and low variable costs, compared to other means of transport. Moreover, operating
efficiently and in large amounts, it is possible to reduce the unit costs. On the other hand, the
roadway option is the opposite: low fixed costs and high variable costs. The third option of
flowing soybean is by the waterway system, ideal for large amounts of low added value
products, low speeds and long distances, presenting the lowest unit costs.
Summing up to this scenario, the Center-West region presents the highest number of
sections considered as regular, bad or very bad in Brazil (ALMEIDA et al., 2011).
BR-163 and BR-364, the main highways to the ports in the Center-South complex, are
very compromised. The section of BR-174, which connects Cuiabá to Porto Velho, is an
important connection channel for the soybean flow from Mato Grosso to the ports of
Itacoatiara (Amazonas) and Santarém (Pará), and is considered as regular.
Rating from the Transport National Federation (CNT), as for 2011

32
As for the perspectives for transport infrastructure development that benefits the
exports of the Brazilian soybean, the government program to accelerate the economy is
presented as the current intention of planning works related to the development of the country.
The PAC, created in 2007, appeared with the purpose of reinitiating a planning
scheme of investments in social, urban, logistics and energetic infrastructure in Brazil. In
terms of transports, the PAC was based in the national plan of transport and logistics
,
created in 2006. In 2011, it was releases the PAC 2, which followed the same methodology of
the previous program.
From the projected or undergoing constructions, some of them contribute for the
soybean flow from the Brazilian Cerrado and correspond to the development in waterways,
ports, roadways and railways.
The Figure 9 and Figure 10 illustrate the main routes for the soybean flow from the
Center-West and South regions.
Programa de Aceleração do Crescimento (PAC)
Plano Nacional de Logística e Transportes (PNLT)

33
Figure 9. Routes for the soybean flow in the Center-West region
Figure 10. Routes for the soybean flow in Rio Grande do Sul (to the left) and in Paraná (to the right)

34
Conditions showed on the previous Figures feature the situation of difficulty handled
for flowing the commodity through roadways – by the long distances – and through railways
– by the geographic dispersion of the producers in the states. Therefore, what this study
intends to evaluate is the relevance of a solution combining the advantage of both modal:
roadways and railways, which will be discussed further ahead.
3.5. Brazilian railway system
Since the Regency, the Brazilian government considered the construction of a
comprehensive railway system as a strategic investment for the economic growth of the
country, especially due to its importance for the coffee industry in the world economy. Thus,
at the beginning of the Second Empire, in 1835, a law was enacted enabling concessions of up
to 40 years to private investors who were willing to connect several states: Bahia, Minas
Gerais, Rio de Janeiro, Rio Grande do Sul and São Paulo. Notwithstanding, the proposal did
not attract any potential candidate, and animal traction still prevailed on cargo transportation.
Only in 1853, with measures covering tax benefits and more secure return on investments,
Irineu Evangelista de Souza, became the first developer of the Brazilian railways, who was
followed by others in subsequent years.
It is important to mention the context in which it appears the construction of the first
railways in order to understand better the reasons for their further decline. A century later,
roadways became the official option of the Brazilian government, due to several reasons,
among: spread of the automobile as individual mean of transport; more operational flexibility
associated to the roadway system; the importance of the automotive industry in terms of job
generating and country increase on revenue; and the image of the automobile as development
symbol.
Usually known as the Baron of Mauá

35
Besides all these factors, and regarding the cargo handling specifically, the construction
of a roadway network with national coverage would allow a productivity integration of the
territory, which was impossible to be achieved by a railway system. This unviability was due
to its development history, with the coexistence of several infrastructure standards for rails,
particularly several different gauges, creating essentially a transport archipelago, as opposed
to an interconnected system.
The roadway consequences last until today. Even though the Brazilian infrastructure of all
modes is less developed compared to first world countries, it is important to highlight that, on
every one thousand square kilometers of surface, there is 17.3 kilometers of paved roadway
and only 3.3 kilometers of railway – of which only one third is explored in its full capacity. In
terms of modal share in total ton-kilometer transported, although there is some variation in
several estimates, the share of road transport is usually estimated at about two-thirds of the
total - and the railways, in a fifth. But, in fact, the above Figures are not necessarily very
informative. Therefore, some of rail and road characteristics should be mentioned again in
more detail.
The construction costs of a railway are usually far superior that the ones linked to
roadways – usually around seven times higher. On the other hand, the cargo capacity is
usually substantially higher, and the variable costs per ton-kilometer transported are reduced
by economies of scale associated to the size of railway systems – effectively, in Brazil, by
reducing the unit cost up to six times, a difference that could be even higher if the railway
were operated more efficiently.
Nevertheless, the roadway option provides unparallel flexibility compared to the rail, once
it allows door-to-door services. Moreover, regarding environmental matters, railways are far

36
superior, not causing the level of negative externalities associated to the roadways in general
terms (neither to those specifically linked to trucks, such as high particulate emissions).
Considering the above mentioned arguments, it becomes evident that the competitive
advantages of the railway transport will occur in situations of high cargo volumes, longer
distances, with no need for operational flexibility and capillarity. One would expect that a
country with relevant commodity production, characterized with long distanced from the main
producing areas to the ports, had a smaller share on road transport. Even though railway is not
the only alternative, it would be expected a reduced fraction of the roadway system for a
country with such dimensions, as Brazil. Yet, whilst only 20% of the North American
production of soybean is handled by roadways, in Brazil this Figure reaches 65%. In addition,
the period of fiscal adjustment brings uncertainty regarding the railway investments, and if it
really is the best strategic use of resources. Thus, it is possible to say that the prospects of the
Brazilian rail transport are not exactly encouraging.
It is important to emphasize that the road-rail transport already exists, even though still
limited, in these corridors: Rondonópolis (Mato Grosso), for example, has a transshipment
terminal of such modes. However, not only this solution in relatively underexplored, as it will
be discussed a specific technology for a multimodal terminal – the so called Modalohr system
– with a section dedicated to this subject. Nevertheless, before stepping into the Modalohr
technology, an introductory discussion regarding the combined transport, with its advantages
and disadvantages, will first be presented. Also the role of information and communication
technologies should play in a system in order to assure that proper development will be
implemented. Since this study dedicates itself specifically to the soybean flow and the
Modalohr system, similar reasoning should be made in further studies regarding the combined
handling of cargo in general.

37
3.6. Combined transport
Concepts related to transportation are usually defined quite vaguely – mobility and
accessibility are two well-known examples in this matter. Combined transport is no different.
A report from the European Conference of Ministers of Transport states:
[...] the combined transport should be understood as a specific mode of transport, which
makes the best use of the advantages from several types of ground transportation and cabotage
navigation, choosing those that are the most appropriate.
The same report says that it is a mode which necessarily operates door-to-door, with no
changing on the cargo unit – containers, trailers, etc. In the road-rail transportation, the
schematic operation frequently consists of: road transport, from the cargo origin to a
transshipment terminal; cargo transfer from the truck to the wagon of a train; rail transport
from this terminal of transshipment to another; transfer from the load to a truck; road transport
to the final destination. Regarding commodities and products for exports, the rail transport
can be directed to a port, instead of another terminal. The last situation is the one discussed in
this material.
The advantages from the road-rail transport are very clear: use of railway in the longest
section allows increase on scale which drastically reduces the overall variable cost per
transported unit. Moreover, the combined transport has the advantage of promoting capillarity
for the isolated railway system and, therefore, being accessible to the producing farms. In this
system, the only additional infrastructure required would be a transshipment terminal, which
can be chosen by several different types of constructions – the Modalohr technology as being
one of the possible systems – and that are endowed by an elevated operational complexity.
Nevertheless, the combined transport is far from taking the isolated roadway system out of
the picture. As it depends on cargo transfer and train loading, it is a handling option that
remains “slower” than the exclusive use of trucks. Regarding the speed, it is important to

38
emphasize that the rationale is, in cargo transport, fully equivalent to those used for regular
passengers (for example, commercial speed). In fact, as the same European Conference of
Ministers of Transport states:
The speed should not be extended to absolute terms of kilometer per hour. usually, the client
requires: next day delivery, dispatch on day A and delivery on day C, or a similar option. For
most services on a national scale [Note: the European national scale, of similar dimensions to the
Brazilian states scale], the client usually requires delivery on the following day. When the carrier
commissioned by the sender takes the cargo only at 5 p.m., he may face difficulties to reach the
terminal before it closes, around 6:30 p.m. Similar problems occur on arrival. If the combined
transport unit cannot be forwarded to the destination transshipment terminal before 9 a.m., it may
be too late to handle it to the client.
However, as noted above, this problem refers to relatively small volumes of loads, higher
added value and higher importance to time restrictions – opposed to agricultural commodities,
that are forwarded to a port, such as Santos (São Paulo).
In our particular case, it is important to consider another possible limitation of the
combined transport: the reliability. A road-rail transshipment terminal, mainly those operating
with either complete loading or partial loading, has a relatively high operational complexity.
Thus, extremely important, for example, to ensure that the loads have the commercial weight
agreed – indeed, weighing is an activity that can take a substantial time – and that they are
forwarded to the correct trains.
Moreover, given that the railway transport is necessarily made “by batches”, small delays
in loading can generate a final delay of several hours, resulting in significant economic losses.
In the case of cargo transport between the Center-West region to port of Santos, the reliability
would be an essential strategic challenge for an operator of a road-rail transshipment terminal.
It could be interesting, in this case, to diversify the activities not only for the soybean
handling, but also to other productions in the region, including some with more value added.

39
In this context, the importance of information technology, features of ITS, becomes
evident. Although, taken generally, the combined transport is rather broader than its
information technology installed; those functions are the ones responsible for adding to the
transshipment terminal the level of reliability that was discussed before, similar or even
higher than the roadway system, especially when considering road incidents.
Before proceeding to the presentation of the Modalohr system, a methodological
explanation is applicable. In the preceding paragraphs, we compare three modes of transport:
road, rail, and road and rail combined. Why not show a decision matrix? The answer is quite
simple. Decision arrays are tools that help to clarify the superiority of some options in the
presence of trade-offs, but only when this superiority is relatively clear, the imprecision
inherent in the assignment of "weights" and "notes" is considerable. Whoever is familiar with
transportation planning understand that the decisions of consumers (travelers and cargo
shippers) are usually too complex to be modeled in a manner acceptable for this type of
instrument, and not necessarily a transportation mode is inherently superior than others. For
that reason alone, it is preferred to explain the type of arbitration that the cargo transport is
submitted, the specific advantages and disadvantages of each mode, and the type of situation
in which each of them usually prevails.
3.7. Modalohr system
Modalohr is an innovative technology for railway transportation developed by the French
company “Lohr industries”. Operational for commercial purposes for a few years between
France and Italy, the technology concept is patented and licensed and based on the use of
wagons that allow the handling of road semi-trailers over an existing railway infrastructure.
Information Technoloy Systems

40
The first connection made using this system was in Europe, in the segment France – Italy as
in the Figure 11 (Aiton – Turin / Orbassano).
Figure 11. Section Aiton - Turin / Orbassano
As being a significantly more efficient system, Modalohr is already operational in several
other sections across the old continent, as in France, Spain and Luxembourg. For the end of
2016, it is expected to be concluded the section Turin-London.
At the same time, other projects are under study with the intention of connecting more
countries and taking typical 45 tons semi-trailer out of the roads.
Figure 12 below shows the European connection with the aforementioned system.

41
Figure 12. Modalohr system routes (existing and under project) in Europe
The transshipment mode using the Modalohr technology does not require the use of
dumpers or cranes, used in traditional methods. The loading and unloading operation is made
by the truck driver, making it faster and more efficient.
The technology is a low-frame articulated railway wagon, specially designed for carrying
standard cargo, including:
A very low loading platform enabling 4 meters high trucks to be loaded within the
limits of existing railway gauges (Figure 13);

42
Figure 13. Truck engagement inside the Modalohr wagon
Standard bogies and wheels to keep servicing costs within the range of those of a
conventional railway car;
Trucks can be loaded horizontally and directly using the road tractor with no
handling equipment (Figure 14);
Figure 14. Modalohr loading system

43
Lateral herring-bone loading of trucks for simultaneous, rapid transshipment
(Figure 15);
Figure 15. Simultaneous loading
A mechanical system for articulation and "opening" the wagons;
A simple, low-cost transshipment terminal, consisting of asphalted areas on either
side of the railway line (no platforms) and wagon opening systems fixed on the
railway.
To guarantee reliability and lower rolling stock purchase and maintenance costs, there is
no power actuator on the wagons. They are just simple mechanical units.
The wagon opening systems are part of the fixed equipment at the terminals. This is in
line with economic logic because there are many more wagons than terminals. It is also much
easier to maintain equipment fixed in one place than systems fitted to wagons. They are
controlled from ground level by operating personnel who monitor the truck transshipment
operations.
Each wagon is fitted with a secured lock which guarantees that it stays closed while
moving along the tracks and, as soon as the train stops, the wagons are recentered on the

44
position with respect to the opening systems.
Once unlocked by the platform personnel, the wagon's vertical load is taken over by the
ground based equipment which then pivots the low-frame platforms. The trucks can then be
unloaded and loaded. To close the wagons, the operation is repeated in reverse order.
Regarding the infrastructure, loading and unloading trucks on Modalohr rail cars needs a
special transshipment terminal to be constructed. In view of the quantity of truck traffic using
these terminals, it is preferable to build new installations outside urban areas, close to
motorway interchanges. In this scenario, the region in Rondonópolis is suitable for a
construction of such magnitude, connecting the soybean production areas through roads such
as BR-163 and BR-364 to the ALL railway system.
A Modalohr terminal consists of a railway line with an asphalted surface on either side, at
almost the same level as the rails. There is no need for gantries or handling equipment to be
installed. The loading floor of the cars is low and by using lateral loading in herring-bone
mode, trucks can be transshipped independently of the other trucks.
All the trucks can be loaded or unloaded at the same time so that 30 trucks can be loaded
as quickly as one. The maneuvers that the driver has to accomplish (in a straight line) are also
easy and fast.
After passing the entrance to the terminal, where it has been identified and inspected, the
truck goes to the position bearing the number indicated, and waits for the train to arrive. Once
the train has stopped, the truck to be loaded waits until the other truck, already on the wagon,
has been unloaded, before driving on board (Figure 16 and Figure 17). The procedure of
loading can be explained on the following steps:
Wagon stopped with respect to the ground system, then the low-frame platform is
unlocked;

45
The low-frame platform is rotated by the ground opening system;
The truck is loaded onto the wagon by driving in a straight line;
The truck crosses the platform until the tractor reaches the other side;
After uncoupling, the tractor is loaded onto the adjacent platform if the whole rig is
travelling on the train, or leaves the terminal if the semi-trailer is travelling alone;
The wagon is closed using the ground system, then locked and the wagon is ready to
leave.
Figure 16. Loading and unloading system

46
Figure 17. Schematic loading and unloading system
This technology has the further advantage of being able to unload or reload one or more
trucks in the middle of the train without having to move the others. Intermediate stops can
thus be planned giving drivers greater flexibility and optimizing train filling. Connections can
even be envisaged between Modalohr trains, exchanging trucks.
Furthermore, this loading method manages to reduce the rail operator's running costs, once
the time for which trains are stopped in terminals can be very short, and the rate of efficiency
is high because they are moving approximately for 80% of the time they are in service. Since
transshipment is horizontal, it can take place on a line using catenaries and trains can reach
the terminal using normal electric locomotive, without having to detach it. Moreover, few
personnel are required in the terminals, since the trucks are loaded directly by their drivers.
Besides that, the implementation of such technology relies on special wagons which need
to be considered in the construction of such terminal. As it has been said, the Modalohr

47
system was created to be suitable to the existing infrastructure and there is no need of changes
in truck sizes or railway dimensions. On the other hand, special wagons are compulsory once
they allow such technology to be applied (Figure 18 and Figure 19).
Figure 18. Special Modalohr wagons

48
Figure 19. Types of Modalohr wagons – characteristics
Moreover, it will be presented the 5 current operating terminals in Europe with the
Modalohr technology:
3.7.1. Aiton terminal (Chambéry, France)
The Aiton terminal was inaugurated in 2003 and is currently owned and operated by
Autoroute Ferroviaire Alpine. It is equipped with the Modalohr system through one track with
500 meters of extension and a total surface of 20,000 sqm (Figure 20).

49
Figure 20. Aiton terminal
3.7.2. Orbassano terminal (Turin, Italy)
The Orbassano terminal was also inaugurated in 2003, owned by RFI and operated by
Terminali Italia SRL. Equipped with the Modalohr system, operates with an area of 50,000
sqm (Figure 21).
Figure 21. Orbassano terminal

50
3.7.3. Le Boulou terminal (Perpignan, France)
Le Boulou terminal is in service since 2007 and is currently operated by Amborgio. It is a
multimodal terminal equipped with the Modalohr system with an operating area of 90,000
sqm (Figure 22).
Figure 22. Le Boulou terminal
3.7.4. Bettembourg terminal (Luxembourg)
The Bettembourg terminal was also inaugurated in 2007. Its Modalohr system has a total
capacity of handling 45,000 semitrailers / year. The rail connection is composed of Antwerp,
Lubeck, Helsingborg, Le Boulou, Milan and Trieste. It is currently managed by CFL
multimodal (Figure 23).

51
Figure 23. Bettembourg terminal
3.7.5. Port of Calais terminal (Calais, France)
This terminal, built-in by the Port of Calais and designed for unaccompanied semi-trailer
traffic connecting the ferries going to and from England was recently inaugurated on October
23rd
, 2015. The total cost of the construction was approximately EUR7.0 million. The new
terminal is due to become the Northern railhead of a service to Le Boulou near the Spanish
boarder, operated by SNCF subsidiary VIIA. The forecasted capacity is around 40,000 semi-
trailers a year (Figure 24).

52
Figure 24. Port of Calais terminal
Furthermore, several other terminals in Europe are under construction or in project willing
to incorporate the Modalohr technology (Figure 25).
Figure 25. Current situation of Modalohr terminals (except for the Port of Calais terminal)

53
4. Methodological review
In this section, it will be presented a theoretical model for pricing the freights charged for
the cargo handling to the port. In this context and aiming to maximize the efficiency of the
proposed terminal, it will be showed how the ITS technologies could improve the multimodal
complex performance.
Further ahead, it will be presented the methodology applied to calculate the potential
environmental benefit that a new road-rail terminal would bring by reducing CO² emissions
releases in the atmosphere.
4.1. Freight to the port
The price formation of the freight is very complex and also incorporates local and
circumstantial factors, besides activity costs, which may be influenced by direct and indirect
factors (CYPRIANO, 2005).
Direct factors: influenced by events that make the demand vary due to the service:
Economy performance;
Corporate strategies, such as location, production management, storage policy and
warehouse centralization;
International commercial agreements, such as Mercosur;
Packaging materials;
Reverse flows (e.g.: for recycling purposes);
Market structure of the transported product supply and demand.
Indirect factors: factors that affect the cost of service providing (CYPRIANO, 2005):

54
Regulation / deregulation;
Fuel price variation;
Vehicles and cargo compartments innovation;
Traffic jams;
Weigh limits for circulation.
In addition, there is seasonality in the freight value, which becomes higher during the
soybean crop. In the producing regions of Mato Grosso, there is a deficit in storage, so there is
the need for fast flow of the production to the export ports and for crushing industries. This
flow increases the demand for transport and generates an increase in prices for these services.
Moreover, the need for trucks is higher, due to the freight from the farm to the warehouses.
Thus, the soybean price calculation is held in the negotiation act with the seller, according
to the Chicago prices and exchange rate of that moment, but not necessarily at the delivery
time, and by other factors, such as internal demand for crushing.
The soybean price to be paid to the producer involves the following variables:
Soybean price in the CBOT, expiring on the day of trading, quoted in cents of
dollars per bushel;
Premium performed in the port on the day of trading
;
Port costs;
Freight costs.
From this, the soybean price to be paid to the producers, for the product originated in
Chicago Board of Trade
Figure influenced by: force of the internal market supply and demand; maritime freight; and port differential

55
Mato Grosso, can be calculated by the Equation 1:
( ) )
Equation 1. Soybean price paid for the producer
With:
CBOT: soybean price on the Chicago Board of Trade, summed with an additional
port premium
PC: port costs in Santos
FX: Exchange rate for the commercial dollar
Freight: price charged for the soybean handling from Mato Grosso to the port of
Santos
It is noteworthy that the above formula provides na overview of the rationale for
composing the soybean prices paid to producers and how the relevant variables are related to
each other, and it may vary from case to case.
Thus, when analyzing the current situation, the high FX in 2015, coupled with the
expectation of cheaper roadway freights due to the new road-rail terminal proposed, imply an
increase of the soybean export parity price, based on the Mato Grosso state and the port of
Santos (São Paulo). Therefore, higher prices positively impact the producer’s earnings.
Moreover, in order to proceed with the scope of the ongoing research, it is interesting to
discuss more specifically about the relation between the soybean price and the freight costs.
Thereby, a very important Figure analyzed by the producers from Mato Grosso is the ratio
freight / soybean, which shows how much the freight prices of soybean participates in the

56
value to be paid for the producer’s bushel.
In this scenario, if the grain freight rises in higher proportions than the soybean price, the
percentage share of the freight on the soybean price will increase, causing a decrease on the
producer’s margins.
Similarly, if the grain freight is reduced in higher proportions than the soybean price, the
percentage share of the freight on the soybean price will decrease, and the producer’s
margins, therefore, will be less impacted.
It can be noticed, as seen in Figure 26 that since 2014, the ratio freight / soybean in
Sorriso is between 25% and 30%. Therefore, about one fourth of the soybean price is spent by
the producer, in Sorriso, with handling the product.
As for the crop season, is can be seen that from January, the ratio starts to increase, mainly
due to the more expensive freight prices. Although, in 2015, the month with the highest ratio,
March, with 29%, still remained below from what was seen in 2014, which showed an
average ratio freight / soybean of 34% in this period. This occurred by the combination of two
factors. The first is the freight price, which performed slightly below that Figures recorded in
2014. In March, 2015, the average freight from Sorriso to the port of Santos was R$290.00
per ton, compared to R$300.00 per ton in 2014. The other factor is the soybean price, which
in March, 2015, registered an average of R$58.95 / bag against R$53.42 / bag as for March,
2014. This difference of R$5.53 / bag mitigates the handling costs for the producers.

57
Figure 26. Freight ratio (Sorriso to Santos) and soybean price in Sorriso
4.2. Intelligent transport systems
The Intelligent transport systems consists on the application of applying a set of
technologies to common issues in transportation, such as the lack of information and
planning, traffic jams contingencies, among others. The international experience
demonstrated that implementing ITS is a strategy to optimize investments and, adequate
planning with an engineering approach are fundamental elements for a profitable and
sustainable execution. Therefore, the proposed study can help to increase the return on
investments, by reducing operational costs, enhance the functionality and the performance of
the cargo management systems, and also mitigate the environmental impact of the sector in
terms of emissions or fuel consumption.
ITS comprise multimodal control centers, monitoring systems, remote surveillance
(cameras, sensors, probes and software), parking management, incident management,
emergency response, electronic payment, dynamic pricing and user information in real time.
With this, in order to fit, in the best way possible, the technologies facilities to the studied

58
multimodal terminal, it may be used as a maturity assessment technique the Intelligent
Transport Maturity Model matrix, developed by IBM in the U.S.A., in which for each
category, a level is assigned depending on the maturity stage (on a scale from 1 to 5):
governance, transport network optimization and integrated transport services (Table 2).

59
Table 2. Intelligent Transport Maturity Model matrix
Level 1: Single
mode
Level 2:
Coordinated
modes
Level 3:
Partially
integrated
Level 4:
Multimodal
integration
Level 5:
Multimodal
optimized
Go
ver
na
nce
Strategic
planning
Functional area
planning (single
mode)
Project –
based planning
(single mode)
Integrated agency
– wide planning
(single mode)
Integrated
corridor – based
multimodal
planning
Integrated
regional
multimodal
planning
Performance
measurement Minimal
Defined metrics
by mode
Limited
integration across
organizational
silos
Shared
multimodal
system – wide
metrics
Continuous
system – wide
performance
measurements
Demand
management
Individual static
measure
Individual
measures, with
long-term
variability
Coordinated
measures, with
short-term
variability
Dynamic pricing Multimodal
dynamic pricing
Tra
nsp
ort
net
wo
rk s
yst
em
Data collection Limited or
manual input
Near real-time for
major routes
Real-time for
major routes
using multiple
inputs
Real-time
coverage for
major corridors,
all significant
modes
System – wide
real-time data
collection across
all modes
Data integration
and analytics
Limited with ad
hoc analysis
Networked but
periodic analysis
Common user
interface with
high-level
analysis
Two-way system
integration and
analysis in real-
time
Extended
integration with
multimodal
analysis in real-
time
Network
operations
response
Ad hoc, single
mode
Centralized single
mode
Automated,
single mode
Automated,
multimodal
Multimodal real-
time optimized
Incident
management
Manual detection,
response and
recovery
Manual detection,
coordinated
response, manual
recover
Automated
detection,
coordinated
response, manual
recover
Automated pre-
planned
multimodal
recovery plans
Dynamic
multimodal
recovery plans
based on real-
time data
Inte
gra
ted
tra
nsp
ort
ser
vic
es Customer
relationships
Minimal
capability, no
customer
accounts
Customer
accounts
managed
separately for
each system /
mode
Multichannel
account
interaction by
mode
Unified customer
account across
multiple modes
Integrated
multimodal
incentives to
optimize
multimodal use
Payment systems Manual cash
collection
Automatic cash
machines
Electronic
payments
Multimodal
integrated fare
card
Multimodal
multichannel
(fare cards, cell
phones, etc.)
Traveler
information Static information
Static trip
planning with
limited real-time
alerts
Multichannel trip
planning and
account-based
alert subscription
Location-based,
on-journey
multimodal
Location-based,
multimodal
proactive
rerouting

60
4.3. Analysis on CO2 emissions
Considering the main transport options to export the soybean from Mato Grosso by the
port of Santos, there were selected two options to calculate the emissions of greenhouse gases.
The first corresponds to the handling made entirely by roads, since Sorriso (Mato Grosso),
until the port of Santos. The second refers to the use of railway between the Modalohr
multimodal terminal and the port of Santos, after the section from Sorriso to the terminal,
made by trucks. It is important to explain that the municipality of Sorriso was selected as
representative of the producing region of Mato Grosso by its outstanding position in the
commodity culture.
The greenhouse gases emissions related to the soybean export made by roadways were
calculated according to the rationale of national guidelines for greenhouse gases inventories
from the IPCC (Wakdron et. al., 2006). The rationale has an easy application, once it uses
only the fuel consumption and the emission factor for the type of fuel used, as shown in the
Equation 2.
Equation 2. CO² annual emission by roadways
With:
Annual emission by the soybean corridor [kilograms of CO² / year];
Total fuel consumption [TJ];
Emission factor for the fuel type j [Kg / TJ];
j = Fuel type (e.g.: diesel, natural gas, gas).
Intergovernmental Panel on Climate Change

61
According to the research made by Anpet “Potential reduction on emission of greenhouse
gases through multimodal systems in the soybean handling”, it was not possible to obtain
primary data of the total roadway consumption for the export corridor of the commodity,
resulting on the use of the Equation 3 to estimate the total fuel consumed.
Equation 3. Total fuel consumption
With:
D = Roadway distance from Sorriso to the port of Santos [kilometers];
H = Annually handled cargo from Sorriso to the porto Santos [tons];
T = Consumption factors of fuel by ton-kilometer [liters / ton*kilometers].
The emission factor for diesel trucks, which enables to convert fuel into carbon dioxide
(CO²) was extracted from the First National Inventory of Air Emissions by Road Motor
Vehicles prepared by the Environmental Ministry (2011), as shown in Table 3.
Table 3. CO² emission factors for trucks
Gasoline (kg/l) Anhydrous ethanol (kg/l) Hydrous ethanol (kg/l) Diesel (kg/l) NGV (kg/m³)
2.269 1.233 1.178 2.671 1.999
For the multimodal alternative, on the other hand, calculation was carried out in two steps.
First, it was analyzed the road connecting Sorriso to the multimodal integration terminal in
Rondonópolis. Then the rail route was added to the section.
The emissions in both sections are summed, in order to estimate the total emission for the
multimodal alternative (Equation 4).
Equation 4. CO² annual emission by road-rail systems

62
With:
= Distance for the roadway section [kilometers];
H = Annually handled cargo from Sorriso to the port of Santos [tons];
= Consumption factor of fuel by ton-kilometer of soybean handled by roadway
[liters / ton*kilometers];
Emission factor by liter of diesel consumed by the roadway system,
[kilograms of CO² / liter];
= Distance for the railway section [kilometers];
= Consumption factor by NTK of soybean handled by railway [liters / NTK];
Emission factor by liter of diesel comsumed by the railway system
[kilograms of CO² / liter].
The monthly fuel consumption in each section of the rail route and its cargo handling in
GTK
, were provided by the railway concessionaire responsible for operating the studied
corridor, from October 2012 to September 2013 (Table 4). From these data, it was considered
the median between the calculated energy efficiency. It should be noted that there is a
substantial variation in this parameter for the analyzed sections, due to variations in the track
gradient, type of locomotive, the cargo handled or the loading method. This variety was the
reason to use the median instead of the average, in this case, in order to result on a figure
closer to reality.
As fuel consumption data were not provided in liter / NTK, the relationship between the
movement in net ton kilometer and gross ton kilometer was estimated at 0.73. This estimate
was based on information provided by the concessionaire for the most recurring locomotive
Net Ton Kilometer
Gross Ton Kilometer

63
models in the soybean transport on this route, the size of the compositions, the tare weight of
the wagons, as well as the net cargo usually transported by a wagon. Furthermore, it is
interesting to state that in the Araraquara stop, a locomotive is added to the composition,
ensuring greater driving force for the second part of the trip.
Table 4. Monthly consumption of fuel and cargo handling
Section
Distance
[km]
Annual consumption
[liter of diesel]
Annual handling
[GTK]
Alto Araguaia - Olacyr Morais 98 4,552,770 1,343,338,268
Olacyr Morais - Chapadão do Sul 111 511,411 260,238,402
Chapadão do Sul - Santa Fé do Sul 308 2,755,618 1,423,603,184
Santa Fé do Sul - Rio Preto Paulista 218 10,388,509 3,549,461,519
Rio Preto Paulista - Santa Adélia 89 3,064,704 835,151,861
Santa Adélia – Araraquara 114 4,061,579 1,102,022,040
Araraquara – Rio Claro Novo 123 13,483,445 2,507,750,847
Rio Claro Novo – Itú 135 9,482,507 2,614,311,321
Itú – Embúguaçú 69 13,733,230 2,206,554,024
Embúguaçú – Paratinga 27 3,853,028 1,484,850,802
Paratinga – Conceiçãozinha 44 1,120,939 426,335,777
The emission factor for railways was obtained from the national guidelines for inventories
of greenhouse gas emissions produced by the IPCC in 2006 (Table 5), since there is no
specific regulation for railway emissions in Brazil and therefore, still not disclosed the
average factors for locomotive models in operation in the country (ANTT, 2012). For
conversions to joule liter of fuel consumed it was adopted the ratio of 8,160 kcal / liter as the
calorific value of diesel power.

64
Table 5. Emission factor for railways
Emission factor [kilogram of CO² / TJ]
Default 74,100
5. Case study
In this section, it will be presented analysis and results of the soybean flow produced in
Mato Grosso to the port of Santos by installing a multimodal terminal with the Modalohr
technology in Rondonópolis. For this study, it was made a comparison with an existing
terminal in the region that uses the tipping and storage method to handle the commodity. It is
noteworthy that the proposed idea is complementary to that terminal and aims to add capacity
to the system, besides enhancing the use of the multimodal option for primary products in
Brazil.
Firstly, there were considered some input data that was provided by ALL (America Latina
Logistica), the operator of the existing terminal in Rondonópolis:
Standard truck: average transport capacity of 45 tons;
Standard railway train: average of 120 wagons per train;
Standard wagon: average transport capacity of 110 tons.
5.1. Capacity analysis on the existing terminal in Rondonópolis
After consulting the Company, ALL provided the following operational data of the
terminal:
Loading capacity: 3.5 hours per train
Terminal operations: 24 hours per day, 362 days per year (3 days per year are
intended for maintenance)

65
Thus, the terminal's capacity was estimated, as shown in the Table 6:
Table 6. Total capacity of the existing Rondonópolis terminal
Annual capacity for handling general cargo 57.3 million of tons / year
Maximum attendance 2,011 trucks / day
From the data published by ALL, 2015, eight months after opening the terminal, 6.5
million tons of general cargo were handled. Of these, 3.5 million were due to the soybean.
Thus, one can estimate that approximately 54% of the terminal operations are intended for the
oil seed. Moreover, the company reported that the average number of service is 1,200 trucks /
day, representing a usage approximately 60% of the total available capacity. Table 7 shows
the capacity and annual average transportation soybean transshipped in Rondonópolis:
Table 7. Soybean handling of the existing Rondonópolis terminal (estimates)
Annual capacity for soybean handling 17.6 million tons / year
Effective annual soybean handling 10.5 million tons / year
5.2. Capacity analysis on the proposed terminal with the Modalohr technology
Assuming a same size terminal such as the existing Rondonópolis one, above analyzed, in
order to evaluate the increase in efficiency that the Modalohr technology can provide, this
section will present the capacity analysis of a new terminal with such technology.
The French company Lohr, asserts that a train can be loaded within 2 hours, 57% faster
than the ALL operating terminal. Therefore, the characteristics of the implementation of such
terminal can be seen in the Table 8.

66
Table 8. Operational data of a terminal in Rondonópolis with the Modalohr technology
Annual capacity for handling general cargo 57.3 million of tons / year
Maximum attendance 3,520 trucks / day
Projected attendance 2,100 trucks / day
Annual capacity for soybean handling 30.9 million tons / year
Effective annual soybean handling 18.4 million tons / year
5.3. Analysis on freight rates in the soybean flow
In order to better understand the current soybean logistics, it was developed an analysis of
freight rates in the commodity flow to the port of Santos. It was used, as reference, the
producing municipality of Sorriso as representative of the Mato Grosso region.
First it was analyzed the prices charged by major logistics companies, for handling the
soybean from Sorriso to the port of Santos entirely by road transport (Table 9).
Table 9. Raod freight between Sorriso - port of Santos
Company
Price (R$/ton)
Transvidal
275.00
Diamante transportes
290.00
Sandra ca1rgas
275.00
MN + logistics
295.00
Fribon transportes
285.00
Median
285.00
Table 10. Road freight between Sorriso - Rondonópolis
Company
Price (R$/ton)
Rodolider transportes
99.00
Belluno
98.00
Transvidal
97.50
Diamante transportes
103.00
Fribon transportes
92.00
Median
98.00

67
Table 11. Historical railway freight between Rondonópolis - port of Santos
Month Freight
Jan-13 165.00
Feb-13 175.00
Mar-13 228.00
Apr-13 194.00
May-13 165.00
Jun-13 179.00
Jul-13 191.00
Aug-13 206.00
Sep-13 204.00
Oct-13 190.00
Nov-13 170.00
Dec-13 178.00
Jan-14 167.00
Feb-14 230.00
Mar-14 219.00
Apr-14 183.00
May-14 180.00
Jun-14 185.00
Jul-14 178.00
Aug-14 181.00
Sep-14 161.00
Oct-14 139.00
Nov-14 139.00
Dec-14 142.00
Jan-15 143.00
Feb-15 160.00
Mar-15 214.00
Apr-15 205.00
May-15 190.00
Jun-15 190.00
Jul-15 193.00
Aug-15 202.00
Sep-15 213.00
Oct-15 213.00
Median 184.00
Then, through the median of the prices charged for road transport between Sorriso and
Rondonópolis (Table 10) and the historical series of Jan-13 to Oct-15 of rail freight between
Rondonópolis and the port of Santos (Table 11), it was obtained an average value of R $

68
282.00 for the soybean current multimodal transport.
With the analysis made, it was found that the logistics cost for the producer when
choosing from road or multimodal options does not have a significant difference. As
previously mentioned and easily verified by the Table 11 presented, the freight price charged
for the railway section is very volatile and only in some periods of the year, road-rail transport
becomes interesting.
Thus, it is relevant to discuss in detail the analysis of a potential reduction in the current
rail freight with the installation of new Modalohr terminal in the region.
First, one must consider that today there is no multimodal competition in the region,
allowing greater fluctuations in prices according to the demand for the soybean flow. The
introduction of a new terminal would add a competitive framework in Rondonópolis, possibly
with a significant impact on the transport prices charged for the rail use today. Therefore,
through the soybean pricing formula already presented in the methodological review section,
it can be said that a possible reduction in the rail freight, and consequent reduction in the price
for soybean handling, between major producers in Mato Grosso and the port of Santos, would
most likely increase the profitability of producers as a whole.
5.4. Analysis on the application of ITS tools in the Modalohr terminal
With the reasoning of technology applied to the Modalohr system, it improvements can be
applied relating with automation, telecommunication and operational control. This study aims
to optimize the multimodal system in order to speed the transshipment and, consequently,
reduce the aggregated cost of the soybean commodity.
Regarding the automation, it is extremely important that the arrival and departure of the
semi-trailers are synchronized so as not to cause unnecessary delays. The operation occurs

69
with a 30º rotation of the wagon’s axis with the loading made as a “herring bone”, of all
trucks at the same time, as can be seen in Figure 27.
Figure 27. Rotation scheme of a standard Modalohr wagon
As for telecommunications, it can be installed wireless systems and the Radio Frequency
Identification (RFID) in the terminal as a solution to integrate and better manage the arrival
and departure of the trucks and the trains. The proper logistic management of the trucks has a
substantial effect on the system efficiency and should be properly detailed in this study.
Therefore, an interesting system to be implemented is the use of electronic tags on trucks,
which consists of the installation of an electronic device on the windshield in order to identify
the vehicle and optimize its logistics, as well as significantly reduce the time spent on
customs. Another interesting technology to be introduced is the automatic weighing, also
aiming to reduce the time spent in the terminal.
The operational control system integrates various aspects such as operational monitoring,
operational management, operational safety, signaling suitability, support to equipment
maintenance, electrical control system, among others.
It is worth emphasizing that a combination of the aforementioned items is essential in

70
order to take advantage of the best possible from the technologies already on the market and
benefit of potential synergies from the interaction of the installed devices.
Another aspect to be considered is the maturity evaluation of the project, as can be seen in
the IBM matrix resubmitted in this section with such analysis (Table 12), in which is
represented the approximate level of the proposed terminal with the installation of the
technologies described above. Thus, it is clear that it is a highly technological system with
high level of efficiency, requiring integration and constant monitoring of all operative
activities. Among them, proper execution of the logistics on arrival and departure of trucks is
crucial so as to be compatible with the frequency of trains on the terminal.
Moreover, another ITS system that is mandatory in a project of such type is the
surveillance equipment to be installed in the terminal. It is very important to understand that
such terminal needs protection and a strict custom service, once it relies mainly on the
handling of export cargo.

71
Table 12 Maturity assessment through the IBM matrix
Level 1: Single
mode
Level 2:
Coordinated
modes
Level 3:
Partially
integrated
Level 4:
Multimodal
integration
Level 5:
Multimodal
optimized
Go
ver
na
nce
Strategic
planning
Functional area
planning (single
mode)
Project –
based planning
(single mode)
Integrated agency
– wide planning
(single mode)
Integrated
corridor – based
multimodal
planning
Integrated
regional
multimodal
planning
Performance
measurement Minimal
Defined metrics
by mode
Limited
integration across
organizational
silos
Shared
multimodal
system – wide
metrics
Continuous
system – wide
performance
measurements
Demand
management
Individual static
measure
Individual
measures, with
long-term
variability
Coordinated
measures, with
short-term
variability
Dynamic pricing
Multimodal
dynamic pricing
Tra
nsp
ort
net
wo
rk s
yst
em
Data collection Limited or
manual input
Near real-time for
major routes
Real-time for
major routes
using multiple
inputs
Real-time
coverage for
major corridors,
all significant
modes
System – wide
real-time data
collection across
all modes
Data integration
and analytics
Limited with ad
hoc analysis
Networked but
periodic analysis
Common user
interface with
high-level
analysis
Two-way system
integration and
analysis in real-
time
Extended
integration with
multimodal
analysis in real-
time
Network
operations
response
Ad hoc, single
mode
Centralized single
mode
Automated,
single mode
Automated,
multimodal
Multimodal real-
time optimized
Incident
management
Manual detection,
response and
recovery
Manual detection,
coordinated
response, manual
recover
Automated
detection,
coordinated
response, manual
recover
Automated pre-
planned
multimodal
recovery plans
Dynamic
multimodal
recovery plans
based on real-
time data
Inte
gra
ted
tra
nsp
ort
ser
vic
es Customer
relationship
Minimal
capability, no
customer
accounts
Customer
accounts
managed
separately for
each system /
mode
Multichannel
account
interaction by
mode
Unified customer
account across
multiple modes
Integrated
multimodal
incentives to
optimize
multimodal use
Payment systems Manual cash
collection
Automatic cash
machines
Electronic
payments
Multimodal
integrated fare
card
Multimodal
multichannel
(fare cards, cell
phones, etc.)
Traveler
information Static information
Static trip
planning with
limited real-time
alerts
Multichannel trip
planning and
account-based
alert subscription
Location-based,
on-journey
multimodal
Location-based,
multimodal
proactive
rerouting

72
The three main strategies where performance levels are evaluated are governance,
transport network optimization and integrated transport services. The model is a macro level
multimodal analysis. Like most maturity models, an organization’s current and best practice
levels can be mapped and gaps identified. Leading practice is considered to be shifting to the
right over time (level 5: multimodal optimized).
5.5. Evaluation on environmental impact caused by implementing the Modalohr
terminal
Brazil currently has a transport infrastructure that does not operate efficiently between
modes, causing a serious imbalance in the transport framework. Logistics costs in Brazil
reached an amount equivalent to 11.6% of GDP in 2008, equivalent to R$349 billion.
Therefore, with the inefficiency of the system, it is observed that for the environment, these
costs can result in high greenhouse gases emission levels (CNT, 2010).
The transport sector has been the leading consumer of oil in Brazil for a long time,
through the extensive use of cars powered with gasoline and diesel, fossil fuels most used in
the industry. In 2009, the sector alone was responsible for the consumption of 51.2% of the
total oil products consumed in the country (EPE, 2010).
Within such a high consumption of petroleum products, the transportation sector was
responsible for the intake of 35.8 million cubic meters of diesel, with 97% of this
consumption only in the road sector, which corresponds to 34.6 million cubic meter (EPE,
2010). This consumption of diesel by road was equivalent to 78% of diesel consumption in
Brazil in 2009 (EPE, 2010). Gasoline is a fossil fuel that is used only by the transport sector,
and is the second most used fuel in the country. Figure 28 illustrates the fact that the energy

73
consumption and CO² emissions per amount of cargo (grams of CO² per net ton-kilometer)
are higher for road transport, followed by rail and waterway transport.
Figure 28. CO² emissions by transport mode in Brazil
It is noted, therefore, that changing the modal in a regional transport of cargo from road to
less intensive energy modes, can have a potentially important role in greenhouse gases
mitigation. The sector plan for transport and urban mobility for the mitigation and adaptation
to climate change, on the cargo transport, prepared by the transport ministry, explores this
role, estimating the potential impact of the implementation of projects from the national plan
for logistics and transport
(IEMA, 2015).
In this way, it was preceded with the analysis of the potential CO² reduction emitted into
the atmosphere through the installation of Modalohr terminal. The conducted study aimed to
quantify the maximum reduction that the installation of the proposed technology would bring
to the environment by reducing the number of outstanding trucks on the highways from Mato
Grosso to the port of Santos. For this, the following distances from Figure 29 were considered
“PSTM – Plano Setorial de Transporte e da Mobilidade Urbana para Mitigação e Adaptação à Mudança do
Clima”
“PNLT – Plano Nacional de Logística e Transportes”
101,2
23,3 20,0 13,8
7,9 5,0
0
20
40
60
80
100
120
Rodoviário Ferroviário(exceto
minério deferro)
Navegaçãointerior
Cabotagem(exceto
petróleo egás natural)
Ferroviário(minério de
ferro)
Cabotagem(petróleo egás natural)
g C
O2/t
ku

74
as evaluation assumptions:
Figure 29. Distances between Sorriso (Mato Grosso) and the port of Santos - road and road-rail options
In order to encourage the rail modal efficiency for the selected section, it was taken the
data provided by the railway concessionaire ALL for this analysis. The value used in the
calculations was the median between the selected sub-sections resulting on an efficiency of
4.64 * litros/NTK (Table 13).
Table 13. Railway energetic efficiency
Section
Annual
comsumption [liters
of diesel]
Annual handling
[NTK]
Efficiency [lliters /
10^3*NTK]
Alto Araguaia - Olacyr
Morais 4,552,770 980,636,936 4.64
Olacyr Morais - Chapadão do
Sul 511,411 189,974,033 2.69
Chapadão do Sul - Santa Fé
do Sul 2,755,618 1,039,230,324 2.65
Santa Fé do Sul - Rio Preto
Paulista 10,388,509 2,591,106,909 4.01
Rio Preto Paulista - Santa
Adélia 3,064,704 609,660,859 5.03
Santa Adélia – Araraquara 4,061,579 804,476,089 5.05
Araraquara – Rio Claro Novo 13,483,445 1,830,658,118 7.37
Rio Claro Novo – Itú 9,482,507 1,908,447,264 4.97
Itú – Embúguaçú 13,733,230 1,610,784,438 8.53
Embúguaçú – Paratinga 3,853,028 1,083,941,085 3.55
Paratinga – Conceiçãozinha 1,120,939 311,225,117 3.60

75
From this and making the use of rationale presented in the theoretical background section,
the following CO² emission results were obtained (Figure 30):
Figure 30. Maximum CO² emissions
With the result it is possible to see that the installation of the proposed terminal would
have a significant impact on decreasing the CO² emissions per year. It is worth emphasizing
that the study considers the maximum potential on CO² reduction only regarding the soybean
transport. In the scenario that it is considered the soybean handling for the early years of
operations for the terminal, the approximate gain in reducing CO² emissions would be
projected as being 409,000 tons per year. This value shows that even if not operating at its full
capacity, this multimodal system is already able to promote a relevant impact on the
environment.
Potential reduction of 686 thousand tons of CO² annually
Roadway mode
Annual emission of 1.596 million ton of
CO²
road-rail multimodal - Modalohr
Annual emission of 0.919 million ton of
CO²

76
6. Conclusions
This study was intended to analyze the flow of the Brazilian soybean from the main
producing farms from the state of Mato Grosso to the port of Santos. Such assay is
fundamental for the country’s economy and for maintained its important position among the
main global players.
Therefore, in order to improve the current system, it was proposed a new technology,
currently only available in Europe, to be installed in the tropical country. The referred
proposal was the Modalohr system. The idea was the implementation of a transshipment
terminal in the municipality of Rondonópolis (Mato Grosso) to add capacity of the already
existing terminal that uses the tipping technique.
Thereby, after detail analysis made possible due to the data provided by the company that
operates the existing terminal (ALL), it was possible to verify that new technologies are
critical for the Brazilian competitiveness worldwide. Another very important aspect to
mention is the lack of infrastructure projects that the country currently faces and its negative
effect in the soybean market.
After the study, it was also possible to understand that the soybean producers are the most
affected by right freight prices, once the final price charged by then is directly influenced by
the handling cost. Moreover, another analyzed feature was the need of ITS technologies in the
new terminal in order to promote all the benefits discussed in the material. Thus, with the
correct installing of such items, the proposed terminal can provide a more efficient system.
Furthermore, a very important analysis was made regarding CO² emissions. The result
showed that it is fundamental to invest in cleaner transport methods, mainly the ones with
such a substantial impact due to the high volume of cargo handled.
In short, this material was able to prove the aforementioned intention of proving that the
77
Modalohr technology would cause a positive impact in the Brazilian infrastructure regarding
the soybean market. Therefore, it is very important to mention that further studies toward the
infrastructure as whole are sorely recommended in order to promote development and
integrate the vast territory in Brazil

78
7. References
MACEDO; LUÍS OTÁVIO BAU (2013). Diagnóstico dos impactos do complexo intermodal
da ferronorte ao município de RondonópolisI. Universidade Federal de Mato Grosso.
TARDELLI; BRUNO LEONARDO SILVA (2013). O escoamento de soja de mato grosso
para exportação: uma análise de integração espacial de mercados e dos impactos da redução
dos custos de transporte. Porto Alegre: Universidade Federal do Rio Grande do Sul.
ANTP (2012). Sistemas Inteligentes de Transporte. Vol.8
DA CUNHA; CLAUDIO BARBIERI (2014). Potencial de redução de emissões de gases de
efeito estufa através de intermodalidade no transporte de soja. São Paulo: Escola Politécnica
da Universidade de São Paulo.
CYPRIANO, L. A. et al. (2005). Formação do frete no Brasil: Subsídios para estratégias de
negociação em cadeias de suprimentos. Toledo: Unioeste.
COSTA, M. V. V. (2008). Expansão do agronegócio e logística de transporte no Estado de
Mato Grosso. Rio de Janeiro: AGB.
MACHADO, L. O. (2010). Fatores de Formação do Preço da Soja em Goiás. Goiás: Seplan-
GO.
ALL – América Latina Logística. Disponível em: <http://all-logistica.com/>. Several
accesses.
Aprosoja. Disponível em: <http://www.aprosoja.com.br>. Several accesses.

79
CONAB – Companhia Nacional de Abastecimento. Disponível em:
<http://www.conab.gov.br/sitio/>. Several accesses.
IMEA – Instituto Mato-grossense de Economia Agropecuária. Disponível em:
<http://www.imea.com.br/>. Several accesses.
LOHR Industries. Available in:
<http://www.lohr,fr/combine_rail_route/index.php?lang=en>. Several accesses.
AGUIAR, D. R. D. (1990). Formação de preço na indústria da soja 1982 -1990.140 p.
Dissertação (Mestrado) – Escola Superior de Agricultura “Luis de Queiroz”, Universidade de
São Paulo, Piracicaba, 1990.
DALLA CHIARA B., MARIGO D., BENZO G. (2002). Interporti e terminali intermodal:
progettazione, gestione, sistemi telematici, riferimenti normativi, terminologia. Milano.
DALLA, CHIARA B. (2009). Sistemi di trasporto intermodal: progettazione ed esercizio:
problematiche generali, approccio técnico-operativo alle varie modalità di trasporto
combinato (includendo quelle stradalle, ferroviária, marittima e fluviale) per la progettazione
e l’esercizio, com rappresentazioni grafiche e schemi per uma più agevole comprensione dela
matéria. Forlì.

80
LOGISTIQUE. (2011). Ferroutage : le wagon Modalohr pourra emprunter le Tunnel sous la
Manche. Available in < http://www.wk-transport-
logistique.fr/actualites/detail/46460/ferroutage-le-wagon-modalohr-pourra-emprunter-le-
tunnel-sous-la-manche.html>. Access in 02/24/2016.