“Policy to Projects” Process - ncleg. · PDF fileInfrastructure Health 40% *Safety...
64
February 19, 2013 Joint Appropriations Subcommittee on Transportation Mike Bruff, Alpesh Patel, Calvin Leggett, Delbert Roddenberry “Policy to Projects” Process NCDOT
Transcript of “Policy to Projects” Process - ncleg. · PDF fileInfrastructure Health 40% *Safety...

February 19, 2013
Joint Appropriations Subcommittee on Transportation
Mike Bruff, Alpesh Patel, Calvin Leggett, Delbert Roddenberry
“Policy to Projects” Process
NCDOT

Outline
• History of Reform at NCDOT – Alpesh Patel
• Long-Range Transportation Planning – Mike Bruff
• 10 & 5 Year Work Program / Strategic Prioritization
– Alpesh Patel
• Mobility Fund and Urban Loops
• State Transportation Improvement Program –
Calvin Leggett
• Unpaved Secondary Road Prioritization – Delbert
Roddenberry
2

History of Reform
Challenges facing the Department prior to 2009:
• 7-Year Construction Program (more needs vs. revenue)
• Delivery Rate below 50%
• Clear priorities not established
• Various mission and goal statements
• Inability to clearly & regularly convey performance results
3

Transportation Reform: “Policy to Projects”
• Strategic Planning
• Improved Communication
• Public Input
• Data-Driven Decisions & Prioritization Process
• Open and Visible Process (Transparency)
• Accountability and Performance (Credibility)
• Performance & Results Driven Organization
• Role of the Board of Transportation
4

NCDOT’s Strategic Planning Framework
N.C. Statewide Transportation Plan (2040 Plan)
Blueprint for transportation planning and investment over the next three decades.
Adopted by NC Board of Transportation in August 2012
NCDOT Program and Resource Plan (10 Year)
Allocates funds for all programs and predicts the outcomes for the level of investment
Guided by strategic prioritization and cash model, also statutory, legal and scheduling constraints
NCDOT State Transportation Improvement Program (STIP – 7 years)
NCDOT Work Program (5 Year)
Comprehensive list of projects, programs, and services
Goal: Increase partner/public confidence in a stable, reliable schedule
5

Long-Range Transportation Planning
Mike Bruff
6

2040 Plan Overview
The 2040 Plan identifies:
1. Challenges & Opportunities
2. Long-term modal infrastructure and
service needs
3. Sustainable financing options
4. Strategic investments and plan
implementation
7

2040 Plan is a major update of NC’s
Statewide Transportation Plan:
• NCDOT’s overarching guide for transportation planning and
programming.
• A broad direction for where NCDOT should concentrate
efforts in the future.
• High-level document to guide NCDOT spending and policy
decisions.
• Recommendations for needed process improvements for
NCDOT to pursue.
8

2040 Plan Is NOT:
• A schedule for project implementation.
• A list of specific projects.
• A recommended future funding strategy.
9

Public & Agency Input
• Statewide Stakeholder Group
• Agency Coordination Group
• Regional Stakeholders webinars
• 3 surveys (more than 8,500 total responses)
• MPO/RPO regional workshops & MPO/RPO Association
briefings
10

Metropolitan Planning Organizations
A Metropolitan Planning Organization (MPO) is established in federal law and is responsible for:
• Carrying out a Continuing, Cooperative and Comprehensive (3C) transportation planning process in cooperation with the state DOT and transit operators
• Cooperatively developing, updating, and approving:
• (Unified) Planning Work Program ((U)PWP)
• Metropolitan Transportation Plan (LRTP)
• Transportation Improvement Program (TIP)
• Project Priorities for MPO Area
• Air Quality Conformity
• Having a proactive Public Involvement Process (PIP) 11

Rural Planning Organizations
A Rural Planning Organization (RPO) is established in state law and is responsible for:
• Assisting NCDOT in developing comprehensive transportation plans (CTP)
• Providing a forum for public participation in the transportation planning and project development processes
• Developing and prioritizing projects it believes should be included in the STIP
• Providing transportation-related information to local governments
12

2040 Plan – How Needs Were Identified
Urban Needs:
• Pulled from Metropolitan Planning Organizations’ (MPO) adopted
transportation plans
Rural Needs:
• Based on traffic growth rates, roadway characteristics, and
bridge and pavement management systems
Other Modes:
• Based on existing plans within NCDOT modal units
10
13

NCDOT’s 30-Year Needs and Funding Gap
Note: LOS = Level of Service 14

Key Findings and Conclusions of the
2040 Plan
• Transportation needs remain large and
challenging.
• Current transportation funding is insufficient.
• Describes various revenue options.
15

10 & 5 Year Work Programs
Alpesh Patel

Why Develop 10 & 5 Year Work
Programs?
• Short-Term business plan/strategy for the
Department
• Track every dollar spent and work from a balanced
cash picture (available dollars to projected expenditures)
• Customized for NC after extensive best practice
research
• Modeled after Florida DOT
17

10-Year Program and Resource Plan
Resource Allocation by Major Program Areas
Program 10 Year Allocation
Construction and Engineering $ 28.5 B
Maintenance $ 14.0 B
Operations $ 2.3 B
Administration $ 3.6 B
Total Program $ 48.4 B
Transfers $ 4.0 B
Total Budget $ 52.4 B
18

5-Year Work Program
• Provides a level of detail that guides day-to-day
operational plans of NCDOT
• Represents a “snapshot” schedule of near term
Projects, Programs and Services to be delivered
• Ongoing objective: work towards 95% delivery rate
(on time, on budget)
19

Investment Mix Overview
Investment by Transportation Goal Percentage of Plan
Mobility 51%
Infrastructure Health 40%
*Safety 2%
Works Well and Great Place (Administration) 7%
Investment by Transportation Tier Percentage of Plan
Statewide 51%
Regional 12%
Subregional 25%
Other (Operations, Administration, Reserves) 12%
* Percentage of transportation dollars spent on Safety are actually higher due to the inherent safety improvement
typically made under mobility & infrastructure health investments
20

Next Steps
• DRAFT 10 & 5 Year Program plus State
Transportation Improvement Program (STIP) to be
released Fall 2013
• Amendments to previously adopted STIP continue
monthly
• STIP delivery rate trend (last 5 years) is positive
21

Strategic Prioritization
Alpesh Patel
22

Strategic Prioritization
• Strategic Planning Office of Transportation (SPOT) created in
2009 to help address reform challenges.
• First version of strategic prioritization was called P1.0 (2009),
second version P2.0 (2011), now on P3.0.
• Combine data plus input of local partners to score
transportation projects across the state.
• Input of key external planning partners has helped develop
the strategic prioritization process. 23

Current Scope of Prioritization in NCDOT
SPOT prioritization covers 85% of STIP Construction (subject to Equity
Formula)
• Mobility Fund & Urban Loop Processes (not subject to Equity formula)
Other highway programs with prioritization process outside of SPOT • Spot safety
• Bridges and pavement resurfacing
• Secondary Road program
Prioritization processes exist for all non-highway modes
Strategic Prioritization successful due to local partners
• Survey of MPOs and RPOs by Legislature (2012) indicates substantial support of the
process 24 24

“The Department shall develop and utilize a process for selection of
transportation projects that is based on professional standards in
order to most efficiently use limited resources to benefit all citizens
of the State.
The strategic prioritization process should be a systematic, data-
driven process that includes a combination of quantitative data,
qualitative input, and multimodal characteristics, and should include
local input.
The Department shall develop a process for
standardizing or approving local methodology used in
Metropolitan Planning Organization and Rural
Transportation Planning Organization prioritization.“ - S.L. 2012-84
Prioritization Now in Law
25

How it All Fits Together: NCDOT Policy to Projects
Strategic Prioritization
(years 6-10)
26
26

Strategic Prioritization and Programming Process
1. Score
Prioritize Projects using
• Data
• Local Input
• Multimodal
Characteristics
• Classify ranked
Projects into Buckets
(Mode, Goal, Tier)
2. Strategize
Set Investment Strategy
• Conduct
Scenario/Trade-off
Analysis with DOT &
Partners
• Constrained only by
Total Available
Revenue
3. Schedule
Program Projects
• Develop STIP using
Project Rankings &
Investment Strategy
• Apply Constraints
• Compare Selected
Strategy vs. Applied
Constraints
27

Current Highway Prioritization Model Total Score = Quantitative Score + Local Input/Rank + Multimodal Score
Quantitative Score • Congestion Score - (volume/capacity + average daily traffic)
• Pavement Score - (pavement condition rating)
• Safety Score - (critical crash rate, crash severity, crash density)
• Benefit Cost - (travel time savings divided by cost of the project)
• Economic Competitiveness - (value added in area by constructing project)
• Shoulder Width - (existing vs. design)
• Lane Width - (existing vs. design)
Local Input/Rank Score driven by top local priority projects
MPO/RPO Rank — use local methodology to rank order priorities
Division Rank — use knowledge of local area to rank order priorities
Multimodal Bonus Score – enhancing multimodal connections/choices 28

Aviation, Rail, and Ferry Prioritization
Processes
• Aviation – Data only drives scoring. (17 categories/activities within three
NCDOT Goals of Safety, Infrastructure Health and Mobility)
• Rail – Data only drives scoring. High-speed rail projects driven by grant
requirements. Grade-crossing projects are evaluated by a rail
investigative index (Average Daily Traffic and frequency of trains)
• Ferry – Data only drives scoring. Condition of vessels and facilities
(buildings and ferry terminals)
• Bike/Ped and Transit prioritization criteria under revision in P3.0
29

Strategic Prioritization and Programming Process
1. Score
Prioritize Projects using
• Data
• Local Input
• Multimodal
Characteristics
• Classify ranked
Projects into Buckets
(Mode, Goal, Tier)
2. Strategize
Set Investment Strategy
• Conduct
Scenario/Trade-off
Analysis with DOT &
Partners
• Constrained only by
Total Available
Revenue
3. Schedule
Program Projects
• Develop STIP using
Project Rankings &
Investment Strategy
• Apply Constraints
• Compare Selected
Strategy vs. Applied
Constraints
30

Outreach Investment Strategy Summits
Summits held throughout NC
• Partner and public input opportunity
Purpose is to seek input of where to apply
expected 10-Year revenue
• What are the high-level priorities and what is the
investment needed to achieve those priorities?
Use LOS to determine return on investment
(more $’s = improved LOS and higher performance results)
Outcome is a “strategy of where transportation $ should be spent”
31

Strategic Prioritization and Programming Process
1. Score
Prioritize Projects Using
• Data
• Local Input
• Multimodal
Characteristics
2. Strategize
Set Investment Strategy
• Classify ranked
Projects into Buckets
(Mode, Goal, Tier)
• Conduct
Scenario/Trade-off
Analysis with DOT &
Partners
• Constrained only by
Total Available
Revenue
3. Schedule
Program Projects
• Develop STIP using
Project Rankings &
Investment Strategy
• Apply Funding
Eligibility Constraints
• Compare Selected
Strategy vs. Applied
Constraints
32

Based on Partner Input and New Administration:
• Economic & Employment Impact component & scoring criteria
• Better travel time data
• Military base and seaport connections
• Bicycle & Pedestrian scoring (in progress)
• Public Transportation scoring (in progress)
• Automated project cost-estimation tool (creates statewide consistency)
Prioritization 3.0 goes “live” early 2014
Enhancements to P2.0 Will Result in P3.0
33

North Carolina Mobility Fund
Alpesh Patel
34

Created in 2010 • First project is I-85 Yadkin River Bridge Phase II
• Addresses critical congestion bottlenecks of statewide and regional importance
• Improves NC logistics and economic development capabilities
• Initial project selection criteria developed with assistance from public and key
stakeholders, in accordance with statute
• FY 13 = $75.5M; FY 14+ = $58M
Legislature modified project selection language in 2011 • NCDOT revised project selection criteria – greater emphasis on travel time
savings
NCDOT solicited candidate projects in December 2011 • Submittal window open December 1, 2011 – February 29, 2012
• Available to public, partners, and stakeholders
• 95 projects evaluated for Mobility Funds
History
35

• Must be on Statewide or Regional Tier
• Focus on short delivery time – funds must be ready for construction within
5 years.
• Must be identified on an adopted long-range transportation plan,
consistent with a local land use plan where available.
• Projects must be in a conforming air quality plan in non-attainment or
maintenance areas.
• Capital expenditures only; Maintenance, Operational & Planning
costs ineligible.
• No minimum cost as threshold for funding.
Minimum Eligibility Requirements
36

Project Scoring Criteria & Weights
CRITERIA WEIGHT DESCRIPTION
Mobility Benefit / Cost
80%
• Measured by travel time
savings (in vehicle hours)
• Divided by “cost to Mobility
Fund”
• Used to compare projects
across transportation modes
Multimodal
20%
• Yes / No question
• Project improves more than one
mode of travel
• Sliding scale
No Cap on the Mobility Benefit/Cost Scoring
37

Candidate projects submitted to NCDOT
95 Projects evaluated - DOT reviewed data to ensure quality control
Projects ranked using scoring factors
DOT developed Draft Funding Schedule considering: • Project readiness (i.e. when project can be let for construction)
• Availability of Mobility Fund dollars
Projects scheduled for construction included in DRAFT 10 Year Policy
to Projects Document / STIP (released October 2012)
Mobility Fund Process
38

Urban Loop Prioritization
Alpesh Patel
39

• 10 Urban Loop Areas
• 21 Urban Loop TIP Projects and 4 Urban Loop TIP Interchange projects
• Remaining cost to complete the system is more than $8 billion
• At current funding levels, it will take more than 50 years to complete
• Separate prioritization process and funds not subject to equity
• Extensive public input developing the process
• Objective, data-driven process
Urban Loop Facts
40

41
Formula Components
• Needs Factors
• Congestion needs 10%
• Safety needs 5%
• Benefits Factors
• Travel time savings (each project) 10%
•Travel time savings (all projects) 15%
• Economic Development 15%
• Freight Volume 10%
• Total Traffic 10%
• Multi-modal 5%
• Protected Right-of-way 10%
• Connectivity 10%
• Divided by Cost
Urban Loop Prioritization
41

Legislative Changes - 2012
• Section 28.34 (a) . G.S. 136-180 directs NCDOT to designate Loop
projects and continue a prioritization process. Exceptions are:
• Charlotte (I-485 Widening)
• Greensboro (I-840 Western Loop (Sections C/D))
• Greensboro (I-840 Eastern Loop (Section B))
• Wilmington (US 17 Bypass)
• Work with local communities to seek other creative funding strategies –
every local dollar increases chances for accelerated delivery
• Conduct formal re-prioritization for all projects in 2014
42

State Transportation Improvement Program
(STIP)
Calvin Leggett
43

State Transportation Improvement
Program (STIP) Statutory Requirements
• Spans a minimum 4-year period
• Fiscally constrained by year
• Submitted for FHWA approval
at least every 4 years
• Public has opportunity to
comment on TIP document
• Includes all capital and non-
capital projects using Title 23
USC or Title 49 USC funds,
other than certain safety,
planning, and research funds.
• Includes metropolitan TIPs
from MPOs
• Board of Transportation
function
• Spans 7-year period
• TIP funds subject to equity
formula, except: *Urban loops
• *Mobility Funds
* Federal-aid CMAQ
* Federal competitive and
discretionary grants
• NCDOT may receive loans
from local government & non-
profit entities to advance
construction
Federal State
44

TIP
Project
Development
Time
Equity Formula Funding
Constraints
Construction
Sequence
Additional Information on Factors Influencing
STIP
Prioritization Results ≠ Programming 45

Projected Uses of NCDOT Appropriations 2012-13
Total Funding = $5.2 Billion
46

Highway System Eligibility by Funding
Source
0
10000
20000
30000
40000
50000
60000
70000
80000
1
Mile
s
Not eligible for TrustFund or Federal-aid
Not Trust Fundeligible but Federal-aid eligible
Trust Fund eligible -unpaved
Trust Fund eligible -paved
47

Project Development Stages
TIP
Feasibility Study
12-18 months
Environmental
Documentation
CE - 18-24+ months
EA/FONSI - 3-7+ years
EIS - 5-10+ years
Design
12-36+ months
ROW / Utilities /
Environmental
Permits
12-24+ months
Initiate planning process per TIP schedule
Construction
1-4+ years
Add to
letting
schedule
Place on
ROW
authorization
list
48

1989 Equity Formula
50%
POPULATION OF REGION
AS PERCENT OF STATE
25%
REMAINING
INTRASTATE
SYSTEM
MILES
25%
EQUAL
SHARE
Loops , CMAQ, Competitive
Federal Grant Funds, Appalachian
Development, and Mobility Fund Excluded
49
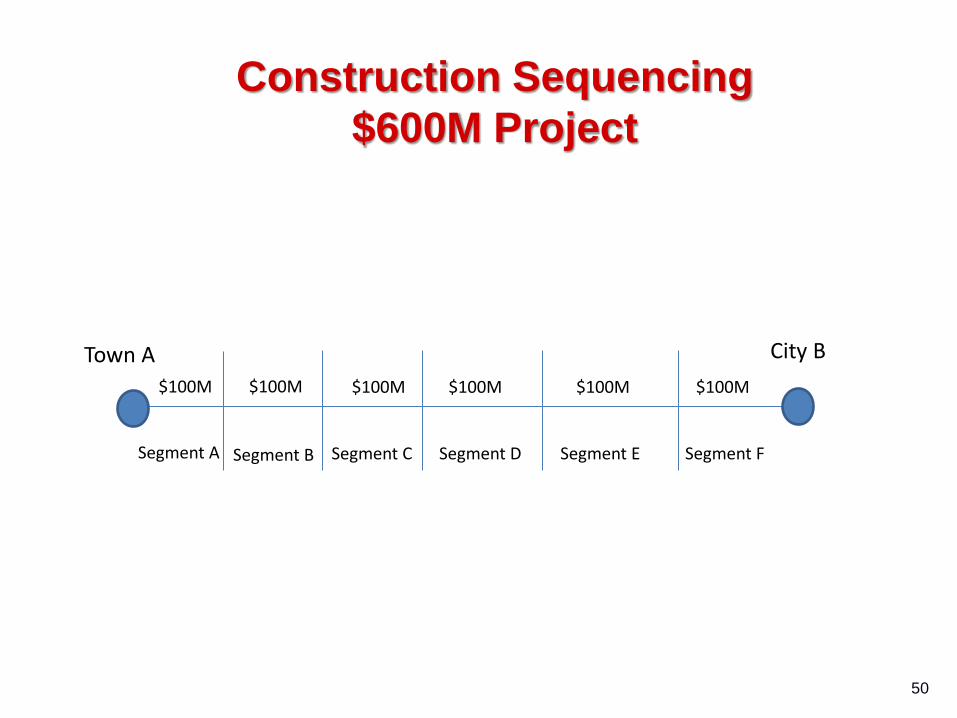
Construction Sequencing
$600M Project
Town A City B
$100M $100M $100M $100M $100M $100M
Segment A Segment B Segment C Segment D Segment E Segment F
50

MAP-21
• 27-month bill
• SAFETEA-LU expired on 9/30/09
• 10 extensions (final one from 7/1/12 – 7/6/12)
51

Unpaved Secondary Roads Prioritization Process
Delbert Roddenberry
52

State Maintained Unpaved Roads
53

~ 3630 miles of Unpaved SR Routes
• Miles on Hold List: 2070
• Miles Eligible for Rating: 1560
What is Left
54

0
200
400
600
800
1000
1200
> 13,000 Miles Paved from 1989 to 2011
Miles of Dirt Road Paving
55

Paving Priority Selection
• Unpaved Road Improvement Projects:
• Periodic Rating Cycle with point system
• - Land use Characteristics
• - Traffic Volume
• - Route Characteristics
• 100 County Specific Prioritization Lists
56

Paving Program Challenges
• Right-of-Way
• Constructability and environmental permitting issues
• Maintenance costs of paved vs. unpaved roads
• Increasing cost of construction versus homes served
57

• Began to transition to an Improvement Program to better
address safety and mobility needs through modernization
improvements on the secondary road system
• Incorporate widening, resurfacing, safety, and bridge
replacement projects on the Secondary Paved System
(Modeled the NC Moving Ahead! program)
• Emphasis placed on completion of the paving program to
the extent possible in counties where the unpaved mileage
is significant.
Statutory Changes 2005-2006
58

PRIORITIZE PAVING OF UNPAVED ROADS THROUGHOUT THE STATE
SECTION 24.15.
For fiscal year 2012-2013, the Department of Transportation shall expend funds
allocated to the paving of unpaved secondary roads for the paving of unpaved
secondary roads based on a statewide prioritization. The Department shall pave the
eligible unpaved secondary roads that receive the highest priority ranking within this
statewide prioritization, notwithstanding the distribution formula in G.S. 136-17.2A or
any other funding distribution formula in law. This section applies to funding for the
paving of secondary roads from both the Highway Fund and the Highway Trust Fund.
House Bill 950 (Fiscal Year 2012-13)
Statewide Prioritization
59

Looking Forward
Unpaved Roads and Paved Roads
• How does North Carolina address the needs of the
secondary road system with limited resources and
increasing demand and inventory?
60

Looking Forward
Unpaved Roads
• Consider continuing the statewide paving priority system for
unpaved roads.
• Consider minimum threshold for paving unpaved roads
• For example, minimum traffic volumes, land use
density, etc…
• Consider designating a portion of secondary road program
funds for paving prioritized unpaved roads.
61

Looking Forward
Unpaved Roads
Potential benefits of prioritized system:
• Increases confidence that funds are being expended on
projects of greatest need
• Continues commitment to pave unpaved roads
Potential impacts of prioritized system:
• Less local involvement
• Negative reaction from property owners
62

Online Resources • Reform webpage http://www.ncdot.gov/performance/reform/
• 2040 Plan http://ncdot.gov/performance/reform/2040Plan/
• Prioritization process
http://ncdot.gov/performance/reform/prioritization/
• Project search engine tool http://www.ncdot.gov/projects/
• Secondary Roads Program
https://connect.ncdot.gov/resources/stateroads/Pages/default.aspx
63

Questions?
64