
PointView presentation for GridWeek 2012 by Erik Gilbert€¦ · ENERGY Pacific Northwest Smart...
24
ENERGY Pacific Northwest Smart Grid Regional Business Case (RBC) Benefit-Cost Model A System-of-Systems Approach to Understanding Value B O N N E V I L L E P O W E R A D M I N I S T R A T I O N 10/5/2012 Lee Hall, Smart Grid Program Manager, BPA; Erik Gilbert, Director, Navigant. A System-of-Systems Approach to Understanding Value GridWeek 2012 GridWeek 2012
Transcript of PointView presentation for GridWeek 2012 by Erik Gilbert€¦ · ENERGY Pacific Northwest Smart...

E N E R G Y
Pacific Northwest Smart GridRegional Business Case (RBC)
Benefit-Cost ModelA System-of-Systems Approach to Understanding Value
B O N N E V I L L E P O W E R A D M I N I S T R A T I O N
10/5/2012
Lee Hall, Smart Grid Program Manager, BPA; Erik Gilbert, Director, Navigant.
A System-of-Systems Approach to Understanding Value GridWeek 2012
GridWeek 2012

BPA Smart Grid Regional Business Case Update
Why a Regional Business Case (RBC) for Smart Grid?
The smart grid promises many benefits for the region, including:
» Better reliability» Lower rates» Environmental stewardship» More accountability to regional stakeholders
But, benefits are uncertain and stakeholders are inexperiencedwith emerging technologies and new types of investments.
1©2012 Navigant Consulting, Inc. Confidential and proprietary. Do not distribute or copy. E N E R G Y
Source: “NIST Framework and Roadmap for Smart Grid Interoperability Standards Release 1.0 (Draft),” Office of the National Coordinator for Smart Grid Interoperability, NIST (September 2009).
What can BPA do in its role as a regional steward to help stakeholders understand and minimize risks, while facilitating the benefits expected from the smart grid?
BPA is developing the RBC to:» Understand the potential for smart grid benefits» Understand the risks for regional stakeholders» Assist Regional stakeholders by providing information to
help make appropriate investments in smart technologies.
GridWeek 2012

Path Forward
Increasing Granularity and Reduced Uncertainty
BPA Smart Grid Regional Business Case Update
RBC phases: moving from a top-down, conceptual analysis to a robust, bottom-up model
iRBC
Preliminary, top-down analysis used to frame the issues and the range of costs and benefits. iRBC =
RBC Framework
Structured bottom-up framework allows incorpora-tion of data from PNW Demo Project and other sources to
RBC Phase I.a
Bottom-up computational model with results in selected functional areas.
RBC Phase I.b
Input develop-ment for range of asset systems and functions. Updated bottom-up analysis with evaluation of
RBC Phases II&III
Incorporate results from the PNW Demo Project and other sources. RBC update(s) using best available data from
2©2012 Navigant Consulting, Inc. Confidential and proprietary. Do not distribute or copy. E N E R G Y
benefits. iRBC = introductory Regional Business Case.
and other sources to better understand uncertainties and asset impacts
with evaluation of assets and uncertainties.
available data from current experiments and studies.
2009 2010 2011 2012 2013-2015
iRBC:8 benefit categories
ACEEE Update:6 benefit categories
1 2 3 4 5 6 7 8 9 10 11 12 13 14 15 16 17 18 19 20 21 22 23 24 25 26 27 28 29 30 31 32 33 34 35 36 37 38 39 40 41 42 43 44 45 46 47 48 49 50 51 52 53 54 55 56 57 58 59 60 61 62 63 64 65 66 67 68 69 70 71 72 73 74
1 Cong
estio
n M
etric
s
Softw
are &
Syst
ems
Cost
2 T&D Op timiz ation X X X X X X X X X X X X X X X X X X X X X X X X X X X X X X X X X X X X X X X X X X X X X X X X X X3 Autom at ed Volt age and VA R Contr ol X X X X X X X X X X X X X X X X X X X X X X X X X X X X X X X X X4 Conse rvation Volt age Re duct ion (CV R) X X X X X X X X X X X X X X X X X X X X X X X X X5 Dynamic Capacity Rating X X X X X X X X X X X X X X X X X X X X
6 Power Flow Contro l & Real Time Load Transfer X X X X X X X X X X X X X X X X X X X X X X X X X X X X X X X7 Improved T&D Line Ef fici ency X X X X X X X X X X X X X X X X8 Infras tructur e Lif e Ext ension f rom Equipme nt Condit ion Diagnos is & Pr eventive Maint enance X X X X X X X X X X X X X X X X9 Phase Balancing X X X X X X X X X X X X X X X X X X X X X X
11 Wide Ar ea M onitor ing & Vis ualizat ion X X X X X X X X X X X X X X X X X X X X X X X X X X X X X X X X X X X X X X X X1213 End Use Energy Effic iency X X X X X X X X X X X X X X X X X X X X X X X X X X X X X X X X14 End U se Con ser vat ion from A utomat ed Consu mption Optimization X X X X X X X X X X X X X X X X X X X X X X X X X X X X X15 End U se Con ser vat ion from Be havior Change X X X X X X X X X X X X X X X X X X X X X X X X16 Enh an ced EE Program Market ing & Implem entation of Ef ficient End Us e Te chnol ogy X X X X X X X X X X X X X X X X X X X X X
17 Enh an ced EE Program Meas ureme nt & Evaluation X X X X X X X X X X18 Improved Equipme nt Efficiency f rom Cond ition Diagnos is & Maintenen ce X X X X X X X X X X X X X X1920 End Use Energy Reliability X X X X X X X X X X X X X X X X X X X X X X X X X X X X X X X X X X X X X X X X X X X X X X21 Autom at ed Islandi ng and Reconnection ( Micr o-G rid Capability) X X X X X X X X X X X X X X X X X X X X X X X X22 Enh an ced An cillary Services f rom Electric Vehic le Charging X X X X X X X X X X X X X X X X X X X X X X
23 Enh an ced An cillary Services f rom Statio nar y Ener gy Sto rage X X X X X X X X X X X X X X X X X X X X X X24 Enh an ced Fault Locati on, Isolat ion & Service Rest oratio n X X X X X X X X X X X X X X X X X X X X X X X X X X25 Enh an ced Fault Pre ve ntion X X X X X X X X X X X X X X X X X X X X X X X X X X X X X X26 Reduced Out ages from Equi pment Cond ition Diagnos is & Prevent ive M ain tenence X X X X X X X X X X X X X X X X X X X27
28 Dynamic & Re spons ive Demand X X X X X X X X X X X X X X X X X X X X X X X X X X X X X X X X X X X X X X X29 Demand Res ponse from Opt- In Utilit y C ontrol led Reduction Events (Dir ect Load Contr ol) X X X X X X X X X X X X X X X X X X X X X X X X X X X X X X X X30 Demand Res ponse from Electr ic Veh icle Charging X X X X X X X X X X X X X X X X X X X X X X X X X X X X X X X X X X31 Demand Res ponse from Opt- In Cust omer Con trolled Re duct ion Eve nts X X X X X X X X X X X X X X X X X X X X X X X X X X X X X X32 Demand Res ponse from V ar iable Pricing X X X X X X X X X X X X X X X X X X X X X X X X X X X X X X X X X X33 Load Shift ing f rom Statio nar y Ene rgy Sto rage X X X X X X X X X X X X X X X X X X X X X X X X X X X X X
3536 Renewable & Dis trib uted Syst ems Int egration X X X X X X X X X X X X X X X X X X X X X X X X X X X X X X X X X X X X X37 Centralized Gen eration - Re newable X X X X X X X X X X X X X X X X X X X X X X X X X X X X X38 ? Dis tribut ed Gener ation - N on-Ren ewab le X X X X X X X X X X X X X X X X X X X X X X X X X X X X X X X X X X39 Dis tribut ed Gener ation - Rene wable X X X X X X X X X X X X X X X X X X X X X X X X X X X X X X X X X X X40
41 Utility Operation al Eff icie ncy X X X X X X X X X X X X X X42 Autom at ed Meter Oper ating Savings X X X X X X X X X X X X X43 Utilit y Pr oce ss I mprovemen t X X X X X X X X X X X44
BENEFIT CATEG ORY / FUNCTION Ener
gy M
anag
emen
t Sys
tem
(EM
S) - C
omm
ercia
l & In
dustr
ial
Reclo
sers
/ Au
to-S
ectio
naliz
ing S
witc
hes
Valu
e of R
educ
ed C
onge
stio
n
Two-
way
Com
mun
icatio
ns In
frast
ructu
re (H
igh B
andw
idth
)
ASSE
T
Cust
omer
Con
sum
ptio
n Disp
lay/P
orta
l
End
Use R
emot
ely C
ontro
lled
Inte
rrupt
er/S
witc
h
Ener
gy M
anag
emen
t Sys
tem
(EM
S) - R
esid
entia
l
Hom
e Ar
ea N
etw
ork
Oth
er D
istrib
uted
Gen
erat
ion (N
G, LN
G, Fu
el C
ell, P
ropa
ne, D
eisel)
Adva
nced
Met
er In
frast
ructu
re (A
MI)
- Sm
art M
eter
s
Disp
atch
able/
Auto
mat
ed Ca
pacit
or B
anks
Smar
t App
lianc
es an
d Eq
uipm
ent
Smar
t The
rmos
tat
End
Use E
quipm
ent S
enso
rs (e
.g.,
Equi
pmen
t Hea
lth, C
onsu
mpt
ion, e
tc.)
Elec
tric V
ehicl
e (E
V) /
Plug
in H
ybrid
(PH
EV)
Rene
wabl
e Dis
tribu
ted
Gene
ratio
n (e
.g., S
mall
Win
d, So
lar, H
ydro
, etc
.)
Dist
ribut
ion
Man
agem
ent S
yste
m
Fault
Curr
ent L
imite
r
Load
Mon
itorin
g De
vice
Met
er D
ata
Man
agem
ent S
yste
m (M
DM
S)
Adva
nced
Tran
sfor
mer
s (e.g
., Lo
ad Ta
p Co
ntro
ls, M
TUs,
etc.)
Dist
ribut
ed St
orag
e (e
.g., B
atte
ries,
Flyw
heel
s, et
c.)
Mai
nten
ance
Cost
s
Cost Data
Ope
ratio
ns Co
sts
Valu
e of R
educ
ed E
miss
ions
Impact Valuation D at a
Unit
Equi
pmen
t Cos
ts
Inst
allat
ion
& In
tegr
ation
Cos
ts
Valu
e of I
ncre
ased
Ener
gy E
fficie
ncy
Valu
e of I
ncre
ased
Dem
and
Resp
onse
Cost
of I
nter
mitt
ent R
esou
rce In
tegr
ation
Valu
e of A
void
ed O
utag
es &
Red
uced
Out
age
Dura
tion
Trai
ning
Costs
Impact Data
Elec
tricit
y Pric
es (W
holes
ale &
Ret
ail)
Valu
e of A
void
ed A
ncilla
ry Se
rvice
s
Valu
e of A
void
ed Ca
pacit
y Ex
pans
ion
Valu
e of A
void
ed O
&M
Elec
tricit
y Con
sum
ption
(e.g
., Sub
stat
ion, F
eede
r, Cu
stom
er, e
tc.)
(kW
h per
inte
rval)
Syste
m P
ower
Facto
r (e
.g., S
ubst
ation
, Fee
der,
Cust
omer,
etc
.)
Gene
ratio
n Ca
pacit
y Fa
ctor
(0.0
0 - 1
.00)
Rene
wabl
e Ene
rgy G
ener
atio
n (M
W ca
pacit
y, kW
h ge
nera
tion)
Dist
ribut
ed En
ergy
Gen
erat
ion
(MW
capa
city,
kWh g
ener
ation
)
Elec
tricit
y The
ft (a
nnua
l kW
h)
Emiss
ions
(e.g.
, Gen
erat
ion, V
ehicl
e, et
c.) (
CO2,
CO2e
, SO
x, NO x,
Parti
cula
te)
Pow
er Q
uality
Indi
cies &
Met
rics
Relia
bilit
y Ind
icies
& M
etric
s (e.
g., S
AIDI
, CAI
DI, S
AIFI
, etc
.)
Tran
smis
sion &
Dist
ribus
tion L
ine L
oads
(e.g
., Su
bsta
tions
, Fee
ders
, etc
.) (M
W p
eak,
MW
load
pro
file)
Tran
smis
sion &
Dist
ribut
ion
Over
load
Eve
nts (
e.g.,
Sub
stati
ons,
Feed
ers, e
tc.)(
qty,
loca
tion)
Ot herCustom er DG Dis tr ibution Transmis sion
Fault
Indi
catio
n Te
chno
logy
Out
age
Man
agem
ent S
yste
m
Vehi
cle to
Grid
Infr
astr
ucut
re -
2 W
ay F
low
Auto
mat
ed V
olta
ge R
egula
tor
Mic
rogr
id Co
ntro
llers
& Te
chno
logi
es
Phas
e An
gle R
egul
atin
g Tra
nsfo
rmer
Cont
rolla
ble/
Regu
latin
g Inv
erte
r
Equi
pmen
t Hea
lth Se
nsor
(Dist
ribut
ion)
Adva
nced
Visu
aliza
tion &
Ana
lysis
Softw
are
(Dist
ribut
ion)
Flex
ible
AC T
rans
miss
ion S
yste
m (F
ACTS
) Dev
ices
Tran
smis
sion S
enso
rs (P
haso
r Mea
sure
men
t, Sy
nchr
opha
sor,
Tem
pera
ture
, Loa
d)
Very
Low
Impe
denc
e (V
LI) o
r Hi
gh T
emp
Supe
rcond
uctiv
ity (H
TS) c
ables
Defe
rred
Cap
acity
Expa
nsio
n (Ge
nera
tion,
Tra
nsm
ission
and
Dist
ribut
ion)
Tran
smis
sion &
Dist
ribut
ion
Line
Loss
es (%
, ann
ual k
Wh)
Equi
pmen
t Hea
lth Se
nsor
(Tra
nsm
issio
n)
Adva
nced
Visu
aliza
tion &
Ana
lysis
Softw
are
(Tran
smiss
ion)
DAT
A
Ope
ratio
ns &
Main
tena
nce
Requ
irem
ents
T&D
Equi
pmen
t Fai
lures
Tran
sact
ive C
ontro
l Sys
tem
Inte
grat
ed U
tility
IT Sy
stem
(IT
hard
ware
, sof
twar
e)
Cent
ral S
torag
e (e
.g., B
atte
ries,
Flyw
heel
s, et
c.)
Varia
ble R
ate S
truc
ture
Oth
er
Relational Model:Benefits mapping to assets
and data requirements
Deployment Model:Based on Smart
Grid Maturity Model
Research
Data Processing &Normalization
Model Output
Deployment Asset Systems
Stakeholders• Generation • Transmission• Distribution• Customer• Society• Environment
Interactions
Assets
Functions
Impacts
Costs ($)
Benefits ($)
ScenarioAnalysis
Uncertainty & Risk
Sensitivity Analysis
Input Development Computational Model Software DevelopmentScenario Development& Analyses
Computational Model:Bottom-up approach to estimate costs & benefits
Computational Model
101010101000010101101010101010010101010101010010101011110100000101010010000100010110101010010101010010101001010101001011000001010101001011101010
010101001010010110100010001001011101001010100100101001001010010101001010101001010101001010101001010100101010101001011010101001010101010101001010101010101001000001001010010101001010
101111010101010010101001010101001010101010010101010010101010010101010010101001010101001000000000111101010101001010010010100101010001010101001010
10010010101010101010101101
101010101000010101101010101010010101010101010010101011110100000101010010
000100010110101010010101010010101001010101001011000001010101001011101010
010101001010010110100010001001011101001010100100101001001010010101001010101001010101001010101001010100101010101001011010101001010101010101001010101010101001000001001010010101001010
101111010101010010101001010101001010101010010101010010101010010101010010101001010101001000000000111101010101001010010010100101010001010101001010
10010010101010101010101101
101010101000010101101010101010010101010101010010101011110100000101010010
000100010110101010010101010010101001010101001011000001010101001011101010010101001010010110100010001001011101001010100100101001001010010101001010101001010101001010101001010100101010
101001011010101001010101010101001010101010101001000001001010010101001010101111010101010010101001010101001010101010010101010010101010010101010010101001010101001000000000111101010101
00101001001010010101000101010100101010010010101010101010101101
101010101000010101101010101010010101010101010010101011110100000101010010
000100010110101010010101010010101001010101001011000001010101001011101010010101001010010110100010001001011101001010100100101001001010010101001010101001010101001010101001010100101010
101001011010101001010101010101001010101010101001000001001010010101001010101111010101010010101001010101001010101010010101010010101010010101010010101001010101001000000000111101010101
001010010010100101010001010101001010100100101010101010101011011111010100
101010101000010101101010101010010101010101010010101011110100000101010010000100010110101010010101010010101001010101001011000001010101001011101010
010101001010010110100010001001011101001010100100101001001010010101001010101001010101001010101001010100101010101001011010101001010101010101001010101010101001000001001010010101001010
101111010101010010101001010101001010101010010101010010101010010101010010101001010101001000000000111101010101001010010010100101010001010101001010
10010010101010101010101101
101010101000010101101010101010010101010101010010101011110100000101010010
000100010110101010010101010010101001010101001011000001010101001011101010
010101001010010110100010001001011101001010100100101001001010010101001010101001010101001010101001010100101010101001011010101001010101010101001010101010101001000001001010010101001010
101111010101010010101001010101001010101010010101010010101010010101010010101001010101001000000000111101010101001010010010100101010001010101001010
10010010101010101010101101
101010101000010101101010101010010101010101010010101011110100000101010010
000100010110101010010101010010101001010101001011000001010101001011101010010101001010010110100010001001011101001010100100101001001010010101001010101001010101001010101001010100101010
101001011010101001010101010101001010101010101001000001001010010101001010101111010101010010101001010101001010101010010101010010101010010101010010101001010101001000000000111101010101
00101001001010010101000101010100101010010010101010101010101101
101010101000010101101010101010010101010101010010101011110100000101010010
000100010110101010010101010010101001010101001011000001010101001011101010010101001010010110100010001001011101001010100100101001001010010101001010101001010101001010101001010100101010
101001011010101001010101010101001010101010101001000001001010010101001010101111010101010010101001010101001010101010010101010010101010010101010010101001010101001000000000111101010101
001010010010100101010001010101001010100100101010101010101011011101010100
101010101000010101101010101010010101010101010010101011110100000101010010000100010110101010010101010010101001010101001011000001010101001011101010
010101001010010110100010001001011101001010100100101001001010010101001010101001010101001010101001010100101010101001011010101001010101010101001010101010101001000001001010010101001010
101111010101010010101001010101001010101010010101010010101010010101010010101001010101001000000000111101010101001010010010100101010001010101001010
10010010101010101010101101
101010101000010101101010101010010101010101010010101011110100000101010010
000100010110101010010101010010101001010101001011000001010101001011101010
010101001010010110100010001001011101001010100100101001001010010101001010101001010101001010101001010100101010101001011010101001010101010101001010101010101001000001001010010101001010
101111010101010010101001010101001010101010010101010010101010010101010010101001010101001000000000111101010101001010010010100101010001010101001010
10010010101010101010101101
101010101000010101101010101010010101010101010010101011110100000101010010
000100010110101010010101010010101001010101001011000001010101001011101010010101001010010110100010001001011101001010100100101001001010010101001010101001010101001010101001010100101010
101001011010101001010101010101001010101010101001000001001010010101001010101111010101010010101001010101001010101010010101010010101010010101010010101001010101001000000000111101010101
00101001001010010101000101010100101010010010101010101010101101
101010101000010101101010101010010101010101010010101011110100000101010010
000100010110101010010101010010101001010101001011000001010101001011101010010101001010010110100010001001011101001010100100101001001010010101001010101001010101001010101001010100101010
101001011010101001010101010101001010101010101001000001001010010101001010101111010101010010101001010101001010101010010101010010101010010101010010101001010101001000000000111101010101
001010010010100101010001010101001010100100101010101010101011010001010100
1. Transactive Control 2. Reliability 3. Conservation & EE 4. Social
RBC Inputs(e.g., expected re duction in consumption and variance )
Test Case Results(e .g., annual % reduction in energy consumption )
Test Case Metrics (e .g., avg. monthly residential custome r usage)
Test Case Data(e .g., 15 minute inte rval meter data)
BPA/NavigantPhase II Input De velopment
BattelleDOE Impact Metric Development
Owner – TBDTest C ase Analysis & Results Development
Sub-Project: Avista
Sub-Project: PGE
Sub-Project: UW
Behavior DR Auto DR FLISR Prev. Maint. Behavior EE Auto EE Uptake
RBC Function Impacts
Demonstration Results:Integrating results from the PNW demonstration project
Bottom-Up RBC:Early granular analysis of
smart grid investment
GridWeek 2012

BPA Smart Grid Regional Business Case Update
The RBC Framework comprises 3 models
1 2 3 4 5 6 7 8 9 10 11 12 13 14 15 16 17 18 19 20 21 22 23 24 25 26 27 28 29 30 31 32 33 34 35 36 37 38 39 40 41 42 43 44 45 46 47 48 49 50 51 52 53 54 55 56 57 58 59 60 61 62 63 64 65 66 67 68 69 70 71 72 73 74Cost DataImpact Valuation DataImpact DataOtherCustomer DG Distribution Transmission
Deployment Model
Asset-to-Function Relational Model
Computational Model
3©2012 Navigant Consulting, Inc. Confidential and proprietary. Do not distribute or copy. E N E R G Y
1 Cong
estio
n M
etric
s
Soft
war
e &
Sys
tem
s Cos
t
2 T&D Optimization X X X X X X X X X X X X X X X X X X X X X X X X X X X X X X X X X X X X X X X X X X X X X X X X X X3 Automated Voltage and VAR Control X X X X X X X X X X X X X X X X X X X X X X X X X X X X X X X X X4 Conservation Voltage Reduction (CVR) X X X X X X X X X X X X X X X X X X X X X X X X X5 Dynamic Capacity Rating X X X X X X X X X X X X X X X X X X X X6 Power Flow Control & Real Time Load Transfer X X X X X X X X X X X X X X X X X X X X X X X X X X X X X X X7 Improved T&D Line Efficiency X X X X X X X X X X X X X X X X8 Infrastructure Life Extension from Equipment Condition Diagnosis & Preventive Maintenance X X X X X X X X X X X X X X X X9 Phase Balancing X X X X X X X X X X X X X X X X X X X X X X
11 Wide Area Monitoring & Visualization X X X X X X X X X X X X X X X X X X X X X X X X X X X X X X X X X X X X X X X X1213 End Use Energy Efficiency X X X X X X X X X X X X X X X X X X X X X X X X X X X X X X X X14 End Use Conservation from Automated Consumption Optimization X X X X X X X X X X X X X X X X X X X X X X X X X X X X X15 End Use Conservation from Behavior Change X X X X X X X X X X X X X X X X X X X X X X X X16 Enhanced EE Program Marketing & Implementation of Efficient End Use Technology X X X X X X X X X X X X X X X X X X X X X17 Enhanced EE Program Measurement & Evaluation X X X X X X X X X X18 Improved Equipment Efficiency from Condition Diagnosis & Maintenence X X X X X X X X X X X X X X1920 End Use Energy Reliability X X X X X X X X X X X X X X X X X X X X X X X X X X X X X X X X X X X X X X X X X X X X X X21 Automated Islanding and Reconnection (Micro-Grid Capability) X X X X X X X X X X X X X X X X X X X X X X X X22 Enhanced Ancillary Services from Electric Vehicle Charging X X X X X X X X X X X X X X X X X X X X X X23 Enhanced Ancillary Services from Stationary Energy Storage X X X X X X X X X X X X X X X X X X X X X X24 Enhanced Fault Location, Isolation & Service Restoration X X X X X X X X X X X X X X X X X X X X X X X X X X25 Enhanced Fault Prevention X X X X X X X X X X X X X X X X X X X X X X X X X X X X X X26 Reduced Outages from Equipment Condition Diagnosis & Preventive Maintenence X X X X X X X X X X X X X X X X X X X2728 Dynamic & Responsive Demand X X X X X X X X X X X X X X X X X X X X X X X X X X X X X X X X X X X X X X X29 Demand Response from Opt-In Utility Controlled Reduction Events (Direct Load Control) X X X X X X X X X X X X X X X X X X X X X X X X X X X X X X X X30 Demand Response from Electric Vehicle Charging X X X X X X X X X X X X X X X X X X X X X X X X X X X X X X X X X X31 Demand Response from Opt-In Customer Controlled Reduction Events X X X X X X X X X X X X X X X X X X X X X X X X X X X X X X32 Demand Response from Variable Pricing X X X X X X X X X X X X X X X X X X X X X X X X X X X X X X X X X X33 Load Shifting from Stationary Energy Storage X X X X X X X X X X X X X X X X X X X X X X X X X X X X X3536 Renewable & Distributed Systems Integration X X X X X X X X X X X X X X X X X X X X X X X X X X X X X X X X X X X X X37 Centralized Generation - Renewable X X X X X X X X X X X X X X X X X X X X X X X X X X X X X38 ? Distributed Generation - Non-Renewable X X X X X X X X X X X X X X X X X X X X X X X X X X X X X X X X X X39 Distributed Generation - Renewable X X X X X X X X X X X X X X X X X X X X X X X X X X X X X X X X X X X4041 Utility Operational Efficiency X X X X X X X X X X X X X X42 Automated Meter Operating Savings X X X X X X X X X X X X X43 Utility Process Improvement X X X X X X X X X X X44
BENEFIT CATEGORY / FUNCTION Ener
gy M
anag
emen
t Sys
tem
(EM
S) -
Com
mer
cial
& In
dust
rial
Recl
oser
s /
Auto
-Sec
tiona
lizin
g Sw
itche
s
Val
ue o
f Red
uced
Con
gest
ion
Two-
way
Com
mun
icatio
ns In
fras
truc
ture
(Hig
h Ba
ndw
idth
)
ASSE
T
Cust
omer
Con
sum
ptio
n Di
spla
y/Po
rtal
End
Use
Rem
otel
y Co
ntro
lled
Inte
rrup
ter/
Switc
h
Ener
gy M
anag
emen
t Sys
tem
(EM
S) -
Resid
entia
l
Hom
e Ar
ea N
etw
ork
Oth
er D
istr
ibut
ed G
ener
atio
n (N
G, LN
G, F
uel C
ell,
Prop
ane,
Dei
sel)
Adv
ance
d M
eter
Infr
astr
uctu
re (A
MI)
- Sm
art M
eter
s
Disp
atch
able
/Aut
omat
ed C
apac
itor B
anks
Smar
t App
lianc
es a
nd E
quip
men
t
Smar
t The
rmos
tat
End
Use
Equ
ipm
ent S
enso
rs (e
.g.,
Equi
pmen
t Hea
lth, C
onsu
mpt
ion,
etc
.)
Elec
tric
Veh
icle
(EV)
/ Pl
ug in
Hyb
rid (P
HEV
)
Rene
wab
le D
istr
ibut
ed G
ener
atio
n (e
.g.,
Smal
l Win
d, S
olar
, Hyd
ro, e
tc.)
Dist
ribut
ion
Man
agem
ent S
yste
m
Faul
t Cur
rent
Lim
iter
Load
Mon
itorin
g De
vice
Met
er D
ata
Man
agem
ent S
yste
m (M
DM
S)
Adv
ance
d Tr
ansf
orm
ers
(e.g
., Lo
ad T
ap C
ontr
ols,
MTU
s, e
tc.)
Dist
ribut
ed S
tora
ge (e
.g.,
Batt
erie
s, F
lyw
heel
s, e
tc.)
Mai
nten
ance
Cos
ts
Cost Data
Ope
ratio
ns C
osts
Val
ue o
f Red
uced
Em
issi
ons
Impact Valuation Data
Uni
t Equ
ipm
ent C
osts
Inst
alla
tion
& In
tegr
atio
n Co
sts
Val
ue o
f Inc
reas
ed E
nerg
y Ef
ficie
ncy
Val
ue o
f Inc
reas
ed D
eman
d Re
spon
se
Cost
of I
nter
mitt
ent R
esou
rce
Inte
grat
ion
Val
ue o
f Avo
ided
Out
ages
& R
educ
ed O
utag
e D
urat
ion
Trai
ning
Cos
ts
Impact Data
Elec
tric
ity P
rices
(Who
lesa
le &
Ret
ail)
Val
ue o
f Avo
ided
Anc
illar
y Se
rvic
es
Val
ue o
f Avo
ided
Cap
acity
Exp
ansi
on
Val
ue o
f Avo
ided
O&
M
Elec
tric
ity C
onsu
mpt
ion
(e.g
., Su
bsta
tion,
Fee
der,
Cust
omer
, etc
.) (k
Wh
per i
nter
val)
Syst
em P
ower
Fac
tor
(e.g
., Su
bsta
tion,
Fee
der,
Cus
tom
er, e
tc.)
Gen
erat
ion
Capa
city
Fact
or (0
.00
- 1.0
0)
Rene
wab
le E
nerg
y G
ener
atio
n (M
W c
apac
ity, k
Wh
gene
ratio
n)
Dist
ribut
ed E
nerg
y Ge
nera
tion
(MW
cap
acity
, kW
h ge
nera
tion)
Elec
tric
ity T
heft
(ann
ual k
Wh)
Emis
sion
s (e.
g., G
ener
atio
n, V
ehicl
e, e
tc.)
(CO
2, CO
2e, S
Ox,
NO
x, Pa
rtic
ulat
e)
Pow
er Q
ualit
y In
dici
es &
Met
rics
Relia
bilit
y In
dici
es &
Met
rics (
e.g.
, SAI
DI, C
AID
I, SA
IFI,
etc.
)
Tran
smis
sion
& D
istrib
ustio
n Li
ne L
oads
(e.g
., Su
bsta
tions
, Fee
ders
, etc
.) (M
W p
eak,
MW
load
pro
file)
Tran
smis
sion
& D
istrib
utio
n O
verlo
ad E
vent
s (e
.g.,
Subs
tatio
ns, F
eede
rs, e
tc.)(
qty,
loca
tion)
OtherCustomer DG Distribution Transmission
Faul
t Ind
icatio
n Te
chno
logy
Out
age
Man
agem
ent S
yste
m
Veh
icle
to G
rid In
fras
truc
utre
- 2
Way
Flo
w
Aut
omat
ed V
olta
ge R
egul
ator
Mic
rogr
id C
ontr
olle
rs &
Tec
hnol
ogie
s
Phas
e An
gle
Regu
latin
g Tr
ansf
orm
er
Cont
rolla
ble/
Regu
latin
g In
vert
er
Equi
pmen
t Hea
lth S
enso
r (Di
strib
utio
n)
Adv
ance
d V
isual
izatio
n &
Ana
lysi
s So
ftw
are
(Dis
trib
utio
n)
Flex
ible
AC
Tran
smis
sion
Sys
tem
(FAC
TS) D
evice
s
Tran
smis
sion
Sens
ors
(Pha
sor M
easu
rem
ent,
Syn
chro
phas
or, T
empe
ratu
re, L
oad)
Ver
y Lo
w Im
pede
nce
(VLI
) or
High
Tem
p Su
perc
ondu
ctiv
ity (H
TS) c
able
s
Def
erre
d Ca
pacit
y Ex
pans
ion
(Gen
erat
ion,
Tra
nsm
issio
n an
d Di
strib
utio
n)
Tran
smis
sion
& D
istrib
utio
n Li
ne Lo
sses
(%, a
nnua
l kW
h)
Equi
pmen
t Hea
lth S
enso
r (Tr
ansm
issi
on)
Adv
ance
d V
isual
izatio
n &
Ana
lysi
s So
ftw
are
(Tra
nsm
issio
n)
DAT
A
Ope
ratio
ns &
Mai
nten
ance
Req
uire
men
ts
T&D
Equ
ipm
ent F
ailu
res
Tran
sact
ive
Cont
rol S
yste
m
Inte
grat
ed U
tility
IT S
yste
m (I
T ha
rdw
are,
sof
twar
e)
Cent
ral S
tora
ge (e
.g.,
Batt
erie
s, F
lyw
heel
s, e
tc.)
Var
iabl
e Ra
te S
truc
ture
Oth
er
GridWeek 2012
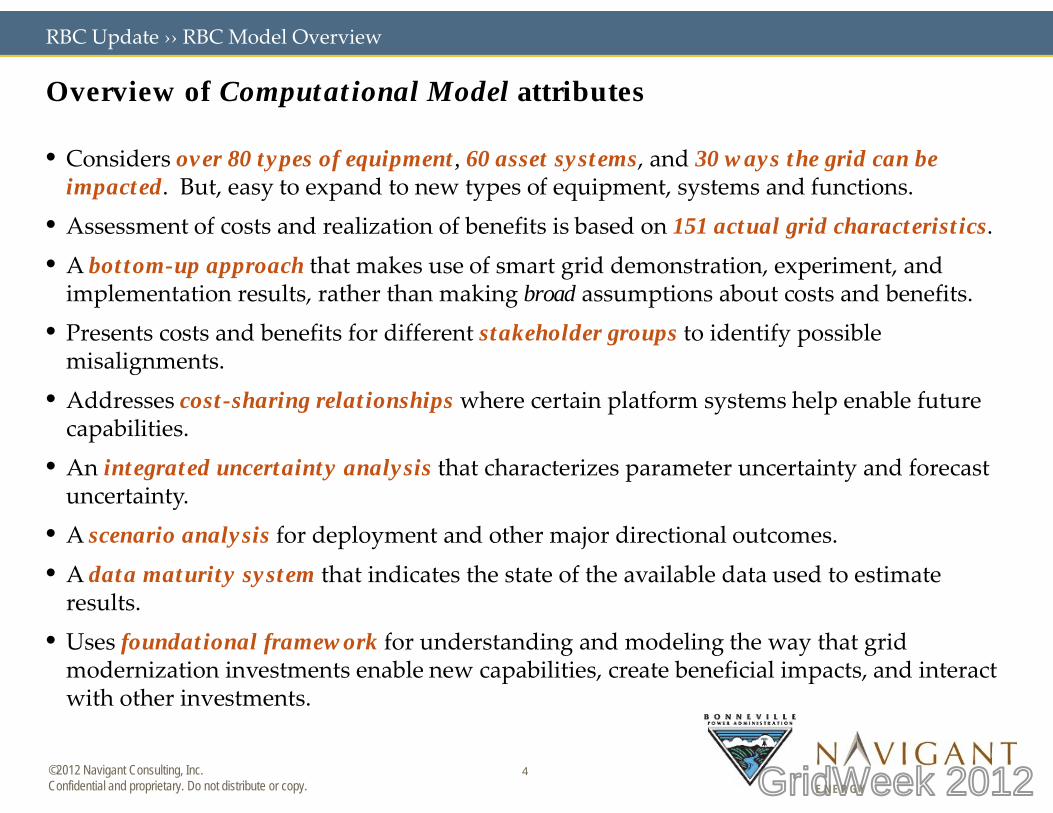
• Considers over 80 types of equipment, 60 asset systems, and 30 ways the grid can be impacted. But, easy to expand to new types of equipment, systems and functions.
• Assessment of costs and realization of benefits is based on 151 actual grid characteristics.• A bottom-up approach that makes use of smart grid demonstration, experiment, and
implementation results, rather than making broad assumptions about costs and benefits.• Presents costs and benefits for different stakeholder groups to identify possible
misalignments.• Addresses cost-sharing relationships where certain platform systems help enable future
Overview of Computational Model attributes
RBC Update ›› RBC Model Overview
4©2012 Navigant Consulting, Inc. Confidential and proprietary. Do not distribute or copy. E N E R G Y
• Addresses cost-sharing relationships where certain platform systems help enable future capabilities.
• An integrated uncertainty analysis that characterizes parameter uncertainty and forecast uncertainty.
• A scenario analysis for deployment and other major directional outcomes.• A data maturity system that indicates the state of the available data used to estimate
results. • Uses foundational framework for understanding and modeling the way that grid
modernization investments enable new capabilities, create beneficial impacts, and interact with other investments.
GridWeek 2012

BPA Smart Grid Regional Business Case Update
» Result of five standard benefit/cost tests (TRC, Societal, Utility, Ratepayer, and Participant cost test), by asset system or function
» Costs (NPV and cash flow)
» Smart-grid function deployment schedule
» Equipment required for each smart-grid asset system
» Forecast technology cost and cost-
Key Input Key Output
INPUT/OUTPUT: Smart-Grid function deployment, assets required, asset and system costs, and impact estimates (all probabilistic) are input to estimate total benefits, costs and B/C ratios for SG functions.
5©2012 Navigant Consulting, Inc. Confidential and proprietary. Do not distribute or copy. E N E R G Y
» Costs (NPV and cash flow) summarized by asset system or totaled across entire smart portfolio
» Benefits (e.g., avoided energy, reduced outage costs, reduced renewable integration costs, etc.) by asset system (NPV and cash flow)
» All results include probability distributions, probability bands, and Best Case/Worst Case/Expected values.
» Forecast technology cost and cost-reduction profile
» Energy and demand savings by asset system
» Other metrics (e.g., reduction in outage frequency, increased renewable energy capacity factor) related to smart grid functions
» Utility avoided costs and program administration costs
GridWeek 2012

Comparison to other widely recognized benefit-cost efforts
BPA Smart Grid Regional Business Case Update
Area RBC Model EPRI Assessment DOE Computational Tool
Scope Region-wide benefit-cost analysis for Pacific Northwest
National assessment focusing on costs with high-level benefits
Utility project specific benefit-cost analysis
Sponsor BPA: to fulfill roles in PNW-SGDP and as Regional Steward
EPRI: to assess national costs and benefits
DOE: to assess SGIG/SGDP program efforts
UseModel (what-if): region-wideassessment using flexibledeployment scenarios covering many technologies
Paper (published report): fixed,estimated range of investment and costs, averaged nationwide, covering many technologies
Model:* guided input flow, assessment of single project rollout, covering many technologies
Methodology-Leverages DOE Smart Grid EPRI Framework** along with DOE Smart Grid Benefit-Cost
6©2012 Navigant Consulting, Inc. Confidential and proprietary. Do not distribute or copy. E N E R G Y
Methodology-Framework
Leverages DOE Smart Grid Benefit-Cost Framework, and EPRI Framework** but modified to meet Regional needs
EPRI Framework** along with additional analysis and assumptions***
DOE Smart Grid Benefit-Cost Framework (roots in RDSI** and earlier efforts)
InputsPNW-SGDP test results and a wide range of other sources including 3rd party published documents
EPRI estimates and assumptions as well as 3rd party published documents
1-5 years of measured project data
Outputs6 broad benefit categories, focused on grid and utilities. Drill down on great deal of detail is possible
9 broad benefits categories, including grid focused as well as safety, quality of life and productivity
4 broad benefit categories, and multiple sub-categories according to DOE Framework
PlatformAnalyticaTM—with built-in uncertainty analysis, and graphical outputs
PDF Document—with supporting assumptions and detail
MS ExcelTM—with built-in user process interface and graphical outputs
*http://www.smartgrid.gov/recovery_act/program_impacts/computational_tool **Methodological Approach for Estimating the Benefits and Costs of Smart Grid Demonstration Projects. EPRI, January, 2010. ***Estimating the Costs and Benefits of the Smart Grid: A Preliminary Estimate of the Investment Requirements and the Resultant Benefits of a Fully Functioning SmartGrid; EPRI; 2011.
GridWeek 2012

BPA Smart Grid Regional Business Case Update
Computational Model Smart Grid Function implementation statusFunction Category Function
T&D Optimization
Automated VAR ControlConservation Voltage Reduction (CVR)1
Dynamic Capacity Rating2
Automated Power Flow Control for TransmissionAutomated Real Time Load Transfer for DistributionNotification of Distribution Equipment ConditionNotification of Transmission Equipment ConditionFault Current Limiting for DistributionFault Current Limiting for TransmissionDistributed Energy Resource Monitoring & ControlPMU-Based Centralized Renewable Resource Monitoring & Control2
Grid Reliability
PMU-Based Wide Area Monitoring2
Automated Islanding & Reconnection (Microgrid Capability)Enhanced Fault Prevention for DistributionEnhanced Fault Prevention for Transmission
1 Phase 1a CVR asset
Function KeyVetted2013 FocusInitialPending
7©2012 Navigant Consulting, Inc. Confidential and proprietary. Do not distribute or copy. E N E R G Y
Enhanced Fault Prevention for TransmissionFault Location, Isolation & Service Restoration (FLISR)
Dynamic & Response Demand
Demand Response - Air Conditioning/Space CoolingDemand Response - Appliances & Plug LoadsDemand Response - LightingDemand Response - Refrigeration, Motors & Process EquipmentDemand Response - Space HeatingDemand Response - Water Heating
End Use Energy Efficiency
End Use ConservationEnd Use Equipment Efficiency UpgradeNotification of End Use Equipment Condition - HVACNotification of End Use Equipment Condition - Refrigeration
Grid Storage Integration &
Control
Transmission-Sited Grid Storage Integration & ControlDistribution-Sited Grid Storage Integration & ControlElectric Vehicle Battery Integration & Control
Utility Operational Efficiency
Automated AMI Meter Reading & BillingImproved DSM Program Execution (Marketing, Implementation, M&V)Improved Regional Planning & Forecasting
1 Phase 1a CVR asset systems included Static CVR and Voltage Optimized CVR. Asset system for dispatchable CVR added in Phase 1b.
2 Currently included as a PMU-based function. Later analyses may also assess other technologies that enable this function.
GridWeek 2012
RBC Functions ID BC*Automated VAR Control 1
T&D
Opt
imiz
atio
nConservation Voltage Reduction (CVR) 2Dynamic Capacity Rating 3Automated Power Flow Control for Transmission 4Automated Real Time Load Transfer for Distribution 5Notification of T&D Equipment Condition 6-7Fault Current Limiting for T&D 8-9Distributed Energy Resource Monitoring & Control 10Centralized Renewable Resource Monitoring & Control 11Wide Area Monitoring 12
Gri
d R
elia
bilit
y
Automated Islanding & Reconnection (Microgrid) 13Enhanced Fault Prevention for T&D 14-15Fault Location, Isolation & Service Restoration (FLISR) 16Demand Response - Air Conditioning/Space Cooling 17
Dyn
amic
&
Res
pons
ive
Dem
andDemand Response - Appliances & Plug Loads 18
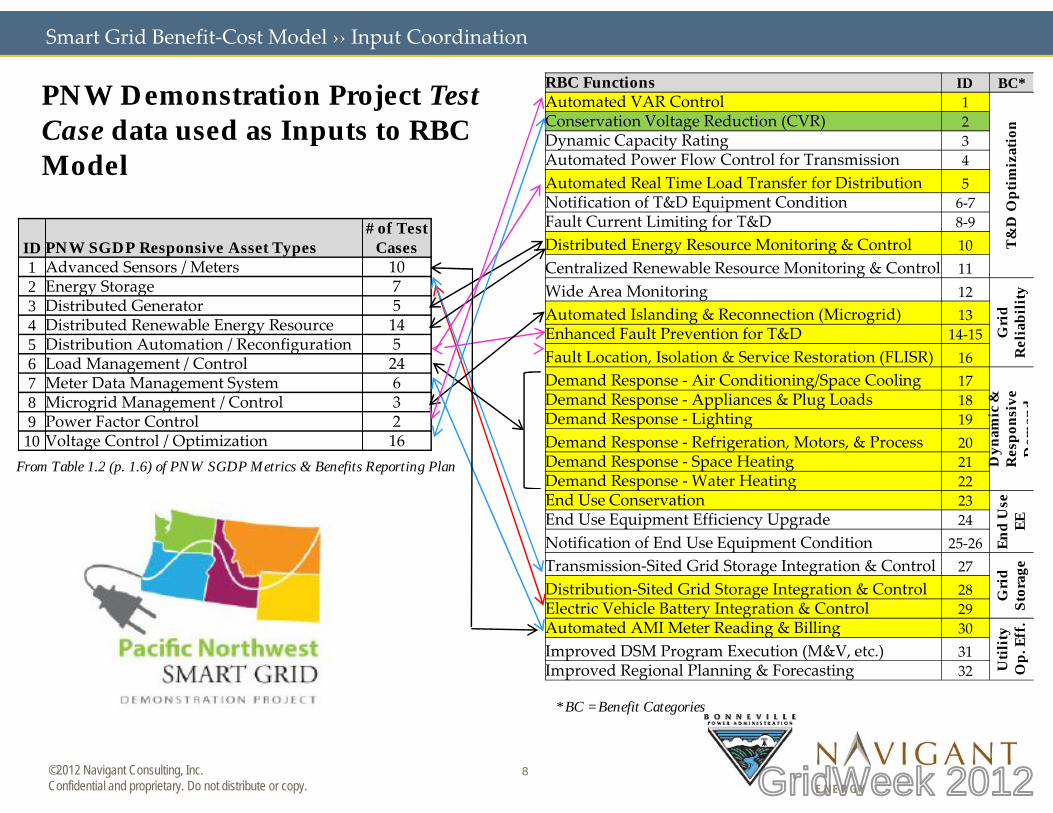
PNW Demonstration Project Test Case data used as Inputs to RBC Model
Smart Grid Benefit-Cost Model ›› Input Coordination
ID PNW SGDP Responsive Asset Types# of Test
Cases1 Advanced Sensors / Meters 102 Energy Storage 73 Distributed Generator 54 Distributed Renewable Energy Resource 145 Distribution Automation / Reconfiguration 56 Load Management / Control 247 Meter Data Management System 68 Microgrid Management / Control 3
8©2012 Navigant Consulting, Inc. Confidential and proprietary. Do not distribute or copy. E N E R G Y
Dyn
amic
&
Res
pons
ive
Dem
andDemand Response - Appliances & Plug Loads 18
Demand Response - Lighting 19Demand Response - Refrigeration, Motors, & Process 20Demand Response - Space Heating 21Demand Response - Water Heating 22End Use Conservation 23
End
Use
EEEnd Use Equipment Efficiency Upgrade 24
Notification of End Use Equipment Condition 25-26Transmission-Sited Grid Storage Integration & Control 27
Gri
d St
orag
e
Distribution-Sited Grid Storage Integration & Control 28Electric Vehicle Battery Integration & Control 29Automated AMI Meter Reading & Billing 30
Util
ity
Op.
Eff.
Improved DSM Program Execution (M&V, etc.) 31Improved Regional Planning & Forecasting 32
8 Microgrid Management / Control 39 Power Factor Control 2
10 Voltage Control / Optimization 16From Table 1.2 (p. 1.6) of PNW SGDP Metrics & Benefits Reporting Plan
* BC = Benefit Categories
GridWeek 2012

BPA Smart Grid Regional Business Case Update
The Computational Model will accommodate input from a variety of sources.
Benefits
PNW - SGDP (Metrics & Work
Products: Regional Opp-
ortunities, CBA) NPCC 6th
Power Plan Other
» Data sources will improve and become refined as the understanding of inputs evolves. As new studies become available, uncertainty bands will narrow.
» Data must be aggregated, analyzed, and linked to functions to estimate benefits.
9©2012 Navigant Consulting, Inc. Confidential and proprietary. Do not distribute or copy. E N E R G Y
Computational Model
Functions
Data Requirements (i.e., aggregated metrics)
Metrics (i.e., aggregated data: peak reduction, energy
saved, reliability metrics)
Raw Data
RBC
Power Plan (Demand/Price
Forecast, Penetration Rates, etc.)
Other BPA
Studies (Xmission, EE)National
Labs Studies
(PNNL, LBNL, NREL, Oak
Ridge)
Other Sources
(EPRI, GridWise, etc.)
Other ARRA
Projects
Regional Business Case
GridWeek 2012

BPA Smart Grid Regional Business Case Update ›› Initial Model Results › CVR/PMU
Example of broad Regional deployment over a number of years. CVR and PMU deployment scenarios reviewed with BPA stakeholders, and adjusted.
Note: CVR function deployment represents % of *total* feeders in the region , not just CVR capable feeders.
PMU function deployment represents % of total substations and wind farm
10©2012 Navigant Consulting, Inc. Confidential and proprietary. Do not distribute or copy. E N E R G Y
interconnections.
GridWeek 2012

BPA Smart Grid Regional Business Case Update ›› Initial Model Results › CVR/PMU
Preliminary Results: The B/C ratios are well above 1.0 in the Expected Case for each Function.
CVR Function
11©2012 Navigant Consulting, Inc. Confidential and proprietary. Do not distribute or copy. E N E R G Y
Note: Avoided Widespread Outages has, by far, the biggest B/C ratio in the best case; however, in the worst case there is no benefit at all (in this 5th percentile case, no outages were avoided.)
3 PMU based Functions
GridWeek 2012

BPA Smart Grid Regional Business Case Update ›› Initial Model Results › CVR/PMU
Preliminary Results: Benefits outweigh the costs in the Expected Case for all four Functions.
12©2012 Navigant Consulting, Inc. Confidential and proprietary. Do not distribute or copy. E N E R G Y GridWeek 2012

BPA Smart Grid Regional Business Case Update ›› Initial Model Results › CVR
Conservation Voltage Reduction (CVR) benefits include avoided energy costs and avoided demand costs.
CVR Benefits
• Avoided Energy Costs• Including reductions in line losses and no load
losses
• Avoided Demand Costs
CVR Costs
• Load Tap Changer Controllers
• Voltage Regulators
• Voltage Regulator Controller/Sensor
13©2012 Navigant Consulting, Inc. Confidential and proprietary. Do not distribute or copy. E N E R G Y
• Avoided Demand Costs____________________________________
› Avoided costs are calculated using an estimated fractional reduction in energy/demand due to CVR.
› Reduction in energy/demand is multiplied by avoided cost of energy/demand (e.g., $/MWh, $/MW-yr) to calculate total avoided costs.
• Distribution Management System
• Software Application
• 2-way Comm Infrastructure (Meters/Distribution)
• Startup and Recurring Costs (Overhead/Operations/Contracting)
GridWeek 2012

• What and how many assets deployed• Annual costs and benefits (and NPV)• Installation, integration, and M&O costs• Costs by individual assets
– E.g, how much has been spent on AMI– How much per year on CVR, etc.
Deployment and cost factors for each Asset System can be examined—or the combined costs and impacts can be examined
BPA Smart Grid Regional Business Case Update ›› Initial Model Results › CVR
14©2012 Navigant Consulting, Inc. Confidential and proprietary. Do not distribute or copy. E N E R G Y GridWeek 2012
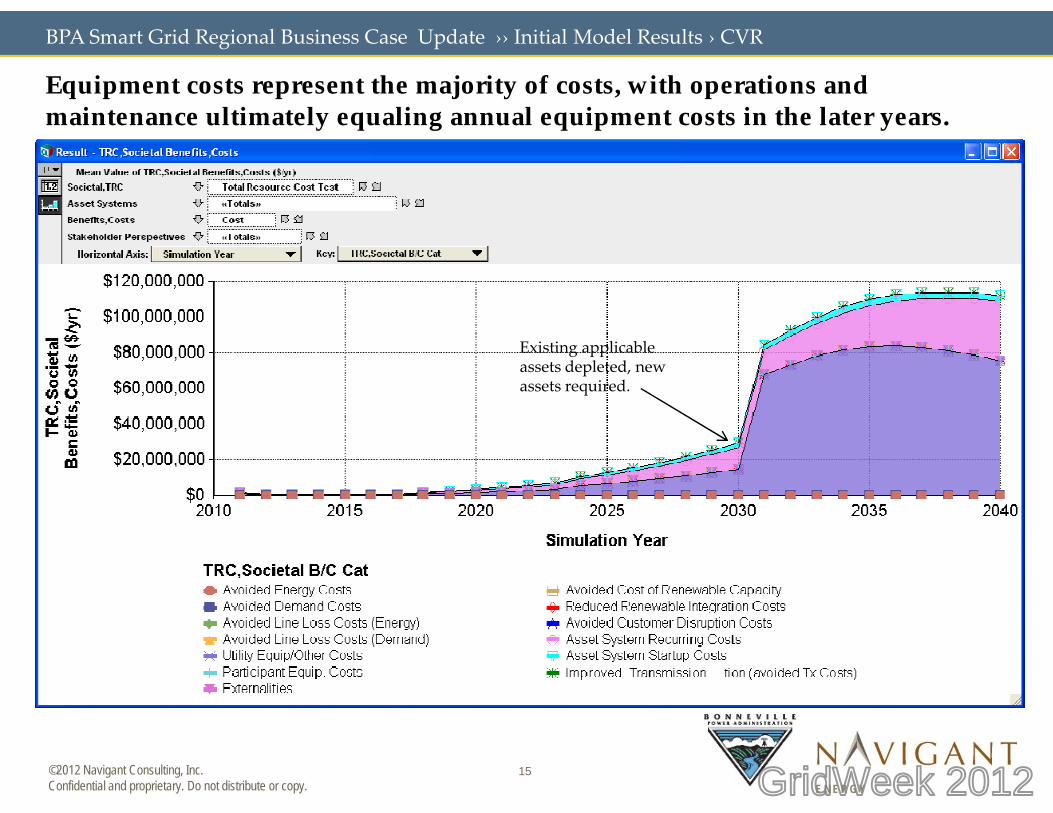
BPA Smart Grid Regional Business Case Update ›› Initial Model Results › CVR
Equipment costs represent the majority of costs, with operations and maintenance ultimately equaling annual equipment costs in the later years.
Existing applicable assets depleted, new assets required.
15©2012 Navigant Consulting, Inc. Confidential and proprietary. Do not distribute or copy. E N E R G Y GridWeek 2012

Smart Grid Benefit-Cost Model ›› Review of Recent Work
Preliminary estimated total benefits and cost for regional CVR deployment (present value)
16©2012 Navigant Consulting, Inc. Confidential and proprietary. Do not distribute or copy. E N E R G Y GridWeek 2012

RBC Update ›› Initial Model Results › CVR/PMU
CVR breakout by stakeholder categories shows the distribution utilities bear the costs, while the benefits are spread across stakeholder groups.
Avoided energy (fuel, O&M, and
line losses)
17©2012 Navigant Consulting, Inc. Confidential and proprietary. Do not distribute or copy. E N E R G Y
Avoided capacity costs
GridWeek 2012

RBC Update ›› Project Background
Summary of rationale for this effort
• BPA motivated to use an approach that is more related to what utilities in the region are actually doing⁻ Use actual utility and grid inputs – to provide something of more value to utility
customers and others in the Region⁻ Leverage learnings from the Pacific Northwest Smart Grid Demonstration Project
(PNW-SGDP) as key inputs to the analysis⁻ Directly relate investment in actual types of assets to the grid related impacts and
benefits⁻ Allow aggregation of results across many smart grid Functions, and across the region
18©2012 Navigant Consulting, Inc. Confidential and proprietary. Do not distribute or copy. E N E R G Y
⁻ Allow aggregation of results across many smart grid Functions, and across the region⁻ Avoid double counting of benefits, and take a reasonable, slightly conservative
approach⁻ Approach allows the analysis to be refined as new results become available, along
with input from stakeholders and review from subject matter experts
⁻ Will help reduce investment uncertainties and provide a clearer picture⁻ Sort out promising, deployment scale approaches from less promising ones⁻ Is not (yet) a toolkit for utility specific business case development⁻ But, the underlying framework and model structure can be adapted for that, if
desired.
GridWeek 2012

KeyC O N T A C T S KeyC O N T A C T S KeyC O N T A C T S KeyC O N T A C T S
Lee Hall,Smart Grid Program Manager
Bonneville Power AdministrationPortland, OR(503) [email protected]
Erik Gilbert,Director
©2011 Navigant Consulting, Inc. Confidential and proprietary. Do not distribute or copy.©2011 Navigant Consulting, Inc. Confidential and proprietary. Do not distribute or copy.©2011 Navigant Consulting, Inc. Confidential and proprietary. Do not distribute or copy.©2011 Navigant Consulting, Inc. Confidential and proprietary. Do not distribute or copy.
19
E N E R G Y
DirectorNavigant
Boulder, CO(303) 728-2536
GridWeek 2012

CVR Stakeholder benefit-cost allocation: some details
BPA Smart Grid Regional Business Case Update ›› CVR
20©2012 Navigant Consulting, Inc. Confidential and proprietary. Do not distribute or copy. E N E R G Y GridWeek 2012
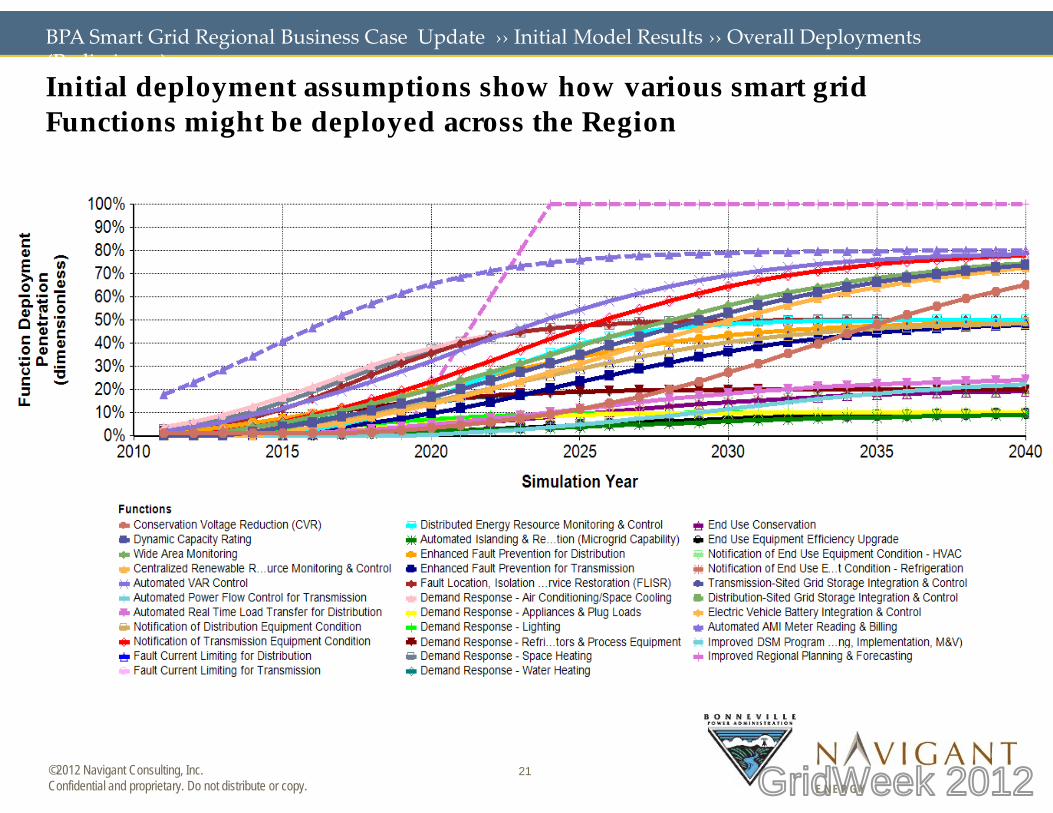
BPA Smart Grid Regional Business Case Update ›› Initial Model Results ›› Overall Deployments (Preliminary)Initial deployment assumptions show how various smart grid Functions might be deployed across the Region
21©2012 Navigant Consulting, Inc. Confidential and proprietary. Do not distribute or copy. E N E R G Y GridWeek 2012

Preliminary DR B/C Ratios show key value differences: more analysis and vetting must be done to validate the initial assumptions
BPA Smart Grid Regional Business Case Update ›› Initial Model Results › DR (Preliminary)
Only for Commercial & Industrial customers
Only for Commercial customers; high costs
from Lighting Control System
Assumes smart dryers deployed for Residential
and EMS for Commercial customers
Small contribution to peak load from
A/C in the PNW; benefits outweighed by
equipment
Consistent with 2003 PGE pilot1
for space heating direct load control
Only for Commercial
& Residential customers
22©2012 Navigant Consulting, Inc. Confidential and proprietary. Do not distribute or copy. E N E R G Y
Systemcustomersequipmentcosts
(e.g., smart thermostats)
load control that also had B/C ratio <1
1 Ecofys, Demand ResponseGuidebook, July 2011.
GridWeek 2012

BPA Smart Grid Regional Business Case Update ›› Model Inputs and Outputs Examples
SAMPLE OUTPUT*: Outputs include probabilistic estimates of benefits/costs as well as five standard benefit/cost test ratios.
23©2012 Navigant Consulting, Inc. Confidential and proprietary. Do not distribute or copy. E N E R G Y
* Values are for illustration only and are not intended to be representative.
GridWeek 2012


![FIS for the RBC/RBC Handover...4.2.1.1 The RBC/RBC communication shall be established according to the rules of the underlying RBC-RBC Safe Communication Interface [Subset-098]. Further](https://static.fdocuments.in/doc/165x107/5e331307d520b57b5677b3fa/fis-for-the-rbcrbc-handover-4211-the-rbcrbc-communication-shall-be-established.jpg)