RBC Capital Markets -...
22
NYSE:EGY Global Energy & Power Executive Conference June 1, 2015 RBC Capital Markets
-
Upload
truongnhan -
Category
Documents
-
view
226 -
download
1
Transcript of RBC Capital Markets -...
NYSE:EGY
Global Energy & Power Executive Conference
June 1, 2015
RBC Capital Markets
2
This presentation includes "forward-looking statements" within the meaning of Section 27A of the Securities Act of 1933, as amended, and Section 21E of the
Securities Exchange Act of 1934, as amended. All statements included in this presentation that address activities, events or developments that VAALCO
expects, believes or anticipates will or may occur in the future are forward-looking statements. These statements include expected capital expenditures, future
drilling plans, objectives and operations, prospect evaluations, negotiations and relations with governments and third parties, expectations regarding processing
facilities, reserve growth, estimated revenues and losses, and projected costs, timing and amount of future production. These statements are based on
assumptions made by VAALCO based on its experience perception of historical trends, current conditions, expected future developments and other factors it
believes are appropriate in the circumstances. Such statements are subject to a number of assumptions, risks and uncertainties, many of which are beyond
VAALCO's control. These risks include, but are not limited to, oil and gas price volatility, inflation, general economic conditions, VAALCO's success in
discovering, developing and producing reserves, lack of availability drilling equipment and services, availability of and capital, environmental risks, drilling risks,
foreign operational risks, the existence of H2S in production, regulatory changes, the uncertainty inherent in estimating reserves and in projecting future rates of
production, cash flow and access to capital, the timing of development expenditures, and other risks. Additional information on risks and uncertainties that could
affect our business prospects and performance are provided in the most recent reports of VAALCO filed with the Securities and Exchange Commission. These
forward-looking statements are based on VAALCO’s current expectations and assumptions about future events and are based on currently available information
as to the outcome and timing of future events. VAALCO cautions you that forward-looking statements are not guarantees of future performance and that actual
results or developments may differ materially from those projected in the forward-looking statements. VAALCO disclaims any intention or obligation to update or
revise any forward-looking statements, whether as a result of new information, future events, or otherwise.
The SEC requires oil and gas companies, in their filings with the SEC, to disclose proved reserves that a company has demonstrated by actual production or
conclusive formation tests to be economically and legally producible under existing economic and operating conditions. VAALCO uses the terms “estimated
ultimate recovery,” “EUR,” “probable,” “3P,” “possible,” and “non-proven” reserves, reserve “potential” or “upside,” “unrisked potential” or other descriptions of
volumes of reserves potentially recoverable through additional drilling or recovery techniques that are not classified as proved reserves, may not have been
calculated as defined by SEC regulations and that the SEC’s guidelines may prohibit us from including in any future filings with the SEC. These estimates are by
their nature more speculative than estimates of proved reserves and accordingly are subject to substantially greater risk of being actually realized by the
company. VAALCO believes these estimates are reasonable, but such estimates have not been reviewed by independent engineers. Estimates may change
significantly as development provides additional data, and actual quantities that are ultimately recovered may differ substantially from prior estimates. Production
forecasts are dependent upon many assumptions, including estimates of production decline rates from existing wells and the outcome of future drilling activity.
Although VAALCO believes the forecasts are reasonable, VAALCO can give no assurance they will prove to have been correct. They can be affected by
inaccurate assumptions and data or by known or unknown risks and uncertainties.
Market and industry data and forecasts used in this presentation have been obtained from independent industry sources as well as from research reports
prepared for other purposes. Although VAALCO believes these third-party sources to be reliable, VAALCO has not independently verified the data obtained from
these sources and VAALCO cannot assure you of the accuracy or completeness of the data. Forecasts and other forward-looking information obtained from
these sources are subject to the same qualifications and uncertainties as the other forward looking statements in this presentation.
Inquiries:
VAALCO Energy, Inc.
Attn: Gregory R. Hullinger
9800 Richmond Avenue
Houston, TX 77042
Ph: 713-623-0801
www.vaalco.com
Safe Harbor Statement
3
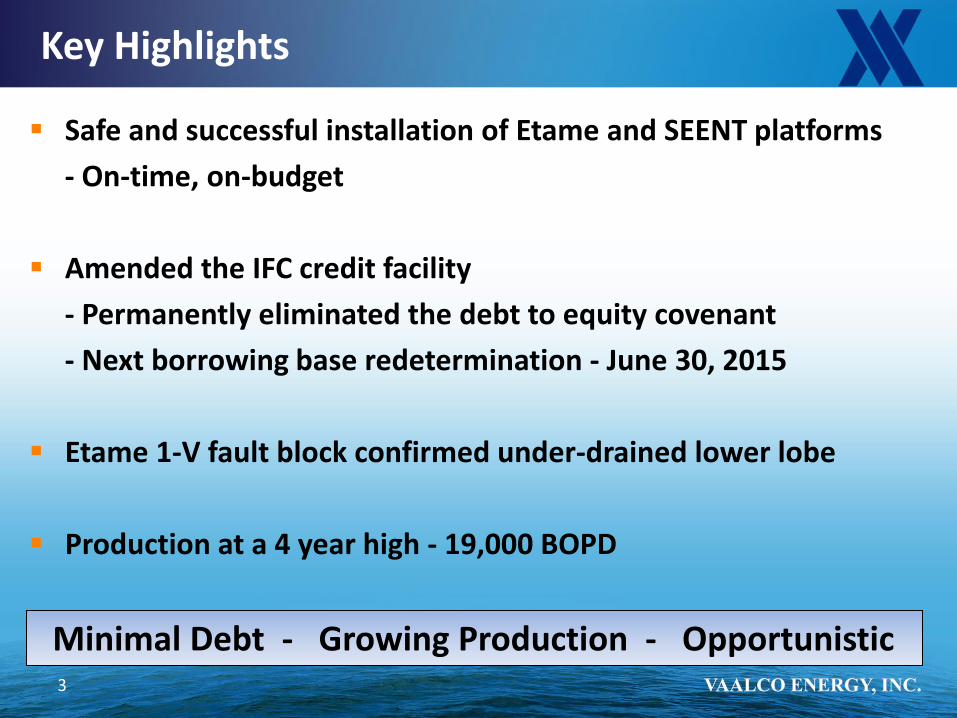
Key Highlights
Safe and successful installation of Etame and SEENT platforms
- On-time, on-budget
Amended the IFC credit facility
- Permanently eliminated the debt to equity covenant
- Next borrowing base redetermination - June 30, 2015
Etame 1-V fault block confirmed under-drained lower lobe
Production at a 4 year high - 19,000 BOPD
Minimal Debt - Growing Production - Opportunistic
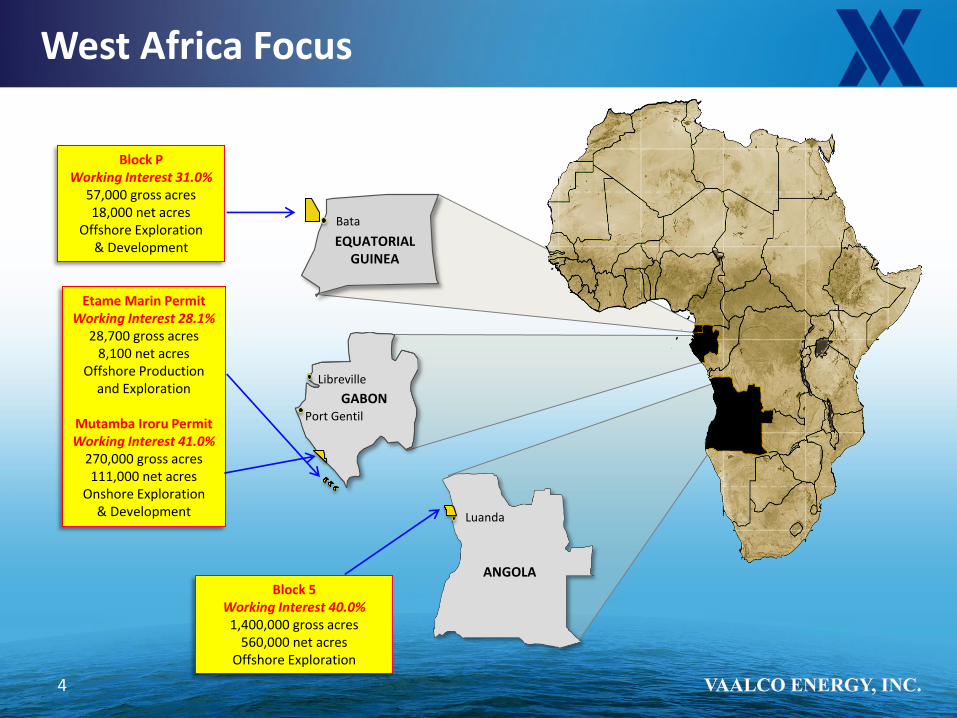
West Africa Focus
4
Block 5 Working Interest 40.0%
1,400,000 gross acres 560,000 net acres
Offshore Exploration
Etame Marin Permit Working Interest 28.1%
28,700 gross acres 8,100 net acres
Offshore Production and Exploration
Mutamba Iroru Permit Working Interest 41.0%
270,000 gross acres 111,000 net acres
Onshore Exploration & Development
Block P Working Interest 31.0%
57,000 gross acres 18,000 net acres
Offshore Exploration & Development
GABON Port Gentil
Libreville
Luanda
ANGOLA
EQUATORIAL GUINEA
Bata
Company Profile
5
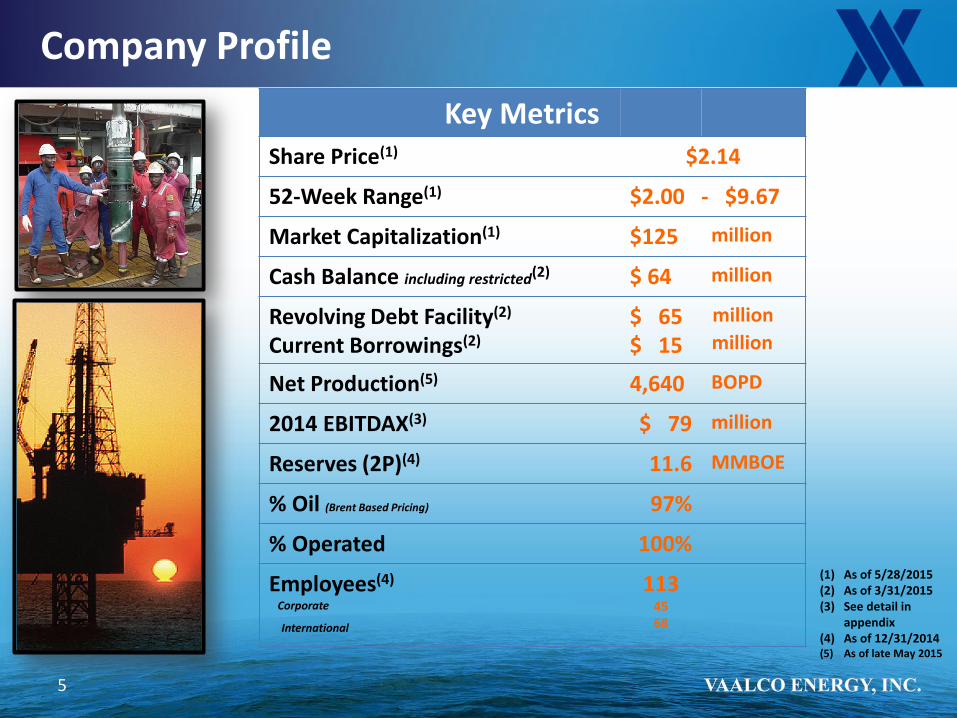
Key Metrics
Share Price(1) $2.14
52-Week Range(1) $2.00 - $9.67
Market Capitalization(1) $125 million
Cash Balance including restricted(2) $ 64 million
Revolving Debt Facility(2)
Current Borrowings(2)
$ 65 $ 15
Net Production(5) 4,640 BOPD
2014 EBITDAX(3) $ 79 million
Reserves (2P)(4) 11.6 MMBOE
% Oil (Brent Based Pricing) 97%
% Operated 100%
Employees(4)
Corporate International
113 45 68
(1) As of 5/28/2015 (2) As of 3/31/2015 (3) See detail in
appendix (4) As of 12/31/2014 (5) As of late May 2015
million
million
Etame Marin Permit (Production / Reserves)
6
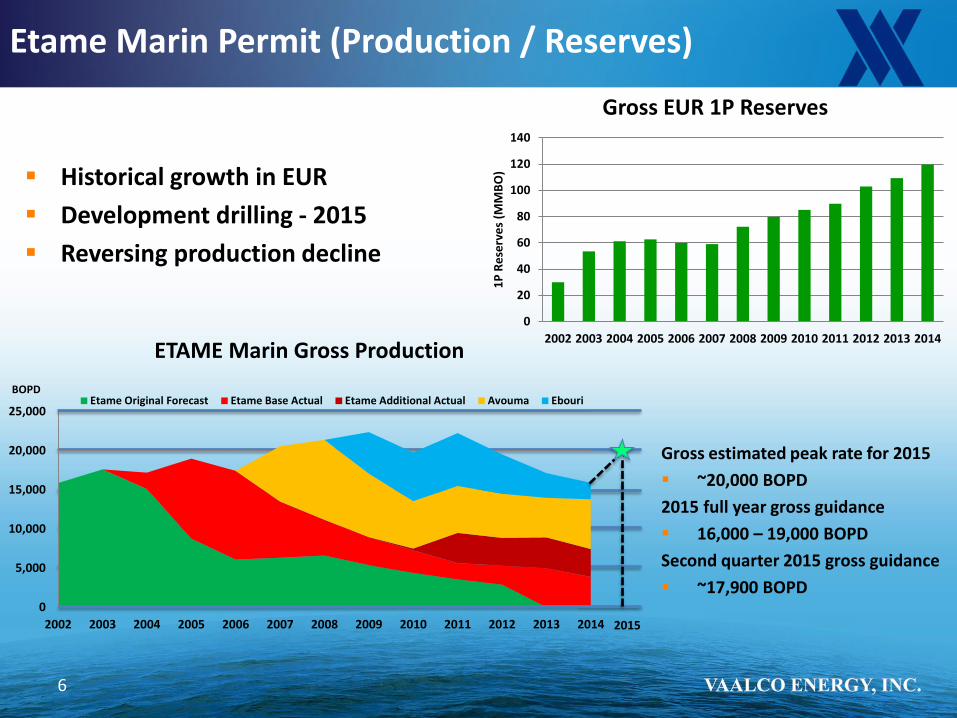
Historical growth in EUR
Development drilling - 2015
Reversing production decline
Gross estimated peak rate for 2015
~20,000 BOPD
2015 full year gross guidance
16,000 – 19,000 BOPD
Second quarter 2015 gross guidance
~17,900 BOPD
0
20
40
60
80
100
120
140
2002 2003 2004 2005 2006 2007 2008 2009 2010 2011 2012 2013 2014
1P
Re
serv
es
(MM
BO
)
Gross EUR 1P Reserves
0
5,000
10,000
15,000
20,000
25,000
2002 2003 2004 2005 2006 2007 2008 2009 2010 2011 2012 2013 2014
ETAME Marin Gross Production
Etame Original Forecast Etame Base Actual Etame Additional Actual Avouma Ebouri
2015
BOPD
Etame Marin Reserves
7
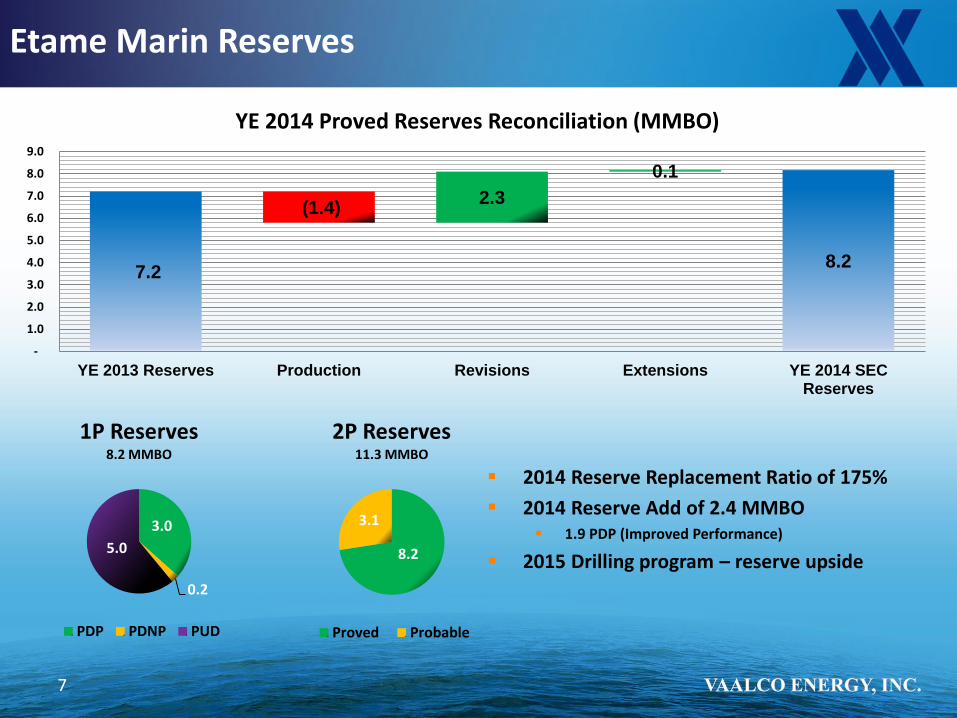
2014 Reserve Replacement Ratio of 175%
2014 Reserve Add of 2.4 MMBO 1.9 PDP (Improved Performance)
2015 Drilling program – reserve upside
8.2
3.1
2P Reserves 11.3 MMBO
Proved Probable
3.0
0.2
5.0
1P Reserves 8.2 MMBO
PDP PDNP PUD
7.2 8.2
2.3
0.1
(1.4)
-
1.0
2.0
3.0
4.0
5.0
6.0
7.0
8.0
9.0
YE 2013 Reserves Production Revisions Extensions YE 2014 SECReserves
YE 2014 Proved Reserves Reconciliation (MMBO)
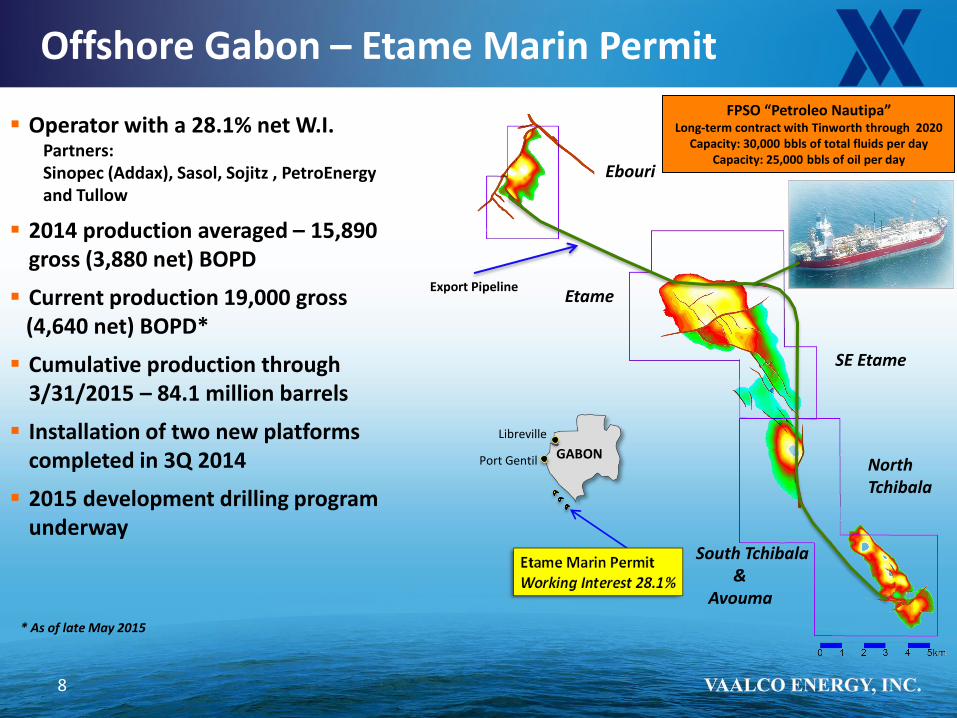
Operator with a 28.1% net W.I. Partners: Sinopec (Addax), Sasol, Sojitz , PetroEnergy and Tullow
2014 production averaged – 15,890 gross (3,880 net) BOPD
Current production 19,000 gross (4,640 net) BOPD*
Cumulative production through 3/31/2015 – 84.1 million barrels
Installation of two new platforms completed in 3Q 2014
2015 development drilling program underway
Offshore Gabon – Etame Marin Permit
8
GABON Port Gentil
Libreville
Etame Marin Permit Working Interest 28.1%
Ebouri
SE Etame
Etame
South Tchibala & Avouma
North Tchibala
FPSO “Petroleo Nautipa” Long-term contract with Tinworth through 2020
Capacity: 30,000 bbls of total fluids per day Capacity: 25,000 bbls of oil per day
* As of late May 2015
Export Pipeline
Etame Field Expansion Project
9
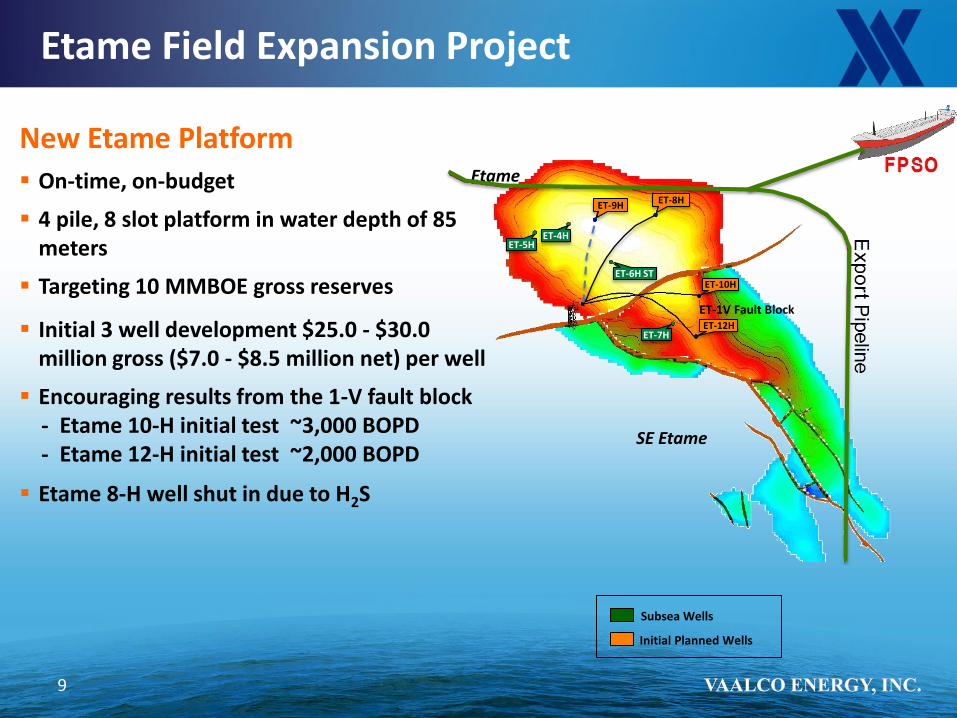
New Etame Platform
On-time, on-budget
4 pile, 8 slot platform in water depth of 85 meters
Targeting 10 MMBOE gross reserves
Initial 3 well development $25.0 - $30.0 million gross ($7.0 - $8.5 million net) per well
Encouraging results from the 1-V fault block - Etame 10-H initial test ~3,000 BOPD - Etame 12-H initial test ~2,000 BOPD
Etame 8-H well shut in due to H2S
Subsea Wells
Initial Planned Wells
Etame
SE Etame
ET-4H ET-5H
ET-7H
ET-6H ST
ET-1V Fault Block ET-12H
ET-10H
ET-8H ET-9H
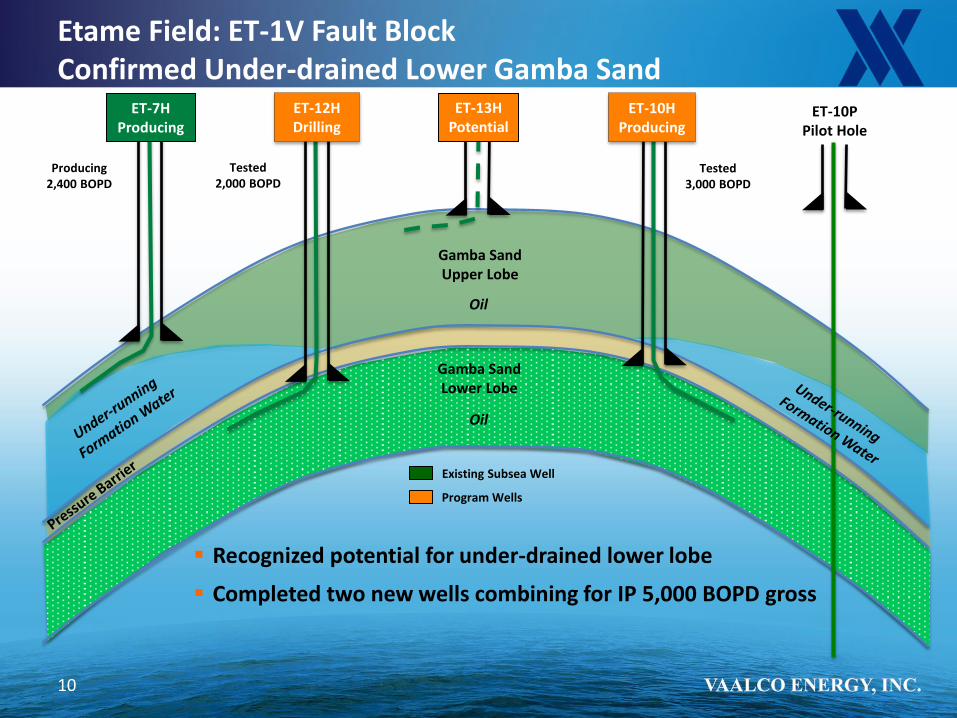
Etame Field: ET-1V Fault Block Confirmed Under-drained Lower Gamba Sand
ET-10P Pilot Hole
Gamba Sand Upper Lobe
Gamba Sand Lower Lobe
Tested 3,000 BOPD
Oil
Oil
Recognized potential for under-drained lower lobe
Completed two new wells combining for IP 5,000 BOPD gross
10
Existing Subsea Well
Program Wells
ET-7H Producing
ET-12H Drilling
ET-13H Potential
ET-10H Producing
Tested 2,000 BOPD
Producing 2,400 BOPD
SE Etame & North Tchibala Fields Project
11
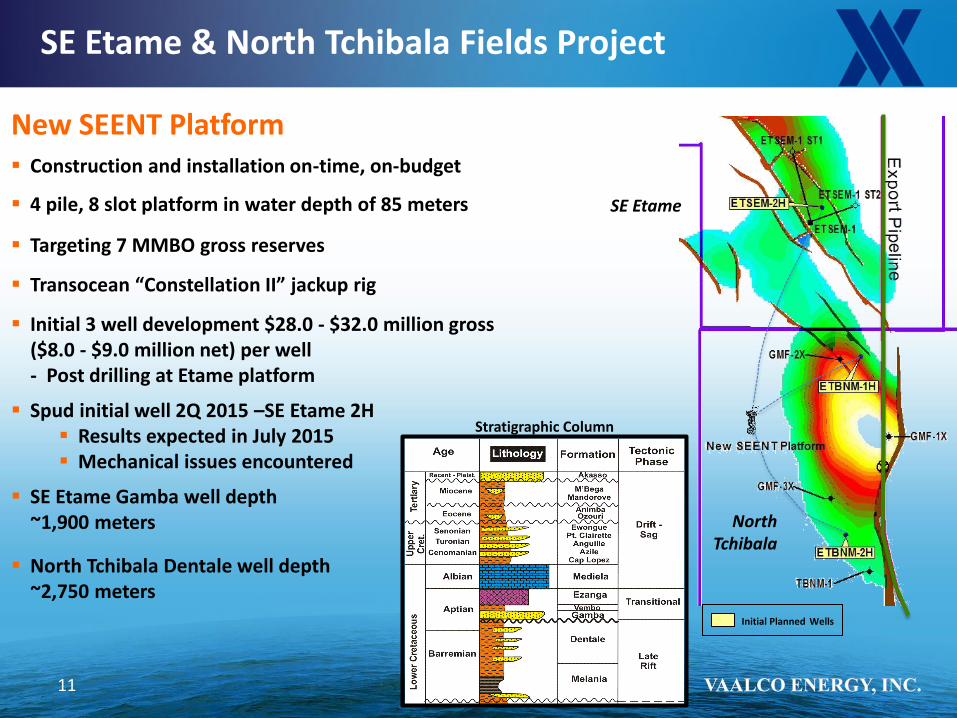
New SEENT Platform Construction and installation on-time, on-budget
4 pile, 8 slot platform in water depth of 85 meters
Targeting 7 MMBO gross reserves
Transocean “Constellation II” jackup rig
Initial 3 well development $28.0 - $32.0 million gross ($8.0 - $9.0 million net) per well - Post drilling at Etame platform
Spud initial well 2Q 2015 –SE Etame 2H Results expected in July 2015 Mechanical issues encountered
SE Etame Gamba well depth ~1,900 meters
North Tchibala Dentale well depth ~2,750 meters
Initial Planned Wells
SE Etame
North Tchibala
Stratigraphic Column
Crude Sweetening Project
12
Ebouri
SE Etame
Etame
South Tchibala & Avouma
North Tchibala
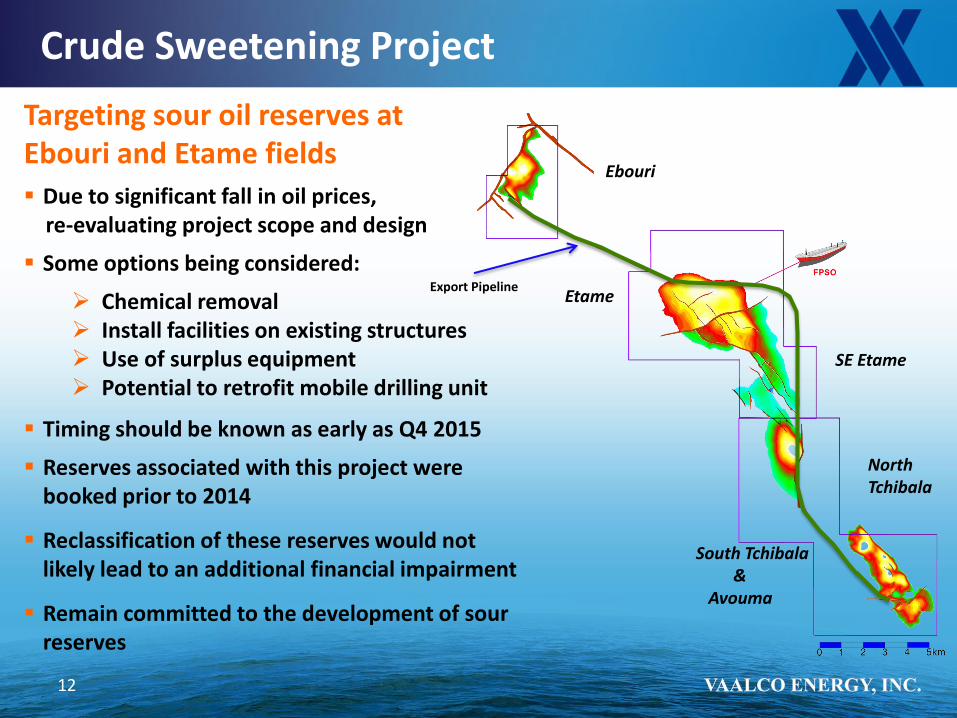
Targeting sour oil reserves at Ebouri and Etame fields
Due to significant fall in oil prices, re-evaluating project scope and design
Some options being considered:
Chemical removal Install facilities on existing structures Use of surplus equipment Potential to retrofit mobile drilling unit
Timing should be known as early as Q4 2015
Reserves associated with this project were booked prior to 2014
Reclassification of these reserves would not likely lead to an additional financial impairment
Remain committed to the development of sour reserves
Export Pipeline
13
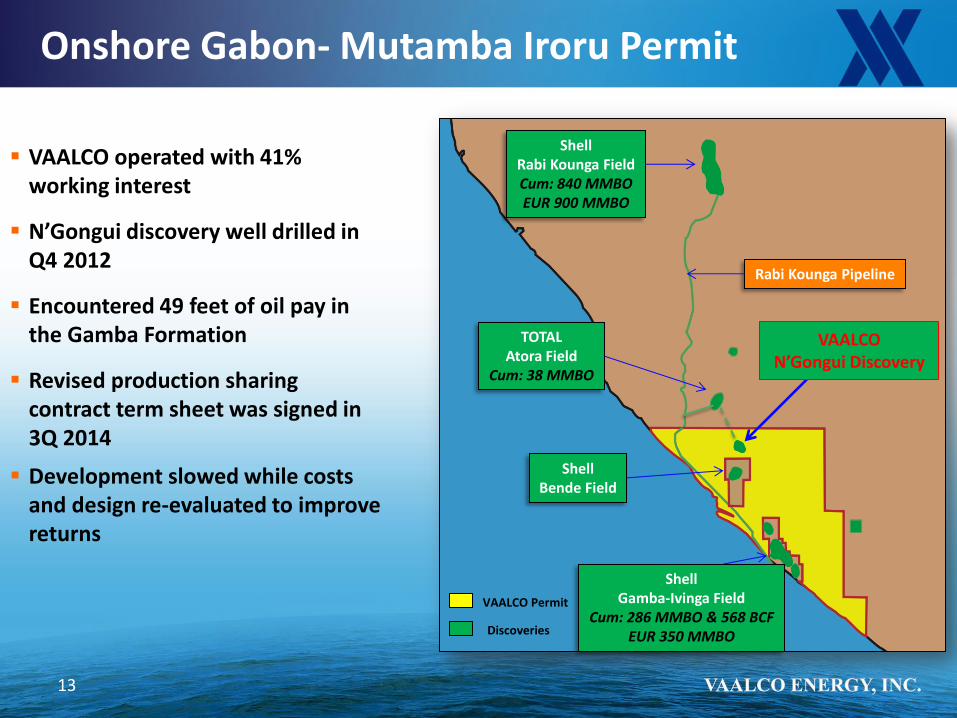
Onshore Gabon- Mutamba Iroru Permit
VAALCO operated with 41% working interest
N’Gongui discovery well drilled in Q4 2012
Encountered 49 feet of oil pay in the Gamba Formation
Revised production sharing contract term sheet was signed in 3Q 2014
Development slowed while costs and design re-evaluated to improve returns
Shell Rabi Kounga Field Cum: 840 MMBO EUR 900 MMBO
TOTAL Atora Field
Cum: 38 MMBO
VAALCO N’Gongui Discovery
Shell Bende Field
Shell Gamba-Ivinga Field
Cum: 286 MMBO & 568 BCF EUR 350 MMBO Discoveries
Rabi Kounga Pipeline
VAALCO Permit
14
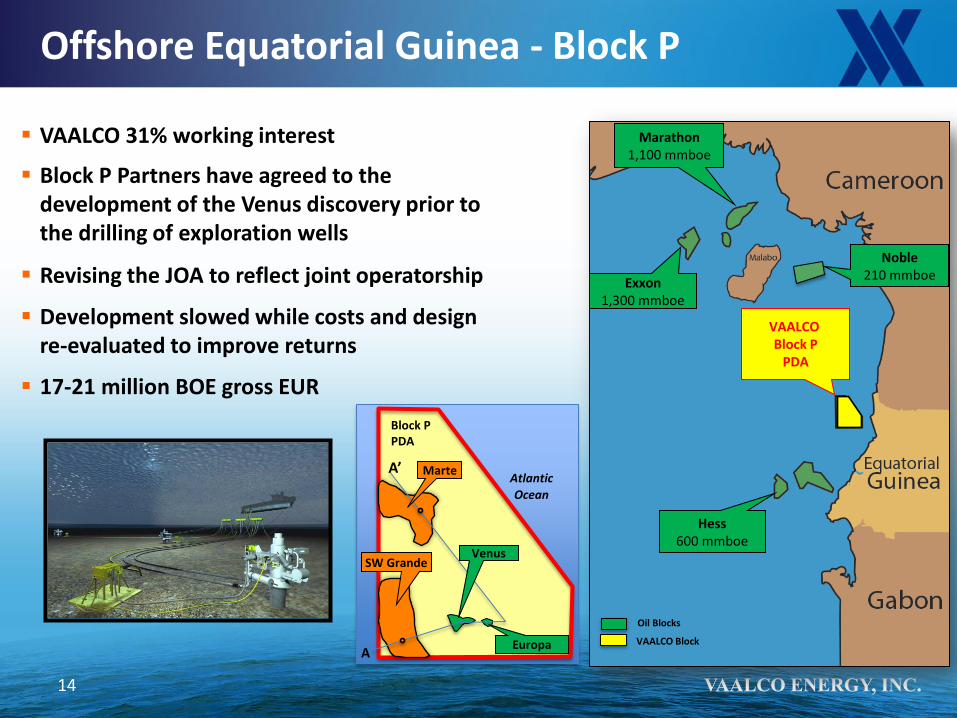
Offshore Equatorial Guinea - Block P
VAALCO 31% working interest
Block P Partners have agreed to the development of the Venus discovery prior to the drilling of exploration wells
Revising the JOA to reflect joint operatorship
Development slowed while costs and design re-evaluated to improve returns
17-21 million BOE gross EUR
Marathon 1,100 mmboe
Exxon 1,300 mmboe
Hess 600 mmboe
VAALCO Block P
PDA
Noble 210 mmboe
Oil Blocks
VAALCO Block
Atlantic
Atlantic Ocean
Block P PDA
A’
A
Venus
Europa
SW Grande
Marte
Exploration Program
15
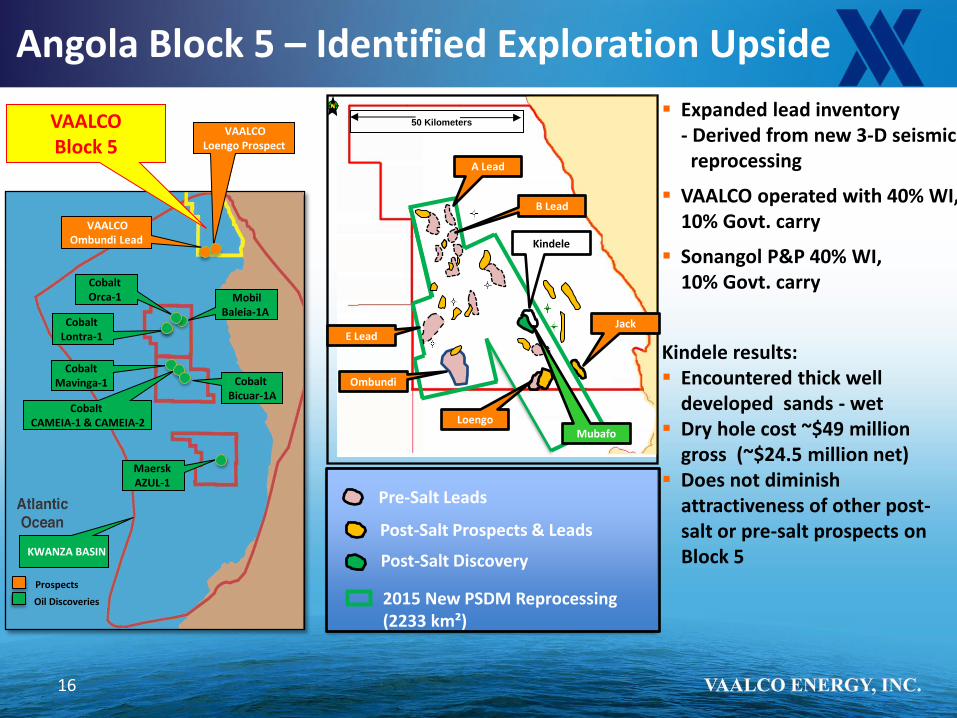
Angola Block 5 – Identified Exploration Upside
16
Maersk AZUL-1
Cobalt Mavinga-1
Cobalt CAMEIA-1 & CAMEIA-2
Cobalt Lontra-1
VAALCO Loengo Prospect
VAALCO Ombundi Lead
Mobil Baleia-1A
VAALCO Block 5
Prospects
Oil Discoveries
Cobalt Bicuar-1A
KWANZA BASIN
Cobalt Orca-1
Pre-Salt Leads
Post-Salt Prospects & Leads
Post-Salt Discovery
2015 New PSDM Reprocessing (2233 km²)
50 Kilometers
Kindele
B Lead
A Lead
Ombundi
E Lead
Loengo
Jack
Mubafo
Expanded lead inventory - Derived from new 3-D seismic reprocessing
VAALCO operated with 40% WI, 10% Govt. carry
Sonangol P&P 40% WI, 10% Govt. carry
Kindele results: Encountered thick well
developed sands - wet Dry hole cost ~$49 million gross (~$24.5 million net) Does not diminish attractiveness of other post- salt or pre-salt prospects on Block 5
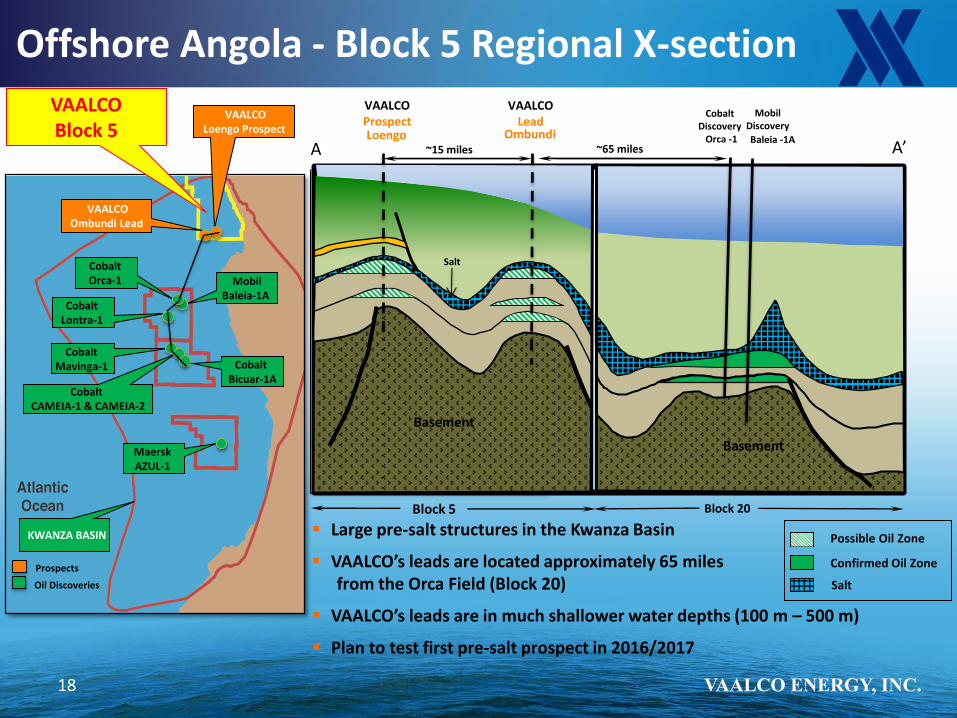
Loengo A A’
Block 5 Block 20
Ombundi
Possible Oil Zone
Confirmed Oil Zone
VAALCO Prospect
VAALCO Lead
Offshore Angola - Block 5 Regional X-section
Salt
Maersk AZUL-1
Cobalt Mavinga-1
Cobalt CAMEIA-1 & CAMEIA-2
Cobalt Lontra-1
VAALCO Loengo Prospect
VAALCO Ombundi Lead
Mobil Baleia-1A
VAALCO Block 5
Prospects
Oil Discoveries
Cobalt Bicuar-1A
KWANZA BASIN
Cobalt Orca-1
~15 miles ~65 miles
Salt
Basement
Basement
Cobalt Discovery
Orca -1
Mobil Discovery
Baleia -1A
18
Large pre-salt structures in the Kwanza Basin
VAALCO’s leads are located approximately 65 miles from the Orca Field (Block 20)
VAALCO’s leads are in much shallower water depths (100 m – 500 m)
Plan to test first pre-salt prospect in 2016/2017
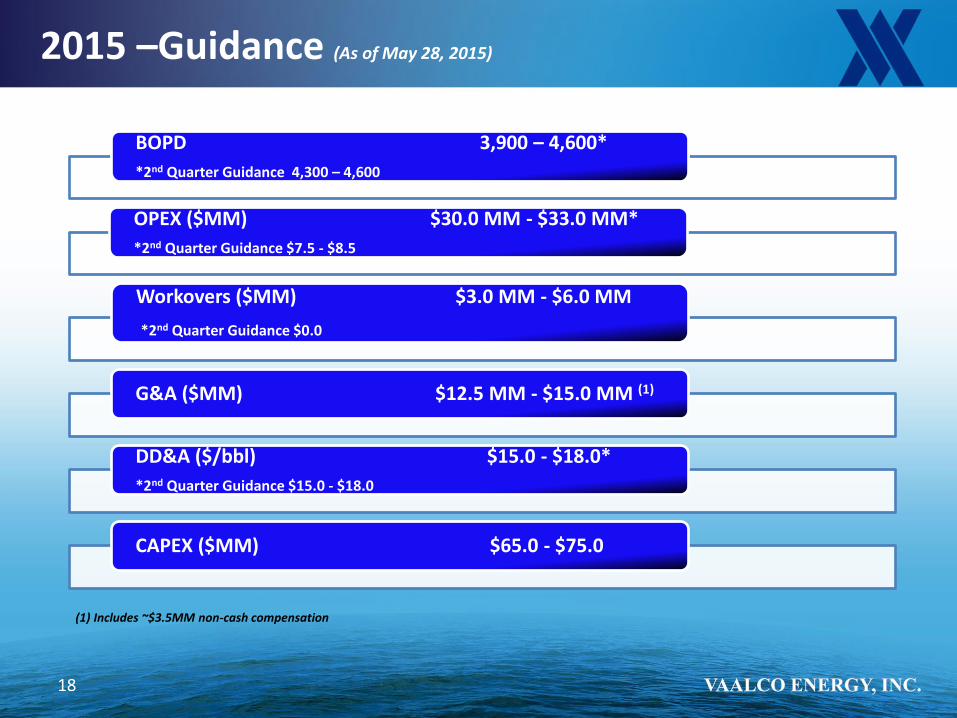
2015 –Guidance (As of May 28, 2015)
18
BOPD 3,900 – 4,600*
*2nd Quarter Guidance 4,300 – 4,600
OPEX ($MM) $30.0 MM - $33.0 MM*
*2nd Quarter Guidance $7.5 - $8.5
Workovers ($MM) $3.0 MM - $6.0 MM
*2nd Quarter Guidance $0.0
G&A ($MM) $12.5 MM - $15.0 MM (1)
DD&A ($/bbl) $15.0 - $18.0*
*2nd Quarter Guidance $15.0 - $18.0
CAPEX ($MM) $65.0 - $75.0
(1) Includes ~$3.5MM non-cash compensation
19
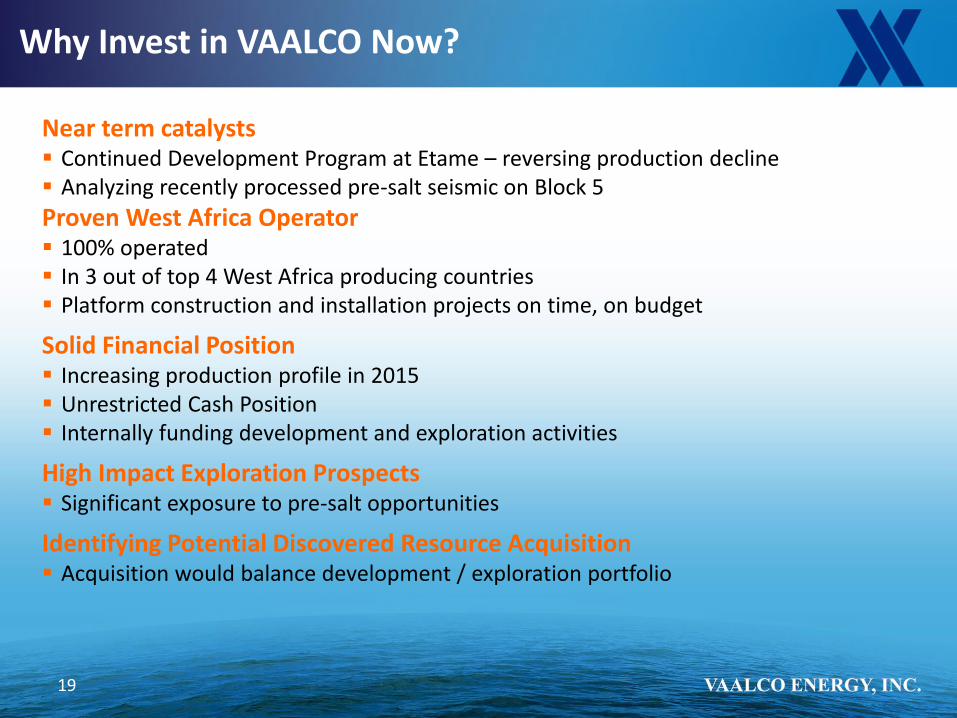
Why Invest in VAALCO Now?
Near term catalysts Continued Development Program at Etame – reversing production decline Analyzing recently processed pre-salt seismic on Block 5
Proven West Africa Operator 100% operated In 3 out of top 4 West Africa producing countries Platform construction and installation projects on time, on budget
Solid Financial Position Increasing production profile in 2015 Unrestricted Cash Position Internally funding development and exploration activities
High Impact Exploration Prospects Significant exposure to pre-salt opportunities
Identifying Potential Discovered Resource Acquisition Acquisition would balance development / exploration portfolio
20
APPENDIX
21
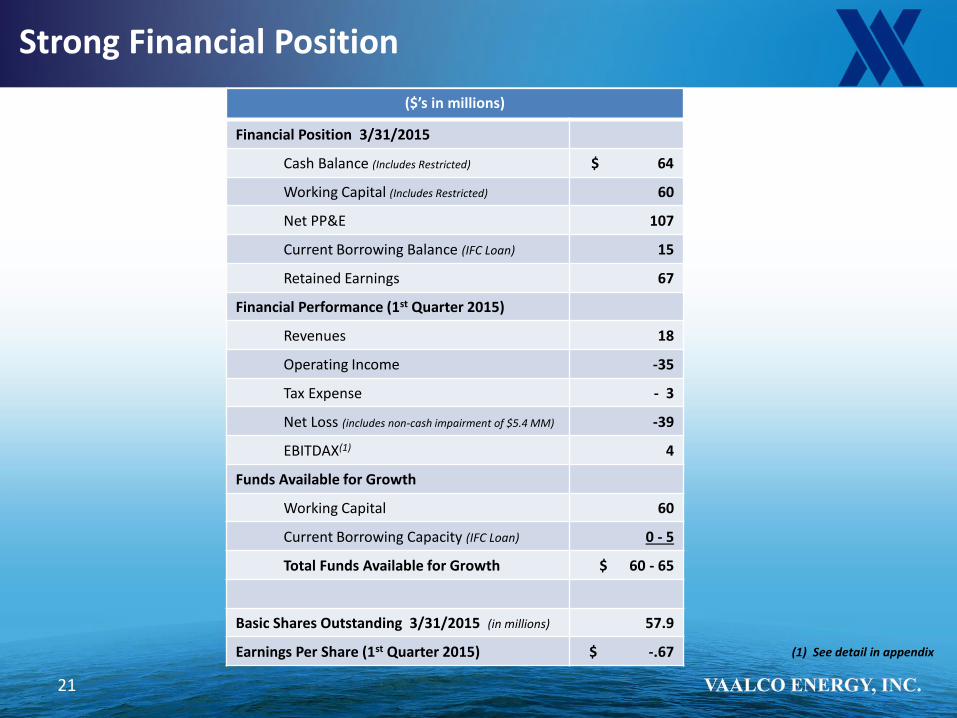
Strong Financial Position
($’s in millions)
Financial Position 3/31/2015
Cash Balance (Includes Restricted) $ 64
Working Capital (Includes Restricted) 60
Net PP&E 107
Current Borrowing Balance (IFC Loan) 15
Retained Earnings 67
Financial Performance (1st Quarter 2015)
Revenues 18
Operating Income -35
Tax Expense - 3
Net Loss (includes non-cash impairment of $5.4 MM) -39
EBITDAX(1) 4
Funds Available for Growth
Working Capital 60
Current Borrowing Capacity (IFC Loan) 0 - 5
Total Funds Available for Growth $ 60 - 65
Basic Shares Outstanding 3/31/2015 (in millions) 57.9
Earnings Per Share (1st Quarter 2015) $ -.67 (1) See detail in appendix
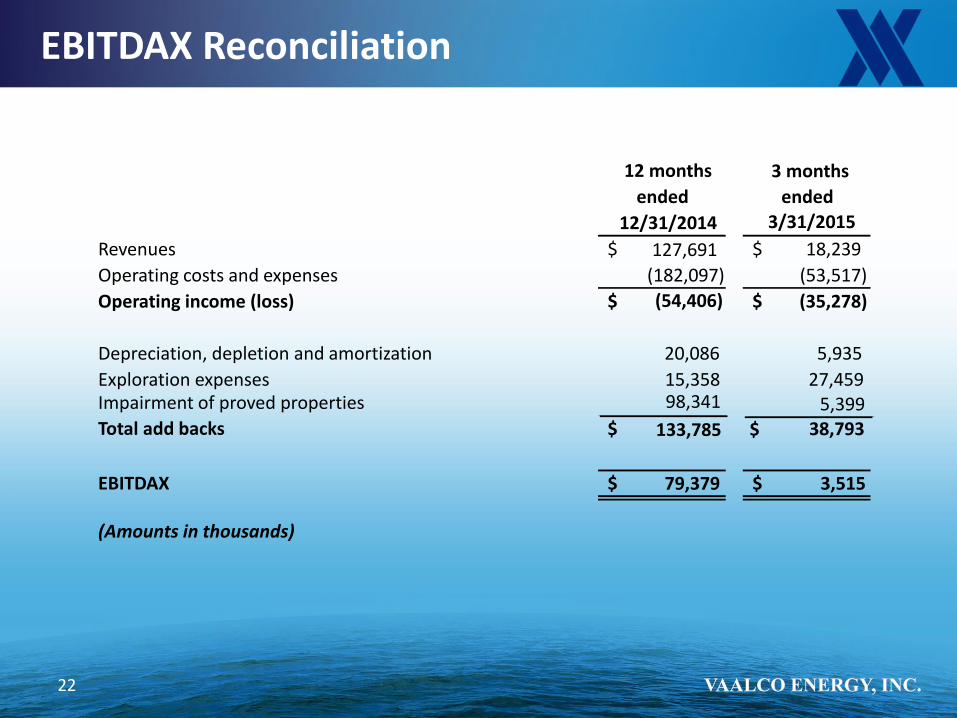
EBITDAX Reconciliation
22
12 months
ended
12/31/2014
3 months
ended
3/31/2015
Revenues $ 18,239 $
Operating costs and expenses (182,097) (53,517)
Operating income (loss) (54,406) $ (35,278) $
Depreciation, depletion and amortization 20,086 5,935
Exploration expenses 15,358 27,459
Total add backs 133,785 $
38,793 $
EBITDAX (Amounts in thousands)
79,379 $ 3,515 $
127,691
Impairment of proved properties 98,341 5,399

![FIS for the RBC/RBC Handover...4.2.1.1 The RBC/RBC communication shall be established according to the rules of the underlying RBC-RBC Safe Communication Interface [Subset-098]. Further](https://static.fdocuments.in/doc/165x107/5e331307d520b57b5677b3fa/fis-for-the-rbcrbc-handover-4211-the-rbcrbc-communication-shall-be-established.jpg)