POBREZA Y VEJEZ - UNLP
86
C C | E E | D D | L L | A A | S S Centro de Estudios Distributivos, Laborales y Sociales Maestría en Economía Universidad Nacional de La Plata Poverty among the Elderly in Latin America and the Caribbean Leonardo Gasparini, Javier Alejo, Francisco Haimovich, Sergio Olivieri y Leopoldo Tornarolli Documento de Trabajo Nro. 55 Julio, 2007 www.depeco.econo.unlp.edu.ar/cedlas
Transcript of POBREZA Y VEJEZ - UNLP

CC | EE | DD | LL | AA | SS
Centro de Estudios Distributivos, Laborales y Sociales
Maestría en Economía
Universidad Nacional de La Plata
Poverty among the Elderly in Latin America and the Caribbean
Leonardo Gasparini, Javier Alejo, Francisco Haimovich,
Sergio Olivieri y Leopoldo Tornarolli
Documento de Trabajo Nro. 55 Julio, 2007
www.depeco.econo.unlp.edu.ar/cedlas

Background paper for the World Economic and Social Survey 2007
The World Ageing Situation
Poverty among the Elderly in Latin America and the Caribbean *
Leonardo Gasparini **
Javier Alejo Francisco Haimovich
Sergio Olivieri Leopoldo Tornarolli
CEDLAS ***
Universidad Nacional de La Plata
Abstract
This paper provides evidence on the incidence of poverty among the elderly in Latin America and the Caribbean, based on household survey microdata from 20 countries. The situation of older people is characterized in terms of income, employment, education, health and access to services vis-à-vis the rest of the population. The paper identifies the role played by the current pension systems in Latin America, and assesses the efforts needed to achieve substantial improvements toward the reduction of old-age poverty.
Keywords: elderly, ageing, poverty, Latin America, Caribbean
* We are very grateful to Ana Cortez, Robert Vos, Oliver Paddison, Marva Corley, Codrina Rada, and Diane Horton for valuable comments and suggestions. We also thank Luis Lima, Georgina Pizzolitto, Pablo Gluzmann, Ana Pacheco, Rocío Carbajal, Gimena Ferreyra, Luis Casanova, Carolina García Domench, Ezequiel Molina, Adriana Conconi and Martín Guzmán for excellent research assistance. The usual disclaimer applies. ** Corresponding author: [email protected] *** CEDLAS is the Center for Distributional, Labor and Social Studies at Universidad Nacional de La Plata (Argentina). Web page: www.depeco.econo.unlp.edu.ar/cedlas/

1. Introduction
Poverty has a relevant age dimension. Both needs and income potential change over the life cycle, modifying the probability of falling into poverty. This paper is focused on the situation of the elderly relative to the rest of the population. In developed countries the combination of strong social security systems, well-developed capital markets, and small households contribute to higher living standards for the elderly, relative to the rest of the population. These conditions are not replicated in many developing countries, where pensions systems are weak and mostly favor the non-poor, the long-term formal credit market is almost inexistent, and the elderly usually live in large extended households sharing the budget with a large number of children.
Identifying the extent to which older persons are affected by poverty vis-à-vis the rest of the population is essential to include the age dimension into social policy discussions. Unfortunately, the task of measuring relative poverty across age groups is plagued by methodological problems and data limitations. Moreover, these limitations do not bias the results in only one direction: old age poverty may be higher or lower than what the statistics show.
This paper is aimed at assessing the situation of the elderly in terms of income poverty and other dimensions of well-being in Latin America and the Caribbean (LAC). The evidence is drawn from a large database of household surveys from 20 LAC countries. To our knowledge this is the first large-scale study that focuses on the poverty situation of the elderly in Latin America based on a large comparable set of household surveys.
The rest of the paper is organized as follows. We start in section 2 by characterizing the age structure of the population, and the household arrangements where older people live. In addition we discuss the ageing process experienced by the region, and the forecasts for the demographic structure of the LAC population. In section 3 we first discuss poverty measurement issues, and then assess the incidence of poverty among older persons in Latin America and the Caribbean under alternative proxies for individual living standards. We compare our results to those found in other developing regions of the world. While in section 3 we deal with income poverty, in section 4 we enrich the analysis by including other dimensions of individual well-being: education, health, access to the labor market and to basic infrastructure (water, sanitation, housing, electricity). The role of the social security system is crucial in understanding old age poverty. In section 5 we examine pension systems in Latin America and assess the observed and potential effectiveness of pensions to reduce poverty. In section 6 we carry out a set of microsimulation exercises in order to analyze the possible patterns toward meeting the target of halving poverty for the elderly. In particular, we compute isopoverty curves that show combinations of neutral growth and redistributive policies toward the elderly capable of attaining the goal of halving old age poverty by year 2015. In section 7 we take the ageing process as giving and carry out some simple microsimulations to estimate its impact on national and old age poverty. Section 8
2

closes the paper with an assessment of the results and their policy implications toward the aim of mitigating old age poverty.
2. The elderly in Latin America and the Caribbean
The population ageing process all over the world is a well-acknowledged fact. Latin America and the Caribbean have not been the exception from this widespread phenomenon. According to the United Nations World Population Prospect, the life expectancy in the region will grow 55% between 1950 and 2050: a person who will be born in 2050 will live 28 years more than a similar person who was born in 1950 (see table 2.1). In fact, life expectancy has been growing in LAC at rates above the world mean.
In LAC, as in the rest of the world, the gender gap in terms of life expectancy has widened in favor of women in the last 50 years (from 3.4 years in 1950 to 6.7 years in 2000). That gap is expected to slightly shrink in the coming decades, due to a more intense fall in the male mortality rate.
The fact that the world, and Latin America in particular, are ageing is clear from the last panel of table 2.1. The median age of the world population has increased from 23.9 to 26.8 since 1950, and it is expected to grow to 37.8 by 2050. The speed of the ageing process has been faster in Latin America compared to the rest of the world, and it is expected to continue being faster in the following decades. In fact, while in 1950 the average Latin-American was almost 4 years younger than the average person in the world; in 2015 a typical inhabitant of Latin America will be 2 years older than the world average.
Another way to illustrate the ageing process is by dividing the population in age brackets. We consider four groups: <15, 15-24, 25-59, and +60, and label the latter group as the elderly. This definition, although entirely arbitrary, is useful for the analysis, as any reasonable alternative definition not based only in age is almost impossible to implement with the usual data at hand. We follow the general practice in LAC to define the elderly as those aged 60 or more. In some sections of this document we assess the robustness of the results to changes in that threshold.
The ageing process discussed above has implied a substantial increase in the share of older people in the population (see figure 2.1). This pattern holds in every continent, but it is particularly significant in Europe. In LAC the share of the elderly in the population increased from around 6% in 1950 to more than 8% in 2000, while it is expected to reach 24% at the end of the century. This ageing process implies an estimate of around 200 million people older than 60 in LAC by 2050.
Figure 2.2 shows that during the last 50 years the annual rate of population growth of the LAC elderly has been higher than the corresponding rate for the younger age brackets. The gap between them has widened since 1980. It is expected that this gap
3

will continue to enlarge during the first two decades of the new millennium (reaching a value 4 times bigger than in 1950), and then probably will start shrinking (Figure 2.2).
The intensity of the population ageing process has been heterogeneous across LAC countries. Figure 2.3 illustrates this heterogeneity by showing the annual growth rate of the population ratio +60/<60 in each LAC country. That ratio has substantially increased in Argentina, Venezuela and Cuba, while it almost has not changed in Mexico, Costa Rica and Nicaragua. Only two LAC countries experienced a substantial fall in the ratio +60/<60: Paraguay and Haiti.
The current (2005) and the estimated future (2015 and 2050) population share of the elderly in each LAC country is displayed in figure 2.4. In all countries the share of the elderly is expected to substantially grow in the coming decades. All LAC societies will have to face the challenges related to an ageing society in the near future. However, as this and the previous figures show, the intensity of these challenges will vary across countries.
Socio-demographic characterization of the elderly
In order to get deeper into the analysis of the socio-economic situation of the elderly in LAC we need to go beyond the basic demographic information included in Census, and use microdata from household surveys. In the rest of the paper we present a socio-economic characterization of older people in LAC based on a large database of household surveys from 21 countries: the Socio-Economic Database for Latin America and the Caribbean (SEDLAC), assembled by CEDLAS (Universidad Nacional de La Plata) and the World Bank’s LAC poverty group (LCSPP). SEDLAC includes more than 150 household surveys in 20 countries: Argentina, Bolivia, Brazil, Colombia, Costa Rica, Chile, Dominican Republic, Ecuador, El Salvador, Guatemala, Haiti, Honduras, Jamaica, Mexico, Nicaragua, Panama, Paraguay, Peru, Uruguay and Venezuela. For this paper we select a sample of surveys corresponding to the latest observation in each country (see table 2.2).
The sample covers all countries in mainland Latin America and three of the largest countries in the Caribbean – Dominican Republic, Haiti and Jamaica. In each period the sample of countries represents more than 92% of LAC total population. Most household surveys included in the sample are nationally representative. The main two exceptions are Argentina and Uruguay, where surveys cover only urban population, which nonetheless represents more than 85% of the total population in both countries.
The population structure drawn from household survey microdata for each LAC country in our sample is presented in table 2.3. On average, older people (60+) represent around 10% of total population. Figure 2.5 illustrates the heterogeneity within the region. While older people in Guatemala and Nicaragua represent 6% of their total population, in Uruguay and Argentina that share is 3 and 2 times greater, respectively.
4

The share of the elderly in the population is larger in rural areas than in cities (Figure 2.6). One possible reason behind this fact is that urban areas offer a wider range of labor possibilities for younger people, which may encourage them to migrate into those areas in order to improve their socio-economic situation.
Table 2.4 shows the population ratios between the elderly and the rest of the population in each country. On average, the elderly are 32% of the children (<15). Figure 2.7 shows the heterogeneity within LAC. While in Uruguay the number of older people is roughly the same as the number of children (<15), in Guatemala the proportion is 1 older people for around 8 children. As expected, the population ratio elderly/children is greater for women than for men. In Uruguay, for instance, there are 15% more older women (>60) than girls (<15), but there are 25% fewer older men than boys.
As expected from the differences in life expectancy shown above, the gender structure differs by age group. In almost all countries the share of women among older people is substantially larger than the corresponding share for the youth (figure 2.8). The average masculinity index, defined as the ratio between the male population and the female population, is 13% higher for the youth (0.97) than for the elderly (0.86) (table 2.5).
Older people tend to live in households of smaller size than younger people (table 2.6). On average in LAC, the elderly live in households with 1.5 persons less than the rest of the population. This gap varies from 1 person in Colombia and Venezuela to around 2 in Guatemala, Argentina and Bolivia. Even though the average family size in rural areas is larger than in cities, we do not find significant differences within the older population (figure 2.9.b).
Table 2.7 helps us to learn on the type of households where the elderly live. On average in Argentina a typical older people lives in a household with 1.37 older people (counting herself), 0.77 adults, 0.26 youngsters and 0.28 children. There is not much variation across countries in the number of people older than 60 living in households with older people (from 1.40 in Peru to 1.25 in Nicaragua). Differences are sharp in terms of children and adults. The average old person in Venezuela lives with 1.52 adults, while the average old Uruguayan lives with 0.64 adults. In rural areas the average LAC old person lives with 20% more children than in cities.
Around a quarter of all LAC households are headed by an older person. Once again there are dissimilarities within the region. For instance, older household heads in Bolivia represent 17% of all heads, while in Argentina and Uruguay that proportion goes up to 31% and 41%, respectively (table 2.8). In rural areas the share of older household heads is higher than in urban areas (figure 2.10.b).
3. Old age poverty
In this section we provide evidence on the incidence of poverty among older persons in Latin America and the Caribbean based on a large set of household surveys. Poverty is certainly a multidimensional issue. However, in this section we restrict the concept of
5

poverty to that of income deprivation. In section 4 we extend the analysis to other relevant variables as education, health, housing, water, sanitation, and labor market opportunities.
An individual is considered as poor if her living standard indicator is lower than a given threshold, known as the poverty line. The practical implementation of this definition requires the choice of a proxy for the individual well-being and a poverty line. Most of the economic literature suggests using household consumption adjusted for demographics as the welfare variable, and a poverty line that combines a certain threshold (largely arbitrary) in terms of consumption of calories, with the consumption habits of the population, and the domestic prices of goods and services.1
Although household consumption is a better proxy for welfare than household income, in this study we follow the literature in LAC and use income as the well-being indicator. A simple reason justifies this practice: few countries in the region routinely conduct national household surveys with consumption/expenditures-based questionnaires, while all of them include questions on individual and household income.
The elements needed to construct a poverty line are idiosyncratic to each community, a fact that leads to wide differences in the national lines across countries, and introduces serious comparability problems. For this reason cross-country comparisons are usually made in terms of some simple international line. The most popular one is the USD1-a-day line proposed in Ravallion et al. (1991). It is a value measured in 1985 international prices and adjusted to local currency using purchasing power parities (PPP) to take into account local prices. The USD 1 standard was chosen as being representative of the national poverty lines found among low-income countries. The line has been recalculated in 1993 PPP terms at USD 1.0763 a day (Chen and Ravallion, 2001). The USD-2-a-day line is also extensively used in comparisons across middle-income countries, like most in LAC. Although the USD-1 or 2-a-day lines have been criticized, their simplicity and the lack of reasonable and easy-to-implement alternatives have made them the standard for international poverty comparisons.2 For instance, the United Nations’ Millennium Development Goal 1 – eradicate extreme poverty and hunger – is stated in terms of USD-1-a-day poverty – halving between 1990 and 2015 the proportion of people whose income is less than USD 1 a day.
The measurement of poverty among the elderly poses some additional relevant problems. The first one is related to the lack of consumption data. Some older people may be living on the assets they accumulated during their lifetimes. The sale of an asset is not usually included as current income, and then not considered in a poverty analysis. While this could be the proper practice for, say, a young adult that sells his car to later buy a new one, it might be incorrect for an older person who periodically sells assets to keep his/her living standard.
1 See for instance Deaton and Zaidi (2003). 2 See Srinivasan (2004), Kakwani (2004) and Ravallion (2004) for a discussion on the merits and demerits of the USD-1-a-day line.
6

An additional problem is posed by the fact that resources may be unevenly allocated within households. The typical information included in an income-based household survey does not allow identifying the specific allocation scheme adopted by each household. For these reason the usual practice is to assume complete within-household equality in living standards.
Another relevant problem arises from the fact that older people usually live in households with a significantly different demographic structure than the rest of the population, as documented in the previous section. That difference makes the poverty comparisons between the elderly and the non-elderly population highly dependent on the assumptions about the impact of the household structure on individual well-beings. In particular, older people tend to live in households of smaller size, which impedes them taking advantage of the household consumption economies of scale.
In summary, although we recognize that poverty is a multidimensional complex problem, data limitations restrict this paper (and most of the literature) to simply consider the poor as those individuals living in households whose per capita income is lower than a certain international poverty line in terms of PPP dollars. Most researchers and practitioners seem to agree that this is a reasonable approximation to a complex problem. In this paper we use that widespread definition and assess the robustness of the results to some methodological changes (economies of scale, adult equivalents and consumption data).
Evidence
We provide evidence on poverty by age groups for a sample of 20 LAC countries. Evidence is drawn from microdata of the SEDLAC database described in section 2. Even after agreeing on the income variable and the poverty line, a large number of methodological problems should be solved to compute poverty in each country. Specific details on methodological issues could be found in the SEDLAC web page.3
Poverty rates significantly differ across LAC countries. Table 3.1 shows the headcount ratios for the USD2-a-day poverty line. While the share of persons with household per capita income below that line is 5.1% in Chile, the share climbs to 78% in Haiti. Poverty is substantially higher in rural areas.4
The correlation between national poverty and poverty in any age group is very high. For instance, the linear correlation coefficient for the case of the elderly (older than 60) is 0.95. Figure 3.1 illustrates this close relationship. It is interesting to notice that most points lie close but below the 45° line, implying lower poverty rates for the elderly when compared to the rest of the population. That is the case in both urban and rural areas. This piece of evidence does not imply that poverty is always decreasing in age. In
3 www.depeco.econo.unlp.edu.ar/cedlas/sedlac 4 See Cicowiez et al. (2006) for evidence on the urban-rural differences.
7

fact when compared to the adult population in most countries poverty is higher for the elderly (figure 3.2). Defining the elderly as those older than 60 or those older than 65 does not make a significant difference.
To further document the age-poverty profile in figure 3.3 we show non-parametric (kernel) estimates of the poverty headcount ratio by age in each LAC country. The curves are clearly downward sloped along all the age range for the set of Southern Cone countries (Argentina, Brazil, Chile and Uruguay). In contrast, for the rest of the countries poverty is clearly decreasing only until around the age of 40, and then becomes either constant (e.g. Paraguay, El Salvador, Nicaragua), slightly increasing (e.g. Bolivia, Ecuador, Venezuela) or substantially increasing (e.g. Colombia, Mexico). For the South American countries with well-developed pensions systems poverty reaches its minimum levels in the older age brackets (table 3.2). In Argentina and Chile the poverty rate for those older than 60 is around a third of the poverty rate for the total population. That proportion drops to 20% in Brazil and just 10% in Uruguay. In contrast, in some other LAC countries old age poverty is more than 20% higher than the national rates. That is the case of Jamaica and Mexico.5
The shape of the age-poverty profiles is surely dependent on factors like the extent of the pension system and the age-education profile. We postpone a discussion on these factors to first investigate another likely determinant of the poverty gaps by age: the demographic structure of households.
The role of the demographic structure
So far, we have measured poverty using per capita income as the individual well-being indicator. It has long been argued that needs differ across age groups and that households can take advantage of their size by exploiting consumption economies of scale (Deaton, 1997). These economies allow a couple to live with less than double the budget of a person living alone.6 According to this approach individual well-being is proxied by total household income deflated by an equivalence scale, defined as a function of the size of the household and its demographic composition. There is a long-standing literature on equivalence scales (see Deaton and Paxson, 1998). We follow the approach of Buhmann et al. (1988) and Deaton and Paxson (1997) by assuming a parametric form for the equivalence scale and examining the consequences of changing the parameters. In particular, we assume that the living standard of an individual i living in household h is given by
θαα )( 2211 ACCY
x hih ++=
5 Notice that although the ratio in Costa Rica is high, the difference in poverty points is small, and even probably not significant. 6 For instance two persons can save costs by living together and having one restroom to share.
8

where A is the number of adults, C1 the number of children under 5 years old, and C2 the number of children between 6 and 14.7 Parameters α allow for different weights for adults and kids, while θ regulates the degree of household economies of scale. When θ=1 there are no economies of scale, while in the other extreme when θ=0, there are full economies of scale, meaning that all goods in the household could be shared completely (i.e. they are all public goods, with no rivalry in consumption). In very underdeveloped economies where people spend nearly all their income in food, there is no much scope for economies of scale (a potato eaten by one member of the household cannot be eaten by another member). In developed economies where a much larger share of the budget is spent in housing, entertainment and other goods easier to share, consumption economies of scale are more important. Following the suggestion of Deaton and Zaidi (2002) for middle-income countries like those in LAC we take intermediate values of the αs (α1=0.5 and α2=0.75) and θ (0.8) as the benchmark case.
To illustrate the adjustment for economies of scale, consider two households, labeled as A and B, for simplicity comprised only by adults, with the same household per capita income ($1000) but with different household size (2 persons in A and 5 persons in B). Using θ=0.8 implies that, despite per capita income is the same in both households, equivalized income is 20% higher in household B ($1380 in B, and $1149 in A).
Notice that in the same way as in the above example, countries where family arrangements imply larger households can take advantage better of the consumption economies of scale, even with a common parameter θ. In addition, one can assume or estimate different parameters θ across countries based on different consumption budget structures (see Deaton, 1997), but this is well beyond the scope of this paper.
In practice it is convenient to work with a transformation of the above equation to make poverty estimates comparable to those obtained with household per capita income and the USD-2-a-day line. The need for an adjustment comes from the fact that by deflating by instead of by just the number of family members , the indicator of individual welfare x
θαα )( 2211 ACC ++ )( 21 ACC ++ih increases, and then poverty estimates go down.
We alleviate (although not eliminate) this nuisance by following the procedure suggested by Deaton and Paxson (1997), and multiplying the above equation by
, where C)/()( 002
01
0022
011 ACCACC ++++ θαα 1
0, C20 and A0 are the number of
children under 5, children between 6 and 14 and adults in the “base” household. We take the average number of children and adults in each country to construct the base family.
Table 3.3 shows older people relative poverty using four alternative income variables: (i) per capita household income, (ii) household income per adult equivalent, (iii) household income adjusted for economies of scale, and (iv) household income per adult equivalent adjusted for economies of scale. The consideration of these demographic
7 Van Praag has suggested the possibility of using different weights for the elderly as their nutritional needs may be lower than those of the adult population. The argument loses strength when expanding the needs to other goods and services (e.g. health).
9
factors implies an increase in the relative poverty of the elderly. As seen in section 2 older people live in smaller households, and then they are not able to take advantage of consumption economies of scale. Also, the increase in equivalized income after the adjustment for the lower needs of children does not particularly favor the elderly, who on average live in households with a smaller number of children.
Figure 3.4 illustrates the change in poverty when carrying out the adjustments. Relative old age poverty significantly increases in Bolivia and Mexico when considering adult equivalents and economies of scale. The effect goes in the same direction in the cases of Argentina and Brazil, although the impact is quantitatively less relevant. This is not surprising, given the smaller household size (and number of children) in Argentina and Brazil, compared to Bolivia and Mexico.
The impact of considering different parameters for economies of scale is analyzed with the help of Table 3.4 and Figure 3.5. As the parameter goes from 1 to 0 consumption economies of scale internal to the household turn more important, and relative old age poverty increases in all countries. In many countries the sign of the poverty comparison between the elderly and the rest does not depend on the parameter of economies of scale (given the adult equivalent scale used). For instance, in Bolivia old age poverty is always higher than national poverty, while the opposite is true in Brazil, regardless of the degree of economies of scale. In some other countries the sign of the difference depends on the parameter: that is the case of Guatemala, El Salvador, Nicaragua, Paraguay and Venezuela. The curves for other countries like Argentina and Chile also cross the unity line, although they do so at improbable values of the parameter of economies of scale.
Characterizing poverty-age profiles
As shown above, old age poverty substantially differs across LAC countries. Countries are different not only in terms of total old age poverty, but what is more relevant for this study, also in elderly poverty relative to the rest of the population. What are the factors behind the country differences in poverty-age profiles? This question is important since it helps to understand why in some countries old age poverty is not a particularly urging problem, at least when compared to poverty for other age groups. Unfortunately, disentangling the complex process leading to old age poverty, even in a single country, is a very difficult topic that goes beyond the scope of this paper. Rather than attempting econometric estimations that will face all sort of data and endogeneity problems, in this section we just show some simple correlations that motivate the possible links between certain characteristics of the economy and old age poverty.
For many reasons, for most people the income potential diminishes after a certain age, and then income poverty is more likely to occur. Societies all around the world have developed pension systems to shield older people against these risks. Old age poverty is then expected to be highly correlated with the development of the pension system. The first panel in figure 3.6 shows a simple scatter plot between relative old age poverty
10

(+60/-60) and the share of old people in the population receiving pension payments. The linear correlation is -0.85 suggesting a strong positive relationship between both variables.8 The relationship is driven by the presence of two clearly different set of countries: those Southern Cone countries with a relatively-well developed pension system where more than half of the population is covered (on average, 66%), and the rest of LAC countries where on average only 14% of the elderly is covered. Within this group the correlation poverty-pensions is not statistically significant.
Older people might be poorer just because they are less educated than the younger generations. As will be documented in the next section, all LAC countries have experienced an education upgrading process which implies that younger people are more skilled and hence better prepared for the labor market. The second panel in figure 3.6 shows that there is a positive relationship between relative old age poverty and the gap in years of education between the elderly and the adult population. The correlation coefficient however is small and barely significant (0.27).
As argued above, the size of the household could be linked to the degree of income poverty. The third panel of figure 3.6 shows the scatter plot of relative old age poverty and the gap in household size between those older than 60 and the rest of the population. In countries where that gap is large, that is where older people live in households substantially smaller than younger people, relative old age poverty is lower. However, this positive link is entirely driven by two countries, Argentina and Uruguay, with low old age poverty and family arrangements such that a large fraction of the elderly, many of whom receive pension payments, lives alone. The linear correlation coefficient is 0.42; it falls to 0.34 when computing poverty with household income adjusted for economies of scale and adult equivalents, and vanishes to zero when deleting Argentina and Uruguay from the sample.
In a cross-country regression (with only 20 observations!) the coefficient of the size of the pension system is always significant, even when controlling for education and household size. In contrast, when controlling for the pension system the coefficients of education and household size become non-significant. In summary, this preliminary evidence suggests that there exists a strong negative relationship between relative old age poverty and the development of the pension system. The evidence about the links between old age poverty with education and household size is weaker.
Older people in the income distribution
Table 3.5 shows the distribution of people older than 60 across quintiles of the income distribution. The elderly are over-represented in the top quintile of the household per capita income distribution in all countries, except Jamaica. When considering the distribution of equivalized household income (θ=0.8, α1=0.5, α2=0.75) the elderly
8 The correlation coefficient is -0.87 when computing relative poverty as +60/-15, and -0.85 when computing poverty with household income adjusted for economies of scale and adult equivalents.
11

become under-represented in five countries. While in the first panel the share of old people in the top quintile exceeds 25% in 15 countries, that number falls to 5 countries in the second panel. When using equivalized income as the welfare indicator, in more than half of the LAC countries the share of the elderly in the bottom quintile is larger than 20%, implying over-representation of older people among the poorest.
Another way of showing the location of the elderly in the income distribution is through concentration curves. Each curve shows the cumulative share of the elderly for the poorest p percent of the population. Figure 3.7 shows these curves for a sample of countries. If the curve lies above the diagonal (the perfect equality line) means that the distribution of older people is biased toward the low-income strata. Suppose the government implements a transfer of $1 to each old person. That policy will be pro-poor (pro-rich) in those countries where the concentration curve lies above (below) the diagonal.
Some results are worth mentioning. First, the curves do not locate too far from the diagonal, meaning a not particularly biased distribution of the elderly in the population. Second, there is not a homogeneous location of the concentration curves across LAC economies. In some countries the curves lie below, in others above, and in others they cross the diagonal.
Box 3.1: Income vs. consumption poverty. The case of Nicaragua
In this box we illustrate the differences between income and consumption poverty of the elderly vis-à-vis the rest of the population, using the Living Standard Measurement Survey of Nicaragua, 2001. This LSMS is one of the few Latin American surveys with reliable information on both income and consumption. The following table shows the ratio of poverty levels between age groups using the two alternative indicators of well-being.
Relative poverty60 +/<60 60+/<15
income poverty 0.82 0.70consumption poverty 0.78 0.66 Source: own calculations based on the EMNV 2001.
Notice that old age poverty relative to the rest of the population is lower when measured with consumption rather than income. Figure B3.1 shows that while when measured with income, poverty slightly increases for the elderly (with respect to adults), it actually goes mildly down when measured with consumption. As expected old age poverty is a less worrisome problem when measured with consumption data.
12

Box 3.2 Subjective poverty and the elderly. The case of Colombia
An alternative approach to determine whether a person achieves a minimum standard of living consists in asking if they consider themselves to be poor. It is interesting to study whether subjective poverty is higher among the elderly, independently of objective measures of deprivation.
Colombia’s Encuesta de Condiciones de Vida asks household heads (or their spouses) whether they would rate themselves as poor. Figure B3.2 illustrates the relationship between self-assessment of welfare and age. As people age, the negative perception of their economic well beings tends to slightly increase.
Whereas on average around 66% of people aged 25 to 59 consider themselves as poor, that share increases to 70.3% for people older than 60 (table B3.1). Notice that around 90% of the elderly living in rural areas are poor under this subjective measure.
For people older than 25, we estimate a basic probit model for the probability of being poor according to the subjective perceptions of individuals. The set of control covariates includes two age dummies (“old people” is the omitted category), a gender dummy, a set of educational dummies, an urban dummy, household size and dummies regarding labor status. As table B3.2 shows, once controlling by observable characteristics the conclusions are different. The likelihood of rating oneself as poor is not significantly different for the elderly and adults aged 50 to 59. Moreover, individuals between 25 and 49 years old are more likely to be poor according to this approach than old people. The higher non-conditional likelihood of being poor of the elderly seems to be due to differences in other observable characteristics, like educational levels. The other estimated coefficients, in general, show the expected sign.
Inequality
Is income inequality higher among the elderly? The answer seems to depend again on the relevance of the pension system in each country. Table 3.6 shows that the Gini coefficient for the income distribution among the elderly is lower than for the rest of the population in Argentina, Brazil, Chile and Uruguay. The results are robust to the change in the individual well-being indicator.
The economic literature has discussed whether ageing societies tend to be less unequal. There is a strong presumption in favor of more equal economies, at least in terms of incomes, in ageing societies with well-developed pension systems. The serious analysis of the interplay between the demographic structure of the population and the income distribution is beyond the scope of this paper. As an exploratory analysis we present in figure 3.8 a simple scatter plot across LAC countries between mean age and the Gini coefficient for the distribution of per capita income. The seemingly negative correlation is driven by Uruguay. As soon as we delete that observation, the negative correlation
13

vanishes (the linear correlation coefficient becomes non-significant). Similar results arise when using the share of older people in the population instead of mean age. At least in the context of LAC where pension systems are poorly developed, the equalizing effect of an ageing society does not show up, at least at a first glance.
Old age poverty in the developing world
The evidence on relative old age poverty in the developing world is still too scarce and non-systematic to identify a clear pattern. Comparisons across studies are mined by all sort of methodological problems, arising from the choice of different poverty lines, different measures of well-being, and different definitions of later life (Barrientos et al., 2003). But even within a specific study patterns are not easy to identify. As we have found for the case of Latin America, other studies report that in other regions of the developing world while in some countries old age poverty is lower, in others it is higher than national poverty. Moreover, the results of these comparisons are affected by the assumptions on economies of scale and adult equivalents (Lanjouw et al., 1998). In contrast to the mixed results for the developing world, most studies find that in advanced economies poverty is significantly lower among older people (Whitehouse, 2000).
In table 3.7 we reproduce some results of previous studies on developing countries. Deaton and Paxson (1997) conducted a detailed analysis of old age poverty for countries of different regions, while Grootaert and Braithwaite (1998) and Lanjouw et al. (1998) use information from the Household Expenditure and Income Data for Transition Economies. In none of these studies a clear pattern for old age poverty arises. In a recent study Kakwani and Subbarao (2005) find that while poverty is higher among households with older persons (particularly in rural areas) in Malawi, Uganda and Zambia, this is not the case in Madagascar, Mozambique and Nigeria, where children were assessed to be in worse situation. Based on these pieces of evidence Barrientos et al. (2003) conclude that “poverty in later life broadly reflects aggregate poverty”. This conclusion seems correct on average, but does not apply to many countries, as table 3.7 and the LAC evidence shown in this paper suggest.
4. The socioeconomic situation of the elderly
In this section other dimensions of well-being are explored. So far, only income deprivation has been taken into consideration. However, well-being is a multi-dimensional concept. Clearly, variables such as health, education, basic infrastructure and security affect the quality of life. These variables have a positive correlation with income, but the correlation is far from being perfect, due in part to the impossibility of buying some attributes of well-being. Another well-known difficulty that reinforces the necessity of examining other dimensions of individual welfare is the biases resulting from measuring poverty with current income (as opposed to permanent income). As
14

discussed above, these biases may distort the poverty comparisons between the elderly and other age groups.
In this section we examine the socioeconomic situation of the elderly compared to the rest of the population in terms of access to the labor market, housing, basic infrastructure, education and health, by exploiting the dataset of household surveys introduced above. We begin by exploring labor opportunities which provides an additional understanding of structural poverty, and give us further insight into income deprivation of the elderly.
Access to the labor market One of the main assets of poor people is their capacity to carry out unskilled work both in market activities and in home production. Compared to the non-poor, the work performed by the poor involves, in general, a greater amount of physical strength. As people age, their ability to perform this kind of tasks diminish, affecting their capacity to keep a job or to get another one, exacerbating poverty.
In order to explore the access of the elderly to the labor market we start by computing labor force participation rates for different age groups in all the countries in our sample. Table 4.1 shows that in all countries the elderly are less likely to be in the labor force than adults aged 25 to 59. The largest differences, in general, correspond to countries with stronger pension systems (Argentina, Brazil, Chile, Costa Rica, Panama and Uruguay). In these countries the age gap in labor market participation, which exceeds 45%, is mainly driven by the lower participation rate of older people, since in those economies the participation rate of adults is similar to the regional average.
Explaining the participation choices of the elderly is an extremely complex issue that goes beyond the scope of this paper. In this section we just carry out an exploratory analysis of this topic. A reasonable starting point is to compare the participation rate of old people receiving pension payments with those who are not receiving these payments. As expected, the columns (v) to (vii) of table 4.1 suggest that the former are less likely to be in the workforce in all the countries. This could be due to legal requirements to stop working once retired, or just to different labor dynamics of old age pensioners. The differences are larger than 30 percentage points in the cases of Argentina, Bolivia, Haiti and Uruguay.
To further analyze this issue we estimate binary choice models for the labor force participation of older people.9 These models are aimed at estimating the likelihood of the elderly of being employed or actively seeking for a job.10 We include as independent variables two dummies identifying old people receiving different kinds of non-labor
9 We restrict the sample to those surveys with appropriate information for estimating those models. 10 The dependent variable is a dummy with value 1 if the individual is employed or unemployed, and 0 if she is out of labor force.
15

income (pensions payments and other non-labor income), a set of educational dummy variables (“at most 8 years of formal education” is the omitted category), age, marital status, a gender dummy, household size, the number of household members with positive income (without including the analyzed individual) and a set of regional dummies. Table 4.2 displays the marginal probabilities of being part of the labor force obtained from the probit regressions. Consistently with the non-conditional analysis, we find that receiving pension payments significantly reduces the likelihood of being in the workforce. In general, other non-labor incomes also decrease this likelihood (except in some few countries), but it is quantitatively less important, presumably because pensions represent most of non-labor income in many countries. Besides, in most cases the number of household members receiving income significantly decreases the likelihood of being in the workforce. This is consistent with the previous result. Other relatives working or receiving non-labor income provide a safety net (in some way similar to pension payments), which could make work for surviving not necessary. On the other hand, it is interesting to notice that among the elderly, in most cases, those who live in rural areas or are skilled (more than 13 years of formal education) are more prone to be in the labor force.11
We now turn to the analysis of the age differences in the employment rate. Table 4.3 shows that old age employment is much lower that the national means. Obviously, this could be a sign not only of the higher difficulty of finding jobs for the elderly, but also of retirement choices. Some of the older people just choose not to work. Moreover, a large employment share of the elderly is not necessarily a social encouraging sign. In fact, this could be the consequence of the lack of a strong social security system.12 In countries such as Argentina, Chile, and Uruguay, which have relatively developed social security systems, the employment rate of the elderly reaches the lowest values in our sample. In these countries, the average share of older people employed is around 25% (the lowest being Uruguay with 17%). In contrast, the highest rates correspond in general to poorer countries without extended pension systems (Bolivia, Guatemala, Honduras, Haiti, Paraguay).
So far, we have shown that the elderly are less likely to be employed, but they are also more likely to be out of the labor market. Since the rate of unemployment is defined as the share of economically active people who are out of work and seeking jobs, it is not clear whether the unemployment rate for the elderly is higher or lower than for the rest
11 In most cases there is very little difference between old people with low or intermediate level of formal education when analyzing participation choices. Increasing the level of qualification from unskilled to semi-skilled does not significantly affect the likelihood of being part of the labor force in 11 out of 17 countries. 12 The participation models explained above contribute with some evidence to this point. We find that safety nets like receiving pension payments or living in families with other income earners reduce the probability of old people of being in the labor force (and presumably the likelihood of being employed). In other words, the lack of a well-built safety net in some countries could be behind a large participation rate of the elderly.
16

of the population. The evidence from household surveys suggests that in most LAC countries the elderly are less likely to experience unemployment (see table 4.4).
As mentioned above, one of the main problems of analyzing unemployment rates of the elderly is that we restrict the analysis to those people in the labor force. Indeed, a large share of old people is not clearly out or in the workforce. Their decision to search for a job is strongly linked to the availability of suitable jobs. In an extreme, if all the elderly sought employment only if they had high chances of obtaining it; their unemployment rate would tend towards zero. This could be one of the reasons behind the lower unemployment rate of the elderly.13
In the third panel of table 4.4 unemployment rates between the poor and the non-poor elderly are compared. In several countries non-poor elderly unemployment is significantly lower than that of the poor. It is important to be cautious about the interpretation of these results. Even though they point to the scarce labor opportunities for the old poor, the differences could be attributable to the interaction among other factors. For instance, many professionals and entrepreneurs that work into later life would receive higher income than the poverty line even if they stopped working (possibly they have saved enough money during adulthood to not need working to survive), but the nature of their work allows them to continue working. In other words, we should not conclude that these people are not poor because of working during old age. Continuing with the example mentioned above, professionals and entrepreneurs usually have more flexible jobs that are not physically demanding, and this could be the reason why they choose to keep on working. There is some evidence pointing out that elderly labor supply is more sensitive to this kind of non-pecuniary benefits (see for example Haider et al., 2001).
Figure 4.1 illustrates that the elderly and adult people differ considerably in their distribution by type of work. The elderly are more likely to be self-employed or entrepreneurs than wage earners.
Table 4.5 reports hourly wages and hours of work for the employed population. As can be seen in the first panel, in LAC the elderly tend to work fewer hours. Only in Nicaragua and the Dominican Republic, are hours worked by old people not significantly different from that of adults aged 50 to 59. The decrease of hours worked over the lifetime is drastic in Argentina, Brazil, Costa Rica, Ecuador, Honduras, Uruguay and Haiti, as illustrated in figure 4.2.
13 This explanation is more plausible for the non-poor elderly, especially in countries with strong pension systems. As mentioned above, the participation gap between adults and old people shrinks in poor countries with fragile social security systems, due in part to the necessity of working for making a decent living of many old people. Under this scenario, the elderly are more prone to actively seek for a job independently of the availability of suitable jobs. On the other hand, analyzing underemployment, together with unemployment, would be necessary to give a full picture of the employability of the elderly
17

Hourly wages are higher for the elderly only in Argentina, Brazil, Chile, and Uruguay (panel II in table 4.5). In all LAC the elderly are over-represented in the lowest quintile of the hourly wage distribution.
Summarizing, in the majority of the countries the elderly face a lower employment rate, and those who are employed tend to work less hours at a lower hourly wage. Likewise, they are more likely to be self-employed or entrepreneurs.
Access to housing and basic infrastructure
Table 4.6 shows statistics regarding housing. It is interesting to notice that, for the most part, the elderly are less likely to be tenants, as well as less likely to live in “poor” areas (i.e. shantytowns). Only in Brazil and Haiti is the share of old people that reside in “poor” areas significantly larger vis-à-vis adults. This is also illustrated in figure 4.3. In contrast, the third panel of table 4.6 shows that in several countries, the elderly are more likely to live in dwellings constructed using low-quality materials. Such is the case of Bolivia, Chile, El Salvador, Guatemala, Honduras, Mexico, Paraguay, Dominican Republic and Haiti. The differences are considerably large in Bolivia, where the elderly are 15% more likely to live in such dwellings than adults aged 25 to 49. The converse is true in the cases of Costa Rica, Nicaragua, Uruguay, Jamaica, and particularly Peru.
The access to basic infrastructure is essential to achieve a minimum standard of living. The access to water, sewerage and hygienic restrooms directly affects individual well-being, and indirectly health status. Clearly, these services play a key role in the household hygiene and in the prevention of water and sanitation-related diseases (like parasitic diseases). The first panel in table 4.7 reports statistics about access to drinking water in the house lot. The elderly seem to have less access to this service in Bolivia, Paraguay and Chile, but are in a better position in Nicaragua, Colombia and Venezuela. In Peru and El Salvador, the likelihood of having water seems to be related in a non-linear fashion to age. Older people have more access than adults aged 25 to 49, but less than people aged 50 to 59. In a number of countries, such as Costa Rica and Ecuador, the differences between age groups are not statistically significant. The panorama of the elderly worsens when considering hygienic restrooms. Older people are more likely to live in dwellings without this facility in the cases of Bolivia, Brazil, Chile, Ecuador, El Salvador, Guatemala, Honduras, Peru and the Dominican Republic. Only in Nicaragua, Uruguay and Venezuela the converse is true. When considering the hardships related to sewerage deprivation we find diverse results. In Chile, Ecuador, El Salvador, Honduras, Mexico and Jamaica, the elderly are in a worse situation in this dimension. The opposite occurs in Bolivia, Costa Rica, Nicaragua, Uruguay and Venezuela.
The previous paragraphs are illustrative of the importance of analyzing multiple dimensions when studying poverty. For instance, the elderly could face a higher probability of having drinking water or living in dwellings made of relatively good quality materials than other age groups, but at the same time they could be in a worse position in terms of hygienic restrooms or income deprivation. These kinds of
18

phenomena are a manifestation of the complexity of measuring welfare, and point out the usefulness of considering each attribute in a separate way, together with aggregate measures of well-being.
Education
When analyzing the socioeconomic situation of the elderly, education becomes a key issue. Besides enhancing the likelihood of having a well-paid job (and therefore reducing the chances of suffering from income deprivation), education affects many aspects of life, being a fundamental attribute of individual welfare. For instance, literacy and numeric skills are used in many daily activities, like buying food. Among other scourges, illiterate people suffer from social exclusion and face serious difficulties in accessing to information.
Table 4.8 reports statistics on literacy rates. For all countries the percentage of older people with literacy skills is smaller than that of adults aged 25 to 59. The gap tends to increase when examining rural areas (panel III in table 4.8). When comparing with people aged 25 to 49, the differences are considerably large in Bolivia, Haiti, Honduras and Nicaragua, the poorest countries in the sample. Figure 4.4 suggests a positive correlation between this literacy gap (in absolute terms) and the level of national poverty. In general, the poorer the country, the larger the elderly relative disadvantage in this basic skill. This fact has a positive side, since it reveals the advance of literacy for the younger generations in the poorest countries. The negative side is that the increase in literacy has not included older people, who are left behind regarding this basic skill.
In table 4.9 individuals are classified according to years of formal education in three groups: unskilled (at most 8 years), semi-skilled (9 to 13 years) and skilled (more than 13 years). In countries like the Dominican Republic, Ecuador, El Salvador, Guatemala, Haiti, Honduras and Nicaragua, around 90% or more of older people are unskilled. In all the countries, the likelihood of being in this group is larger for old people, and is around twice as large as that of adults in countries with relatively low levels of poverty like Argentina, Chile and Uruguay (see panel III in table 4.9). A slight negative correlation between national poverty and the ratio between the percentage of unskilled old age and the percentage of unskilled adults is shown in figure 4.5. This suggests that, in contrast to the changes in literacy discussed above, the education upgrading process has been more intensive in the less poor countries in the sample.
An aggregate indicator
Once we move beyond the scope of income poverty, we face conceptual issues related to the aggregation of the multiple attributes of well-being. A multidimensional approach discards prices as weights and requires the specification of a welfare function which performs this role. This step would lead to determine which attributes, if any, are
19

substitutes. For instance, deprivation in health may be compensated by a sufficiently high level in another dimension (e.g. education).14 Specifying a welfare function and setting the relevant thresholds allows us to rank people according to their level of welfare and to identify the poor.15
To deal implicitly with this issue, an aggregate indicator of deprivation (usually labeled as NBI – Necesidades Básicas Insatisfechas) is frequently employed by researchers and National Statistics Offices in Latin America. A particular aspect concerning aggregate indicators is that insufficient levels of welfare in one attribute cannot be compensated by improving (even substantially) the other dimensions, i.e. there is no substitutability. A person is considered poor under this approach by not fulfilling at least one of the selected conditions.
We construct an aggregate indicator of deprivation according to the following criteria:16 (i) more than 4 persons per room, (ii) the household lives in “poor” areas (iii) the dwelling is made of low-quality materials, (iv) the household does not have access to water in the lot, (v) the dwelling does not have an hygienic restroom, (vi) the household head does not have a primary school degree (vii) the household head does not have a high-school degree, and there are more than 4 household members for each income earner. As mentioned above, all persons in a household are considered poor if they meet at least one of these conditions.
The results obtained are shown in table 4.10. It is important to take into consideration that in some countries the information in the household surveys does not allow to implement the seven criteria listed above. For that reason this aggregate indicator should not be compared across countries. Our main objective, however, is to compare this measure within countries and across age groups. In most cases the elderly are more prone to live in poor households according to the aggregate indicator. The more substantial differences are observed in Brazil, Costa Rica, the Dominican Republic and Panama. Table 4.11 examines each condition included in this indicator.17 The result of the disadvantage of the elderly regarding the aggregate indicator is mainly due to differences in terms of education and house material. On the other hand, the indicators related to a large household size (rooms per capita, dependency rates) tend to reduce the gap between the elderly and the rest regarding this aggregate measure of deprivation.
14 See Thorbecke (2005) for a discussion on this point. 15 See for instance Perry et al (2006), Bourguignon and Chakravarty(2002) and Thorbecke (2005) for more theoretical references about this issue. 16 See Gasparini (2006) for more details of each criterion. 17 For each criterion we report the difference between the proportion of older people who live in households not meeting this criterion and that of adult population.
20

Box 4.1 Hunger and the elderly
Some countries measure food insecurity using an indirect approach. They estimate the cost of a basic food bundle and then identify the household that cannot afford it. A different approach consists in directly asking about alimentary deprivation. In particular, the United States Department of Agriculture developed a methodology that allows establishing whether a household have enough food according to the perception of the adult members.18 If the converse is true, it is said that the household suffer from hunger.
In order to compare the elderly’s chance of suffering from hunger vis-à-vis that of the rest of the population, we employed this methodology and the component of food security included in a special survey of Argentina.19 This module included 10 questions to assess if the household faces difficulties in satisfying its food needs. The answers to these questions were employed to construct a hunger indicator.20 In table B4.1, household are classified according to the age of the head. As it can be seen in the first panel of this table, there are not statistically significant differences in the likelihood of having hunger between different age groups.
Colombia’s ECV allows constructing a more rudimentary indicator of hunger21, but with the advantage of having a much larger sample size than in Argentina.22 The second panel of table B4.1 shows that the results are similar to those found for Argentina, except for the rural areas. Among rural people, households where the head is old are more likely to suffer from hunger than those where the head is aged 25 to 49.
Health
Health is an important dimension of poverty. Poor people usually suffer from precarious sanitary conditions. This not only directly affects welfare but also interacts with many related aspects. For example, bad health reduces productivity and diminishes the ability to manage knowledge.23 In order to analyze the health dimension, we use a sample of surveys (in most cases Living Standard Measurement Surveys) which include questions on several health issues for a group of countries: Argentina (Encuesta de Condiciones de Vida, 2001), Bolivia (Encuesta Continua de Hogares, 2003-2004), Colombia
18 Hamilton et al (1997). The details about this methodology can be found in Hamilton et al. (1997) and Nord y Bickel (2002) 19 Encuesta de Impacto Social de la Crisis en Argentina (ISCA), 2002 20 For technical details see Haimovich and Winkler (2005) 21 This survey asks if a member of the household had nothing to eat (at least during a whole day of the previous week) due to economic reasons. This question is similar to one of the ten questions employed to construct the hunger indicator of Argentina. 22 The sample size of Colombia’s ECV is around ten times larger than that of the ISCA survey
23 World Bank (2006). Poverty Reduction and Growth: Virtuous and Vicious Circles
21

(Encuesta de Condiciones de Vida, 2003), Guatemala (Encuesta Nacional sobre Condiciones de Vida, 2000), El Salvador (Encuesta de Hogares de Propósitos Múltiples, 2004), Nicaragua (Encuesta Nacional de Hogares sobre Medición de Nivel de Vida, 2001), Panama (Encuestas de Niveles de Vida, 2003) and Peru (Encuesta Nacional de Hogares, 2003).
Health issues are particularly interesting when studying old people’s well-being. Aging is strongly linked to health deterioration. Other things being the same, the health of older people is expected to be worse than that of the rest of the population. We illustrate this idea with a subjective measure of health status. Colombia’s ECV asks individuals about self-perception of health. Figure 4.6 shows that the proportion of people who consider themselves to be healthy drastically falls with age. Whereas around 80% of the population aged 5 to 30 have a positive self-perception, this share drops to values close to 30% for people older than 70. Naturally, this phenomenon is also reflected in the likelihood of being ill.24 Table 4.12 shows that in all the countries this likelihood is significantly higher for the elderly. The differences are particularly large in Bolivia and Nicaragua. In the latter, whereas 38% of people aged 25 to 49 fell ill during the previous month, this percentage reaches 73% for older people.
In Bolivia, Nicaragua, Panama and Peru, among those who are ill, the likelihood of visiting a doctor is higher for the elderly. This could be due to differences in the severity of the illness or to different attitudes toward health care, but it does not seem to be due to a larger capacity to afford medical attention. Only in Bolivia, people between 25 and 59 years old are more likely to face economic barriers to visit a doctor (see panel III in table 4.12). In Panama, Peru, Guatemala and El Salvador the converse is true, and in the cases of Nicaragua and Argentina there are not significant differences in this likelihood.25
Other relevant aspect is access to health insurance. Table 4.13 shows that the panorama regarding this issue is ambiguous. In Guatemala, El Salvador and Nicaragua older people are in a worse situation, with lower access to health insurance. The opposite happens in the rest of the countries.
5. The role of the pension systems
In this section we extend the analysis of the relationship between old age poverty and the pension systems, started in section 3, by presenting evidence on the coverage of pensions in LAC, and carrying out microsimulations in order to assess the potential effectiveness of different pension schemes to reduce poverty.
24 The illness condition is referred to the month previous to the field work of the survey. 25 However, in Argentina the elderly are much more likely (10 percentage points) to face economic barriers for getting medicines.
22

Coverage
Most LAC countries have contributory pension systems. In these kinds of employment-based schemes only people with a stable formal job have access to a pension upon retirement. Most Latin-Americans, however, are self-employed or salaried workers in small, precarious firms without a signed contract in compliance with labor regulations, and without access to social security. The evidence suggests that there are no signs of a reduction in the high levels of labor informality in the region in the last 15 years (Gasparini and Tornarolli, 2007; ECLAC, 2006). In fact, in several countries labor informality has increased since the early 1990s.
In table 5.1 and figure 5.1 we present the share of people receiving income from pensions. As expected, the coverage of the pension system in LAC is very low: in 13 out of 19 countries in the sample the share of the elderly receiving income from pensions is lower than 20%. As mentioned earlier, Southern Cone countries have relatively well-developed pension systems, with coverage for the elderly ranging from around 55% in Argentina and Chile to 78% in Brazil and Uruguay. The other two countries with coverage higher than 20% are Costa Rica and Panama, with levels near 40%.
The picture does not look very different if we consider only urban areas. Table 5.2 and figure 5.2 show that in most countries the coverage of pension systems in cities is higher than in the whole country, but the difference does not seem large. The main exception to this conclusion is Panama. The level of urban coverage in this country is similar to Argentina, with more than 50%.
The case of Brazil stands out from the rural statistics in table 5.3 and figure 5.3. In rural Brazil the share of elderly receiving income from pensions is 85%. This high level of coverage is due to the implementation of a non-contributory program geographically targeted: the Brazilian rural pension program, which has been very important in reducing poverty in the poorest rural areas of that South American country. The results achieved in rural Brazil highlight the potential effectiveness of non-contributory mechanisms in reducing poverty, especially in countries with a large proportion of their population excluded from formal labor markets, and thus unable to have access contributory pension systems. Of course, the possibility to implement non-contributory mechanisms depends on fiscal revenues, usually scarce in LAC countries.
All the results shown above are not significantly different if we restrict the analysis to inactive elderly people or define the elderly as those older than 65. In fact, both changes reinforce the advantage in favor of Southern Cone countries, with the share of covered people changing slightly in the remaining countries. The exception is Argentina: in this country 76% of inactive people older than 65 receive income from pensions, while only 56% of people older than 60 receive income from pensions.
So far we have analyzed the access to pensions by the elderly. We now turn to adult people in the labor force to assess its potential access to the pension system in the future. Table 5.4 presents the percentage of salaried workers with the right to receive a
23

pension when retired. Unfortunately, information on the access to the pension system in the LAC household surveys is either restricted to wage earners or not available altogether.
In 8 out of 13 countries less than half of the workers have the right to receive a pension upon retirement. If we added to this scenario the fact that labor informality is surely very high among the self-employed, and that unemployment rates are high in many LAC countries, we would end up with a very disappointing result: most participants in the labor force are not included in the contributory pension systems of LAC, and therefore they do not have the right to perceive a pension in the future.
The situation regarding labor informality is not homogeneous across countries. In Chile almost 90% of salaried workers pay social protection contributions, and in Uruguay 3 out of 4 salaried workers contribute to the pension system. There are three countries with intermediate levels of informality: Venezuela, Argentina and El Salvador. In the remaining countries the share of formal salaried workers is less than 50%. The case of Brazil is interesting: while only 20% of rural salaried workers pay social protection contributions, it was shown above that 85% of rural people older than 60 receive income from pensions. This highlights the importance of the non-contributory mechanism in Brazil.
In the four Southern Cone countries with the lowest overall rates of labor informality, the share of workers older than 60 who are formal is similar to the national average. On the contrary, in almost all the remaining countries the percentage of informal salaried workers older than 60 is significantly higher than the national mean.
Finally, table 5.4 informs that a very low proportion of salaried rural workers have the right to pensions when retired, with the exception of Chile.
Impact of pension on poverty
In section 3 we provide evidence on poverty in LAC countries. By showing poverty rates by age groups, we conclude that poverty rates are lower for the elderly than for other age groups in countries with well-developed pension systems. On the other hand, in countries with weak social security systems there is not much difference between old-age poverty rates and overall poverty rates. In this section, we take a step into the analysis of the impact of pension systems over poverty by computing poverty rates excluding pensions from total household income. This contrafactual exercise has an implicit assumption: if the pension system disappeared, older people incomes would be reduced by the amount of the pensions they are now receiving. The assumption is strong, since it is likely that without pensions, some older people would receive transfers from relatives, friends or NGOs, or decide re-enter the labor market. These behavioral changes would be even more important in the long run, when adult people can foresee the absence of a social security net when old. Given these caveats, the simulations of this section should be viewed as just the direct short-run effects of the
24

pension system on poverty. A deeper analysis requires a behavioral model that is beyond the scope of this document.
In table 5.5 we show the results of this simple exercise. The evidence supports the conclusions of section 3: pension systems in Argentina, Brazil, Chile and Uruguay have an important role in alleviating old-age poverty (given the assumptions of this exercise). In these four countries, those with overall poverty rates markedly higher than old-age poverty, the existence of pension systems with high coverage helps to eradicate poverty almost completely among the elderly. The strongest impact occurs in Brazil: while only 3.7% of Brazilians older than 60 are poor, 47.9% of them would be poor without pensions (keeping all the rest constant). The situation is very similar in Argentina: while poverty among the elderly is low (4.5%), the situation would be different without social security: old-age poverty would reach a level of 39.5%. In Chile and Uruguay, two countries where poverty among the elderly is very low, pension systems contribute to decrease old-age poverty in almost 20 points. In the remaining countries, with the exception of Mexico and Venezuela, the impact of pension systems on poverty is low. This is an expected result, considering the very low coverage of pension systems in these countries. Tables 5.6 and 5.7 display the results of the same exercise for urban and rural areas, separately. The main finding is not surprising: the impact of the pension systems on poverty is higher in the cities than in the countryside, due to the higher coverage of pension systems in urban areas. The results presented in Tables 5.5 to 5.7 are robust to the definition of the elderly.
Simulating the impact of a universal pension system on poverty
Policies traditionally applied to fight poverty are usually designed with the intention of improving the productivity of poor people. The aim of specific policies like training and educational programs is to strengthen their endowment of human capital, augmenting their capacity to find employment and generate income. But, as we have already commented in section 4, most elderly people just do not participate in the labor market, and hence those policies may result ineffective to fight old-age poverty.
A powerful instrument to alleviate poverty among the elderly is to transfer real income to them, specifically through pension systems. In order to analyze the impact of this kind of policy on old-age poverty, we carry out microsimulation exercises following Bourguignon et al. (2006), who simulate the introduction of minimum pension systems in all LAC countries.
The simplest minimum pension scheme to fight old-age poverty is a universal transfer equal to the poverty line granted to all people older than 60 (or 65). This scheme covers all the elderly unconditionally, which makes it administratively very simple, but at the same time very costly, as it transfers income to all the elderly. One way to reduce costs without increasing administrative costs too much, is by using information from pension systems to subtract from the transfer the income that some of the elderly perceive as pension. A further refinement to reduce direct costs would be to restrict the transfer to
25

the poor elderly. Obviously, this restriction imposes indirect costs in terms of identifying poor people. The two minimum pension systems considered in our microsimulations (similar to Bourguignon et al, 2006) are the following:
Microsimulation 1: a transfer equal to the poverty line net from income perceived as pension, granted to all the elderly:
T = max (0, z – yp) if age>59 (or 64)
where T = transfer, z = poverty line, yp = income perceived as a pension
Microsimulation 2: a transfer equal to the poverty line net from income perceived as a pension to all the poor elderly:
T = max (0, z – yp) if age>59 (or 64) and y<z
where y = household per capita income.
Notice that the impact on poverty of these two schemes is the same, since poor elderly receive the same transfer under both mechanisms. As mentioned earlier, the difference between them is the amount of money required by each one. Direct costs are lower in the second scheme, in which only poor people aged more than 60 receive the transfer.
Following Bourguignon et al. (2006) we present results under different scenarios regarding the way in which the transfer is shared within the family, and the possible incentive effects of the transfer, particularly work incentives. The scenarios analyzed are the following:
• Benchmark: the transfer is shared within the household. Each member will have an income equal to (Y+P)/n, where Y = total household income, P = minimum pension and n = total family members.
• Altruism: the older person gives away half of his/her pension to the rest of the members of the family. The older person will have an income equal to Y/n + P/2n, and the other members equal to Y/n + P/2n + P/2(n-1).
• Egoism: the old person keeps his/her pension to him/herself. In this case her/his income is Y/n + P, while the other members of the family receive only Y/n.
• Labor Supply: we suppose that because of the minimum pension the labor supply of the other members of the family decrease. We assume a reduction of labor income equal to the 50% of the pension.
In table 5.8 we present the poverty headcounts resulting from both microsimulations, under the four scenarios. The first panel shows results for all the population, for the elderly and people younger than 60, while the second panel breaks down the latter group into children, young and adults.
The impact on the overall poverty rate of the minimum pension system proposed, under any scenario, is low. This result is not surprising, since these schemes are aimed to reduce old-age poverty, instead of overall poverty. More important for us is to analyze what happens with old-age poverty. As expected, the greatest impact on old-age poverty
26

takes place for countries with low coverage of pension systems. In countries with well-developed pension systems most of the elderly are already receiving income from pensions: the extension of the current schemes simulated in the exercise only affects a limited number of older people. Additionally, it is probable that people receiving the transfer in the exercise belong to the poorest families of the population of these countries, so the amount of the transfer given to the elderly would be usually not enough to allow the family to escape poverty. 26
As expected, the greatest impact on old-age poverty occurs under “egoism”, i.e. when the older member of the family keeps the pension for him/herself. In this case the poverty rates for younger than 60 are not modified. An opposite conclusion is obtained under “altruism”: the poverty rate of the elderly does not fall as much as without “altruism”, but the other age groups experience a larger decrease in their poverty rates. However, in practice the poverty reduction in these groups turns to be very small. In the “benchmark” case, the results are intermediate between “egoism” and “altruism”: poverty rates fall for all age groups, but old-age poverty does not decrease as much as under “egoism”, and poverty rates of the non-elderly do not decrease as much as under “altruism”.
In the “labor supply” case the poverty rates of all age groups decrease less than under the “benchmark” case. However, the welfare of each group may increase, because of lower rates of labor force participation (and hence more leisure).
The fact that old-age poverty is not eradicated completely in spite of the minimum pension reflects that the pension is shared among all household members. Even under “egoism”, poverty for the elderly is not eliminated. This is explained by the fact that we have supposed that the elderly keeps for him/herself only the pension received from the new scheme, but they still share the pension received before the implementation of the universal pension system. Table 5.9 shows that these conclusions are robust to the definition of the elderly.
In order to assess the feasibility of the implementation of these kinds of universal minimum pension systems, we calculate the costs in terms of household per capita income of each scheme. Table 5.10 shows the results of these calculations. As expected, the program with the lowest cost is that in which only the poor elderly receive the transfer. The cost of both programs is smaller in countries with well-developed pension systems. In fact, in Argentina, Brazil, Chile, and Uruguay the cost of the programs is negligible.
26 People excluded from the contributory pension system in these countries are normally those who do not have a stable job along their lifetime. These people are also very poor in these countries.
27

6. Some microsimulation exercises
One of the main social targets for societies all around the world is to reduce poverty. For instance, the first goal of the United Nations Millennium Development Goals is aimed at halving the proportion of poor people in each country between 1990 and 2015. Although poverty-reduction targets are usually set for country aggregates, it is equally important to analyze them for certain relevant groups. In this section we use microsimulation techniques in order to analyze how several contrafactual scenarios may influence the likelihood of reaching certain poverty-reduction goals by the elderly. Specifically, we carry a microsimulation exercise that illustrates the combinations of neutral growth and redistribution needed to attain certain poverty-reduction targets for the elderly.
The roads leading to sustainable reduction of poverty are subject of great debate. In this section we simplify the issue by thinking poverty reduction as the result of either neutral per capita income growth, or redistributive policies, or a combination of both. Of course reality is much more complex: there might be no policy instrument that increase productivity proportionally for all the population, while redistributive policies may take a significant toll on efficiency, and hence on incomes. However, it is still illustrative to know what is the effort in terms of neutral economic growth and simple non-distortionary redistributive policies to attain a certain poverty target. This information is useful at least to have an idea of the “distance” of the country from the poverty target in terms of growth and redistribution. In this section we compute isopoverty curves that measure the effort in terms of income redistribution as well as economic growth, that would allow reducing poverty for the elderly. We first discuss the methodology and then show the results.
We compute isopoverty curves, that is, combinations of neutral growth rates and simple redistributive policies that are capable of attaining a given poverty objective.27 In our case the objective is reducing poverty by a half for the older population (+60) of a country. The starting point in each country is the latest income distribution available. In the simulations the country reaches the poverty-reduction goal for the elderly in the year 2015. We model growth by multiplying household income by a constant, thus assuming neutral growth. This exercise tell us at what rate the economy should grow, with unchanged Lorenz curve, to meet a given poverty target.
In our isopoverty curves the other way to reduce old-age poverty is by income transfers from the non-poor people to the poor elderly. We analyze three types of income transfers. The targeted transfers minimize the fiscal cost of a given poverty reduction, as measured by the headcount ratio. Only the poor elderly who are closer to the poverty line receive the transfer (i.e. those that need a smaller transfer to escape out of poverty), and they receive only the minimum amount needed to reach the poverty line. Although this policy would be probably undesirable (as the very poorest do not receive transfers),
27 See Gasparini and Cicowiez (2005) for specific details on the computation of these curves.
28
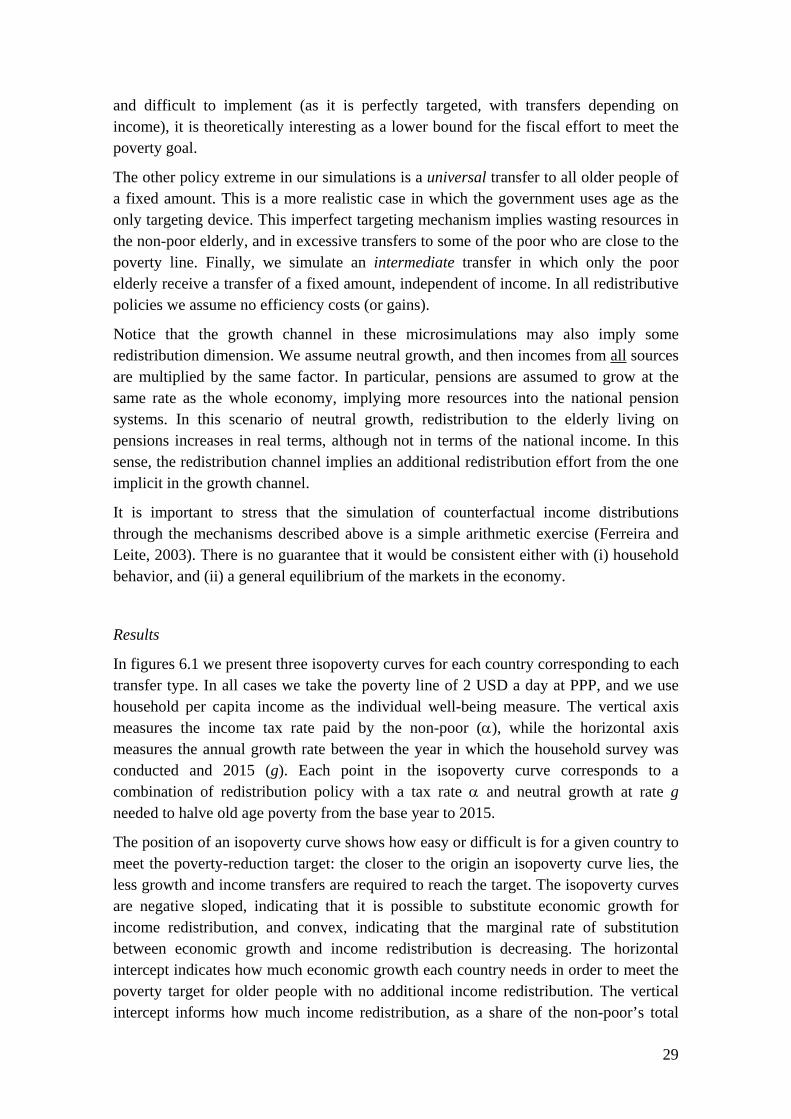
and difficult to implement (as it is perfectly targeted, with transfers depending on income), it is theoretically interesting as a lower bound for the fiscal effort to meet the poverty goal.
The other policy extreme in our simulations is a universal transfer to all older people of a fixed amount. This is a more realistic case in which the government uses age as the only targeting device. This imperfect targeting mechanism implies wasting resources in the non-poor elderly, and in excessive transfers to some of the poor who are close to the poverty line. Finally, we simulate an intermediate transfer in which only the poor elderly receive a transfer of a fixed amount, independent of income. In all redistributive policies we assume no efficiency costs (or gains).
Notice that the growth channel in these microsimulations may also imply some redistribution dimension. We assume neutral growth, and then incomes from all sources are multiplied by the same factor. In particular, pensions are assumed to grow at the same rate as the whole economy, implying more resources into the national pension systems. In this scenario of neutral growth, redistribution to the elderly living on pensions increases in real terms, although not in terms of the national income. In this sense, the redistribution channel implies an additional redistribution effort from the one implicit in the growth channel.
It is important to stress that the simulation of counterfactual income distributions through the mechanisms described above is a simple arithmetic exercise (Ferreira and Leite, 2003). There is no guarantee that it would be consistent either with (i) household behavior, and (ii) a general equilibrium of the markets in the economy.
Results
In figures 6.1 we present three isopoverty curves for each country corresponding to each transfer type. In all cases we take the poverty line of 2 USD a day at PPP, and we use household per capita income as the individual well-being measure. The vertical axis measures the income tax rate paid by the non-poor (α), while the horizontal axis measures the annual growth rate between the year in which the household survey was conducted and 2015 (g). Each point in the isopoverty curve corresponds to a combination of redistribution policy with a tax rate α and neutral growth at rate g needed to halve old age poverty from the base year to 2015.
The position of an isopoverty curve shows how easy or difficult is for a given country to meet the poverty-reduction target: the closer to the origin an isopoverty curve lies, the less growth and income transfers are required to reach the target. The isopoverty curves are negative sloped, indicating that it is possible to substitute economic growth for income redistribution, and convex, indicating that the marginal rate of substitution between economic growth and income redistribution is decreasing. The horizontal intercept indicates how much economic growth each country needs in order to meet the poverty target for older people with no additional income redistribution. The vertical intercept informs how much income redistribution, as a share of the non-poor’s total
29

income, each country needs in order to achieve the poverty target with no economic growth.
The curves in figure 6.1 are relatively “flat”, implying that the poverty reduction impact of even a small transfer program is equivalent to that of many percentage points in accumulated economic growth. For instance, in the case of El Salvador, an annual growth rate of almost 5% between 2004 and 2015 is equal, in terms of old age poverty reduction, to an income transfer of less than one point (0.73%) of the non-poor individuals’ income to the poor elderly. In general, the curves are flatter for targeted and intermediate transfer policies than for universal transfers, as the latter imply a greater fiscal effort to achieve the poverty reduction goal.
Columns (i) and (ii) of table 6.1 show the intercepts of the isopoverty curves with the horizontal and vertical axis for every kind of transfer program. Column (iii) shows the amount of income transferred from non-poor individuals to older ones as a percentage of the country’s total income, assuming no economic growth (g=0).28
For instance, in order to halve old age poverty (as measured with the USD 2 line) Mexico would need to transfer 0.54% of non-poor individuals’ total income to the elderly poor population under the intermediate scheme, if the economy were not to grow between 2004 and 2015. Under a universal scheme the incremental tax rate would increase to almost 2%. The same policy-reducing effect could be achieved with no income redistribution by an average annual income growth rate of 10.5% between 2004 and 2015.
On average, the region needs to grow at annual 6% to cut old age poverty by a half in the next 10 years. Although most countries in the region are growing at a fact pace, to sustain a growth rate of 6% for a decade seems an ambitious target for such an unstable region as Latin America. The redistributive effort seems more modest. Under the intermediate type of transfers, only two Caribbean countries (Haiti and Jamaica) would need to implement a tax on the non-poor with a rate higher than 2%. On average the rate needed is 0.64%. Even in the universal case, with targeting made only based on age, the incremental tax rate would be on average less than 2%. Although this effort seems small, the possibility of its implementation in the real world depends on the political economy of each country. Efficient redistributive policies have been very difficult to implement in Latin America, so even a tax reform of 1% of total income aimed at the poor elderly might be unfeasible.
Box 6.1. A simple transfer program
In this box we calculate the effect at the national level of halving poverty for the elderly from their current levels. In order to do that, we simulate the implementation of a
28 Total income is calculated from the household surveys. Notice that this estimation usually differs from National Accounts.
30

transfer program that allows half of the elderly poor to leave poverty behind. We present results for the poverty headcount ratio using the USD 2 a day at PPP poverty line. Figure B6.1 shows the results.
The reduction in national poverty varies across countries, ranging from more than 3 percentage points in Jamaica (from 50.5% to 47.3%) to 0.08 percentage points for Uruguay (form 6.07% to 5.9%). In most countries the effect of this redistributive policy on the national poverty is not significant. On average, the national poverty in the region falls by around 1 point. In some countries with large and relatively poorer older population, such as Jamaica and Colombia, the impact of this simulated redistributive policy is larger. Uruguay, Argentina and Chile also have a large elderly population, but composed mostly by non-poor people, which implies a low effect of the simulated policy over national poverty (Table B6.1).
7. Demographic transition and poverty
As discussed in section 2 the Latin American population is ageing. This demographic process will undoubtedly have consequences on national poverty. Naturally, estimating these consequences is an extremely difficult task that is beyond the aim of this document. In this section we take a small step on that direction by carrying out a microsimulation exercise. Starting from the latest available household survey in each LAC country, we make two basic changes. First we simulate the demographic structure of each country in 20 years, considering the population projections by age and sex of the United Nations (under the assumption of the medium variant).29 Second, we change the educational structure of the population, as we expect that the increase in education coverage that the region has experienced will continue in the following 20 years. In this section we compute the consequences in terms of income poverty of the simultaneous change of the demographic and educational structure of the population of each Latin American country.
As explained, to simulate the demographic structure in 20 years from now we make use of the UN population projections. To simulate the future educational structure we make the following assumptions. Suppose the latest survey available for a given country is that of 2005, and then we make the simulation for year 2025. People older than 45 in 2025 are those older than 25 now. We assume those people already finished their educational process in 2005, and hence in 2025 they will have the same educational level as today. We also assume that in 2025 all children finish primary school, and all youths (aged 13 to 18) finish secondary school. These two assumptions are not important for the simulations since children and youths have zero or low earnings, and hence do not affect much the poverty status of the family.
29 For further information see World Population Prospects - The 2004 revision, United Nations-Department of Economic ad Social Affairs Population Division.
31

People aged 19 to 44 in 2025 are those aged 9 to 24 in 2005. Some of them already dropped school. We assume that they will not resume education. For those who have not dropped school in 2005, we are uncertain which educational level they will end up having in 2025. We then impose a simple upgrading of the observed educational structure of those people.
After simulating the educational levels of people in 2025 we estimate their earnings by assuming no changes in the labor market from 2005 to 2015. Of course, this is a strong assumption, but it is useful to isolate the effects of the demographic and educational changes. Specifically we estimate earnings in 2025 by applying the parameters of two Mincer equation for hourly wages and hours of work (estimated with the 2005 data) to the characteristics of the population in 2025. If earnings in the simulation change, we also change non-labor income proportionally. Finally, we assume no changes in the family structure.
After carrying out this exercise, household incomes change, and hence poverty changes. There are two effects that go in different directions. On the one hand, the educational upgrading is a poverty-reducing factor. More educated people have higher earnings, and hence poverty falls. On the other hand, the ageing process has an ambiguous effect on poverty. The demographic transition implies more adult population and more older people. The first factor is very likely poverty-reducing as adults have higher earnings than youngsters, while the second one is ambiguous, as countries differ in the incomes of the elderly relative to the rest of the population.
Table 7.1 shows the results of the microsimulations for all the countries in our sample. The table shows the change in national poverty measured with the USD 2 line using three alternative poverty indicators. Poverty drops in all countries (with the exception of Uruguay). In some cases the fall is large. For instance, in Nicaragua and El Salvador national poverty falls 25 points. Old age poverty also decreases (see table 7.2). The fall is particularly noticeable in countries with high current levels of old age poverty.
In table 7.3 we show the results of a decomposition of the poverty changes described above. Given that the microsimulation was based on changes in the demographic and educational structure of the population, we can decompose the total change in the headcount poverty ratio into these two effects. The educational upgrading of the population has an unambiguous poverty-decreasing effect both on national and old age poverty. The effect is particularly large in those countries with low attendance rates.
It interesting to notice that in all economies (except Uruguay) the ageing process modeled in this section has a small poverty-decreasing effect. To understand this result recall again that the income-age profile has an inverted-U shape: in general individual earnings increase from youth to adulthood, and then fall when the person turns old. As explained above, on the one hand the demographic transition implies more older people, and hence lower incomes and higher poverty, but at the same time it also implies more adults instead of children and youths, which implies higher incomes and lower poverty. From the evidence of this section it seems that the demographic transition in Latin
32

America is at a point where the latter effect seems larger than the former. The difference, however, seems pretty small. Latin America can still take advantage of the demographic dynamics. However, it is likely that as the ageing process goes on, the increase in the elderly population would become the dominant factor, and hence it will imply a new challenge to the aim of reducing poverty in the region.
8. Concluding remarks
The elderly are around 8% of the LAC population, a fraction that is expected to significantly grow in the future as the ageing process goes on. All LAC societies will have to face the challenges related to an ageing society in the near future. One of the major challenges is eradicating old age poverty. Around a quarter of the elderly population in a typical LAC country lives with less than USD 2 a day (PPP). When compared to other age groups, the situation widely differs across countries: while in the South American countries with relatively well-developed pension systems (Argentina, Brazil, Chile and Uruguay) old age poverty is substantially lower than the national mean, in many other LAC countries it is similar or higher than the national average.
Old age poverty seems to be a less worrisome problem when measured with consumption. On the contrary, it looks a more severe problem, vis-à-vis the rest of the population, when adjusting incomes for household economies of scale and adult equivalents. There is still a long way to go to have precise measures of relative old age poverty in LAC.
The preliminary evidence shown in the paper suggests that there exists a strong negative relationship between the development of the pension system and relative old age poverty. Cross-country data and various microsimulations suggest that pensions or any other mechanism of transferring income to the elderly are essential to keep old age poverty low. However, most of LAC elderly do not receive pensions, and most of LAC workers are not covered by the social security system, and hence they will not have a pension in the future, at least within the contributory regime.
The cost of protecting the elderly from income poverty does not seem high. Even assuming no economic growth, the incremental tax rate on the non-poor to finance a transfer to the elderly enough to cut old age poverty by a half is around 1%. Although this effort seems small, the possibility of its implementation in the real world depends on the political economy of each country. Efficient redistributive policies have been very difficult to implement in Latin America, so even a tax reform of 1% of total income aimed at the poor elderly might be unfeasible. If there is no room for redistributive policies toward the elderly, our simulations suggest that to achieve the goal of halving old age poverty LAC economies would need to grow at an annual rate of 6% (per capita) for 10 years.
33

Besides the availability of formal arrangements for old age support, the paper suggests that factors such as living arrangements, composition of household, and education play a role in determining vulnerability to poverty among older persons.
The study documents that in many countries the elderly are less likely to live in precarious areas, like shantytowns, but more likely to live in houses made of precarious materials or without sanitation. This diversity points out the usefulness of considering each attribute in a separate way, together with aggregate measures of well-being.
Many poverty-alleviation policies in Latin America are targeted geographically, and use the number of children in the household and the size of the dwelling (persons per room) as targeting criteria. But as the evidence shown in this paper suggests, in some countries the elderly are as poor as the rest of the population (or more), but are less likely to live in poor areas, and less likely to share the house with children, a fact that calls for more refinements in the design of social policies.
The demographic transition is underway in Latin America and the Caribbean. Countries with well-developed pension systems, where old age poverty is now relatively low, will face serious difficulties in maintaining such systems with a decreasing workers/elderly ratio. On the other hand, countries with a weak social security net and where old age poverty is particularly high, will find hard to reduce national poverty in an ageing society.
The Latin American and Caribbean economies are now in a stage of economic recovery and expansion. GDP is growing and poverty is falling in most countries. This paper also highlights the fact that countries are still in a stage of the demographic transition where the ageing process does not imply a serious obstacle to the aim of reducing poverty. LAC societies in general and local governments in particular face a great opportunity to make the reforms needed to reduce old age poverty today, and to create the environment for old age poverty not to be a serious concern in the future.
34

References
Barrientos, A. (2002), Old age, poverty and social development. Journal of International Development, Vol. 14, No. 8 (November).
Barrientos, A. et al. (2003). Old age poverty in developing countries: contributions and dependence in later life. World Development 31 (3).
Bourguignon, F. and Chakravarty, S.(2002), Multi-dimensional poverty orderings, Working paper N° 2002-22, DELTA
Bourguignon, F., Cicowiez, M., Dethier, J., Gasparini, L and Pestieau, P. (2006). What impact would a universal minimum pension have on old age poverty in developing countries? Mimeo.
Buhmann, B., Rainwater, G., Schmaus, G. and Smeeding, T. (1988). Equivalence scales, well being, inequality and poverty: sensitivity estimates across ten countries using the Luxembourg Income Study database. Review of Income and Wealth 34, 115-142.
Chen, S. and Ravallion., M. (2001). How did the world's poorest fare in the 1990s? World Bank working paper.
Cicowiez, M., Gasparini, L., Gutiérrez, F. and Tornarolli, L. (2006). Areas rurales y Objetivos de Desarrollo del Milenio en América Latina y el Caribe. New York: UNDP.
Deaton, A. and Zaidi, S. (2002). Guidelines for constructing consumption aggregates for welfare analysis. LSMS Working Paper 135.
Deaton, A. and Paxson, C. (1997). Poverty among children and the elderly in developing countries. Working paper, Princeton University.
Deaton, A. and Paxson, C. (1998). Poverty among the elderly. In Wise, D. (ed). Inquires in the economic of aging. Chicago University Press for the National Bureau of Economic Research.
Haider, A. et al. (2001), Elderly Labor Supply: Work or Play? Journal of International Development, Vol. 14, No. 8 (November). Boston College. Working Paper Nº 2001-04.
Haimovich, F. and Winkler, H (2005), Urban-Rural Differences in Poverty: a micro-decomposition approach for Argentina CEDLAS. Working paper Nº24
Hamilton, W. et al. (1997) Household Food Security in the United States in 1995: Summary Report of the Food SecurityMeasurement Project. Washington DC: Office of Analysis, Nutrition, and Evaluation, Food and Nutrition Service, United States Department of Agriculture.
Gasparini, L. (2006), A Guide to the Sedlac Socio-Economic Database for Latin America and the Caribbean. CEDLAS and The World Bank.
35

Gasparini, L. and Tornarolli, L. (2007). Labor Informality in Latin America and the Caribbean: Patterns and Trends from Household Survey Microdata, Working paper, CEDLAS.
Grootaert, C. and Braithwaite, J. (1998). Poverty correlates and indicator-based targeting in Eastern Europe and the former Soviet Union. World bank Working paper 1942.
Kakwani, N. (2004). New global poverty counts. In Focus, International Poverty Centre. September.
Kakwani, N. and Subbarao, K. (2005), Ageing and Poverty in Africa and the role of social pensions. UNDP International Poverty Centre, Working Paper No. 8 (August).
Lanjouw, P., Milanovic, B. and S. Paternostro (1998). Poverty and the Economic Transition: How Do Changes in Economies of Scale Affect Poverty Rates for Different Households? World Bank Working paper 2009.
Nord, M., y G. Bickel (2002). Measuring Children’s Food Security in U.S. Households, 1995-99. FANRR- 25, USDA, Economic Research Service.
Ravallion. M. (2004). Monitoring progress against global poverty. In Focus, International Poverty Centre. September.
Ravallion, M., Datt, G. and van de Walle, D. (1991). Quantifying absolute poverty in the Developing World. Review of Income and Wealth 37, 345-361.
Perry, G. et al (2006), Poverty Reduction and Growth: Virtuous and Vicious Circles. The World Bank LAC Flagship Report.
Srinivasan, T. (2004). The unsatisfactory state of global poverty estimation. In Focus, International Poverty Centre. September.
Thorbecke, E. (2005). Multi-dimensional Poverty: Conceptual and Measurement Issues. The Many Dimensions of Poverty International Conference, UNDP International Poverty Centre, Brasilia.
Whitehouse, E. (2000). How poor are the old? A survey of evidence from 44 countries. World Bank working paper.
36

Table 2.1 Population, life expectancy and median age
Africa Asia Europe Latin America and Caribbean
Northern America Oceania
Population (millons)1950 2,519 224 1,396 547 167 172 132000 6,086 812 3,676 728 523 315 312015 7,219 1,115 4,351 721 634 361 372050 9,076 1,937 5,217 653 783 438 48
Life expectancy Both
1950 46.6 38.4 41.4 65.6 51.4 68.8 60.42000 64.6 49.9 65.7 73.2 70.2 76.7 72.52015 67.7 51.8 70.2 75.0 74.0 78.8 76.22050 75.1 65.4 77.2 80.6 79.5 82.7 81.2
Males1950 45.3 37.1 40.7 62.9 49.7 66.1 58.12000 62.3 48.5 63.9 69.0 66.9 73.9 70.02015 65.5 51.1 68.1 71.1 70.8 76.1 74.12050 72.8 63.8 75.0 77.5 76.4 80.2 78.9
Females1950 48.0 39.7 42.2 67.9 53.1 71.9 62.92000 67.0 51.3 67.6 77.4 73.6 79.5 75.02015 69.9 52.5 72.3 79.0 77.1 81.4 78.32050 77.5 67.0 79.5 83.6 82.5 85.2 83.4
Median Age1950 23.9 19.0 22.0 29.7 20.2 29.8 28.02000 26.8 18.4 26.2 37.6 24.4 35.4 31.22015 30.4 20.2 30.8 41.8 29.1 37.4 34.52050 37.8 27.4 39.9 47.1 39.9 41.5 40.5
World Major Area
Source: own calculations based on Population Division of the Department of Economic and Social Affairs of the United Nations Secretariat, World Population Prospects: The 2004 Revision, February 2005. Note: Medium fertility and AIDS mortality variant
Table 2.2 LAC household surveys used in this study
Country Name of survey Acronym Year Coverage Households Individuals
Argentina Encuesta Permanente de Hogares-Continua EPH-C 2005 Urban-28 cities 27,511 94,813Bolivia Encuesta Continua de Hogares- MECOVI ECH 2002 National 5,746 24,933Brazil Pesquisa Nacional por Amostra de Domicilios PNAD 2004 National 122,513 399,342Chile Encuesta de Caracterización Socioeconómica Nacional CASEN 2003 National 68,153 257,077Colombia Encuesta Continua de Hogares ECH 2004 National 12,510 50,850Costa Rica Encuesta de Hogares de Propósitos Múltiples EHPM 2004 National 11,366 43,779Dominican R. Encuesta Nacional de Fuerza de Trabajo ENFT 2005 National 7,655 30,038Ecuador Encuesta de Empleo, Desempleo y Subempleo ENEMDU 2003 National 18,959 82,317El Salvador Encuesta de Hogares de Propósitos Múltiples EHPM 2004 National 16,490 70,558Guatemala Encuesta Nacional de Empleo e Ingresos ENEI - 2 2004 National 2,874 10,615Haiti Enquête sur les Conditions de Vie en Haïti ECVH 2001 National 7,186 33,007Honduras Encuesta Permanente de Hogares de Propósitos Múltiples EPHPM 2005 National 7,318 35,182Jamaica Jamaica Survey of Living Conditions JSLC 2002 National 5,092 17,535Mexico Encuesta Nacional de Ingresos y Gastos de los Hogares ENIGH 2004 National 22,595 91,738Nicaragua Encuesta Nacional de Hogares sobre Medición de Nivel de Vida EMNV 2001 National 4,191 22,810Panama Encuesta de Hogares EH 2004 National 13,500 52,957Paraguay Encuesta Permanente de Hogares EPH 2004 National 7,823 34,636Peru Encuesta Nacional de Hogares ENAHO 2003 National 4,642 21,267Suriname Expenditure Household Survey EHS 1999 Urban/Paramaribo 410 1,694Uruguay Encuesta Continua de Hogares ECH 2005 Urban 18,506 54,330Venezuela Encuesta de Hogares Por Muestreo EHM 2004 National 37,838 166,320 Source: SEDLAC
37

Table 2.3 Population structure by age National, urban and rural areas
60+ 0-59 <15 15-24 25-59 60-64 65-80 80+ 60+ 0-59 <15 15-24 25-59 60-64 65-80 80+ 60+ 0-59 <15 15-24 25-59 60-64 65-80 80+ Argentina 2005 14.5 85.5 25.5 17.4 42.5 4.0 8.0 2.4 14.5 85.5 25.5 17.4 42.5 4.0 8.0 2.4 Bolivia 2002 6.4 93.6 39.6 19.4 34.6 2.0 3.7 0.7 5.1 94.9 37.5 20.9 36.5 1.6 2.9 0.6 8.4 91.6 43.3 16.9 31.5 2.5 5.0 0.9 Brazil 2004 9.7 90.3 27.1 19.1 44.1 3.0 5.4 1.2 9.7 90.3 26.1 19.1 45.1 3.0 5.5 1.2 9.9 90.1 32.1 19.1 39.0 3.2 5.4 1.2 Chile 2003 11.5 88.5 25.5 17.6 45.4 3.5 6.4 1.6 11.0 89.0 25.4 17.8 45.7 3.4 6.1 1.6 14.5 85.5 25.7 16.4 43.4 4.1 8.2 2.2 Colombia 2004 10.3 89.7 30.1 18.6 41.0 3.4 5.6 1.4 10.2 89.8 28.1 19.0 42.7 3.2 5.6 1.4 10.7 89.3 35.4 17.7 36.2 3.9 5.6 1.2 Costa Rica 2004 9.0 91.0 28.6 19.9 42.7 2.7 4.9 1.3 9.9 90.1 26.2 19.8 44.3 2.9 5.5 1.4 7.7 92.3 32.1 20.0 40.4 2.4 4.1 1.1 Dominican R. 2005 9.2 90.8 31.5 19.5 39.8 2.6 5.1 1.4 8.6 91.4 30.6 19.8 41.0 2.5 4.8 1.3 10.4 89.6 33.2 18.9 37.5 2.9 5.7 1.7 Ecuador 2003 9.7 90.3 35.0 19.1 36.3 2.8 5.4 1.5 8.8 91.2 32.7 19.7 38.8 2.6 4.8 1.4 10.6 89.4 37.7 18.3 33.4 2.9 6.0 1.7 El Salvador 2004 9.5 90.5 34.0 19.7 36.8 2.6 5.3 1.6 9.9 90.1 31.1 19.3 39.7 2.6 5.6 1.7 8.8 91.2 38.4 20.4 32.4 2.4 5.0 1.4 Guatemala 2004 6.2 93.8 41.9 19.7 32.2 2.0 3.4 0.8 7.0 93.0 36.6 20.3 36.2 2.1 3.9 0.9 5.6 94.4 46.3 19.3 28.9 1.9 3.0 0.7 Haiti 2001 8.8 91.2 38.6 20.3 32.5 2.5 5.0 1.2 7.1 92.9 35.6 23.3 34.1 2.0 3.9 1.0 10.0 90.0 40.6 18.2 31.5 2.8 5.7 1.3 Honduras 2005 7.4 92.6 39.7 21.5 31.5 2.2 4.0 1.1 7.3 92.7 35.0 23.2 34.5 2.2 3.9 1.2 7.4 92.6 43.6 20.0 28.9 2.2 4.2 1.1 Jamaica 2002 12.2 87.8 33.2 17.8 36.9 2.8 7.0 2.3 10.9 89.1 31.4 18.3 39.3 2.7 6.5 1.7 13.2 86.8 34.6 17.3 34.9 2.9 7.4 2.8 Mexico 2004 8.9 91.1 31.6 18.6 40.9 2.9 4.8 1.2 8.3 91.7 30.3 19.0 42.4 2.7 4.5 1.1 10.7 89.3 35.8 17.3 36.1 3.3 5.7 1.7 Nicaragua 2001 6.2 93.8 39.4 21.8 32.5 1.8 3.4 1.0 6.6 93.4 36.3 22.3 34.8 2.0 3.7 1.0 5.7 94.3 43.8 21.3 29.2 1.6 3.1 1.0 Panama 2004 9.7 90.3 31.1 17.8 41.4 3.0 5.2 1.5 9.3 90.7 27.8 18.8 44.1 3.0 4.9 1.4 10.5 89.5 36.7 16.1 36.7 3.1 5.8 1.6 Paraguay 2004 7.4 92.6 36.3 20.5 35.8 2.4 4.0 1.0 7.4 92.6 33.4 21.2 38.0 2.5 4.0 1.0 7.4 92.6 40.1 19.6 32.9 2.3 4.1 1.0 Peru 2003 9.2 90.8 32.2 20.2 38.5 2.6 5.1 1.5 9.1 90.9 27.7 21.7 41.4 2.5 5.1 1.6 9.2 90.8 40.5 17.2 33.1 2.8 5.0 1.5 Uruguay 2005 21.2 78.8 22.0 15.0 41.8 4.8 12.6 3.8 21.2 78.8 22.0 15.0 41.8 4.8 12.6 3.8 Venezuela 2004 7.2 92.8 32.1 19.4 41.3 2.4 3.9 0.9 7.2 92.8 32.1 19.4 41.3 2.4 3.9 0.9
National Urban RuralCountry Year
Source: own calculations based on SEDLAC. Table 2.4 Population ratios
60 +/<60 60+/<15 60 +/<60 60+/<15 60 +/<60 60+/<15 60 +/<60 60+/<15 60 +/<60 60+/<15 Argentina 2005 16.9 56.7 16.9 56.7 19.6 68.5 14.1 45.2 Bolivia 2002 6.8 16.0 5.4 13.7 9.1 19.3 7.3 17.8 6.3 14.4 Brazil 2004 10.7 35.8 10.7 37.1 10.9 30.7 11.8 40.9 9.6 30.9 Chile 2003 13.0 45.1 12.4 43.3 16.9 56.2 14.4 51.1 11.5 39.2 Colombia 2004 11.5 34.3 11.4 36.3 11.9 30.1 12.4 38.6 10.6 30.2 Costa Rica 2004 9.7 31.0 10.8 37.3 8.2 23.6 10.2 33.2 9.2 28.8 Dominican R. 2005 10.1 29.3 9.4 28.0 11.6 31.3 10.4 30.1 9.9 28.4 Ecuador 2003 10.7 27.6 9.7 26.9 11.9 28.2 10.7 28.3 10.7 26.9 El Salvador 2004 10.5 27.8 11.0 32.0 9.6 22.8 10.8 30.6 10.0 25.1 Guatemala 2004 6.6 14.9 7.5 19.1 5.9 12.1 6.5 14.9 6.8 14.8 Haiti 2001 9.5 22.4 7.5 19.7 10.8 24.1 10.1 24.1 8.9 20.7 Honduras 2005 8.0 18.6 7.9 20.8 8.0 17.0 7.8 19.1 8.1 18.1 Jamaica 2002 13.8 36.6 12.2 34.7 15.1 38.0 14.8 40.2 12.9 33.2 Mexico 2004 9.8 28.2 9.1 27.5 12.0 30.0 10.0 30.3 9.5 26.1 Nicaragua 2001 6.7 15.8 7.1 18.3 6.0 13.0 6.9 16.8 6.4 14.9 Panama 2004 10.8 31.4 10.3 33.6 11.7 28.5 11.1 33.4 10.5 29.5 Paraguay 2004 8.0 20.4 8.0 22.2 8.0 18.4 8.8 22.9 7.2 18.1 Peru 2003 10.1 28.5 10.1 33.0 10.2 22.8 10.4 29.7 9.8 27.3 Uruguay 2005 26.9 96.5 26.9 96.5 31.2 117.6 22.3 76.0 Venezuela 2004 7.8 22.5 7.8 22.5 8.5 24.6 7.1 20.4
GenderFemale MaleCountry Year National Area
Urban Rural
Source: own calculations based on SEDLAC.
Table 2.5 Female share in population and masculinity index by age
All >60 <60 All >60 <60 Argentina 2005 52.6 59.6 51.4 0.90 0.68 0.94 Bolivia 2002 50.3 53.6 50.1 0.99 0.87 1.00 Brazil 2004 51.3 56.0 50.8 0.95 0.79 0.97 Chile 2003 51.3 56.1 50.6 0.95 0.78 0.97 Colombia 2004 51.9 55.4 51.5 0.93 0.81 0.94 Costa Rica 2004 50.6 52.7 50.4 0.97 0.90 0.98 Dominican R. 2005 49.9 51.0 49.8 1.00 0.96 1.01 Ecuador 2003 50.1 50.2 50.1 0.99 0.99 1.00 El Salvador 2004 52.2 53.9 52.0 0.92 0.85 0.92 Guatemala 2004 51.4 50.3 51.5 0.94 0.99 0.94 Haiti 2001 51.9 54.9 51.6 0.93 0.82 0.94 Honduras 2005 51.5 50.5 51.6 0.94 0.98 0.94 Jamaica 2002 50.8 53.8 50.4 0.97 0.86 0.98 Mexico 2004 51.9 53.2 51.8 0.93 0.88 0.93 Nicaragua 2001 50.8 52.6 50.7 0.97 0.90 0.97 Panama 2004 50.0 51.3 49.8 1.00 0.95 1.01 Paraguay 2004 49.8 54.4 49.5 1.01 0.84 1.02 Peru 2003 50.7 52.2 50.5 0.97 0.92 0.98 Uruguay 2005 53.4 59.9 51.6 0.87 0.67 0.94 Venezuela 2004 49.8 53.7 49.4 1.01 0.86 1.02
Share of females Masculinity indexCountry Year
Source: own calculations based on SEDLAC.
38

Table 2.6 Average family size by age
All 60 + 0-59 <15 15-24 25-59 60-64 65-80 80+ All 60 + 0-59 <15 15-24 25-59 60-64 65-80 80+ All 60 + 0-59 <15 15-24 25-59 60-64 65-80 80+ Argentina 2005 4.4 2.8 4.7 5.4 4.9 4.1 3.2 2.7 2.5 4.4 2.8 4.7 5.4 4.9 4.1 3.2 2.7 2.5 Bolivia 2002 5.5 3.5 5.7 6.1 5.7 5.1 3.8 3.3 3.3 5.4 3.9 5.5 5.9 5.6 5.1 4.2 3.8 3.4 5.7 3.1 6.0 6.4 5.9 5.3 3.4 2.9 3.1 Brazil 2004 3.9 2.8 4.1 4.6 4.2 3.7 3.0 2.7 2.8 3.8 2.8 3.9 4.4 4.0 3.6 3.0 2.7 2.8 4.5 3.0 4.7 5.2 4.8 4.2 3.2 2.9 2.9 Chile 2003 4.6 3.5 4.7 5.1 4.9 4.4 3.7 3.5 3.3 4.6 3.5 4.7 5.1 4.9 4.4 3.7 3.4 3.2 4.6 3.6 4.8 5.2 5.2 4.5 3.7 3.5 3.5 Colombia 2004 4.9 4.0 5.0 5.5 5.1 4.7 4.1 3.9 4.2 4.8 4.1 4.9 5.3 5.0 4.6 4.2 4.0 4.1 5.3 3.9 5.5 6.0 5.6 4.9 4.1 3.7 4.3 Costa Rica 2004 4.6 3.4 4.8 5.2 5.0 4.4 3.5 3.3 3.4 4.5 3.4 4.6 5.0 4.9 4.3 3.5 3.3 3.5 4.8 3.4 5.0 5.4 5.2 4.5 3.5 3.4 3.3 Dominican R. 2005 4.7 3.6 4.8 5.3 5.0 4.4 3.8 3.5 3.4 4.6 3.6 4.7 5.1 4.9 4.3 3.8 3.5 3.4 4.9 3.6 5.0 5.6 5.2 4.5 3.8 3.5 3.3 Ecuador 2003 5.5 3.9 5.6 6.1 5.9 5.1 4.2 3.8 3.7 5.2 4.0 5.3 5.7 5.5 4.9 4.3 3.9 3.8 5.8 3.8 6.0 6.4 6.3 5.4 4.1 3.7 3.5 El Salvador 2004 5.3 4.1 5.4 5.9 5.5 4.9 4.3 4.1 4.1 4.9 4.1 5.0 5.5 5.2 4.6 4.2 4.0 4.0 5.8 4.2 5.9 6.3 6.1 5.4 4.5 4.1 4.2 Guatemala 2004 6.2 4.5 6.4 6.8 6.4 5.8 4.8 4.3 4.1 5.6 4.1 5.7 6.2 5.7 5.2 4.2 4.0 4.0 6.8 4.8 6.9 7.2 6.9 6.4 5.3 4.7 4.2 Haiti 2001 5.6 4.1 5.8 6.3 6.0 5.1 4.3 4.0 3.8 5.6 4.3 5.7 6.2 5.9 5.0 4.5 4.3 4.0 5.7 3.9 5.9 6.4 6.0 5.2 4.3 3.8 3.7 Honduras 2005 6.0 4.7 6.1 6.5 6.1 5.5 5.1 4.6 4.5 5.5 4.6 5.6 6.0 5.7 5.1 4.8 4.5 4.6 6.4 4.8 6.5 6.8 6.5 5.9 5.3 4.7 4.5 Jamaica 2002 5.2 3.8 5.4 6.1 5.6 4.6 4.1 3.7 3.6 4.8 3.5 5.0 5.7 5.1 4.3 4.0 3.4 3.1 5.5 3.9 5.7 6.4 6.0 4.9 4.2 3.8 3.9 Mexico 2004 5.0 3.7 5.1 5.6 5.4 4.7 4.0 3.6 3.5 4.9 3.7 5.0 5.4 5.2 4.6 4.0 3.6 3.6 5.4 3.8 5.6 6.0 5.9 5.0 4.1 3.8 3.2 Nicaragua 2001 6.6 5.4 6.7 7.1 6.8 6.1 5.5 5.4 5.0 6.2 5.4 6.3 6.7 6.4 5.8 5.4 5.4 5.2 7.1 5.3 7.2 7.5 7.4 6.6 5.6 5.4 4.8 Panama 2004 5.2 3.8 5.4 6.1 5.6 4.7 4.1 3.7 3.7 4.8 3.8 5.0 5.5 5.2 4.5 3.9 3.7 3.8 5.9 3.9 6.1 6.9 6.3 5.2 4.3 3.8 3.5 Paraguay 2004 5.6 4.1 5.8 6.4 5.9 5.1 4.3 3.9 4.0 5.3 4.0 5.4 6.0 5.5 4.9 4.3 3.9 4.0 6.1 4.1 6.2 6.8 6.4 5.4 4.4 4.0 4.0 Peru 2003 5.5 4.1 5.7 6.0 5.9 5.3 4.5 3.9 4.0 5.4 4.3 5.5 5.8 5.7 5.2 4.7 4.1 4.4 5.8 3.7 6.0 6.4 6.2 5.5 4.2 3.6 3.2 Uruguay 2005 3.9 2.5 4.2 5.0 4.5 3.8 2.9 2.4 2.4 3.9 2.5 4.2 5.0 4.5 3.8 2.9 2.4 2.4 Venezuela 2004 5.5 4.4 5.6 6.0 5.8 5.1 4.6 4.3 4.4 5.5 4.4 5.6 6.0 5.8 5.1 4.6 4.3 4.4
RuralYearCountry National Urban
Source: own calculations based on SEDLAC. Table 2.7 Number of people living in households with older people By age group
All 60 + <15 15-24 25-59 All 60 + <15 15-24 25-59 All 60 + <15 15-24 25-59 Argentina 2005 2.68 1.37 0.28 0.26 0.77 2.68 1.37 0.28 0.26 0.77 Bolivia 2002 3.45 1.29 0.77 0.52 0.89 3.84 1.26 0.83 0.64 1.16 3.03 1.33 0.70 0.40 0.61 Brazil 2004 2.78 1.32 0.28 0.35 0.84 2.73 1.31 0.25 0.33 0.85 3.01 1.35 0.39 0.46 0.81 Chile 2003 3.43 1.37 0.50 0.42 1.19 3.43 1.37 0.50 0.42 1.20 3.47 1.40 0.51 0.42 1.18 Colombia 2004 3.92 1.34 0.79 0.58 1.33 3.95 1.34 0.71 0.60 1.42 3.84 1.33 1.00 0.54 1.08 Costa Rica 2004 3.35 1.37 0.44 0.45 1.09 3.34 1.39 0.39 0.42 1.13 3.38 1.33 0.51 0.51 1.03 Dominican R. 2005 3.51 1.29 0.71 0.55 1.00 3.55 1.27 0.68 0.58 1.07 3.43 1.34 0.74 0.51 0.90 Ecuador 2003 3.82 1.37 0.86 0.58 1.07 3.93 1.36 0.83 0.61 1.21 3.72 1.38 0.89 0.56 0.95 El Salvador 2004 4.06 1.29 0.95 0.68 1.15 3.97 1.30 0.85 0.64 1.21 4.21 1.29 1.12 0.76 1.06 Guatemala 2004 4.42 1.32 1.13 0.78 1.22 4.09 1.29 0.89 0.66 1.30 4.80 1.37 1.41 0.92 1.13 Haiti 2001 4.02 1.27 1.26 0.76 0.98 4.22 1.24 1.31 0.93 1.13 3.92 1.28 1.24 0.68 0.90 Honduras 2005 4.68 1.29 1.41 0.86 1.13 4.52 1.28 1.20 0.87 1.20 4.82 1.30 1.60 0.86 1.07 Jamaica 2002 3.65 1.27 0.95 0.56 0.97 3.48 1.24 0.83 0.51 1.04 3.76 1.29 1.03 0.60 0.93 Mexico 2004 3.71 1.34 0.67 0.51 1.19 3.68 1.33 0.63 0.50 1.24 3.77 1.38 0.78 0.54 1.07 Nicaragua 2001 5.35 1.25 1.60 1.09 1.49 5.37 1.24 1.57 1.07 1.58 5.33 1.27 1.66 1.12 1.35 Panama 2004 3.80 1.33 0.79 0.50 1.23 3.77 1.33 0.69 0.49 1.34 3.84 1.32 0.95 0.52 1.08 Paraguay 2004 4.04 1.32 0.95 0.69 1.17 4.02 1.31 0.90 0.68 1.24 4.06 1.33 1.01 0.70 1.08 Peru 2003 4.06 1.40 0.83 0.69 1.37 4.24 1.41 0.74 0.77 1.63 3.73 1.38 0.99 0.55 0.92 Uruguay 2005 2.42 1.37 0.24 0.20 0.64 2.42 1.37 0.24 0.20 0.64 Venezuela 2004 4.34 1.28 0.90 0.66 1.52 4.34 1.28 0.90 0.66 1.52
RuralCountry Year National Urban
Source: own calculations based on SEDLAC. Table 2.8 Distribution of household heads by age group
60 + 0-59 60 + 0-59 60 + 0-59 Argentina 2005 30.7 69.3 30.7 69.3 Bolivia 2002 17.6 82.4 14.5 85.5 22.8 77.2 Brazil 2004 20.6 79.4 20.1 79.9 23.2 76.8 Chile 2003 26.2 73.8 25.0 75.0 33.9 66.1 Colombia 2004 25.5 74.5 24.0 76.0 30.1 69.9 Costa Rica 2004 20.8 79.2 21.8 78.2 19.2 80.8 Dominican R. 2005 23.6 76.4 22.0 78.0 26.6 73.4 Ecuador 2003 25.7 74.3 22.3 77.7 29.8 70.2 El Salvador 2004 24.4 75.6 23.5 76.5 26.0 74.0 Guatemala 2004 19.3 80.7 18.8 81.2 19.8 80.2 Haiti 2001 24.7 75.3 19.4 80.6 28.3 71.7 Honduras 2005 22.8 77.2 20.5 79.5 24.9 75.1 Jamaica 2002 29.3 70.7 24.6 75.4 33.3 66.7 Mexico 2004 22.4 77.6 20.5 79.5 28.6 71.4 Nicaragua 2001 20.9 79.1 20.6 79.4 21.5 78.5 Panama 2004 24.4 75.6 22.1 77.9 28.6 71.4 Paraguay 2004 20.1 79.9 19.1 80.9 21.5 78.5 Peru 2003 23.8 76.2 23.2 76.8 25.1 74.9 Uruguay 2005 40.8 59.2 40.8 59.2 Venezuela 2004 19.5 80.5 19.5 80.5
Country Year National Urban Rural
Source: own calculations based on SEDLAC.
39

Table 3.1 Poverty headcount ratio by age
National Urban RuralAll 60 + 0-59 65+ 0-64 <15 15-24 25-59 All 60 + 0-59 65+ 0-64 <15 15-24 25-59 All 60 + 0-59 65+ 0-64 <15 15-24 25-59
Argentina 11.6 4.5 12.8 3.6 12.5 20.1 12.1 8.6 11.6 4.5 12.8 3.6 12.5 20.1 12.1 8.6 Bolivia 43.1 42.1 43.2 43.8 43.1 50.9 37.0 37.7 26.2 19.4 26.6 21.9 26.3 33.7 21.1 22.3 72.6 67.7 73.0 67.9 72.8 76.8 70.7 68.9 Brazil 17.7 3.7 19.2 2.8 18.8 30.4 17.7 12.9 14.8 3.7 16.0 2.9 15.6 26.0 15.0 10.6 31.9 3.5 35.0 2.6 34.0 47.9 30.9 26.4 Chile 5.1 1.8 5.6 1.5 5.5 8.2 5.4 4.1 4.7 1.6 5.1 1.3 5.0 7.6 5.0 3.7 8.0 2.9 8.9 2.2 8.7 12.3 8.8 6.8 Colombia 26.3 30.3 25.8 31.9 25.8 30.9 25.6 21.9 21.0 25.0 20.5 27.8 20.4 24.3 20.5 17.8 40.8 45.3 40.3 44.1 40.6 45.4 40.3 35.2 Costa Rica 7.0 9.6 6.8 9.8 6.8 9.5 6.2 5.1 4.3 5.6 4.1 6.0 4.1 5.9 4.3 2.9 10.9 16.7 10.4 16.9 10.6 13.8 8.8 8.5 Dominican R. 14.5 14.7 14.5 15.2 14.4 20.4 12.4 10.8 11.9 12.4 11.8 12.8 11.8 16.7 10.9 8.6 19.3 18.1 19.4 18.9 19.3 26.6 15.1 15.2 Ecuador 36.3 33.3 36.6 35.8 36.3 45.0 31.9 30.9 27.2 24.6 27.5 27.1 27.2 35.1 25.2 22.2 46.6 41.6 47.2 43.9 46.8 54.8 40.0 42.4 El Salvador 38.7 31.2 39.5 32.2 39.2 49.2 36.4 32.3 26.5 21.4 27.0 23.0 26.7 35.6 24.6 21.4 56.9 47.6 57.8 47.7 57.5 65.3 52.8 52.0 Guatemala 34.9 28.0 35.3 29.3 35.1 43.3 27.7 29.6 23.1 20.6 23.2 20.4 23.2 31.1 17.0 18.8 44.7 35.8 45.2 39.1 44.9 51.3 36.9 41.0 Haiti 78.0 66.4 79.2 66.0 78.8 85.2 76.9 73.4 66.2 60.0 66.7 62.7 66.4 74.0 64.8 60.3 85.7 69.5 87.5 67.6 87.1 91.7 86.5 82.8 Honduras 38.7 39.2 38.7 40.7 38.6 47.1 31.8 33.0 21.2 22.2 21.1 24.0 21.0 27.2 17.4 17.4 59.6 60.8 59.6 61.9 59.5 66.0 51.9 55.0 Jamaica 44.8 54.0 43.3 54.1 43.6 48.4 43.1 38.6 47.6 56.4 46.1 56.2 46.5 51.1 46.7 41.6 42.5 52.0 40.8 52.4 41.1 46.2 39.9 35.9 Mexico 22.0 27.1 21.5 29.5 21.5 28.1 19.4 17.4 15.6 20.4 15.1 22.7 15.1 19.7 13.8 12.4 42.7 44.0 42.5 46.2 42.4 50.7 38.9 36.1 Nicaragua 48.4 40.1 48.9 40.5 48.7 57.6 44.4 41.3 37.9 33.8 38.2 35.7 38.0 47.1 33.7 31.7 62.7 50.3 63.5 48.2 63.4 69.6 59.7 57.1 Panama 15.8 12.4 16.2 12.9 16.1 23.5 13.6 11.8 6.2 4.8 6.3 4.7 6.3 9.2 6.0 4.6 32.2 23.9 33.2 24.9 32.8 41.9 28.7 26.5 Paraguay 26.0 21.0 26.4 22.3 26.2 33.8 22.9 20.7 14.8 14.5 14.8 16.4 14.7 20.7 12.0 11.1 40.6 29.6 41.5 29.9 41.2 48.3 37.9 35.3 Peru 30.2 21.0 31.1 19.9 30.9 42.4 25.6 24.4 12.4 6.4 13.0 6.5 12.8 18.9 11.8 9.7 62.5 47.2 64.0 44.6 63.7 71.9 56.6 58.1 Uruguay 6.0 0.8 7.4 0.6 7.1 12.6 7.6 4.6 6.0 0.8 7.4 0.6 7.1 12.6 7.6 4.6 Venezuela 32.3 28.1 32.6 29.3 32.5 42.3 29.7 26.4 32.3 28.1 32.6 29.3 32.5 42.3 29.7 26.4
Source: own calculations based on SEDLAC. Note: Poverty line=USD 2 a day (PPP)
Table 3.2 Ratio of poverty headcount ratios by age groups Income variable: household per capita income
National Urban Rural60 +/<60 60+/<15 60 +/<60 60+/<15 60 +/<60 60+/<15
Argentina 0.35 0.22 0.35 0.22 Bolivia 0.97 0.83 0.73 0.57 0.93 0.88 Brazil 0.19 0.12 0.23 0.14 0.10 0.07 Chile 0.33 0.22 0.32 0.21 0.33 0.24 Colombia 1.18 0.98 1.22 1.03 1.13 1.00 Costa Rica 1.42 1.01 1.37 0.96 1.61 1.21 Dominican R. 1.01 0.72 1.05 0.74 0.93 0.68 Ecuador 0.91 0.74 0.90 0.70 0.88 0.76 El Salvador 0.79 0.64 0.79 0.60 0.82 0.73 Guatemala 0.79 0.65 0.88 0.66 0.79 0.70 Haiti 0.84 0.78 0.90 0.81 0.79 0.76 Honduras 1.01 0.83 1.05 0.82 1.02 0.92 Jamaica 1.25 1.12 1.22 1.10 1.28 1.13 Mexico 1.26 0.97 1.35 1.04 1.03 0.87 Nicaragua 0.82 0.70 0.89 0.72 0.79 0.72 Panama 0.76 0.53 0.77 0.53 0.72 0.57 Paraguay 0.80 0.62 0.98 0.70 0.71 0.61 Peru 0.68 0.50 0.49 0.34 0.74 0.66 Uruguay 0.10 0.06 0.10 0.06 Venezuela 0.86 0.67 0.86 0.67
Source: own calculations based on SEDLAC. Note: Poverty line=USD 2 a day (PPP)
40

Table 3.3 Poverty and ratio of poverty headcount ratios by age groups Alternative income variables
Household income adjusted for Per capita income Adult equivalents Economies of scale Both
60 + 60+/<60 60 + 60+/<60 60 + 60+/<60 60 + 60+/<60 Argentina 4.5 0.35 4.7 0.40 4.7 0.39 5.2 0.46 Bolivia 42.1 0.97 45.8 1.08 44.7 1.04 49.3 1.15 Brazil 3.7 0.19 4.2 0.23 3.6 0.19 4.2 0.24 Chile 1.8 0.33 2.0 0.39 1.9 0.36 2.1 0.43 Colombia 30.3 1.18 31.3 1.23 30.8 1.21 32.0 1.28 Costa Rica 9.6 1.42 10.5 1.61 11.3 1.70 14.2 2.15 Dominican R. 14.7 1.01 15.7 1.14 15.4 1.11 16.9 1.26 Ecuador 33.3 0.91 36.8 1.02 37.5 1.02 40.2 1.12 El Salvador 31.2 0.79 34.8 0.89 34.7 0.88 37.3 0.95 Guatemala 28.0 0.79 31.2 0.91 30.7 0.88 34.2 0.99 Haiti 66.4 0.84 71.1 0.90 72.1 0.90 76.8 0.96 Honduras 39.2 1.01 41.1 1.08 41.0 1.06 42.4 1.11 Jamaica 54.0 1.25 55.9 1.30 55.8 1.28 57.7 1.34 Mexico 27.1 1.26 29.0 1.38 28.7 1.37 31.1 1.52 Nicaragua 40.1 0.82 43.2 0.89 42.6 0.87 44.7 0.91 Panama 12.4 0.76 13.7 0.87 13.6 0.86 14.7 0.95 Paraguay 21.0 0.80 23.6 0.92 23.6 0.91 25.8 1.01 Peru 21.0 0.68 24.0 0.79 23.7 0.77 26.0 0.85 Uruguay 0.8 0.10 0.8 0.13 0.8 0.12 0.9 0.16 Venezuela 28.1 0.86 30.1 0.95 29.7 0.91 31.2 0.98
Source: own calculations based on SEDLAC. Note: Poverty line=USD 2 a day (PPP)
41

Table 3.4 Ratio of poverty older than 60/younger than 60 By parameter of economies of scale
Argentina Bolivia Brazil Chile Colombia Costa Rica Dominican R Ecuador El Salvador GuatemalaCase 1
1 0.35 0.97 0.19 0.33 1.18 1.42 1.01 0.91 0.79 0.790.9 0.36 1.00 0.19 0.34 1.19 1.51 1.04 0.97 0.83 0.820.8 0.39 1.04 0.19 0.36 1.21 1.70 1.11 1.02 0.88 0.880.7 0.43 1.10 0.20 0.39 1.24 2.05 1.18 1.07 0.92 0.940.6 0.47 1.13 0.23 0.45 1.25 2.17 1.26 1.13 0.95 0.990.5 0.52 1.16 0.24 0.54 1.27 2.32 1.40 1.17 0.99 1.050.4 0.57 1.18 0.27 0.64 1.31 2.36 1.50 1.21 1.02 1.100.3 0.67 1.20 0.28 0.78 1.35 2.64 1.56 1.27 1.06 1.190.2 0.81 1.23 0.47 0.91 1.37 2.91 1.66 1.32 1.11 1.230.1 0.97 1.23 0.65 1.12 1.40 3.13 1.76 1.35 1.14 1.250 1.26 1.26 0.75 1.40 1.43 3.32 1.86 1.37 1.16 1.26
Case 21 0.40 1.08 0.23 0.39 1.23 1.61 1.14 1.02 0.89 0.91
0.9 0.43 1.10 0.24 0.41 1.25 1.78 1.21 1.07 0.92 0.960.8 0.46 1.15 0.24 0.43 1.28 2.15 1.26 1.12 0.95 0.990.7 0.49 1.17 0.25 0.48 1.29 2.23 1.31 1.15 0.99 1.050.6 0.52 1.19 0.25 0.54 1.30 2.37 1.43 1.19 1.00 1.090.5 0.57 1.20 0.26 0.62 1.34 2.50 1.49 1.23 1.03 1.140.4 0.64 1.23 0.29 0.74 1.36 2.61 1.57 1.26 1.06 1.200.3 0.72 1.25 0.40 0.84 1.37 2.71 1.63 1.31 1.10 1.240.2 0.83 1.24 0.49 0.95 1.40 2.99 1.75 1.33 1.13 1.250.1 1.00 1.24 0.67 1.16 1.41 3.15 1.80 1.36 1.15 1.260 1.26 1.26 0.75 1.40 1.43 3.32 1.86 1.37 1.16 1.26
Case 31 0.47 1.15 0.26 0.45 1.31 1.81 1.28 1.13 0.99 1.01
0.9 0.50 1.19 0.26 0.49 1.32 2.10 1.34 1.17 1.01 1.050.8 0.52 1.20 0.26 0.51 1.34 2.37 1.41 1.20 1.03 1.100.7 0.54 1.22 0.26 0.57 1.34 2.52 1.47 1.23 1.05 1.130.6 0.59 1.22 0.27 0.62 1.36 2.52 1.51 1.26 1.06 1.160.5 0.62 1.26 0.30 0.71 1.36 2.66 1.60 1.28 1.08 1.200.4 0.68 1.27 0.31 0.81 1.38 2.75 1.64 1.31 1.09 1.260.3 0.77 1.26 0.42 0.90 1.41 2.87 1.71 1.33 1.12 1.280.2 0.88 1.26 0.51 1.02 1.41 3.02 1.77 1.36 1.14 1.270.1 1.03 1.25 0.68 1.21 1.42 3.19 1.80 1.37 1.15 1.260 1.26 1.26 0.75 1.40 1.43 3.32 1.86 1.37 1.16 1.26
Haiti Honduras Jamaica Mexico Nicaragua Panama Paraguay Peru Uruguay VenezuelaCase 1
1 0.84 1.01 1.25 1.26 0.82 0.76 0.80 0.68 0.10 0.860.9 0.87 1.04 1.26 1.31 0.86 0.82 0.85 0.72 0.11 0.890.8 0.90 1.06 1.28 1.37 0.87 0.86 0.91 0.77 0.12 0.910.7 0.94 1.08 1.32 1.44 0.88 0.92 0.96 0.81 0.15 0.930.6 0.97 1.12 1.36 1.50 0.92 0.99 1.01 0.86 0.17 0.970.5 0.99 1.15 1.38 1.57 0.97 1.10 1.10 0.92 0.22 1.000.4 1.01 1.17 1.41 1.67 0.99 1.17 1.19 0.98 0.28 1.020.3 1.02 1.18 1.43 1.72 1.03 1.26 1.25 0.99 0.40 1.050.2 1.03 1.20 1.44 1.78 1.03 1.32 1.31 1.07 0.52 1.090.1 1.04 1.23 1.46 1.86 1.06 1.37 1.35 1.11 0.68 1.130 1.05 1.25 1.46 1.90 1.09 1.44 1.37 1.16 0.90 1.15
Case 21 0.90 1.08 1.30 1.38 0.89 0.87 0.92 0.79 0.13 0.95
0.9 0.92 1.10 1.32 1.45 0.89 0.91 0.95 0.82 0.14 0.960.8 0.96 1.11 1.34 1.52 0.91 0.95 1.01 0.85 0.16 0.980.7 0.98 1.13 1.37 1.59 0.94 1.01 1.04 0.89 0.18 1.000.6 1.00 1.17 1.38 1.63 0.97 1.09 1.11 0.94 0.21 1.030.5 1.02 1.18 1.40 1.72 0.98 1.18 1.19 0.97 0.27 1.050.4 1.03 1.19 1.42 1.74 1.01 1.25 1.25 1.00 0.36 1.070.3 1.04 1.21 1.43 1.79 1.04 1.31 1.30 1.02 0.44 1.080.2 1.04 1.22 1.46 1.81 1.05 1.35 1.33 1.08 0.56 1.110.1 1.05 1.24 1.46 1.88 1.07 1.39 1.36 1.13 0.71 1.140 1.05 1.25 1.46 1.90 1.09 1.44 1.37 1.16 0.90 1.15
Case 31 0.94 1.14 1.34 1.54 0.95 0.97 1.03 0.87 0.16 1.03
0.9 0.96 1.14 1.38 1.59 0.96 1.00 1.07 0.92 0.17 1.050.8 0.98 1.16 1.40 1.67 0.98 1.04 1.10 0.95 0.20 1.070.7 1.00 1.18 1.42 1.70 0.99 1.11 1.16 0.97 0.22 1.080.6 1.02 1.20 1.42 1.75 1.01 1.20 1.23 0.99 0.27 1.090.5 1.03 1.22 1.42 1.79 1.01 1.24 1.28 1.01 0.32 1.100.4 1.04 1.22 1.43 1.80 1.04 1.31 1.30 1.02 0.42 1.110.3 1.04 1.24 1.45 1.82 1.05 1.34 1.34 1.06 0.48 1.110.2 1.05 1.24 1.46 1.86 1.06 1.37 1.36 1.10 0.59 1.130.1 1.05 1.24 1.46 1.89 1.07 1.40 1.37 1.15 0.74 1.160 1.05 1.25 1.46 1.90 1.09 1.44 1.37 1.16 0.90 1.15
Source: own calculations based on SEDLAC. Case 1: α1=1, α2=1, Case 2: α1=0.5, α2=0.75, Case 3: α1=0.25, α2=0.50
42

Table 3.5 Distribution of people older than 60 across quintiles of the income distribution
Household per capita income Household equivalized income1 2 3 4 5 Total 1 2 3 4 5 Total
Argentina 8.0 15.1 22.1 28.6 26.3 100.0 11.0 17.9 24.9 24.9 21.4 100.0 Bolivia 20.3 19.0 16.7 18.0 26.0 100.0 24.4 21.5 14.6 16.7 22.8 100.0 Brazil 4.5 12.3 25.4 27.8 30.2 100.0 5.5 13.9 29.2 24.9 26.5 100.0 Chile 10.8 16.8 21.7 25.0 25.8 100.0 13.9 19.2 21.9 22.7 22.2 100.0 Colombia 24.4 15.5 15.8 21.1 23.2 100.0 26.6 16.4 16.5 19.7 20.8 100.0 Costa Rica 25.1 16.2 18.9 19.5 20.4 100.0 30.2 18.3 16.3 17.0 18.2 100.0 Dominican R. 18.9 17.5 20.5 20.5 22.7 100.0 22.4 19.8 19.6 18.9 19.3 100.0 Ecuador 20.4 16.6 18.2 20.9 23.9 100.0 25.5 17.9 18.0 18.3 20.3 100.0 El Salvador 15.8 16.5 19.5 22.2 26.0 100.0 18.5 19.7 18.6 20.7 22.5 100.0 Guatemala 16.3 16.9 14.5 22.1 30.2 100.0 21.4 17.0 15.8 21.1 24.7 100.0 Haiti 13.1 15.1 17.0 23.9 30.9 100.0 15.8 16.7 19.3 25.3 22.9 100.0 Honduras 19.8 20.6 18.7 19.1 21.7 100.0 23.6 20.3 19.5 17.1 19.5 100.0 Jamaica 26.7 23.1 15.9 17.4 16.9 100.0 27.7 25.4 16.3 15.9 14.7 100.0 Mexico 25.2 19.1 16.2 17.8 21.7 100.0 28.9 19.9 16.9 15.5 18.8 100.0 Nicaragua 16.2 15.4 20.9 21.1 26.4 100.0 18.4 20.1 17.7 21.3 22.4 100.0 Panama 15.8 15.4 17.6 22.4 28.8 100.0 19.3 16.0 18.4 20.1 26.2 100.0 Paraguay 15.4 18.0 20.0 20.9 25.7 100.0 20.6 19.8 18.8 18.1 22.8 100.0 Peru 12.3 17.3 17.8 19.8 32.7 100.0 16.7 17.9 18.5 18.1 28.8 100.0 Uruguay 4.9 12.0 21.6 28.9 32.6 100.0 7.0 15.3 23.5 26.8 27.4 100.0 Venezuela 19.5 14.6 17.0 20.3 28.7 100.0 22.4 15.8 17.4 18.3 26.1 100.0 Source: own calculations based on SEDLAC.
Table 3.6 Gini coefficient
Household per capita income Household equivalized income60 + 0-59 <15 15-24 25-59 60 + 0-59 <15 15-24 25-59
Argentina 0.452 0.508 0.506 0.480 0.493 0.437 0.478 0.491 0.457 0.464 Bolivia 0.616 0.599 0.594 0.555 0.606 0.607 0.577 0.581 0.535 0.583 Brazil 0.538 0.566 0.555 0.529 0.558 0.527 0.545 0.542 0.514 0.540 Chile 0.542 0.545 0.526 0.525 0.549 0.522 0.527 0.522 0.512 0.529 Colombia 0.593 0.557 0.544 0.498 0.568 0.565 0.533 0.529 0.475 0.544 Costa Rica 0.522 0.475 0.462 0.430 0.481 0.516 0.452 0.449 0.413 0.458 Dominican R. 0.560 0.499 0.473 0.473 0.504 0.539 0.473 0.461 0.453 0.479 Ecuador 0.538 0.515 0.493 0.484 0.526 0.522 0.489 0.476 0.462 0.500 El Salvador 0.475 0.484 0.474 0.454 0.485 0.456 0.458 0.458 0.429 0.460 Guatemala 0.534 0.488 0.454 0.464 0.506 0.512 0.455 0.432 0.435 0.473 Haiti 0.575 0.592 0.561 0.571 0.611 0.550 0.581 0.554 0.590 0.593 Honduras 0.591 0.564 0.547 0.531 0.576 0.573 0.541 0.532 0.509 0.554 Jamaica 0.609 0.597 0.578 0.562 0.598 0.596 0.570 0.563 0.541 0.572 Mexico 0.601 0.487 0.470 0.441 0.498 0.574 0.461 0.456 0.418 0.472 Nicaragua 0.507 0.545 0.499 0.525 0.574 0.482 0.515 0.479 0.504 0.539 Panama 0.549 0.546 0.545 0.507 0.534 0.534 0.519 0.526 0.484 0.510 Paraguay 0.555 0.551 0.530 0.521 0.561 0.538 0.523 0.510 0.496 0.534 Peru 0.581 0.505 0.476 0.476 0.511 0.562 0.479 0.460 0.455 0.486 Uruguay 0.393 0.454 0.449 0.435 0.442 0.374 0.428 0.433 0.416 0.419 Venezuela 0.454 0.453 0.441 0.423 0.453 0.431 0.424 0.421 0.399 0.424 Source: own calculations based on SEDLAC.
43

Table 3.7 Relative old age poverty in developing countries
Old age relative poverty
Deaton and Paxson (1997)Ghana 1.0Pakistan 1.0South Africa 1.0Thailand 1.1Taiwan 0.8Ukraine 1.3Grootaert and Braithwaite (1998)Bulgaria 1.3Hungary 0.6Poland 0.8Estonia 1.1Kyrgyz Rep. 1.1Russia 1.1Lanjouw et al. (1998)Bulgaria, 1992 1.0Russia 0.9Hungary 0.7Poland 0.5Estonia 0.8Kazakhstan 0.8
44

Table 4.1 Labor force participation
All 60+ 25-59 (ii)-(iii) + 60 with + 60 without (v)-(vi)pensions pensions
(i) (ii) (iii) (iv) (v) (vi) (vii)
Argentina 0.67 0.28 0.80 -0.52** 0.10 0.43 -0.33** Bolivia 0.80 0.60 0.84 -0.23** 0.32 0.64 -0.31** Brazil 0.70 0.31 0.79 -0.48** 0.26 0.45 -0.18** Chile 0.63 0.26 0.73 -0.47** 0.17 0.37 -0.21**
Colombia 0.70 0.36 0.79 -0.43** 0.19 0.39 -0.21** Costa Rica 0.64 0.24 0.72 -0.47** 0.13 0.30 -0.17**
Dominican R. 0.68 0.32 0.77 -0.45** 0.21 0.33 -0.13** Ecuador 0.73 0.51 0.79 -0.28** 0.31 0.53 -0.22**
El Salvador 0.65 0.35 0.73 -0.38** 0.13 0.38 -0.25** Guatemala 0.68 0.51 0.72 -0.21** 0.35 0.52 -0.17**
Haiti 0.71 0.47 0.77 -0.30** 0.09 0.48 -0.39** Honduras 0.66 0.47 0.71 -0.24** 0.25 0.48 -0.23**
Mexico 0.66 0.38 0.72 -0.34** 0.22 0.42 -0.20** Nicaragua 0.70 0.42 0.75 -0.33** 0.29 0.44 -0.15** Panama 0.66 0.30 0.75 -0.45** 0.15 0.40 -0.25** Paraguay 0.77 0.49 0.82 -0.34** 0.24 0.52 -0.28**
Peru 0.78 0.53 0.84 -0.31** Uruguay 0.61 0.18 0.83 -0.64** 0.09 0.53 -0.44**
Venezuela 0.75 0.38 0.81 -0.44** 0.21 0.41 -0.21**
Source: own calculations based on SEDLAC. * significant at 5%; ** significant at 1% Table 4.2 Marginal probabilities Labor force participation of the elderly
Argentina Bolivia Brazil Colombia Costa Rica Dominican R. Ecuador El Salvador Guatemala
Pension payments -0.30048*** -0.39123*** -0.16283*** -0.22587*** -0.20900*** -0.21648*** -0.29439*** -0.30806*** -0.29973***[0.01394] [0.05694] [0.00726] [0.02286] [0.01374] [0.01901] [0.01909] [0.01635] [0.05821]
Other non-labor income -0.04282*** -0.00716 -0.03580*** -0.09660*** -0.13469*** -0.20679*** -0.13727*** -0.15516*** -0.15051***[0.01512] [0.03771] [0.00836] [0.02827] [0.01366] [0.02025] [0.01434] [0.01864] [0.03855]
Male 0.24258*** 0.31218*** 0.25013*** 0.39443*** 0.38231*** 0.40207*** 0.42217*** 0.36871*** 0.58625***[0.01366] [0.03528] [0.00544] [0.02766] [0.01729] [0.02019] [0.01143] [0.01842] [0.02844]
Age -0.02038*** -0.01945*** -0.01738*** -0.01947*** -0.01619*** -0.01667*** -0.02089*** -0.01886*** -0.02574***[0.00089] [0.00229] [0.00041] [0.00198] [0.00116] [0.00150] [0.00087] [0.00118] [0.00238]
semi-skilled 0.03803** -0.20194*** 0.00467 0.00251 0.05755* 0.13654** -0.03084 -0.03231 -0.08278[0.01544] [0.07400] [0.01002] [0.03847] [0.03244] [0.05304] [0.02559] [0.03979] [0.07417]
Skilled 0.14732*** 0.04763 0.10453*** 0.15923** 0.07620* 0.24436*** 0.17400*** -0.01523 0.00531[0.02356] [0.07806] [0.01392] [0.07084] [0.04320] [0.07553] [0.03425] [0.06820] [0.16843]
Married -0.11588*** 0.13823*** -0.04183 -0.06774*** -0.03845 0.00596 0.00262[0.01418] [0.03699] [0.02946] [0.01718] [0.02340] [0.01984] [0.04125]
Household size 0.00135 -0.01174 0.00322 -0.00416 -0.00724 0.00113 -0.00096 -0.00328 -0.0095[0.00453] [0.01019] [0.00250] [0.00662] [0.00457] [0.00654] [0.00384] [0.00476] [0.00842]
Number of household members -0.04253*** -0.07309*** -0.01071*** -0.02937* -0.01102 -0.04078*** -0.07019*** -0.06678*** -0.02737receiving income [0.01022] [0.02440] [0.00374] [0.01544] [0.00881] [0.01290] [0.00767] [0.01142] [0.01675]Urban -0.21526*** -0.35381*** -0.12943*** 0.00231 -0.07964*** -0.10752*** 0.02173
[0.03570] [0.00816] [0.03988] [0.01401] [0.02407] [0.01334] [0.01869]Observations 10212 1646 36381 4260 3356 2603 7821 6385 4307Chi2 1155.33 309.5 5886.97 346.36 762.07 585.05 2059.53 724.07 459.01Robust standard errors in brackets* significant at 10%; ** significant at 5%; *** significant at 1%
45

Table 4.2 (cont.) Marginal probabilities Labor force participation of the elderly
Haiti Honduras Mexico Nicaragua Panama Paraguay Uruguay Venezuela
Pension payments -0.32529*** -0.10514** -0.54105*** -0.29185*** -0.28399*** -0.24522*** -0.30842*** -0.32535***[0.07702] [0.04463] [0.02274] [0.06259] [0.01509] [0.04757] [0.01288] [0.01021]
Other non-labor income -0.09823*** 0.00058 -0.30508*** -0.02567 -0.09202*** -0.09684*** -0.05214*** -0.14274***[0.02444] [0.04301] [0.02957] [0.04494] [0.01497] [0.03208] [0.00602] [0.01365]
Male 0.23992*** 0.17243*** 0.37258*** 0.32820*** 0.38695*** 0.31990*** 0.14779*** 0.41495***[0.02372] [0.03464] [0.02913] [0.05642] [0.01494] [0.02577] [0.00794] [0.01161]
Age -0.02033*** -0.01875*** -0.02528*** -0.02069*** -0.01897*** -0.02510*** -0.01432*** -0.02355***[0.00164] [0.00178] [0.00194] [0.00278] [0.00103] [0.00191] [0.00051] [0.00090]
semi-skilled -0.01729 -0.05725 0.04329 0.112 0.02248 0.06199 0.01944** 0.06220***[0.06020] [0.04668] [0.04301] [0.10085] [0.02526] [0.05307] [0.00795] [0.02075]
Skilled 0.22580** 0.17917* 0.10421** -0.31198** 0.11640*** 0.22309*** 0.07385*** 0.15279***[0.10779] [0.10571] [0.04399] [0.14516] [0.04116] [0.06871] [0.01357] [0.03417]
Married 0.02879 -0.04164 -0.06070** 0.05457 -0.03046* 0.04479 -0.08441*** -0.00758[0.02504] [0.02921] [0.03075] [0.05821] [0.01705] [0.02986] [0.00779] [0.01285]
Household size -0.00138 -0.01382* 0.01257 -0.01369 0.00637 -0.00356 0.01122*** -0.01934***[0.00562] [0.00729] [0.00797] [0.00917] [0.00550] [0.00689] #¡REF! [0.00307]
Number of household members 0.00294 -0.00831 -0.00886 -0.00022 -0.03687*** -0.04694*** #¡REF! -0.03296***receiving income [0.01434] [0.01430] [0.01533] [0.02159] [0.00952] [0.01482] #¡REF! [0.00535]Urban -0.05270** 0.09537*** -0.07365** -0.06094 -0.08206*** -0.27316***
[0.02612] [0.03040] [0.03281] [0.04406] [0.01642] [0.04179]Observations 2579 952 5421 920 5157 2728 11542 10356Chi2 389.45 119.1 781.59 134.76 927.44 457.21 2337.71 1897.27Robust standard errors in brackets* significant at 10%; ** significant at 5%; *** significant at 1% Source: own calculations based on SEDLAC. Note: The probit estimates include unreported regional dummies Semi-skilled: 9 to 13 years of formal education, Skilled: more than 13 years of formal education. Table 4.3 Employment
All 60+ 25-59 All 60+ 25-59 All P. O N.P.O(i) (ii) (iii) (i) (ii) (iii) (i) (ii) (iii)
Argentina 0.61 0.26 0.74 -0.48** 0.49 0.22 0.53 -0.31** 0.26 0.22 0.24 -0.02
Bolivia 0.78 0.60 0.81 -0.21** 0.78 0.70 0.79 -0.10** 0.60 0.70 0.48 0.21** Brazil 0.66 0.30 0.74 -0.44** 0.57 0.27 0.59 -0.31** 0.30 0.27 0.29 -0.02 Chile 0.59 0.25 0.67 -0.42** 0.28 0.11 0.30 -0.19** 0.25 0.11 0.24 -0.13**
Colombia 0.64 0.35 0.71 -0.36** 0.48 0.25 0.56 -0.31** 0.35 0.25 0.32 -0.06** Costa Rica 0.61 0.23 0.68 -0.46** 0.25 0.15 0.29 -0.14** 0.23 0.15 0.22 -0.07**
Dominican R. 0.60 0.32 0.66 -0.34** 0.33 0.17 0.38 -0.21** 0.32 0.17 0.34 -0.17** Ecuador 0.69 0.49 0.74 -0.25** 0.61 0.43 0.66 -0.23** 0.49 0.43 0.51 -0.08**
El Salvador 0.61 0.32 0.69 -0.37** 0.51 0.31 0.56 -0.25** 0.32 0.31 0.33 -0.02 Guatemala 0.67 0.50 0.70 -0.20** 0.61 0.45 0.64 -0.18** 0.50 0.45 0.52 -0.07**
Haiti 0.57 0.43 0.61 -0.18** 0.56 0.43 0.59 -0.17** 0.43 0.43 0.41 0.02 Honduras 0.65 0.47 0.69 -0.22** 0.56 0.36 0.61 -0.25** 0.47 0.36 0.40 -0.04 Mexico 0.65 0.37 0.70 -0.33** 0.53 0.37 0.58 -0.21** 0.37 0.37 0.37 0.00
Nicaragua 0.65 0.40 0.69 -0.30** 0.56 0.34 0.60 -0.25** 0.40 0.34 0.43 -0.09** Panama 0.62 0.30 0.70 -0.40** 0.55 0.43 0.57 -0.15** 0.30 0.43 0.28 0.15** Paraguay 0.73 0.47 0.78 -0.31** 0.65 0.45 0.69 -0.24** 0.47 0.45 0.48 -0.03
Peru 0.76 0.52 0.82 -0.30** 0.84 0.75 0.86 -0.11** 0.52 0.75 0.46 0.29** Uruguay 0.56 0.17 0.75 -0.58** 0.55 0.31 0.57 -0.26** 0.17 0.31 0.17 0.14**
Venezuela 0.66 0.34 0.72 -0.38** 0.51 0.25 0.56 -0.32** 0.34 0.25 0.35 -0.10**
All Poor People The elderly
(ii)-(iii) (ii)-(iii) (ii)-(iii)
Source: own calculations based on SEDLAC. Note 1: * significant at 5%; ** significant at 1% Note 2: P.O: poor old people, N.P.O: non-poor old people
46

Table 4.4 Unemployment
All 60+ 25-59 All 60+ 25-59 All P. O N.P.O(i) (ii) (iii) (i) (ii) (iii) (i) (ii) (iii)
Argentina 0.08 0.08 0.08 0.01 0.25 0.32 0.24 0.08* 0.08 0.32 0.08 0.25**
Bolivia 0.03 0.01 0.03 -0.02** 0.03 0.01 0.03 -0.02* 0.01 0.01 0.01 0.00 Brazil 0.06 0.02 0.06 -0.04** 0.18 0.10 0.18 -0.09** 0.02 0.10 0.02 0.08** Chile 0.08 0.05 0.08 -0.03** 0.48 0.50 0.48 0.03 0.05 0.50 0.05 0.46**
Colombia 0.10 0.05 0.10 -0.05** 0.20 0.12 0.21 -0.09** 0.05 0.12 0.04 0.08** Costa Rica 0.04 0.03 0.04 -0.02* 0.31 0.14 0.34 -0.20** 0.03 0.14 0.02 0.12**
Dominican R. 0.13 0.01 0.14 -0.13** 0.37 0.04 0.40 -0.36** 0.01 0.04 0.00 0.04** Ecuador 0.05 0.03 0.06 -0.03** 0.09 0.06 0.09 -0.04** 0.03 0.06 0.02 0.03**
El Salvador 0.05 0.07 0.05 0.02** 0.11 0.12 0.10 0.02 0.07 0.12 0.04 0.07** Guatemala 0.01 0.01 0.01 0.00 0.03 0.04 0.02 0.02* 0.01 0.04 0.00 0.04**
Haiti 0.19 0.09 0.21 -0.12** 0.19 0.08 0.20 -0.12** 0.09 0.08 0.11 -0.02 Honduras 0.02 0.00 0.02 -0.02** 0.02 0.00 0.02 -0.02 0.00 0.00 0.00 0.00 Mexico 0.02 0.02 0.02 -0.01 0.05 0.03 0.05 -0.02** 0.02 0.03 0.01 0.02**
Nicaragua 0.08 0.06 0.08 -0.02 0.12 0.08 0.12 -0.04 0.06 0.08 0.05 0.03 Panama 0.06 0.02 0.06 -0.04** 0.09 0.03 0.10 -0.07** 0.02 0.03 0.02 0.01 Paraguay 0.05 0.03 0.05 -0.03** 0.08 0.04 0.08 -0.05** 0.03 0.04 0.02 0.01
Peru 0.03 0.02 0.03 -0.01 0.01 0.00 0.01 -0.01 0.02 0.00 0.03 -0.02* Uruguay 0.09 0.05 0.09 -0.04** 0.23 0.15 0.24 -0.08 0.05 0.15 0.05 0.10**
Venezuela 0.11 0.10 0.12 -0.02** 0.23 0.19 0.24 -0.04** 0.10 0.19 0.08 0.11**
(ii)-(iii) (ii)-(iii) (ii)-(iii)
All Poor People The elderly
Source: own calculations based on SEDLAC. Note 1: * significant at 5%; ** significant at 1% Note 2: P.O: poor old people, N.P.O: non-poor old people Table 4.5 Hourly wage and hours of work by age groups
All 60+ 50-59 25-49 All 60+ 50-59 25-49(i) (ii) (iii) (iv) (i) (ii) (iii) (iv)
Argentina 40.6 37.0 40.8 41.1 -3.8** -4.1** 4.0 4.7 4.1 3.8 0.6* 0.9** 23.3 17.1 17.6 19.4 22.7 100.0 Bolivia 45.4 42.0 44.9 46.1 -2.9** -4.0** 2.0 1.1 2.0 2.1 -0.9** -1.0** 45.3 24.9 12.6 8.2 9.0 100.0 Brazil 40.7 33.9 40.1 41.6 -6.2** -7.7** 3.7 4.1 4.2 3.6 -0.1 0.6** 28.9 17.3 16.6 15.5 21.7 100.0 Chile 45.8 44.1 45.7 46.1 -1.6** -2.0** 5.2 6.8 6.3 4.8 0.5* 2.0** 21.6 14.2 17.8 21.7 24.7 100.0 Colombia 46.2 41.4 45.5 47.0 -4.2** -5.7** 3.1 2.1 3.6 3.2 -1.4** -1.1** 39.2 21.4 16.6 9.5 13.3 100.0 Costa Rica 46.0 37.6 45.3 46.8 -7.7** -9.2** 5.4 5.7 5.8 5.3 -0.1 0.4 33.6 18.9 15.2 16.5 15.9 100.0 Dominican R. 42.0 39.2 40.2 42.7 -1.00 -3.5** 3.3 2.9 4.1 3.3 -1.1** -0.4* 31.1 19.1 16.3 16.6 16.8 100.0 Ecuador 42.3 38.4 42.3 43.1 -3.9** -4.7** 2.2 1.9 2.3 2.3 -0.4** -0.4* 30.3 20.7 16.9 15.8 16.3 100.0 El Salvador 45.4 42.2 45.0 45.9 -2.8** -3.7** 1.7 1.3 1.9 1.7 -0.6** -0.5** 34.9 22.1 14.3 15.0 13.8 100.0 Guatemala 41.9 38.3 40.6 42.8 -2.3** -4.5** 2.0 1.6 1.9 2.1 -0.3** -0.5** 34.6 24.8 12.3 14.2 14.1 100.0 Haiti 37.6 34.1 37.7 38.3 -3.5** -4.2** 1.0 0.8 0.8 1.0 -0.1 -0.2** 22.7 20.9 20.9 18.8 16.7 100.0 Honduras 39.8 33.6 39.2 41.1 -5.7** -7.5** 2.6 2.0 3.1 2.6 -1.2** -0.6** 28.8 23.0 17.1 15.7 15.4 100.0 Jamaica 39.5 36.5 39.8 40.1 -3.3** -3.6** 3.6 3.3 3.8 3.6 -0.5 -0.3 33.7 14.5 12.8 21.5 17.4 100.0 Mexico Nicaragua 47.5 44.5 46.3 48.2 -1.70 -3.7** 1.8 1.5 2.7 1.6 -1.2** -0.1 26.9 21.5 17.8 15.7 18.1 100.0 Panama 40.8 34.6 40.1 41.7 -5.6** -7.2** 4.6 3.9 5.7 4.5 -1.8** -0.6** 42.1 18.4 12.0 11.7 15.8 100.0 Paraguay 45.6 40.5 46.0 46.3 -5.5** -5.8** 2.7 2.5 2.5 2.8 0.0 -0.2 33.5 20.7 14.7 13.3 17.8 100.0 Peru 41.9 35.6 42.3 43.0 -6.7** -7.3** 1.8 1.7 2.0 1.8 -0.3 -0.2 39.5 17.0 14.6 15.4 13.4 100.0 Uruguay 40.1 36.6 40.1 40.7 -3.5** -4.0** 3.0 3.1 3.3 2.8 -0.2 0.3** 23.7 18.2 17.8 19.0 21.4 100.0 Venezuela 41.3 38.5 40.7 41.7 -2.2** -3.2** 2.1 1.8 2.2 2.1 -0.3** -0.2** 33.1 19.7 14.6 15.3 17.3 100.0
1 2 3 4 Total5(ii)-(iii) (ii)-(iv) (ii)-(iii) (ii)-(iv)
Hours of work Hourly wages 1 Quintiles of hourly wages distribution (+60) 2
Source: own calculations based on SEDLAC. Notes: 1 Hourly wage in main activity at PPP 2 Distribution of people older than 60 across quintiles of hourly wages distribution * significant at 5%; ** significant at 1%
47

Table 4.6 Housing by age groups
All 60+ 50-59 25-49 All 60+ 50-59 25-49 All 60+ 50-59 25-49(i) (ii) (iii) (iv) (i) (ii) (iii) (iv) (i) (ii) (iii) (iv)
Argentina 0.66 0.83 0.76 0.54 0.07** 0.29** Bolivia 0.64 0.86 0.80 0.58 0.05** 0.27** 0.21 0.11 0.16 0.23 -0.05** -0.12** 0.55 0.66 0.59 0.51 0.07** 0.15** Brazil 0.70 0.82 0.78 0.65 0.04** 0.18** 0.01 0.00 0.00 0.01 0.00 0.00** 0.03 0.03 0.02 0.02 0.00 0.00 Chile 0.65 0.84 0.76 0.54 0.08** 0.30** 0.03 0.02 0.01 0.03 0.00 -0.01** 0.10 0.13 0.09 0.09 0.03** 0.03** Colombia 0.59 0.82 0.64 0.48 0.18** 0.34** 0.01 0.00 0.01 0.01 -0.01* -0.01 0.20 0.21 0.20 0.19 0.01 0.02 Costa Rica 0.74 0.85 0.85 0.70 0.00 0.16** 0.01 0.01 0.01 0.01 0.00 0.00 0.05 0.04 0.04 0.05 0.00 -0.02** Dominican R. 0.67 0.86 0.79 0.57 0.07** 0.29** 0.45 0.42 0.42 0.45 0.00 -0.03* 0.08 0.10 0.08 0.07 0.02* 0.03** Ecuador 0.70 0.85 0.81 0.61 0.04** 0.24** El Salvador 0.69 0.80 0.79 0.65 0.01 0.15** 0.06 0.03 0.04 0.06 0.00 -0.03** 0.27 0.31 0.25 0.25 0.06** 0.05** Guatemala 0.78 0.87 0.86 0.74 0.00 0.13** 0.30 0.34 0.29 0.29 0.05** 0.06** Haiti 0.67 0.84 0.78 0.58 0.07** 0.26** 0.20 0.24 0.20 0.18 0.04** 0.06** 0.26 0.32 0.28 0.24 0.04* 0.08** Honduras 0.71 0.85 0.83 0.66 0.02 0.19** 0.06 0.02 0.02 0.07 0.00 -0.06** 0.10 0.14 0.10 0.09 0.04** 0.05** Mexico 0.73 0.86 0.84 0.67 0.02** 0.20** 0.32 0.36 0.30 0.31 0.06** 0.05** Nicaragua 0.77 0.87 0.88 0.73 -0.01 0.14** 0.08 0.06 0.05 0.09 0.01 -0.03* 0.22 0.20 0.20 0.23 -0.01 -0.04* Panama Paraguay 0.81 0.89 0.89 0.78 0.00 0.11** 0.16 0.16 0.14 0.16 0.03* 0.01 0.02 0.04 0.03 0.02 0.01 0.02** Peru 0.76 0.89 0.85 0.68 0.04* 0.20** 0.09 0.06 0.07 0.11 -0.01 -0.04** 0.18 0.11 0.12 0.22 0.00 -0.11** Uruguay 0.64 0.76 0.71 0.50 0.05** 0.27** 0.02 0.02 0.02 0.01 0.00 0.00 Venezuela 0.76 0.91 0.84 0.69 0.06** 0.22** 0.08 0.05 0.05 0.09 0.00 -0.05** 0.10 0.08 0.07 0.11 0.01 -0.03**
(ii)-(iii) (ii)-(iv)
Share of housing owners Share of dwellings in poor areas Share of dwellings of low-quality materials
(ii)-(iv)(ii)-(iii)(ii)-(iii) (ii)-(iv)
Source: own calculations based on SEDLAC. * significant at 5%; ** significant at 1% Table 4.7 Access to services by age groups
All 60+ 50-59 25-49 All 60+ 50-59 25-49 All 60+ 50-59 25-49(i) (ii) (iii) (iv) (i) (ii) (iii) (iv) (i) (ii) (iii) (iv)
Argentina Bolivia 0.77 0.73 0.77 0.78 -0.04 -0.04** 0.66 0.59 0.67 0.69 -0.08**-0.10** 0.46 0.52 0.52 0.44 0.00 0.08** Brazil 0.96 0.96 0.97 0.97 0.00* 0.00 0.69 0.69 0.71 0.69 -0.02** 0.00 0.56 0.58 0.59 0.56 -0.01** 0.02** Chile 0.95 0.94 0.95 0.96 -0.01**-0.01** 0.87 0.87 0.90 0.87 -0.03** 0.00 0.80 0.78 0.82 0.81 -0.04**-0.02** Colombia 0.76 0.81 0.76 0.74 0.05* 0.07** 0.79 0.80 0.78 0.78 0.02 0.02 0.57 0.55 0.57 0.58 -0.02 -0.03 Costa Rica 0.96 0.95 0.96 0.96 0.00 -0.01 0.95 0.94 0.95 0.95 -0.01 -0.01 0.28 0.34 0.32 0.25 0.01 0.09** Dominican R. 0.71 0.72 0.73 0.71 -0.01 0.01 0.60 0.57 0.62 0.62 -0.05**-0.04** 0.23 0.24 0.25 0.22 -0.01 0.03* Ecuador 0.73 0.73 0.73 0.73 0.00 0.00 0.79 0.75 0.79 0.80 -0.04**-0.06** 0.45 0.42 0.46 0.46 -0.03**-0.03** El Salvador 0.59 0.61 0.66 0.58 -0.05** 0.02* 0.35 0.31 0.41 0.37 -0.09**-0.06** 0.32 0.28 0.37 0.34 -0.09**-0.06** Guatemala 0.66 0.67 0.71 0.67 -0.04** 0.00 0.46 0.46 0.50 0.44 -0.04* 0.02 0.38 0.39 0.40 0.37 -0.01 0.02 Haiti 0.14 0.15 0.12 0.15 0.02 0.00 0.04 0.03 0.04 0.04 -0.01 -0.01 Honduras 0.35 0.33 0.39 0.35 -0.06** -0.02 0.44 0.39 0.47 0.44 -0.08**-0.06** 0.34 0.29 0.35 0.36 -0.06**-0.06** Mexico 0.88 0.89 0.90 0.88 -0.01 0.01 0.65 0.64 0.69 0.65 -0.05** -0.01 0.71 0.71 0.74 0.71 -0.02* 0.00 Nicaragua 0.61 0.65 0.62 0.61 0.02 0.04* 0.23 0.26 0.25 0.21 0.01 0.04** 0.17 0.20 0.19 0.15 0.01 0.05** Panama Paraguay 0.70 0.67 0.69 0.72 -0.02 -0.05** 0.61 0.60 0.62 0.62 -0.02 -0.02 0.08 0.10 0.08 0.07 0.02 0.03** Peru 0.61 0.64 0.69 0.57 -0.04* 0.07** 0.58 0.57 0.65 0.56 -0.08** 0.01 0.48 0.52 0.58 0.44 -0.06** 0.08** Uruguay 0.99 0.99 0.99 0.99 0.00 0.00 0.94 0.96 0.95 0.93 0.01 0.03** 0.64 0.71 0.68 0.64 0.03** 0.06** Venezuela 0.94 0.95 0.95 0.94 0.00 0.01** 0.89 0.91 0.92 0.89 -0.01* 0.02** 0.72 0.76 0.77 0.70 -0.01 0.06**
Water Hygienic restrooms Sewerage
(ii)-(iii) (ii)-(iv) (ii)-(iii) (ii)-(iv) (ii)-(iii) (ii)-(iv)
Source: own calculations based on SEDLAC. * significant at 5%; ** significant at 1%
48

Table 4.8 Literacy by age groups
All 60+ 50-59 25-49 All 60+ 50-59 25-49 All 60+ 50-59 25-49(i) (ii) (iii) (iv) (i) (ii) (iii) (iv) (i) (ii) (iii) (iv)
Argentina 0.98 0.97 0.98 0.99 -0.02** -0.02** 0.98 0.97 0.98 0.99 -0.02** -0.02** Bolivia 0.82 0.57 0.76 0.90 -0.19** -0.33** 0.92 0.75 0.88 0.96 -0.13** -0.21** 0.66 0.38 0.57 0.77 -0.19** -0.39** Brazil 0.86 0.68 0.82 0.91 -0.14** -0.23** 0.89 0.73 0.87 0.94 -0.14** -0.21** 0.67 0.45 0.59 0.77 -0.13** -0.31** Chile 0.95 0.87 0.94 0.98 -0.07** -0.11** 0.97 0.91 0.96 0.98 -0.05** -0.08** 0.85 0.67 0.82 0.94 -0.15** -0.26** Colombia 0.91 0.77 0.89 0.95 -0.12** -0.18** 0.95 0.85 0.94 0.97 -0.08** -0.12** 0.79 0.56 0.74 0.88 -0.18** -0.32** Costa Rica 0.91 0.75 0.89 0.96 -0.14** -0.20** 0.94 0.83 0.94 0.97 -0.10** -0.14** 0.86 0.61 0.81 0.93 -0.20** -0.31** Dominican R. 0.86 0.70 0.82 0.91 -0.12** -0.21** 0.90 0.77 0.87 0.94 -0.10** -0.18** 0.78 0.59 0.72 0.85 -0.13** -0.26** Ecuador 0.75 0.60 0.74 0.84 -0.14** -0.24** 0.84 0.73 0.85 0.90 -0.11** -0.17** 0.69 0.50 0.67 0.80 -0.17** -0.30** El Salvador 0.78 0.56 0.74 0.86 -0.18** -0.30** 0.87 0.68 0.85 0.93 -0.17** -0.25** 0.63 0.36 0.56 0.73 -0.20** -0.37** Guatemala 0.65 0.45 0.55 0.73 -0.10** -0.28** 0.80 0.61 0.74 0.85 -0.13** -0.24** 0.50 0.28 0.34 0.59 -0.06* -0.31** Haiti 0.41 0.17 0.26 0.53 -0.09** -0.36** 0.62 0.32 0.46 0.72 -0.14** -0.40** 0.27 0.10 0.16 0.37 -0.07** -0.28** Honduras 0.77 0.53 0.74 0.85 -0.20** -0.31** 0.87 0.67 0.86 0.92 -0.19** -0.25** 0.67 0.42 0.61 0.77 -0.19** -0.35** Mexico 0.89 0.72 0.86 0.94 -0.14** -0.22** 0.92 0.78 0.90 0.96 -0.12** -0.18** 0.78 0.58 0.72 0.86 -0.15** -0.29** Nicaragua 0.73 0.50 0.61 0.81 -0.11** -0.31** 0.82 0.62 0.74 0.89 -0.12** -0.27** 0.57 0.30 0.42 0.67 -0.12** -0.36** Panama 0.92 0.80 0.90 0.96 -0.10** -0.16** 0.97 0.91 0.97 0.99 -0.06** -0.08** 0.82 0.62 0.76 0.91 -0.14** -0.29** Paraguay 0.88 0.71 0.83 0.93 -0.12** -0.23** 0.93 0.80 0.89 0.97 -0.08** -0.16** 0.80 0.58 0.75 0.88 -0.17** -0.30** Peru 0.84 0.65 0.77 0.91 -0.12** -0.26** 0.92 0.80 0.88 0.96 -0.09** -0.17** 0.67 0.40 0.53 0.79 -0.13** -0.40** Uruguay 0.97 0.94 0.99 0.99 -0.05** -0.06** 0.97 0.94 0.99 0.99 -0.05** -0.06** Venezuela 0.91 0.71 0.90 0.96 -0.19** -0.25** 0.91 0.71 0.90 0.96 -0.19** -0.25**
Rural
(ii)-(iii) (ii)-(iv)(ii)-(iii) (ii)-(iv)
National Urban
(ii)-(iii) (ii)-(iv)
Source: own calculations based on SEDLAC. * significant at 5%; ** significant at 1% Table 4.9 Skill levels by age groups Distribution of older people and adults across skill levels
unskilled semi-skilled skilled Total unskilled semi-skilled skilled Total unskilled semi-skilled skilled(i) (ii) (iii) (iv) (v) (vi) (vii) (viii) (i) / (v) (ii) / (vi) (iii) / (vii)
Argentina 65.3 23.2 11.6 100.0 35.0 37.4 27.6 100.0 1.9 0.6 0.4 Bolivia 84.3 7.7 8.0 100.0 60.8 23.9 15.3 100.0 1.4 0.3 0.5 Brazil 87.3 8.1 4.6 100.0 62.1 27.9 10.0 100.0 1.4 0.3 0.5 Chile 65.4 27.1 7.5 100.0 30.2 48.6 21.1 100.0 2.2 0.6 0.4 Colombia 83.9 11.5 4.6 100.0 54.2 30.3 15.5 100.0 1.5 0.4 0.3 Costa Rica 84.5 8.8 6.7 100.0 57.7 26.9 15.4 100.0 1.5 0.3 0.4 Dominican R. 90.9 6.4 2.7 100.0 56.5 27.8 15.7 100.0 1.6 0.2 0.2 Ecuador 89.0 7.8 3.2 100.0 59.1 25.7 15.2 100.0 1.5 0.3 0.2 El Salvador 89.4 7.6 3.0 100.0 58.9 29.3 11.8 100.0 1.5 0.3 0.3 Guatemala 93.9 4.5 1.6 100.0 79.2 16.2 4.7 100.0 1.2 0.3 0.4 Haiti 93.8 4.7 1.5 100.0 72.9 16.5 10.6 100.0 1.3 0.3 0.1 Honduras 92.8 5.6 1.6 100.0 77.3 16.9 5.8 100.0 1.2 0.3 0.3 Mexico 86.2 9.2 4.6 100.0 48.3 36.8 14.9 100.0 1.8 0.3 0.3 Nicaragua 95.2 3.5 1.2 100.0 74.2 18.9 7.0 100.0 1.3 0.2 0.2 Panama 73.0 19.1 7.9 100.0 41.8 36.9 21.3 100.0 1.7 0.5 0.4 Paraguay 87.2 8.6 4.3 100.0 65.0 23.4 11.6 100.0 1.3 0.4 0.4 Peru 79.9 12.9 7.2 100.0 48.3 33.1 18.6 100.0 1.7 0.4 0.4 Uruguay 72.5 19.0 8.5 100.0 38.7 40.9 20.4 100.0 1.9 0.5 0.4 Venezuela 83.0 11.6 5.4 100.0 50.6 32.3 17.1 100.0 1.6 0.4 0.3
RatiosOlder than 60 Between 25 - 59
Source: own calculations based on SEDLAC. * significant at 5%; ** significant at 1%
49

Table 4.10 Aggregate indicator of deprivation by age groups
All 60+ 50-59 25-49 0-24(i) (ii) (iii) (iv) (v)
Argentina 0.27 0.23 0.20 0.23 0.33 0.03** 0.00 -0.10** 3 Bolivia 0.84 0.86 0.85 0.81 0.86 0.01 0.05** 0.00 7 Brazil 0.69 0.80 0.71 0.64 0.71 0.09** 0.16** 0.09** 7 Chile 0.39 0.46 0.38 0.36 0.39 0.08** 0.11** 0.07** 7 Colombia 0.51 0.56 0.48 0.46 0.55 0.09** 0.11** 0.02* 7 Costa Rica 0.40 0.55 0.37 0.36 0.42 0.17** 0.19** 0.13** 2 Dominican R. 0.77 0.87 0.75 0.73 0.77 0.12** 0.14** 0.09** 7 Ecuador 0.63 0.68 0.60 0.56 0.66 0.08** 0.12** 0.02** 5 El Salvador 0.84 0.88 0.81 0.79 0.86 0.07** 0.09** 0.02** 7 Guatemala 0.86 0.84 0.82 0.81 0.89 0.02* 0.03** -0.04** 6 Haiti 0.98 0.98 0.97 0.97 0.98 0.01* 0.01** 0.00 7 Honduras 0.84 0.88 0.80 0.80 0.86 0.08** 0.08** 0.02** 7 Jamaica 0.72 0.70 0.69 0.67 0.75 0.00 0.03* -0.06** 7 Mexico 0.67 0.74 0.65 0.62 0.69 0.08** 0.11** 0.04** 6 Nicaragua 0.91 0.91 0.88 0.88 0.92 0.03* 0.03** -0.01 7 Panama 0.27 0.40 0.27 0.21 0.28 0.13** 0.19** 0.12** 2 Paraguay 0.67 0.72 0.65 0.61 0.70 0.07** 0.10** 0.02 7 Peru 0.65 0.61 0.55 0.61 0.70 0.07** 0.00 -0.08** 7 Uruguay 0.28 0.33 0.21 0.22 0.31 0.12** 0.11** 0.02** 6 Venezuela 0.46 0.50 0.39 0.41 0.49 0.10** 0.09** 0.00 7
(ii)-(iii) (ii)-(iv) (ii)-(v) Number of criteria implemented
Source: own calculations based on SEDLAC. * significant at 5%; ** significant at 1% Table 4.11 Aggregate indicator of deprivation by criterion The elderly vis-à-vis adults
house house house education education+rooms location materials head earners
(i) (ii) (iii) (iv) (v) (vi) (vii) Argentina -0.04** 0.10** -0.09** Bolivia -0.16** -0.10** 0.13** 0.04** 0.09** 0.22** -0.18** Brazil 0.00** 0.00** 0.00 0.00* 0.00 0.21** -0.08** Chile -0.01** -0.01** 0.03** 0.01** 0.01** 0.16** -0.06** Colombia -0.03** 0.00 0.02 -0.02* -0.02 0.18** -0.07** Costa Rica 0.29** -0.12** Dominican R. -0.01** -0.01 0.03** 0.01 0.05** 0.28** -0.08** Ecuador -0.07** 0.00 0.05** 0.27** -0.07** El Salvador -0.10** -0.02** 0.04** -0.01 0.04** 0.19** -0.08** Guatemala -0.15** 0.05** 0.00 0.00 0.16** -0.16** Haiti -0.05** 0.05** 0.06** 0.01 0.01* 0.11** -0.11** Honduras -0.04** -0.03** 0.04** 0.02 0.04** 0.23** -0.11** Jamaica -0.05** 0.00 -0.01* 0.02 0.01 0.11** -0.03** Mexico -0.06** 0.04** 0.00 0.02** 0.31** -0.09** Nicaragua -0.11** -0.01 -0.01 -0.01 -0.01 0.16** -0.06** Panama 0.21** -0.03** Paraguay -0.07** 0.01 0.01** 0.04** 0.03** 0.24** -0.08** Peru -0.05** -0.02** -0.05** -0.01 0.03* 0.20** -0.09** Uruguay -0.01** 0.00 0.00 -0.02** 0.19** -0.06** Venezuela -0.05** -0.02** -0.01* 0.00 0.00 0.20** -0.08**
water restroom
Source: own calculations based on SEDLAC. Note: For each criterion we report the difference between the proportion of older people who live in households not meeting this criterion and that of adult population. * significant at 5%; ** significant at 1%
50

Table 4.12 Health statistics by age groups
All 60+ 50-59 25-49 All 60+ 50-59 25-49 All 60+ 50-59 25-49(i) (ii) (iii) (iv) (i) (ii) (iii) (iv) (i) (ii) (iii) (iv)
Argentina 0.15 0.21 0.23 0.18 -0.02 0.02** 0.20 0.25 0.30 0.22 -0.05* 0.03 Bolivia 0.28 0.51 0.38 0.24 0.13** 0.27** 0.37 0.45 0.36 0.37 0.09** 0.08** 0.07 0.10 0.11 0.13 -0.01 -0.03* Colombia Guatemala 0.12 0.14 0.12 0.09 0.02** 0.04** 0.50 0.46 0.47 0.46 -0.01 0.00 0.13 0.17 0.13 0.12 0.04 0.05** El Salvador 0.36 0.45 0.40 0.33 0.05** 0.12** 0.46 0.47 0.44 0.46 0.03 0.01 0.36 0.46 0.41 0.31 0.06 0.15** Nicaragua 0.46 0.73 0.58 0.38 0.15** 0.35** 0.47 0.51 0.45 0.45 0.06* 0.05** 0.17 0.18 0.15 0.17 0.03 0.01 Panama 0.28 0.42 0.36 0.28 0.06** 0.14** 0.65 0.74 0.73 0.65 0.01 0.09** 0.18 0.22 0.23 0.16 -0.01 0.05* Peru 0.52 0.71 0.60 0.51 0.11** 0.20** 0.46 0.49 0.45 0.42 0.03* 0.06** 0.29 0.41 0.41 0.32 0.00 0.09**
(ii)-(iii) (ii)-(iv)(ii)-(iii) (ii)-(iv) (ii)-(iii) (ii)-(iv)
Have been sick in last month? Have you seen a doctor? Economic reason for not seeing a doctor?
Source: own calculations based on SEDLAC. * significant at 5%; ** significant at 1%
Table 4.13 Access to health insurance
All 60+ 50-59 25-49(i) (ii) (iii) (iv)
Argentina 0.64 0.83 0.62 0.57 0.21** 0.26** Bolivia 0.20 0.36 0.18 0.17 0.19** 0.19** Colombia 0.67 0.73 0.71 0.64 0.03** 0.09** Guatemala 0.29 0.21 0.27 0.33 -0.06** -0.12** El Salvador 0.18 0.14 0.14 0.19 0.00 -0.05** Nicaragua 0.14 0.07 0.13 0.16 -0.06** -0.09** Panama 0.56 0.71 0.61 0.51 0.10** 0.20** Peru 0.29 0.37 0.32 0.26 0.06** 0.11**
(ii)-(iii) (ii)-(iv)
Source: own calculations based on SEDLAC.
51

Table 5.1 Share of people receiving income from pensions
All Inactive All Inactive All Inactive All InactiveArgentina 0.56 0.70 0.03 0.09 0.69 0.76 0.05 0.14Bolivia 0.11 0.19 0.01 0.03 0.11 0.19 0.02 0.04Brazil 0.77 0.82 0.09 0.22 0.86 0.87 0.12 0.29Chile 0.55 0.61 0.03 0.07 0.63 0.66 0.06 0.11Colombia 0.15 0.19 0.01 0.04 0.16 0.19 0.02 0.07Costa Rica 0.34 0.39 0.02 0.06 0.39 0.42 0.04 0.09Dominican Rep. 0.11 0.13 0.01 0.03 0.12 0.14 0.01 0.04Ecuador 0.11 0.15 0.01 0.02 0.12 0.16 0.02 0.03El Salvador 0.14 0.19 0.01 0.03 0.15 0.18 0.02 0.05Guatemala 0.11 0.14 0.01 0.02 0.13 0.16 0.01 0.02Haiti 0.01 0.02 0.00 0.00 0.01 0.01 0.00 0.00Honduras 0.05 0.08 0.00 0.01 0.06 0.08 0.01 0.01Jamaica 0.14 0.18 0.00 0.01 0.16 0.19 0.01 0.03Mexico 0.20 0.25 0.02 0.04 0.22 0.26 0.03 0.06Nicaragua 0.10 0.13 0.01 0.02 0.12 0.13 0.01 0.02Panama 0.39 0.47 0.03 0.09 0.41 0.48 0.05 0.14Paraguay 0.12 0.18 0.01 0.02 0.15 0.20 0.01 0.03Uruguay 0.78 0.87 0.08 0.24 0.87 0.90 0.12 0.36Venezuela 0.17 0.22 0.01 0.05 0.18 0.21 0.02 0.07
60 + 24-59 65 + 24-64
Source: own calculations based on SEDLAC. Table 5.2 Share of people receiving income from pensions Urban areas
All Inactive All Inactive All Inactive All InactiveArgentina 0.56 0.70 0.03 0.09 0.69 0.76 0.05 0.14Bolivia 0.19 0.26 0.01 0.04 0.19 0.26 0.02 0.06Brazil 0.76 0.81 0.10 0.23 0.85 0.86 0.12 0.29Chile 0.58 0.65 0.04 0.07 0.67 0.70 0.06 0.12Colombia 0.19 0.23 0.02 0.06 0.20 0.22 0.03 0.09Costa Rica 0.42 0.48 0.03 0.09 0.47 0.49 0.04 0.13Dominican Rep. 0.14 0.16 0.01 0.04 0.16 0.17 0.02 0.05Ecuador 0.18 0.23 0.02 0.03 0.20 0.24 0.03 0.05El Salvador 0.20 0.26 0.02 0.05 0.20 0.25 0.03 0.08Guatemala 0.15 0.20 0.02 0.04 0.17 0.21 0.02 0.05Haiti 0.02 0.04 0.00 0.00 0.03 0.04 0.00 0.01Honduras 0.10 0.13 0.01 0.02 0.10 0.13 0.01 0.03Jamaica 0.17 0.23 0.00 0.01 0.20 0.24 0.01 0.03Mexico 0.25 0.31 0.02 0.04 0.27 0.32 0.03 0.07Nicaragua 0.14 0.17 0.01 0.03 0.16 0.17 0.02 0.04Panama 0.52 0.59 0.04 0.12 0.57 0.61 0.06 0.18Paraguay 0.18 0.23 0.01 0.03 0.21 0.26 0.02 0.04Uruguay 0.78 0.87 0.08 0.24 0.87 0.90 0.12 0.36Venezuela 0.17 0.22 0.01 0.05 0.18 0.21 0.02 0.07
60 + 24-59 65 + 24-64
Source: own calculations based on SEDLAC.
Table 5.3 Share of people receiving income from pensions Rural areas
All Inactive All Inactive All Inactive All InactiveBolivia 0.03 0.03 0.00 0.00 0.03 0.02 0.00 0.01Brazil 0.85 0.89 0.07 0.16 0.92 0.93 0.12 0.23Chile 0.38 0.42 0.02 0.04 0.45 0.47 0.04 0.07Colombia 0.05 0.07 0.00 0.01 0.06 0.08 0.01 0.01Costa Rica 0.21 0.24 0.02 0.03 0.25 0.26 0.02 0.04Dominican Rep. 0.07 0.08 0.01 0.02 0.07 0.08 0.01 0.02Ecuador 0.04 0.05 0.01 0.01 0.05 0.06 0.01 0.01El Salvador 0.04 0.05 0.00 0.01 0.04 0.05 0.01 0.01Guatemala 0.06 0.06 0.00 0.01 0.07 0.09 0.01 0.01Haiti 0.00 0.00 0.00 0.00 0.00 0.00 0.00 0.00Honduras 0.02 0.02 0.00 0.00 0.02 0.02 0.00 0.00Jamaica 0.12 0.15 0.00 0.01 0.14 0.16 0.01 0.02Mexico 0.07 0.08 0.01 0.02 0.09 0.10 0.01 0.02Nicaragua 0.04 0.05 0.00 0.00 0.05 0.06 0.00 0.00Panama 0.19 0.23 0.02 0.04 0.18 0.22 0.03 0.06Paraguay 0.05 0.08 0.00 0.00 0.07 0.10 0.00 0.00
60 + 24-59 65 + 24-64
Source: own calculations based on SEDLAC.
52

Table 5.4 Share of workers with the right to receive a pension when retired
Total (15-24) (25-59) (60 +) (15-24) (25-59) (60 +) (15-24) (25-59) (60 +)Argentina 0.55 0.35 0.59 0.52 0.35 0.59 0.52Bolivia 0.26 0.07 0.34 0.16 0.07 0.36 0.21 0.07 0.24 0.00Brazil 0.47 0.39 0.53 0.21 0.46 0.59 0.28 0.13 0.22 0.07Chile 0.87 0.73 0.90 0.88 0.73 0.90 0.89 0.70 0.84 0.80Ecuador 0.28 0.12 0.35 0.27 0.17 0.47 0.41 0.07 0.15 0.12El Salvador 0.50 0.35 0.58 0.24 0.44 0.69 0.40 0.21 0.31 0.07Guatemala 0.35 0.27 0.43 0.20 0.38 0.52 0.30 0.12 0.26 0.08Mexico 0.40 0.28 0.45 0.22 0.32 0.50 0.27 0.12 0.21 0.05Nicaragua 0.32 0.22 0.39 0.18 0.27 0.45 0.26 0.12 0.21 0.03Paraguay 0.23 0.08 0.31 0.29 0.08 0.35 0.36 0.07 0.20 0.07Peru 0.30 0.09 0.38 0.45 0.10 0.41 0.50 0.03 0.19 0.16Uruguay 0.74 0.53 0.79 0.68 0.53 0.79 0.68Venezuela 0.60 0.39 0.66 0.63 0.39 0.66 0.63
National Urban Rural
Source: own calculations based on SEDLAC.
Table 5.5 Poverty headcount ratios with and without pensions USD 2 a day poverty line
With Without With Without With Without With Without With WithoutArgentina 11.6 19.2 4.5 39.5 12.8 15.8 3.6 45.3 12.5 16.2Bolivia 43.1 45.8 42.1 50.4 43.2 45.5 43.8 53.5 43.1 45.4Brazil 17.7 28.1 3.7 47.9 19.2 26.0 2.8 52.7 18.8 26.3Chile 5.1 10.0 1.8 22.7 5.6 8.4 1.5 25.8 5.5 8.7Costa Rica 8.5 11.8 11.2 29.7 8.2 10.1 11.5 32.8 8.3 10.4Dominican Rep. 14.5 15.3 14.7 17.1 14.5 15.1 15.2 18.0 14.4 15.1Ecuador 36.3 37.6 33.3 39.2 36.6 37.5 35.8 42.5 36.3 37.3El Salvador 38.7 39.9 31.2 35.6 39.5 40.4 32.2 36.7 39.2 40.2Guatemala 34.9 35.3 28.0 30.6 35.3 35.6 29.3 32.3 35.1 35.4Haiti 78.0 79.4 66.4 68.8 79.2 80.4 66.0 68.4 78.8 80.1Honduras 38.7 39.1 39.2 41.3 38.7 38.9 40.7 42.9 38.6 38.9Jamaica 44.8 46.4 54.0 60.6 43.3 44.0 54.1 60.7 43.6 44.5Mexico 22.0 24.6 27.1 40.4 21.5 23.1 29.5 43.5 21.5 23.4Nicaragua 48.4 49.1 40.1 43.5 48.9 49.5 40.5 43.9 48.7 49.3Panama 15.8 20.9 12.4 38.8 16.2 19.0 12.9 42.6 16.1 19.3Paraguay 26.0 27.2 21.0 27.2 26.4 27.2 22.3 30.1 26.2 27.0Uruguay 6.0 13.5 0.8 20.2 7.4 11.7 0.6 22.4 7.1 11.8Venezuela 32.3 35.3 28.1 41.1 32.6 34.8 29.3 43.9 32.5 34.8
0-64All 60 + 0-59 65 +
Source: own calculations based on SEDLAC.
53

Table 5.6 Poverty headcount ratios with and without pensions USD 2 a day poverty line Urban areas
With Without With Without With Without With Without With WithoutArgentina 11.6 19.2 4.5 39.5 12.8 15.8 3.6 45.3 12.5 16.2Bolivia 26.2 29.4 19.4 30.9 26.6 29.3 21.9 35.9 26.3 29.2Brazil 14.8 24.9 3.7 47.2 16.0 22.5 2.9 51.9 15.6 22.9Chile 4.7 9.3 1.6 21.4 5.1 7.8 1.3 24.4 5.0 8.0Colombia 21.0 24.2 25.0 37.2 20.5 22.6 27.8 40.2 20.4 22.9Dominican Rep. 11.9 12.8 12.4 15.3 11.8 12.5 12.8 16.0 11.8 12.6Ecuador 27.2 29.1 24.6 32.9 27.5 28.7 27.1 36.7 27.2 28.6El Salvador 26.5 28.1 21.4 27.4 27.0 28.2 23.0 29.2 26.7 28.0Guatemala 23.1 23.8 20.6 25.0 23.2 23.7 20.4 25.5 23.2 23.7Haiti 66.2 68.2 60.0 63.4 66.7 68.6 62.7 65.7 66.4 68.4Honduras 21.2 21.7 22.2 25.3 21.1 21.5 24.0 27.2 21.0 21.4Jamaica 47.6 49.3 56.4 65.2 46.1 46.6 56.2 65.1 46.5 47.3Mexico 15.6 18.2 20.4 35.4 15.1 16.6 22.7 38.5 15.1 17.0Nicaragua 37.9 38.9 33.8 37.9 38.2 39.0 35.7 39.8 38.0 38.9Panama 6.2 11.1 4.8 32.2 6.3 8.9 4.7 36.2 6.3 9.4Paraguay 14.8 16.4 14.5 23.2 14.8 15.8 16.4 27.7 14.7 15.8Uruguay 6.0 13.5 0.8 20.2 7.4 11.7 0.6 22.4 7.1 11.8Venezuela 32.3 35.3 28.1 41.1 32.6 34.8 29.3 43.9 32.5 34.8
0-64All 60 + 0-59 65 +
Source: own calculations based on SEDLAC
Table 5.7 Poverty headcount ratios with and without pensions USD 2 a day poverty line Rural areas
With Without With Without With Without With Without With WithoutBolivia 72.6 74.2 67.7 72.3 73.0 74.4 67.9 72.9 72.8 74.3Brazil 31.9 43.9 3.5 51.3 35.0 43.1 2.6 56.9 34.0 43.0Chile 8.0 15.0 2.9 29.1 8.9 12.7 2.2 32.7 8.7 13.0Dominican Rep. 19.3 19.8 18.1 19.8 19.4 19.7 18.9 21.0 19.3 19.7Ecuador 46.6 47.4 41.6 45.2 47.2 47.6 43.9 47.9 46.8 47.3El Salvador 56.9 57.3 47.6 49.2 57.8 58.1 47.7 49.4 57.5 57.9Guatemala 44.7 44.8 35.8 36.5 45.2 45.3 39.1 39.8 44.9 45.0Haiti 85.7 86.6 69.5 71.4 87.5 88.3 67.6 69.7 87.1 87.9Honduras 59.6 59.8 60.8 61.6 59.6 59.6 61.9 62.9 59.5 59.6Jamaica 42.5 43.9 52.0 56.8 40.8 41.7 52.4 57.1 41.1 42.1Mexico 42.7 45.2 44.0 53.0 42.5 44.3 46.2 55.9 42.4 44.3Nicaragua 62.7 63.1 50.3 52.5 63.5 63.8 48.2 50.4 63.4 63.7Panama 32.2 37.5 23.9 48.8 33.2 36.2 24.9 52.0 32.8 36.4Paraguay 40.6 41.2 29.6 32.4 41.5 41.9 29.9 33.0 41.2 41.6
0-64All 60 + 0-59 65 +
Source: own calculations based on SEDLAC
54

Table 5.8 Poverty headcount ratios Micro-simulations Elderly defined as older than 60 Panel A
Current Benchmark Altruism Egoistic Labor Current Benchmark Altruism Egoistic Labor Current Benchmark Altruism Egoistic LaborArgentina 11.6 11.0 11.1 11.1 11.1 4.5 2.0 3.7 0.8 2.3 12.8 12.5 12.4 12.8 12.6Bolivia 43.1 40.8 41.3 40.6 41.4 42.1 18.3 30.6 0.1 21.7 43.2 42.3 42.0 43.2 42.7Brazil 17.7 17.4 17.5 17.5 17.5 3.7 2.3 3.3 1.3 2.5 19.2 19.1 19.0 19.2 19.1Chile 5.1 5.0 5.0 5.0 5.0 1.8 1.3 1.5 0.9 1.4 5.6 5.5 5.5 5.6 5.5Costa Rica 8.5 7.6 7.8 7.7 7.7 11.2 4.8 8.0 2.2 5.5 8.2 7.8 7.8 8.2 8.0Dominican Rep. 14.5 12.5 12.8 13.2 12.9 14.7 5.4 9.2 0.5 6.4 14.5 13.3 13.1 14.5 13.6Ecuador 36.3 33.0 33.7 33.2 34.2 33.3 14.9 25.1 1.7 19.1 36.6 35.0 34.6 36.6 35.8El Salvador 38.7 35.5 35.8 35.9 36.5 31.2 16.0 22.8 1.1 19.2 39.5 37.5 37.1 39.5 38.3Guatemala 34.9 32.9 33.1 33.2 33.6 28.0 13.1 19.6 0.8 16.3 35.3 34.2 33.9 35.3 34.7Haiti 78.0 73.8 74.4 71.9 75.2 66.4 42.0 54.9 0.1 47.3 79.2 77.1 76.4 79.2 78.0Honduras 38.7 36.1 36.4 36.1 37.0 39.2 22.8 31.2 0.7 26.8 38.7 37.0 36.7 38.7 37.8Jamaica 44.8 40.5 42.8 38.2 40.8 54.0 31.4 50.5 7.6 31.7 43.3 42.0 41.5 43.3 42.3Mexico 22.0 19.7 20.6 19.8 20.4 27.1 11.1 23.0 1.7 13.1 21.5 20.6 20.3 21.5 21.1Nicaragua 48.4 45.7 45.7 46.0 46.8 40.1 27.1 33.4 2.4 31.9 48.9 46.9 46.5 48.9 47.8Panama 15.8 14.6 14.9 14.8 14.9 12.4 6.3 9.2 2.3 7.4 16.2 15.6 15.5 16.2 15.8Paraguay 26.0 24.0 24.1 24.4 24.7 21.0 9.4 14.0 0.3 12.0 26.4 25.1 24.9 26.4 25.7Peru 30.2 27.4 27.6 28.3 28.5 21.0 8.0 12.8 0.0 11.7 31.1 29.3 29.1 31.1 30.2Uruguay 6.0 5.8 5.8 5.9 5.9 0.8 0.5 0.6 0.3 0.5 7.4 7.3 7.3 7.4 7.3Venezuela 32.3 30.5 30.7 30.4 31.1 28.1 17.3 23.5 1.9 19.7 32.6 31.5 31.3 32.6 32.0
Panel B
Current Benchmark Altruism Egoistic Labor Current Benchmark Altruism Egoistic Labor Current Benchmark Altruism Egoistic LaborArgentina 20.1 19.8 19.8 20.1 19.9 12.1 11.8 11.8 12.1 11.9 8.6 8.3 8.2 8.6 8.4Bolivia 50.9 50.4 50.1 50.9 50.6 37.0 35.6 35.4 37.0 36.3 37.7 36.7 36.4 37.7 37.1Brazil 30.4 30.2 30.2 30.4 30.3 17.7 17.5 17.5 17.7 17.6 12.9 12.8 12.8 12.9 12.9Chile 8.2 8.2 8.1 8.2 8.2 5.4 5.3 5.3 5.4 5.4 4.1 4.0 4.0 4.1 4.1Costa Rica 11.3 11.0 11.0 11.3 11.2 6.7 6.3 6.3 6.7 6.5 6.5 6.1 6.0 6.5 6.2Dominican Rep. 20.4 19.0 18.8 20.4 19.4 12.4 10.8 10.7 12.4 11.2 10.8 10.0 9.9 10.8 10.2Ecuador 45.0 43.5 43.2 45.0 44.3 31.9 30.3 29.9 31.9 31.2 30.9 29.2 28.8 30.9 30.1El Salvador 49.2 47.1 46.9 49.2 48.0 36.4 34.0 33.6 36.4 35.0 32.3 30.4 30.1 32.3 31.1Guatemala 43.3 42.3 42.0 43.3 42.7 27.7 26.5 26.3 27.7 27.1 29.6 28.5 28.2 29.6 29.0Haiti 85.2 83.5 82.9 85.2 84.3 76.9 74.5 73.5 76.9 75.5 73.4 71.1 70.5 73.4 72.2Honduras 47.1 45.4 45.1 47.1 46.1 31.8 30.0 29.8 31.8 30.8 33.0 31.4 31.2 33.0 32.2Jamaica 48.4 47.4 47.0 48.4 47.7 43.1 41.6 41.2 43.1 42.0 38.6 37.2 36.7 38.6 37.3Mexico 28.1 27.1 27.0 28.1 27.6 19.4 18.4 18.2 19.4 19.0 17.4 16.4 16.2 17.4 16.9Nicaragua 57.6 55.9 55.5 57.6 56.6 44.4 42.1 41.5 44.4 43.2 41.3 39.2 38.9 41.3 40.1Panama 23.5 22.8 22.7 23.5 22.9 13.6 13.0 13.0 13.6 13.2 11.8 11.2 11.1 11.8 11.4Paraguay 33.8 32.6 32.3 33.8 33.1 22.9 21.5 21.2 22.9 22.2 20.7 19.6 19.4 20.7 20.1Peru 42.4 40.5 40.3 42.4 41.5 25.6 23.9 23.5 25.6 24.8 24.4 22.8 22.6 24.4 23.6Uruguay 12.6 12.4 12.4 12.6 12.5 7.6 7.5 7.5 7.6 7.5 4.6 4.5 4.5 4.6 4.5Venezuela 42.3 41.1 40.9 42.3 41.7 29.7 28.6 28.3 29.7 29.1 26.4 25.3 25.0 26.4 25.8
All 60 + 0-59
<15 15-24 25-59
Source: own calculations based on SEDLAC Table 5.9 Poverty headcount ratios Micro-simulations Elderly defined as older than 65 Panel A
Current Benchmark Altruism Egoistic Labor Current Benchmark Altruism Egoistic Labor Current Benchmark Altruism Egoistic LaborArgentina 11.6 11.2 11.3 11.3 11.3 3.6 1.6 2.9 0.7 1.7 12.5 12.4 12.3 12.5 12.4Bolivia 43.1 41.4 41.8 41.3 41.8 43.8 17.6 31.6 0.0 21.2 43.1 42.4 42.3 43.1 42.7Brazil 17.7 17.6 17.6 17.6 17.6 2.8 2.0 2.7 1.4 2.1 18.8 18.7 18.7 18.8 18.7Chile 5.1 5.1 5.1 5.1 5.1 1.5 1.2 1.3 0.9 1.2 5.5 5.4 5.4 5.5 5.4Costa Rica 8.5 7.8 8.0 7.9 7.9 11.5 5.6 8.4 2.2 6.0 8.3 8.0 7.9 8.3 8.1Dominican Rep. 14.5 13.1 13.3 13.5 13.3 15.2 5.4 9.4 0.6 6.2 14.4 13.6 13.5 14.4 13.8Ecuador 36.3 33.9 34.4 33.9 34.6 35.8 16.0 27.2 2.1 20.1 36.3 35.2 34.9 36.3 35.7El Salvador 38.7 36.2 36.5 36.6 37.1 32.2 16.5 23.6 1.2 20.0 39.2 37.7 37.4 39.2 38.3Guatemala 34.9 33.5 33.6 33.7 34.0 29.3 13.8 21.3 1.1 17.7 35.1 34.3 34.1 35.1 34.7Haiti 78.0 74.9 75.3 73.6 76.0 66.0 42.0 55.0 0.1 47.5 78.8 77.3 76.8 78.8 78.0Honduras 38.7 36.9 37.1 36.8 37.5 40.7 23.9 32.6 0.6 27.4 38.6 37.5 37.4 38.6 38.0Jamaica 44.8 41.4 43.2 39.5 41.7 54.1 32.4 50.7 8.0 32.8 43.6 42.6 42.2 43.6 42.8Mexico 22.0 20.4 21.1 20.3 20.9 29.5 11.9 25.2 1.8 14.1 21.5 20.9 20.8 21.5 21.3Nicaragua 48.4 46.5 46.4 46.7 47.3 40.5 28.2 33.7 2.9 32.2 48.7 47.3 47.0 48.7 48.0Panama 15.8 14.9 15.1 15.1 15.2 12.9 6.4 9.6 2.2 7.7 16.1 15.5 15.5 16.1 15.7Paraguay 26.0 24.6 24.7 24.9 25.0 22.3 10.1 15.1 0.4 12.7 26.2 25.3 25.2 26.2 25.7Peru 30.2 28.1 28.3 28.9 29.0 19.9 7.2 12.1 0.0 11.1 30.9 29.6 29.4 30.9 30.3Uruguay 6.0 6.0 6.0 6.0 6.0 0.6 0.5 0.5 0.3 0.5 7.1 7.0 7.0 7.1 7.1Venezuela 32.3 31.0 31.2 31.0 31.5 29.3 18.1 25.0 2.2 20.6 32.5 31.7 31.5 32.5 32.1
Panel B
Current Benchmark Altruism Egoistic Labor Current Benchmark Altruism Egoistic Labor Current Benchmark Altruism Egoistic LaborArgentina 20.1 19.9 19.9 20.1 20.0 12.1 12.0 12.0 12.1 12.0 8.5 8.3 8.3 8.5 8.3Bolivia 50.9 50.5 50.3 50.9 50.7 37.0 36.0 35.9 37.0 36.5 37.8 37.0 36.8 37.8 37.3Brazil 30.4 30.3 30.3 30.4 30.4 17.7 17.6 17.6 17.7 17.7 12.5 12.4 12.4 12.5 12.4Chile 8.2 8.2 8.2 8.2 8.2 5.4 5.4 5.4 5.4 5.4 4.0 4.0 4.0 4.0 4.0Costa Rica 11.3 11.1 11.1 11.3 11.2 6.7 6.4 6.4 6.7 6.5 6.7 6.4 6.3 6.7 6.5Dominican Rep. 20.4 19.4 19.3 20.4 19.7 12.4 11.5 11.4 12.4 11.7 11.0 10.3 10.2 11.0 10.4Ecuador 45.0 44.0 43.7 45.0 44.5 31.9 31.0 30.7 31.9 31.4 30.6 29.4 29.0 30.6 30.0El Salvador 49.2 47.6 47.5 49.2 48.3 36.4 34.7 34.4 36.4 35.4 32.0 30.5 30.2 32.0 31.1Guatemala 43.3 42.6 42.3 43.3 42.9 27.7 27.0 26.7 27.7 27.4 29.4 28.5 28.2 29.4 29.0Haiti 85.2 83.8 83.5 85.2 84.7 76.9 75.3 74.7 76.9 75.9 73.0 71.2 70.7 73.0 72.1Honduras 47.1 46.0 45.9 47.1 46.5 31.8 30.7 30.6 31.8 31.3 33.1 32.0 31.8 33.1 32.5Jamaica 48.4 47.6 47.5 48.4 47.9 43.1 41.7 41.3 43.1 42.2 39.7 38.6 38.0 39.7 38.7Mexico 28.1 27.5 27.4 28.1 27.8 19.4 18.8 18.7 19.4 19.3 17.7 17.0 16.8 17.7 17.4Nicaragua 57.6 56.5 56.2 57.6 57.0 44.4 42.8 42.3 44.4 43.6 41.2 39.6 39.3 41.2 40.4Panama 23.5 22.9 22.9 23.5 23.1 13.6 13.2 13.2 13.6 13.3 11.8 11.2 11.2 11.8 11.4Paraguay 33.8 32.9 32.8 33.8 33.3 22.9 22.2 22.0 22.9 22.6 20.6 19.7 19.6 20.6 20.1Peru 42.4 40.9 40.8 42.4 41.8 25.6 24.4 24.3 25.6 25.1 24.4 23.1 22.9 24.4 23.7Uruguay 12.6 12.6 12.6 12.6 12.6 7.6 7.6 7.6 7.6 7.6 4.3 4.3 4.3 4.3 4.3Venezuela 42.3 41.6 41.4 42.3 41.9 29.7 29.0 28.8 29.7 29.3 26.4 25.5 25.4 26.4 25.9
All 65 + 0-64
<15 15-24 25-64
Source: own calculations based on SEDLAC
55

Table 5.10 Cost of programs As % of household per capita income
All PoorArgentina 0.7% 0.1%Bolivia 2.3% 1.2%Brazil 0.3% 0.0%Chile 0.4% 0.0%Costa Rica 0.7% 0.1%Dominican Rep. 2.0% 0.3%Ecuador 3.6% 1.3%El Salvador 4.1% 1.5%Guatemala 2.5% 0.8%Haiti 10.5% 6.8%Honduras 2.6% 1.1%Jamaica 5.0% 2.8%Mexico 1.9% 0.7%Nicaragua 3.0% 1.3%Panama 0.6% 0.2%Paraguay 1.9% 0.5%Peru 3.6% 0.7%Uruguay 0.5% 0.0%Venezuela 2.5% 0.9%
Cost
56

Table 6.1 Isopoverty curves: axis intercepts and transfer cost Poverty line 2 U$S PPP a day
X axis Y axis Cost (1) X axis Y axis Cost (1) X axis Y axis Cost (1)
(alpha=0) (g=0) (% national income)
(alpha=0) (g=0) (% national income)
(alpha=0) (g=0) (% national income)
(i) (ii) (iii) (i) (ii) (iii) (i) (ii) (iii)
Argentina 2005 6.06 0.01 0.01 6.06 0.06 0.06 6.06 1.28 1.26 Bolivia 2002 6.77 0.18 0.17 6.77 0.73 0.67 6.77 1.73 1.58 Brazil 2004 4.24 0.01 0.01 4.24 0.03 0.03 4.24 0.74 0.73 Chile 2003 2.56 0.00 0.00 2.56 0.01 0.01 2.56 0.45 0.45 Colombia 2004 14.49 0.17 0.17 14.49 0.75 0.72 14.49 2.47 2.39 Costa Rica 2004 6.14 0.02 0.02 6.14 0.07 0.07 6.14 0.70 0.69 Dominican R. 2005 4.18 0.03 0.03 4.18 0.12 0.11 4.18 0.79 0.77 Ecuador 2003 5.22 0.19 0.17 5.22 0.74 0.67 5.22 2.21 2.01 El Salvador 2004 4.98 0.18 0.16 4.98 0.73 0.64 4.98 2.32 2.07 Guatemala 2004 4.32 0.08 0.07 4.32 0.33 0.30 4.32 1.17 1.06 Haiti 2001 6.24 1.69 1.11 6.24 5.96 3.92 6.24 8.98 5.90 Honduras 2005 7.18 0.15 0.14 7.18 0.60 0.55 7.18 1.53 1.41 Jamaica 2002 19.97 0.90 0.85 19.97 3.01 2.86 19.97 5.58 5.30 Mexico 2004 10.49 0.13 0.13 10.49 0.54 0.52 10.49 1.98 1.91 Nicaragua 2001 3.86 0.16 0.13 3.86 0.66 0.56 3.86 1.64 1.39 Panama 2004 4.23 0.02 0.02 4.23 0.09 0.08 4.23 0.69 0.68 Paraguay 2004 4.57 0.05 0.04 4.57 0.20 0.19 4.57 0.94 0.89 Peru 2003 3.12 0.06 0.06 3.12 0.25 0.23 3.12 1.17 1.08 Uruguay 2005 1.86 0.00 0.00 1.86 0.01 0.01 1.86 0.72 0.71 Venezuela 2004 7.25 0.14 0.13 7.25 0.57 0.53 7.25 2.04 1.87
Universal transfersTargeted transfers Intermediate transfers
Country Year
Notes: (1) Calculated assuming no economic growth (g=0) Source: own calculations based on SEDLAC.
57

Table 7.1 National poverty Before and after simulation of changes in the demographic and educational structure of the population
before after before after before after Argentina 2005 13.9 11.1 5.6 4.7 3.3 2.8 Bolivia 2002 48.0 34.3 27.2 17.2 20.0 11.1 Brazil 2004 21.0 9.2 9.7 4.3 6.6 2.9 Chile 2003 7.6 5.1 3.0 1.8 1.9 1.1 Colombia 2004 33.4 18.3 22.6 8.8 19.1 5.9 Costa Rica 2004 12.2 7.0 7.8 3.2 6.5 2.2 Dominican R. 2005 19.7 12.6 7.9 4.8 4.6 2.7 Ecuador 2003 39.4 14.3 17.6 6.0 10.8 3.6 El Salvador 2004 42.6 27.0 20.8 12.3 14.3 7.8 Guatemala 2004 37.8 20.1 16.1 8.9 9.4 5.4 Haiti 2001 81.5 53.2 55.7 36.2 43.0 28.9 Honduras 2005 49.7 29.5 30.2 17.6 23.2 13.6 Mexico 2004 24.6 16.2 12.4 7.7 9.0 5.3 Nicaragua 2001 52.5 27.6 24.1 14.0 14.6 9.2 Panama 2004 15.8 12.4 6.7 6.8 3.8 4.9 Paraguay 2004 30.4 19.9 13.7 8.2 8.3 4.8 Peru 2003 33.1 26.9 13.4 11.2 7.2 6.4 Uruguay 2005 8.1 8.2 2.1 3.0 0.8 1.6 Venezuela 2004 37.3 23.2 19.4 9.9 14.1 6.2
Country YearGap Severity
FGT(1) FGT(2)Incidence
FGT(0)
Source: own calculations based on SEDLAC. Note: Poverty line 2 U$S PPP a day Table 7.2 Old age poverty Before and after simulation of changes in the demographic and educational structure of the population
before after before after before after Argentina 2005 4.9 3.7 2.5 2.0 1.9 1.6 Bolivia 2002 46.8 28.1 28.1 14.6 21.1 9.9 Brazil 2004 5.0 3.2 2.1 1.4 1.6 1.0 Chile 2003 3.7 2.6 1.3 1.0 0.7 0.7 Colombia 2004 34.6 16.8 25.2 9.7 22.3 7.7 Costa Rica 2004 13.9 7.8 8.8 4.4 7.3 3.5 Dominican R. 2005 23.5 15.7 11.6 8.0 8.0 5.7 Ecuador 2003 37.4 17.0 17.7 8.0 11.3 5.2 El Salvador 2004 37.1 21.8 18.2 9.5 12.6 6.0 Guatemala 2004 30.2 21.1 12.7 9.8 7.6 6.2 Haiti 2001 78.0 54.4 51.8 38.5 39.3 31.4 Honduras 2005 49.7 33.3 29.9 20.8 22.6 16.1 Mexico 2004 29.7 18.1 19.0 11.7 15.6 9.9 Nicaragua 2001 44.4 25.7 20.1 12.3 12.4 8.0 Panama 2004 12.4 7.4 4.8 3.9 2.7 2.9 Paraguay 2004 26.0 17.7 11.4 7.9 7.0 5.1 Peru 2003 24.7 16.6 8.7 6.5 4.3 3.8 Uruguay 2005 1.4 1.1 0.3 0.3 0.2 0.2 Venezuela 2004 32.2 16.3 19.3 8.4 15.3 6.2
FGT(0) FGT(1) FGT(2)Severity
Country YearIncidence Gap
Source: own calculations based on SEDLAC. Note: Poverty line 2 U$S PPP a day
58

Table 7.3 Decomposition of the change in poverty after simulation of changes in the demographic and educational structure of the population
National poverty Old age poverty
before after education ageing before after education ageing Argentina 2005 13.9 11.1 -2.8 -1.8 -0.9 4.9 3.7 -1.2 -1.2 0.0 Bolivia 2002 48.0 34.3 -13.7 -12.4 -1.3 46.8 28.1 -18.7 -18.3 -0.4 Brazil 2004 21.0 9.2 -11.9 -10.5 -1.4 5.0 3.2 -1.9 -1.9 0.0 Chile 2003 7.6 5.1 -2.5 -2.0 -0.6 3.7 2.6 -1.1 -1.2 0.1 Colombia 2004 33.4 18.3 -15.1 -14.5 -0.6 34.6 16.8 -17.8 -17.7 -0.1 Costa Rica 2004 12.2 7.0 -5.2 -5.0 -0.2 13.9 7.8 -6.1 -6.0 -0.1 Dominican R. 2005 19.7 12.6 -7.1 -6.4 -0.7 23.5 15.7 -7.8 -6.4 -1.4 Ecuador 2003 39.4 14.3 -25.1 -24.0 -1.2 37.4 17.0 -20.4 -19.8 -0.7 El Salvador 2004 42.6 27.0 -15.5 -14.2 -1.4 37.1 21.8 -15.3 -15.1 -0.2 Guatemala 2004 37.8 20.1 -17.7 -16.8 -0.8 30.2 21.1 -9.1 -9.4 0.3 Haiti 2001 81.5 53.2 -28.3 -27.4 -1.0 78.0 54.4 -23.6 -23.2 -0.3 Honduras 2005 49.7 29.5 -20.2 -18.8 -1.4 49.7 33.3 -16.4 -16.1 -0.2 Mexico 2004 24.6 16.2 -8.3 -7.4 -0.9 29.7 18.1 -11.7 -11.3 -0.3 Nicaragua 2001 52.5 27.6 -25.0 -23.8 -1.2 44.4 25.7 -18.7 -18.1 -0.6 Panama 2004 15.8 12.4 -3.5 -2.5 -1.0 12.4 7.4 -5.0 -4.9 0.0 Paraguay 2004 30.4 19.9 -10.5 -9.8 -0.7 26.0 17.7 -8.3 -8.6 0.4 Peru 2003 33.1 26.9 -6.3 -5.0 -1.3 24.7 16.6 -8.1 -8.6 0.5 Uruguay 2005 8.1 8.2 0.1 0.1 -0.1 1.4 1.1 -0.3 -0.4 0.0 Venezuela 2004 37.3 23.2 -14.1 -12.6 -1.5 32.2 16.3 -15.9 -15.8 -0.1
EffectsChangeLevelChange EffectsLevel
Source: own calculations based on SEDLAC. Note: Poverty line 2 U$S PPP a day
59

Table B3.1 Subjective poverty by age groups
All 60+ 50-59 25-49(i) (ii) (iii) (iv)
National 67.14 70.32 66.40 65.94 3.92** 4.38**Urban 60.47 63.45 59.32 59.49 4.13** 3.96**Rural 87.63 90.71 87.97 86.68 2.73 4.03**
(ii)-(iii) (ii)-(iv)
Source: own calculations based on Colombia’s ECV.
Table B3.2 Marginal probabilities Subjective poverty in Colombia
Male 0.04249***[0.01133]
semi-skilled -0.22518***[0.01442]
skilled -0.39892***[0.01879]
aged 25 to 49 0.02726*[0.01543]
aged 50 to 59 -0.00291[0.01758]
Urban -0.18638***[0.01121]
Household size 0.01134***[0.00279]
Out of labor force -0.00269[0.01563]
Unemployed 0.07991***[0.02397]
entrepeneur -0.20201***[0.03279]
profesional self-employed -0.03518[0.04209]
non-profesional self-employed 0.03193**[0.01442]
zero wage worker 0.05884[0.04430]
Observations 21206Chi2 2236.75Robust standard errors in brackets* significant at 10%; ** significant at 5%; *** significant at 1
Source: own calculations based on Colombia’s ECV.
Table B4.5 Hunger by age groups
All 60+ 50-59 25-49 All 60+ 50-59 25-49(i) (ii) (iii) (iv) (i) (ii) (iii) (iv)
National 17.68 15.72 19.65 18.07 -3.93 -2.35 9.15 9.44 9.26 8.89 0.18 0.55Urban 17.26 15.38 19.27 17.52 -3.89 -2.14 8.97 8.26 9.25 8.97 -0.98 -0.71Rural 30.13 26.32 30.31 33.25 -3.99 -6.94 9.76 12.90 9.29 8.60 3.60 4.30**
ARGENTINA COLOMBIA
(ii)-(iii) (ii)-(iv) (ii)-(iii) (ii)-(iv)
Source: own calculations based on ISCA(2002) and ECV(2003).
60

Table B6.1 National effects of halving poverty for the elderly National poverty headcount ratio
Observed Simulated Argentina 2005 12.9 12.5 Bolivia 2002 44.5 43.1 Brazil 2004 18.3 18.1 Chile 2003 5.5 5.4 Colombia 2004 33.4 31.6 Costa Rica 2004 11.4 10.8 Dominican R. 2005 14.5 13.8 Ecuador 2003 36.7 35.0 El Salvador 2004 38.7 37.3 Guatemala 2004 34.9 34.0 Haiti 2001 77.9 74.9 Honduras 2005 47.5 45.7 Jamaica 2002 50.5 47.3 Mexico 2004 22.4 21.2 Nicaragua 2001 48.4 47.1 Panama 2004 15.8 15.2 Paraguay 2004 26.0 25.2 Peru 2003 30.2 29.2 Uruguay 2005 6.1 6.0 Venezuela 2004 36.1 35.0 Source: own calculations based on SEDLAC.
61

Figure 2.1 Population structure by age and major area
0%
20%
40%
60%
80%
100%
1950
2000
2015
2050
1950
2000
2015
2050
1950
2000
2015
2050
1950
2000
2015
2050
1950
2000
2015
2050
1950
2000
2015
2050
1950
2000
2015
2050
World Africa Asia Europe Latin America andCaribbean
Northern America Oceania
60 + <15 15-24 25-59
Source: own calculations based on Population Division of the Department of Economic and Social Affairs of the United Nations Secretariat, World Population Prospects: The 2004 Revision, February 2005. Note: Medium fertility and AIDS mortality variant
Figure 2.2 LAC annual growth population rate
-0.5
-
0.5
1.0
1.5
2.0
2.5
3.0
3.5
4.0
4.5
1950-1960
1960-1970
1970-1980
1980-1990
1990-2000
2000-2010
2010-2020
2020-2030
2030-2040
2040-2050
60 + 0-59
Source: own calculations based on Population Division of the Department of Economic and Social Affairs of the United Nations Secretariat, World Population Prospects: The 2004 Revision, February 2005. Note: Medium fertility and AIDS mortality variant
62

Figure 2.3 LAC annual growth rate of ratio +60/<60 (1950-2000)
-1.5
-1
-0.5
0
0.5
1
1.5
2
2.5Pa
ragu
ay
Hai
ti
Ecua
dor
Mex
ico
Beliz
e
Cos
ta R
ica
Surin
ame
Nic
arag
ua
Guy
ana
Dom
inic
an R
.
Boliv
ia
Baha
mas
Pana
ma
Peru
Hon
dura
s
Col
ombi
a
Gua
tem
ala
Chi
le
Uru
guay
El S
alva
dor
Trin
idad
&To
bago
Barb
ados
Braz
il
Sain
t Luc
ia
Jam
aica
Cub
a
Vene
zuel
a
Arge
ntin
a
Puer
to R
ico
Source: own calculations based on Population Division of the Department of Economic and Social Affairs of the United Nations Secretariat, World Population Prospects: The 2004 Revision, February 2005. Note: Medium fertility and AIDS mortality variant
Figure 2.4 Share of elderly people in total population - LAC
-
5
10
15
20
25
30
35
40
Dom
inic
an R
.
Surin
ame
Mex
ico
Gua
tem
ala
Hai
ti
Pana
ma
Chi
le
Hon
dura
s
Cos
ta R
ica
Fren
ch G
uian
a
Peru
Sain
t Luc
ia
Nic
arag
ua
Uru
guay
Trin
idad
&To
bago
El S
alva
dor
Para
guay
Baha
mas
Cub
a
Vene
zuel
a
Arge
ntin
a
Guy
ana
Beliz
e
Braz
il
Jam
aica
Ecua
dor
Boliv
ia
Col
ombi
a
Gua
delo
upe
Barb
ados
Net
herla
nds
Antill
es
Puer
to R
ico
2005 2015 2050 Source: own calculations based on Population Division of the Department of Economic and Social Affairs of the United Nations Secretariat, World Population Prospects: The 2004 Revision, February 2005. Note: Medium fertility and AIDS mortality variant
63

Figure 2.5 Population structure by age (Last available year)
0% 20% 40% 60% 80% 100%
Guatemala Nicaragua
Bolivia Venezuela Honduras Paraguay
Haiti Mexico
Costa Rica Peru
Dominican R. El Salvador
Ecuador Brazil
Panama Colombia
Chile Jamaica
Argentina Uruguay
60+ <15 15-24 25-59
Source: own calculations based on SEDLAC.
Figure 2.6 Share of the elderly in total population Urban and rural areas
-2.04.06.08.0
10.012.014.016.0
Bolivia Brazil
Chile
Colombia
Costa Rica
Dominican R.
Ecuador
El Salvador Guatemala Haiti
Honduras
Jamaica
Mexico
Nicaragua
Panama
Paraguay
Peru
Urban Rural
Source: own calculations based on SEDLAC.
64

Figure 2.7 Population ratios
- 20,0 40,0 60,0 80,0 100,0
Uruguay Argentina
Chile Jamaica
Brazil Colombia Panama
Costa Rica Dominican R.
Peru Mexico
El Salvador Ecuador
Venezuela Haiti
Paraguay Honduras
Bolivia Nicaragua Guatemala
60 +/<60 60+/<15
Source: own calculations based on SEDLAC.
Figure 2.8 Share of females by age group
30
35
40
45
50
55
60 Argentina
Bolivia Brazil
Chile
Colombia
Costa Rica
Dominican R.
Ecuador
El Salvador Guatemala
Haiti Honduras
Jamaica
Mexico
Nicaragua
Panama
Paraguay
Peru
Uruguay Venezuela
>60 <60
Source: own calculations based on SEDLAC.
65

Figure 2.9 a. Average family size by age b. Average family size by area (>60)
-1.02.03.04.05.06.07.0 Argentina
Bolivia Brazil
Chile
Colombia
Costa Rica
Dominican R.
Ecuador
El Salvador Guatemala
Haiti Honduras
Jamaica
Mexico
Nicaragua
Panama
Paraguay
Peru
Uruguay Venezuela
60 + 0-59
-1.0
2.0
3.0
4.0
5.06.0 Bolivia
Brazil
Chile
Colombia
Costa Rica
Dominican R.
Ecuador
El Salvador Guatemala Haiti
Honduras
Jamaica
Mexico
Nicaragua
Panama
Paraguay
Peru
Urban Rural
Source: own calculations based on SEDLAC.
Figure 2.10 a. Household head by age b. Household head by area (>60)
-
20
40
60
80
100 Argentina
Bolivia Brazil
Chile
Colombia
Costa Rica
Dominican R.
Ecuador
El Salvador Guatemala
Haiti Honduras
Jamaica
Mexico
Nicaragua
Panama
Paraguay
Peru
Uruguay Venezuela
60 + 0-59
-
10
20
30
40 Bolivia
Brazil
Chile
Colombia
Costa Rica
Dominican R
Ecuador
El Salvador Guatemala Haiti
Honduras
Jamaica
Mexico
Nicaragua
Panama
Paraguay
Peru
Rural Urban
Source: own calculations based on SEDLAC.
66

Figure 3.1 National and old age poverty headcount ratios
0
20
40
60
80
0 10 20 30 40 50 60 70 80
National poverty rate
Old
age
pov
erty
rate
Source: own calculations based on SEDLAC. Note: Poverty is defined as household per capita income below the USD2 a day (PPP) line. Figure 3.2 Adult and old age poverty headcount ratios
0
20
40
60
80
0 10 20 30 40 50 60 70 80
Adult poverty rate
Old
age
pov
erty
rate
Source: own calculations based on SEDLAC. Note: Poverty is defined as household per capita income below the USD2 a day (PPP) line.
67
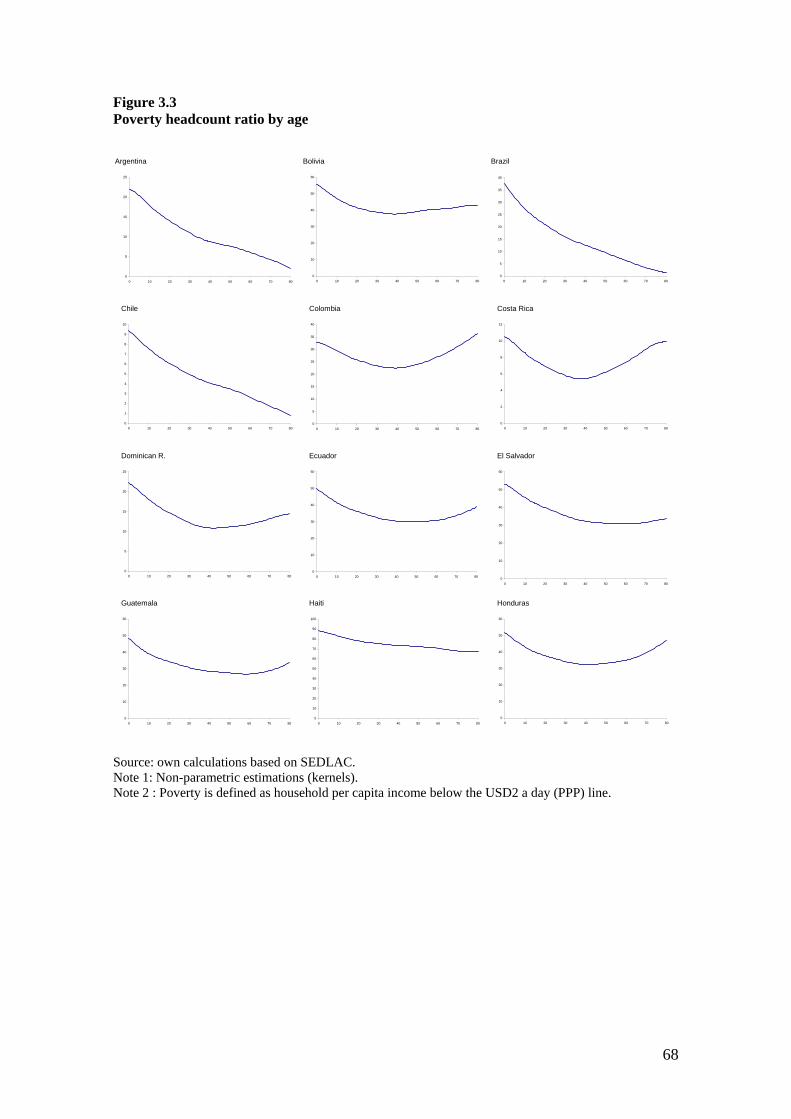
Figure 3.3 Poverty headcount ratio by age Argentina Bolivia Brazil
Chile Colombia Costa Rica
Dominican R. Ecuador El Salvador
Guatemala Haiti Honduras
0
5
10
15
20
25
0 10 20 30 40 50 60 70 80
0
10
20
30
40
50
60
0 10 20 30 40 50 60 70 800
5
10
15
20
25
30
35
40
0 10 20 30 40 50 60 70 80
0
1
2
3
4
5
6
7
8
9
10
0 10 20 30 40 50 60 70 800
5
10
15
20
25
30
35
40
0 10 20 30 40 50 60 70 800
2
4
6
8
10
12
0 10 20 30 40 50 60 70 80
0
5
10
15
20
25
0 10 20 30 40 50 60 70 800
10
20
30
40
50
60
0 10 20 30 40 50 60 70 80 0
10
20
30
40
50
60
0 10 20 30 40 50 60 70 80
0
10
20
30
40
50
60
0 10 20 30 40 50 60 70 800
10
20
30
40
50
60
70
80
90
100
0 10 20 30 40 50 60 70 800
10
20
30
40
50
60
0 10 20 30 40 50 60 70 80
Source: own calculations based on SEDLAC. Note 1: Non-parametric estimations (kernels). Note 2 : Poverty is defined as household per capita income below the USD2 a day (PPP) line.
68

Figure 3.3 (cont.) Poverty headcount ratio by age Jamaica Mexico Nicaragua
Panama Paraguay Peru
Uruguay Venezuela
0
10
20
30
40
50
60
70
0 10 20 30 40 50 60 70 80
0
5
10
15
20
25
30
0 10 20 30 40 50 60 70 80
0
5
10
15
20
25
30
35
40
0 10 20 30 40 50 60 70 80
0
5
10
15
20
25
30
35
40
0 10 20 30 40 50 60 70 80
0
10
20
30
40
50
60
70
0 10 20 30 40 50 60 70 80
0
10
20
30
40
50
60
0 10 20 30 40 50 60 70 80
-2
0
2
4
6
8
10
12
14
16
18
0 10 20 30 40 50 60 70 80 0
5
10
15
20
25
30
35
40
45
50
0 10 20 30 40 50 60 70 80
Source: own calculations based on SEDLAC. Note 1: Non-parametric estimations (kernels). Note 2 : Poverty is defined as household per capita income below the USD2 a day (PPP) line.
69

Figure 3.4 Poverty by age Equivalized income using adult equivalents and economies of scale Argentina Bolivia
Brazil Mexico
0
5
10
15
20
25
0 10 20 30 40 50 60 70 80
per capita income equivalized income
0
10
20
30
40
50
60
0 10 20 30 40 50 60 70 80
per capita income equivalized income
0
5
10
15
20
25
30
35
40
0 10 20 30 40 50 60 70 80
per capita income equivalized income
0
5
10
15
20
25
30
35
40
45
0 10 20 30 40 50 60 70 80
per capita income equivalized income
Source: own calculations based on SEDLAC. Note 1: Non-parametric estimations (kernels). Note 2 : Poverty defined with household per capita income and equivalized income (adult equivalent 0.25 if age lower than 5, and 0.5 if age between 6 and 14; parameter of internal economies of scale=0.8)
Figure 3.5 Ratio of poverty older than 60/younger than 60 By parameter of economies of scale
0.0
0.2
0.4
0.6
0.8
1.0
1.2
1.4
1.6
1.8
2.0
1 0.9 0.8 0.7 0.6 0.5 0.4 0.3 0.2 0.1 0
Parameter of economies of scale
1 Argentina Bolivia Brazil Chile Colombia
0.0
0.2
0.4
0.6
0.8
1.0
1.2
1.4
1.6
1.8
2.0
1 0.9 0.8 0.7 0.6 0.5 0.4 0.3 0.2 0.1
Parameter of economies of scale
1 Dominican R. Ecuador El Salvador Guate
0.0
0.2
0.4
0.6
0.8
1.0
1.2
1.4
1.6
1.8
2.0
1 0.9 0.8 0.7 0.6 0.5 0.4 0.3 0.2 0.1 0
Parameter of economies of scale
1 Haiti Honduras Jamaica Mexico Nicaragua
0.0
0.2
0.4
0.6
0.8
1.0
1.2
1.4
1.6
1.8
2.0
1 0.9 0.8 0.7 0.6 0.5 0.4 0.3 0.2 0.1
Parameter of economies of scale
1 Panama Paraguay Peru Uruguay Ve
Source: own calculations based on SEDLAC.
70

Figure 3.6 Scatter plot ratio poverty +60/-60 with other variables Share of old people receiving pensions, gap in years of education +60/(25-59), And gap in household size +60/-60 Share old people receiving pensions Years of education +60/(25-59)
Household size +60/-60
0.0
0.2
0.4
0.6
0.8
1.0
1.2
1.4
1.6
0.0 0.2 0.4 0.6 0.8
Share old people receiving pensions
Pov
erty
+60
/-60
0.0
0.2
0.4
0.6
0.8
1.0
1.2
1.4
1.6
2.5 3.0 3.5 4.0 4.5
Years of education +60/(25-59)
Pov
erty
+60
/-60
0.0
0.2
0.4
0.6
0.8
1.0
1.2
1.4
1.6
0.6 0.7 0.8
Hosehold size +60/-60
Pov
erty
+60
/-60
Source: own calculations based on SEDLAC. Note: poverty measured with household per capita income and the USD2 line. Figure 3.7 Concentration curves Distribution of the elderly along the income distribution
0
0.1
0.2
0.3
0.4
0.5
0.6
0.7
0.8
0.9
1
0 0.1 0.2 0.3 0.4 0.5 0.6 0.7 0.8 0.9 1
pel Argentina Brazil Mexico
0
0.1
0.2
0.3
0.4
0.5
0.6
0.7
0.8
0.9
1
0 0.1 0.2 0.3 0.4 0.5 0.6 0.7 0.8 0.9 1
pel Bolivia Uruguay Venezuela
Source: own calculations based on SEDLAC.
71

Figure 3.8 Scatter plot between mean age and the Gini coefficient for the distribution of per capita income LAC countries, early 2000s
0.40
0.45
0.50
0.55
0.60
0.65
25 30 35 40
Mean age
Gin
i
Source: own calculations based on SEDLAC.
72

Figure 4.1 Distribution by type of work
Entrepeneurs Self-employed Wage earners
0.00
0.05
0.10
0.15
0.20
0.25
0.30
0.00 0.05 0.10 0.15 0.20 0.25 0.30
share of entrepeneurs (employed adults)
shar
e of
ent
repe
neur
s (e
mpl
oyed
old
age
)
0.00
0.10
0.20
0.30
0.40
0.50
0.60
0.70
0.80
0.00 0.10 0.20 0.30 0.40 0.50 0.60 0.70 0.80
share of self-employed (employed adults)
shar
e of
sel
f-em
ploy
ed (e
mpl
oyed
old
age
0.00
0.10
0.20
0.30
0.40
0.50
0.60
0.70
0.80
0.00 0.20 0.40 0.60 0.80
share of self-employed (employed adults)
shar
e of
sel
f-em
ploy
ed (e
mpl
oyed
old
age
Source: own calculations based on SEDLAC.
73

Figure 4.2 Hours worked by age
Argentina
15
20
25
30
35
40
45
25 35 45 55 65 75
Bolivia
15
20
25
30
35
40
45
50
25 35 45 55 65 75
Brazil
15
20
25
30
35
40
45
25 35 45 55 65 75
Chile
15
20
25
30
35
40
45
50
25 35 45 55 65 75
Colombia
15
20
25
30
35
40
45
50
25 35 45 55 65 75
Costa Rica
15
20
25
30
35
40
45
50
25 35 45 55 65 75
Ecuador
15
20
25
30
35
40
45
50
25 35 45 55 65 75
El Salvador
15
20
25
30
35
40
45
50
25 35 45 55 65 75
Guatemala
15
20
25
30
35
40
45
25 35 45 55 65 75
Honduras
15
20
25
30
35
40
45
25 35 45 55 65 75
Nicaragua
15
20
25
30
35
40
45
50
25 35 45 55 65 75
Panama
15
20
25
30
35
40
45
25 35 45 55 65 75
Paraguay
15
20
25
30
35
40
45
25 35 45 55 65 75
Paraguay
15
20
25
30
35
40
45
50
25 35 45 55 65 75
Peru
15
20
25
30
35
40
45
25 35 45 55 65 75
Uruguay
15
20
25
30
35
40
45
25 35 45 55 65 75
Venezuela
15
20
25
30
35
40
45
25 35 45 55 65 75
Dominican R.
15
20
25
30
35
40
45
25 35 45 55 65 75
Haiti
15
20
25
30
35
40
45
25 35 45 55 65 75
Jamaica
15
20
25
30
35
40
45
25 35 45 55 65 75
Non-parametric estimation (lowess) of hours worked Source: own calculations based on SEDLAC.
74

Figure 4.3 Housing by age groups
housing owners poor dwellings low-quality materials
0.50
0.55
0.60
0.65
0.70
0.75
0.80
0.85
0.90
0.50 0.55 0.60 0.65 0.70 0.75 0.80 0.85
National share of housing owners
Old
age
sha
re o
f hou
sing
ow
ners
0.00
0.05
0.10
0.15
0.20
0.25
0.30
0.35
0.40
0.45
0.00 0.10 0.20 0.30 0.40
National share of "poor" dwellingsO
ld a
ge s
hare
of "
poor
" dw
ellin
gs
0.00
0.10
0.20
0.30
0.40
0.50
0.60
0.70
0.00 0.20 0.40 0.60National share of dwellings of low-quality materials
Old
age
of d
wel
lings
of l
ow-q
ualit
y m
ater
ials
Source: own calculations based on SEDLAC Figure 4.4 Literacy gap and poverty
0.00
0.05
0.10
0.15
0.20
0.25
0.30
0.35
0.40
0.45
0.50
0 0.1 0.2 0.3 0.4 0.5
poverty
litera
cy g
ap
Source: own calculations based on SEDLAC. Figure 4.5 Unskilled ratio and poverty
0.5
0.7
0.9
1.1
1.3
1.5
1.7
1.9
2.1
2.3
0 0.1 0.2 0.3 0.4 0.5
poverty
unsk
illed
ratio
Source: own calculations based on SEDLAC.
75

Figure 4.6 Self-perception of health status and age Colombia, ECV 2003
0
0.1
0.2
0.3
0.4
0.5
0.6
0.7
0.8
0.9
5 15 25 35 45 55 65 75
age
Goo
d he
alth
(sel
f-per
cept
ion)
Source: own calculations based on Colombia’s ECV microdata. Non-parametric estimation (lowess) of positive self-perception of health status
76

Figure 5.1 Share of people receiving income from pensions National
0.0
0.2
0.4
0.6
0.8
1.0
Uruguay
Brazil
Argentina
Chile
Panam
a
Costa R
ica
Mexico
Venezuela
Colom
bia
El S
alvador
Jamaica
Paraguay
Dom
inican Rep.
Bolivia
Ecuador
Guatem
ala
Nicaragua
Honduras
Haiti
All Inactive
Source: own calculations based on SEDLAC. Figure 5.2 Share of people receiving income from pensions Urban areas
0.0
0.2
0.4
0.6
0.8
1.0
Uruguay
Brazil
Chile
Argentina
Panama
Costa R
ica
Mexico
El Salvador
Bolivia
Colom
bia
Paraguay
Ecuador
Jamaica
Venezuela
Guatem
ala
Nicaragua
Dom
inican Rep.
Honduras
Haiti
All Inactive
Source: own calculations based on SEDLAC.
Figure 5.3 Share of people receiving income from pensions Rural areas
0.0
0.2
0.4
0.6
0.8
1.0
Brazil
Chile
Costa R
ica
Panam
a
Jamaica
Mexico
Dom
inican Rep.
Guatem
ala
Paraguay
Colom
bia
Ecuador
El S
alvador
Nicaragua
Bolivia
Honduras
Haiti
All Inactive
Source: own calculations based on SEDLAC.
77

Figure 6.1 Isopoverty curves
0.00
0.20
0.40
0.60
0.80
1.00
1.20
1.40
Tax
rate
(alp
ha)
0.0 1.0 2.0 3.0 4.0 5.0 6.0
Annual growth rate (g)
Targeted
Intermediate
Universal
Argentina 2005
0.00
0.20
0.40
0.60
0.80
1.00
1.20
1.40
1.60
1.80
Tax
rate
(alp
ha)
0.0 1.0 2.0 3.0 4.0 5.0 6.0 7.0
Annual growth rate (g)
Targeted
Intermediate
Universal
Bolivia 2002
0.00
0.10
0.20
0.30
0.40
0.50
0.60
0.70
0.80
Tax
rate
(alp
ha)
0.0 0.5 1.0 1.5 2.0 2.5 3.0 3.5 4.0 4.5
Annual growth rate (g)
Targeted
Intermediate
Universal
Brazil 2004
0.00
0.05
0.10
0.15
0.20
0.25
0.30
0.35
0.40
0.45
Tax
rate
(alp
ha)
0.0 0.5 1.0 1.5 2.0 2.5
Annual growth rate (g)
Targeted
Intermediate
Universal
Chile 2003
0.00
0.50
1.00
1.50
2.00
2.50
Tax
rate
(alp
ha)
0.0 2.0 4.0 6.0 8.0 10.0 12.0 14.0
Annual growth rate (g)
Targeted
Intermediate
Universal
Colombia 2004
0.00
0.10
0.20
0.30
0.40
0.50
0.60
0.70
Tax
rate
(alp
ha)
0.0 1.0 2.0 3.0 4.0 5.0 6.0
Annual growth rate (g)
Targeted
Intermediate
Universal
Costa Rica 2004
0.00
0.10
0.20
0.30
0.40
0.50
0.60
0.70
0.80
Tax
rate
(alp
ha)
0.0 0.5 1.0 1.5 2.0 2.5 3.0 3.5 4.0 4.5
Annual growth rate (g)
Targeted
Intermediate
Universal
Dominican Republic 2005
0.00
0.50
1.00
1.50
2.00
2.50
Tax
rate
(alp
ha)
0.0 0.5 1.0 1.5 2.0 2.5 3.0 3.5 4.0 4.5 5.0
Annual growth rate (g)
Targeted
Intermediate
Universal
Ecuador 2003
Source: Author's calculations based on Household Surveys
78

Figure 6.1 Isopoverty curves (continue)
0.00
0.50
1.00
1.50
2.00
2.50
Tax
rate
(alp
ha)
0.0 0.5 1.0 1.5 2.0 2.5 3.0 3.5 4.0 4.5 5.0
Annual growth rate (g)
Targeted
Intermediate
Universal
El Salvador 2004
0.00
0.20
0.40
0.60
0.80
1.00
1.20
Tax
rate
(alp
ha)
0.0 0.5 1.0 1.5 2.0 2.5 3.0 3.5 4.0 4.5
Annual growth rate (g)
Targeted
Intermediate
Universal
Guatemala 2004
0.00
1.00
2.00
3.00
4.00
5.00
6.00
7.00
8.00
9.00
Tax
rate
(alp
ha)
0.0 1.0 2.0 3.0 4.0 5.0 6.0
Annual growth rate (g)
Targeted
Intermediate
Universal
Haiti 2001
0.00
0.20
0.40
0.60
0.80
1.00
1.20
1.40
1.60Ta
x ra
te (a
lpha
)
0.0 1.0 2.0 3.0 4.0 5.0 6.0 7.0
Annual growth rate (g)
Targeted
Intermediate
Universal
Honduras 2005
0.00
1.00
2.00
3.00
4.00
5.00
6.00
Tax
rate
(alp
ha)
0.0 2.0 4.0 6.0 8.0 10.0 12.0 14.0 16.0 18.0 20.0
Annual growth rate (g)
Targeted
Intermediate
Universal
Jamaica 2002
0.00
0.20
0.40
0.60
0.80
1.00
1.20
1.40
1.60
1.80
2.00
Tax
rate
(alp
ha)
0.0 2.0 4.0 6.0 8.0 10.0
Annual growth rate (g)
Targeted
Intermediate
Universal
Mexico 2004
0.00
0.20
0.40
0.60
0.80
1.00
1.20
1.40
1.60
Tax
rate
(alp
ha)
0.0 0.5 1.0 1.5 2.0 2.5 3.0 3.5 4.0
Annual growth rate (g)
Targeted
Intermediate
Universal
Nicaragua 2001
0.00
0.10
0.20
0.30
0.40
0.50
0.60
0.70
Tax
rate
(alp
ha)
0.0 0.5 1.0 1.5 2.0 2.5 3.0 3.5 4.0 4.5
Annual growth rate (g)
Targeted
Intermediate
Universal
Panama 2004
Source: Author's calculations based on Household Surveys
79
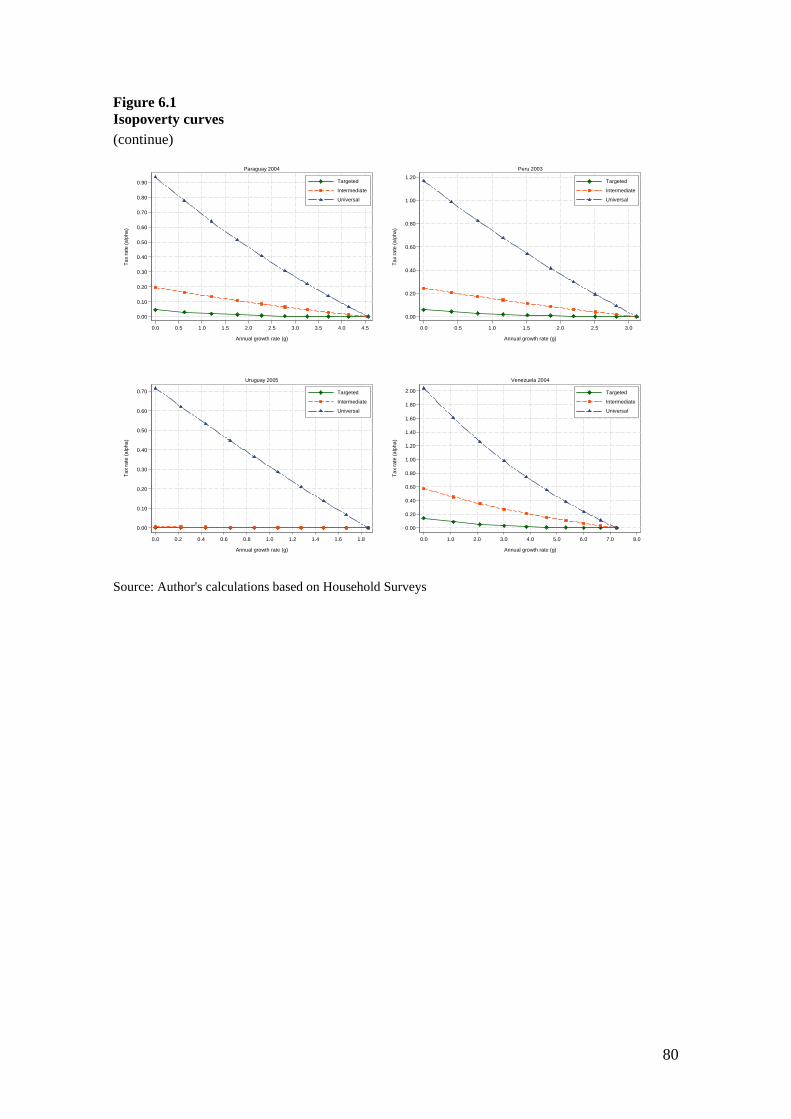
Figure 6.1 Isopoverty curves (continue)
0.00
0.10
0.20
0.30
0.40
0.50
0.60
0.70
0.80
0.90
Tax
rate
(alp
ha)
0.0 0.5 1.0 1.5 2.0 2.5 3.0 3.5 4.0 4.5
Annual growth rate (g)
Targeted
Intermediate
Universal
Paraguay 2004
0.00
0.20
0.40
0.60
0.80
1.00
1.20
Tax
rate
(alp
ha)
0.0 0.5 1.0 1.5 2.0 2.5 3.0
Annual growth rate (g)
Targeted
Intermediate
Universal
Peru 2003
0.00
0.10
0.20
0.30
0.40
0.50
0.60
0.70
Tax
rate
(alp
ha)
0.0 0.2 0.4 0.6 0.8 1.0 1.2 1.4 1.6 1.8
Annual growth rate (g)
Targeted
Intermediate
Universal
Uruguay 2005
0.00
0.20
0.40
0.60
0.80
1.00
1.20
1.40
1.60
1.80
2.00Ta
x ra
te (a
lpha
)
0.0 1.0 2.0 3.0 4.0 5.0 6.0 7.0 8.0
Annual growth rate (g)
Targeted
Intermediate
Universal
Venezuela 2004
Source: Author's calculations based on Household Surveys
80

Figure B3.1 Poverty headcount ratio by age Nicaragua, 2001
0
10
20
30
40
50
60
70
0 10 20 30 40 50 60 70 80
income poverty consumption poverty Source: own calculations based on the EMNV 2001. Figure B3.2 Self-perception of poverty Colombia, ECV 2003
0.4
0.45
0.5
0.55
0.6
0.65
0.7
0.75
0.8
25 35 45 55 65 75
age
subj
ectiv
e po
verty
Source: own calculations based on Colombia’s ECV. Figure B6.1 National effects of halving poverty for the elderly National poverty headcount ratio
0 10 20 30 40 50
Haiti Jamaica
Honduras Bolivia
Colombia Nicaragua Venezuela
El Salvador Ecuador
Guatemala Peru
Mexico Paraguay
Brazil Costa Rica
Panama Argentina
Dominican R. Chile
Uruguay
Observed Simulated
Source: own calculations based on SEDLAC.
81

SERIE DOCUMENTOS DE TRABAJO DEL CEDLAS Todos los Documentos de Trabajo del CEDLAS están disponibles en formato electrónico en <www.depeco.econo.unlp.edu.ar/cedlas>.
• Nro. 55 (Julio, 2007). Leonardo Gasparini, Javier Alejo, Francisco Haimovich, Sergio Olivieri y Leopoldo Tornarolli. "Poverty among the Elderly in Latin America and the Caribbean".
• Nro. 54 (Julio, 2007). Gustavo Javier Canavire-Bacarreza y Luís Fernando Lima Soria. "Unemployment Duration and Labor Mobility in Argentina: A Socioeconomic-Based Pre- and Post-Crisis Analysis".
• Nro. 53 (Junio, 2007). Leonardo Gasparini, Francisco Haimovich y Sergio Olivieri. "Labor Informality Effects of a Poverty-Alleviation Program".
• Nro. 52 (Junio, 2007). Nicolás Epele y Victoria Dowbley. "Análisis Ex-Ante de un Aumento en la Dotación de Capital Humano: El Caso del Plan Familias de Transferencias Condicionadas".
• Nro. 51 (Mayo, 2007). Jerónimo Carballo y María Bongiorno. "Vulnerabilidad Individual: Evolución, Diferencias Regionales e Impacto de la Crisis. Argentina 1995 – 2005".
• Nro. 50 (Mayo, 2007). Paula Giovagnoli. "Failures in School Progression".
• Nro. 49 (Abril, 2007). Sebastian Galiani, Daniel Heymann, Carlos Dabús y Fernando Tohmé. "Land-Rich Economies, Education and Economic Development".
• Nro. 48 (Abril, 2007). Ricardo Bebczuk y Francisco Haimovich. "MDGs and Microcredit: An Empirical Evaluation for Latin American Countries".
• Nro. 47 (Marzo, 2007). Sebastian Galiani y Federico Weinschelbaum. "Modeling Informality Formally: Households and Firms".
• Nro. 46 (Febrero, 2007). Leonardo Gasparini y Leopoldo Tornarolli. "Labor Informality in Latin America and the Caribbean: Patterns and Trends from Household Survey Microdata".
• Nro. 45 (Enero, 2007). Georgina Pizzolitto. "Curvas de Engel de Alimentos, Preferencias Heterogéneas y Características Demográficas de los Hogares: Estimaciones para Argentina".
• Nro. 44 (Diciembre, 2006). Rafael Di Tella, Sebastian Galiani y Ernesto Schargrodsky. "Crime Distribution and Victim Behavior during a Crime Wave".

• Nro. 43 (Noviembre, 2006). Martín Cicowiez, Leonardo Gasparini, Federico Gutiérrez y Leopoldo Tornarolli. "Areas Rurales y Objetivos de Desarrollo del Milenio en America Latina y El Caribe".
• Nro. 42 (Octubre, 2006). Martín Guzmán y Ezequiel Molina. "Desigualdad e Instituciones en una Dimensión Intertemporal".
• Nro. 41 (Septiembre, 2006). Leonardo Gasparini y Ezequiel Molina. "Income Distribution, Institutions and Conflicts: An Exploratory Analysis for Latin America and the Caribbean".
• Nro. 40 (Agosto, 2006). Leonardo Lucchetti. "Caracterización de la Percepción del Bienestar y Cálculo de la Línea de Pobreza Subjetiva en Argentina".
• Nro. 39 (Julio, 2006). Héctor Zacaria y Juan Ignacio Zoloa. "Desigualdad y Pobreza entre las Regiones Argentinas: Un Análisis de Microdescomposiciones".
• Nro. 38 (Julio, 2006). Leonardo Gasparini, Matías Horenstein y Sergio Olivieri. "Economic Polarisation in Latin America and the Caribbean: What do Household Surveys Tell Us?".
• Nro. 37 (Junio, 2006). Walter Sosa-Escudero, Mariana Marchionni y Omar Arias. "Sources of Income Persistence: Evidence from Rural El Salvador".
• Nro. 36 (Mayo, 2006). Javier Alejo. "Desigualdad Salarial en el Gran Buenos Aires: Una Aplicación de Regresión por Cuantiles en Microdescomposiciones".
• Nro. 35 (Abril, 2006). Jerónimo Carballo y María Bongiorno. "La Evolución de la Pobreza en Argentina: Crónica, Transitoria, Diferencias Regionales y Determinantes (1995-2003)".
• Nro. 34 (Marzo, 2006). Francisco Haimovich, Hernán Winkler y Leonardo Gasparini. "Distribución del Ingreso en América Latina: Explorando las Diferencias entre Países".
• Nro. 33 (Febrero, 2006). Nicolás Parlamento y Ernesto Salinardi. "Explicando los Cambios en la Desigualdad: Son Estadísticamente Significativas las Microsimulaciones? Una Aplicación para el Gran Buenos Aires".
• Nro. 32 (Enero, 2006). Rodrigo González. "Distribución de la Prima Salarial del Sector Público en Argentina".
• Nro. 31 (Enero, 2006). Luis Casanova. "Análisis estático y dinámico de la pobreza en Argentina: Evidencia Empírica para el Periodo 1998-2002".
• Nro. 30 (Diciembre, 2005). Leonardo Gasparini, Federico Gutiérrez y Leopoldo Tornarolli. "Growth and Income Poverty in Latin America and the Caribbean: Evidence from Household Surveys".
• Nro. 29 (Noviembre, 2005). Mariana Marchionni. "Labor Participation and Earnings for Young Women in Argentina".

• Nro. 28 (Octubre, 2005). Martín Tetaz. "Educación y Mercado de Trabajo".
• Nro. 27 (Septiembre, 2005). Matías Busso, Martín Cicowiez y Leonardo Gasparini. "Ethnicity and the Millennium Development Goals in Latin America and the Caribbean".
• Nro. 26 (Agosto, 2005). Hernán Winkler. "Monitoring the Socio-Economic Conditions in Uruguay".
• Nro. 25 (Julio, 2005). Leonardo Gasparini, Federico Gutiérrez y Guido G. Porto. "Trade and Labor Outcomes in Latin America's Rural Areas: A Cross-Household Surveys Approach".
• Nro. 24 (Junio, 2005). Francisco Haimovich y Hernán Winkler. "Pobreza Rural y Urbana en Argentina: Un Análisis de Descomposiciones".
• Nro. 23 (Mayo, 2005). Leonardo Gasparini y Martín Cicowiez. "Equality of Opportunity and Optimal Cash and In-Kind Policies".
• Nro. 22 (Abril, 2005). Leonardo Gasparini y Santiago Pinto. "Equality of Opportunity and Optimal Cash and In-Kind Policies".
• Nro. 21 (Abril, 2005). Matías Busso, Federico Cerimedo y Martín Cicowiez. "Pobreza, Crecimiento y Desigualdad: Descifrando la Última Década en Argentina".
• Nro. 20 (Marzo, 2005). Georgina Pizzolitto. "Poverty and Inequality in Chile: Methodological Issues and a Literature Review".
• Nro. 19 (Marzo, 2005). Paula Giovagnoli, Georgina Pizzolitto y Julieta Trías. "Monitoring the Socio-Economic Conditions in Chile".
• Nro. 18 (Febrero, 2005). Leonardo Gasparini. "Assessing Benefit-Incidence Results Using Decompositions: The Case of Health Policy in Argentina".
• Nro. 17 (Enero, 2005). Leonardo Gasparini. "Protección Social y Empleo en América Latina: Estudio sobre la Base de Encuestas de Hogares".
• Nro. 16 (Diciembre, 2004). Evelyn Vezza. "Poder de Mercado en las Profesiones Autorreguladas: El Desempeño Médico en Argentina".
• Nro. 15 (Noviembre, 2004). Matías Horenstein y Sergio Olivieri. "Polarización del Ingreso en la Argentina: Teoría y Aplicación de la Polarización Pura del Ingreso".
• Nro. 14 (Octubre, 2004). Leonardo Gasparini y Walter Sosa Escudero. "Implicit Rents from Own-Housing and Income Distribution: Econometric Estimates for Greater Buenos Aires".
• Nro. 13 (Septiembre, 2004). Monserrat Bustelo. "Caracterización de los Cambios en la Desigualdad y la Pobreza en Argentina Haciendo Uso de Técnicas de Descomposiciones Microeconometricas (1992-2001)".

• Nro. 12 (Agosto, 2004). Leonardo Gasparini, Martín Cicowiez, Federico Gutiérrez y Mariana Marchionni. "Simulating Income Distribution Changes in Bolivia: a Microeconometric Approach".
• Nro. 11 (Julio, 2004). Federico H. Gutierrez. "Dinámica Salarial y Ocupacional: Análisis de Panel para Argentina 1998-2002".
• Nro. 10 (Junio, 2004). María Victoria Fazio. "Incidencia de las Horas Trabajadas en el Rendimiento Académico de Estudiantes Universitarios Argentinos".
• Nro. 9 (Mayo, 2004). Julieta Trías. "Determinantes de la Utilización de los Servicios de Salud: El Caso de los Niños en la Argentina".
• Nro. 8 (Abril, 2004). Federico Cerimedo. "Duración del Desempleo y Ciclo Económico en la Argentina".
• Nro. 7 (Marzo, 2004). Monserrat Bustelo y Leonardo Lucchetti. "La Pobreza en Argentina: Perfil, Evolución y Determinantes Profundos (1996, 1998 Y 2001)".
• Nro. 6 (Febrero, 2004). Hernán Winkler. "Estructura de Edades de la Fuerza Laboral y Distribución del Ingreso: Un Análisis Empírico para la Argentina".
• Nro. 5 (Enero, 2004). Pablo Acosta y Leonardo Gasparini. "Capital Accumulation, Trade Liberalization and Rising Wage Inequality: The Case of Argentina".
• Nro. 4 (Diciembre, 2003). Mariana Marchionni y Leonardo Gasparini. "Tracing Out the Effects of Demographic Changes on the Income Distribution. The Case of Greater Buenos Aires".
• Nro. 3 (Noviembre, 2003). Martín Cicowiez. "Comercio y Desigualdad Salarial en Argentina: Un Enfoque de Equilibrio General Computado".
• Nro. 2 (Octubre, 2003). Leonardo Gasparini. "Income Inequality in Latin America and the Caribbean: Evidence from Household Surveys".
• Nro. 1 (Septiembre, 2003). Leonardo Gasparini. "Argentina's Distributional Failure: The Role of Integration and Public Policies".