PNW WOOD MARKETS - Forest Resources
42
©2016, Forest2Market, Inc. PNW WOOD MARKETS: A CLOSER LOOK AT DOMESTIC & GLOBAL EFFECTS ON OUR INDUSTRY FRA – WESTERN REGION SPRING “WORK LOCAL, THINK GLOBAL” MAY 27, 2016 SUNRIVER RESORT SUNRIVER, OREGON GREG FROHN [email protected]
Transcript of PNW WOOD MARKETS - Forest Resources

©2016, Forest2Market, Inc.
PNW WOOD MARKETS: A CLOSER LOOK AT DOMESTIC &
GLOBAL EFFECTS ON OUR INDUSTRY
FRA – WESTERN REGION SPRING “WORK LOCAL, THINK GLOBAL”
MAY 27, 2016 SUNRIVER RESORT
SUNRIVER, OREGON GREG FROHN
©2016, Forest2Market, Inc. Slide 2
TODAY’S TOPICS
1. US Housing Trends
2. The future for building with wood
3. “Softwood Lumber Agreement”
4. North American lumber production
5. The forest product export business
6. Pulp, Paper, and Pellets, a global perspective
7. Conclusion and some predictions
©2016, Forest2Market, Inc. Slide 3
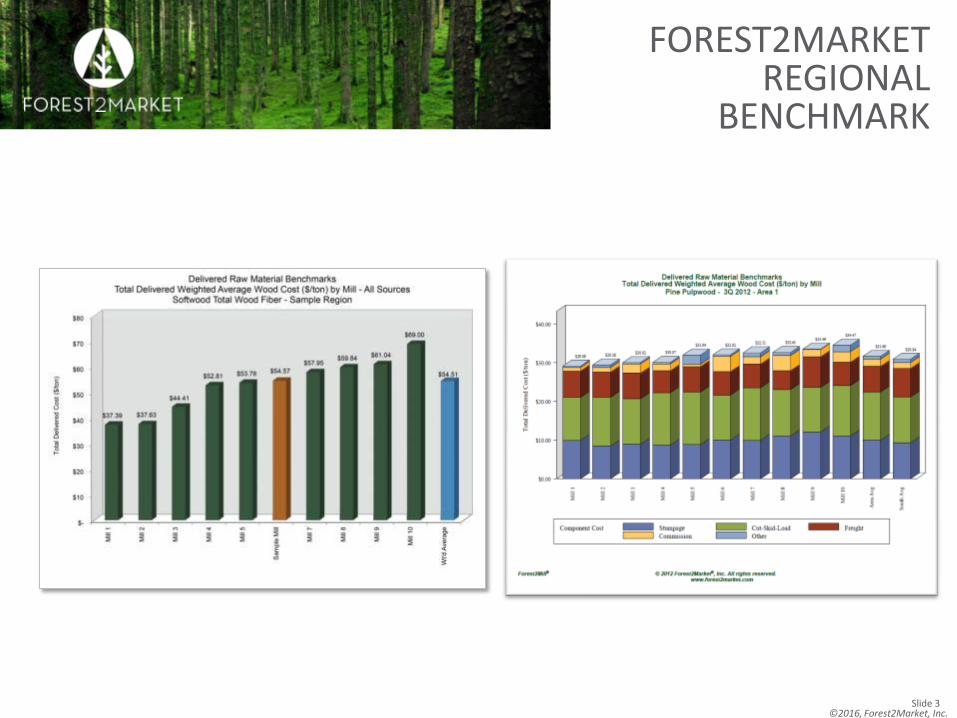
FOREST2MARKET REGIONAL
BENCHMARK
©2016, Forest2Market, Inc. Slide 4
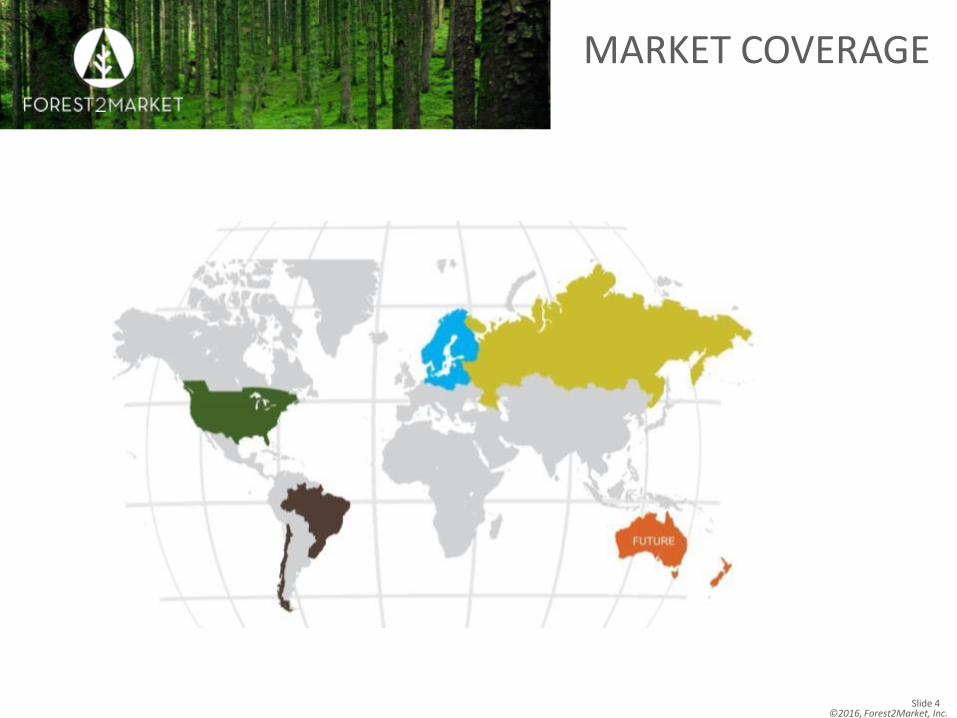
MARKET COVERAGE
©2016, Forest2Market, Inc. Slide 5
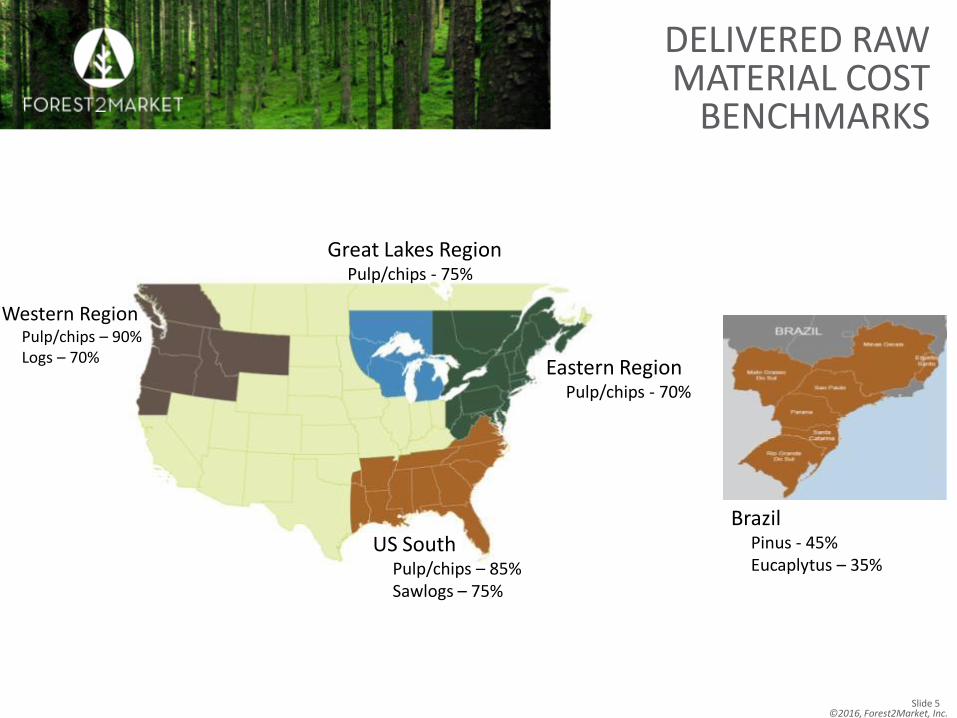
DELIVERED RAW MATERIAL COST
BENCHMARKS
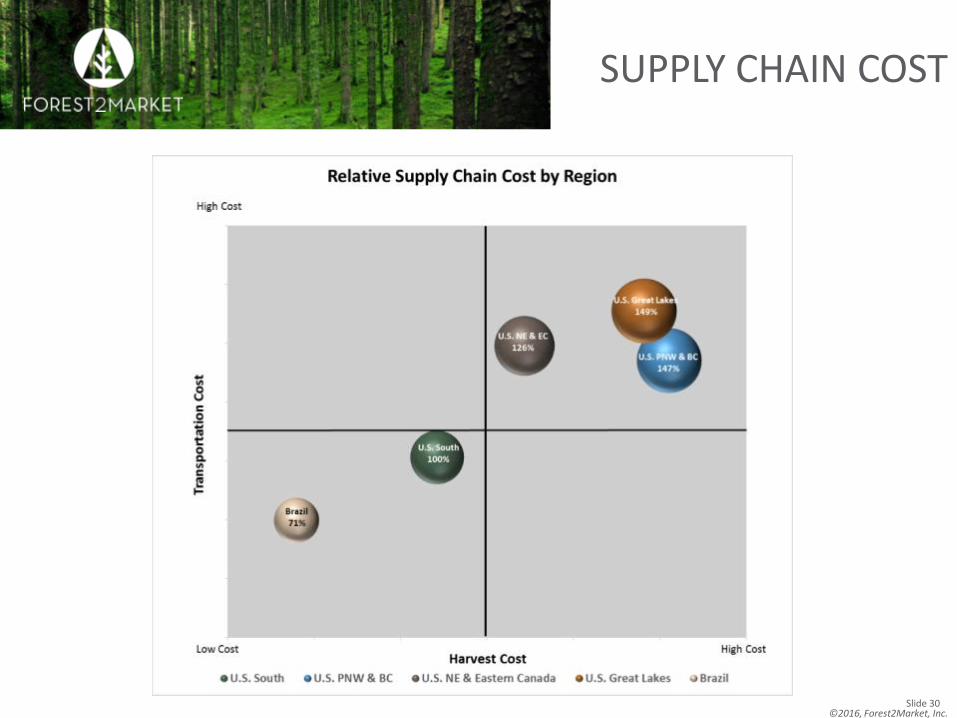
Western Region Pulp/chips – 90% Logs – 70%
Great Lakes Region Pulp/chips - 75%
US South Pulp/chips – 85% Sawlogs – 75%
Brazil Pinus - 45% Eucaplytus – 35%
Eastern Region Pulp/chips - 70%
©2016, Forest2Market, Inc. Slide 6
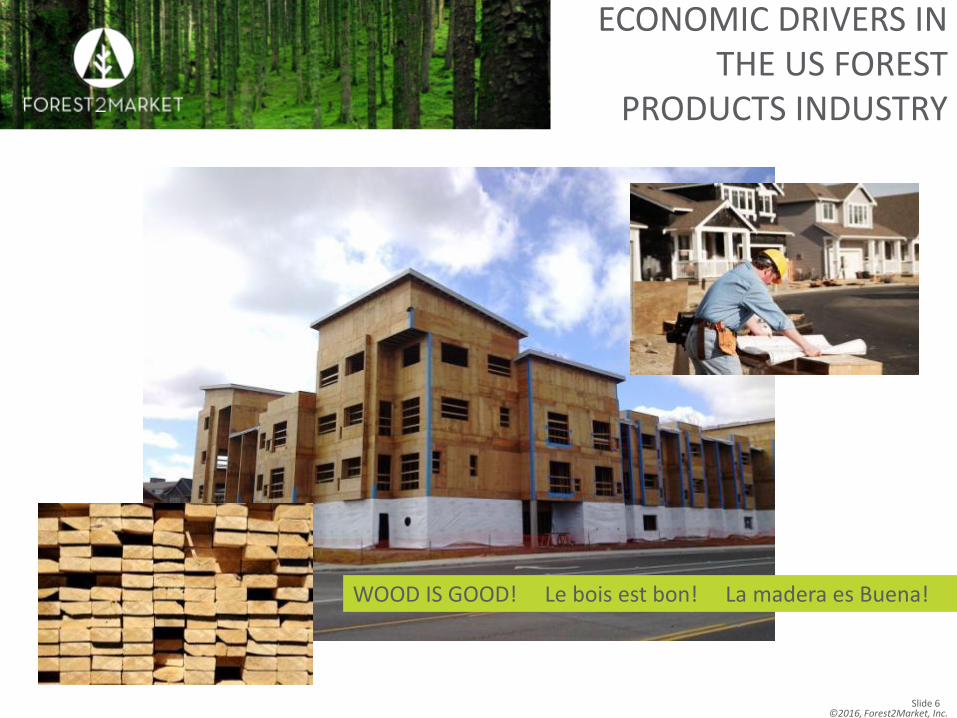
ECONOMIC DRIVERS IN THE US FOREST
PRODUCTS INDUSTRY
WOOD IS GOOD! Le bois est bon! La madera es Buena!

©2016, Forest2Market, Inc. Slide 7
US HOUSING DRIVES NA PRODUCTION — ON THE
RISE BUT BUMPY
Source: US Census & Forest2Market
0
500
1,000
1,500
2,000
2,500
A shallow recession looms due to global economy. Real wage growth is stagnant - part time jobs. Home prices and rents are increasing. Home equity loans from subprime era linger. Conservative outlook.
©2016, Forest2Market, Inc. Slide 8
0
500
1,000
1,500
2,000
2,500
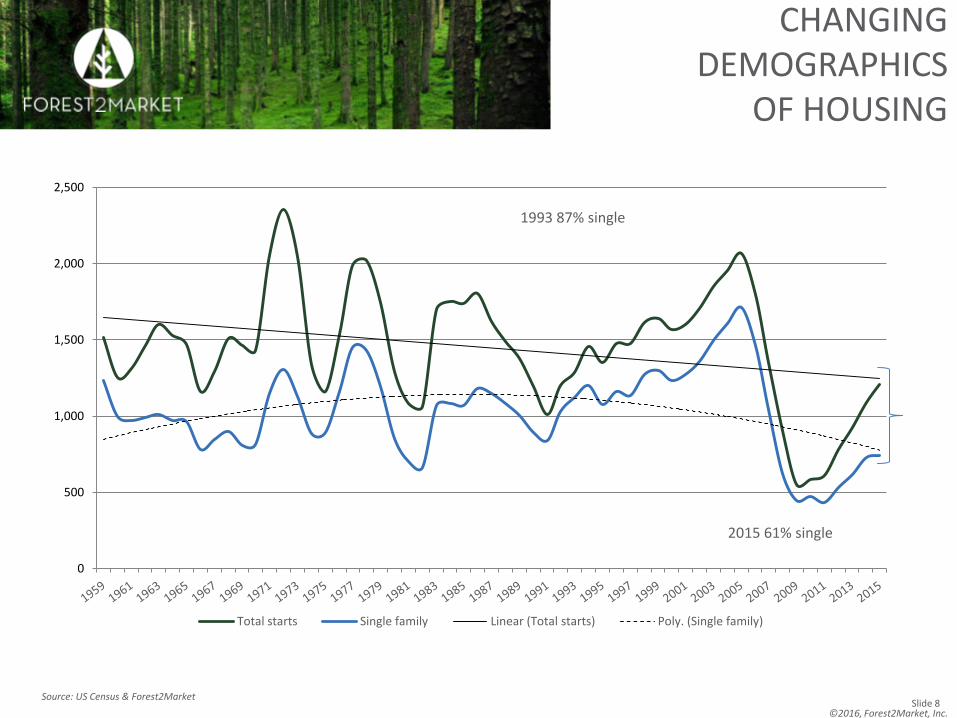
Total starts Single family Linear (Total starts) Poly. (Single family)
CHANGING DEMOGRAPHICS
OF HOUSING
1993 87% single
2015 61% single
Source: US Census & Forest2Market

©2016, Forest2Market, Inc. Slide 9
HOUSING THE MILLENNIALS:
92 MILLION BETWEEN 15-35
• Peak home buying years: 25-45 years
• Marriage (averages)
• 1970: 23 years old
• 2010: 30 years old
• Married and own a home (18-31 years)
• 1968: 56%
• 1981: 43%
• 2012: 23%
• Urban Centric
• 93% want to own their own homes, but the financials may not make sense:
• 41% work full-time
• 50% have less than $5,000 in savings
• Average student loan debt $33,000

©2016, Forest2Market, Inc. Slide 10
WHO’S DRIVING WHAT?

©2016, Forest2Market, Inc. Slide 11
KEY ECONOMIC INDICATORS ARE
IMPROVING
©2016, Forest2Market, Inc. Slide 12
NORTH AMERICAN LUMBER PRODUCTION
TOPICS
©2016, Forest2Market, Inc. Slide 13
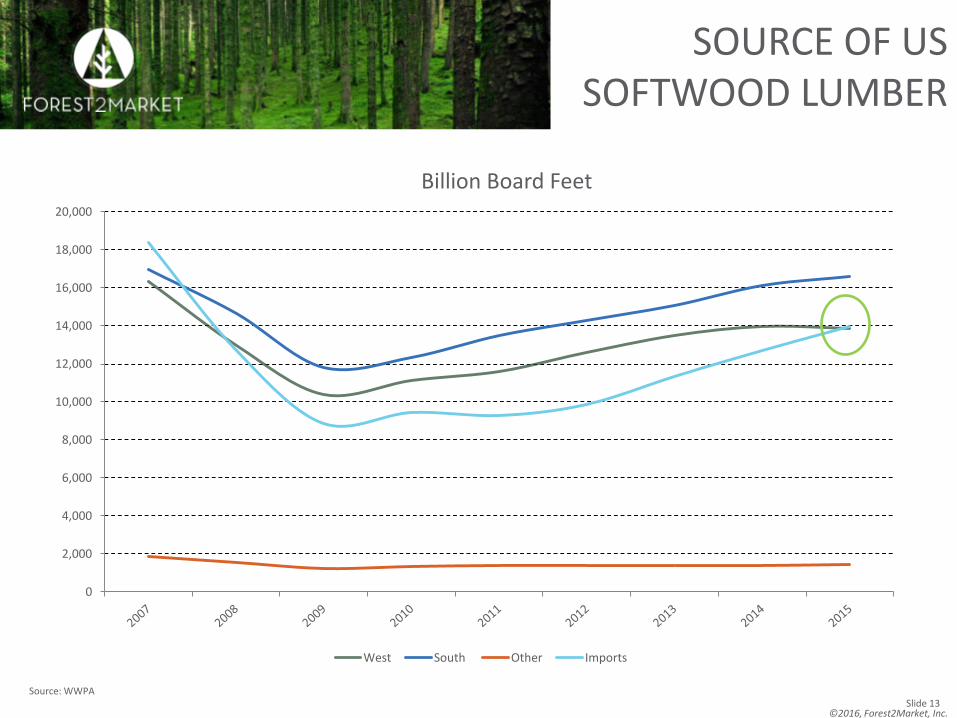
SOURCE OF US SOFTWOOD LUMBER
0
2,000
4,000
6,000
8,000
10,000
12,000
14,000
16,000
18,000
20,000
West South Other Imports
Source: WWPA
Billion Board Feet
©2016, Forest2Market, Inc. Slide 14
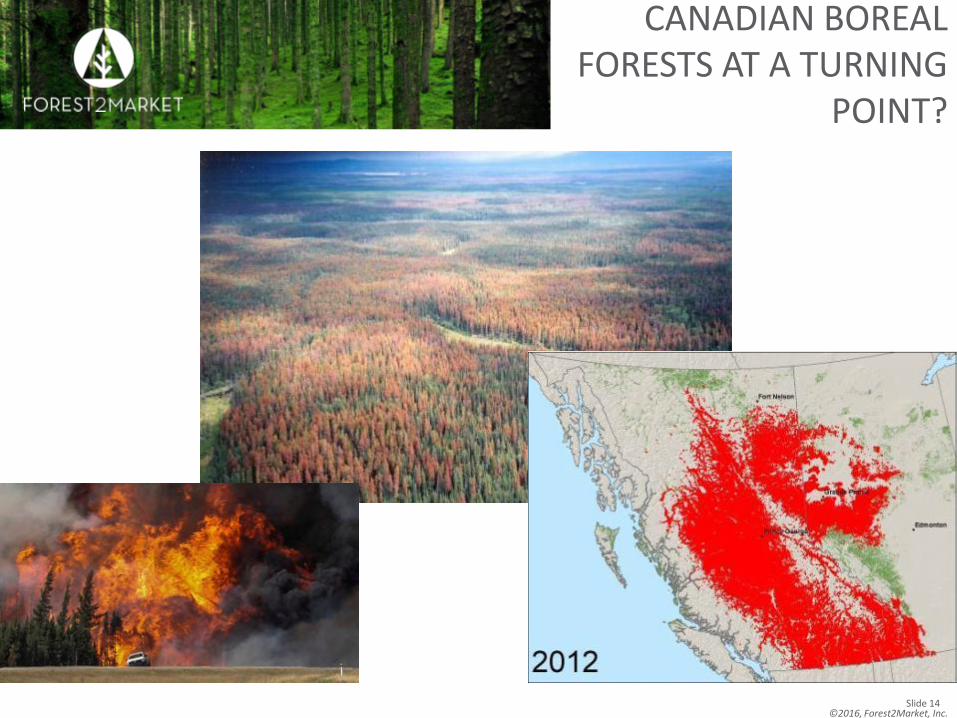
CANADIAN BOREAL FORESTS AT A TURNING
POINT?
©2016, Forest2Market, Inc. Slide 15
0
2000
4000
6000
8000
10000
12000
14000
16000
18000
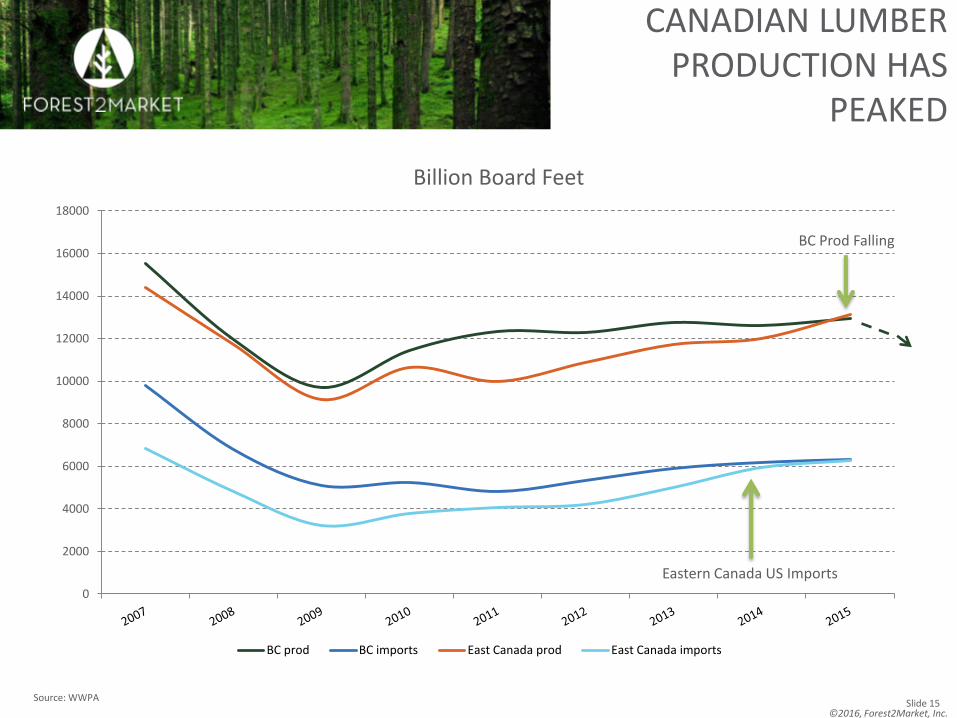
BC prod BC imports East Canada prod East Canada imports
CANADIAN LUMBER PRODUCTION HAS
PEAKED
BC Prod Falling
Eastern Canada US Imports
Source: WWPA
Billion Board Feet
©2016, Forest2Market, Inc. Slide 16
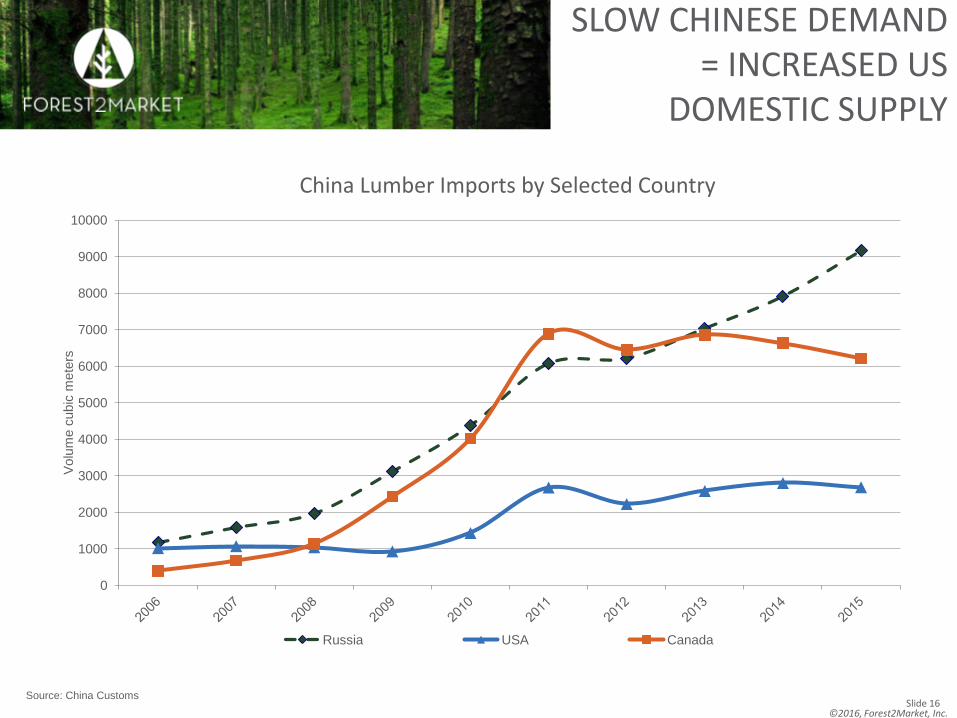
SLOW CHINESE DEMAND = INCREASED US
DOMESTIC SUPPLY
0
1000
2000
3000
4000
5000
6000
7000
8000
9000
10000
Volu
me c
ubic
mete
rs
China Lumber Imports by Selected Country
Russia USA Canada
Source: China Customs

©2016, Forest2Market, Inc. Slide 17
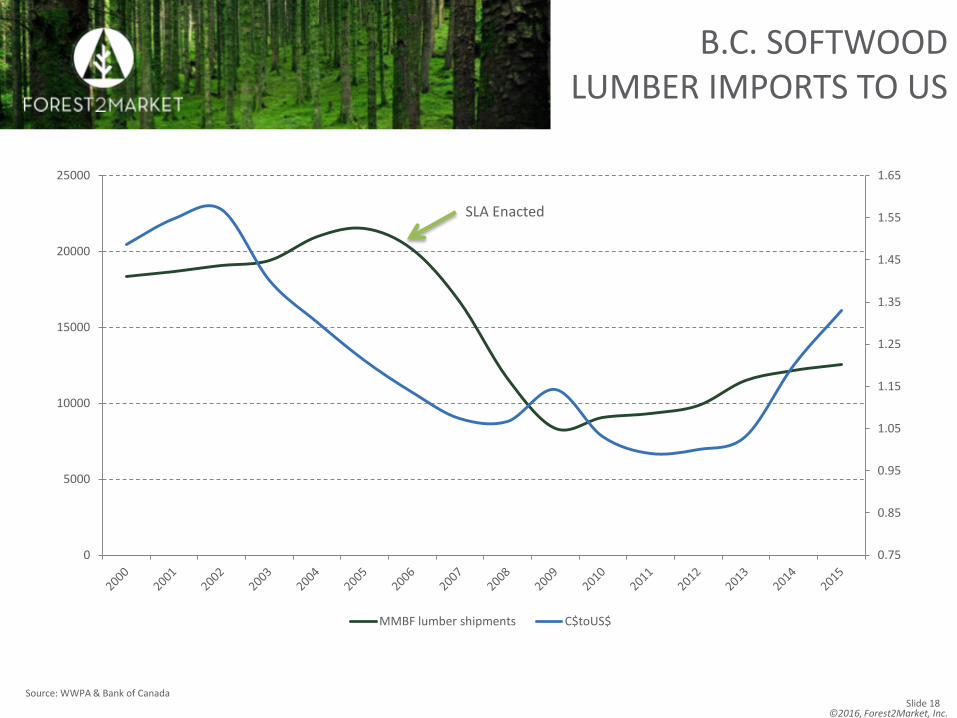
SLA SUMMARY
• Adopted in 2006, the result of a disagreement over whether Canadian stumpage pricing process constituted an unfair subsidy that disadvantaged the US lumber industry.
• SLA expired in October 2015.
• What has changed? Mountain pine beetle infestation in BC, Canadian producers supply China’s demand for wood products, Canadian industry now owns a large stake in US lumber production.
• Strong US $ makes Canadian lumber imports attractive.
• As demand from China falls, US producers have been concerned about a “wall of wood” from across the border. So far in 2016 CDN import volume is up significantly
• Canadian producers see new trade restrictions as an unnecessary intrusion on free trade, an effort to prop up values of US private forests and fear further duties could be retroactive.
• Not much progress since PM Trudeau’s White House visit in April
©2016, Forest2Market, Inc. Slide 18
0.75
0.85
0.95
1.05
1.15
1.25
1.35
1.45
1.55
1.65
0
5000
10000
15000
20000
25000
MMBF lumber shipments C$toUS$
B.C. SOFTWOOD LUMBER IMPORTS TO US
Source: WWPA & Bank of Canada
SLA Enacted
©2016, Forest2Market, Inc. Slide 19
US PACIFIC NORTHWEST EXPORT/DOMESTIC
©2016, Forest2Market, Inc. Slide 20
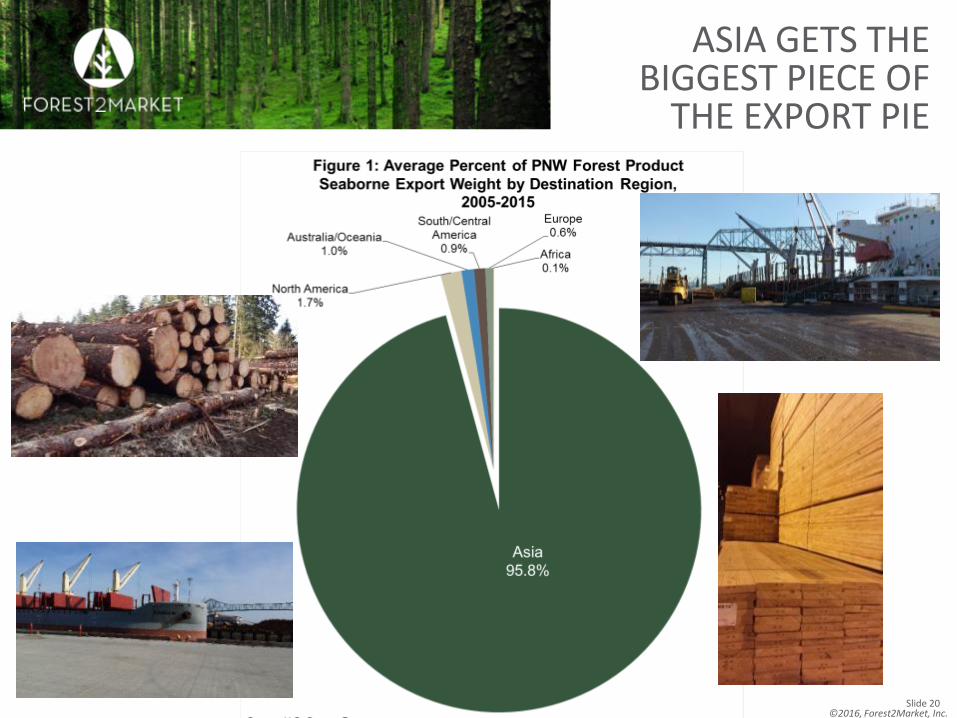
ASIA GETS THE BIGGEST PIECE OF
THE EXPORT PIE
©2016, Forest2Market, Inc. Slide 21
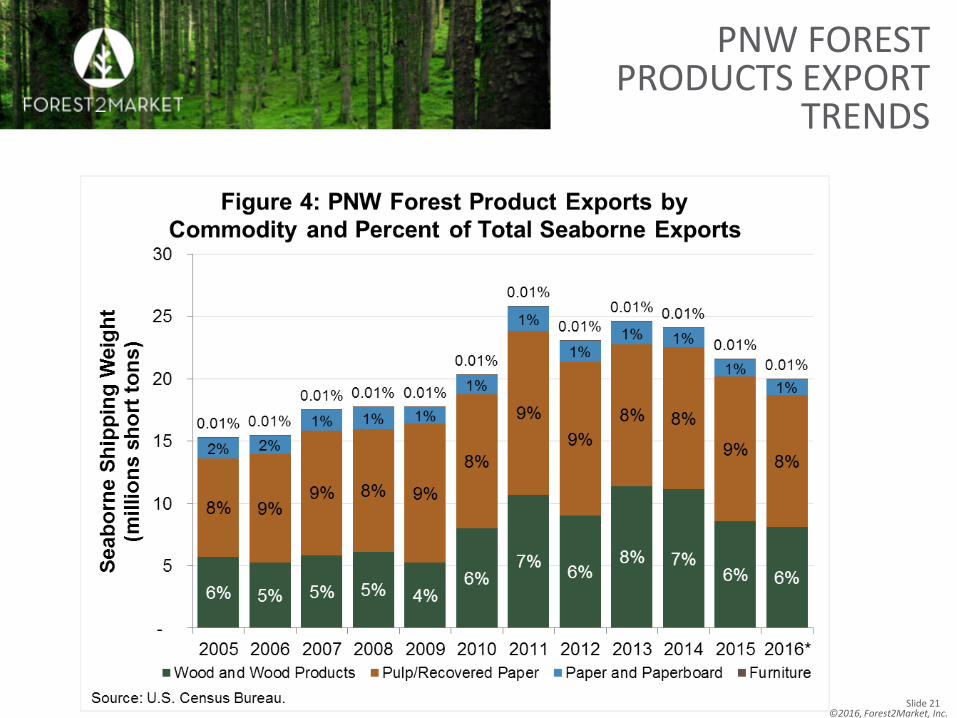
PNW FOREST PRODUCTS EXPORT
TRENDS
©2016, Forest2Market, Inc. Slide 22
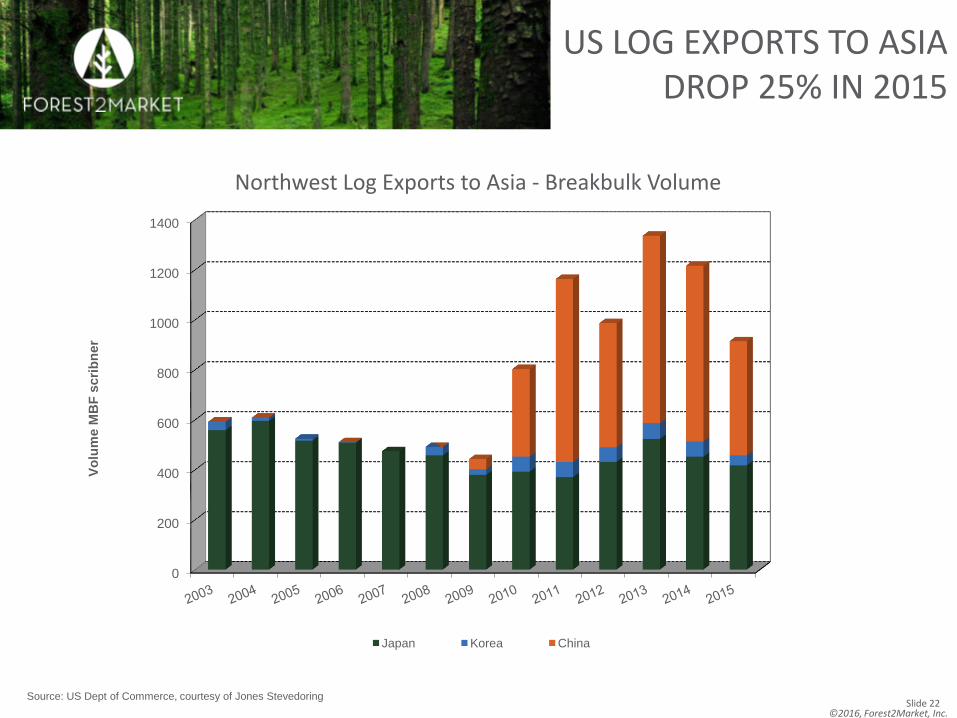
US LOG EXPORTS TO ASIA DROP 25% IN 2015
0
200
400
600
800
1000
1200
1400
Vo
lum
e M
BF
scri
bn
er
Northwest Log Exports to Asia - Breakbulk Volume
Japan Korea China
Source: US Dept of Commerce, courtesy of Jones Stevedoring
©2016, Forest2Market, Inc.
©2016, Forest2Market, Inc. Slide 24
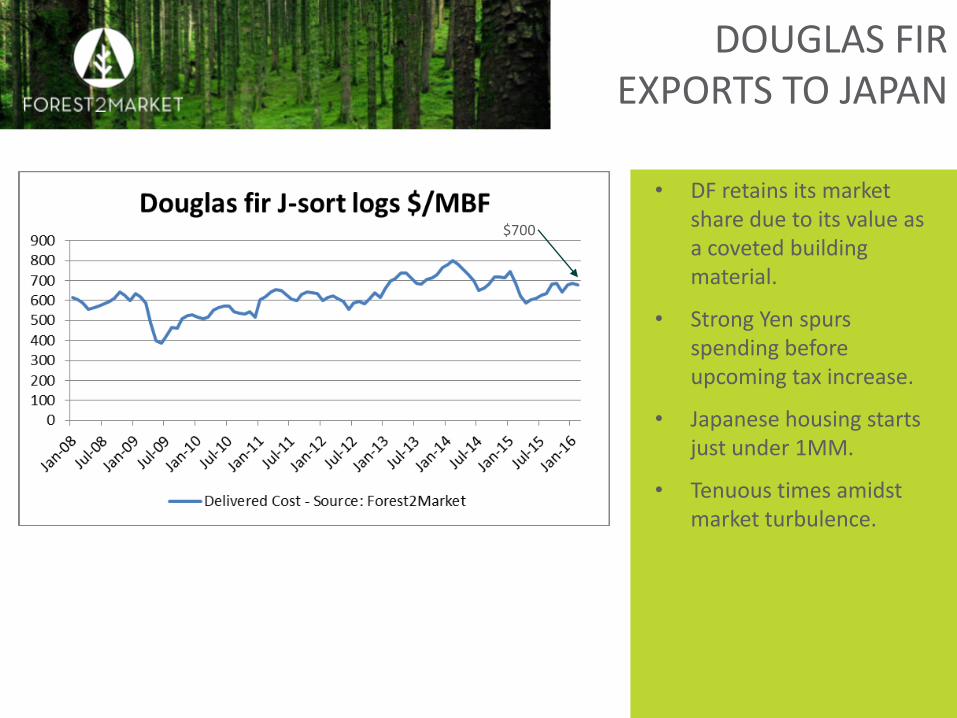
DOUGLAS FIR EXPORTS TO JAPAN
• DF retains its market share due to its value as a coveted building material.
• Strong Yen spurs spending before upcoming tax increase.
• Japanese housing starts just under 1MM.
• Tenuous times amidst market turbulence.
$700
©2016, Forest2Market, Inc. Slide 25
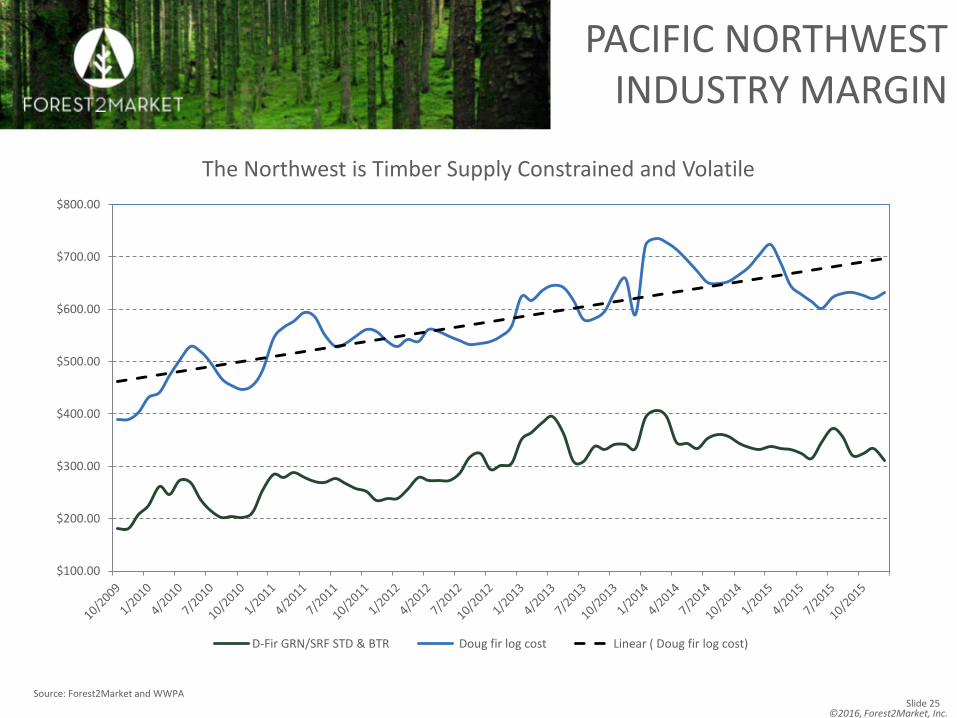
PACIFIC NORTHWEST INDUSTRY MARGIN
$100.00
$200.00
$300.00
$400.00
$500.00
$600.00
$700.00
$800.00
D-Fir GRN/SRF STD & BTR Doug fir log cost Linear ( Doug fir log cost)
Source: Forest2Market and WWPA
The Northwest is Timber Supply Constrained and Volatile
©2016, Forest2Market, Inc. Slide 26
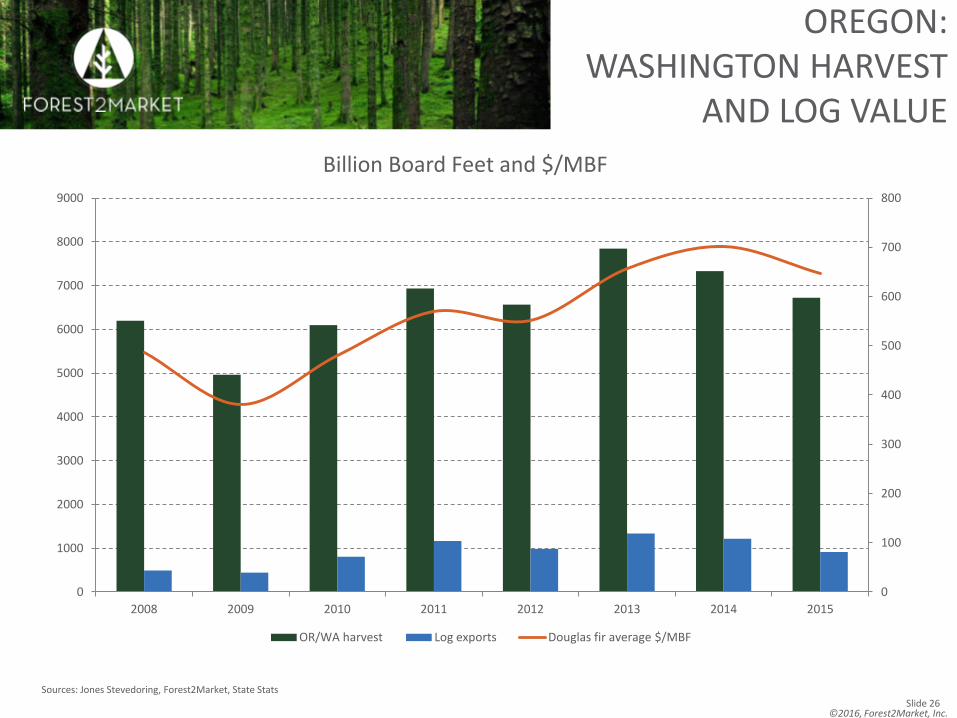
OREGON: WASHINGTON HARVEST
AND LOG VALUE
0
100
200
300
400
500
600
700
800
0
1000
2000
3000
4000
5000
6000
7000
8000
9000
2008 2009 2010 2011 2012 2013 2014 2015
OR/WA harvest Log exports Douglas fir average $/MBF
Billion Board Feet and $/MBF
Sources: Jones Stevedoring, Forest2Market, State Stats
©2016, Forest2Market, Inc. Slide 27
US SOUTHERN PINE MOSTLY A DOMESTIC
INFLUENCE
©2016, Forest2Market, Inc. Slide 28
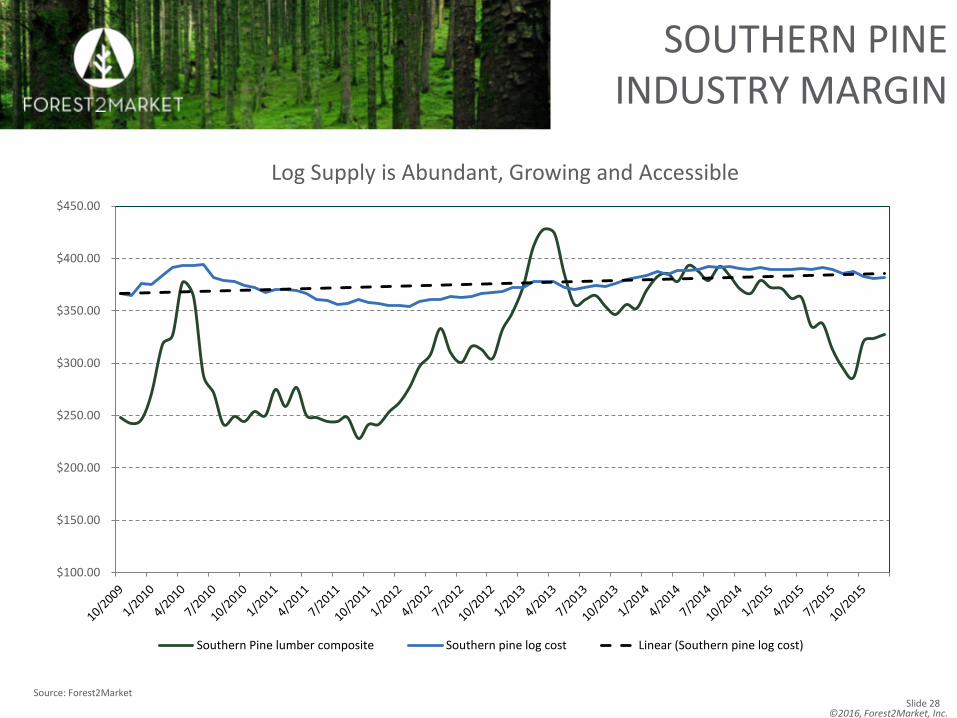
SOUTHERN PINE INDUSTRY MARGIN
$100.00
$150.00
$200.00
$250.00
$300.00
$350.00
$400.00
$450.00
Southern Pine lumber composite Southern pine log cost Linear (Southern pine log cost)
Source: Forest2Market
Log Supply is Abundant, Growing and Accessible
©2016, Forest2Market, Inc. Slide 29
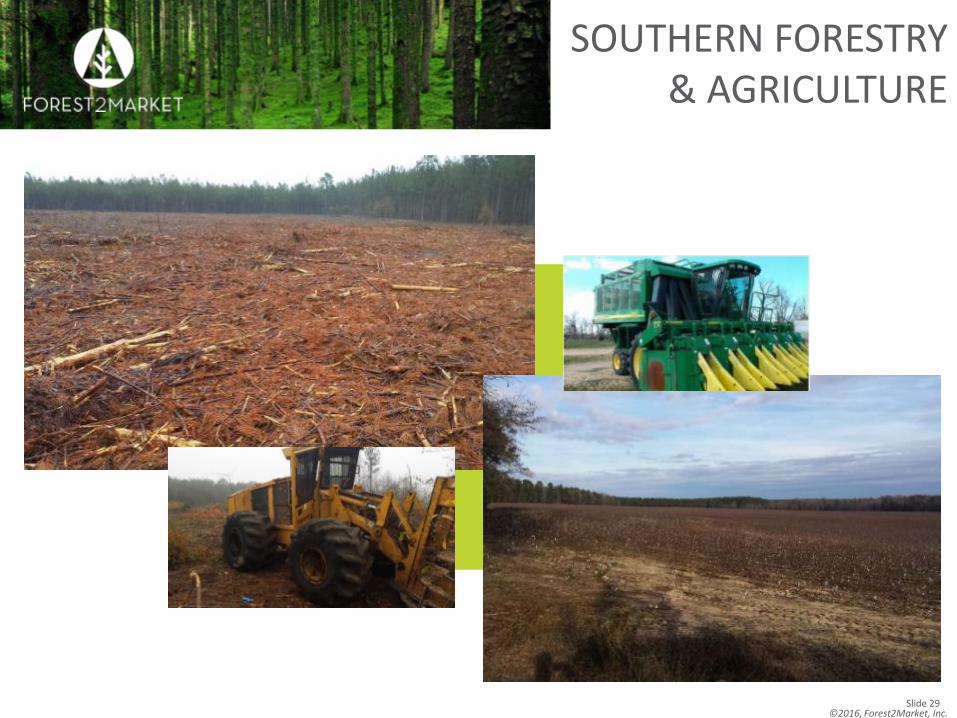
SOUTHERN FORESTRY & AGRICULTURE
©2016, Forest2Market, Inc. Slide 30
SUPPLY CHAIN COST

©2016, Forest2Market, Inc. Slide 31
CANADIAN INVESTMENT IN SOUTHERN PINE
SAWMILLS
$0
$100
$200
$300
$400
$500
$600
$700
$800 Ja
n-0
8
Ap
r-0
8
Jul-
08
Oct
-08
Jan
-09
Ap
r-0
9
Jul-
09
Oct
-09
Jan
-10
Ap
r-1
0
Jul-
10
Oct
-10
Jan
-11
Ap
r-1
1
Jul-
11
Oct
-11
Jan
-12
Ap
r-1
2
Jul-
12
Oct
-12
Jan
-13
Ap
r-1
3
Jul-
13
Oct
-13
Jan
-14
Ap
r-1
4
Jul-
14
Oct
-14
Jan
-15
Ap
r-1
5
Jul-
15
Oct
-15
Jan
-16
DF Westside Domestic SYP MBF Linear (DF Westside Domestic)
Source: Forest2Market
DF to SYP Pricing Volatility
©2016, Forest2Market, Inc. Slide 32
CANADIAN FOREST INDUSTRY MOVES
SOUTH
• The Southern US pine region has abundant, low cost timber from productive, well managed private forests.
• Canfor, West Fraser and Interfor, leading Canadian forest products companies, hedge their bets, moving out of Beetle kill into more lucrative business environment.
• 35 SYP sawmills in Texas, Arkansas, Louisiana, Mississippi, Alabama, Georgia, South Carolina, North Carolina and Florida are now owned by these three companies.
• 4.5 billion board feet of production capacity, mostly framing lumber. Studs remain a NW and Northern product due to strength characteristics.
• Roughly half of 2015’s housing starts were in the South.
©2016, Forest2Market, Inc. Slide 33
PULP & PAPER and… PELLETS?
©2016, Forest2Market, Inc. Slide 34
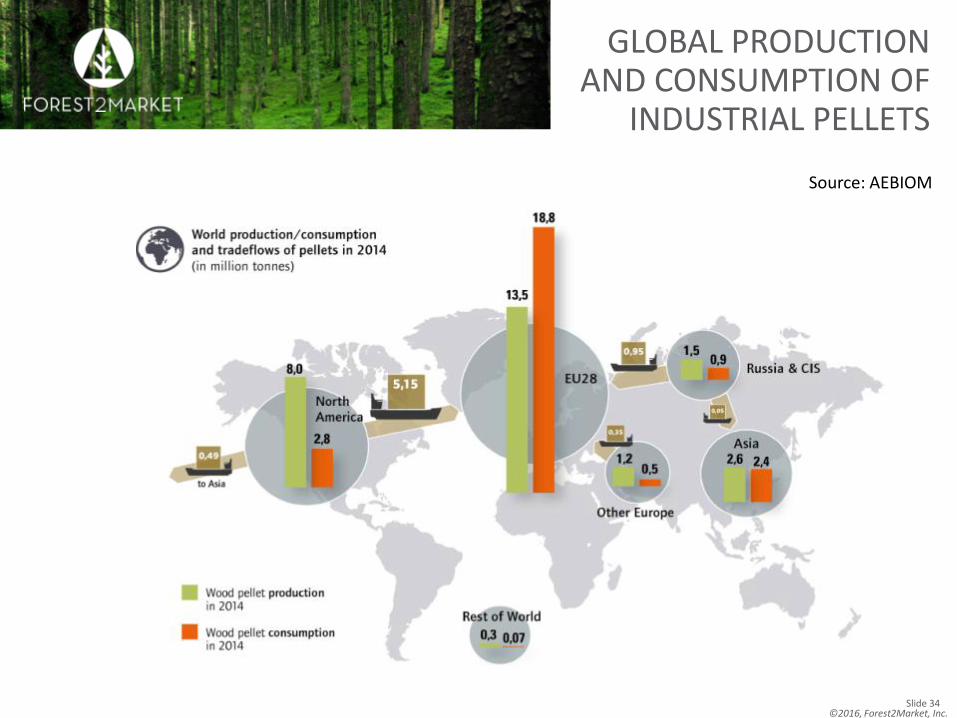
GLOBAL PRODUCTION AND CONSUMPTION OF
INDUSTRIAL PELLETS
Source: AEBIOM
©2016, Forest2Market, Inc. Slide 35
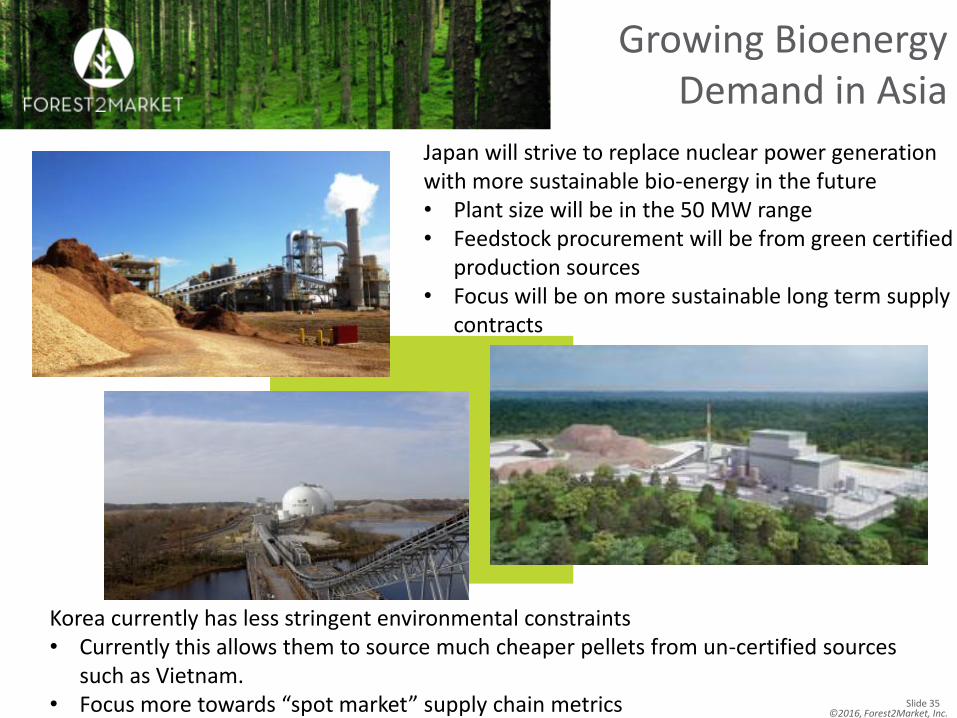
Growing Bioenergy Demand in Asia
Japan will strive to replace nuclear power generation with more sustainable bio-energy in the future • Plant size will be in the 50 MW range • Feedstock procurement will be from green certified
production sources • Focus will be on more sustainable long term supply
contracts
Korea currently has less stringent environmental constraints • Currently this allows them to source much cheaper pellets from un-certified sources
such as Vietnam. • Focus more towards “spot market” supply chain metrics

©2016, Forest2Market, Inc.
©2016, Forest2Market, Inc. Slide 37
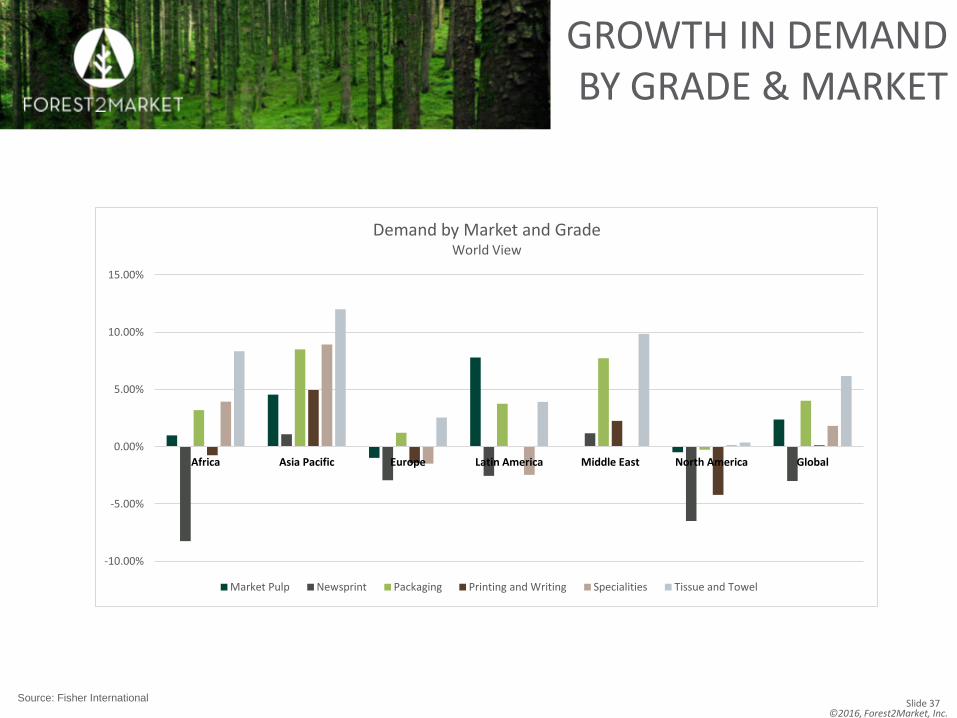
GROWTH IN DEMAND BY GRADE & MARKET
Source: Fisher International
-10.00%
-5.00%
0.00%
5.00%
10.00%
15.00%
Africa Asia Pacific Europe Latin America Middle East North America Global
Demand by Market and Grade World View
Market Pulp Newsprint Packaging Printing and Writing Specialities Tissue and Towel
©2016, Forest2Market, Inc. Slide 38
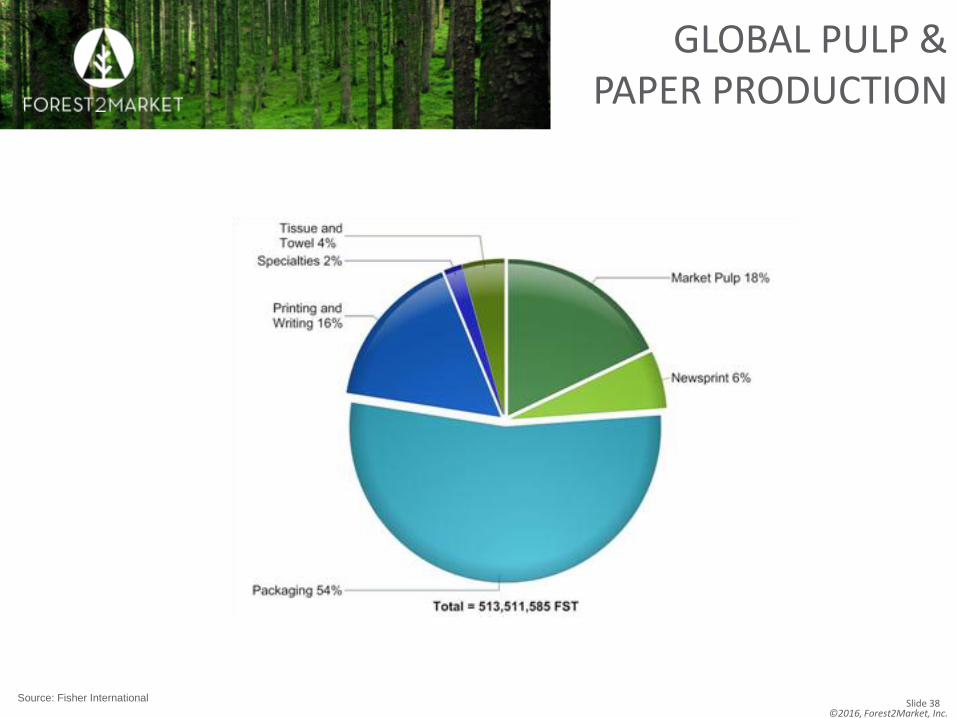
GLOBAL PULP & PAPER PRODUCTION
Source: Fisher International
©2016, Forest2Market, Inc. Slide 39
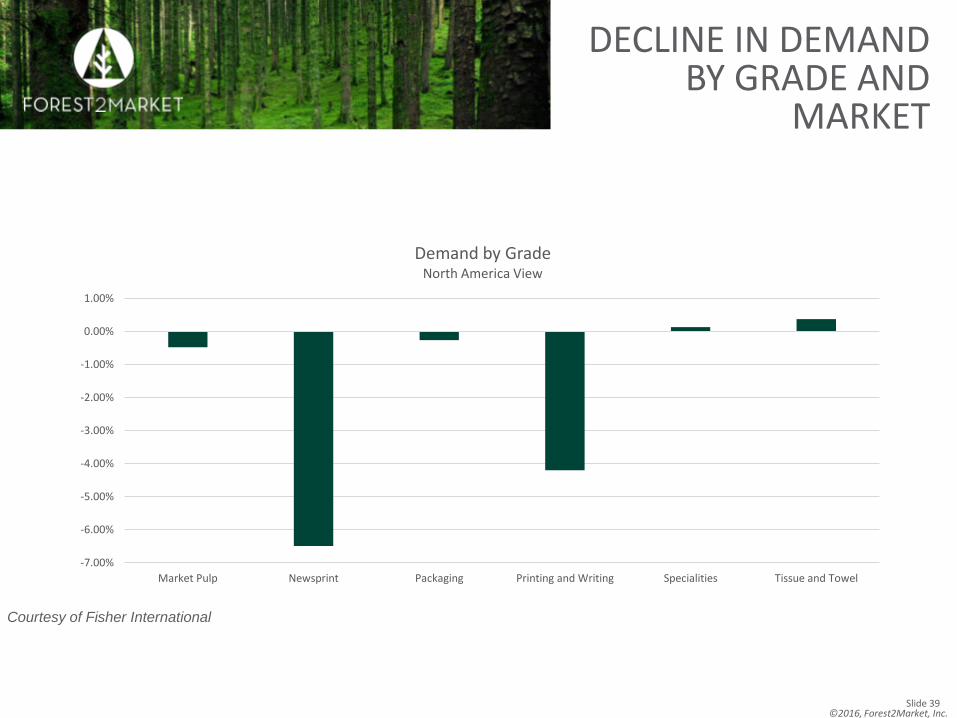
DECLINE IN DEMAND BY GRADE AND
MARKET
-7.00%
-6.00%
-5.00%
-4.00%
-3.00%
-2.00%
-1.00%
0.00%
1.00%
Market Pulp Newsprint Packaging Printing and Writing Specialities Tissue and Towel
Demand by Grade North America View
Courtesy of Fisher International
©2016, Forest2Market, Inc. Slide 40
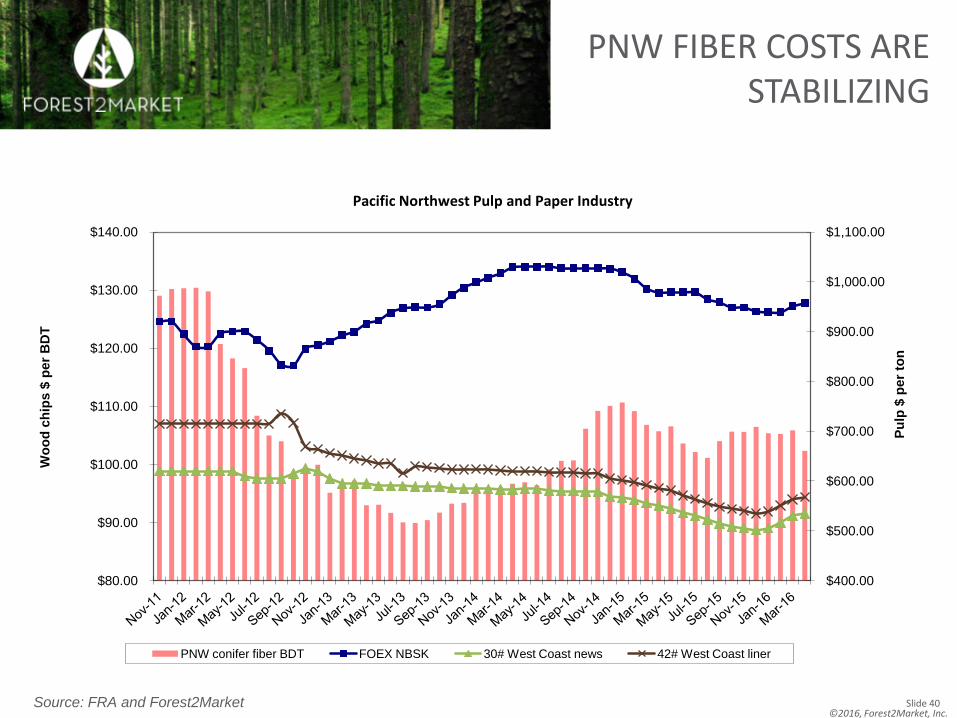
PNW FIBER COSTS ARE STABILIZING
Source: FRA and Forest2Market
$400.00
$500.00
$600.00
$700.00
$800.00
$900.00
$1,000.00
$1,100.00
$80.00
$90.00
$100.00
$110.00
$120.00
$130.00
$140.00
Pu
lp $
per
ton
Wo
od
ch
ips $
per
BD
T
PNW conifer fiber BDT FOEX NBSK 30# West Coast news 42# West Coast liner
Pacific Northwest Pulp and Paper Industry
©2016, Forest2Market, Inc. Slide 41
CONCLUDING THOUGHTS
• Slow but steady recovery for the US housing market
• Low interest rates, cheap fuel and yet a sluggish economy
• Potential for multi-level building with wood will continue
• Watch for additional mill closures and/or consolidation to continue as PNW log supply is constrained
• As British Columbia Interior production and exports decline — opportunity for the PNW-US to fill the gap. In the meantime, lumber will flow from Canada.
• Major growth in the Southern US pine industry underway
• Continuing influence of strong US $ on wood imports and exports
• Less demand for NA wood products in China = more supply and competition into domestic lumber markets
• Western harvest levels flat in near-term though harvests increase as housing and exports increase; fire mitigation efforts will open new fiber supply opportunity
• At the end of the day, the PNW — still the most sought after source of sustainable high quality conifer and hardwood products locally, regionally and globally!!!
©2016, Forest2Market, Inc. Slide 42
Forest2Market: The highest quality wood raw material analysis available
Greg Frohn Manager, PNW Market Sales Hayden Lake, ID +1.360.477.6242 [email protected]
Forest2Market
15720 Brixham Hill Ave
Suite 550
Charlotte, NC 28277
CONTACT