PNSC Annual Report 2015
160
SAILING TOWARDS SUCCESS A N N U A L R E P O R T 2 0 1 5 Pakistan National Shipping Corporation
Transcript of PNSC Annual Report 2015
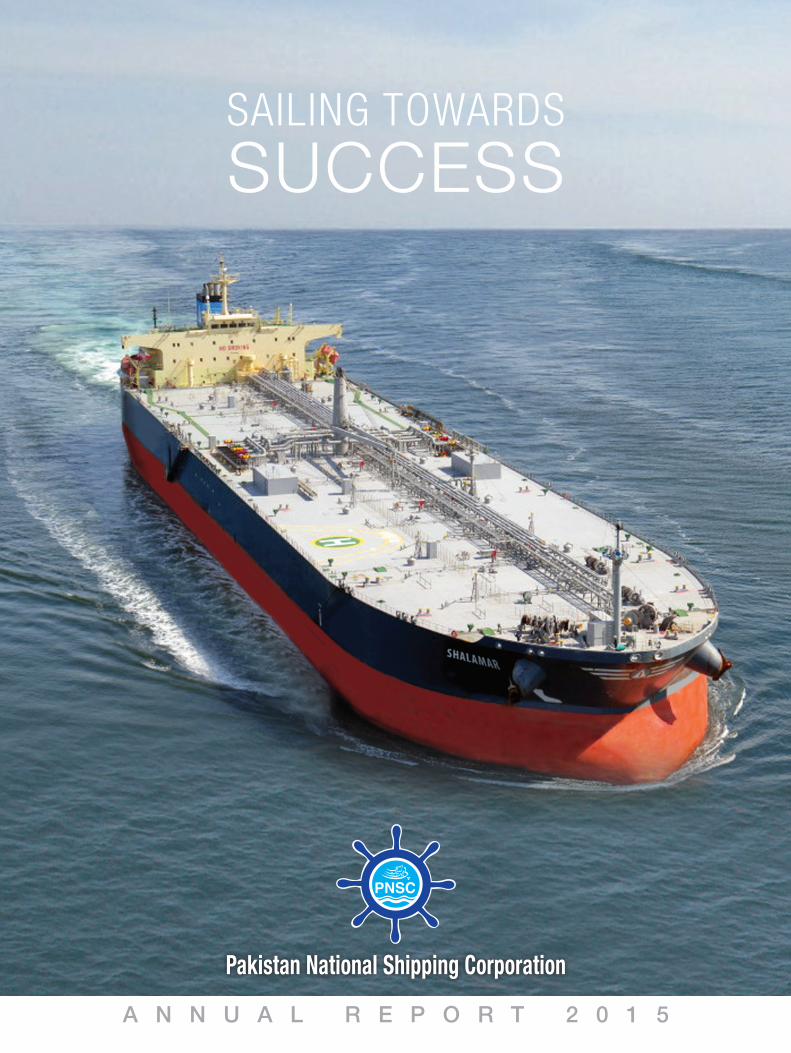
SAILING TOWARDS
SUCCESS
A N N U A L R E P O R T 2 0 1 5
Pakistan National Shipping Corporation

1Annual Report 2015
Contents
Auditors’ Report on Consolidated Accounts 51
Consolidated Report and Accounts of Pakistan National Shipping Corporation Group of Companies 52
Auditors’ Report on Holding Company 102
Report and Accounts of Pakistan National Shipping Corporation (Holding Company) 104
Pattern of Shareholding 151
Categories of Shareholders 152
Notice of Annual General Meeting 153
Proxy Form
Vision & Mission 2
Strategic Objectives 3
Corporate Information 5
Code of Conduct 6
Board of Directors’ Profile 8
PNSC Leadership Team 15
Regulatory Appointments 22
Fleet Strength 23
Directors’ Report 24
Value Added Statement 32
Financial Ratios 33
Graphical Analysis 34
Horizontal Analysis (Group) 38
Vertical Analysis (Group) 40
Six Years At A Glance (PNSC) 43
Auditors’ Review Report on Compliance with The Code of Corporate Governance 44
Statement of Compliance with the Code of Corporate Governance 46
Mission
Vision
To provide reliable & efficient shipping services to overseas and Pakistan’s sea borne trade, maintaining relationship of integrity and trust with our customers, partners, employees, safeguarding interests of our stakeholders and contributing towards betterment of national economy, society and the environment.
To be a prominent player and key stakeholder in global shipping industry by maintaining diversified and efficient marine assets.
2 Pakistan National Shipping Corporation
Strategic Objectives
• Persistentgrowthbystrategicinvestmentanddiversificationinmarinesectorsaccordingtopastperformance and future outlook of industry.
• Tobeoptimallyprofitable,viable,commercialorganizationandcontributetothenationaleconomyby securing a reasonable return on capital and minimize outflow of national foreign reserves.
• EnsuresteadysuppliestoPakistandefenceforcesintimeofpeace&war.
• Todohighlyethical,environmentfriendlyandsociallyresponsiblebusinesspractices.
• EnsuringthateveryemployeefeelsproudofbeingpartofPNSCteam.
• Toprovideitsclientelesafe,secure,reliableandefficientshippingservices.
• Topractice&believeinEqualOpportunityforeveryoneineveryaspectofbusiness.
3Annual Report 2015
4 Pakistan National Shipping Corporation
5Annual Report 2015
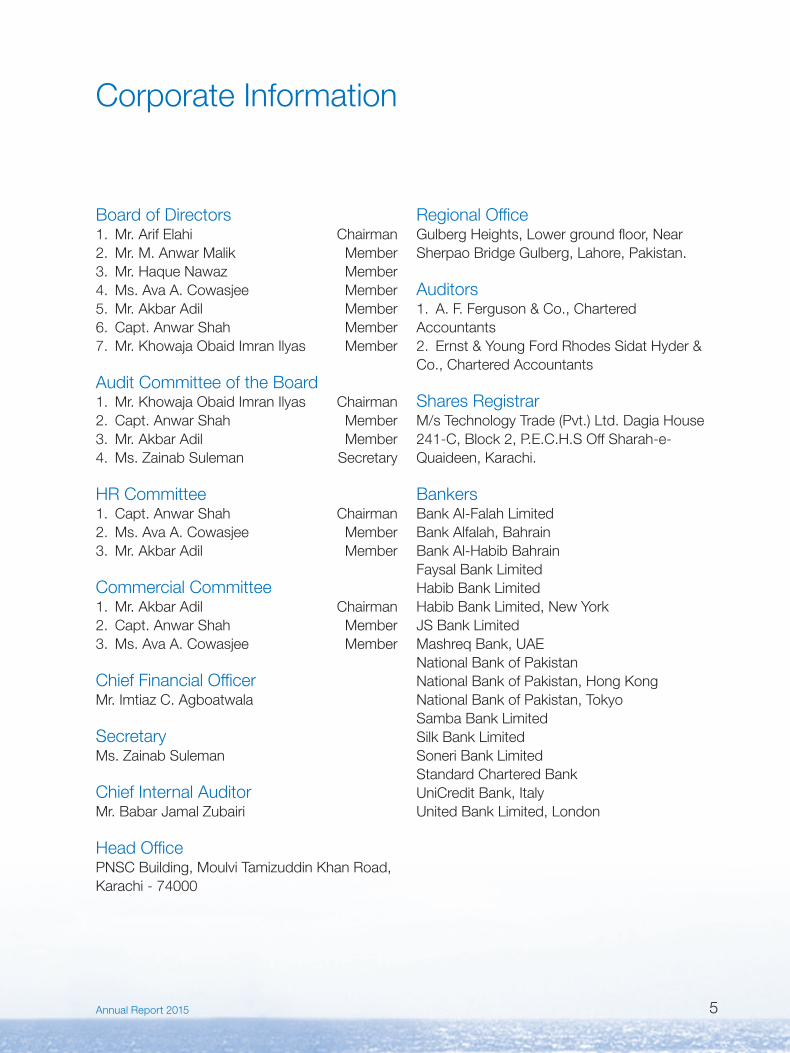
Corporate Information
Board of Directors1. Mr.ArifElahi Chairman2. Mr. M. Anwar Malik Member3. Mr.HaqueNawaz Member4. Ms. Ava A. Cowasjee Member5. Mr. Akbar Adil Member6. Capt. Anwar Shah Member7. Mr. Khowaja Obaid Imran Ilyas Member
Audit Committee of the Board1. Mr. Khowaja Obaid Imran Ilyas Chairman2. Capt. Anwar Shah Member3. Mr. Akbar Adil Member4. Ms. Zainab Suleman Secretary
HR Committee1. Capt. Anwar Shah Chairman2. Ms. Ava A. Cowasjee Member3. Mr. Akbar Adil Member
Commercial Committee1. Mr. Akbar Adil Chairman2. Capt. Anwar Shah Member3. Ms. Ava A. Cowasjee Member
Chief Financial OfficerMr. Imtiaz C. Agboatwala
SecretaryMs. Zainab Suleman
Chief Internal AuditorMr. Babar Jamal Zubairi
Head OfficePNSC Building, Moulvi Tamizuddin Khan Road, Karachi - 74000
Regional Office Gulberg Heights, Lower ground floor, Near Sherpao Bridge Gulberg, Lahore, Pakistan.
Auditors1. A. F. Ferguson & Co., Chartered Accountants 2. Ernst&YoungFordRhodesSidatHyder&Co., Chartered Accountants
Shares RegistrarM/s Technology Trade (Pvt.) Ltd. Dagia House 241-C,Block2,P.E.C.H.SOffSharah-e-Quaideen, Karachi.
BankersBank Al-Falah LimitedBank Alfalah, BahrainBank Al-Habib BahrainFaysal Bank LimitedHabib Bank LimitedHabib Bank Limited, New YorkJS Bank LimitedMashreqBank,UAENational Bank of PakistanNational Bank of Pakistan, Hong KongNational Bank of Pakistan, TokyoSamba Bank LimitedSilk Bank LimitedSoneri Bank LimitedStandard Chartered BankUniCreditBank,ItalyUnitedBankLimited,London
6 Pakistan National Shipping Corporation
Code of Conduct
In Pakistan National Shipping Corporation the Board, senior management and employees are committed to professionalism and understanding of themselves and others regarding accepted standards of the discipline.
Theworkrelatedconductrequiresapersonalcommitmentto act in accordance with the accepted and especially professional standards of conduct and also to encourage such behaviour by employees and colleagues.
Corporation has always emphasized on the Business Ethicsasamatterofpolicy.TheBusinessEthics includethe principles of honesty, integrity, trust- worthiness, loyalty, fairness and justice. The business ethics are rules for conduct which raise awareness of acceptable and unacceptable behaviour. Furthermore, the ethical minds of individual employees significantly contribute to ethical business practices of the Corporation.
It is the duty and responsibilities of directors, senior management and all employees to faithfully follow the BusinessEthicsandcomplywiththepoliciesandpracticesstated in this Code of Conduct. The Corporation’s ultimate goal is to achieve its business objectives for the benefit of all stakeholders including the shareholders and the community at large.
POLICYSTATEMENT
It is the Corporation’s policy to conduct its business operations within the framework of the law and statutory rules and regulations, including the international law governing shipping operations.
The Corporation shall manage its affairs in accordance with concepts of good governance, with a high degree of integrity, transparency and accountability.
The Corporation shall constantly endeavour to formulate policies to ensure business growth, optimize operational efficiencies and profitability, and develop a corporate culture to reward merit and eliminate discrimination in all forms. It is the policy of the Corporation that professionalism is maintained in all recruiting, interviewing and hiring of individuals without regard to race, gender or religion.
There is no direct or indirect discrimination on grounds including, but not limited to race, gender, sex or marital status or religion or language and there is no harassment or victimization based on any of the aforesaid grounds.
DEVELOPMENTOFINTERNALCONTROLSYSTEMS
It is the policy of the Corporation to maintain and update internal control systems, accounting/financial procedure, rules and regulations, in keeping with modern management practices, and ensure due compliance with regulatory requirements.
MAINTENANCEOFPROPERBOOKSOFACCOUNTANDRECORDS
It is the policy of the Corporation to maintain proper books of account and supporting documents in accordance with law and regulatory requirements. No compromises as tothe integrity of financial records or financial statements shall be permitted.
The Corporation shall ensure that all statutory records are properly maintained and that statutory returns are filed strictlyaccordingtotheregulatoryrequirements.
All books of account, supporting documents, and statutory records shall be safeguarded and retained for such periods as may be prescribed by law or by the Corporation.
USE AND SAFEGUARDING OF CONFIDENTIALINFORMATION
All information about the policies and business affairs of the Corporation is confidential. Information received from third parties under obligation of confidentiality belongs to those third parties and is confidential. Such information must not be used or disclosed except as permissible under the relevant agreements.
Employeesshallnotunauthorisedlyremoveanydocumentsor tangible items which belong to the Corporation or which contain any confidential information, from the Corporation’s premises, including vessels.
The responsibility to maintain the confidential nature of all nonpublic information in the Corporation’s possession continues after cessation of employment.
It is the policy of the Corporation to ensure confidentiality of all inside information and do not leak any inside information out of the Corporation and no employee shall derive any personal benefit from such inside information not yet disclosed to the public and to maintain harmony among all co-workers and staff in the Corporation.
7Annual Report 2015
The Corporation has set up an important policy concerning the use of information of the Corporation in compliance with Good Corporate Governance and relevant regulations. The Corporation has advised its directors, senior management and employees to focus on confidential information especially internal information not yet disclosed to public or any data or information that may effect the business of the Corporation or its share price. They must not use information they receive from their directorships or employment for personal benefit or for conducting business or other activities in competition with the Corporation.
POLICYTOWARDSSTAKEHOLDERS
The Corporation recognizes the rights of all stakeholders and therefore encourages cooperation between the Corporation and all the stakeholders including employees, creditors, government agencies, community and society at large.
POLICYONSAFETY,OCCUPATIONALHEALTHANDENVIRONMENT
The Corporation is committed to conducting business with the highest standards of safety, occupational health and environment conditions fully complying with all legislation and regulations relating to safety, occupational health and environmental requirements at all locations in which theCorporation operates.
The Corporation shall follow practices that constantly ensure that its working environment is safe for the protection of property of the Corporation and life of its employees.
The Corporation shall encourage health and safety awareness at all levels and promote procedures and practices that ensure environmental protection taking into account the current legislation and industry codes and practices.
The Corporation shall fully disclose all information regarding its operations and standards in relation to safety, occupational health and environment.
It is the policy of the Corporation to take all necessary measures to protect the health and safety of its employees.
CONFLICTOFINTEREST
The Corporation has set up an important policy on conflict of interest. No directors, officer or employee shall have any financial interest in or be involved in the business activities of a competitor of the Corporation.
ACCEPTANCEORGIVINGOFBRIBES
No employee of the Corporation shall accept or give bribe or any illegal gratification in the conduct of the Corporation’s business.
DISCIPLINEANDGENERALCONDUCT
All employees shall conform to and abide by the rules and regulations of the Corporation, and shall observe, comply with and abide by all orders which may from time to time be given by any person under whose jurisdiction, superintendence or control an employee may for the time being be placed.
The Corporation expects that all directors, officers and employees will understand and adhere to this Code of Conduct.Theyshallberesponsiblefortheconsequencesof any violation. If a violation of law is also implicated, civil or criminal liability may result.
It is expected of all to practice good / ethical behaviour and to pay attention to emerging questions, challenges andstress points positively in their respective capacities.
The purpose of this Code of Conduct is to maintain and promote dignity and reputation of the Corporation and achieveexcellence.Eachemployeeisrequiredtoconducthimself/herself in a proper way, behave lawfully adhering to all laws, rules and regulations which are applicable. Failure to comply with this code or guidance may result in disciplinary action depending on the severity of the misconduct and the Corporation’s disciplinary record.
8 Pakistan National Shipping Corporation
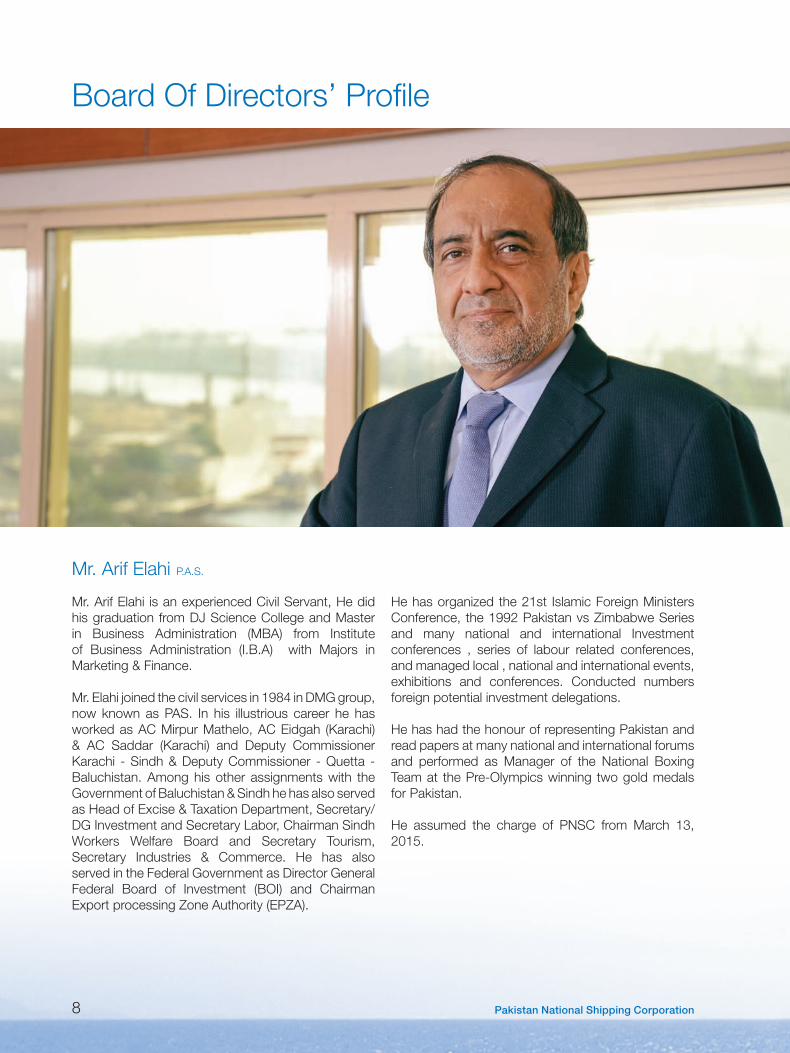
Mr.ArifElahi isanexperiencedCivilServant,Hedidhis graduation from DJ Science College and Master in Business Administration (MBA) from Institute of Business Administration (I.B.A) with Majors in Marketing & Finance.
Mr.Elahijoinedthecivilservicesin1984inDMGgroup,now known as PAS. In his illustrious career he has workedasACMirpurMathelo,ACEidgah (Karachi)& AC Saddar (Karachi) and Deputy Commissioner Karachi - Sindh & Deputy Commissioner - Quetta - Baluchistan. Among his other assignments with the Government of Baluchistan & Sindh he has also served asHeadofExcise&TaxationDepartment,Secretary/DG Investment and Secretary Labor, Chairman Sindh Workers Welfare Board and Secretary Tourism, Secretary Industries & Commerce. He has also served in the Federal Government as Director General Federal Board of Investment (BOI) and Chairman ExportprocessingZoneAuthority(EPZA).
He has organized the 21st Islamic Foreign Ministers Conference,the1992PakistanvsZimbabweSeriesand many national and international Investment conferences , series of labour related conferences, and managed local , national and international events, exhibitions and conferences. Conducted numbers foreign potential investment delegations.
He has had the honour of representing Pakistan and read papers at many national and international forums and performed as Manager of the National Boxing Team at the Pre-Olympics winning two gold medals for Pakistan. He assumed the charge of PNSC from March 13, 2015.
Board Of Directors’ Profile
Mr.ArifElahi P.A.S.
9Annual Report 2015
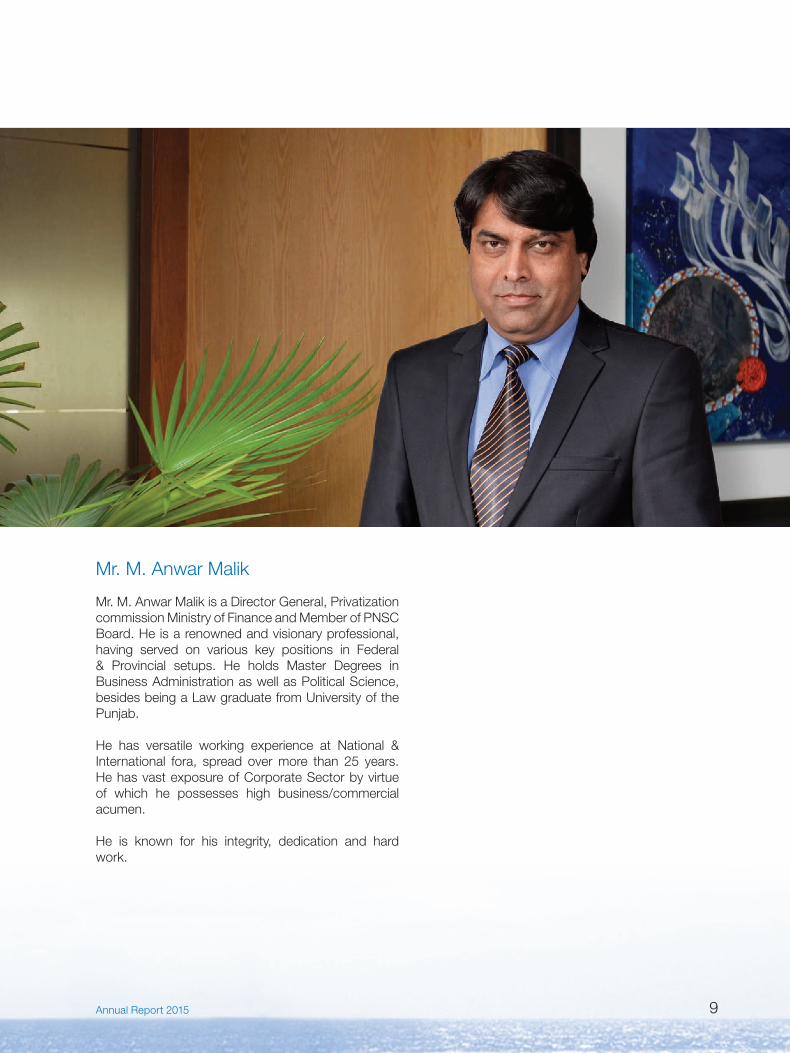
Mr. M. Anwar Malik is a Director General, Privatization commission Ministry of Finance and Member of PNSC Board. He is a renowned and visionary professional, having served on various key positions in Federal & Provincial setups. He holds Master Degrees in Business Administration as well as Political Science, besidesbeingaLawgraduatefromUniversityofthePunjab.
He has versatile working experience at National & International fora, spread over more than 25 years. He has vast exposure of Corporate Sector by virtue of which he possesses high business/commercial acumen.
He is known for his integrity, dedication and hard work.
Mr. M. Anwar Malik
10 Pakistan National Shipping Corporation
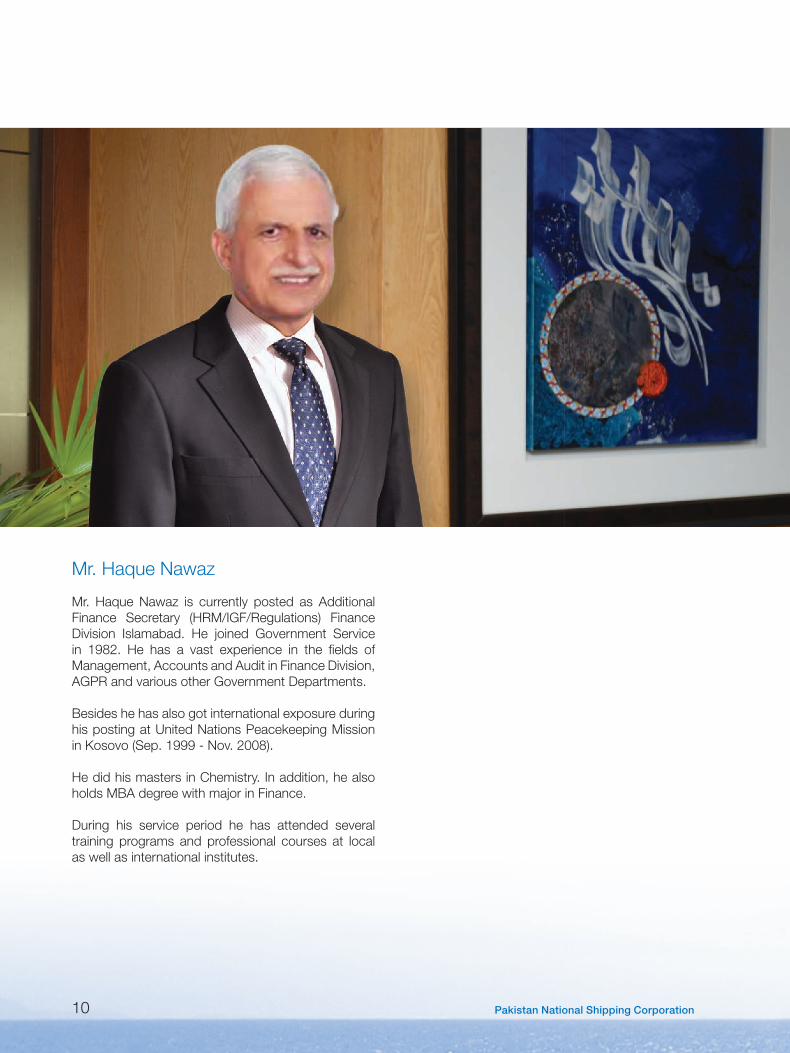
Mr. HaqueNawaz is currently posted as AdditionalFinance Secretary (HRM/IGF/Regulations) Finance Division Islamabad. He joined Government Service in 1982. He has a vast experience in the fields ofManagement, Accounts and Audit in Finance Division, AGPR and various other Government Departments.
Besides he has also got international exposure during hispostingatUnitedNationsPeacekeepingMissioninKosovo(Sep.1999-Nov.2008).
He did his masters in Chemistry. In addition, he also holds MBA degree with major in Finance.
During his service period he has attended several training programs and professional courses at local as well as international institutes.
Mr.HaqueNawaz
11Annual Report 2015
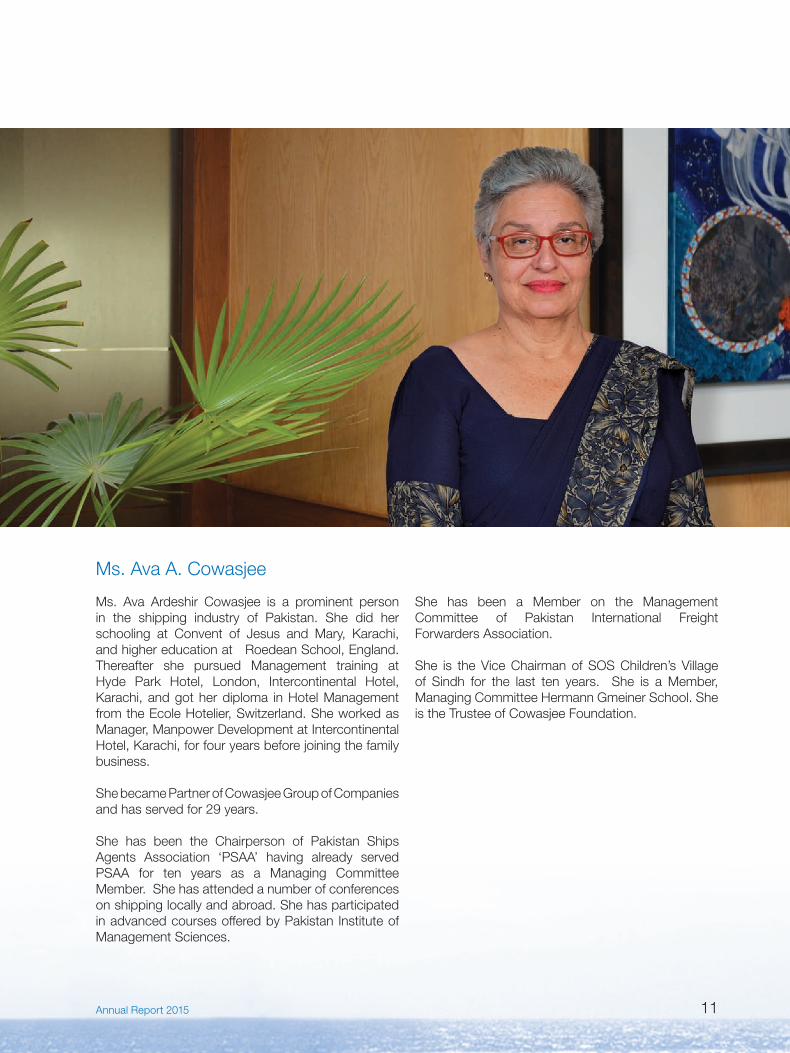
Ms. Ava Ardeshir Cowasjee is a prominent person in the shipping industry of Pakistan. She did her schooling at Convent of Jesus and Mary, Karachi, andhighereducationatRoedeanSchool,England.Thereafter she pursued Management training at Hyde Park Hotel, London, Intercontinental Hotel, Karachi, and got her diploma in Hotel Management fromtheEcoleHotelier,Switzerland.SheworkedasManager, Manpower Development at Intercontinental Hotel, Karachi, for four years before joining the family business.
She became Partner of Cowasjee Group of Companies andhasservedfor29years.
She has been the Chairperson of Pakistan Ships Agents Association ‘PSAA’ having already served PSAA for ten years as a Managing Committee Member. She has attended a number of conferences on shipping locally and abroad. She has participated in advanced courses offered by Pakistan Institute of Management Sciences.
She has been a Member on the Management Committee of Pakistan International Freight Forwarders Association.
She is the Vice Chairman of SOS Children’s Village of Sindh for the last ten years. She is a Member, Managing Committee Hermann Gmeiner School. She is the Trustee of Cowasjee Foundation.
Ms. Ava A. Cowasjee
12 Pakistan National Shipping Corporation
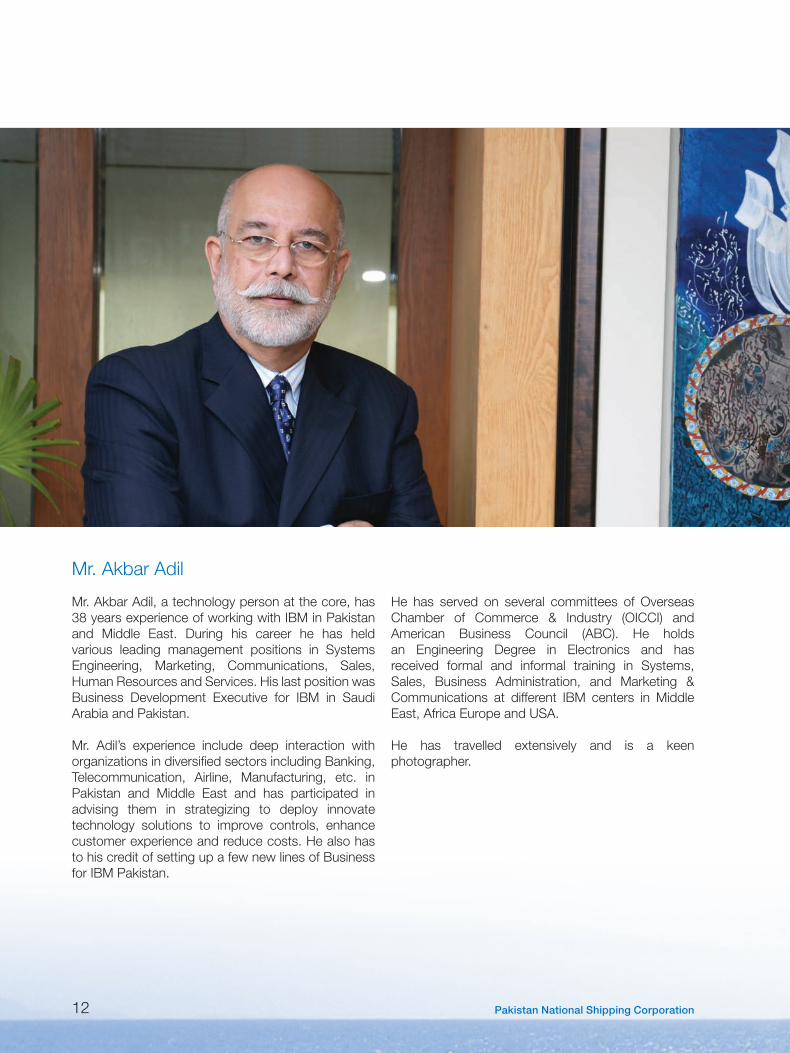
Mr. Akbar Adil, a technology person at the core, has 38 years experience of working with IBM in Pakistan and Middle East. During his career he has heldvarious leading management positions in Systems Engineering, Marketing, Communications, Sales,Human Resources and Services. His last position was Business Development Executive for IBM in SaudiArabia and Pakistan.
Mr. Adil’s experience include deep interaction with organizations in diversified sectors including Banking, Telecommunication, Airline, Manufacturing, etc. in Pakistan and Middle East and has participated inadvising them in strategizing to deploy innovate technology solutions to improve controls, enhance customer experience and reduce costs. He also has to his credit of setting up a few new lines of Business for IBM Pakistan.
He has served on several committees of Overseas Chamber of Commerce & Industry (OICCI) and American Business Council (ABC). He holds an Engineering Degree in Electronics and hasreceived formal and informal training in Systems, Sales, Business Administration, and Marketing & Communications at different IBM centers in Middle East,AfricaEuropeandUSA.
He has travelled extensively and is a keen photographer.
Mr. Akbar Adil
13Annual Report 2015
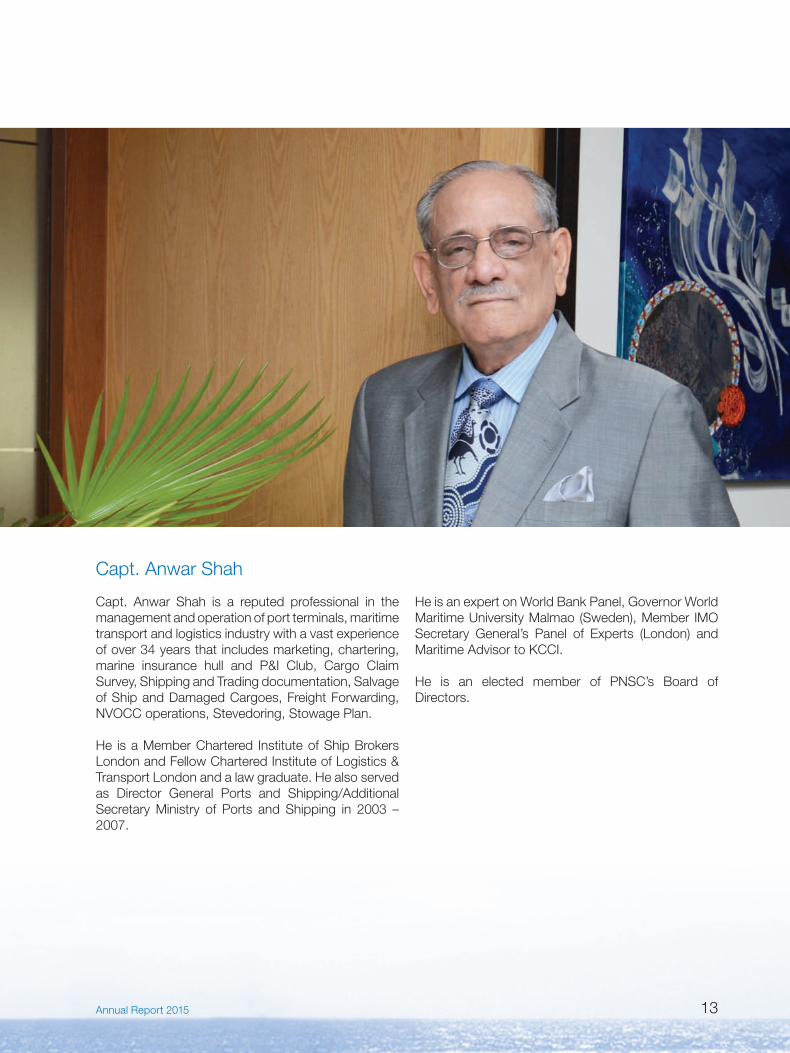
Capt. Anwar Shah is a reputed professional in the management and operation of port terminals, maritime transport and logistics industry with a vast experience of over 34 years that includes marketing, chartering, marine insurance hull and P&I Club, Cargo Claim Survey, Shipping and Trading documentation, Salvage of Ship and Damaged Cargoes, Freight Forwarding, NVOCC operations, Stevedoring, Stowage Plan.
He is a Member Chartered Institute of Ship Brokers London and Fellow Chartered Institute of Logistics & Transport London and a law graduate. He also served as Director General Ports and Shipping/Additional Secretary Ministry of Ports and Shipping in 2003 – 2007.
He is an expert on World Bank Panel, Governor World MaritimeUniversityMalmao(Sweden),Member IMOSecretary General’s Panel of Experts (London) andMaritime Advisor to KCCI.
He is an elected member of PNSC’s Board of Directors.
Capt. Anwar Shah
14 Pakistan National Shipping Corporation
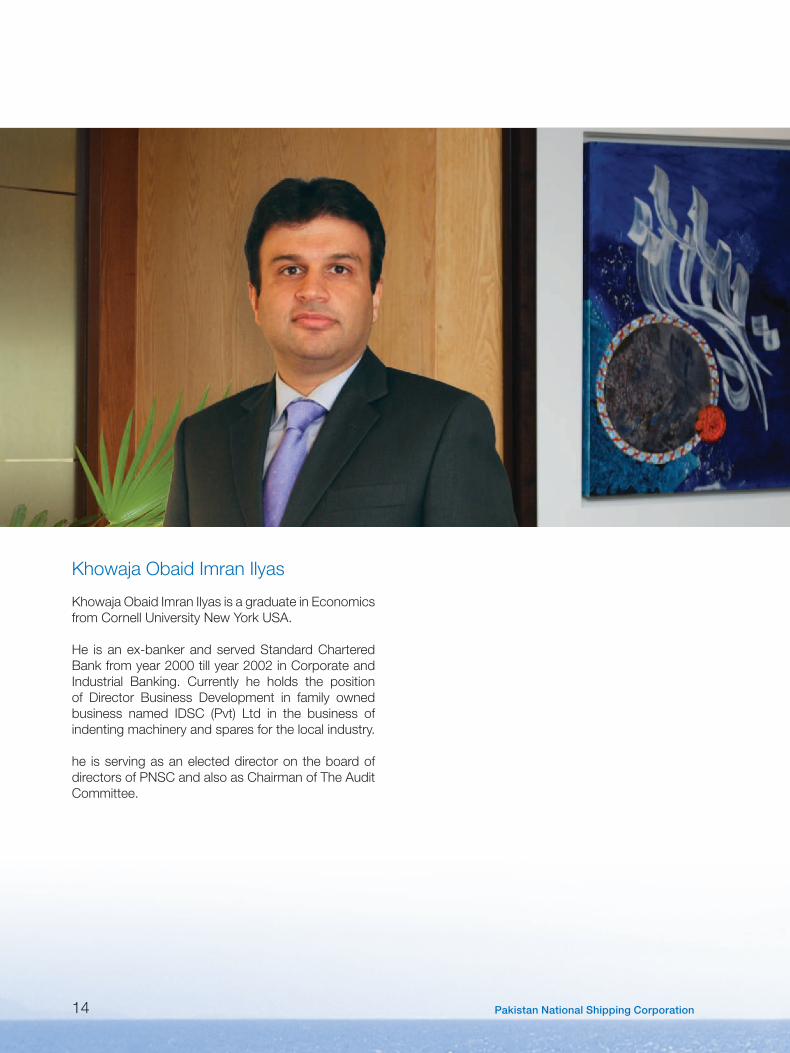
KhowajaObaidImranIlyasisagraduateinEconomicsfromCornellUniversityNewYorkUSA.
He is an ex-banker and served Standard Chartered Bank from year 2000 till year 2002 in Corporate and Industrial Banking. Currently he holds the position of Director Business Development in family owned business named IDSC (Pvt) Ltd in the business of indenting machinery and spares for the local industry.
he is serving as an elected director on the board of directors of PNSC and also as Chairman of The Audit Committee.
Khowaja Obaid Imran Ilyas
15Annual Report 2015
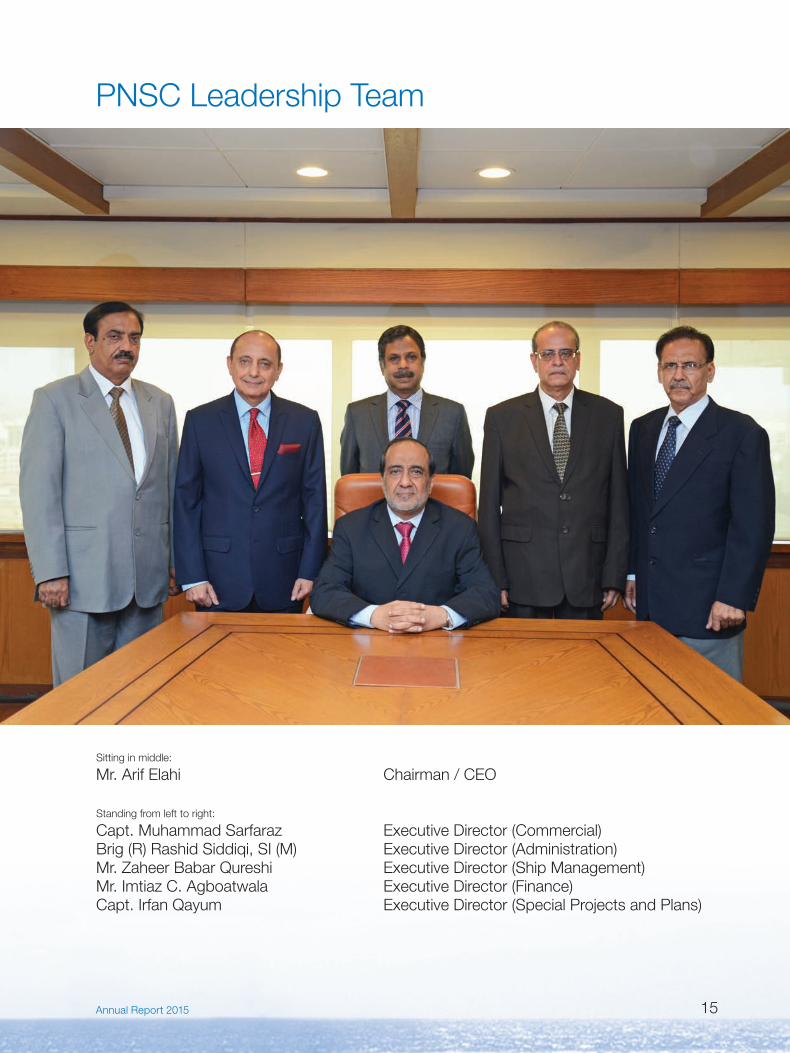
PNSC Leadership Team
Sitting in middle:
Mr.ArifElahi Chairman/CEO
Standing from left to right:
Capt.MuhammadSarfaraz ExecutiveDirector(Commercial)Brig(R)RashidSiddiqi,SI(M) ExecutiveDirector(Administration)Mr.ZaheerBabarQureshi ExecutiveDirector(ShipManagement)Mr.ImtiazC.Agboatwala ExecutiveDirector(Finance)Capt.IrfanQayum ExecutiveDirector(SpecialProjectsandPlans)

16 Pakistan National Shipping Corporation
Mr.ArifElahi isanexperiencedCivilServant,Hedidhis graduation from DJ Science College and Master in Business Administration (MBA) from Institute of Business Administration (I.B.A) with Majors in Marketing & Finance.
Mr.Elahijoinedthecivilservicesin1984inDMGgroup,now known as PAS. In his illustrious career he has workedasACMirpurMathelo,ACEidgah (Karachi)& AC Saddar (Karachi) and Deputy Commissioner Karachi– Sindh & Deputy Commissioner - Quetta – Baluchistan. Among his other assignments with the Government of Baluchistan & Sindh he has also served asHeadofExcise&TaxationDepartment,Secretary/DG Investment and Secretary Labor, Chairman Sindh Workers Welfare Board and Secretary Tourism, Secretary Industries & Commerce. He has also served in the Federal Government as Director General Federal Board of Investment (BOI) and Chairman ExportprocessingZoneAuthority(EPZA).
He has organized the 21st Islamic Foreign Ministers Conference,the1992PakistanvsZimbabweSeriesand many national and international Investment conferences , series of labour related conferences, and managed local , national and international events, exhibitions and conferences. Conducted numbers foreign potential investment delegations.
He has had the honour of representing Pakistan and read papers at many national and international forums and performed as Manager of the National Boxing Team at the Pre-Olympics winning two gold medals for Pakistan. He assumed the charge of PNSC from March 13, 2015.
Chairman/CEOMr. Arif Elahi P.A.S.
PNSC Leadership Team
17Annual Report 2015
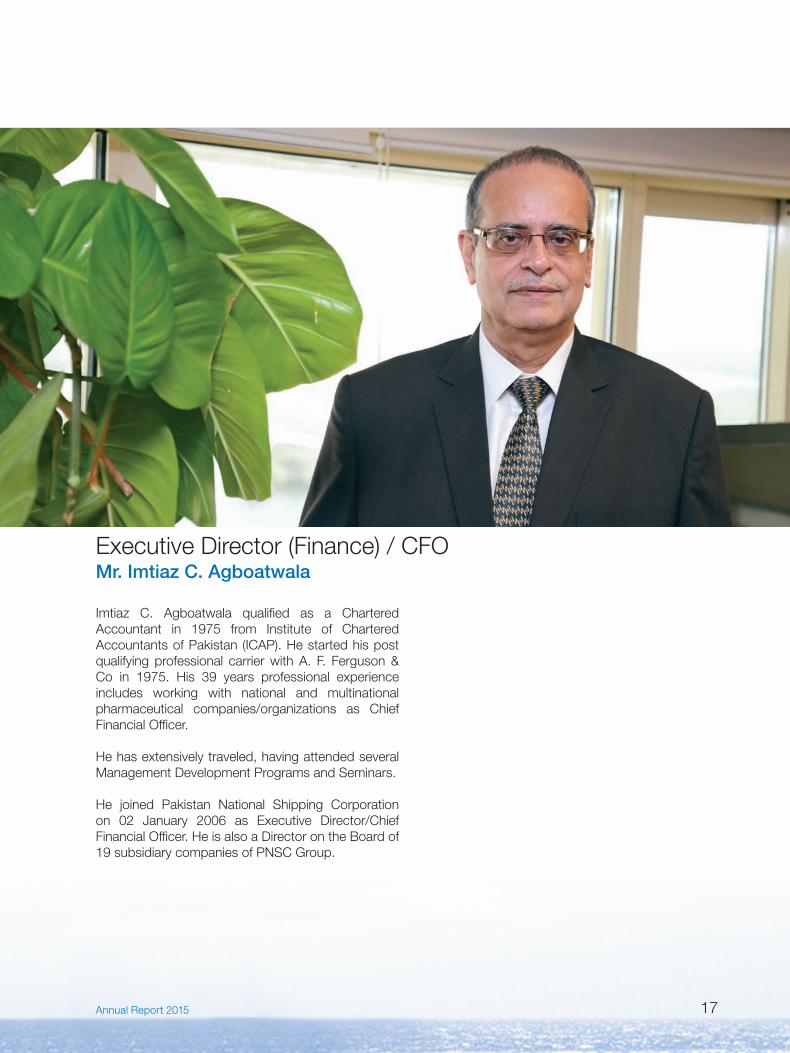
Imtiaz C. Agboatwala qualified as a CharteredAccountant in 1975 from Institute of CharteredAccountants of Pakistan (ICAP). He started his post qualifying professional carrierwithA. F. Ferguson&Co in 1975. His 39 years professional experienceincludes working with national and multinational pharmaceutical companies/organizations as Chief Financial Officer.
He has extensively traveled, having attended several Management Development Programs and Seminars.
He joined Pakistan National Shipping Corporation on 02 January 2006 as Executive Director/ChiefFinancial Officer. He is also a Director on the Board of 19subsidiarycompaniesofPNSCGroup.
ExecutiveDirector(Finance)/CFOMr. Imtiaz C. Agboatwala
18 Pakistan National Shipping Corporation
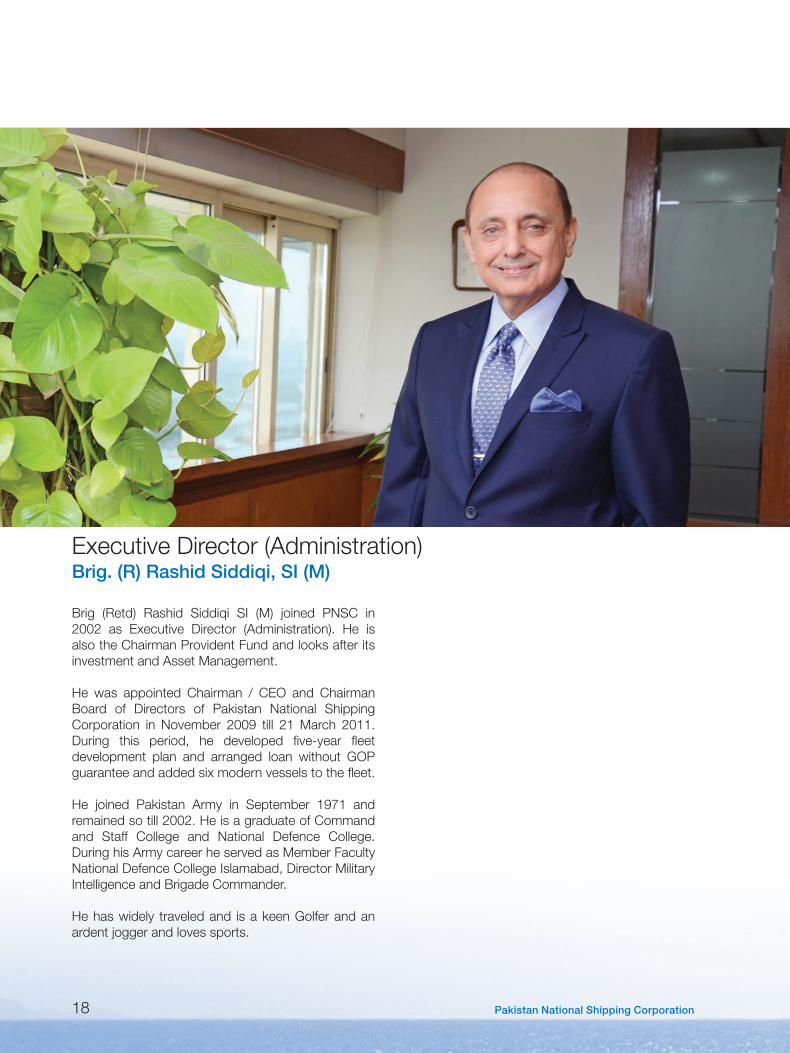
Brig (Retd) Rashid Siddiqi SI (M) joined PNSC in2002 as Executive Director (Administration). He isalso the Chairman Provident Fund and looks after its investment and Asset Management.
He was appointed Chairman / CEO and ChairmanBoard of Directors of Pakistan National Shipping Corporation in November 2009 till 21March 2011.During this period, he developed five-year fleet development plan and arranged loan without GOP guarantee and added six modern vessels to the fleet.
He joined Pakistan Army in September 1971 andremained so till 2002. He is a graduate of Command and Staff College and National Defence College. During his Army career he served as Member Faculty National Defence College Islamabad, Director Military Intelligence and Brigade Commander.
He has widely traveled and is a keen Golfer and an ardent jogger and loves sports.
ExecutiveDirector(Administration)Brig. (R) Rashid Siddiqi, SI (M)
19Annual Report 2015
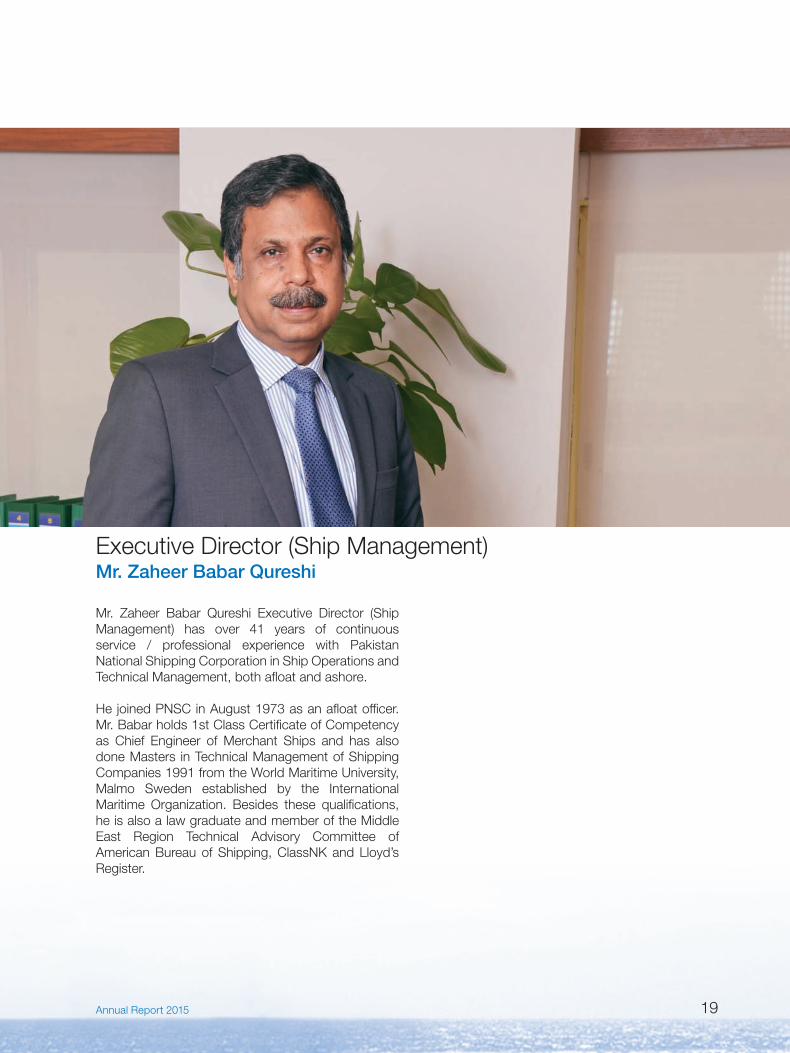
Mr. Zaheer Babar Qureshi Executive Director (ShipManagement) has over 41 years of continuous service / professional experience with Pakistan National Shipping Corporation in Ship Operations and Technical Management, both afloat and ashore.
HejoinedPNSCinAugust1973asanafloatofficer.Mr. Babar holds 1st Class Certificate of Competency as Chief Engineer of Merchant Ships and has alsodone Masters in Technical Management of Shipping Companies1991fromtheWorldMaritimeUniversity,Malmo Sweden established by the International Maritime Organization. Besides these qualifications,he is also a law graduate and member of the Middle East Region Technical Advisory Committee ofAmerican Bureau of Shipping, ClassNK and Lloyd’s Register.
ExecutiveDirector(ShipManagement)Mr. Zaheer Babar Qureshi
20 Pakistan National Shipping Corporation
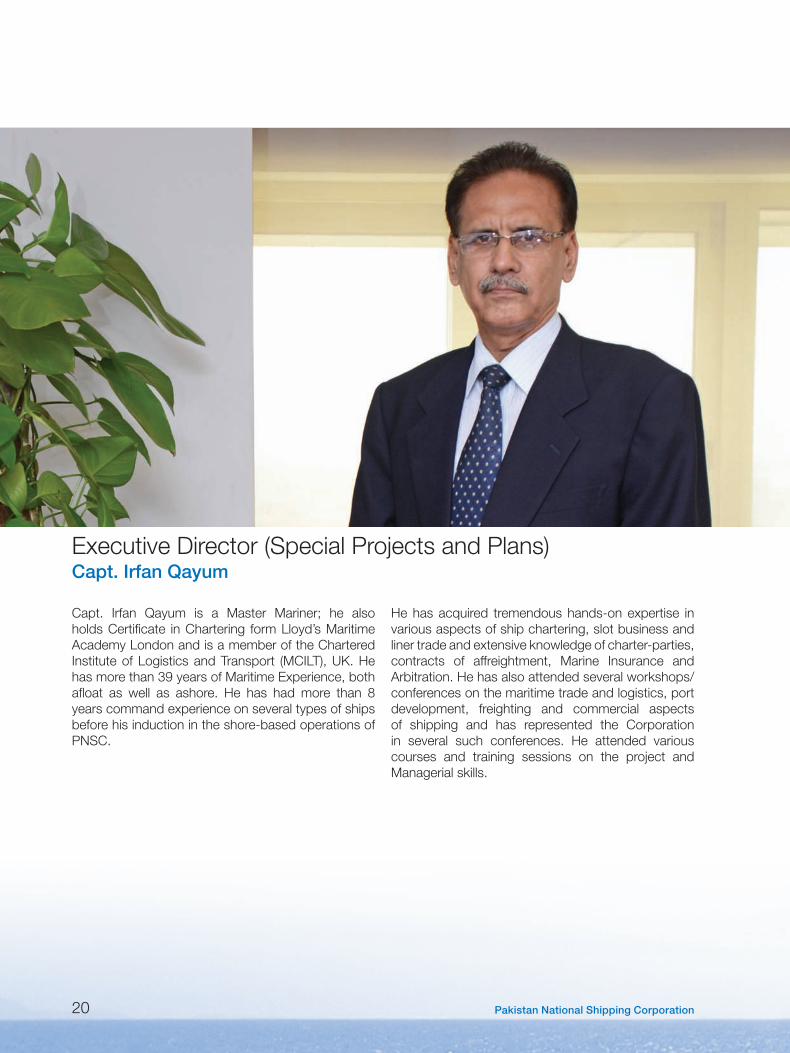
Capt. Irfan Qayum is a Master Mariner; he also holds Certificate in Chartering form Lloyd’s Maritime Academy London and is a member of the Chartered InstituteofLogisticsandTransport (MCILT),UK.Hehasmorethan39yearsofMaritimeExperience,bothafloat as well as ashore. He has had more than 8 years command experience on several types of ships before his induction in the shore-based operations of PNSC.
Hehasacquired tremendoushands-onexpertise invarious aspects of ship chartering, slot business and liner trade and extensive knowledge of charter-parties, contracts of affreightment, Marine Insurance and Arbitration. He has also attended several workshops/ conferences on the maritime trade and logistics, port development, freighting and commercial aspects of shipping and has represented the Corporation in several such conferences. He attended various courses and training sessions on the project and Managerial skills.
ExecutiveDirector(SpecialProjectsandPlans)Capt. Irfan Qayum
21Annual Report 2015
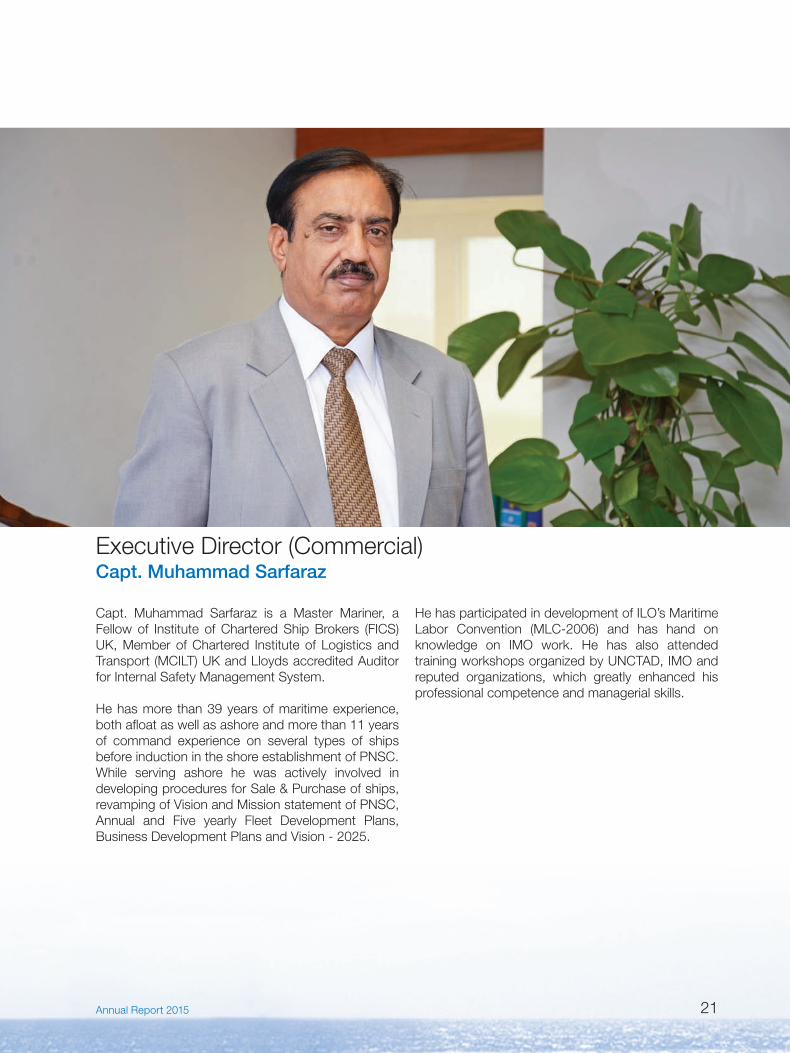
Capt. Muhammad Sarfaraz is a Master Mariner, a Fellow of Institute of Chartered Ship Brokers (FICS) UK,MemberofChartered Instituteof Logistics andTransport(MCILT)UKandLloydsaccreditedAuditorfor Internal Safety Management System. Hehasmore than39yearsofmaritimeexperience,both afloat as well as ashore and more than 11 years of command experience on several types of ships before induction in the shore establishment of PNSC.While serving ashore he was actively involved in developing procedures for Sale & Purchase of ships, revamping of Vision and Mission statement of PNSC, Annual and Five yearly Fleet Development Plans, Business Development Plans and Vision - 2025.
He has participated in development of ILO’s Maritime Labor Convention (MLC-2006) and has hand on knowledge on IMO work. He has also attended trainingworkshopsorganizedbyUNCTAD,IMOandreputed organizations, which greatly enhanced his professional competence and managerial skills.
ExecutiveDirector(Commercial)Capt. Muhammad Sarfaraz

22 Pakistan National Shipping Corporation
Ms. Zainab Suleman, Corporation & Board Secretary, had done her L.L.M. and is enrolled as an Advocate of High Court of Sindh. She is a member of High Court Bar Association. Prior to joining PNSC she was working as an Advocate/Associate in a well reputed firm of Advocates and Solicitors and gained a vast experience on the corporate side. She has also attended a number of workshops and conferences locally and abroad
Corporation & Board SecretaryMs. Zainab Suleman
Syed Jarrar Haider Kazmi is head of Finance Department and Chief Accountant since January 2007. He is associated with PNSC since October 2005. Mr. Jarar is a fellow member of the Institute of Chartered Accountants of Pakistan and the fellow member of Institute of Public Finance Accountants of Pakistanwith post qualification experience ofmorethan 13 years on senior positions in other organizations including Automobile and Pharmaceutical sector etc. Mr. Jarar is also a member of the Public Sector Committee of the Institute of Chartered Accountants of Pakistan.
He has attended various workshops and saminar, internationally and locally.
Chief AccountantSyed Jarar Haider Kazmi
Regulatory Appointments
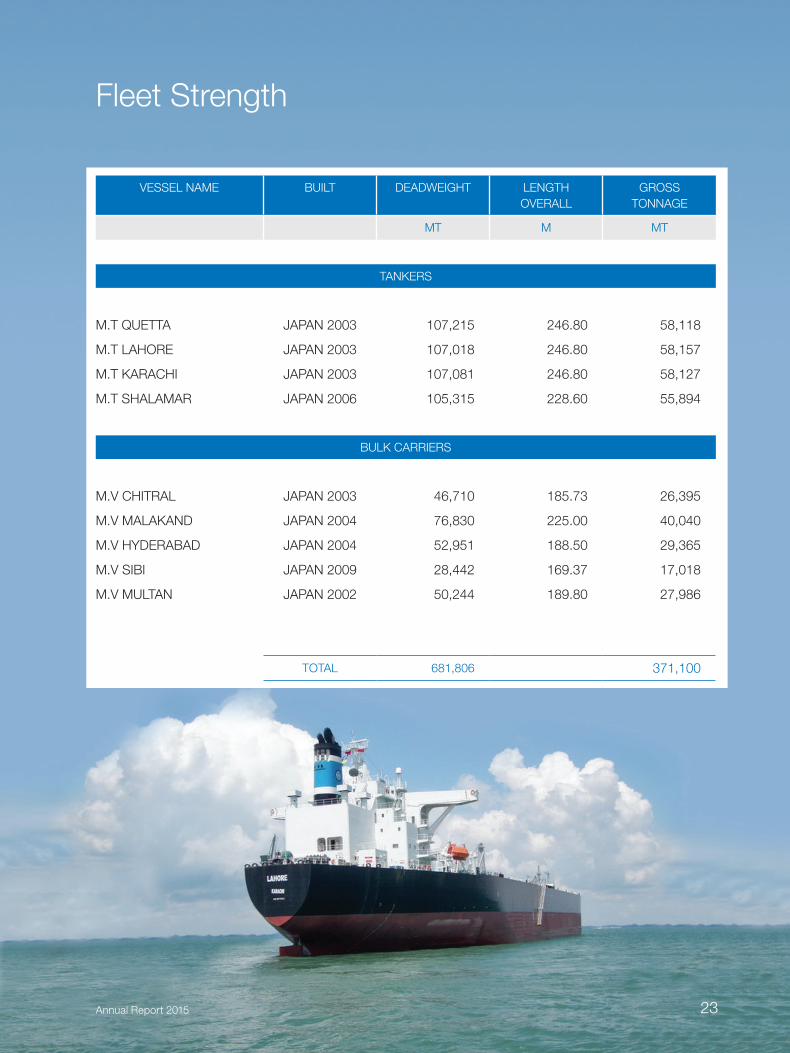
Fleet Strength
VESSELNAME BUILT DEADWEIGHT LENGTHOVERALL
GROSS TONNAGE
MT M MT
TANKERS
M.TQUETTA JAPAN 2003 107,215 246.80 58,118
M.TLAHORE JAPAN 2003 107,018 246.80 58,157
M.T KARACHI JAPAN 2003 107,081 246.80 58,127
M.T SHALAMAR JAPAN 2006 105,315 228.60 55,894
BULKCARRIERS
M.V CHITRAL JAPAN 2003 46,710 185.73 26,395
M.V MALAKAND JAPAN 2004 76,830 225.00 40,040
M.VHYDERABAD JAPAN 2004 52,951 188.50 29,365
M.V SIBI JAPAN2009 28,442 169.37 17,018
M.VMULTAN JAPAN 2002 50,244 189.80 27,986
TOTAL 681,806 371,100
23Annual Report 2015
24 Pakistan National Shipping Corporation
Directors’ Report
The Board of Directors of Pakistan National Shipping Group is pleased to present the thirty-seventh Annual Report
together with the audited financial statements for the year ended June 30, 2015.
OURPERFORMANCE
SUSTAINABLEFINANCIALRESULTS
PNSC achieved satisfactory results in the year 2014-15, despite a slowdown in economic growth globally. The Group aims
to gradually increase its reliance on owned vessels and with implementation of fleet expansion plan, PNSC inducted a new
aframax tanker M.T Shalamar in the mid-year which positively influenced Owned Vessel business margins and reduced
reliance on Chartering Vessels.
25Annual Report 2015
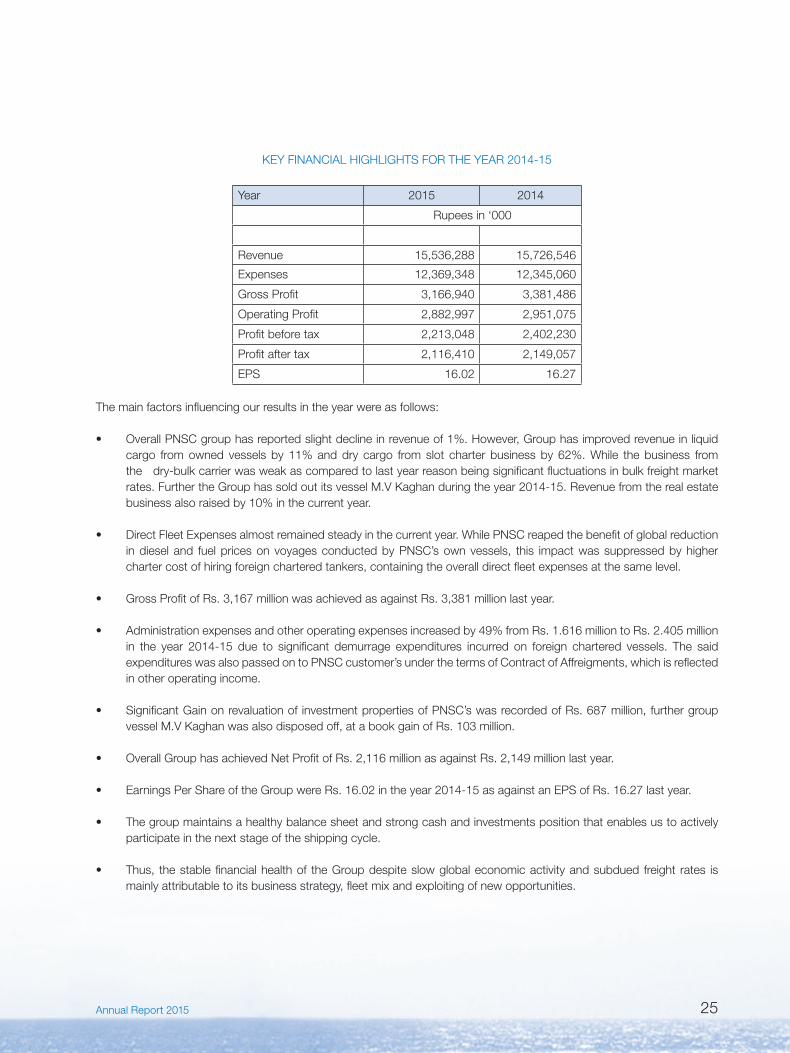
KEYFINANCIALHIGHLIGHTSFORTHEYEAR2014-15
Year 2015 2014
Rupees in ‘000
Revenue 15,536,288 15,726,546
Expenses 12,369,348 12,345,060
Gross Profit 3,166,940 3,381,486
Operating Profit 2,882,997 2,951,075
Profit before tax 2,213,048 2,402,230
Profit after tax 2,116,410 2,149,057
EPS 16.02 16.27
The main factors influencing our results in the year were as follows:
• OverallPNSCgrouphasreportedslightdeclineinrevenueof1%.However,Grouphasimprovedrevenueinliquidcargo from owned vessels by 11% and dry cargo from slot charter business by 62%. While the business from the dry-bulk carrier was weak as compared to last year reason being significant fluctuations in bulk freight market rates. Further the Group has sold out its vessel M.V Kaghan during the year 2014-15. Revenue from the real estate business also raised by 10% in the current year.
• DirectFleetExpensesalmostremainedsteadyinthecurrentyear.WhilePNSCreapedthebenefitofglobalreductionin diesel and fuel prices on voyages conducted by PNSC’s own vessels, this impact was suppressed by higher charter cost of hiring foreign chartered tankers, containing the overall direct fleet expenses at the same level.
• Gross Profit of Rs. 3,167 million was achieved as against Rs. 3,381 million last year.
• Administrationexpensesandotheroperatingexpensesincreasedby49%fromRs.1.616milliontoRs.2.405millionin the year 2014-15 due to significant demurrage expenditures incurred on foreign chartered vessels. The said expenditures was also passed on to PNSC customer’s under the terms of Contract of Affreigments, which is reflected in other operating income.
• Significant Gain on revaluation of investment properties of PNSC’s was recorded of Rs. 687 million, further group vessel M.V Kaghan was also disposed off, at a book gain of Rs. 103 million.
• OverallGrouphasachievedNetProfitofRs.2,116millionasagainstRs.2,149millionlastyear.
• EarningsPerShareoftheGroupwereRs.16.02intheyear2014-15asagainstanEPSofRs.16.27lastyear.
• The group maintains a healthy balance sheet and strong cash and investments position that enables us to actively participate in the next stage of the shipping cycle.
• Thus, the stable financial health of the Group despite slow global economic activity and subdued freight rates is mainly attributable to its business strategy, fleet mix and exploiting of new opportunities.
26 Pakistan National Shipping Corporation
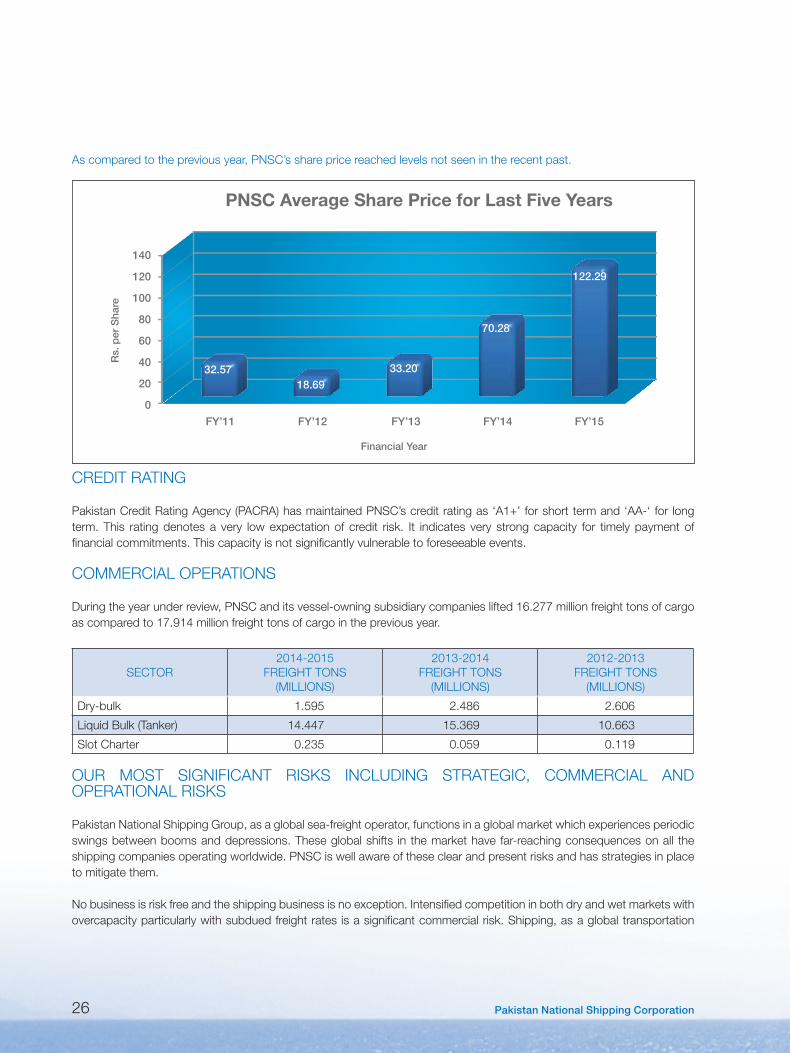
As compared to the previous year, PNSC’s share price reached levels not seen in the recent past.
CREDITRATING
Pakistan Credit Rating Agency (PACRA) has maintained PNSC’s credit rating as ‘A1+’ for short term and ‘AA-‘ for long term. This rating denotes a very low expectation of credit risk. It indicates very strong capacity for timely payment of financial commitments. This capacity is not significantly vulnerable to foreseeable events.
COMMERCIALOPERATIONS
During the year under review, PNSC and its vessel-owning subsidiary companies lifted 16.277 million freight tons of cargo ascomparedto17.914millionfreighttonsofcargointhepreviousyear.
SECTOR2014-2015
FREIGHTTONS(MILLIONS)
2013-2014FREIGHTTONS
(MILLIONS)
2012-2013FREIGHTTONS
(MILLIONS)
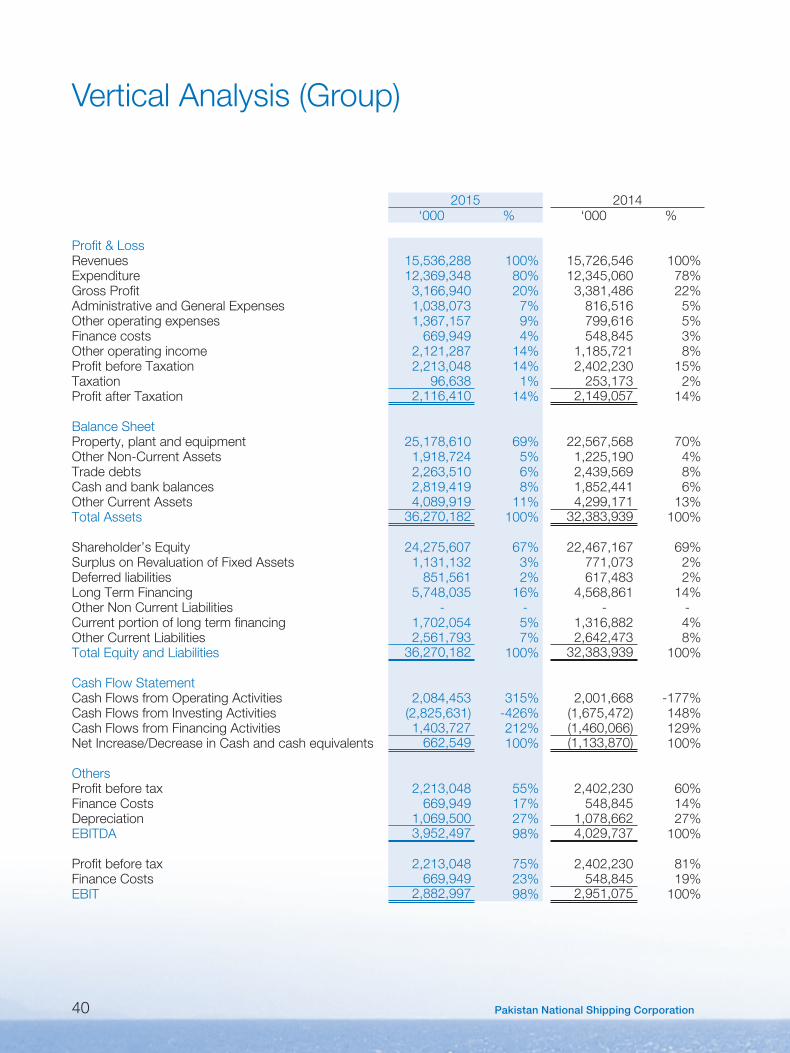
Dry-bulk 1.595 2.486 2.606
LiquidBulk(Tanker) 14.447 15.369 10.663
Slot Charter 0.235 0.059 0.119
OUR MOST SIGNIFICANT RISKS INCLUDING STRATEGIC, COMMERCIAL ANDOPERATIONALRISKS
Pakistan National Shipping Group, as a global sea-freight operator, functions in a global market which experiences periodic swingsbetweenboomsanddepressions.Theseglobalshifts inthemarkethavefar-reachingconsequencesonall theshipping companies operating worldwide. PNSC is well aware of these clear and present risks and has strategies in place to mitigate them.
No business is risk free and the shipping business is no exception. Intensified competition in both dry and wet markets with overcapacity particularly with subdued freight rates is a significant commercial risk. Shipping, as a global transportation
PNSC Average Share Price for Last Five Years
140
120
100
80
60
40
20
0
Rs.
per
Sha
re
FY’11 FY’12 FY’13 FY’14 FY’15
Financial Year
32.5718.69
33.20
70.28
122.29
27Annual Report 2015
industry in theworldbyplayingavital role inworldeconomiescaters forabout90%ofworld tradevolumeat lowesttransportation costs. However, the industry is cyclical in nature and essentially operates in a volatile market. The earnings are dependent upon function of demand and supply dynamics of the global markets. The shipping sector benefited from global economic environment wherein GDP growth remained high however with global economy starting to melt down from beginning of 2008 the demand as a result continues to remain subdued and seriously/adversely impacted on all segments of world shipping i.e. freight, asset values, rise of bunker and demo prices.
PNSC has transported crude oil for four major oil refineries in Pakistan under Contracts of Affreightment (CoA). In addition, PNSC transported Refined Oil for a major Oil Marketing Company in Pakistan.
MARKETRISK
The Company is exposed to the volatility inherent in the dry bulk and tanker market, where it has virtually all its assets and operations. The market is volatile and highly competitive. Demand for dry bulk transportation is closely linked to global economic trends, with risks of demand setbacks in periods of economic downturns. Supply of tonnage serving the dry bulk market is growing as an effect of large ordering in previous years. The market balance is difficult to predict, and it cannot be assumed that resulting rates will be sufficient to cover expenses and/or a return on the Company’s capital.
OPERATIONALRISKS
The Company’s operations may be subject to a number of risks. This includes risks of counterparties failing to honour its obligations, technical risks (including the service life of the Company’s vessels and unexpected repair costs), risks inherent in marine operations such as groundings and collisions, as well as environmental risks. In the course of its activities, the Companymaybecomeparttolegalproceedingsanddisputes.Insuranceprotectionmaynotbeadequateinallinstances.All of these factors could have a significant impact on the Company’s operations or financial position. For mitigation of commercial risk we are exercising pre & post fixture due diligence SOP.
FINANCIAL RISKS
Financial risks include risks of interest rate and currency fluctuations. In addition, its borrowings create leverage, which will amplify the effects of rate, cost, and value movements. In addition, changes in taxation could have a material impact on the Group. However, based on thorough reviews an appropriate strategy based on a consultative process is developed and deemed appropriate in the given circumstances to reduce the impact of risks arising out of any unfavorable situation.
CREDITRISKS
In the present market, the risk of counterparty default is very real. With a view to avoid such risks, we ensure stringent due diligence and try to restrict our dealings to parties who are reputable and financially sound.
COMPLIANCEWITHCODEOFCORPORATEGOVERNANCE
TherequirementsoftheCodeofCorporateGovernancesetoutbytheKarachiStockExchangeinitsListingRegulationshave been duly complied with. A statement to this effect is annexed with the Report.
28 Pakistan National Shipping Corporation
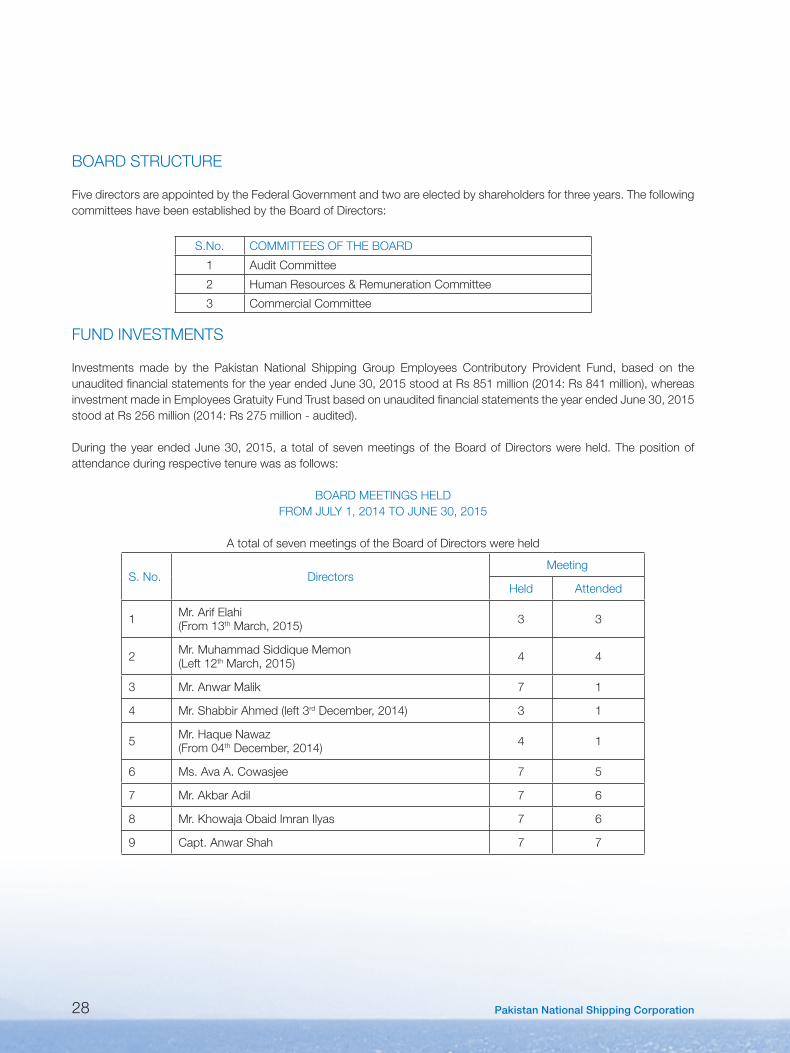
BOARDSTRUCTURE
Five directors are appointed by the Federal Government and two are elected by shareholders for three years. The following committees have been established by the Board of Directors:
S.No. COMMITTEESOFTHEBOARD
1 Audit Committee
2 Human Resources & Remuneration Committee
3 Commercial Committee
FUNDINVESTMENTS
Investments made by the Pakistan National Shipping Group Employees Contributory Provident Fund, based on theunaudited financial statements for the year ended June 30, 2015 stood at Rs 851 million (2014: Rs 841 million), whereas investmentmadeinEmployeesGratuityFundTrustbasedonunauditedfinancialstatementstheyearendedJune30,2015stood at Rs 256 million (2014: Rs 275 million - audited).
During the year ended June 30, 2015, a total of seven meetings of the Board of Directors were held. The position of attendance during respective tenure was as follows:
BOARDMEETINGSHELDFROMJULY1,2014TOJUNE30,2015
A total of seven meetings of the Board of Directors were held
S. No. DirectorsMeeting
Held Attended
1 Mr.ArifElahi(From 13th March, 2015) 3 3
2 Mr.MuhammadSiddiqueMemon(Left 12th March, 2015) 4 4
3 Mr. Anwar Malik 7 1
4 Mr. Shabbir Ahmed (left 3rd December, 2014) 3 1
5 Mr.HaqueNawaz(From 04th December, 2014) 4 1
6 Ms. Ava A. Cowasjee 7 5
7 Mr. Akbar Adil 7 6
8 Mr. Khowaja Obaid Imran Ilyas 7 6
9 Capt. Anwar Shah 7 7
29Annual Report 2015
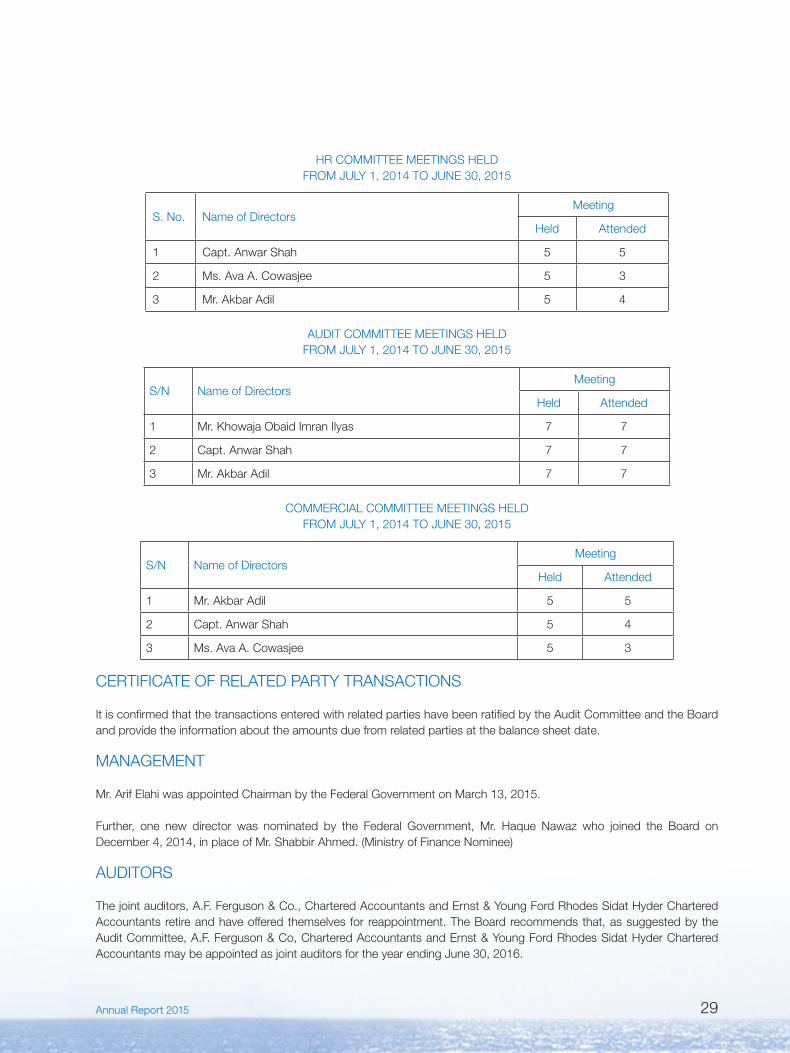
HRCOMMITTEEMEETINGSHELDFROMJULY1,2014TOJUNE30,2015
S. No. Name of DirectorsMeeting
Held Attended
1 Capt. Anwar Shah 5 5
2 Ms. Ava A. Cowasjee 5 3
3 Mr. Akbar Adil 5 4
AUDITCOMMITTEEMEETINGSHELDFROMJULY1,2014TOJUNE30,2015
S/N Name of DirectorsMeeting
Held Attended
1 Mr. Khowaja Obaid Imran Ilyas 7 7
2 Capt. Anwar Shah 7 7
3 Mr. Akbar Adil 7 7
COMMERCIALCOMMITTEEMEETINGSHELDFROMJULY1,2014TOJUNE30,2015
S/N Name of DirectorsMeeting
Held Attended
1 Mr. Akbar Adil 5 5
2 Capt. Anwar Shah 5 4
3 Ms. Ava A. Cowasjee 5 3
CERTIFICATEOFRELATEDPARTYTRANSACTIONS
It is confirmed that the transactions entered with related parties have been ratified by the Audit Committee and the Board and provide the information about the amounts due from related parties at the balance sheet date.
MANAGEMENT
Mr.ArifElahiwasappointedChairmanbytheFederalGovernmentonMarch13,2015.
Further, one new director was nominated by the Federal Government, Mr. Haque Nawaz who joined the Board on December 4, 2014, in place of Mr. Shabbir Ahmed. (Ministry of Finance Nominee)
AUDITORS
Thejointauditors,A.F.Ferguson&Co.,CharteredAccountantsandErnst&YoungFordRhodesSidatHyderCharteredAccountants retire and have offered themselves for reappointment. The Board recommends that, as suggested by the AuditCommittee,A.F.Ferguson&Co,CharteredAccountantsandErnst&YoungFordRhodesSidatHyderCharteredAccountants may be appointed as joint auditors for the year ending June 30, 2016.
30 Pakistan National Shipping Corporation
STRATEGIES,OBJECTIVESANDFUTUREPROSPECTS
Everyshippingsegmentcontinuedtostruggleduring2015,asexpected.Thesupplyside(fleetgrowth)hasnowbegunto decline but weakening global economic growth is becoming a new threat. Despite decreasing bunker prices, dry-bulk freight rates declined or stagnant across the most routes especially in larger vessel segments. Mean while new ordering activity continued despite pressure of unhealthy freight earnings.
The Group’s cash flows from fleet operations remained stronger over the years and PNSC is enjoying strong coverage ratios. The above stated factors might affect earnings and operations of PNSC and leads towards the challenges years ahead.
The Group is also taking steps to secure new business for maximum utilization of its capacity both in the domestic and regional markets. Nevertheless, the extent to recovery in the backdrop of overcapacity in the industry remains to be seen.
TheGrouphasdevelopedthestrategicfleetdevelopmentplan2025,acquisitionoftwoLR-1ProductTankershasbeenapprovedby theBoardandprocurement /acquisitionprocesswillbefinalized inFY2015-16.Thisdevelopmentplanis kept under continuous review and is revised/updated on the basis of trade & freight market trends in global shipping industry.
The Group has taken steps to cut down its current finance cost by refinancing its current financing facilities from a Commercial Bank, this will help to significantly reduce interest burden on current debts financing.
PNSC is exploring new business opportunities, including starting of a ferry service to Iran Coastal Cities and Oil Storage Facilities(Ullage).
DIRECTOR’STRAININGPROGRAM
Director’s training program was conducted in June 2015 under the training program of Pakistan Institute of Corporate Governance (PICG). Five of the directors attended the director’s training program that was held for 3 days and entail guidelines on the Board composition, structure and Code of Corporate Governance. These key issues and other international best practices are addressed in the director training program. Now six Board Directors are Certified Directors by PICG.
CORPORATEANDFINANCIALREPORTINGFRAMEWORK
It is certified that:
• Thefinancialstatementspreparedbythemanagementpresentfairlyitsstateofaffairs,theresultofitsoperations,cashflowsandchangesinequity.
• ProperbooksofaccountsoftheGrouphavebeenmaintained.
• Appropriateaccountingpolicieshavebeenconsistentlyappliedinthepreparationoffinancialstatements.Accountingestimates are based on reasonable and prudent judgment.
• InternationalAccountingStandards, as applicable inPakistan, havebeen followed in thepreparationof financialstatements.
• Thesystemofinternalcontrolsystemissoundindesignandhasbeeneffectivelyimplementedandmonitored.
• TherearenosignificantdoubtsabouttheGroup’sabilitytocontinueasagoingconcern.
• Therehasbeennomaterialdeparture fromthebestpracticesofcorporategovernance,asdetailed in theStockExchangeListingRegulations.
• Summaryofkeyoperatingandfinancialdataoflastsixfinancialyearsinsummaryformisannexed.
• Outstandingdutiesandtaxes,ifany,havebeendulydisclosedinfinancialstatements.
31Annual Report 2015
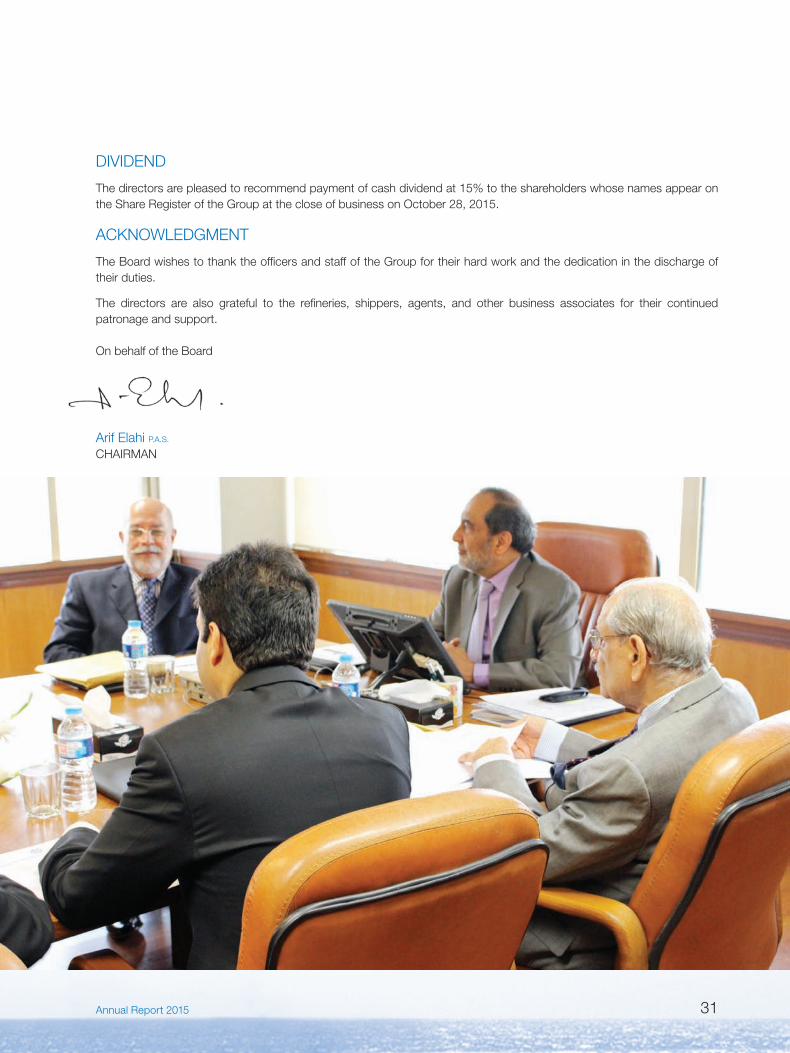
DIVIDEND
The directors are pleased to recommend payment of cash dividend at 15% to the shareholders whose names appear on the Share Register of the Group at the close of business on October 28, 2015.
ACKNOWLEDGMENT
The Board wishes to thank the officers and staff of the Group for their hard work and the dedication in the discharge of their duties.
The directors are also grateful to the refineries, shippers, agents, and other business associates for their continued patronage and support.
On behalf of the Board
ArifElahiP.A.S.
CHAIRMAN
32 Pakistan National Shipping Corporation
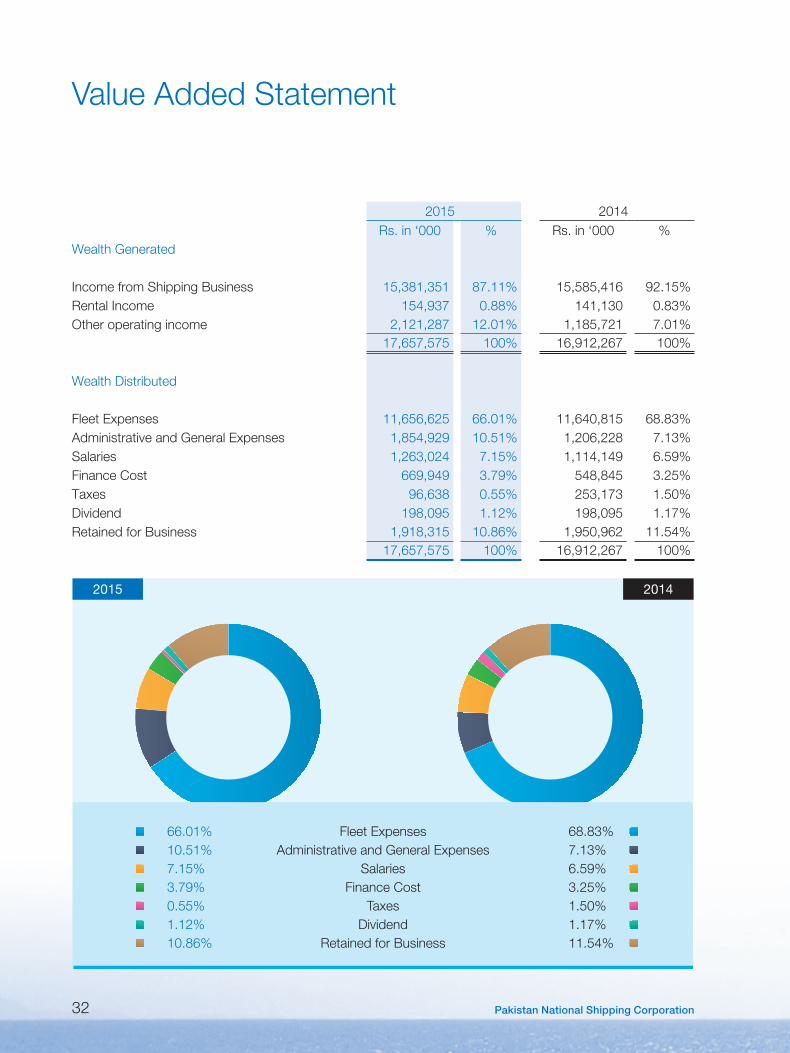
Value Added Statement
2015 2014Rs. in ‘000 % Rs. in ‘000 %
Wealth Generated
Income from Shipping Business 15,381,351 87.11% 15,585,416 92.15%Rental Income 154,937 0.88% 141,130 0.83%Other operating income 2,121,287 12.01% 1,185,721 7.01%
17,657,575 100% 16,912,267 100%
Wealth Distributed
FleetExpenses 11,656,625 66.01% 11,640,815 68.83%AdministrativeandGeneralExpenses 1,854,929 10.51% 1,206,228 7.13%Salaries 1,263,024 7.15% 1,114,149 6.59%Finance Cost 669,949 3.79% 548,845 3.25%Taxes 96,638 0.55% 253,173 1.50%Dividend 198,095 1.12% 198,095 1.17%Retained for Business 1,918,315 10.86% 1,950,962 11.54%
17,657,575 100% 16,912,267 100%
2015 2014
Fleet ExpensesAdministrative and General Expenses
SalariesFinance Cost
TaxesDividend
Retained for Business
66.01%10.51%7.15%3.79%0.55%1.12%10.86%
68.83%7.13%6.59%3.25%1.50%1.17%11.54%

33Annual Report 2015
Financial Ratios
UOM 2014-2015 2013-2014 2012-2013 2011-2012 2010-2011 2009-2010
Profitability Ratios
Profit before tax % 14.2% 15.3% 19.9% 8.2% 21.8% 18.4%
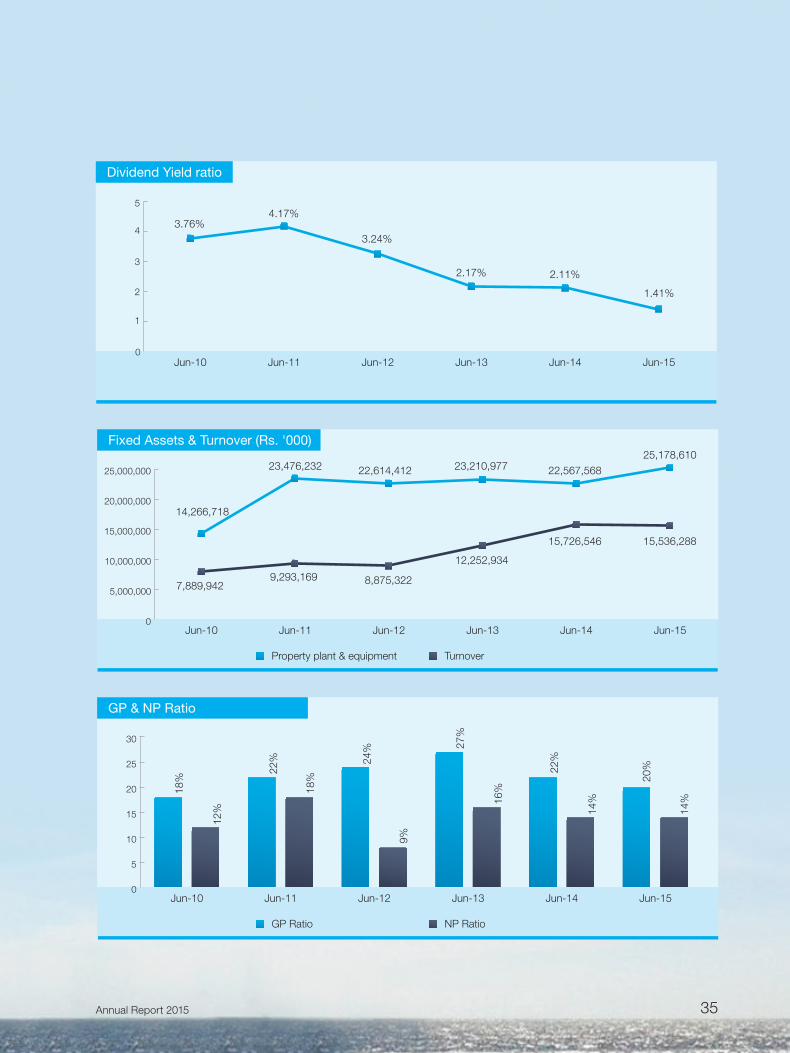
GP ratio % 20.38% 21.50% 26.86% 23.61% 22.18% 18.48%
Profit after tax % 13.6% 13.7% 16.3% 8.5% 17.6% 12.3%
EBITDAmargintosales % 25.4% 25.6% 34.3% 32.8% 35.5% 31.2%
Operating leverage ratio % 190.7% -23.0% 199.0% 479.1% 313.2% 165.7%
Returnonequity % 8.72% 9.57% 9.74% 4.05% 9.04% 5.74%
Return on capital employed % 6.61% 7.56% 7.20% 2.91% 6.25% 5.43%
LiquidityRatios
Current Ratio Times 2.15 2.17 1.99 1.73 1.59 2.96
Cash to Current liabilities Times 0.66 0.47 0.54 0.63 0.78 1.02
Cash flow from operations to Sales Times 0.13 0.13 0.13 0.17 0.17 0.66
Activity/Turnover Ratios
Debtor Turnover Ratio Times 6.61 8.70 15.22 16.34 16.64 12.52
Asset Turnover ratio Times 0.45 0.50 0.41 0.31 0.39 0.42
Fixed Assets turnover ratio Times 0.57 0.66 0.50 0.37 0.38 0.52
Market Ratios
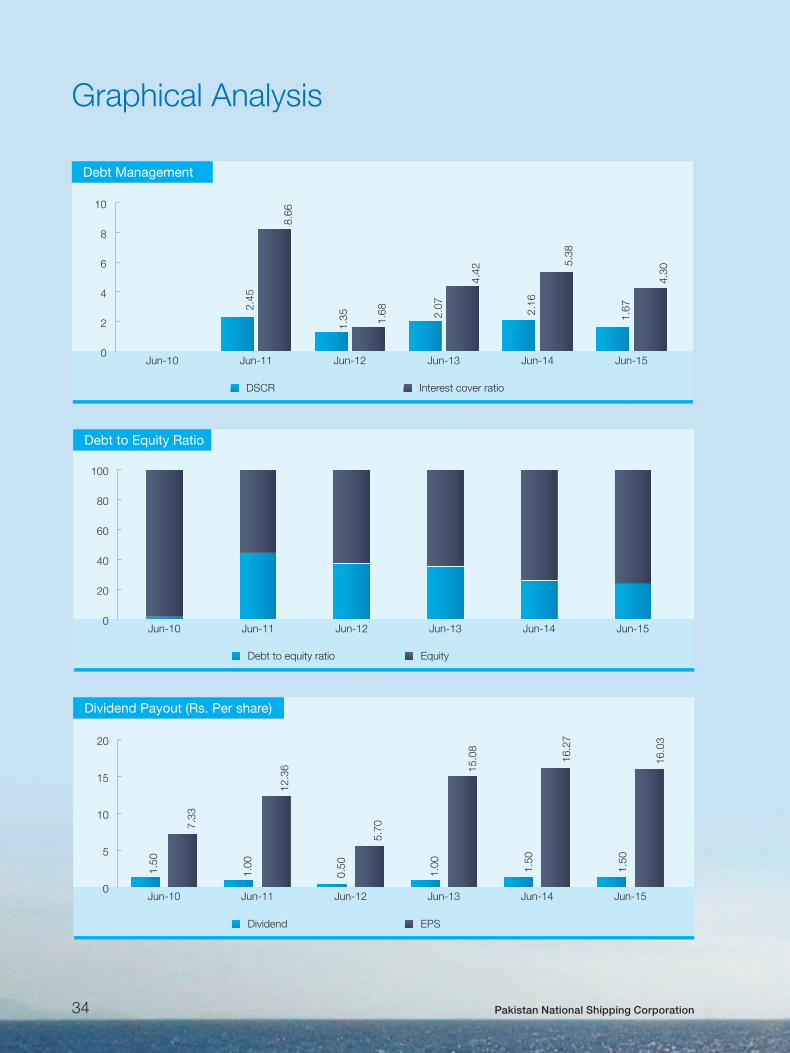
Earningspershare Rs. 16.03 16.27 15.08 5.70 12.36 7.33
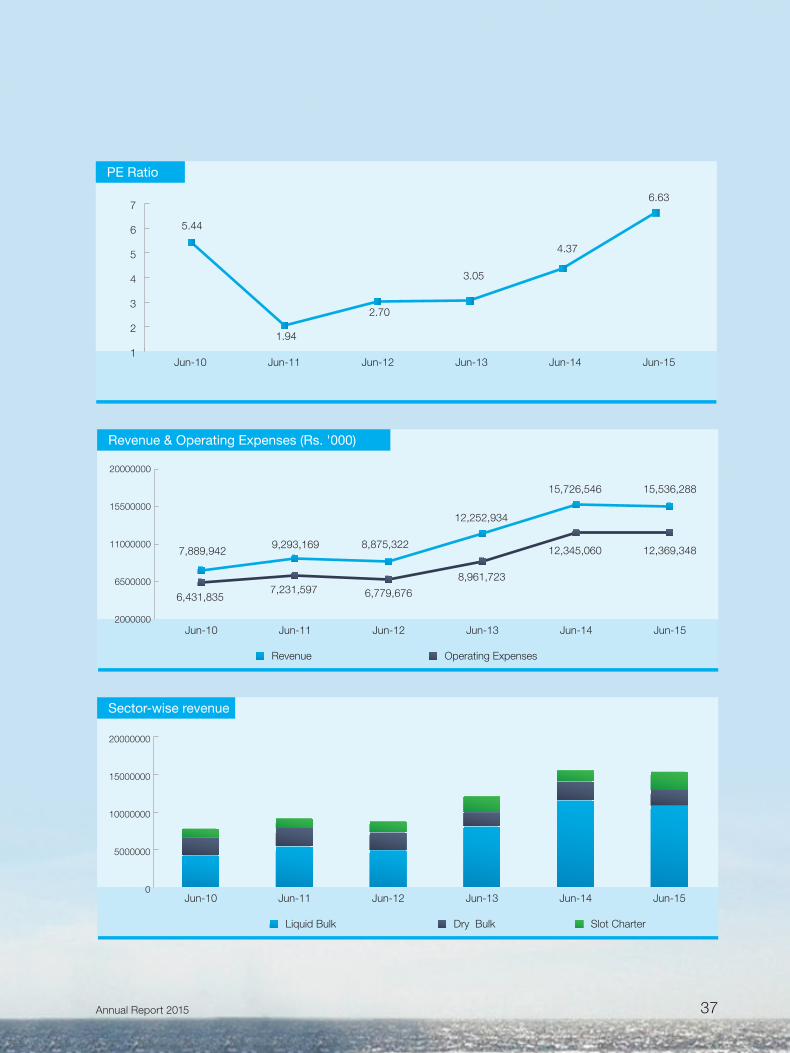
P/ERatio Times 6.63 4.37 3.05 2.70 1.94 5.44
Price to book ratio Times 3.87 2.90 1.96 0.71 1.10 2.76
Dividend Yield ratio % 1.41% 2.11% 2.17% 3.24% 4.17% 3.76%
Dividend Payout ratio Times 0.09 0.09 0.07 0.09 0.08 0.20
Dividend cover ratio Times 10.68 10.85 15.08 11.41 12.36 4.89
Cash dividend Rs. 1.5 1.5 1.0 0.50 1.0 1.5
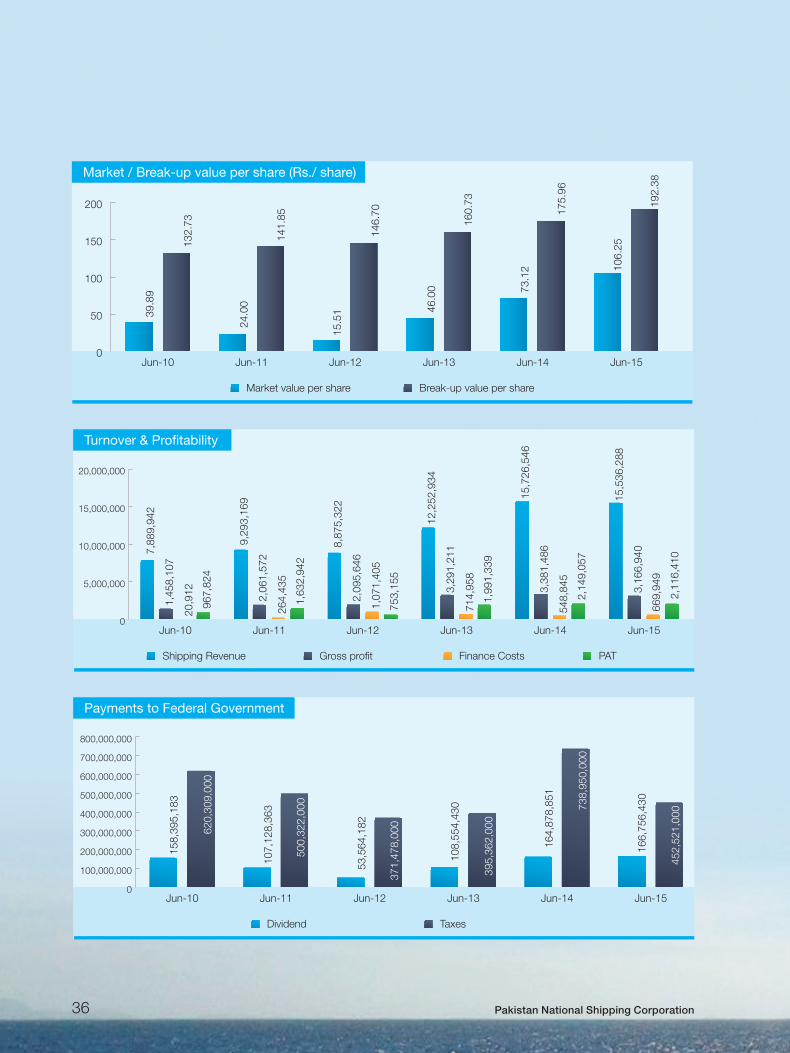
Breakup value/share with surplus Rs. 192.38 175.96 160.73 146.70 141.85 132.73
Breakup value/share without surplus Rs. 183.82 170.12 154.83 140.79 136.80 127.59
Share Price at year end Rs. 106.25 73.12 46.00 15.41 24.00 39.89
Share Price- High Rs. 187.90 94.57 52.00 25.89 41.74 75.54
Low Rs. 56.68 46.00 14.41 11.50 23.40 38.00
Capital Structure Ratio
Financial Leverage ratio Times 0.31 0.26 0.35 0.37 0.44 0.00
Debt Service Coverage Ratio Times 1.67 2.16 2.07 1.35 2.45 0.00
Debttoequityratio Times 0.24 0.20 0.29 0.32 0.38 0.00
Interest cover ratio Times 4.30 5.38 4.42 1.68 8.66 0.00
34 Pakistan National Shipping Corporation
DSCR Interest cover ratio
Debt Management
2.45
1.35 2.
07
1.67
4.30
4.42
1.68
8.66
0
2
4
6
8
10
Jun-15Jun-14Jun-13Jun-12Jun-11Jun-10
2.16
5.38
Debt to Equity Ratio
Debt to equity ratio Equity
0
20
40
60
80
100
Jun-15Jun-14Jun-13Jun-12Jun-11Jun-10
Dividend EPS
Dividend Payout (Rs. Per share)
1.5
0
1.0
0
0.5
0
1.0
0
1.5
0
16.
27
15.
08
5.7
0
12.
36
7.3
3
0
5
10
15
20
Jun-15Jun-14Jun-13Jun-12Jun-11Jun-10
1.5
0
16.0
3
Graphical Analysis
35Annual Report 2015
Jun-15
Dividend Yield ratio
0
1
2
3
4
54.17%
3.24%
2.17%
1.41%
3.76%
Jun-10 Jun-11 Jun-12 Jun-13 Jun-14
2.11%
Property plant & equipment Turnover
Fixed Assets & Turnover (Rs. '000)
0
5,000,000
10,000,000
15,000,000
20,000,000
25,000,000
7,889,942 9,293,169 8,875,322
12,252,934
15,536,288
25,178,610 23,210,977 22,614,412 23,476,232
14,266,718
15,726,546
22,567,568
Jun-15Jun-10 Jun-11 Jun-12 Jun-13 Jun-14
GP Ratio NP Ratio
GP & NP Ratio
0
5
10
15
20
25
30
18%
22% 24
% 27%
20%
14%16
%
9%
18%
12%
22%
14%
Jun-15Jun-10 Jun-11 Jun-12 Jun-13 Jun-14
36 Pakistan National Shipping Corporation
Market value per share Break-up value per share
39.8
9
132.
73
24.0
0
141.
85
15.5
1
146.
70
46.0
0
160.
73
106.
25
192.
38
Market / Break-up value per share (Rs./ share)
0
50
100
150
200
Jun-15Jun-10 Jun-11 Jun-12 Jun-13 Jun-14
73.1
2
175.
96
Shipping Revenue Gross profit Finance Costs PAT
Turnover & Pro�tability
0
5,000,000
10,000,000
15,000,000
20,000,000
15,
536,
288
3,1
66,9
40
669
,949
2,1
16,4
10 7,8
89,9
42
1,4
58,1
07
20,
912
967
,824
9,2
93,1
69
2,0
61,5
72
264
,435
1,6
32,9
42
8,8
75,3
22
2,0
95,6
46
1,0
71,4
05
753
,155
12,
252,
934
3,2
91,2
11
714
,958
1,9
91,3
39
15,
726,
546
3,3
81,4
86
548
,845
2,1
49,0
57
Jun-15Jun-10 Jun-11 Jun-12 Jun-13 Jun-14
Dividend Taxes
Payments to Federal Government
0
100,000,000
200,000,000
300,000,000
400,000,000
500,000,000
600,000,000
700,000,000
800,000,000
166
,756
,430
452,
521,
000
158
,395
,183
107
,128
,363
53,
564,
182
108
,554
,430
395
,362
,000
371
,478
,000
500
,322
,000
620
,309
,000
164
,878
,851
738
,950
,000
Jun-15Jun-10 Jun-11 Jun-12 Jun-13 Jun-14
37Annual Report 2015
PE Ratio
1.94
2.70
3.05
6.63
5.44
1
2
3
4
5
6
7
Jun-15Jun-10 Jun-11 Jun-12 Jun-13 Jun-14
4.37
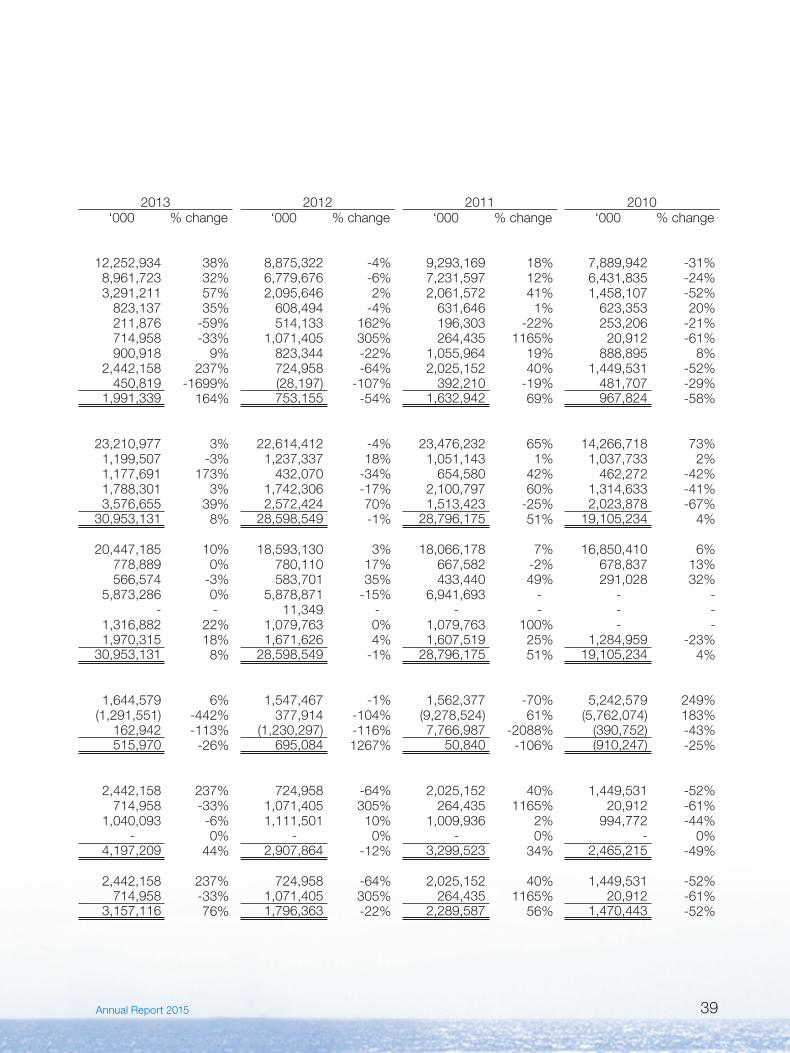
Revenue Operating Expenses
Revenue & Operating Expenses (Rs. '000)
2000000
6500000
11000000
15500000
20000000
6,431,835 7,231,597 6,779,676
8,961,723
12,369,348
15,536,288
12,252,934
8,875,322 9,293,169 7,889,942
Jun-15Jun-10 Jun-11 Jun-12 Jun-13 Jun-14
12,345,060
15,726,546
Sector-wise revenue
0
5000000
10000000
15000000
20000000
Liquid Bulk Dry Bulk Slot Charter
Jun-15Jun-10 Jun-11 Jun-12 Jun-13 Jun-14

38 Pakistan National Shipping Corporation
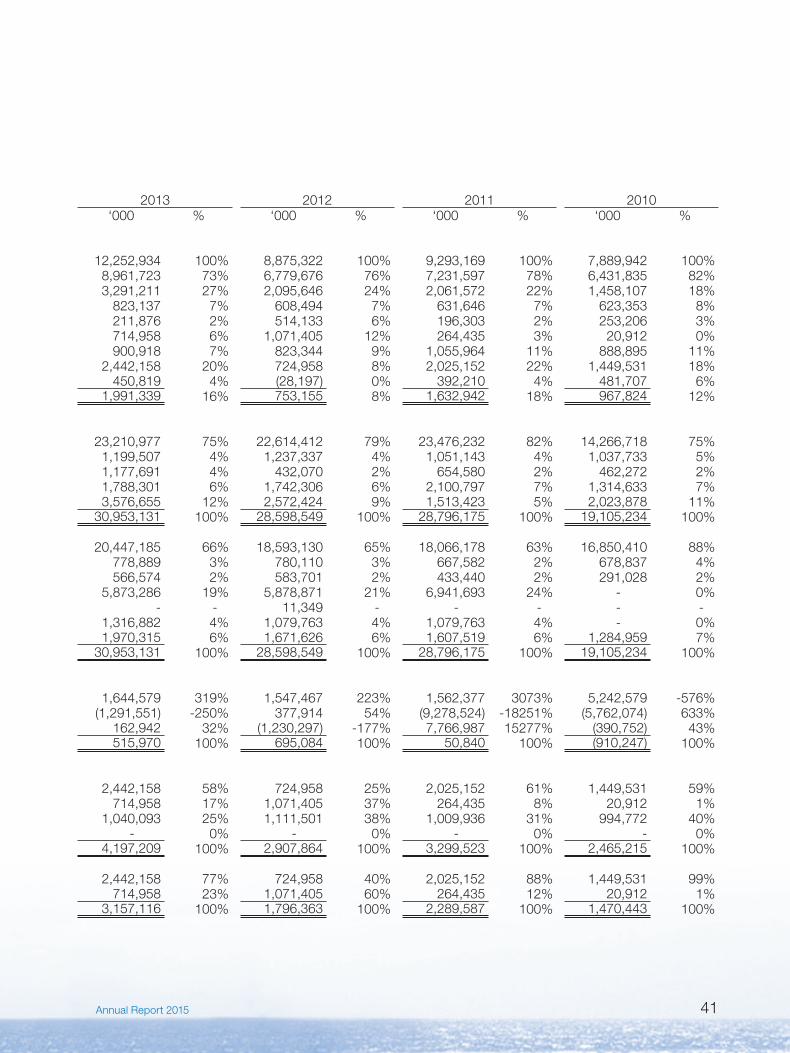
2015 2014‘000 % change ‘000 % change
Profit & LossRevenues 15,536,288 -1% 15,726,546 28%Expenditure 12,369,348 0% 12,345,060 38%Gross Profit 3,166,940 -6% 3,381,486 3%AdministrativeandGeneralExpenses 1,038,073 27% 816,516 -1%Other operating expenses 1,367,157 71% 799,616 277%Finance costs 669,949 22% 548,845 -23%Other income 2,121,287 79% 1,185,721 32%Profit before Taxation 2,213,048 -8% 2,402,230 -2%Taxation 96,638 -62% 253,173 -44%Profit after Taxation 2,116,410 -2% 2,149,057 8%
Balance SheetProperty,plantandequipment 25,178,610 12% 22,567,568 -3%Other Non-Current Assets 1,918,724 57% 1,225,190 2%Trade debts 2,263,510 -7% 2,439,569 107%Cash and bank balances 2,819,419 52% 1,852,441 4%Other Current Assets 4,089,919 -5% 4,299,171 20%Total Assets 36,270,182 12% 32,383,939 5%
Shareholder'sEquity 24,275,607 8% 22,467,167 10%Surplus on Revaluation of Fixed Assets 1,131,132 47% 771,073 -1%Deferred liabilites 851,561 38% 617,483 9%Long Term Financing 5,748,035 26% 4,568,861 -22%Other Non Current Liabilities - - -Current portion of long term financing 1,702,054 29% 1,316,882 0%Other Current Liabilities 2,561,793 -3% 2,642,473 34%TotalEquityandLiabilities 36,270,182 12% 32,383,939 5%
Cash Flow StatementCash Flows from Operating Activities 2,084,453 4% 2,001,668 22%Cash Flows from Investing Activities (2,825,631) 69% (1,675,472) 30%Cash Flows from Financing Activities 1,403,727 -196% (1,460,066) -996%Net(decrease)/increaseinCashandcashequivalents 662,549 -158% (1,133,870) -320%
OthersProfit before tax 2,213,048 -8% 2,402,230 -2%Finance Costs 669,949 22% 548,845 -23%Depreciation 1,069,500 -1% 1,078,662 4%EBITDA 3,952,497 -2% 4,029,737 -4%
Profit before tax 2,213,048 -8% 2,402,230 -2%Finance Costs 669,949 22% 548,845 -23%EBIT 2,882,997 -2% 2,951,075 -7%
Horizontal Analysis (Group)
39Annual Report 2015
2013 2012 2011 2010‘000 % change ‘000 % change ‘000 % change ‘000 % change
12,252,934 38% 8,875,322 -4% 9,293,169 18% 7,889,942 -31%8,961,723 32% 6,779,676 -6% 7,231,597 12% 6,431,835 -24%3,291,211 57% 2,095,646 2% 2,061,572 41% 1,458,107 -52%
823,137 35% 608,494 -4% 631,646 1% 623,353 20% 211,876 -59% 514,133 162% 196,303 -22% 253,206 -21%714,958 -33% 1,071,405 305% 264,435 1165% 20,912 -61%900,918 9% 823,344 -22% 1,055,964 19% 888,895 8%
2,442,158 237% 724,958 -64% 2,025,152 40% 1,449,531 -52%450,819 -1699% (28,197) -107% 392,210 -19% 481,707 -29%
1,991,339 164% 753,155 -54% 1,632,942 69% 967,824 -58%
23,210,977 3% 22,614,412 -4% 23,476,232 65% 14,266,718 73%1,199,507 -3% 1,237,337 18% 1,051,143 1% 1,037,733 2%1,177,691 173% 432,070 -34% 654,580 42% 462,272 -42% 1,788,301 3% 1,742,306 -17% 2,100,797 60% 1,314,633 -41% 3,576,655 39% 2,572,424 70% 1,513,423 -25% 2,023,878 -67%
30,953,131 8% 28,598,549 -1% 28,796,175 51% 19,105,234 4%
20,447,185 10% 18,593,130 3% 18,066,178 7% 16,850,410 6%778,889 0% 780,110 17% 667,582 -2% 678,837 13% 566,574 -3% 583,701 35% 433,440 49% 291,028 32%
5,873,286 0% 5,878,871 -15% 6,941,693 - - - - - 11,349 - - - - -
1,316,882 22% 1,079,763 0% 1,079,763 100% - -1,970,315 18% 1,671,626 4% 1,607,519 25% 1,284,959 -23%
30,953,131 8% 28,598,549 -1% 28,796,175 51% 19,105,234 4%
1,644,579 6% 1,547,467 -1% 1,562,377 -70% 5,242,579 249%(1,291,551) -442% 377,914 -104% (9,278,524) 61% (5,762,074) 183%
162,942 -113% (1,230,297) -116% 7,766,987 -2088% (390,752) -43%515,970 -26% 695,084 1267% 50,840 -106% (910,247) -25%
2,442,158 237% 724,958 -64% 2,025,152 40% 1,449,531 -52%714,958 -33% 1,071,405 305% 264,435 1165% 20,912 -61%
1,040,093 -6% 1,111,501 10% 1,009,936 2% 994,772 -44% - 0% - 0% - 0% - 0%
4,197,209 44% 2,907,864 -12% 3,299,523 34% 2,465,215 -49%
2,442,158 237% 724,958 -64% 2,025,152 40% 1,449,531 -52%714,958 -33% 1,071,405 305% 264,435 1165% 20,912 -61%
3,157,116 76% 1,796,363 -22% 2,289,587 56% 1,470,443 -52%
40 Pakistan National Shipping Corporation
Vertical Analysis (Group)
2015 2014‘000 % ‘000 %
Profit & LossRevenues 15,536,288 100% 15,726,546 100%Expenditure 12,369,348 80% 12,345,060 78%Gross Profit 3,166,940 20% 3,381,486 22%AdministrativeandGeneralExpenses 1,038,073 7% 816,516 5%Other operating expenses 1,367,157 9% 799,616 5%Finance costs 669,949 4% 548,845 3%Other operating income 2,121,287 14% 1,185,721 8%Profit before Taxation 2,213,048 14% 2,402,230 15%Taxation 96,638 1% 253,173 2%Profit after Taxation 2,116,410 14% 2,149,057 14%
Balance SheetProperty,plantandequipment 25,178,610 69% 22,567,568 70%Other Non-Current Assets 1,918,724 5% 1,225,190 4%Trade debts 2,263,510 6% 2,439,569 8%Cash and bank balances 2,819,419 8% 1,852,441 6%Other Current Assets 4,089,919 11% 4,299,171 13%Total Assets 36,270,182 100% 32,383,939 100%
Shareholder’sEquity 24,275,607 67% 22,467,167 69%Surplus on Revaluation of Fixed Assets 1,131,132 3% 771,073 2%Deferred liabilities 851,561 2% 617,483 2%Long Term Financing 5,748,035 16% 4,568,861 14%Other Non Current Liabilities - - - - Current portion of long term financing 1,702,054 5% 1,316,882 4%Other Current Liabilities 2,561,793 7% 2,642,473 8%TotalEquityandLiabilities 36,270,182 100% 32,383,939 100%
Cash Flow StatementCash Flows from Operating Activities 2,084,453 315% 2,001,668 -177%Cash Flows from Investing Activities (2,825,631) -426% (1,675,472) 148%Cash Flows from Financing Activities 1,403,727 212% (1,460,066) 129%NetIncrease/DecreaseinCashandcashequivalents 662,549 100% (1,133,870) 100%
OthersProfit before tax 2,213,048 55% 2,402,230 60%Finance Costs 669,949 17% 548,845 14%Depreciation 1,069,500 27% 1,078,662 27%EBITDA 3,952,497 98% 4,029,737 100%
Profit before tax 2,213,048 75% 2,402,230 81%Finance Costs 669,949 23% 548,845 19%EBIT 2,882,997 98% 2,951,075 100%
41Annual Report 2015
2013 2012 2011 2010‘000 % ‘000 % ‘000 % ‘000 %
12,252,934 100% 8,875,322 100% 9,293,169 100% 7,889,942 100%8,961,723 73% 6,779,676 76% 7,231,597 78% 6,431,835 82%3,291,211 27% 2,095,646 24% 2,061,572 22% 1,458,107 18%
823,137 7% 608,494 7% 631,646 7% 623,353 8% 211,876 2% 514,133 6% 196,303 2% 253,206 3%714,958 6% 1,071,405 12% 264,435 3% 20,912 0%900,918 7% 823,344 9% 1,055,964 11% 888,895 11%
2,442,158 20% 724,958 8% 2,025,152 22% 1,449,531 18%450,819 4% (28,197) 0% 392,210 4% 481,707 6%
1,991,339 16% 753,155 8% 1,632,942 18% 967,824 12%
23,210,977 75% 22,614,412 79% 23,476,232 82% 14,266,718 75%1,199,507 4% 1,237,337 4% 1,051,143 4% 1,037,733 5%1,177,691 4% 432,070 2% 654,580 2% 462,272 2% 1,788,301 6% 1,742,306 6% 2,100,797 7% 1,314,633 7% 3,576,655 12% 2,572,424 9% 1,513,423 5% 2,023,878 11%
30,953,131 100% 28,598,549 100% 28,796,175 100% 19,105,234 100%
20,447,185 66% 18,593,130 65% 18,066,178 63% 16,850,410 88%778,889 3% 780,110 3% 667,582 2% 678,837 4% 566,574 2% 583,701 2% 433,440 2% 291,028 2%
5,873,286 19% 5,878,871 21% 6,941,693 24% - 0% - - 11,349 - - - - -
1,316,882 4% 1,079,763 4% 1,079,763 4% - 0%1,970,315 6% 1,671,626 6% 1,607,519 6% 1,284,959 7%
30,953,131 100% 28,598,549 100% 28,796,175 100% 19,105,234 100%
1,644,579 319% 1,547,467 223% 1,562,377 3073% 5,242,579 -576%(1,291,551) -250% 377,914 54% (9,278,524) -18251% (5,762,074) 633%
162,942 32% (1,230,297) -177% 7,766,987 15277% (390,752) 43%515,970 100% 695,084 100% 50,840 100% (910,247) 100%
2,442,158 58% 724,958 25% 2,025,152 61% 1,449,531 59%714,958 17% 1,071,405 37% 264,435 8% 20,912 1%
1,040,093 25% 1,111,501 38% 1,009,936 31% 994,772 40% - 0% - 0% - 0% - 0%
4,197,209 100% 2,907,864 100% 3,299,523 100% 2,465,215 100%
2,442,158 77% 724,958 40% 2,025,152 88% 1,449,531 99%714,958 23% 1,071,405 60% 264,435 12% 20,912 1%
3,157,116 100% 1,796,363 100% 2,289,587 100% 1,470,443 100%

42 Pakistan National Shipping Corporation
43Annual Report 2015
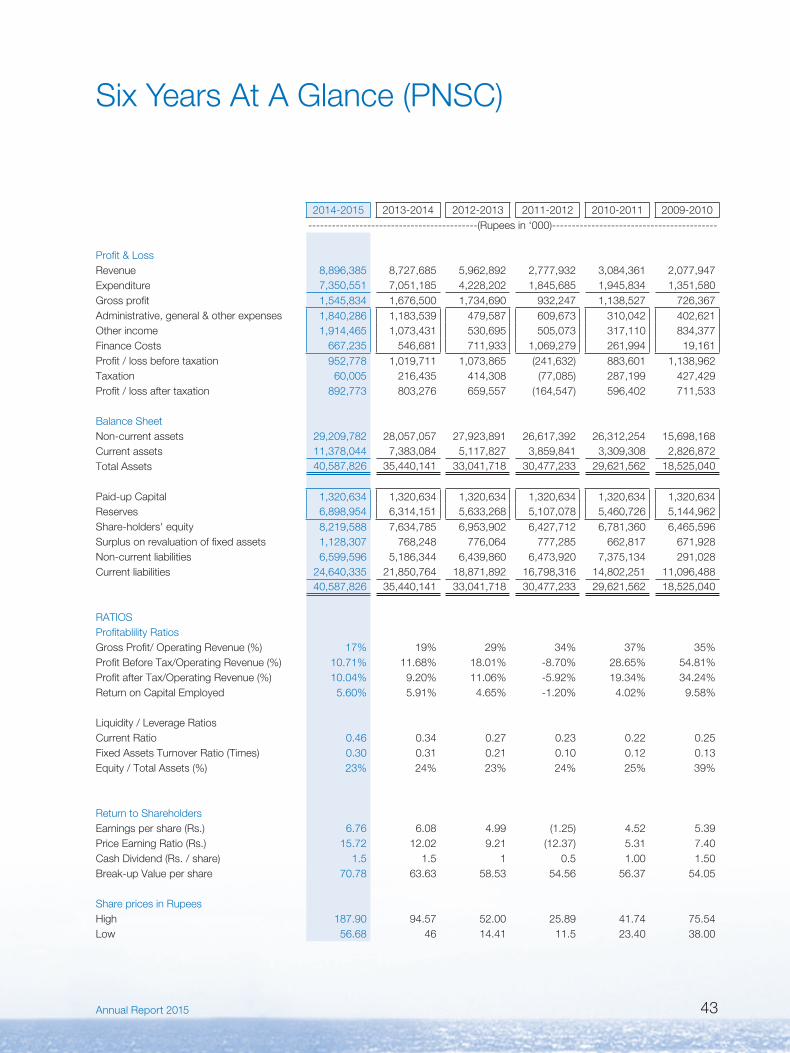
Six Years At A Glance (PNSC)
2014-2015 2013-2014 2012-2013 2011-2012 2010-2011 2009-2010-------------------------------------------(Rupees in ‘000)------------------------------------------
Profit & LossRevenue 8,896,385 8,727,685 5,962,892 2,777,932 3,084,361 2,077,947Expenditure 7,350,551 7,051,185 4,228,202 1,845,685 1,945,834 1,351,580 Gross profit 1,545,834 1,676,500 1,734,690 932,247 1,138,527 726,367 Administrative, general & other expenses 1,840,286 1,183,539 479,587 609,673 310,042 402,621 Other income 1,914,465 1,073,431 530,695 505,073 317,110 834,377 Finance Costs 667,235 546,681 711,933 1,069,279 261,994 19,161Profit / loss before taxation 952,778 1,019,711 1,073,865 (241,632) 883,601 1,138,962Taxation 60,005 216,435 414,308 (77,085) 287,199 427,429Profit / loss after taxation 892,773 803,276 659,557 (164,547) 596,402 711,533
Balance SheetNon-current assets 29,209,782 28,057,057 27,923,891 26,617,392 26,312,254 15,698,168Current assets 11,378,044 7,383,084 5,117,827 3,859,841 3,309,308 2,826,872 Total Assets 40,587,826 35,440,141 33,041,718 30,477,233 29,621,562 18,525,040
Paid-up Capital 1,320,634 1,320,634 1,320,634 1,320,634 1,320,634 1,320,634 Reserves 6,898,954 6,314,151 5,633,268 5,107,078 5,460,726 5,144,962Share-holders'equity 8,219,588 7,634,785 6,953,902 6,427,712 6,781,360 6,465,596Surplus on revaluation of fixed assets 1,128,307 768,248 776,064 777,285 662,817 671,928Non-current liabilities 6,599,596 5,186,344 6,439,860 6,473,920 7,375,134 291,028Current liabilities 24,640,335 21,850,764 18,871,892 16,798,316 14,802,251 11,096,488
40,587,826 35,440,141 33,041,718 30,477,233 29,621,562 18,525,040
RATIOSProfitablility RatiosGross Profit/ Operating Revenue (%) 17% 19% 29% 34% 37% 35%Profit Before Tax/Operating Revenue (%) 10.71% 11.68% 18.01% -8.70% 28.65% 54.81%Profit after Tax/Operating Revenue (%) 10.04% 9.20% 11.06% -5.92% 19.34% 34.24%ReturnonCapitalEmployed 5.60% 5.91% 4.65% -1.20% 4.02% 9.58%
Liquidity/LeverageRatiosCurrent Ratio 0.46 0.34 0.27 0.23 0.22 0.25 Fixed Assets Turnover Ratio (Times) 0.30 0.31 0.21 0.10 0.12 0.13 Equity/TotalAssets(%) 23% 24% 23% 24% 25% 39%
Return to ShareholdersEarningspershare(Rs.) 6.76 6.08 4.99 (1.25) 4.52 5.39PriceEarningRatio(Rs.) 15.72 12.02 9.21 (12.37) 5.31 7.40 Cash Dividend (Rs. / share) 1.5 1.5 1 0.5 1.00 1.50 Break-up Value per share 70.78 63.63 58.53 54.56 56.37 54.05
Share prices in RupeesHigh 187.90 94.57 52.00 25.89 41.74 75.54Low 56.68 46 14.41 11.5 23.40 38.00
44 Pakistan National Shipping Corporation
Review Report To The Members On The Statement Of Compliance With The Code Of Corporate Governance
We have reviewed the enclosed Statement of Compliance with the best practices contained in the Code of Corporate Governance (the Code) prepared by the Board of Directors of Pakistan National Shipping Corporation (theCorporation)fortheyearendedJune30,2015tocomplywiththerequirementsofListingRegulationNo.35oftheKarachiStockExchangeLimitedwheretheCorporationislisted.
The responsibility for compliance with the Code is that of the Board of Directors of the Corporation. Our responsibility is to review, to the extent where such compliance can be objectively verified, whether the Statement of Compliance reflects the status of the Corporation’s compliance with the provisions of the Code andreportifitdoesnotandtohighlightanynon-compliancewiththerequirementsoftheCode.AreviewislimitedprimarilytoinquiriesoftheCorporation’spersonnelandreviewofvariousdocumentspreparedbytheCorporation to comply with the Code.
Asapartofourauditofthefinancialstatements,wearerequiredtoobtainanunderstandingoftheaccountingand internal control systems sufficient to plan the audit and develop an effective audit approach. We are not requiredtoconsiderwhethertheBoardofDirectors’statementoninternalcontrolcoversallrisksandcontrolsor to form an opinion on the effectiveness of such internal controls, the Corporation’s corporate governance procedures and risks.
TheCoderequirestheCorporationtoplacebeforetheAuditCommittee,anduponrecommendationoftheAudit Committee, place before the Board of Directors for their review and approval its related party transactions distinguishing between transactions carried out on terms equivalent to those that prevail in arm’s lengthtransactions and transactions which are not executed at arm’s length price and recording proper justification for using such alternate pricing mechanism. We are only required and have ensured compliance of thisrequirement to theextentof theapprovalof the relatedparty transactionsby theBoardofDirectorsuponrecommendation of the Audit Committee. We have not carried out any procedures to determine whether the related party transactions were undertaken at arm’s length price or not.
Based on our review, nothing has come to our attention which causes us to believe that the Statement of Compliance does not appropriately reflect the Corporation’s compliance, in all material respects, with the best practices contained in the Code as applicable to the Corporation for the year ended June 30, 2015.
A.F.FERGUSON&CO.CHARTEREDACCOUNTANTSa member firm of the PwC networkSTATELIFEBUILDING1-CI.I.CHUNDRIGARROADKARACHI
ERNST&YOUNGFORDRHODESSIDATHYDERCHARTEREDACCOUNTANTSamemberfirmofErnst&YoungGlobalLimitedPROGRESSIVEPLAZABEAUMONTROADKARACHI
45Annual Report 2015
A.F.FERGUSON&CO.CHARTEREDACCOUNTANTSa member firm of the PwC networkSTATELIFEBUILDING1-CI.I.CHUNDRIGARROADKARACHI
ERNST&YOUNGFORDRHODESSIDATHYDERCHARTEREDACCOUNTANTSamemberfirmofErnst&YoungGlobalLimitedPROGRESSIVEPLAZABEAUMONTROADKARACHI
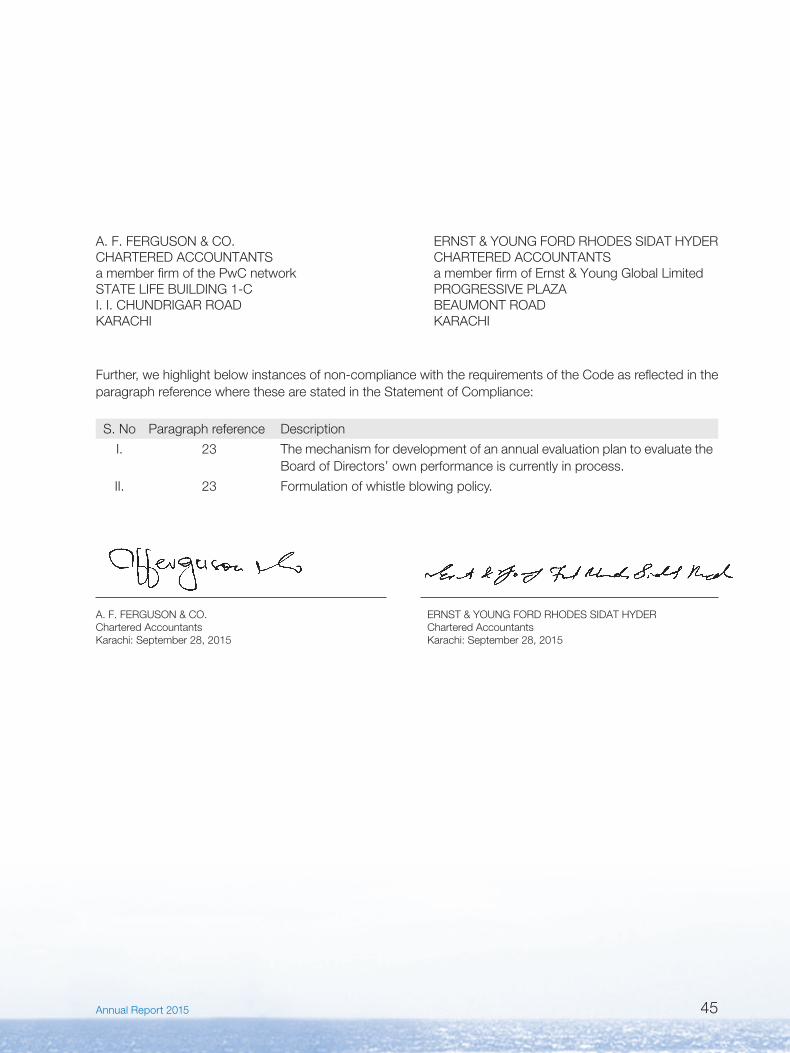
Further,wehighlightbelowinstancesofnon-compliancewiththerequirementsoftheCodeasreflectedintheparagraph reference where these are stated in the Statement of Compliance:
S. No Paragraph reference Description
I. 23 The mechanism for development of an annual evaluation plan to evaluate the Board of Directors’ own performance is currently in process.
II. 23 Formulation of whistle blowing policy.
A.F.FERGUSON&CO.Chartered AccountantsKarachi: September 28, 2015
ERNST&YOUNGFORDRHODESSIDATHYDERChartered AccountantsKarachi: September 28, 2015
46 Pakistan National Shipping Corporation
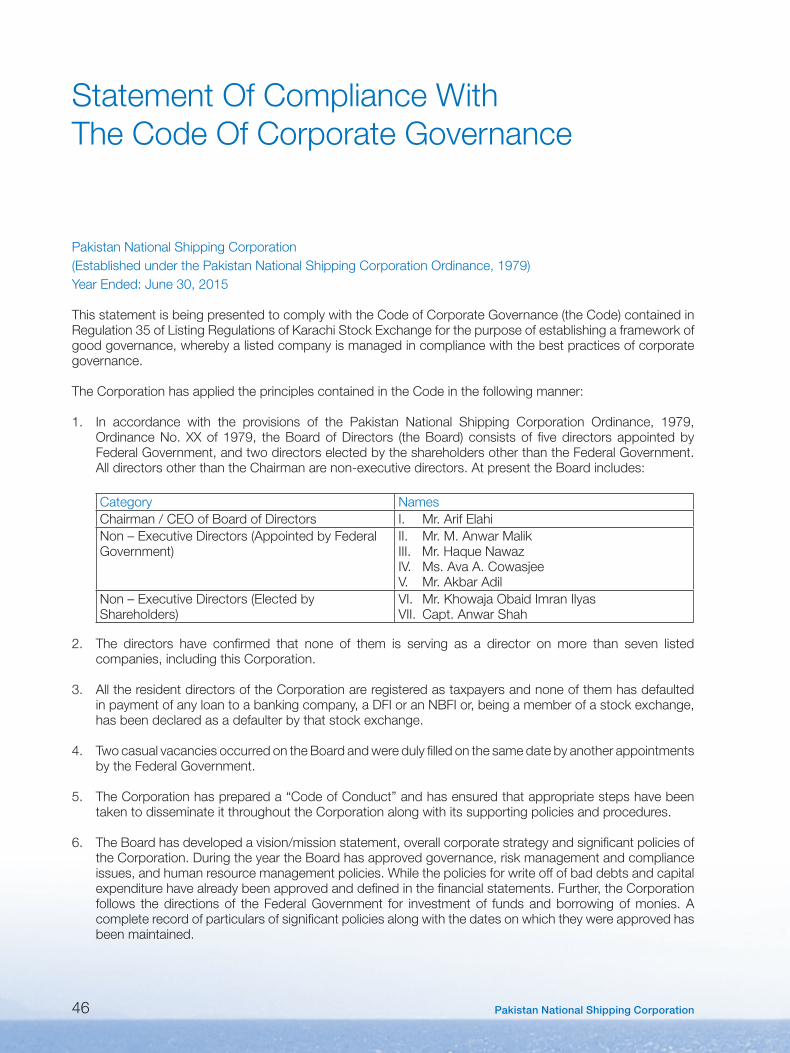
Pakistan National Shipping Corporation(EstablishedunderthePakistanNationalShippingCorporationOrdinance,1979)YearEnded:June30,2015
This statement is being presented to comply with the Code of Corporate Governance (the Code) contained in Regulation35ofListingRegulationsofKarachiStockExchangeforthepurposeofestablishingaframeworkofgood governance, whereby a listed company is managed in compliance with the best practices of corporate governance.
The Corporation has applied the principles contained in the Code in the following manner:
1. In accordance with the provisions of the Pakistan National Shipping Corporation Ordinance, 1979,OrdinanceNo.XXof 1979, theBoardofDirectors (theBoard) consistsof fivedirectors appointedbyFederal Government, and two directors elected by the shareholders other than the Federal Government. All directors other than the Chairman are non-executive directors. At present the Board includes:
Category NamesChairman/CEOofBoardofDirectors I. Mr.ArifElahiNon–ExecutiveDirectors(AppointedbyFederalGovernment)
II. Mr. M. Anwar MalikIII. Mr.HaqueNawazIV. Ms. Ava A. CowasjeeV. Mr. Akbar Adil
Non–ExecutiveDirectors(ElectedbyShareholders)
VI. Mr. Khowaja Obaid Imran IlyasVII. Capt. Anwar Shah
2. The directors have confirmed that none of them is serving as a director on more than seven listed companies, including this Corporation.
3. All the resident directors of the Corporation are registered as taxpayers and none of them has defaulted in payment of any loan to a banking company, a DFI or an NBFI or, being a member of a stock exchange, has been declared as a defaulter by that stock exchange.
4. Two casual vacancies occurred on the Board and were duly filled on the same date by another appointments by the Federal Government.
5. The Corporation has prepared a “Code of Conduct” and has ensured that appropriate steps have been taken to disseminate it throughout the Corporation along with its supporting policies and procedures.
6. The Board has developed a vision/mission statement, overall corporate strategy and significant policies of the Corporation. During the year the Board has approved governance, risk management and compliance issues, and human resource management policies. While the policies for write off of bad debts and capital expenditure have already been approved and defined in the financial statements. Further, the Corporation follows the directions of the Federal Government for investment of funds and borrowing of monies. A complete record of particulars of significant policies along with the dates on which they were approved has been maintained.
Statement Of Compliance With The Code Of Corporate Governance
47Annual Report 2015
7. All the powers of the Board have been duly exercised and decisions on material transactions have been takenbytheBoard.HowevertheappointmentandremunerationoftheChairman/ChiefExecutiveOfficer(CEO)hasbeendeterminedbytheFederalGovernment.
8. The meetings of the Board were presided over by the Chairman and, in his absence, by a director elected bytheBoardforthispurposeandtheBoardmetatleastonceineveryquarter.WrittennoticesoftheBoardmeetings, along with agenda and working papers, were circulated atleast seven days before the meetings. The minutes of the meetings were appropriately recorded and circulated.
9. TheCorporationhasarrangedapprovedtrainingprogramforitsdirectorsduringtheyear.
10. There have been no fresh appointments of Chief Financial Officer (CFO) and Company Secretary. However, during the year the Board has approved the terms and conditions of employment and remuneration of Head of Internal Audit.
11.Thedirectors’reportforthisyearhasbeenpreparedincompliancewiththerequirementsoftheCodeandfullydescribesthesalientmattersrequiredtobedisclosed.
12.ThefinancialstatementsoftheCorporationweredulyendorsedbyCEOandCFObeforeapprovaloftheBoard.
13.Thedirectors,CEOandexecutivesdonotholdanyinterestinthesharesoftheCorporationotherthanthatdisclosed in the pattern of shareholding.
14.TheCorporationhascompliedwithallthecorporateandfinancialreportingrequirementsoftheCode.
15. The Board has formed an Audit Committee (the Committee). The Committee comprises of three members, of whom all are non-executive directors and the Chairman of the Committee is also a non-executive director.
16.ThemeetingsoftheCommitteewereheldatleastonceeveryquarterpriortoapprovalofinterimandfinalresultsoftheCorporationandasrequiredbytheCode.ThetermsofreferenceoftheCommitteehavebeenformedandadvisedtotheCommitteeforcompliance.AlltherequirementsoftheCodewithrespectto the Committee were complied.
17. The Board has formed a Human Resource and Remuneration (HR) Committee. It comprises of three members, of whom all are non-executive directors and the Chairman of the HR Committee is a non-executive director.
18. The Board has set up an internal audit function. The members of the internal audit function of the Corporationaresuitablyqualifiedandexperiencedforthepurposeandareconversantwiththepoliciesand procedures of the Corporation.
19.ThestatutoryauditorsoftheCorporationhaveconfirmedthattheyhavebeengivenasatisfactoryratingunder thequalitycontrol reviewprogramof the InstituteofCharteredAccountantsofPakistan (ICAP),that they or any of the partners of the firm, their spouses and minor children do not hold any shares of the Corporation and that the firm and all its partners are in compliance with International Federation of Accountants (IFAC) guidelines on code of ethics as adopted by the ICAP.
48 Pakistan National Shipping Corporation
20. The statutory auditors or the persons associated with them have not been appointed to provide other services except in accordance with the listing regulations and the auditors have confirmed that they have observed IFAC guidelines in this regard.
21. The closed period, prior to the announcement of interim/final results, and business decisions, which may materially affect the market price of the Corporation’s securities, was determined and intimated to directors, employees and stock exchange.
22. Material/price sensitive information has been disseminated among all market participants at once through the stock exchange.
23. We confirm that all other material principles enshrined in the Code have been complied with except for the following, towards which reasonable progress is being made by the Corporation to seek compliance by the end of next accounting year.- Formulation of mechanism to evaluate the Board’s own performance.[Non-compliance of clause (v)(e)
of the Code].- Formulation of whistle blowing policy by the Board. [Non-compliance of clause (v)(c) of the Code].
__________________________ ArifElahiP.A.S.
Chairman/CEO Dated: September 28, 2015
Consolidated Report and Accounts
ofPakistan National
Shipping CorporationGroup of Companies
for the year ended June 30, 2015
49Annual Report 2015
50 Pakistan National Shipping Corporation

Notes to and Forming part of the Consolidated Financial StatementsFor the year ended June 30, 2015
Auditors’ Report to the Members
A. F. FERGUSON & CO.CHARTERED ACCOUNTANTSa member firm of the PwC networkSTATE LIFE BUILDING 1-CI. I. CHUNDRIGAR ROADKARACHI
ERNST & YOUNG FORD RHODES SIDAT HYDER CHARTERED ACCOUNTANTSa member firm of Ernst & Young Global LimitedPROGRESSIVE PLAZABEAUMONT ROADKARACHI
We have audited the annexed consolidated financial statements comprising consolidated balance sheet of Pakistan National Shipping Corporation and its subsidiary companies as at June 30, 2015 and the related consolidated profit and loss account, consolidated statement of changes in equity and consolidated cash flow statement together with the notes forming part thereof, for the year then ended. We have also expressed separate opinions on the financial statements of Pakistan National Shipping Corporation and its subsidiary companies. These financial statements are the responsibility of the holding company’s management. Our responsibility is to express an opinion on these statements based on our audit.
Our audit was conducted in accordance with the International Standards on Auditing and accordingly includes such tests of accounting records and such other auditing procedures as we considered necessary in the circumstances.
In our opinion the consolidated financial statements present fairly the financial position of Pakistan National Shipping Corporation and its subsidiary companies as at June 30, 2015 and the results of their operations for the year then ended.
A. F. FERGUSON & CO.Chartered AccountantsKarachi: September 28, 2015Audit Engagement Partner : Khurshid Hasan
ERNST & YOUNG FORD RHODES SIDAT HYDERChartered AccountantsKarachi: September 28, 2015Audit Engagement Partner : Riaz A. Rehman Chamdia
51Annual Report 2015

Notes to and Forming part of the Consolidated Financial StatementsFor the year ended June 30, 2015
Consolidated Balance SheetAs at June 30, 2015
Note 2015 2014------------(Rupees in ‘000)------------
ASSETSNON-CURRENT ASSETS
Property, plant and equipment 4 25,178,610 22,567,568 Intangible asset 5 - - Investment properties 6 1,767,473 1,080,596 Long-term investments in:
- Related party (associate) 7 - - - Listed companies and another entity 8 53,434 53,669
Long-term loans and advances 58 58 Long-term deposits 90 90 Deferred taxation 9 97,669 90,777
27,097,334 23,792,758 CURRENT ASSETS
Stores and spares 10 624,542 637,847 Trade debts - unsecured 11 2,263,510 2,439,569 Agents’ and owners’ balances - unsecured 12 18,065 124,824 Loans and advances 13 102,562 58,564 Trade deposits and short-term prepayments 14 54,754 47,664 Interest / mark-up accrued on bank deposits and investments 38,271 35,009 Other receivables 15 277,309 343,625 Insurance claims 16 393 7,032 Taxation-net 1,019,637 749,726 Short-term investments 17 1,961,375 2,294,880 Cash and bank balances 18 2,812,430 1,852,441
9,172,848 8,591,181 TOTAL ASSETS 36,270,182 32,383,939
EQUITY AND LIABILITIES
EQUITY ATTRIBUTABLE TO THE OWNERS OF THE HOLDING COMPANYShare capital 19 1,320,634 1,320,634 Reserves 20 22,952,012 21,144,018
24,272,646 22,464,652
NON-CONTROLLING INTEREST 21 2,961 2,515 EQUITY ATTRIBUTABLE TO EQUITY HOLDERS OF THE GROUP 24,275,607 22,467,167
SURPLUS ON REVALUATION OF PROPERTY, PLANT AND EQUIPMENT - NET OF TAX 22 1,131,132 771,073
NON-CURRENT LIABILITIES
Long-term financing - secured 23 5,748,035 4,568,861 Deferred liabilities 24 851,561 617,483
6,599,596 5,186,344 CURRENT LIABILITIES
Trade and other payables 25 2,440,420 2,520,301 Provision against damage claims 26 20,223 31,973 Current portion of long-term financing 23 1,702,054 1,316,882 Incomplete voyages 27 18,452 11,684 Accrued mark-up on long term financing 82,698 78,515
4,263,847 3,959,355
TOTAL EQUITY AND LIABILITIES 36,270,182 32,383,939
CONTINGENCIES AND COMMITMENTS 28
The annexed notes 1 to 50 form an integral part of these consolidated financial statements.
Arif Elahi P.A.S.
Chairman & Chief ExecutiveCapt. Anwar Shah
Director
52 Pakistan National Shipping Corporation

Notes to and Forming part of the Consolidated Financial StatementsFor the year ended June 30, 2015
Note 2015 2014------------(Rupees in ‘000)------------
REVENUEIncome from shipping business 29 15,381,351 15,585,416 Rental income 154,937 141,130
15,536,288 15,726,546 EXPENDITUREFleet expenses - direct 30 (12,240,228) (12,243,641)Fleet expenses - indirect 31 (30,277) (33,878)Real estate expenses 32 (98,843) (67,541)
(12,369,348) (12,345,060)GROSS PROFIT 3,166,940 3,381,486
Administrative expenses 33 (1,038,073) (816,516)Other expenses 34 (1,367,157) (799,616)Other income 35 2,121,287 1,185,721
(283,943) (430,411)OPERATING PROFIT 2,882,997 2,951,075
Finance costs 36 (669,949) (548,845)
PROFIT BEFORE TAXATION 2,213,048 2,402,230
Taxation 37 (96,638) (253,173)
PROFIT FOR THE YEAR 2,116,410 2,149,057
Attributable to:Equity holders of the Holding Company 2,115,964 2,148,674 Non-controlling interest 446 383
2,116,410 2,149,057 OTHER COMPREHENSIVE INCOME FOR THE YEAR
Items that will not be reclassified to profit and loss accountRemeasurement of post-retirement benefits obligation (131,004) 1,307 Tax on remeasurement of post-retirement benefits obligation 14,621 914
(116,383) 2,221 TOTAL COMPREHENSIVE INCOME FOR THE YEAR 2,000,027 2,151,278
----------------(Rupees)----------------EARNINGS PER SHARE FOR PROFIT ATTRIBUTABLE
TO EQUITY HOLDERS OF THE HOLDING COMPANY 38 16.02 16.27
Note: The appropriations from profits are set out in the statement of changes in equity.
The annexed notes 1 to 50 form an integral part of these consolidated financial statements.
Consolidated Profit and Loss AccountFor the year ended June 30, 2015
Arif Elahi P.A.S.
Chairman & Chief ExecutiveCapt. Anwar Shah
Director
53Annual Report 2015

Notes to and Forming part of the Consolidated Financial StatementsFor the year ended June 30, 2015
Attributable to the share holders of the Holding Company
Issued, subscribed and fully paid-up
share capital (Note 19)
Capital reserve
Revenue reserves
Non-controlling
interestTotalGeneral
reserves
Remeasur-ement of post
retirement benefits
obligation - net of tax
Unappro-priated profit
Total
-----------------------------------------------------------(Rupees in ‘000)-----------------------------------------------------------
Balance as at July 1, 2013 1,320,634 131,344 129,307 (228,743) 19,092,511 18,993,075 2,132 20,447,185
Final cash dividend for the year ended June 30, 2013 paid to shareholders of the Holding Company @ Re 1 per ordinary share - - - - (132,063) (132,063) - (132,063)
Profit for the year - - - - 2,148,674 2,148,674 383 2,149,057
Other comprehensive incomefor the year - - - 2,221 - 2,221 - 2,221
Total comprehensive incomefor the year - - - 2,221 2,148,674 2,150,895 383 2,151,278
Surplus on revaluation of property, plant and equipment realised during the year on account of incremental depreciation charged thereon - net of tax (note 22) - - - - 7,449 7,449 - 7,449
Transaction cost incurred for issue of further share capital of subsidiary - - - -
(6,682) (6,682) - (6,682)Balance as at June 30, 2014 1,320,634 131,344 129,307 (226,522) 21,109,889 21,012,674 2,515 22,467,167
Final cash dividend for the year ended June 30, 2014 paid to shareholders of the Holding Company @ Rs 1.5per ordinary share - - - - (198,095) (198,095) - (198,095)
Profit for the year - - - - 2,115,964 2,115,964 446 2,116,410
Other comprehensive income for the year - - - (116,383) - (116,383) - (116,383)
Total comprehensive income for the year - - - (116,383) 2,115,964 1,999,581 446 2,000,027
Surplus on revaluation of property, plant and equipment realised during the year on account of incremental depreciation - - - - 6,508 6,508 - 6,508 charged thereon - net of tax (note 22)
Balance as at June 30, 2015 1,320,634 131,344 129,307 (342,905) 23,034,266 22,820,668 2,961 24,275,607
The annexed notes 1 to 50 form an integral part of these consolidated financial statements.
Consolidated Statement of Changes in EquityFor the year ended June 30, 2015
Arif Elahi P.A.S.
Chairman & Chief ExecutiveCapt. Anwar Shah
Director
54 Pakistan National Shipping Corporation

Notes to and Forming part of the Consolidated Financial StatementsFor the year ended June 30, 2015
Note 2015 2014
-------------(Rupees in ‘000)-------------
Cash flows from operating activities
Cash generated from operations 39 3,351,122 3,419,104
Employees’ gratuity paid (57,015) (7,474)
Employees’ compensated absences paid (85,475) (60,241)
Post-retirement medical benefits paid (32,401) (25,938)
Finance costs paid (850,326) (793,788)
Receipt under cross currency interest rate swap 211,069 208,955
Taxes paid (452,521) (738,950)
Net cash generated from operating activities 2,084,453 2,001,668
Cash flows from investing activities
Purchase of property, plant and equipment (3,643,869) (435,253)
Proceeds from disposal of property, plant and equipment 481,236 -
Short term investments redeemed / (made) during the year 36,065 (1,497,440)
Interest / mark-up received 298,913 256,400
Dividends received 2,024 821
Net cash used in investing activities (2,825,631) (1,675,472)
Cash flows from financing activities
Long-term financing obtained 3,081,375 (1,323,158)
Long-term financing repaid (1,482,700) -
Transaction costs paid for issue of ordinary share capital - (6,682)
Dividends paid (194,948) (130,226)
Net cash generated / (used in) from financing activities 1,403,727 (1,460,066)
Net increase / (decrease) in cash and cash equivalents 662,549 (1,133,870)
Cash and cash equivalents at the beginning of the year 2,649,881 3,783,751
Cash and cash equivalents at the end of the year 40 3,312,430 2,649,881
The annexed notes 1 to 50 form an integral part of these consolidated financial statements.
Consolidated Cash Flow StatementFor the year ended June 30, 2015
Arif Elahi P.A.S.
Chairman & Chief ExecutiveCapt. Anwar Shah
Director
55Annual Report 2015

Notes to and Forming part of the Consolidated Financial StatementsFor the year ended June 30, 2015
1. GENERAL INFORMATION
Pakistan National Shipping Corporation (the Holding Company), its subsidiary companies and an associate (together ‘the Group’) were incorporated under the provisions of the Pakistan National Shipping Ordinance, 1979 and the Companies Ordinance, 1984, respectively. The Group is principally engaged in the business of shipping, including charter of vessels, transportation of cargo and other related services. The Group is also engaged in renting out its properties to tenants under lease agreements. The Group’s registered office is situated at PNSC Building, Moulvi Tamizuddin Khan Road, Karachi except for Pakistan Co-operative Ship Stores (Private) Limited which is situated at 70/4, Timber Pond, N.M Reclamation Kemari, Karachi. The Group consists of:
Holding company- Pakistan National Shipping Corporation
Subsidiary companies- Bolan Shipping (Private) Limited- Chitral Shipping (Private) Limited- Hyderabad Shipping (Private) Limited- Islamabad Shipping (Private) Limited- Johar Shipping (Private) Limited- Kaghan Shipping (Private) Limited- Karachi Shipping (Private) Limited - Khairpur Shipping (Private) Limited- Lahore Shipping (Private) Limited - Lalazar Shipping (Private) Limited- Makran Shipping (Private) Limited- Malakand Shipping (Private) Limited- Multan Shipping (Private) Limited- Pakistan Co-operative Ship Stores (Private) Limited- Quetta Shipping (Private) Limited- Sargodha Shipping (Private) Limited- Shalamar Shipping (Private) Limited- Sibi Shipping (Private) Limited- Swat Shipping (Private) Limited
Associate - Muhammadi Engineering Works (Private) Limited
The Holding Company owns 73% (2014: 73%) of the share capital of Pakistan Co-operative Ship Stores (Private) Limited and 100% (2014: 100%) of the share capital of the remaining eighteen subsidiary companies. All the wholly owned subsidiaries operate one vessel / tanker each with the exception of Bolan Shipping (Private) Limited, Swat Shipping (Private) Limited, Lalazar Shipping (Private) Limited, Johar Shipping (Private) Limited, Kaghan Shipping (Private) Limited, Khairpur Shipping (Private) Limited, Islamabad Shipping (Private) Limited, Sargodha Shipping (Private) Limited and Makran Shipping (Private) Limited which currently do not own any vessel / tanker.
2. SIGNIFICANT ACCOUNTING INFORMATION AND POLICIES
The principal accounting policies applied in the preparation of these consolidated financial statements are set out below. These policies have been consistently applied to all the years presented, unless otherwise stated.
56 Pakistan National Shipping Corporation

Notes to and Forming part of the Consolidated Financial StatementsFor the year ended June 30, 2015
2.1 Basis of preparation
These consolidated financial statements have been prepared in accordance with approved accounting standards as applicable in Pakistan. Approved accounting standards comprise of such International Financial Reporting Standards (IFRSs) issued by the International Accounting Standards Board and Islamic Financial Accounting Standards (IFAS) issued by the Institute of Chartered Accountants of Pakistan (ICAP) as are notified under the Companies Ordinance, 1984 (the Ordinance), provisions of and directives issued under the Ordinance. In case requirements differ, the provisions or directives of the Ordinance shall prevail. These consolidated financial statements have been prepared under the historical cost convention unless otherwise specifically stated.
The preparation of consolidated financial statements in conformity with approved accounting standards requires the use of certain significant accounting estimates. It also requires management to exercise its judgment in the process of applying the Group’s accounting policies. The areas involving a higher degree of judgment or complexity, or areas where assumptions and estimates are significant to the consolidated financial statements are disclosed in note 3 of these consolidated financial statements.
2.2 New standards, amendments to published approved accounting standards and interpretations
2.2.1 New amendments to approved accounting standards and interpretations which became effective during the year ended June 30, 2015
There were certain new amendments to the approved accounting standards and new interpretations issued by the International Financial Reporting Interpretations Committee (IFRIC) which became effective during the year but are considered not to be relevant or have any significant effect on the Group’s operations and are, therefore, not disclosed in these consolidated financial statements.
2.2.2 New standard, amendments to approved accounting standards and new interpretations that are not yet effective and have not been early adopted by the Group
There are certain amendments to the approved accounting standards and new interpretation issued by IFRIC which will be effective after July 1, 2015 but are considered not to be relevant or are expected to have any significant effect on the Groups’s operations and are, therefore, not disclosed in these financial statements except for IFRS 13, “Fair value measurement”, which aims to improve consistency and reduce complexity by providing a precise definition of fair value and a single source of fair value measurement and disclosure requirements for use across IFRSs. The requirement do not extend the use of fair value accounting but provide guidance on how it should be applied where its use is already required or permitted by other standards within IFRSs. The standard will affect the determination of fair value and its related disclosures in the financial statements of the Group. The Group is yet to assess the full impact of the amendments.
2.3 Basis of consolidation
2.3.1 Subsidiaries
These consolidated financial statements comprise the financial statements of the Holding Company and all of its subsidiary companies as at June 30 each year.
The financial statements of the subsidiary companies have been consolidated on a line-by-line basis and the carrying values of the investments held by the Holding Company have been eliminated against the shareholders’ equity in the subsidiary companies.
The financial statements of the subsidiaries are prepared for the same reporting year as the Holding Company, using consistent accounting policies.
57Annual Report 2015

Notes to and Forming part of the Consolidated Financial StatementsFor the year ended June 30, 2015
All intra-group balances, transactions, income and expenses and profits and losses resulting from intra-group transactions are eliminated in full.
Subsidiaries are fully consolidated from the date of acquisition, being the date on which the Group obtains control, and continue to be consolidated until the date that such control ceases.
The purchase method of accounting is used to account for the acquisition of subsidiaries by the Group. The cost of an acquisition is measured as the fair value of the assets given, equity instruments issued and liabilities incurred or assumed at the date of exchange, plus costs directly attributable to the acquisition. Identifiable assets acquired and liabilities and contingent liabilities assumed in a business combination are measured initially at their fair values at the acquisition date, irrespective of the extent of any non-controlling interest. The excess of the cost of acquisition over the fair value of the Group’s share of the identifiable net assets acquired is recorded as goodwill.
Transactions with non-controlling interests
The Group treats transactions with non controlling interest as transactions with equity owners of the Group. For purchase of interest from non controlling interests, the difference between any consideration paid and relevant share acquired of the carrying value of net assets of the subsidiary is recorded in equity. Gains or losses on disposals to non-controlling interests are also recorded in equity.
When the Group ceases to have control or significant influence, any retained interest in the equity is remeasured to its fair value, with the change in carrying amount recognised in the profit and loss account. The fair value is the initial carrying amount for the purposes of subsequent accounting for the retained interest as an associate, joint venture or financial assets. In addition, any amount previously recognised in other comprehensive income in respect to that entity are accounted for as if the Group had directly disposed off the related assets and liabilities.
2.3.2 Associates
Associates are all entities over which the Group has significant influence but no control. Investments in associate is accounted for using the equity method of accounting and are initially recognised at cost.
2.4 Property, plant and equipment
These are initially recognised at cost and subsequently carried at cost less accumulated depreciation and impairment losses, if any, except for leasehold land, buildings on leasehold land, beach huts and workshop machinery and equipment which are carried at revalued amounts less accumulated depreciation and any subsequent impairment losses, if any. The revaluation of related assets is carried out with sufficient regularity to ensure that the carrying amounts do not differ materially from those which would have been determined using fair values at the balance sheet date.
The value assigned to leasehold land is not depreciated as the leases are expected to be renewed for further periods on payment of relevant rentals. Annual lease rentals are charged to profit and loss account and premium paid at the time of renewal, if any, is amortised over the remaining period of the lease.
Depreciation is charged to income applying the straight line method whereby the depreciable amount of an asset is depreciated over its estimated useful life.
No depreciation is charged if the asset’s residual value exceeds its carrying amount.
Full month’s depreciation is charged in the month of acquisition and no depreciation is charged in the month of disposal. An item of property, plant and equipment is derecognised upon disposal or when no future economic benefits are expected from its use.
58 Pakistan National Shipping Corporation

Notes to and Forming part of the Consolidated Financial StatementsFor the year ended June 30, 2015
Residual values, useful lives and methods of depreciation are reviewed at each balance sheet date and adjusted if expectations differ significantly from previous estimates.
A revaluation deficit is recognised in profit and loss account, except that a deficit directly offsetting a previous surplus on any asset, in which case the deficit is recognised in surplus on revaluation of property, plant and equipment account. Surplus on revaluation can not be distributed to shareholders until it is transferred to retained earnings. An annual transfer from the surplus on revaluation of property, plant and equipment account to retained earnings is made for the difference between depreciation based on the revalued carrying amount of the assets and the depreciation based on the assets’ original cost. Additionally, accumulated depreciation as at the revaluation date is eliminated against the gross carrying amount of the assets and the net amount is restated to the revalued amount of the assets. Upon disposal, any revaluation reserve relating to the particular assets being sold is transferred to retained earnings.
Major spare parts and stand-by equipment qualify for recognition as property, plant and equipment when the Group expects to use them during more than one year.
Maintenance and normal repairs are charged to profit and loss account as and when incurred. Major renewals, replacements and improvements are capitalised and assets so replaced, if any, are retired.
2.5 Capital work-in-progress
These are stated at cost less accumulated impairment losses, if any. All expenditure connected with specific assets incurred during installation and construction period are carried under this head. These are transferred to specific assets as and when these assets are available for use.
2.6 Intangible assets
Intangible assets are initially recognised at cost and are subsequently carried at cost less accumulated amortisation and impairment losses, if any.
Amortisation is charged to profit and loss account by applying straight-line method whereby the cost less residual value, if not insignificant, of an asset is written off over its estimated useful life to the Group. Full month’s amortisation is charged in the month of acquisition and no amortisation is charged in the month of disposal.
2.7 Investment properties
Properties held for long-term rental yields which are significantly rented out by the Group are classified as investment properties.
Investment properties are measured initially at cost, including related transaction costs. After initial recognition at cost, investment properties are carried at their fair values based on market value determined by professional independent valuers with sufficient regularity. Fair values are based on active market prices, adjusted, if necessary, for any difference in the nature, location or condition of the specific asset. The valuation of these properties is carried out with sufficient regularity.
Additions to investment properties consist of costs of a capital nature. The profit on disposal is determined as the difference between the sales proceeds and the carrying amount of the asset at the commencement of the accounting period plus capital expenditure in the period.
59Annual Report 2015

Notes to and Forming part of the Consolidated Financial StatementsFor the year ended June 30, 2015
2.8 Impairment of non-financial assets
The Group assesses at each balance sheet date whether there is any indication that the assets may be impaired. If such indications exist, the carrying amounts of such assets are reviewed to assess whether they are recorded in excess of their recoverable amounts. Where carrying values exceed the respective recoverable amount, assets are written down to their recoverable amounts and the resulting impairment charge is recognised in income except for impairment loss on revalued assets, which is recognised directly against revaluation surplus of any other asset to the extent that the impairment loss does not exceed the amount held in the revaluation surplus.
2.9 Financial instruments
2.9.1 Financial assets
The Group classifies its financial assets in the following categories:
a) Financial assets at fair value through profit or loss
Financial assets at fair value through profit or loss are financial assets held for trading and financial assets designated upon initial recognition as at fair value through profit or loss.
b) Loans and receivables
Loans and receivables are non-derivative financial assets with fixed or determinable payments that are not quoted in an active market.
c) Available-for-sale financial assets
Available-for-sale financial assets are non-derivatives that are either designated in this category or not classified in any of the other categories.
All financial assets are recognised at the time when the Group becomes a party to the contractual provisions of the instrument. Regular purchases and sales of investments are recognised at trade-date i.e. the date on which the Group commits to purchase or sell the asset.
Financial assets are initially recognised at fair value plus transaction costs for all financial assets not carried at fair value through profit or loss. Financial assets carried at fair value through profit or loss are initially recognised at fair value and transactions costs are expensed in the profit and loss account.
Available-for-sale financial assets and financial assets at fair value through profit or loss are subsequently carried at fair value. Loans and receivables are carried at amortised cost using effective interest rate method.
Financial assets are derecognised when the rights to receive cash flows from the assets have expired or have been transferred and the Group has transferred substantially all the risks and rewards of ownership.
2.9.2 Impairment
The Group assesses at each balance sheet date whether there is objective evidence that a financial asset or group of financial assets is impaired.
2.9.3 Financial liabilities
All financial liabilities are recognised at the time when the Group becomes a party to the contractual provisions of the instrument.
60 Pakistan National Shipping Corporation

Notes to and Forming part of the Consolidated Financial StatementsFor the year ended June 30, 2015
A financial liability is derecognised when the obligation under the liability is discharged or cancelled or expired.
2.9.4 Derivative financial instruments
The Group uses derivative financial instruments such as interest rate and cross currency swaps to manage its risks associated with interest and exchange rate fluctuations. Such derivative financial instruments are initially recognised at fair value on the date on which a derivative contract is entered into and are subsequently re-measured at fair value. Derivatives with positive market values (unrealised gains) are included in ‘other receivables’ and derivatives with negative market values (unrealised losses) are included in ‘trade and other payables’ in the balance sheet. Any gains or losses arising from changes in fair value of derivatives that do not qualify for hedge accounting are recognised directly to the profit and loss account.
2.9.5 Off-setting of financial assets and financial liabilities
A financial asset and a financial liability is offset and the net amount is reported in the consolidated financial statements if the Group has a legally enforceable right to set-off the transaction and also intends either to settle on a net basis or to realise the asset and settle the liability simultaneously.
2.10 Stores and spares
Stores are valued at weighted average cost while spares are valued at cost determined on first-in first-out basis. Stores and spares in transit are valued at cost incurred upto the balance sheet date.
Certain spares having low value and high consumption levels are charged to profit and loss account at the time of purchase.
The Group reviews the carrying amount of stores and spares on a regular basis and provision is made for obsolescence if there is any change in the usage pattern and physical form.
2.11 Trade debts and other receivables
Trade and other debts are recognised at the fair value of consideration to be received against goods and services and are carried at amortised cost. Provision is made in respect of doubtful debts, if any. Debts, considered irrecoverable, are written off, as and when identified.
2.12 Taxation
2.12.1 Current
Provision for current taxation is based on taxable income for the year at the current rates of taxation after taking into account tax credits and tax rebates available, if any, and tax paid on final tax basis or minimum tax on turnover, whichever is higher. The charge for current tax also includes adjustments, where considered necessary, to provision for tax made in pervious years arising from assessments framed during the year for such years. For certain subsidiaries owing and operating vessels, the charge for current taxation is based on Final Tax Regime (FTR) under clause 21(a) of Part II of the Second Schedule to the Income Tax Ordinance, 2001.
2.12.2 Deferred
Deferred income tax is provided using the liability method for all temporary differences arising at the balance sheet date, between tax bases of assets and liabilities and their carrying amounts. Deferred tax liabilities are recognized for all taxable temporary differences and deferred tax assets are recognized for all deductible temporary differences, unused tax losses and unused tax credits to the extent that it is probable that future taxable profits will be available which these can be utilised.
61Annual Report 2015

Notes to and Forming part of the Consolidated Financial StatementsFor the year ended June 30, 2015
2.13 Insurance claims
Hull claims and other claimable expenses relating to hull are charged to income currently and claims filed there-against are taken to income when such claims are accepted by the underwriters.
Afloat medical expenses, cargo claims and other relevant amounts recoverable from underwriters are recognised to insurance claims receivable.
2.14 Trade and other payables
Liabilities for trade and other amounts payable are carried at cost which is the fair value of the consideration to be paid in future for goods and services whether billed or not.
2.15 Provisions
Provisions are recognised when the Group has a present legal or constructive obligation as a result of past events, it is probable that an outflow of resources embodying economic benefits will be required to settle the obligation and a reliable estimate of the obligation can be made. Provisions are reviewed at each balance sheet date and adjusted to reflect the current best estimate.
2.16 Dividend and appropriations
Dividends declared and transfers between reserves made subsequent to the balance sheet date are considered as non-adjusting events and are recognised in the consolidated financial statements in the period in which such dividends are declared / transfers are made.
2.17 Staff retirement benefits
2.17.1 The Group operates an approved provident fund scheme for all its permanent employees. Equal monthly contributions are made, both by the Group and its employees, to the fund at the rate of 10 percent of the basic salaries of employees.
2.17.2 Defined benefit gratuity scheme
The Group operates a funded retirement gratuity scheme for its permanent employees other than those who joined the Group on or after October 16, 1984. Further, the Group also operates an unfunded retirement gratuity scheme for contractual employees. Provisions are made in the consolidated financial statements to cover obligations on the basis of actuarial valuation carried out annually under the projected unit credit method. The remeasurement of defined benefit contribution is recognised directly to equity through other comprehensive income.
The benefit is payable on completion of prescribed qualifying period of service under these schemes.
Actuarial valuation is carried out annually and the latest valuation was carried out as at June 30, 2015 using the projected unit credit method.
The Group’s crew members are also entitled to gratuity in accordance with the Pakistan Maritime Board Regulations. However, these employee benefits are recognised upon payment as the amounts involved are not material.
2.17.3 Post-retirement medical benefits
The Group provides lump sum medical allowance to its retired permanent employees in accordance with the service regulations.
62 Pakistan National Shipping Corporation

Notes to and Forming part of the Consolidated Financial StatementsFor the year ended June 30, 2015
Provisions are made in the consolidated financial statements to cover obligations on the basis of actuarial valuation carried out annually using the projected unit credit method. The remeasurement of post-retirement benefit obligation is recognised directly to equity through other comprehensive income.
The benefit is payable on completion of prescribed qualifying period of service under these schemes.
Actuarial valuation is carried out annually and the latest valuation was carried out as at June 30, 2015 using the projected unit credit method.
2.18 Employees’ compensated absences
The Group accounts for the liability in respect of employees’ compensated absences in the year in which these are earned. Annual provisions to cover the obligations under the scheme are based on actuarial estimates and are charged to profit and loss account currently. The remeasurement of defined benefit obligation arising at each valuation date is recognised immediately.
Actuarial valuation is carried out annually and the latest valuation was carried out as at June 30, 2015 using the projected unit credit method.
2.19 Cash and cash equivalents
Cash and cash equivalents include cash in hand, cheques in hand, deposits held with banks and other short-term highly liquid investments with maturities of three months or less.
2.20 Foreign currency translation
These consolidated financial statements are presented in Pakistani Rupee, which is the Group’s functional and presentation currency.
Transactions in foreign currencies are recorded in Pakistani Rupee at the exchange rates approximating those prevailing on the date of transaction. Monetary assets and liabilities in foreign currencies are reported in Pakistani Rupee at the exchange rates approximating those prevalent at the balance sheet date. Gains and losses on translation are recognised to profit and loss account.
2.21 Revenue recognition
- Earnings in respect of voyages other than time charter voyages are accounted for on the basis of completed voyages. Voyages are taken as complete when a vessel arrives at the last port of discharge and completes discharge of entire cargo on or before the balance sheet date. Freight revenue, direct and indirect operating expenses associated with the incomplete voyages are deferred until completion of voyage and are classified in the balance sheet as ‘Incomplete voyages’. With respect to time charter voyages, chartering revenue is accounted for on the basis of number of days to the balance sheet date.
- Rental income is recognised as revenue on a straight line basis over the term of the respective lease arrangements.
- Dividend income is recognised when the Group ‘s right to receive the dividend is established.
- Profit from bank accounts and return on investments is recognised on a time proportion basis.
63Annual Report 2015

Notes to and Forming part of the Consolidated Financial StatementsFor the year ended June 30, 2015
2.22 Contingent liabilities
Consistent with prior year contingent liability is disclosed when:
- there is a possible obligation that arises from past events and whose existence will be confirmed only by the occurrence or non-occurrence of one or more uncertain future events not wholly within the control of the Corporation; or
- there is present obligation that arises from past events but it is not probable that an outflow of resources embodying economic benefits will be required to settle the obligation or the amount of the obligation cannot be measured with sufficient reliability.
2.23 Benazir Employees’ Stock Option Scheme
On August 14, 2009, the Government of Pakistan (GoP) launched Benazir Employees’ Stock Option Scheme (the Scheme) for employees of certain State Owned Enterprises (SOEs) and non-State Owned Enterprises where GoP holds significant investments (non-SOEs). The Scheme is applicable to permanent and contractual employees who were in employment of these entities on the date of launch of the Scheme, subject to completion of five years vesting period by all contractual employees and by permanent employees in certain instances.
The Scheme provides for a cash payment to employees on retirement or termination based on the price of shares of respective entities. To administer this scheme, GoP shall transfer 12% of its investment in such SOEs and non-SOEs to a trust fund to be created for the purpose of such entities. The eligible employees would be allotted units by each Trust Fund in proportion to their respective length of service and on retirement or termination of such employees would be entitled to receive such amounts from Trust Funds in exchange for the surrendered units as would be determined based on market price of listed entities or breakup value of non-listed entities. The shares related to the surrendered units would be transferred back to GoP.
The Scheme also provides that 50% of dividend related to shares transferred to the respective Trust Fund would be distributed amongst the unit-holder employees. The balance 50% dividend would be transferred by the respective Trust Fund to the Central Revolving Fund managed by the Privatisation Commission of Pakistan for payment to employees against surrendered units. The deficits, if any, in Trust Funds to meet the re-purchase commitment would be met by GoP.
The Scheme, developed in compliance with the stated GoP policy of the empowerment of employees of SOEs need to be accounted for by the covered entities, including the Group, under the provisions of amended International Financial Reporting Standard-2 ‘Share Based Payments’ (IFRS 2). However, keeping in view the difficulties that may be faced by the entities covered under the Scheme, the Securities & Exchange Commission of Pakistan on receiving the representation from some of the entities covered under the Scheme and after having consulted the Institute of Chartered Accountants of Pakistan, has granted exemption vide SRO 587(I)/2011 dated June 7, 2011 to such entities from application of IFRS 2 to the Scheme.
During the year ended June 30, 2015, the shares have not been transferred to the respective Trust Fund under the Scheme as the matter is pending with the Ministry of Finance, Revenue, Economic Affairs, Statistics and Privitisation (Privatisation Commission). The Scheme is being revamped by GoP and all claims and disbursements to the employees are kept in abeyance.
Had the exemption not been granted, the retained earnings would have been lower by Rs 631.142 million (2014: Rs 631.142 million) and reserves would have been higher by Rs 631.142 million (2014: Rs 631.142 million) based on the independent actuarial valuations conducted as on June 30, 2014. However the impact of staff cost and profit for the year is immaterial for the purpose of these consolidated financial statements.
64 Pakistan National Shipping Corporation

Notes to and Forming part of the Consolidated Financial StatementsFor the year ended June 30, 2015
3. SIGNIFICANT ACCOUNTING ESTIMATES, JUDGEMENTS AND ASSUMPTIONS
The preparation of consolidated financial statements requires management to make judgments, estimates and assumptions that affect the reported amounts of revenues, expenses, assets and liabilities, and the disclosure of contingent liabilities, at the end of the reporting period. However, uncertainty about these assumptions and estimates could result in outcomes that require a material adjustment to the carrying amount of the asset or liability affected in future periods.
In the process of applying the accounting policies, management has made the following estimates and judgements which are significant to the consolidated financial statements.
(a) Valuation of certain property, plant and equipment and investment properties;
(b) Determination of the residual values and useful lives of property, plant and equipment;
(c) Recognition of taxation and deferred taxation;
(d) Accounting for provision for impairment against loans and advances, trade debts, agents and owners balances, deposits and other receivables;
(e) Accounting for provision against damage claims;
(f) Accounting for defined benefit plans;
(g) Measuring fair value of cross currency swap and interest rate swap;
(h) Recoverable amount of investment in related parties; and
(i) Determination of contingent assets and liabilities.
Estimates and judgements are continually evaluated and are based on historical experience and other factors, including expectation of future events that are believed to be reasonable under the circumstances.
Note 2015 2014----------(Rupees in ‘000)----------
4. PROPERTY, PLANT AND EQUIPMENT
- Operating fixed assets 4.1 24,480,366 21,894,357 - Major spare parts and stand-by equipment 4.6 221,523 218,731 - Capital work-in-progress - buildings on leasehold land 4.8 476,721 454,480
25,178,610 22,567,568
65Annual Report 2015

Notes to and Forming part of the Consolidated Financial StatementsFor the year ended June 30, 2015
4.1
The
follo
win
g is
a s
tate
men
t of o
pera
ting
fixed
ass
ets:
Leas
ehol
d la
nd
Build
ings
on
leas
ehol
d la
nd
Vess
el fl
eet
Vehi
cles
Offic
e eq
uipm
ent
Furn
iture
an
d fit
tings
Mot
or
laun
ch a
nd
jetty
Equi
pmen
t on
boa
rdCo
ntai
ner
fittin
gsBe
ach
huts
Wor
ksho
p m
achi
nery
an
d eq
uipm
ent
Com
pute
r eq
uipm
ent
Tota
l Co
stDr
y do
ckin
gTo
tal
(not
e 4.
2 an
d 4.
3)(n
ote
4.2
and
4.3)
(not
e 4.
4)(n
ote
4.2
and
4.3
)(n
ote
4.3)
----
----
----
----
----
----
----
----
----
----
----
----
----
----
----
----
----
----
----
----
----
----
----
----
----
----
-(Rup
ees i
n ‘0
00)--
----
----
----
----
----
----
----
----
----
----
----
----
----
----
----
----
----
----
----
----
----
----
----
----
----
---
As
at J
une
30, 2
013
Cos
t or r
eval
ued
amou
nt
649
,060
5
78,0
38
24,4
72,7
02
903
,107
2
5,37
5,80
9 6
8,04
5 4
9,37
0 3
1,31
1 1
8 1
8,84
0 3
,468
1
4,98
8 1
4,95
7 3
6,88
5 2
6,84
0,78
9 L
ess:
Acc
umul
ated
dep
reci
atio
n
-
7
4,66
7 3
,276
,066
6
29,6
98
3,9
05,7
64
65,
116
22,
512
16,
820
18
8,0
41
3,4
68
1,2
98
10,
413
28,
848
4,1
36,9
65
Net
boo
k va
lue
6
49,0
60
503
,371
2
1,19
6,63
6 2
73,4
09
21,
470,
045
2,9
29
26,
858
14,
491
-
10,
799
-
13,
690
4,5
44
8,0
37
22,
703,
824
Year
end
ed J
une
30, 2
014
Open
ing
net b
ook
valu
e 6
49,0
60
503
,371
2
1,19
6,63
6 2
73,4
09
21,
470,
045
2,9
29
26,
858
14,
491
-
10,
799
-
13,
690
4,5
44
8,0
37
22,
703,
824
Addi
tions
-
3,0
81
-
229
,671
2
29,6
71
-
1,0
26
136
-
2
,098
-
-
33
3
5,2
43
241
,588
Tr
ansf
ers
from
CW
IP -
5
,557
-
-
-
-
-
-
-
-
-
-
-
-
5
,557
Writ
e of
fCo
st -
-
-
-
-
-
-
-
(1
8) -
(3
,468
) -
-
-
(3
,486
)Ac
cum
ulat
ed d
epre
ciat
ion
-
-
-
-
-
-
-
-
18
-
3
,468
-
-
-
3
,486
-
-
-
-
-
-
-
-
-
-
-
-
-
-
-
Depr
ecia
tion
char
ge fo
r the
yea
r -
(2
7,15
3) (8
40,2
37)
(166
,849
) (1
,007
,086
) (1
,107
) (6
,609
) (3
,671
) -
(2
,547
) -
(1
,399
) (4
72)
(6,5
68)
(1,0
56,6
12)
Clos
ing
net b
ook
valu
e 6
49,0
60
484
,856
2
0,35
6,39
9 3
36,2
31
20,
692,
630
1,8
22
21,
275
10,
956
-
10,
350
-
12,
291
4,4
05
6,7
12
21,
894,
357
As a
t Jun
e 30
, 201
4
Cost
or r
eval
ued
amou
nt 6
49,0
60
586
,676
2
4,47
2,70
2 1
,132
,778
2
5,60
5,48
0 6
8,04
5 5
0,39
6 3
1,44
7 -
2
0,93
8 -
1
4,98
8 1
5,29
0 4
2,12
8 2
7,08
4,44
8 L
ess:
Acc
umul
ated
dep
reci
atio
n -
1
01,8
20
4,1
16,3
03
796
,547
4
,912
,850
6
6,22
3 2
9,12
1 2
0,49
1 -
1
0,58
8 -
2
,697
1
0,88
5 3
5,41
6 5
,190
,091
Ne
t boo
k va
lue
649
,060
4
84,8
56
20,
356,
399
336
,231
2
0,69
2,63
0 1
,822
2
1,27
5 1
0,95
6 -
1
0,35
0 -
1
2,29
1 4
,405
6
,712
2
1,89
4,35
7
Year
end
ed J
une
30, 2
015
Addi
tions
-
3,4
81
3,4
17,7
52
130
,382
3
,548
,134
-
2
,361
2
03
-
7,3
22
-
-
68
10,
750
3,5
72,3
19
Tran
sfer
s fro
m C
WIP
-
10,
038
-
-
-
-
-
-
-
-
-
-
-
-
10,
038
Disp
osal
s (4
.5)
Cost
-
-
(7
72,6
36)
(228
,678
) (1
,001
,314
) -
(2
81)
(11)
-
(4,8
72)
-
-
-
-
(1,0
06,4
78)
Accu
mul
ated
dep
reci
atio
n -
-
4
19,6
38
228
,678
6
48,3
16
-
265
8
-
4
,193
-
-
-
-
6
52,7
82
-
-
(352
,998
) -
(3
52,9
98)
-
(16)
(3)
-
(679
) -
-
-
-
(3
53,6
96)
Surp
lus
on re
valu
atio
n 2
13,2
92
243
,938
-
-
-
-
-
-
-
-
-
3
,038
-
-
4
60,2
68
Writ
e of
fCo
st -
(6
,221
) (1
1,42
5) -
(1
1,42
5) -
-
-
-
-
-
-
-
-
(1
7,64
6)Ac
cum
ulat
ed d
epre
ciat
ion
-
-
1,7
04
-
1,7
04
-
-
-
-
-
-
-
-
-
1,7
04
-
(6,2
21)
(9,7
21)
-
(9,7
21)
-
-
-
-
-
-
-
-
-
(15,
942)
Depr
ecia
tion
char
ge fo
r the
yea
r -
(2
7,36
6) (8
88,4
92)
(151
,636
) (1
,040
,128
) (8
80)
(6,3
51)
(3,3
82)
-
(2,9
31)
-
(1,4
16)
(499
) (4
,025
) (1
,086
,978
)Cl
osin
g ne
t boo
k va
lue
862
,352
7
08,7
26
22,
522,
940
314
,977
2
2,83
7,91
7 9
42
17,
269
7,7
74
-
14,
062
-
13,
913
3,9
74
13,
437
24,
480,
366
As
at J
une
30, 2
015
Cos
t or r
eval
ued
amou
nt
862
,352
7
12,5
96
27,
106,
393
1,0
34,4
82
28,
140,
875
68,
045
52,
476
31,
639
-
23,
388
-
13,
913
15,
358
52,
878
29,
973,
520
Les
s: A
ccum
ulat
ed d
epre
ciat
ion
-
3,8
70
4,5
83,4
53
719
,505
5
,302
,958
6
7,10
3 3
5,20
7 2
3,86
5 -
9
,326
-
-
1
1,38
4 3
9,44
1 5
,493
,154
N
et b
ook
valu
e
862
,352
7
08,7
26
22,
522,
940
314
,977
2
2,83
7,91
7 9
42
17,
269
7,7
74
-
14,
062
-
13,
913
3,9
74
13,
437
24,
480,
366
-
-
Annu
al ra
te o
f dep
reci
atio
n (%
)20
15 -
3
to 2
0 3
.33
20 to
40
-
2015
10 to
15
10 to
15
10 to
15
1510
5 to
10
25An
nual
rate
of d
epre
ciat
ion
(%)
2014
-
3 to
20
3.3
3 20
to 4
0 -
20
1510
to 1
510
to 1
510
to 1
515
105
to 1
025
66 Pakistan National Shipping Corporation

Notes to and Forming part of the Consolidated Financial StatementsFor the year ended June 30, 2015
4.2 The revaluation of the ‘leasehold land’, ‘buildings on leasehold land’ and ‘beach huts’ was carried out as of June 30, 2015 by FairWater Property Valuers & Surveyors (Pvt.) Limited on the basis of their professional assessment of present market values. The revaluation resulted in a surplus of Rs 460.268 million on the written down values of Rs 1,121.228 million which were incorporated in the books of the Group as at June 30, 2015. Out of the total revaluation surplus arisen, Rs 1,257.662 million (2014: Rs 806.965 million) remains undepreciated at June 30, 2015.
4.3 Had there been no revaluation, the carrying amount of revalued assets would have been as follows:
2015 2014------------(Rupees in ‘000)-------------
Leasehold land, buildings on leasehold land and beach huts 275,426 285,874 Workshop machinery and equipment 3,864 4,290
279,290 290,164
4.4 Cost and accumulated depreciation of vessel amounting to Rs 1.440 million relates to M.V Ilyas Bux. This vessel was seized by the Indian authorities during the 1965 war and the Group does not have physical possession or control over the vessel.
4.5 The following operating fixed assets with a net book value exceeding Rs 50,000 were disposed off during the year:
ParticularsMode of disposal
CostAccumulated depreciation
Written down value
Sale proceeds
Gain on disposal
Particulars of purchaser
-------------------------------(Rupees in ‘000)-------------------------------Vessel Fleet Tender sale
through broker
- MV Kaghan
Vessel cost 772,636 (419,638) 352,998
Messrs. Vincente
Investments Inc.
Dry docking 228,678 (228,678) -
Equipment on board 4,872 (4,193) 679
Major spare parts and stand-by equipments
96,209 (71,976) 24,233
Total 1,102,395 (724,485) 377,910 481,177 103,267
2015 2014----------(Rupees in ‘000)----------
4.6 Major spare parts and standby equipment
Net carrying value
Balance at beginning of the year 218,731 191,893 Additions during the year 39,271 48,888 Disposals made during the year (24,233) - Balance at end of the year 233,769 240,781 Depreciation (12,246) (22,050)Net book value 221,523 218,731
67Annual Report 2015

Notes to and Forming part of the Consolidated Financial StatementsFor the year ended June 30, 2015
Note 2015 2014----------(Rupees in ‘000)----------
4.7 The depreciation charge for the year has been allocated as follows:
Fleet expenses - direct 30 1,025,416 1,026,798 Fleet expenses - indirect 31 499 474 Real estate expenses 32 21,973 21,816 Administrative expenses 33 21,612 24,860 Incomplete voyages 27 29,724 4,714
1,099,224 1,078,662
4.8 Capital work-in-progress - buildings on leasehold land
Balance at the beginning of the year 454,480 315,260 Additions during the year 32,279 144,777 Transferred to operating fixed assets during the year (10,038) (5,557)Balance at the end of the year 476,721 454,480
5. INTANGIBLE ASSET
This represents cost of Rs 16.503 million of software “Ship Management Expert System” (SES). SES was being amortised over the useful life of five years and was fully amortised during the year ended June 30, 2009, however, it is still in active use.
6. INVESTMENT PROPERTIES
NoteLeasehold
landBuildings on
leasehold landTotal
-----------------(Rupees in ‘000)-----------------
Balance as at July 1, 2014 1,043,560 37,036 1,080,596 Gain on revaluation of investment properties 6.1 682,430 4,447 686,877 Balance as at June 30, 2015 1,725,990 41,483 1,767,473
6.1 The revaluation of the Group investment properties was carried out by FairWater Property Valuers & Surveyors (Pvt.) Limited as of June 30, 2015 on the basis of their professional assessment of present market value. As a result, a revaluation gain of Rs 686.877 million was determined in respect of leasehold land whereas a revaluation gain amounting to Rs 4.447 million was determined on buildings.
7. LONG-TERM INVESTMENTS IN RELATED PARTY (ASSOCIATE)
Equity method
No. of shares - ordinary
Name of the company
Country of incorporation
Share of net assets
Latest available audited financial statements for the year ended
Percentage holding
Face value per share
2015 2014 2015 2014 2015 2014
---(Rupees ‘000)--- % (Rupees) ---(Rupees ‘000)---
Associate - unlisted
12,250 12,250
Muhammadi Engineering Works Limited Pakistan
Paskitan 1,600 1,600 December 31 ,
1982 (unaudited)
49 100 1,600 1,600
Less: Accumulated impairment losses
1,600 1,600
- -
68 Pakistan National Shipping Corporation

Notes to and Forming part of the Consolidated Financial StatementsFor the year ended June 30, 2015
Note 2015 2014----------(Rupees in ‘000)----------
8. LONG-TERM INVESTMENTS IN LISTED COMPANIES AND ANOTHER ENTITY
Financial assets designated as ‘at fair value through profit or loss’
Listed companies
Siemens (Pakistan) Engineering Limited.6,930 (2014: 6,930) fully paid ordinary shares of Rs 10each. Market value per share as at June 30, 2015Rs 1,274.23 (2014: Rs 1,257). 8.1 8,830 8,711
Pakistan State Oil Company Limited.115,358 (2014: 115,358) fully paid ordinary shares of Rs 10 each. Market value per share as at June 30, 2015Rs 385.79 (2014: Rs 388.86). 8.2 44,504 44,858
53,334 53,569 Available-for-sale financial asset
Other entity - carried at cost
Pakistan Tourism Development Corporation Limited.10,000 (2014: 10,000) fully paid ordinary shares of Rs 10 each. 100 100
53,434 53,669 8.1 The Group holds 0.084% (2014: 0.084%)
of the investee’s share capital.
Opening balance 8,711 4,513 Change in fair value 119 4,198
8,830 8,711
8.2 The Group holds 0.04246% (2014: 0.04246%) of the investee’s share capital.
Opening balance 44,858 33,598 Change in fair value (354) 11,260
44,504 44,858 9. DEFERRED TAXATION
Deductible temporary differences arising in respect of short-term provisions and deferred liabilities 232,676 136,660
Taxable temporary differences arising in respect of:- surplus on revaluation of property, plant and equipment 22 126,530 35,892 - accelerated depreciation 8,477 9,991
135,007 45,883 97,669 90,777
69Annual Report 2015

Notes to and Forming part of the Consolidated Financial StatementsFor the year ended June 30, 2015
9.1 The management of the Group is confident that sufficient future taxable profits will be available against which deferred tax asset will be adjusted.
Note 2015 2014-----------(Rupees in ‘000)-----------
10. STORES AND SPARES
Stores
- at depots 11,343 9,495 - at buildings 742 845 - on board 26,693 22,991
38,778 33,331 Spares
- at buildings 1,063 1,062 - in transit 169 169 - on board 264,164 193,449
265,396 194,680
Bunker on board 320,368 409,836 624,542 637,847
11. TRADE DEBTS - unsecured
Considered good 11.1 2,263,470 2,439,569 Considered doubtful 232,503 242,749
2,495,973 2,682,318 Less: Provision for impairment 11.2 232,463 242,749
2,263,510 2,439,569
11.1 The ageing analysis of these trade debts that are past due but not impaired is as follows:
Note 2015 2014-----------(Rupees in ‘000)-----------
Upto 1 month 482,820 1,031,717 1 to 6 months 470,338 933,226 More than 6 months 1,310,312 474,626
2,263,470 2,439,569 11.2 Provision for impairment
Balance at the beginning of the year 242,749 252,814 Provision made during the year 34 2,543 - Provision reversed during the year - (9,961)Provision written off during the year (12,829) (104)Balance at the end of the year 11.3 232,463 242,749
70 Pakistan National Shipping Corporation

Notes to and Forming part of the Consolidated Financial StatementsFor the year ended June 30, 2015
11.3 As at June 30, 2015, trade debts of Rs 232.463 million (2014: Rs 242.749 million) were impaired and provided for. These balances have been outstanding for more than three years.
Note 2015 2014-----------(Rupees in ‘000)-----------
12. AGENTS’ AND OWNERS’ BALANCES - unsecured
Considered good 12.1 18,065 124,824 Considered doubtful 4,453 4,453
22,518 129,277 Less: Provision for impairment 4,453 4,453
18,065 124,824
12.1 The ageing analysis of these agents’ and owners’ balances that are past due but not impaired is as follows:
2015 2014-----------(Rupees in ‘000)-----------
Upto 1 month 3,528 60,128 1 to 6 months 8,256 64,033 More than 6 months 6,281 663
18,065 124,824
13. LOANS AND ADVANCES - considered good
LoansTo employees 1 1
Advances- employees 40,731 46,738 - contractors and suppliers 38,124 3,197 - others 23,706 8,628
102,562 58,564
14. TRADE DEPOSITS AND SHORT-TERM PREPAYMENTS
Deposits
- considered good 15,960 9,914 - considered doubtful 369 369
16,329 10,283 Less: Provision for impairment 369 369
15,960 9,914
Prepayments 38,794 37,750
54,754 47,664
71Annual Report 2015

Notes to and Forming part of the Consolidated Financial StatementsFor the year ended June 30, 2015
Note 2015 2014-----------(Rupees in ‘000)-----------
15. OTHER RECEIVABLES
Rent receivable- considered good 15.1 11,322 10,335 - considered doubtful 3,801 3,801
15,123 14,136 Less: Provision for impairment 3,801 3,801
11,322 10,335
Amount held by lawyer in respect of a guarantee provided to the court 4,952 4,952
Derivative cross currency interest rate swap 15.6 & 15.7 62,991 147,209
Others
- considered good 15.2 198,044 181,129 - considered doubtful 10,832 12,659
15.3 208,876 193,788 Less: Provision for impairment 15.4 10,832 12,659
198,044 181,129 277,309 343,625
15.1 The ageing analysis of rent receivables past due but not impaired is as follows:
2015 2014-----------(Rupees in ‘000)-----------
Upto 1 month (526) 890 1 to 6 months 2,111 1,952 More than 6 months 9,737 7,493
11,322 10,335
15.2 As at June 30, 2015, an amount of Rs 198.044 million (2014: Rs 181.129 million) that are past due but not impaired. These receivables have been outstanding for less than one year.
2015 2014-----------(Rupees in ‘000)-----------
15.3 This includes the following:
Receivable from sundry debtors 177,127 128,226 Sales tax refund claims 25,865 26,017 Insurance claims receivable - 29 Others 5,884 39,516
208,876 193,788
72 Pakistan National Shipping Corporation

Notes to and Forming part of the Consolidated Financial StatementsFor the year ended June 30, 2015
15.4 Provision for impairment2015 2014
----------(Rupees in ‘000)----------
Balance at the beginning of the year 12,659 12,659 Provision reversed during the year (1,827) - Balance at the end of the year 10,832 12,659
15.5 As at June 30, 2015, other receivables of Rs 10.832 million (2014: Rs 12.659 million) were impaired and provided for. These receivables have been outstanding for more than three years.
15.6 The Holding Company has entered into a cross currency interest rate swap of Rs 9,995.300 million in respect of its borrowing (note 23). Under the terms of the cross currency swap arrangement, the Holding Company is required to pay LIBOR plus 3.75% to the arranging bank on the borrowing denominated in USD (USD notional) for the purpose of cross currency swap, and receive KIBOR plus 2.20% from the arranging bank. Further, the Holding Company shall pay / receive any exchange loss / gain on the USD notional outstanding at each quarter end. Furthermore, the Holding Company had also entered into an interest rate swap. Under the terms of the interest rate swap, the Holding Company receives a fixed interest of 13% per annum, whereas the Holding Company has to pay 3 months KIBOR for each quarter. The net fair value of cross currency interest and interest rate swap as determined by the bank were Rs 30.048 million (favourable) (2014: Rs 86.851 million (favourable) and Rs 9.022 million (favourable) (2014: Rs 14.015 million (favourable)) respectively to the Holding Company as of the balance sheet date which has been reduced by the net interest receivable and exchange loss aggregating Rs 23.920 million (2014: Rs 46.343 million) as at June 30, 2015.
15.7 On September 26, 2013, the Holding Company has early terminated one of its cross currency swap contract having a notional amount aggregating Rs 1,244.880 million. The early termination resulted in the payment by the Holding Company to the arranging bank aggregating Rs 87.624 million comprising of net effects of interest received aggregating Rs 7.982 million, exchange loss and swap spread paid amounting to Rs 60.565 million and Rs 35.041 million respectively.
16. INSURANCE CLAIMS
In addition to these, general average claims aggregating to Rs 0.393 million (2014: Rs 6.5 million) are receivable from cargo owners and charterers. These amounts are determined on the basis of adjustment book received from independent adjuster. The Group has not recognised these claims as receivable pending acceptance from the counter parties or underwriter.
Note 2015 2014----------(Rupees in ‘000)----------
17. SHORT-TERM INVESTMENTS
Term deposits with banks having maturity of - more than six months 17.1 300,000 - - three to six months 17.2 1,161,375 1,497,440 - three months or less 17.3 500,000 797,440
1,961,375 2,294,880
17.1 The mark-up on these term deposits denominated in local currency ranges from 8.5 % to 8.75 % (2014 : Nil) per annum.
73Annual Report 2015

Notes to and Forming part of the Consolidated Financial StatementsFor the year ended June 30, 2015
17.2 The mark-up on these term deposits denominated in local currency ranges from 8.10% to 8.80% (2014: 10% to 10.50% ) per annum, whereas mark-up on term deposits denominated in foreign currency is 2.05% to 2.10 % (2014: 2%) per annum.
17.3 The mark-up on these term deposits denominated in local currency ranges from 6.70% to 7.00% (2014: 9.75% to 10.50%) per annum, whereas mark-up on term deposits denominated in foreign currency is Nil (2014: 1.6% to 2%) per annum.
Note 2015 2014----------(Rupees in ‘000)----------
18. CASH AND BANK BALANCES
Cash at bank- in current accounts
- local currency 783,996 413,495 - foreign currency 516,021 145,426
1,300,017 558,921 - in saving accounts
- local currency 18.1 & 18.2 1,510,442 1,290,962 - foreign currency 18.3 1,423 1,579
1,511,865 1,292,541
Cash in hand 548 979 2,812,430 1,852,441
18.1 This includes Rs 2.126 million (2014: Rs 2.126 million) and Rs 3 million (2014: Rs 3 million) held as security by Habib Bank Limited, P.N.S.C. Branch and Soneri Bank Limited, AKU Branch respectively against guarantees issued on behalf of the Holding Company.
18.2 The mark-up on savings accounts in local currency ranges from 4.5% to 6.75% (2014: 4.8% to 9.4%) per annum.
18.3 The mark-up on savings accounts in foreign currency ranges from 0.15% to 0.50% (2014: 0.15% to 0.50%) per annum.
74 Pakistan National Shipping Corporation

Notes to and Forming part of the Consolidated Financial StatementsFor the year ended June 30, 2015
19. SHARE CAPITAL
19.1 Issued, subscribed and fully paid-up capital
2015 2014 2015 2014-----------(No. of Shares)---------- ----------(Rupees in ‘000)---------
24,130,789 24,130,789
Ordinary shares of Rs 10 each issued as fully paid to shareholders of former National Shipping Corporation (NSC) and Pakistan Shipping Corporation (PSC) in consideration of their shareholdings in those companies 241,308 241,308
25,900,000 25,900,000 Ordinary shares of Rs 10 each issued as fully paid to the GoP for cash received in 1985 259,000 259,000
64,309,800 64,309,800
Ordinary shares of Rs 10 each issued as fully paid to the GoP on the financial restructuring of the Holding Company in the year 1989-90 643,098 643,098
17,722,791 17,722,791 Ordinary shares of Rs 10 each issued as fully paid bonus shares 177,228 177,228
132,063,380 132,063,380 1,320,634 1,320,634
19.2 As at June 30, 2015, the GoP held 109,919,234 (2014: 109,919,234) ordinary shares of the Holding Company.
Note 2015 2014----------(Rupees in ‘000)----------
20. RESERVES
Capital reserves 20.1 131,344 131,344 Revenue reserves- remeasurement of post-retirement benefits
obligation - net of tax (342,905) (226,522)- unappropriated profit (including general reserves) 23,163,573 21,239,196
22,952,012 21,144,018
20.1 This includes amount transferred from shareholders’ equity at the time of merger of former NSC and PSC.
2015 2014----------(Rupees in ‘000)----------
21. NON-CONTROLLING INTEREST
Share of non-controlling interest in:- share capital 59 59 - general reserve 10 10 - unappropriated profit 2,446 2,063 - profit for the year 446 383
2,961 2,515
75Annual Report 2015

Notes to and Forming part of the Consolidated Financial StatementsFor the year ended June 30, 2015
Note 2015 2014----------(Rupees in ‘000)----------
22. SURPLUS ON REVALUATION OF PROPERTY, PLANTAND EQUIPMENT - NET OF TAX
Balance at the beginning of the year 806,965 816,603
Add : Surplus arising on revaluation of fixedassets druing the current year 460,268 -
Less: Transferred to unappropriated profit:Surplus relating to incremental depreciation charged
during the current year on related assets - net of tax 6,508 7,449 Related deferred tax liability 3,063 2,189
9,571 9,638 1,257,662 806,965
Less: Related deferred tax liability on:- Revaluation at the beginning of the year 35,892 37,714 - Incremental depreciation charged during the current year
on related assets transferred to profit and loss account (3,063) (2,189)- Surplus arising on revaluation of fixed assets during the current year 79,032 - - Effect of change in statutory tax rate for next year (3,076) 1,109 - Effect of allocation of revenue between presumptive tax regime and normal tax regime 17,745 (742)
9 126,530 35,892 Balance at the end of the year 1,131,132 771,073
23. LONG-TERM FINANCING - secured
Financing under syndicate term finance agreement 23.1 5,907,129 5,142,882 Less: Current portion 1,407,455 1,150,674
4,499,674 3,992,208 Financing under term finance certificates agreement 23.1 580,030 742,861 Less: Current portion 166,208 166,208
413,822 576,653
Financing under musharika agreement 23.2 962,930 - Less: Current portion 128,391 -
834,539 - 5,748,035 4,568,861
23.1 During the year ended June 30, 2011, the Holding Company obtained a financing facility of Rs 10,300 million. The financing was obtained in the form of a syndicated term finance loan of Rs 9,000 million with the remaining amount of Rs 1,300 million in the form of Term Finance Certificates (TFCs) having a face value of Rs 5,000 each by way of private placement.
The financing carries mark-up of KIBOR+2.20%. The loan along with the mark-up is repayable on a quarterly basis with the last repayment date is November 23, 2018. The facility is secured by a first mortgage charge over certain vessels owned by subsidiary companies, all present and future receivables of the Holding Company from three major customers and its investment properties.
76 Pakistan National Shipping Corporation

Notes to and Forming part of the Consolidated Financial StatementsFor the year ended June 30, 2015
As at June 30, 2015, the Holding Company has drawn Rs 8,733.757 million (2014: Rs 8,733.757 million) and Rs 1,261.543 million (2014: Rs 1,261.543 million) from syndicated term finance and TFCs respectively. The Holding Company has also paid loan arrangement fee amounting to Rs 106.662 million out of which Rs Nil (2014: Rs Nil) was included in the amortised cost of the long term financing whereas the remaining amount of Rs 3.155 million has been expensed out upon completion of the drawdowns and expiry of the facility on September 7, 2012.
23.2 During the year ended June 30, 2015, the Holding Company has obtained a financing facility of Rs 4,500 million. The financing was obtained in the form of syndicated term finance loan of Rs 3,000 million, with the remaining amount of Rs 1,500 million through a musharika agreement.
The financing carries mark-up at the rate of KIBOR+1.60%. The loan along with the mark-up is repayable on a quarterly basis with the last repayment date on November 6, 2022. The facility is secured by a first mortgage charge over certain vessels owned by the subsidiary companies of the Holding Company.
During the year ended June 30, 2015, the Holding Company has drawn Rs 2,054.250 million (June 30, 2014: Rs Nil) and Rs 1,027.125 million (June 30, 2014: Rs Nil) from syndicated term finance and musharika respectively. The Holding Company has also paid loan arrangement fee amounting to Rs 45 million which was included fully in the amortised cost of the long term financing, whereas an amount of Rs 315,000 (June 30, 2014: Nil) is expensed out at the time of drawdown.
Note 2015 2014----------(Rupees in ‘000)----------
24. DEFERRED LIABILITIES
Employees’ gratuity- funded 24.1.3 142,289 86,899 - unfunded 24.1.3 167,304 100,995
309,593 187,894 Post-retirement medical benefits 24.1.3 200,989 194,581 Employees’ compensated absences 24.2.3 340,979 235,008
851,561 617,483 24.1 Retirement benefit schemes
24.1.1 The disclosures made in note 24.1.2 to 24.1.15 are based on the information included in the actuarial valuation report as of June 30, 2015.
77Annual Report 2015

Notes to and Forming part of the Consolidated Financial StatementsFor the year ended June 30, 2015
24.1.2 As stated in notes 2.18.2 and 2.18.3 of these consolidated financial statements, the Group operates a funded retirement gratuity scheme for those permanent employees who joined the Group before October 16, 1984, an unfunded retirement gratuity scheme for contractual employees and an unfunded post retirement medical benefit scheme for permanent and contractual employees. Liability is maintained against these schemes based on the actuarial recommendations. The following significant assumptions were used for the actuarial valuation of the defined benefit obligation schemes:
2015 2014Employees’ Post Employees’ Post
gratuity retirement gratuity retirementFunded Unfunded medical Funded Unfunded medical
benefits benefits
Discount rate 9.75% 10.50% 9.75% 13.25% 13.25% 13.25%
Future salary increases - for permanent employeesFor the year 2014-15 N/A - - 40.00% - - For the year 2015-16 2.00% - - 2.00% - - For the year 2016-17 40.00% - - 40.00% - - For the year 2017-18 2.00% - - 2.00% - - For the year 2018-19 40.00% - - 40.00% - - For the year 2019-20 2.00% - - 2.00% - - For the year 2020-21 40.00% - - 13.25% - - For the year 2022-23 and
onwards 9.75% - - 13.25% - -
Future salary increases - for contractual employeesFor the year 2014-15 - - - 15.00% - - For the year 2015-16 - 15.00% - 15.00% - - For the year 2016-17 - 15.00% - 15.00% - - For the year 2017-18 - 15.00% - 15.00% - - For the year 2018-19 - 15.00% - 15.00% - - For the year 2019-20 - 15.00% - 13.25% - - For the year 2020-21 - 10.50% - 13.25% - - For the year 2022- and
onwards - 10.50% - 13.25% - - Medical escalation rate - - 9.75% - - 13.25%Death rate based on SLIC (2001-05) Ultimate mortality tables.
78 Pakistan National Shipping Corporation

Notes to and Forming part of the Consolidated Financial StatementsFor the year ended June 30, 2015
2015 2014Employees’ Post - Employees’ Post
gratuity retirement gratuity retirementFunded Unfunded medical Funded Unfunded medical
benefits benefits---------------------------------------(Rupees in ‘000)---------------------------------------
24.1.3 Balance sheet reconciliation
Present value of defined benefit obligation 432,113 167,304 200,989 397,045 100,995 194,581 Fair value of plan assets (289,824) - - (310,146) - - Net liability in the balance sheet 142,289 167,304 200,989 86,899 100,995 194,581
24.1.4 Movement in present valueof defined benefit obligation
Balance at the beginning of the year 397,045 100,995 194,581 435,454 67,166 200,957 Current service cost 9,256 20,648 7,717 11,991 11,416 7,232 Interest cost 47,025 14,407 23,671 44,414 6,890 21,032 Benefits paid (93,763) (7,015) (32,401) (83,717) (7,474) (25,938)Recognised prior service cost - - - - - 10,273 Remeasurements on obligation 72,550 38,269 7,421 (11,097) 22,997 (18,975)Balance at the end of the year 432,113 167,304 200,989 397,045 100,995 194,581
24.1.5 Movement in fair value of plan assets
Balance at the beginning of the year 310,146 - - 362,802 - - Expected return on plan assets 36,205 - - 36,829 - - Contribution 50,000 - - - - - Benefits paid (93,763) - - (83,717) - - Remeasurement on plan asset (12,764) - - (5,768) - - Balance at the end of the year 289,824 - - 310,146 - -
24.1.6 Movement in net liability in the balance sheet
Balance at the beginning of the year 86,899 100,995 194,581 72,652 67,166 200,957 Expense recognised for the year 20,076 35,055 31,388 19,576 18,306 38,537 Contributions made by the
Holding Company / payments (50,000) (7,015) (32,401) - (7,474) (25,938)Remeasuremens recognised in
other comprehensive income 85,314 38,269 7,421 (5,329) 22,997 (18,975) 142,289 167,304 200,989 86,899 100,995 194,581
24.1.7 The amounts recognised in theincome statement
Current service cost 9,256 20,648 7,717 11,991 11,416 7,232 Net interest amount 10,820 14,407 23,671 7,585 6,890 21,032 Prior service cost - - - - - 10,273 Expense 20,076 35,055 31,388 19,576 18,306 38,537
24.1.8 Remeasurements recognised in Other Comprehensive Income
Losses / (gains) from changes in 45,200 15,902 - (24,281) 9,952 - demographic assumptions 27,350 22,367 7,421 13,184 13,045 (1,381)
Experience losses / (gains) 12,764 - - 5,768 - (17,594)Remeasurement of fair value of plan assets 85,314 38,269 7,421 (5,329) 22,997 (18,975)
Rupees in ‘000 % Rupees in
‘000 %
24.1.9 Major categories / composition of plan assets
Cash and cash equivalents 138,133 47.66% 33,530 10.81%Term deposit receipts of
private commercial banks (unquoted) 151,691 52.34% 276,616 89.19% 289,824 100% 310,146 100%
79Annual Report 2015

Notes to and Forming part of the Consolidated Financial StatementsFor the year ended June 30, 2015
24.1.10 Actual gain on plan assets during the year ended June 30, 2015 was Rs 23.481 million (2014: Rs 31.33 million).
24.1.11 Assumed future salary increase rate and discount rate have a significant effect on the employee’s gratuity. A one percentage point change in assumed future salary increase rate and discount rate would have the following effects:
Increase / (decrease) in defined benefit obligation of Funded Gratuity Scheme Unfunded Gratuity Scheme
Change in assumption
Increase in assumption
Decrease in assumption
Increase in assumption
Decrease in assumption
Discount Rate 1% (10,689) 11,281 (18,178) 22,081 Salary increase rate 1% 11,560 (11,174) 22,025 (18,464)
24.1.12 The weighted average duration of the defined benefit obligations funded and unfunded gratuity scheme is 2.57 and 10.57 years.
24.1.13 Assumed medical cost escalation rate and discount rate have a significant effect on the post-retirement medical benefit. A one percentage point change in assumed medical cost escalation rate and discount rate would have the following effects:
Increase / (decrease) in defined benefit obligation ofPost Retirement Medical Benefits
Permanent Employees Contractual EmployeesChange in
assumptionIncrease in assumption
Decrease in assumption
Increase in assumption
Decrease in assumption
Medical Cost Escalation Rate 1% 3,907 (3,712) 3,139 (2,599)Discount Rate 1% (3,679) 3,944 (2,577) 3,171
24.1.14 The weighted average duration of the defined benefit obligations post medical retirement benefit scheme for permanent and contractual employees is 4.93 years.
24.1.15 The employee gratuity funded and unfunded scheme and post retirement medical benefit plans exposes the Corporation to the following risks:
Investment risk: The risk of the investment underperforming and not being sufficient to meet the liabilities.
Mortality risk: The risk that the actual mortality rate is different. The effect depends on the beneficiaries service/age distribution and the benefit.
Medical cost escalation risks – The risk that the hospitalisation cost could be higher than what we assumed.
Final salary risk: The risk that the final salary at the time of cessation of service is greater than what is assumed. Since the benefit is calculated on the final salary, the benefit amount increases similarly.
Withdrawal risk: The risk of higher or lower withdrawal experienced than assumed. The final effect could go either way depending on the beneficiaries’ service/age distribution and the benefit.
24.2 Employees’ compensated absences
24.2.1 The disclosures made in notes 24.2.2 to 24.2.8 are based on the information included in the actuarial valuation as of June 30, 2015.
80 Pakistan National Shipping Corporation

Notes to and Forming part of the Consolidated Financial StatementsFor the year ended June 30, 2015
24.2.2 As stated in note 2.18, the Group operates an employees’ compensated absences scheme. Provision is maintained against this scheme based on the actuarial recommendations. The following significant assumptions were used for the actuarial valuation of the scheme:
2015 2014
Discount rate 9.75% 13.25%Future salary increases - for permanent employees
For the year 2015-16 - 40.00%For the year 2016-17 40.00% 2.00%For the year 2017-18 2.00% 40.00%For the year 2018-19 40.00% 2.00%For the year 2019-20 2.00% 40.00%For the year 2020-21 40.00% 2.00%For the year 2021-22 and onwards 2.00% 13.25%For the year 2023 and onwards 13.25% 13.25%
Future salary increases - for contractual employeesFor the year 2016-17 till 2017-18 15.00% 15.00%For the year 2018-19 15.00% 15.00%For the year 2019-20 15.00% 13.25%For the year 2020-21 15.00% 13.25%For the year 2022 and onwards 9.75% 13.25%
2015 2014------------(Rupees in ‘000)------------
24.2.3 Balance sheet reconciliation
Present value of defined benefit obligation (recognised) 340,979 235,008
24.2.4 Movement in present value of defined benefit obligation
Balance at the beginning of the year 235,008 225,799 Current service cost 57,227 58,268 Interest cost 32,277 25,413 Remeasurements of obligation 101,942 (14,231)Benefits paid (85,475) (60,241)Balance at the end of the year 340,979 235,008
24.2.5 Expenses
Current service cost 57,227 58,268 Interest cost 32,277 25,413 Remeasurements of obligation 101,942 (14,231)
191,446 69,450
24.2.6 Amounts for the current period and prior period of the present value of defined benefit obligation are as follows:
2015 2014------------(Rupees in ‘000)------------
Present value of defined benefit obligation 340,979 235,008 Experience gain on defined benefit obligation 101,942 (14,231)
81Annual Report 2015

Notes to and Forming part of the Consolidated Financial StatementsFor the year ended June 30, 2015
24.2.7 Assumed future salary increase rate and discount rate have a significant effect on the employee’s compensated absences. A one percentage point change in assumed future salary increase rate and discount rate would have the following effects:
Increase / (decrease) in defined benefit obligation of`
Employees Compensated Absences
Permanent Employees Contractual Employees
Change in assumptionIncrease in assumption
Decrease in assumption
Increase in assumption
Decrease in assumption
Discount rate 1% (7,453) 7,993 (12,831) 16,022 Salary growth rate 1% 8,035 (7,647) 15,940 (13,006)
24.2.8 The risks to which the scheme exposes the Group are disclosed in note 24.1.15.
24.3 Expected retirement benefits costs for the year ending June 30, 2016 are as follows:
(Rupees in ‘000) Gratuity-Funded 24,512 -Unfunded 58,235 Post-retirement medical benefits 25,838 Compensated absences 126,757
24.4 During the year, the Group contributed Rs 12.550 million (2014: Rs 10.589 million) to the provident fund.
Note 2015 2014----------(Rupees in ‘000)---------
25. TRADE AND OTHER PAYABLES
Creditors 157,468 102,188 Agents’ and owners’ balances 396,500 804,063 Accrued liabilities 1,523,053 1,262,344 Deposits 25.1 38,187 68,614 Unclaimed dividends 33,063 29,916 Sales tax payable - 186 Bills payable 762 1,364 Advance from customers 110,899 128,305 Other liabilities- amounts retained from contractors 27,411 23,695 - others 153,077 99,626
180,488 123,321 2,440,420 2,520,301
25.1 These deposits are interest free and are repayable on demand or on completion of specific contracts.
82 Pakistan National Shipping Corporation

Notes to and Forming part of the Consolidated Financial StatementsFor the year ended June 30, 2015
Note 2015 2014----------(Rupees in ‘000)---------
26. PROVISION AGAINST DAMAGE CLAIMS
Balance at the beginning of the year 31,973 22,338 Charged during the year 34 4,615 15,847 Reversed during the year (16,365) (6,212)Balance at the end of the year 20,223 31,973
27. INCOMPLETE VOYAGES Net freight 136,844 49,681
Salaries and allowances 15,944 2,708 Diesel, fuel and lubricants 48,778 18,530 Stores and spares consumed 17,335 4,744 Insurance 5,370 1,074 Charter hire and related expenses - 5,992 Depreciation 4.7 29,724 4,714 Victualling 1,241 235
118,392 37,997 18,452 11,684
28. CONTINGENCIES AND COMMITMENTS
Contingencies
28.1 The contingent liability in respect of claims not acknowledged as debts by the Holding Company as at June 30, 2015 aggregate to Rs 201.116 million (2014: Rs 368.244 million). These claims mainly relate to deficiencies in shipping documentation, delay in delivery of cargo and damages to cargo. These include Rs 2.285 million (2014: Rs 2.225 million) approximately in respect of insurance claims which, if accepted, will be borne by the Holding Company as the P&I Club, Oceanus Mutual Underwriting Association (Bermuda) Limited has gone into liquidation. Out of the remaining claims, a sum of Rs 180.887 million (2014: Rs 273.186 million) approximately would be recoverable from the P&I Club, Steamship Mutual Underwriting Association (Bermuda) Limited, in the event these claims are accepted by the Holding Company. As a matter of prudence, the management has made a total provision of Rs 20.233 million (2014: Rs 31.973 million) against the aforementioned claims in these consolidated financial statements.
28.2 The Holding Company has not accepted liability in respect of customs duty approximating Rs 2.500 million (2014: Rs 2.500 million) relating to the sale of the vessel M.V. Bhambore during the year ended June 30, 1978. The duty was claimed from the Holding Company and the matter has been taken up with the appropriate Government agencies.
28.3 The former owners of East & West Steamship Company, Chittagong Steamship Corporation Limited and Trans Oceanic Steamship Company Limited had initiated litigation that involved the Government of Pakistan and the Holding Company.
Following the Supreme Court’s adjudication of the East & West Steamship Company’s matter in favour of the former owners, the Government provisionally assessed additional compensation due to the former owners at approximately Rs 97.012 million (2014: Rs 97.012 million). Although a major portion of this amount has been settled by the Government, the Government holds the Holding Company liable for this amount by virtue of the net assets of the East & West Steamship Company having become vested in the Holding Company.
83Annual Report 2015

Notes to and Forming part of the Consolidated Financial StatementsFor the year ended June 30, 2015
In case of Chittagong Steamship Corporation Limited and Trans Oceanic Steamship Company Limited, the litigations relating to compensation to the former owners and the legal suits are pending in the High Court of Sindh. The amounts claimed are approximately Rs 1.300 million (2014: Rs 1.300 million) and Rs 66.800 million (2014: Rs 66.800 million) respectively.
The Holding Company disclaims any liability in respect of the above mentioned amounts and any accretions to it upto final determination and settlement of the matters.
28.4 Certain other claims have been filed against the Holding Company in respect of employees’ matters for an aggregate amount of approximately Rs 97.817 million (2014: Rs 108.817 million). These cases are pending and the management is confident that the outcome of these cases will be in the Holding Company’s favour and accordingly no provision for above claims has been made in these consolidated financial statements.
28.5 While framing the tax assessment for the income year ended June 30, 1990, the assessing officer had made an addition to income of Rs 3,974.455 million, being the remission of liabilities due to the Federal Government under the scheme of financial restructuring of the Holding Company. The resultant tax liability including additional taxes for late payment of tax amounted to Rs 1,293.694 million, part of which was paid by the Holding Company and the remaining amount of Rs 1,233.694 million was directly discharged at source by the Federal Government. The assessing officer while framing the order of income year ended June 30, 1996 had treated the aforementioned payment of tax liability by the Government as the income of the Holding Company. The Income Tax Appellate Tribunal (ITAT) has given the decision in favour of the Holding Company on the appeals filed against the above orders. However, the department has filed an appeal with the Honourable High Court against the aforementioned orders of ITAT. The Honourable High Court has decided the appeal against the Holding Company. The leave to appeal filed by the Holding Company has been accepted by the Honourable Supreme Court and the decision of the High Court has been suspended. Hearing of the appeal is pending in the Honourable Supreme Court.
28.6 During the year ended June 30, 2011, the Officer Inland Revenue (OIR) has issued assessment orders under section 122 (5A) of the Income Tax Ordinance, 2001 (ITO, 2001) in respect of tax years 2008, 2009 and 2010. According to the orders, the OIR had made certain additions and determined additional tax demand of Rs 363.421 million. OIR has disallowed a portion of administrative expenses by attributing the same to the subsidiary companies and further disallowed a portion of contribution made to approved gratuity fund (only in respect of tax year 2008) on the contention that the same is attributable to the subsidiary companies. The Holding Company has paid Rs 170 million under protest and filed an appeal with the Commissioner of Income Tax (Appeals). During the year, Commissioner Income Tax (Appeals) in his order has upheld certain additions and has given decisions in favour of the Holding Company on certain matters resulting in refund of Rs 90.579 million. The management has provided for all the matters that have been decided against the Holding Company, with the exception of disallowance of allocation of common expenses to profit on debt for tax year 2008 and 2009 which may result in increase of tax liability by Rs 17.848 million. The Holding Company has filed an appeal with the ITAT in respect of aforementioned disallowances. The management of the Holding Company is confident that the matters in appeals shall be eventually decided in its favour.
28.7 During the year ended June 30, 2012, the OIR issued assessment orders under section 122 (5A) of the ITO, 2001 in respect of tax year 2011. According to the orders, the OIR has made certain additions and determined additional tax demand of Rs 251.092 million. OIR has disallowed a portion of administrative expenses by attributing the same to the subsidiary companies and further disallowed financial expenses incurred by the Holding Company on the contention that the same is equity specific and hence being capital in nature. The Holding Company had paid Rs 160.513 million (2014: Rs 160.513 million) and adjusted Rs 90.579 million against refunds relating to tax year 2008, 2009 and 2010 under protest. During the year, Commissioner of Income Tax (Appeals) in his order has upheld certain additions and has given decisions in favour of the Corporation on certain matters, and has worked out refund of Rs 15.068 million. The Holding Company and the tax department have filed appeals with the ITAT in respect of aforementioned disallowances. The management of the Holding Company is confident that the subject matter in respect of tax year 2011 will eventually be decided in favour of the Holding Company.
84 Pakistan National Shipping Corporation

Notes to and Forming part of the Consolidated Financial StatementsFor the year ended June 30, 2015
28.8 During the year ended June 30, 2013, the OIR issued assessment orders under section 122 (5A) of the ITO, 2001 in respect of tax year 2012. According to the orders, the OIR has made certain additions and determined additional tax demand of Rs 107.499 million. OIR disallowed a portion of administrative expenses by attributing the same to the subsidiary companies and further disallowed financial expenses incurred by the Holding Company on the contention that the same is equity specific and hence being capital in nature. The Holding Company has paid Rs 65 million under protest and filed an appeal with the Commissioner of Income Tax (Appeals). During the year, Commissioner of Income Tax (Appeals) in his order has upheld certain additions and has given decisions in favour of the Holding Company on certain matters, and has worked out refund of Rs 24.022 million. The Holding Company and the department have filed appeals with the ITAT in respect of aforementioned disallowances. The management of the Holding Company is confident that the subject matter in respect of tax year 2012 will eventually be decided in favour of the Holding Company.
28.9 During the year ended June 30, 2014, the OIR has issued assessment orders under section 122 (5A) of the ITO, 2001 in respect of tax year 2013. According to the orders, the OIR has made certain additions and determined additional tax demand of Rs 303.333 million. OIR has disallowed a portion of retirement benefit expenses by attributing the same to the subsidiary companies and further disallowed financial expenses incurred by the Holding Company on the contention that the same is equity specific and hence being capital in nature. Moreover, OIR disallowed the basis of apportionment of expenses. The Holding Company has paid Rs 288.265 million under protest and adjusted Rs 15.068 million against refunds available for the tax year 2011. Further the management has filed an appeal with the Commissioner of Income Tax (Appeals) in his order has upheld certain additions and has given decisions in favour of the Holding Company on certain matters, and worked out a Nil demand. The Holding Company and the department have filed appeals with the ITAT in respect of aforementioned disallowances.
28.10 During the year ended June 30, 2015, ACIR issued assessment order under section 122 (5A) of the ITO, 2001 in respect of tax year 2014. According to the order the ACIR made certain additions and determined additional tax demand of Rs. 170.436 million in respect of certain disallowances regarding financial expenses, administrative costs and post retirement benefits. The Holding Company has paid Rs. 83.438 million under protest and adjusted Rs. 86.998 million against refunds available for tax year 2008, 2009, 2010 and 2013. The management has filed an appeal with the Commissioner of Income Tax (Appeals) and at present the matter is pending for hearing. The management of the Holding Company is confident that the subject matter in respect of tax year 2014 will eventually be decided in favour of the Holding Company. The Commissioner (Appeals) in his order has upheld certain additions and has given addition in favour of the Holding Company on certain matters, however, the appeal effect order has not been passed by the ACIR. The Holding Company and the department have filed appeals with the ITAT in respect of aforementioned order of the Commissioner (Appeals).
28.11 During the year ended June 30, 2014, the Deputy Commissioner Inland Revenue (DCIR) has issued orders under section 161 of the ITO, 2001 in respect of tax years 2008 to 2013. According to the orders, the DCIR has held that the Holding Company was required to withhold tax under section 152 (2) of the ITO, 2001 while making payments to non-resident shipping Companies, and the failure to deduct tax at source renders it personally liable to pay tax along with default surcharge on the unpaid amount of tax, under section 161 and 205 of the ITO, 2001. By virtue of above orders a total tax demand of Rs 2,695.502 million was raised by the tax authorities. The Holding Company filed an appeal with the Commissioner of Income Tax (Appeals) who maintained the orders passed by the DCIR and consequently an appeal was filed before the ATIR. The ATIR, in the appellate order, has held that the payments made by the Holding Company to the non-resident shipping companies are in the nature of “Royalty” and the rate of tax withholding applicable on such payments would be 15 per cent. Accordingly, the tax demand originally raised has been reduced to Rs 1,659.485 million. The Holding Company Legal Counsel has filed a reference in the Honorable High Court against the order passed by the ATIR. A rectification application has also been filed with ATIR which is pending for hearing.
85Annual Report 2015

Notes to and Forming part of the Consolidated Financial StatementsFor the year ended June 30, 2015
28.12 Further, during the year ended June 30, 2015, the DCIR has issued show cause notice under section 161 of the Ordinance in respect of tax year 2014 proposing to raise tax demand of Rs 1,324.077 million on the aforementioned matter. The Holding Company took up the matter to the Honourable High Court and the Court has suspended the show cause notice till further notice. The management of the Holding Company is confident that the subject matter in respect of tax years 2008 to 2013 will eventually be decided in favour of the Holding Company, and hence no provision has been recorded in the consolidated financial statements in respect of the said matter.
28.13 During the year ended June 30, 2014, the Assistant Commissioner Sindh Revenue Board (AC) has passed an order under Sindh Sales Tax on Services Act, 2011 for the tax period July 2011 to June 2012. The AC has held the Holding Company liable to pay sales tax on ‘Administrative and Financial Services’ provided to its subsidiaries and has also levied sales tax on the services that are provided by the Holding Company outside Sindh. By virtue of above order an additional tax demand of Rs 12.654 million, along with default surcharge of Rs 1.012 million was raised by the taxation authorities. The Holding Company paid the amount under protest and filed Appeal with Commissioner Appeals - SRB (CA) which was decided against the Holding Company. The Holding Company has filed another appeal against the decision of CA with the Appellate Tribunal, SRB which is pending for hearing.
28.14 The Taxation Officer (TO) issued an amended assessment order under section 122(5A) of the Income Tax Ordinance, 2001 in respect of tax year 2003 against Karachi Shipping (Private) Limited (KSPL). According to the amended order, TO made additions to taxable income of the Company aggregating to Rs 163.523 million mainly on account of interest income and gain on sale of fixed assets, which have been taxed separately. The Company made payment of Rs 70.315 million under protest, being the additional tax demand raised by the TO in his order and filed an appeal against the subject order with Commissioner of Income Tax (Appeals) – CIT(A). Consequently, the Company filed a petition to Alternate Dispute Resolution Committee (ADRC) with respect to the said matter. During the year ended June 30, 2009 the ADRC upheld the decision of TO and decided the matter against the Company. As the Company was not satisfied with the order, the Company continued to pursue its remedy against CIT(A) which is at present pending for hearing.
The management of KSPL is confident that the matter in the appeal shall eventually be decided in its favour. Without prejudice to the contentions of the management, the management has as a matter of prudence provided for amount aggregating Rs 70.315 million as payment under protest in these consolidated financial statements.
28.15 While framing tax assessment for the income year ended June 30, 2005, the Taxation Officer (TO) issued order under section 122 (5A) of the the Income Tax Ordinance, 2001 whereby demand of Rs 139.118 million was raised by the tax department against Lalazar Shipping (Private) Limited (LSPL). According to the order, the TO is of the view that the income appearing under the head ‘other income’ in the annual audited financial statements for the said year is taxable under normal tax regime with reference to section 39 of the Income Tax Ordinance, 2001. LSPL had filed appeals with Commissioner of Income Tax (Appeals) and Income Tax Appellate Tribunal, however, the appeals were decided in favour of the tax department.
During the year ended June 30, 2011, the Honourable High Court had heard the appeal filed by LSPL and reduced the tax demand raised by OIR to Rs 68.284 million. LSPL had paid the reduced tax demand under protest and filed an appeal with the Honourable Supreme Court for which leave to appeal was granted to LSPL. Further, the tax department had also filed an appeal with the Honourable Supreme Court against the order and the matter is at present pending for hearing.
The management of LSPL is confident that the matter shall eventually be decided in favour of LSPL.
Commitments
28.16 Commitments in respect of capital expenditure amount to Rs 86.023 million (2014: Rs 193.057 million).
28.17 Outstanding letters of guarantee amount to Rs 5.126 million (2014: Rs 5.126 million).
86 Pakistan National Shipping Corporation

Notes to and Forming part of the Consolidated Financial StatementsFor the year ended June 30, 2015
Note 2015 2014----------(Rupees in ‘000)---------
29. INCOME FROM SHIPPING BUSINESS
Owned vessels - combi vessels - 25,771 - bulk carriers 2,099,858 2,512,075 - oil tankers 5,267,928 4,751,035
7,367,786 7,288,881 Chartered vessels - slot charter revenue 2,432,556 1,503,241 - voyage charter revenue 5,581,009 6,793,294
8,013,565 8,296,535 15,381,351 15,585,416
30. FLEET EXPENSES - DIRECT
Diesel, fuel and lubricants consumed 2,053,987 2,394,434 Stevedoring and transhipment expenses 22,969 13,900 Ocean loss 16,092 21,793 Port, light, canal and customs dues 797,407 651,194 Salaries and allowances 594,281 621,866 Charter hire and related expenses 30.1 6,766,067 6,620,384 Fleet communication expenses 25,281 24,018 Agency commission and brokerage 120,728 140,384 Victualling expenses 63,089 66,991 Insurance 257,603 276,105 Claim charges 16,753 - Stores and spares consumed 203,128 153,751 Repairs, maintenance and special surveys 184,415 150,056 Depreciation on opening incomplete voyage 27 4,714 25,068 Depreciation 4.7 1,025,416 1,026,798
1,030,130 1,051,866 Exchange loss / (gain) 7,131 (39,940)Services sales tax expense 7,928 8,447 Additional war risk 14,923 15,771 Sundry expenses 58,316 72,621
12,240,228 12,243,641 30.1 Charter hire and related expenses
Foreign flag vessels- voyage charter expenses 5,510,305 5,854,181 - slot charter expenses 1,255,762 766,203
6,766,067 6,620,384 31. FLEET EXPENSES - INDIRECT
Salaries and allowances 31.1 19,599 14,838 Agents’ and other general expenses 31.2 7,279 15,881 Legal and professional charges 2,130 1,931 Depreciation 4.7 499 474 General establishment expenses 770 754
30,277 33,878
87Annual Report 2015

Notes to and Forming part of the Consolidated Financial StatementsFor the year ended June 30, 2015
31.1 This includes Rs 2.081 million (2014: Rs 1.756 million) in respect of provident fund contribution.
Note 2015 2014----------(Rupees in ‘000)---------
31.2 Agents’ and other general expenses
Legal and professional charges 8 5,094 Printing and stationery 1,163 57 Advertisement and publicity 1,157 1,185 Telephone, telex and postage 3,204 3,172 Air freight 1,396 1,328 Bank charges and commission 342 382 Sundry expenses 9 4,663
7,279 15,881 32. REAL ESTATE EXPENSES
Salaries and allowances 32.1 39,723 8,658 General establishment expenses 32.2 26,358 25,752 Rent, rates and taxes 6,015 7,286 Insurance 4,024 4,008 Depreciation 4.7 21,973 21,816 Legal and professional charges 750 21
98,843 67,541
32.1 This includes Rs 0.292 million (2014: Rs 0.246 million) in respect of provident fund contribution.
Note 2015 2014----------(Rupees in ‘000)---------
32.2 General establishment expenses
Repairs and maintenance 9,581 5,718 Security charges 9,797 6,632 Light, power and water 6,810 13,064 Vehicle running, repairs and maintenance expenses 170 338
26,358 25,752 33. ADMINISTRATIVE EXPENSES
Workshop management expense 77,713 56,098 Salaries and allowances 33.1 609,421 468,787 General establishment expenses 33.2 216,293 193,637 Rent, rates and taxes 16,200 5,972 Scholarship and training expenses 4,069 2,196 Insurance 3,221 3,586 Depreciation 4.7 21,612 24,860 Directors’ fee 41.2 1,770 1,350 Legal and professional charges 53,662 28,649 Services sales tax expense - 339 Sales tax expenses 33,985 17,236 Loss on settlement of trade debts - 13,798 Sundry expenses 127 8
1,038,073 816,516
88 Pakistan National Shipping Corporation

Notes to and Forming part of the Consolidated Financial StatementsFor the year ended June 30, 2015
33.1 This includes Rs 4.8 million (2014: Rs 4.016 million) in respect of provident fund contribution.
Note 2015 2014----------(Rupees in ‘000)---------
33.2 General establishment expenses
Repairs and maintenance 11,206 9,973 Medical expenses 45,063 53,975 Contribution to employees welfare fund 8 9 Contribution to group term insurance 1,631 1,865 Security charges 3,653 2,524 Travelling and conveyance 56,296 47,702 Entertainment and canteen subsidy 8,489 2,884 Books, periodicals and subscription 6,119 5,506 Uniform and liveries 1,283 1,204 Hajj expenses 2,297 1,551 Printing and stationery 6,037 3,825 Telephone, telex and postage 9,190 6,954 Light, power and water 11,471 10,263 Computer expenses 8,966 7,851 Advertisement and publicity 11,337 5,083 Vehicle running, repairs and maintenance expenses 16,668 17,779 Ship inspection expenses 3,024 2,269 Sundry expenses 13,555 12,420
216,293 193,637
34. OTHER EXPENSES
Donations 34.1 1,000 1,000 Auditors’ remuneration 34.2 12,551 11,289 Demurrage expenses 961,381 625,611 Employees’ gratuity
- funded 24.1.7 20,076 19,576 - unfunded 24.1.7 35,055 18,306
55,131 37,882 Post - retirement medical benefits 24.1.7 31,388 38,537 Loss on revaluation of derivative instruments 61,797 - Loss on revaluation of long-term investments
in listed companies 235 - Provision for doubtful debt 2,543 - Fixed assets written off 9,721 - Loss on disposal of stores 35,349 - Employees’ compensated absences 24.2.5 191,446 69,450 Provision in respect of damage claims 26 4,615 15,847
1,367,157 799,616
34.1 Donations were not made to any donee in which the Group or a director or his spouse had any interest.
89Annual Report 2015

Notes to and Forming part of the Consolidated Financial StatementsFor the year ended June 30, 2015
34.2 Auditors’ remuneration2015 2014
A. F. Ernst & YoungTotal
A. F. Ernst & Young Total Ferguson Ford Rhodes Ferguson Ford Rhodes
& Co. Sidat Hyder & Co. Sidat Hyder------------------------------------(Rupees in ‘000)------------------------------------
Audit fee - the Holding Company 1,115 1,115 2,230 1,061 1,061 2,122Audit fee - subsidiaries 1,576 1,576 3,152 1,461 1,461 2,922Review of half yearly
financial statements 385 385 770 360 360 720Review of compliance with
the best practices of the code of corporate governance 118 118 236 106 106 212
Fee for audit of the consolidated financial statements 139 139 278 130 130 260
Tax advisory services 4,828 - 4,828 4,286 - 4,286Central Depository Company
certification fees 15 - 15 15 - 15Out of pocket expenses 521 521 1,042 376 376 752
8,697 3,854 12,551 7,795 3,494 11,289
Note 2015 2014----------(Rupees in ‘000)---------
35. OTHER INCOME
Income from financial assets / liabilities
Income from saving account and term deposits 302,175 271,510 Dividend income 2,024 821 Agency fee 46,894 28,051 Gain on revaluation of long-term investments - 15,458 Gain on revaluation of swap derivative - net - 210,297 Gain on revaluation of investment properties 686,877 - Cargo Claim 1,042 - Liability no longer required written back 5,804 - Demurrage income 863,444 496,820 Exchange gain 13,052 10,051
Income from non-financial assets
Gain on disposal of fixed assets 103,307 - Sale of scrap - 456 Provisions no longer required written back 19,011 16,173 Insurance claims 35.1 20,736 80,495 Ocean loss written back - 1,050 Sundry income 56,921 54,539
2,121,287 1,185,721
90 Pakistan National Shipping Corporation

Notes to and Forming part of the Consolidated Financial StatementsFor the year ended June 30, 2015
35.1 This represents recoveries from hull, cargo and other claims according to the insurance policies.
Note 2015 2014----------(Rupees in ‘000)---------
36. FINANCE COSTS
Interest on long-term financing 854,509 796,913 Gain on cross currency interest rate swap derivative 36.1 (188,648) (251,104)Bank charges 4,088 3,036
669,949 548,845
36.1 This relates to the amount received during the year on account of quarterly exchanges and terminations under the swap arrangement.
2015 2014----------(Rupees in ‘000)---------
37. TAXATION
Tax charge for:
- current year 212,272 305,430 - prior years (29,662) (42,579)
182,610 262,851 Deferred (85,972) (9,678)
96,638 253,173
37.1 In view of the tax losses for the year, provision for minimum taxation has been made in accordance with section 113 of the Income Tax Ordinance, 2001 (I.T.O).
Minimum tax rate under section 113 of I.T.O for the tax year 2015 is 1 % of turnover. No numeric tax rate reconciliation is given as the Corporation is liable for turnover tax only.
38. EARNINGS PER SHARE FOR PROFIT ATTRIBUTABLE TO EQUITY HOLDERS OF THE HOLDING COMPANY
2015 2014----------(Rupees in ‘000)---------
Profit for the year 2,115,964 2,148,674
-----------(No. of Shares)----------
Weighted average ordinary shares in issue during the year 132,063,380 132,063,380
--------------(Rupees)--------------
Earnings per share - basic and diluted 16.02 16.27
There were no dilutive potential ordinary shares outstanding as at June 30, 2015 and 2014.
91Annual Report 2015

Notes to and Forming part of the Consolidated Financial StatementsFor the year ended June 30, 2015
Note 2015 2014----------(Rupees in ‘000)---------
39. CASH GENERATED FROM OPERATIONS
Profit before taxation 2,213,048 2,402,230
Adjustments for non-cash charges and other items:Depreciation 1,069,500 1,078,662 Gain on disposal of fixed assets (103,307) - Fixed assets written off 9,721 - Loss on disposal of stores and spares 35,349 - Provision in respect of damage claims 4,615 15,847 Provision for employees’ gratuity 55,131 37,882 Provision for employees’ compensated absences 191,446 69,450 Provision for post retirement medical benefits 31,388 38,537 Dividend income (2,024) (821)Provision for impairment on doubtful debts 5,086 - Provision for impairment on other receivables 1,827 - Reversal of provision against damage claims (16,365) (6,212)Liabilities no longer payable written back (5,804) - Interest / mark-up income (302,175) (271,510)Interest / mark-up expense 854,509 799,949 Loss / (gain) on revaluation of long-term investments 235 (15,458)Gain on cross currency interest rate swap derivative (126,851) (461,401)Gain on revaluation of investment properties (686,877) - Working capital changes 39.1 122,670 (268,051)
3,351,122 3,419,104
39.1 Working capital changes Decrease / (increase) in current assets:Stores and spares (22,044) 96,545 Trade debts - unsecured 170,973 (1,261,878)Agents’ and owners’ balances 106,759 (115,833)Loans and advances (43,998) 8,980 Deposits and short-term prepayments (41,419) (10,089)Other receivables (19,729) (28,438)Insurance claims 6,639 162,408
157,181 (1,148,305)Decrease / (increase) in current liabilities:Incomplete voyages 36,492 110,864 Trade and other payables (71,003) 769,390
(34,511) 880,254 122,670 (268,051)
40. CASH AND CASH EQUIVALENTS
Short-term investments having maturity of three months or less 17 500,000 797,440
Cash and bank balances 18 2,812,430 1,852,441 3,312,430 2,649,881
92 Pakistan National Shipping Corporation

Notes to and Forming part of the Consolidated Financial StatementsFor the year ended June 30, 2015
41. REMUNERATION OF CHAIRMAN, EXECUTIVE DIRECTORSAND OTHER EXECUTIVES
The aggregate amount of remuneration including all benefits to the Chairman and Chief Executive, Executive Directors / Directors and Executives of the Corporation were as follows:
2015 2014 2015 2014 2015 2014Chairman & Executive Directors Other Executives
Chief Executive--------------------------------------(Rupees in ‘000)--------------------------------------
Managerial remuneration and allowances 851 805 21,796 18,812 349,327 264,669
Retirement benefits - - - - 12,235 8,032 House rent 39 - 4,498 2,549 142,930 98,783 Conveyance 589 - 1,685 - 16,845 9,036 Entertainment 726 317 918 705 7,106 3,852 Medical 421 440 1,924 1,645 26,853 15,880 Utilities 468 459 2,185 1,872 44,131 36,926 Personal staff subsidy - - - - 313 121 Club membership fee and
expenses 229 250 366 489 - 99 Bonus 170 - 3,722 2,766 69,931 44,891 Other allowances 776 664 2,901 1,176 270,138 240,358
4,269 2,935 39,995 30,014 939,809 722,647
Number of persons 2 2 5 4 313 267
41.1 Retirement benefits represent amount contributed towards various retirement benefit plans. The executives of the Group are entitled to retirement benefits as outlined in note 2.17 and 2.18 to these consolidated financial statements. The Chairman and Chief Executive, Executive Directors and certain Executives are provided with Group owned and maintained cars.
41.2 The aggregate amount charged in these consolidated financial statements for fee to 6 (2014: 6) non-executive directors was Rs 1.770 million (2014: Rs 1.350 million).
41.3 During the year ended June 30, 2015, new Chairman and Chief Executive was appointed. The above amounts also relate to the outgoing Chairman and Chief Executive.
93Annual Report 2015

Notes to and Forming part of the Consolidated Financial StatementsFor the year ended June 30, 2015
42. FINANCIAL INSTRUMENTS BY CATEGORY2015 2014
----------(Rupees in ‘000)---------FINANCIAL ASSETSFair value through profit or loss
Long-term investments - listed companies 53,334 53,569 Derivative financial instruments 62,991 147,209
Loans and receivables
Loans - employees 59 59 Trade debts - unsecured 2,263,510 2,439,569 Agents’ and owners’ balances 18,065 124,824 Deposits 15,960 9,914 Interest / mark-up accrued 38,271 35,009 Other receivables 214,318 196,416 Insurance claims 393 7,032 Short-term investments 1,961,375 2,294,880 Cash and bank balances 2,812,430 1,852,441
7,324,381 6,960,144
Available-for-sale financial assets
Long-term investments - other entity 100 100 7,440,806 7,161,022
FINANCIAL LIABILITIES
Amortised cost
Long-term financing 7,450,089 5,885,743 Trade and other payables 2,440,420 2,520,301 Accrued mark-up on long-term financing 82,698 78,515
9,973,207 8,484,559
43. FINANCIAL RISK MANAGEMENT
43.1 Financial risk factors
The Group finances its operations through equity and management of working capital with a view to maintaining an appropriate mix between various sources of finance to minimise risk. Taken as a whole, the Group is exposed to market risk (including interest rate risk, currency risk and other price risk), credit risk and liquidity risk. The Groups’s principal financial liabilities comprise trade and other payables. The Group also has various financial assets such as long term deposits, trade debts, other receivables and bank balances which are directly related to its operations. No changes were made in the objectives, policies or processes and assumptions during the year ended June 30, 2015. The policies for managing each of these risk are summarised below:
94 Pakistan National Shipping Corporation

Notes to and Forming part of the Consolidated Financial StatementsFor the year ended June 30, 2015
43.1.1 Concentration of credit risk
Credit risk arises from cash and cash equivalents, derivative financial instruments and deposits with banks and financial institutions, as well as credit exposures to customers, including trade receivables and committed transactions. Credit risk represents the accounting loss that would be recognised at the reporting date if counter parties fail completely to perform as contracted.
As at June 30, 2015, out of the total financial assets of Rs 7,440.807 million (2014: Rs 7,161.022 million) , the financial assets which are subject to credit risk amounted to Rs 7,440.259 million (2014: Rs 7,160.043 million). The management continuously monitors the credit exposure towards the customers and makes provision against those balances considered doubtful of recovery.
Moreover, a significant component of the receivable balances of the Group relates to amounts due from the Public Sector organisations. Due to the Group’s long standing business relationships with these counterparties and after giving due consideration to their related credit standing, management does not expect non–performance by those counter parties on their obligations to the Group.
For banks and financial institutions, only independently rated parties with a minimum credit rating of A are accepted.
43.1.2 Market Risk
Foreign exchange risk
Foreign exchange risk is the risk that the fair value or future cash flows of a financial instrument will fluctuate because of changes in foreign exchange rates. The Group faces foreign currency risk on receivable, payable transactions at foreign ports and the derivative cross currency interest rate swap.
As at June 30, 2015, if the currency had weakened / strengthened by 5% against the US dollar with all other variables held constant, profit before taxation for the year would have been higher / lower by Rs 27.363 million (2014: Rs 30.772 million), mainly as a result of foreign exchange gains / losses on translation of US dollar denominated assets and liabilities.
As at June 30, 2015, the effect of fluctuations in other foreign currency denominated assets or liabilities balances would not be material, therefore, not disclosed.
Cash flow and fair value interest rate risk
Interest rate risk is the risk that the value of a financial instrument will fluctuate due to changes in the market interest rates. The Group has a high exposure to interest rate risk due to the long-term financing (note 23). In order to manage its exposure to such risks the management of the Group has entered into a derivative cross currency interest rate swap (note 15) under which the Group receives three months KIBOR on the PKR notional in exchange for payment of three months LIBOR on the USD notional. During the year ended June 30, 2012, to further manage the exposure to such risk, management had obtained interest rate swap under which the Group receives a fixed interest rate of 13% in exchange for payment of KIBOR.
The Group has interest bearing liabilities that have floating interest rates. At June 30, 2015, if interest rates on borrowings had been 100 basis points higher / lower with all other variables held constant, profit after taxation for the year would have been lower / higher by Rs 10.432 million (2014: Rs 10.480 million).
95Annual Report 2015

Notes to and Forming part of the Consolidated Financial StatementsFor the year ended June 30, 2015
Price risk
Price risk represents the risk that the fair value or future cash flows of a financial instrument will fluctuate because of changes in market prices (other than those arising from interest rate risk or foreign exchange risk), whether those changes are caused by factors specific to the individual financial instrument or its issuer, or factors affecting all similar financial instruments traded in the market.
The effects of changes in fair value of investments made by the Group, on the future profits are not considered to be material in the overall context of these consolidated financial statements.
43.1.3 Liquidity risk
Liquidity risk is the risk that the Group will encounter difficulties in raising funds to meet commitments associated with financial instruments. The Group believes that it is not exposed to any significant level of liquidity risk.
The management forecasts the liquidity of the Group on basis of expected cash flow considering the level of liquid assets necessary to meet such risk. This involves monitoring balance sheet liquidity ratios and maintaining debt financing plans.
Financial liabilities in accordance with their contractual maturities are presented below:
Contractual cash flows
Less than 1 year
Between 1 to 2 years
Between 2 to 5 years
More than 5 years
2015 ------------------------------------(Rupees in ‘000)------------------------------------
Long term financing 9,280,828 2,346,441 2,185,985 2,914,344 1,834,058 Trade and other payables 2,440,420 2,440,420 - - - Accrued mark-up on
long-term financing 82,698 82,698 - - - 11,803,946 4,869,559 2,185,985 2,914,344 1,834,058
2014 ------------------------------------(Rupees in ‘000)------------------------------------
Long term financing 7,712,144 1,932,063 1,864,640 3,915,441 - Trade and other payables 2,520,301 2,520,301 - - - Accrued mark-up on
long-term financing 78,515 78,515 - - - 10,310,960 4,530,879 1,864,640 3,915,441 -
43.1.4 Fair value of financial instruments
Fair value is an amount for which an asset could be exchanged, or a liability settled, between knowledgeable willing parties in an arm’s length transaction. Consequently, differences may arise between the carrying value and the fair value estimates.
The Group classifies financial instruments measured in the balance sheet at fair value in accordance with the following fair value measurement:
Level 1: Quoted prices in active markets for identical assets or liabilities;
96 Pakistan National Shipping Corporation

Notes to and Forming part of the Consolidated Financial StatementsFor the year ended June 30, 2015
Level 2: Those involving inputs other than quoted prices included in Level 1 that are observable for the asset or liability, either directly (as prices) or indirectly (derived from prices); and
Level 3: Those whose inputs for the asset or liability that are not based on observable market date (unobservable inputs).
Note Level 1 Level 2 Level 3 Total
----------------------------(Rupees in ‘000)----------------------------
Long term investment in listed company 8 53,334 - - 53,334
Derivative cross currency interest rate swap 15 - - 62,991 62,991
43.2 Capital risk management
The Group’s objectives when managing capital are to safeguard the Group’s ability to continue as a going concern in order to provide returns for shareholders and benefits for other stakeholders and to maintain an optimal capital structure to reduce the cost of capital.
The Group manages its capital structure by monitoring return on net assets and makes adjustment to it in the light of changes in economic conditions. In order to maintain or adjust the capital structure, the Group may adjust the amount of dividends paid to shareholders or issue new shares.
The Group is subject to externally imposed capital requirements, which are applicable at consolidated financial statements level.
During the year, the Group’s strategy was to maintain the debt equity ratio below 60:40. The debt equity ratios as at June 30, 2015 and 2014 were as follows:
2015 2014----------(Rupees in ‘000)---------
Long-term financing - secured (note 23) 7,450,089 5,885,743 Total equity 24,275,607 22,467,167 Total 31,725,696 28,352,910
Debt-to-equity ratio 23:77 21:79
44. ENTITY WIDE INFORMATION
44.1 The Group constitutes a single reportable segment, the principal classes of services provided are transportation of dry cargo and liquid cargo through chartered and owned vessels, and rental of properties.
97Annual Report 2015

Notes to and Forming part of the Consolidated Financial StatementsFor the year ended June 30, 2015
44.2 Information about services
The Group’s principal classes of services accounted for the following amount of revenue:
2015 2014----------(Rupees in ‘000)---------
Transportation of dry cargo 4,532,414 4,041,087 Transportation of liquid cargo 10,848,937 11,544,329 Rental income 154,937 141,130
15,536,288 15,726,546
44.3 Information about geographical areas
The Group does not hold non-current assets in any foreign country.
44.4 Information about major customers
The Group has the following exposure to concentration of credit risk with clients representing greater than 10 % of the total revenue balances:
2015 2014Revenue Revenue
(Rupees in ‘000) % of Total (Rupees in ‘000) % of Total
Client 1 2,371,821 15 7,277,834 47 Client 2 - - 6,137,418 39
2,371,821 15 13,415,252 86
45. RELATED PARTY DISCLOSURES
Related parties comprise of companies affiliated to the Holding Company and the directors, chief executives of the Holding Company and employee funds maintained by the Holding Company. Particulars of remuneration to key personnel are disclosed in note 41 to these consolidated financial statements.
The significant transactions carried out by the Group with related parties are given below:
Note 2015 2014----------(Rupees in ‘000)---------
Contributions to Provident Fund 12,550 10,589 Key management personnel compensation 41 44,264 32,949 Directors’ fee 1,770 1,350
46. PROVIDENT FUND RELATED DISCLOSURES
The following information is based on latest un-audited financial statements of the Provident Fund (the Fund):
Note 2015 2014----------(Rupees in ‘000)---------
Size of the Fund - Total assets 917,339 888,525 Cost of investments made 743,525 850,181 Percentage of investments made 81.05% 94.67%Fair value of investments 46.1 851,046 841,133
98 Pakistan National Shipping Corporation

Notes to and Forming part of the Consolidated Financial StatementsFor the year ended June 30, 2015
46.1 The break-up of fair value of investments is:
2015 2014(Rs in ‘000) ----%---- (Rs in ‘000) ----%----
Government securities 430,060 51% 460,593 55%Mutual funds 420,986 49% 380,540 45%
851,046 100% 841,133 100%
46.2 The investments out of the Fund have been made in accordance with the provisions of Section 227 of the Ordinance and the rules formulated for this purpose.
47. NUMBER OF EMPLOYEES
The total average number of employees during the year and as at June 30, 2015 and 2014 respectively are as follows:
2015 2014No. of employees
Average number of employees during the year 1,036 963 Number of employees as at end of the year 1,117 954
48. NON-ADJUSTING EVENTS AFTER THE BALANCE SHEET DATE
48.1 The Board of Directors at the meeting held on September 28, 2015 have proposed for the year ended June 30, 2015, cash dividend of Rs 1.5 per share (2014: Rs 1.5 per share) amounting to Rs 198.095 million (2014: Rs 198.095 million) subject to the approval of the members at the annual general meeting to be held on October 28, 2015. The consolidated financial statements for the year ended June 30, 2015 do not include the effect of this appropriation which will be accounted for subsequent to the year end.
49. GENERAL
49.1 Figures have been rounded off to the nearest thousand of rupees unless otherwise stated.
49.2 For better presentation, certain balances were reclassified where necessary.
50. DATE OF AUTHORISATION
These consolidated financial statements were authorised for issue on September 28, 2015 by the Board of Directors of the Holding Company.
Arif Elahi P.A.S.
Chairman & Chief ExecutiveCapt. Anwar Shah
Director
99Annual Report 2015
100 Pakistan National Shipping Corporation
Report and Accounts of
Pakistan NationalShipping Corporation(Holding Company)
for the year ended June 30, 2015
101Annual Report 2015

Notes to and Forming part of the Financial StatementsFor the year ended June 30, 2015
We have audited the annexed unconsolidated balance sheet of Pakistan National Shipping Corporation (the Corporation) as at June 30, 2015 and the related unconsolidated profit and loss account, unconsolidated statement of changes in equity and unconsolidated cash flow statement together with the notes forming part thereof, for the year then ended and we state that we have obtained all the information and explanations which, to the best of our knowledge and belief, were necessary for the purposes of our audit.
It is the responsibility of the Corporation’s management to establish and maintain a system of internal control, and prepare and present the above said statements in conformity with the approved accounting standards as applicable in Pakistan and the requirements of the Companies Ordinance, 1984. Our responsibility is to express an opinion on these statements based on our audit.
We conducted our audit in accordance with the auditing standards as applicable in Pakistan. These standards require that we plan and perform the audit to obtain reasonable assurance about whether the above said statements are free of any material misstatement. An audit includes examining, on a test basis, evidence supporting the amounts and disclosures in the above said statements. An audit also includes assessing the accounting policies and significant estimates made by management, as well as, evaluating the overall presentation of the above said statements. We believe that our audit provides a reasonable basis for our opinion and, after due verification, we report that-
(a) in our opinion, proper books of account have been kept by the Corporation as required by the Companies Ordinance, 1984;
(b) in our opinion-
(i) the unconsolidated balance sheet and unconsolidated profit and loss account together with the notes thereon have been drawn up in conformity with the Companies Ordinance, 1984, and are in agreement with the books of account and are further in accordance with accounting policies consistently applied;
(ii) the expenditure incurred during the year was for the purpose of the Corporation’s business; and
(iii) the business conducted, investments made and the expenditure incurred during the year were in accordance with the objects of the Corporation;
Auditors’ Report to the Members
A. F. FERGUSON & CO.CHARTERED ACCOUNTANTSa member firm of the PwC networkSTATE LIFE BUILDING 1-CI. I. CHUNDRIGAR ROADKARACHI
ERNST & YOUNG FORD RHODES SIDAT HYDER CHARTERED ACCOUNTANTSa member firm of Ernst & Young Global LimitedPROGRESSIVE PLAZABEAUMONT ROADKARACHI
102 Pakistan National Shipping Corporation

Notes to and Forming part of the Financial StatementsFor the year ended June 30, 2015
A. F. FERGUSON & CO.Chartered AccountantsKarachi: September 28, 2015Audit Engagement Partner : Khurshid Hasan
ERNST & YOUNG FORD RHODES SIDAT HYDERChartered AccountantsKarachi: September 28, 2015Audit Engagement Partner : Riaz A. Rehman Chamdia
(c) in our opinion and to the best of our information and according to the explanations given to us, the unconsolidated balance sheet, unconsolidated profit and loss account, unconsolidated statement of changes in equity and unconsolidated cash flow statement together with the notes forming part thereof conform with approved accounting standards as applicable in Pakistan, andgive the information required by the Companies Ordinance, 1984, in the manner so required and respectively give a true and fair view of the state of the Corporation’s affairs as at June 30, 2015 and of the profit, its changes in equity and cash flows for the year then ended; and
(d) in our opinion zakat deductible at source under the Zakat and Ushr Ordinance, 1980 (XVIII of 1980) was deducted by the Corporation and deposited in the Central Zakat Fund established under section 7 of that Ordinance.
A. F. FERGUSON & CO.CHARTERED ACCOUNTANTSa member firm of the PwC networkSTATE LIFE BUILDING 1-CI. I. CHUNDRIGAR ROADKARACHI
ERNST & YOUNG FORD RHODES SIDAT HYDER CHARTERED ACCOUNTANTSa member firm of Ernst & Young Global LimitedPROGRESSIVE PLAZABEAUMONT ROADKARACHI
103Annual Report 2015

Notes to and Forming part of the Financial StatementsFor the year ended June 30, 2015
Balance SheetAs at June 30, 2015
Note 2015 2014-----------(Rupees in ‘000)-----------
ASSETSNON-CURRENT ASSETS
Property, plant and equipment 4 2,102,085 1,642,894 Intangible asset 5 - - Investment properties 6 1,767,473 1,080,596 Long-term investments in:
- Related parties (subsidiaries and an associate) 7 25,189,063 25,189,063 - Listed companies and another entity 8 53,434 53,669
25,242,497 25,242,732
Long-term loans and advances 58 58 Deferred taxation 9 97,669 90,777
29,209,782 28,057,057 CURRENT ASSETS
Stores and spares 10 13,148 11,402 Trade debts - unsecured 11 1,821,692 1,987,993 Agents’ and owners’ balances - unsecured 12 18,065 124,824 Loans and advances 13 3,505,259 58,564 Trade deposits and short-term prepayments 14 51,326 45,604 Interest / mark-up accrued on bank deposits and investments 37,445 34,539 Other receivables 15 153,072 239,755 Incomplete voyages - 5,992 Taxation-net 1,015,291 737,000 Short-term investments 16 1,954,375 2,294,880 Cash and bank balances 17 2,808,371 1,842,531
11,378,044 7,383,084 TOTAL ASSETS 40,587,826 35,440,141
EQUITY AND LIABILITIES
SHARE CAPITAL AND RESERVES
SHARE CAPITALAuthorised (200,000,000 Ordinary shares of Rs 10 each) 2,000,000 2,000,000
Issued, subscribed and fully paid-up 18 1,320,634 1,320,634 Reserves 19 6,898,954 6,314,151
8,219,588 7,634,785
Surplus on revaluation of property, plant and equipment - net of tax 20 1,128,307 768,248
NON-CURRENT LIABILITIES
Long-term financing - secured 21 5,748,035 4,568,861 Deferred liabilities 22 851,561 617,483
6,599,596 5,186,344 CURRENT LIABILITIES
Trade and other payables 23 22,808,212 20,423,394 Provision against damage claims 24 20,223 31,973 Incomplete voyages 27,148 - Current portion of long-term financing 21 1,702,054 1,316,882 Accrued markup on long-term financing 82,698 78,515
24,640,335 21,850,764 TOTAL EQUITY AND LIABILITIES 40,587,826 35,440,141
CONTINGENCIES AND COMMITMENTS 25
The annexed notes 1 to 50 form an integral part of these unconsolidated financial statements.
Arif Elahi P.A.S.
Chairman & Chief ExecutiveCapt. Anwar Shah
Director
104 Pakistan National Shipping Corporation

Notes to and Forming part of the Financial StatementsFor the year ended June 30, 2015
Profit and Loss AccountFor the year ended June 30, 2015
Note 2015 2014-----------(Rupees in ‘000)-----------
REVENUEChartering revenue 26 8,013,565 8,296,535 Service fees - net 27 294,712 290,625 Rental income 154,272 140,525 Dividend income from subsidiaries 28 433,836 -
8,896,385 8,727,685 EXPENDITUREFleet expenses - direct 29 (6,768,109) (6,591,784)
- indirect 30 (26,749) (23,359)Vessel management expenses 31 (456,910) (368,501)Real estate expenses 32 (98,783) (67,541)
(7,350,551) (7,051,185)GROSS PROFIT 1,545,834 1,676,500
Administrative & general expenses 33 (529,187) (390,493)Other expenses 34 (1,311,099) (793,046)Other income 35 1,914,465 1,073,431
(74,179) (110,108)OPERATING PROFIT 1,620,013 1,566,392
Finance costs 36 (667,235) (546,681)
PROFIT BEFORE TAXATION 952,778 1,019,711
Taxation 37 (60,005) (216,435)
PROFIT FOR THE YEAR 892,773 803,276
OTHER COMPREHENSIVE INCOME FOR THE YEAR
Items that will not be reclassified to profit and loss accountRemeasurement of post-retirement benefits obligation (131,004) 1,307 Tax on remeasurement of post-retirement benefits obligation 14,621 914
(116,383) 2,221 TOTAL COMPREHENSIVE INCOME FOR THE YEAR 776,390 805,497
--------------(Rupees)--------------EARNINGS PER SHARE - basic and dilutive 38 6.76 6.08
Note: The appropriations from profits are set out in the unconsolidateed statement of changes in equity.
The annexed notes 1 to 50 form an integral part of these unconsolidated financial statements.
Arif Elahi P.A.S.
Chairman & Chief ExecutiveCapt. Anwar Shah
Director
105Annual Report 2015

Notes to and Forming part of the Financial StatementsFor the year ended June 30, 2015
Issued, subscribed
and fully paid-up
share capital
Capital reserves
Revenue reserves
TotalUnappro-priated profit
Remeasure-ment of post-
retirement benefits
obligation - net of tax
--------------------------------------(Rupees in ‘000)--------------------------------------
Balance as at July 1, 2013 1,320,634 126,843 5,735,168 (228,743) 6,953,902
Final cash dividend for the year ended
June 30, 2013 @ Re 1 per ordinary share - - (132,063) - (132,063)
Profit for the year - - 803,276 - 803,276
Other comprehensive income for the year - - - 2,221 2,221
Total comprehensive income for the year - - 803,276 2,221 805,497
Surplus on revaluation of property, plant and
equipment realised during the year on
account of incremental depreciation charged
thereon - net of tax (note 20) - - 7,449 - 7,449
Balance as at June 30, 2014 1,320,634 126,843 6,413,830 (226,522) 7,634,785
Final cash dividend for the year ended
June 30, 2014 @ Rs 1.5 per ordinary share - - (198,095) - (198,095)
Profit for the year - - 892,773 - 892,773
Other comprehensive income for the year - - - (116,383) (116,383)
Total comprehensive income for the year - - 892,773 (116,383) 776,390
Surplus on revaluation of property, plant and
equipment realised during the year on
account of incremental depreciation charged
thereon - net of tax (note 20) - - 6,508 - 6,508
Balance as at June 30, 2015 1,320,634 126,843 7,115,016 (342,905) 8,219,588
The annexed notes 1 to 50 form an integral part of these unconsolidated financial statements.
Statement of Changes in EquityFor the year ended June 30, 2015
Arif Elahi P.A.S.
Chairman & Chief ExecutiveCapt. Anwar Shah
Director
106 Pakistan National Shipping Corporation

Notes to and Forming part of the Financial StatementsFor the year ended June 30, 2015
Note 2015 2014-----------(Rupees in ‘000)-----------
Cash flows from operating activities
Cash generated from operations 39 208,896 3,100,569 Employees’ gratuity paid (57,015) (7,474)Employees’ compensated absences paid (85,475) (60,241)Post-retirement medical benefits paid (32,401) (25,938)Finance costs paid (850,326) (791,624)Receipts under cross currency interest rate swap 211,069 208,955 Taxes paid (424,268) (710,522)Net cash (used in) / generated from operating activities (1,029,520) 1,713,725
Cash flows from investing activities
Purchase of property, plant and equipment (49,142) (154,596)Proceeds from disposal of property, plant and equipment 58 - Short term investments redeemed / (made) 43,065 (1,497,440)Interest / mark-up received 298,188 256,398 Dividends received 2,024 821 Net cash generated from / (used in) investing activities 294,193 (1,394,817)
Cash flows from financing activities
Long-term financing obtained 3,081,375 - Long-term financing repaid (1,482,700) (1,323,158)Dividends paid (194,948) (130,226)Net cash generated from / (used in) financing activities 1,403,727 (1,453,384)
Net increase / (decrease) in cash and cash equivalents 668,401 (1,134,476)
Cash and cash equivalents at the beginning of year 2,639,971 3,774,447
Cash and cash equivalents at the end of year 40 3,308,372 2,639,971
The annexed notes 1 to 50 form an integral part of these unconsolidated financial statements.
Cash Flow StatementFor the year ended June 30, 2015
Arif Elahi P.A.S.
Chairman & Chief ExecutiveCapt. Anwar Shah
Director
107Annual Report 2015

Notes to and Forming part of the Financial StatementsFor the year ended June 30, 2015
1. GENERAL INFORMATION
1.1 Pakistan National Shipping Corporation (the Corporation) was established under the provisions of the Pakistan National Shipping Corporation Ordinance, 1979 and is principally engaged in the business of shipping, including charter of vessels, transportation of cargo and other related services and providing commercial, technical, administrative, financial and other services to its subsidiaries and third parties in relation to the business of shipping. The Corporation is also engaged in renting out its properties to tenants under lease arrangements. The Corporation is listed on the Karachi and Lahore Stock Exchanges. The Corporation’s registered office is situated at PNSC Building, Moulvi Tamizuddin Khan Road, Karachi.
1.2 The Corporation had applied for delisting from the Lahore Stock Exchange (LSE) in the year 2002. However, at present the matter of delisting from LSE is pending subject to a final decision by the Honourable Supreme Court of Pakistan.
2. SIGNIFICANT ACCOUNTING INFORMATION AND POLICIES
The principal accounting policies applied in the preparation of these financial statements are set out below. These policies have been consistently applied to all the years presented, unless otherwise stated.
2.1 Basis of preparation
These financial statements are the separate financial statements of the Corporation and have been prepared in accordance with approved accounting standards as applicable in Pakistan. Approved accounting standards comprise of such International Financial Reporting Standards (IFRSs) issued by the International Accounting Standards Board and Islamic Financial Accounting Standards (IFAS) issued by the Institute of Chartered Accountants of Pakistan (ICAP) as are notified under the Companies Ordinance, 1984 (the Ordinance), provisions of and directives issued under the Ordinance. In case requirements differ, the provisions or directives of the Ordinance shall prevail. These financial statements have been prepared under the historical cost convention unless otherwise specifically stated.
The preparation of financial statements in conformity with approved accounting standards requires the use of certain significant accounting estimates. It also requires management to exercise its judgment in the process of applying the Corporation’s accounting policies. The areas involving a higher degree of judgment or complexity, or areas where assumptions and estimates are significant to the financial statements are disclosed in note 3 of these financial statements.
2.2 New standards, amendments to published approved accounting standards and interpretations
2.2.1 New amendments to approved accounting standards and interpretations which became effective during the year ended June 30, 2015
There were certain new amendments to the approved accounting standards and new interpretations issued by the International Financial Reporting Interpretations Committee (IFRIC) which became effective during the year but are considered not to be relevant or have any significant effect on the Corporation’s operations and are, therefore, not disclosed in these financial statements.
2.2.2 New standard, amendments to approved accounting standards and new interpretations that are not yet effective and have not been early adopted by the Corporation:
There are certain amendments to the approved accounting standards and new interpretation issued by IFRIC which will be effective after July 1, 2015 but are considered not to be relevant or are expected to have any significant effect on the Corporation’s operations and are, therefore, not disclosed in these financial statements except for IFRS 13, “Fair value measurement”, which aims to improve consistency and reduce complexity by providing a precise definition of fair value and a single source of fair value measurement and disclosure requirements for use across IFRSs. The requirement do not extend the use of fair value accounting but provide guidance on how it should be applied where its use is already required or permitted by other standards within IFRSs. The standard will affect the determination of fair value and its related disclosures in the financial statements of the Corporation. The Corporation is yet to assess the full impact of the amendments.
108 Pakistan National Shipping Corporation

Notes to and Forming part of the Financial StatementsFor the year ended June 30, 2015
2.3 Property, plant and equipment
These are initially recognised at cost and subsequently carried at cost less accumulated depreciation and impairment losses, if any, except for leasehold land, buildings on leasehold land, beach huts and workshop machinery and equipment which are carried at revalued amounts less accumulated depreciation and any subsequent impairment losses, if any. The revaluation of related assets is carried out with sufficient regularity to ensure that the carrying amounts do not differ materially from those which would have been determined using fair values at the balance sheet date.
The value assigned to leasehold land is not depreciated as the leases are expected to be renewed for further periods on payment of relevant rentals. Annual lease rentals are charged to profit and loss account and premium paid at the time of renewal, if any, is amortised over the remaining period of the lease.
Depreciation is charged to income applying the straight line method whereby the depreciable amount of an asset is depreciated over its estimated useful life.
No depreciation is charged if the asset’s residual value exceeds its carrying amount.
Full month’s depreciation is charged in the month of acquisition and no depreciation is charged in the month of disposal. An item of property, plant and equipment is derecognised upon disposal or when no future economic benefits are expected from its use.
Residual values, useful lives and methods of depreciation are reviewed at each balance sheet date and adjusted if expectations differ significantly from previous estimates.
A revaluation deficit is recognised in profit and loss account, except that a deficit directly offsetting a previous surplus on any asset, in which case the deficit is recognised in surplus on revaluation of property, plant and equipment account. Surplus on revaluation can not be distributed to shareholders until it is transferred to retained earnings. An annual transfer from the surplus on revaluation of property, plant and equipment account to retained earnings is made for the difference between depreciation based on the revalued carrying amount of the assets and the depreciation based on the assets’ original cost. Additionally, accumulated depreciation as at the revaluation date is eliminated against the gross carrying amount of the assets and the net amount is restated to the revalued amount of the assets. Upon disposal, any revaluation reserve relating to the particular assets being sold is transferred to retained earnings.
Major spare parts and stand-by equipment qualify for recognition as property, plant and equipment when the Corporation expects to use them during more than one year.
Maintenance and normal repairs are charged to profit and loss account as and when incurred. Major renewals, replacements and improvements are capitalised and assets so replaced, if any, are retired.
2.4 Capital work-in-progress
These are stated at cost less accumulated impairment losses, if any. All expenditure connected with specific assets incurred during installation and construction period are carried under this head. These are transferred to specific assets as and when these assets are available for use.
2.5 Intangible assets
Intangible assets are initially recognised at cost and are subsequently carried at cost less accumulated amortisation and impairment losses, if any.
Amortisation is charged to profit and loss account by applying straight-line method whereby the cost less residual value, if not insignificant, of an asset is written off over its estimated useful life to the Corporation. Full month’s amortisation is charged in the month of acquisition and no amortisation is charged in the month of disposal.
109Annual Report 2015

Notes to and Forming part of the Financial StatementsFor the year ended June 30, 2015
2.6 Investment properties
Properties held for long-term rental yields which are significantly rented out by the Corporation are classified as investment properties.
Investment properties are measured initially at cost, including related transaction costs. After initial recognition at cost, investment properties are carried at their fair values based on market value determined by professional independent valuers with sufficient regularity. Fair values are based on active market prices, adjusted, if necessary, for any difference in the nature, location or condition of the specific asset. The valuation of these properties is carried out with sufficient regularity.
Additions to investment properties consist of costs of a capital nature. The profit on disposal is determined as the difference between the sales proceeds and the carrying amount of the asset at the commencement of the accounting period plus capital expenditure in the period.
2.7 Investments in subsidiaries and associate
Investments in subsidiaries and associate are stated at cost less provision for impairment, if any.
2.8 Impairment of non-financial assets
The Corporation assesses at each balance sheet date whether there is any indication that the assets may be impaired. If such indications exist, the carrying amounts of such assets are reviewed to assess whether they are recorded in excess of their recoverable amounts. Where carrying values exceed the respective recoverable amount, assets are written down to their recoverable amounts and the resulting impairment charge is recognised in income except for impairment loss on revalued assets, which is recognised directly against revaluation surplus of any other asset to the extent that the impairment loss does not exceed the amount held in the revaluation surplus.
2.9 Financial instruments
2.9.1 Financial assets
The Corporation classifies its financial assets in the following categories:
a) Financial assets at fair value through profit or loss
Financial assets at fair value through profit or loss are financial assets held for trading and financial assets designated upon initial recognition as at fair value through profit or loss.
b) Loans and receivables
Loans and receivables are non-derivative financial assets with fixed or determinable payments that are not quoted in an active market.
c) Available-for-sale financial assets
Available-for-sale financial assets are non-derivatives that are either designated in this category or not classified in any of the other categories.
All financial assets are recognised at the time when the Corporation becomes a party to the contractual provisions of the instrument. Regular purchases and sales of investments are recognised at trade-date i.e. the date on which the Corporation commits to purchase or sell the asset.
Financial assets are initially recognised at fair value plus transaction costs for all financial assets not carried at fair value through profit or loss. Financial assets carried at fair value through profit and loss are initially recognised at fair value and transactions costs are expensed in the profit and loss account.
110 Pakistan National Shipping Corporation

Notes to and Forming part of the Financial StatementsFor the year ended June 30, 2015
Available-for-sale financial assets and financial assets at fair value through profit or loss are subsequently carried at fair value. Loans and receivables are carried at amortised cost using effective interest rate method.
Financial assets are derecognised when the rights to receive cash flows from the assets have expired or have been transferred and the Corporation has transferred substantially all the risks and rewards of ownership.
2.9.2 Impairment
The Corporation assesses at each balance sheet date whether there is objective evidence that a financial asset or group of financial assets is impaired.
2.9.3 Financial liabilities
All financial liabilities are recognised at the time when the Corporation becomes a party to the contractual provisions of the instrument.
A financial liability is derecognised when the obligation under the liability is discharged or cancelled or expired.
2.9.4 Derivative financial instruments
The Corporation uses derivative financial instruments such as interest rate and cross currency swaps to manage its risks associated with interest and exchange rate fluctuations. Such derivative financial instruments are initially recognised at fair value on the date on which a derivative contract is entered into and are subsequently re-measured at fair value. Derivatives with positive market values (unrealised gains) are included in ‘other receivable’ and derivatives with negative market values (unrealised losses) are included in ‘trade and other payables’ in the balance sheet. Any gains or losses arising from changes in fair value of derivatives are recognised directly to the profit and loss account.
2.9.5 Off-setting of financial assets and financial liabilities
A financial asset and a financial liability is offset and the net amount is reported in the financial statements if the Corporation has a legally enforceable right to set-off the transaction and also intends either to settle on a net basis or to realise the asset and settle the liability simultaneously.
2.10 Stores and spares
Stores are valued at weighted average cost while spares are valued at cost determined on first-in first-out basis. Stores and spares in transit are valued at cost incurred upto the balance sheet date.
Certain spares having low value and high consumption levels are charged to profit and loss account at the time of purchase.
The Corporation reviews the carrying amount of stores and spares on a regular basis and provision is made for obsolescence if there is any change in the usage pattern and physical form.
2.11 Trade debts and other receivables
Trade and other debts are recognised at the fair value of consideration to be received against goods and services and are carried at amortised cost. Provision is made in respect of doubtful debts, if any. Debts, considered irrecoverable, are written off, as and when identified.
111Annual Report 2015

Notes to and Forming part of the Financial StatementsFor the year ended June 30, 2015
2.12 Taxation
2.12.1 Current
Provision for current taxation is based on taxable income for the year at the current rates of taxation after taking into account tax credits and tax rebates available, if any, and tax paid on final tax basis or minimum tax on turnover, whichever is higher. The charge for current tax also includes adjustments, where considered necessary, to provision for tax made in pervious years arising from assessments framed during the year for such years.
2.12. Deferred
Deferred income tax is provided using the liability method for all temporary differences arising at the balance sheet date, between tax bases of assets and liabilities and their carrying amounts. Deferred tax liabilities are recognized for all taxable temporary differences and deferred tax assets are recognized for all deductible temporary differences, unused tax losses and unused tax credits to the extent that it is probable that future taxable profits will be available which these can be utilised.
2.13 Insurance claims
Hull claims and other claimable expenses relating to hull are charged to income currently and claims filed there-against are taken to income when such claims are accepted by the underwriters.
Afloat medical expenses, cargo claims and other relevant amounts recoverable from underwriters are recognised to insurance claims receivable.
2.14 Trade and other payables
Liabilities for trade and other amounts payable are carried at cost which is the fair value of the consideration to be paid in future for goods and services whether billed or not.
2.15 Provisions
Provisions are recognised when the Corporation has a present legal or constructive obligation as a result of past events, it is probable that an outflow of resources embodying economic benefits will be required to settle the obligation and a reliable estimate of the obligation can be made. Provisions are reviewed at each balance sheet date and adjusted to reflect the current best estimate.
2.16 Dividend and appropriations
Dividends declared and transfers between reserves made subsequent to the balance sheet date are considered as non-adjusting events and are recognised in the financial statements in the period in which such dividends are declared / transfers are made.
2.17 Staff retirement benefits
2.17.1 The Corporation operates an approved provident fund scheme for all its permanent employees. Equal monthly contributions are made, both by the Corporation and its employees, to the fund at the rate of 10 percent of the basic salaries of employees.
2.17.2 Defined benefit gratuity scheme
The Corporation operates a funded retirement gratuity scheme for its permanent employees other than those who joined the Corporation on or after October 16, 1984. Further, the Corporation operates an unfunded retirement gratuity scheme for contractual employees. Provisions are made in the financial statements to cover obligations on the basis of actuarial valuation carried out annually under the projected unit credit method. The remeasurement of defined benefit contribution is recognised directly to equity through other comprehensive income.
112 Pakistan National Shipping Corporation

Notes to and Forming part of the Financial StatementsFor the year ended June 30, 2015
The benefit is payable on completion of prescribed qualifying period of service under these schemes.
Actuarial valuation is carried out annually and the latest valuation was carried out as at June 30, 2015 using the projected unit credit method.
2.17.3 Post-retirement medical benefits
The Corporation provides lump sum medical allowance to its retired permanent employees in accordance with the service regulations.
Provisions are made in the financial statements to cover obligations on the basis of actuarial valuation carried out annually using the projected unit credit method. The remeasurement of post-retirement benefit obligation is recognised directly to equity through other comprehensive income.
The benefit is payable on completion of prescribed qualifying period of service under these schemes.
Actuarial valuation is carried out annually and the latest valuation was carried out as at June 30, 2015 using the projected unit credit method.
2.18 Employees’ compensated absences
The Corporation accounts for the liability in respect of employees’ compensated absences in the year in which these are earned. Annual provisions to cover the obligations under the scheme are based on actuarial estimates and are charged to profit and loss account currently. The remeasurement of defined benefit obligation arising at each valuation date is recognised immediately.
Actuarial valuation is carried out annually and the latest valuation was carried out as at June 30, 2015 using the projected unit credit method.
2.19 Cash and cash equivalents
Cash and cash equivalents are stated at cost. These include cash in hand, cheques in hand, deposits held with banks and other short-term highly liquid investments with maturities of three months or less.
2.20 Foreign currency translation
These financial statements are presented in Pakistani Rupee, which is the Corporation’s functional and presentation currency.
Transactions in foreign currencies are recorded in Pakistani Rupee at the exchange rates approximating those prevailing on the date of transaction. Monetary assets and liabilities in foreign currencies are reported in Pakistani Rupee at the exchange rates approximating those prevalent at the balance sheet date. Gains and losses on translation are recognised to profit and loss account.
2.21 Revenue recognition
- Earnings in respect of voyages other than time charter voyages are accounted for on the basis of completed voyages. Voyages are taken as complete when a vessel arrives at the last port of discharge and completes discharge of entire cargo on or before the balance sheet date. Freight revenue, direct and indirect operating expenses associated with the incomplete voyages are deferred until completion of voyage and are classified in the balance sheet as ‘Incomplete voyages’. With respect to time charter voyages, chartering revenue is accounted for on the basis of number of days to the balance sheet date.
- Fee for technical, commercial, administrative and financial services are recognised as revenue when the services are rendered.
- Rental income is recognised as revenue on a straight line basis over the term of the respective lease arrangements.
113Annual Report 2015

Notes to and Forming part of the Financial StatementsFor the year ended June 30, 2015
- Dividend income is recognised when the Corporation’s right to receive the dividend is established.
- Profit from bank accounts and return on investments is recognised on a time proportion basis.
2.22 Contingent liabilities
Consistent with prior year contingent liability is disclosed when:
- there is a possible obligation that arises from past events and whose existence will be confirmed only by the occurrence or non-occurrence of one or more uncertain future events not wholly within the control of the Corporation; or
- there is present obligation that arises from past events but it is not probable that an outflow of resources embodying economic benefits will be required to settle the obligation or the amount of the obligation cannot be measured with sufficient reliability.
2.23 Benazir Employees’ Stock Option Scheme
On August 14, 2009, the Government of Pakistan (GoP) launched Benazir Employees’ Stock Option Scheme (the Scheme) for employees of certain State Owned Enterprises (SOEs) and non-State Owned Enterprises where GoP holds significant investments (non-SOEs). The scheme is applicable to permanent and contractual employees who were in employment of these entities on the date of launch of the Scheme, subject to completion of five years vesting period by all contractual employees and by permanent employees in certain instances.
The Scheme provides for a cash payment to employees on retirement or termination based on the price of shares of respective entities. To administer this scheme, GoP shall transfer 12% of its investment in such SOEs and non-SOEs to a trust fund to be created for the purpose of such entities. The eligible employees would be allotted units by each Trust Fund in proportion to their respective length of service and on retirement or termination of such employees would be entitled to receive such amounts from Trust Funds in exchange for the surrendered units as would be determined based on market price of listed entities or breakup value of non-listed entities. The shares related to the surrendered units would be transferred back to GoP.
The Scheme also provides that 50% of dividend related to shares transferred to the respective Trust Fund would be distributed amongst the unit-holder employees. The balance 50% dividend would be transferred by the respective Trust Fund to the Central Revolving Fund managed by the Privatisation Commission of Pakistan for payment to employees against surrendered units. The deficits, if any, in trust funds to meet the re-purchase commitment would be met by GoP.
The Scheme, developed in compliance with the stated GoP policy of the empowerment of employees of State Owned Enterprises need to be accounted for by the covered entities, including the Corporation, under the provisions of amended International Financial Reporting Standard - 2 ‘Share Based Payments’ (IFRS 2). However, keeping in view the difficulties that may be faced by the entities covered under the Scheme, the Securities & Exchange Commission of Pakistan on receiving the representation from some of the entities covered under the Scheme and after having consulted the Institute of Chartered Accountants of Pakistan, has granted exemption vide SRO 587(I)/2011 dated June 7, 2011 to such entities from application of IFRS 2 to the Scheme.
During the year ended June 30, 2015, the shares have not been transferred to the respective Trust Fund under the Scheme as the matter is pending with the Ministry of Finance, Revenue, Economic Affairs, Statistics and Privatisation (Privatisation Commission). The Scheme is being revamped by GoP and all claims and disbursements to the employees are kept in abeyance.
Had the exemption not been granted, the retained earnings would have been lower by Rs 631.142 million (2014: Rs 631.142 million) and reserves would have been higher by Rs 631.142 million (2014: Rs 631.142 million) based on the independent actuarial valuations conducted as on June 30, 2014. However the impact on staff cost and profit for the year is not material for the purpose of these financial statements.
114 Pakistan National Shipping Corporation

Notes to and Forming part of the Financial StatementsFor the year ended June 30, 2015
3. SIGNIFICANT ACCOUNTING ESTIMATES, JUDGEMENTS AND ASSUMPTIONS
The preparation of the Corporation’s financial statements requires management to make judgments, estimates and assumptions that affect the reported amounts of revenues, expenses, assets and liabilities, and the disclosure of contingent liabilities, at the end of the reporting period. However, uncertainty about these assumptions and estimates could result in outcomes that require a material adjustment to the carrying amount of the asset or liability affected in future periods.
In the process of applying the accounting policies, management has made the following estimates and judgements which are significant to the financial statements.
(a) Valuation of certain property, plant and equipment and investment properties;
(b) Determination of the residual values and useful lives of property, plant and equipment;
(c) Recognition of taxation and deferred taxation;
(d) Accounting for provision for impairment against loans and advances, trade debts, agents and owners balances, deposits and other receivables;
(e) Accounting for provision against damage claims;
(f) Accounting for defined benefit plans;
(g) Measuring fair value of cross currency swap and interest rate swap;
(h) Recoverable amount of investment in related parties; and
(i) Determination of contingent assets and liabilities.
Estimates and judgements are continually evaluated and are based on historical experience and other factors, including expectation of future events that are believed to be reasonable under the circumstances.
Note 2015 2014-----------(Rupees in ‘000)-----------
4. PROPERTY, PLANT AND EQUIPMENT- Operating fixed assets 4.1 1,625,364 1,188,414 - Capital work-in-progress (CWIP) - buildings on leasehold land 4.7 476,721 454,480
2,102,085 1,642,894
115Annual Report 2015

Notes to and Forming part of the Financial StatementsFor the year ended June 30, 2015
4.1 The following is a statement of operating fixed assets:
Leasehold land(notes 4.2 & 4.3)
Buildings on
leasehold land (notes 4.2 & 4.3)
Vessel (note 4.4)
VehiclesOffice
equipmentFurniture
and fittings
Motor launch and
jetty
Equipment on board
Container fittings
Beach huts (notes 4.2
& 4.3)
Workshop machinery
and equipment (note 4.2 &
4.3)
Computer equipment
Total
------------------------------------------------------------------------------------(Rupees in ‘000)------------------------------------------------------------------------------------As at June 30, 2013
Cost or revalued amount 649,060 573,852 1,440 67,777 49,337 31,299 18 1,736 3,468 14,988 14,959 36,885 1,444,819 Less: Accumulated depreciation - 74,086 1,440 64,848 22,481 16,808 18 958 3,468 1,298 10,415 28,848 224,668 Net book value 649,060 499,766 - 2,929 26,856 14,491 - 778 - 13,690 4,544 8,037 1,220,151
Year ended June 30, 2014
Opening net book value 649,060 499,766 - 2,929 26,856 14,491 - 778 - 13,690 4,544 8,037 1,220,151
Additions - 3,081 - - 1,026 136 - - - - 333 5,243 9,819 Transfers from CWIP - note 4.7 - 5,557 - - - - - - - - - - 5,557
Write offCost - - - - - - (18) - (3,468) - - - (3,486)Accumulated depreciation - - - - - - 18 - 3,468 - - - 3,486
- - - - - - - - - - - - -
Depreciation charge for the year - note 4.6 - (27,116) - (1,107) (6,609) (3,671) - (171) - (1,399) (472) (6,568) (47,113)
Closing net book value 649,060 481,288 - 1,822 21,273 10,956 - 607 - 12,291 4,405 6,712 1,188,414
As at June 30, 2014
Cost or revalued amount 649,060 582,490 1,440 67,777 50,363 31,435 - 1,736 - 14,988 15,292 42,128 1,456,709 Less: Accumulated depreciation - 101,202 1,440 65,955 29,090 20,479 - 1,129 - 2,697 10,887 35,416 268,295 Net book value 649,060 481,288 - 1,822 21,273 10,956 - 607 - 12,291 4,405 6,712 1,188,414
Year ended June 30, 2015
Opening net book value 649,060 481,288 - 1,822 21,273 10,956 - 607 - 12,291 4,405 6,712 1,188,414
Additions - 3,481 - - 2,361 203 - - - - 68 10,750 16,863 Transfers from CWIP - note 4.7 - 10,038 - - - - - - - - - - 10,038
Disposals - note 4.5Cost - - - - (281) (11) - - - - - - (292)Accumulated depreciation - - - - 265 8 - - - - - - 273
- - - - (16) (3) - - - - - - (19)
Surplus on revaluation 213,292 243,938 - - - - - - - 3,038 - - 460,268
Write offCost - (6,221) - - - - - - - - - - (6,221)Accumulated depreciation - - - - - - - - - - - - -
- (6,221) - - - - - - - - - - (6,221)
Depreciation charge for the year - note 4.6 - (27,310) - (880) (6,304) (3,373) - (172) - (1,416) (499) (4,025) (43,979)Closing net book value 862,352 705,214 - 942 17,314 7,783 - 435 - 13,913 3,974 13,437 1,625,364
As at June 30, 2015
Cost or revalued amount 862,352 708,410 1,440 67,777 52,443 31,627 - 1,736 - 13,913 15,360 52,878 1,807,936 Less: Accumulated depreciation - 3,196 1,440 66,835 35,129 23,844 - 1,301 - - 11,386 39,441 182,572 Net book value 862,352 705,214 - 942 17,314 7,783 - 435 - 13,913 3,974 13,437 1,625,364
Annual rate of depreciation (%) 2015 3 to 20 4 20 15 10 to 15 10 to 15 10 to 15 15 10 5 to 10 33
Annual rate of depreciation (%) 2014 3 to 20 4 20 15 10 to 15 10 to 15 10 to 15 15 10 5 to 10 33
4.2 The revaluation of the ‘leasehold land’, ‘buildings on leasehold land’ and ‘beach huts’ was carried out as of June 30, 2015 by Fairwater Property Valuers & Surveyors (Private) Limited on the basis of their professional assessment of present market values. The revaluation resulted in a surplus of Rs 460.268 million on the written down values of Rs 1,121.228 million which were incorporated in the books of the Corporation as at June 30, 2015. Out of the total revaluation surplus arisen, Rs 1,254.837 million (2014: Rs 804.140 million) remains undepreciated as at June 30, 2015.
116 Pakistan National Shipping Corporation

Notes to and Forming part of the Financial StatementsFor the year ended June 30, 2015
4.3 Had there been no revaluation, the carrying amount of revalued assets would have been as follows:
2015 2014-----------(Rupees in ‘000)-----------
Leasehold land, buildings on leasehold land and beach huts 275,426 285,874 Workshop machinery and equipment 3,864 4,290
279,290 290,164
4.4 Cost and accumulated depreciation of vessel amounting to Rs 1.440 million relates to M.V Ilyas Bux. This vessel was seized by the Indian Authorities during the 1965 war and the Corporation does not have physical possession or control over the vessel.
4.5 No operating fixed assets with a net book value exceeding Rs 50,000 were disposed off during the year.
4.6 The depreciation charge for the year has been allocated as follows:
Note 2015 2014-----------(Rupees in ‘000)-----------
Fleet expenses - indirect 30 499 474 Vessel management expenses 31 19,617 22,341 Real estate expenses 32 21,901 21,816 Administrative expenses 33 1,962 2,482
43,979 47,113
4.7 Capital work-in-progress - buildings on leasehold land:
Balance at beginning of the year 454,480 315,260 Additions during the year 32,279 144,777 Transfered to operating fixed assets during the year (10,038) (5,557)Balance at end of the year 476,721 454,480
5. INTANGIBLE ASSET
This represents cost of Rs 16.503 million of software “Ship Management Expert System” (SES). SES was being amortised over the useful life of five years and was fully amortised during the year ended June 30, 2009, however, it is still in active use.
6. INVESTMENT PROPERTIES Note Leasehold Buildings on Total
land leasehold land------------------(Rupees in ‘000)------------------
Balance as at July 1, 2014 1,043,560 37,036 1,080,596 Gain on revaluation of investment properties 6.1 682,430 4,447 686,877 Balance as at June 30, 2015 1,725,990 41,483 1,767,473
6.1 The revaluation of the Corporation’s investment properties was carried out by Fairwater Property Valuers & Surveyors (Private) Limited as of June 30, 2015 on the basis of their professional assessment of present market values. As a result, a revaluation gain of Rs 686.877 million was determined in respect of leasehold land whereas a revaluation gain of Rs 4.447 million was determined on buildings.
117Annual Report 2015

Notes to and Forming part of the Financial StatementsFor the year ended June 30, 2015
7. LONG-TERM INVESTMENTS IN RELATED PARTIES
(SUBSIDIARIES AND AN ASSOCIATE)
No. of shares - ordinary
Name of the company
Country of
incorpo-ration
Latest available audited financial
statements for the year ended
Percentage holdingFace
value per share
20142015 2014 2015 2014 2015
(Rupees) ----(Rupees in ‘000)----
(i) Subsidiary companies - unlisted
10,000,000 10,000,000 Bolan Shipping (Private) Limited Pakistan June 30, 2015 100 100 10 100,000 100,000
275,344,100 275,344,100 Chitral Shipping (Private) Limited Pakistan June 30, 2015 100 100 10 2,753,441 2,753,441
226,825,500 226,825,500 Hyderabad Shipping (Private) Limited Pakistan June 30, 2015 100 100 10 2,268,255 2,268,255
15,686,000 15,686,000 Islamabad Shipping (Private) Limited Pakistan June 30, 2015 100 100 10 156,860 156,860
36,000 36,000 Johar Shipping (Private) Limited Pakistan June 30, 2015 100 100 10 360 360
7,286,000 7,286,000 Kaghan Shipping (Private) Limited Pakistan June 30, 2015 100 100 10 72,860 72,860
330,000,000 330,000,000 Karachi Shipping (Private) Limited Pakistan June 30, 2015 100 100 10 3,451,994 3,451,994
16,736,000 16,736,000 Khairpur Shipping (Private) Limited Pakistan June 30, 2015 100 100 10 167,360 167,360
340,000,000 340,000,000 Lahore Shipping (Private) Limited Pakistan June 30, 2015 100 100 10 3,400,000 3,400,000
14,686,000 14,686,000 Lalazar Shipping (Private) Limited Pakistan June 30, 2015 100 100 10 146,860 146,860
9,486,000 9,486,000 Makran Shipping (Private) Limited Pakistan June 30, 2015 100 100 10 94,860 94,860
336,016,700 336,016,700 Malakand Shipping (Private) Limited Pakistan June 30, 2015 100 100 10 3,360,167 3,360,167
14,054,750 14,054,750 Multan Shipping (Private) Limited Pakistan June 30, 2015 100 100 10 1,405,475 1,405,475
1,600 1,600 Pakistan Co-operative Ship Stores
(Private) Limited Pakistan June 30, 2015 73 73 100 868 868
500,000,000 500,000,000 Quetta Shipping (Private) Limited Pakistan June 30, 2015 100 100 10 5,000,000 5,000,000
6,936,000 6,936,000 Sargodha Shipping (Private) Limited Pakistan June 30, 2015 100 100 10 69,360 69,360
6,786,000 6,786,000 Shalamar Shipping (Private) Limited Pakistan June 30, 2015 100 100 10 67,860 67,860
254,012,300 254,012,300 Sibi Shipping (Private) Limited Pakistan June 30, 2015 100 100 10 2,540,123 2,540,123
13,236,000 13,236,000 Swat Shipping (Private) Limited Pakistan June 30, 2015 100 100 10 132,360 132,360
25,189,063 25,189,063
(ii) Associate - unlisted
12,250 12,250Muhammadi Engineering Works Limited
Pakistan December 31, 1982
49 49 100 1,600 1,600
Less: Accumulated impairment losses (unaudited) 1,600 1,600
- -
25,189,063 25,189,063
118 Pakistan National Shipping Corporation

Notes to and Forming part of the Financial StatementsFor the year ended June 30, 2015
8. LONG-TERM INVESTMENTS IN LISTED COMPANIES AND ANOTHER ENTITY
Note 2015 2014Financial assets designated as ‘at fair value through -----------(Rupees in ‘000)-----------
profit or loss’
Listed companies
Siemens (Pakistan) Engineering Limited6,930 (2014: 6,930) fully paid ordinary shares of Rs 10each. Market value per share as at June 30, 2015Rs 1,274.23 (2014: Rs 1,257). 8.1 8,830 8,711
Pakistan State Oil Company Limited115,358 (2014: 115,358) fully paid ordinary shares of Rs 10 each. Market value per share as at June 30, 2015Rs 385.79 (2014: Rs 388.86). 8.2 44,504 44,858
53,334 53,569
Available-for-sale financial asset
Other entity - carried at cost
Pakistan Tourism Development Corporation Limited.10,000 (2014: 10,000) fully paid ordinary shares of Rs 10 each. 100 100
53,434 53,669
8.1 The Corporation holds 0.084% (2014: 0.084%)of the investee’s share capital.
Opening balance 8,711 4,513 Change in fair value 119 4,198
8,830 8,711
8.2 The Corporation holds 0.04246% (2014: 0.04246%) of the investee’s share capital.
Opening balance 44,858 33,598 Change in fair value (354) 11,260
44,504 44,858
9. DEFERRED TAXATION
Deductible temporary differences arising in respect ofshort-term provisions and deferred liabilities 232,676 136,660
Taxable temporary differences arising in respect of:- surplus on revaluation of property, plant and equipment 20 126,530 35,892 - accelerated depreciation 8,477 9,991
135,007 45,883
97,669 90,777
119Annual Report 2015

Notes to and Forming part of the Financial StatementsFor the year ended June 30, 2015
9.1 The management is confident that sufficient future taxable profits will be available against which deferred tax asset will be adjusted.
Note 2015 2014-----------(Rupees in ‘000)-----------
10. STORES AND SPARES
Stores- at depot 11,343 9,495 - at buildings 742 845
12,085 10,340 Spares
- at buildings 1,063 1,062 13,148 11,402
11. TRADE DEBTS - unsecured
- considered good 11.1 1,821,692 1,987,993 - considered doubtful 18,007 17,280
1,839,699 2,005,273 Less: Provision for doubtful debts 11.2 18,007 17,280
1,821,692 1,987,993
11.1 The ageing analysis of these trade debts that are past due but not impaired is as follows:
Note 2015 2014-----------(Rupees in ‘000)-----------
Upto 1 month 284,154 787,061 1 to 6 months 294,660 744,299 More than 6 months 1,242,878 456,633
1,821,692 1,987,993
11.2 Provision for doubtful debts
Balance at the beginning of the year 17,280 18,265 Provision made during the year 34 727 - Provision reversed during the year - (881)Provision written off during the year - (104)Balance at the end of the year 18,007 17,280
As at June 30, 2015, trade debts of Rs 18.007 million (2014: Rs 17.280 million) were impaired and provided for. These balances have been outstanding for more than three years.
Note 2015 2014-----------(Rupees in ‘000)-----------
12. AGENTS’ AND OWNERS’ BALANCES - unsecured
Considered good 12.1 18,065 124,824 Considered doubtful 4,453 4,453
22,518 129,277 Less: Provision for impairment 4,453 4,453
18,065 124,824
120 Pakistan National Shipping Corporation

Notes to and Forming part of the Financial StatementsFor the year ended June 30, 2015
12.1 The ageing analysis of these agents’ and owners’ balances that are past due but not impaired is as follows:
Note 2015 2014------------(Rupees in ‘000)------------
Upto 1 month 3,528 60,128 1 to 6 months 8,256 64,033 More than 6 months 6,281 663
18,065 124,824
13. LOANS AND ADVANCES - considered good
LoansTo employees 1 1
Advances- a subsidiary 13.1 3,402,698 - - employees 40,730 46,738 - contractors and suppliers 38,124 3,197 - others 23,706 8,628
3,505,259 58,564
13.1 This represents amount paid by the Corporation, as an advance against future issue of share capital by a wholly owned subsidiary, Shalamar Shipping (Private) Limited, for purchase of vessel.
14. TRADE DEPOSITS AND SHORT-TERM PREPAYMENTS
Note 2015 2014------------(Rupees in ‘000)------------
Deposits- considered good 15,913 9,868 - considered doubtful 369 369
16,282 10,237 Less: Provision for impairment 369 369
15,913 9,868
Prepayments 35,413 35,736 51,326 45,604
15. OTHER RECEIVABLES
Rent receivable- considered good 15.1 11,203 10,282 - considered doubtful 3,801 3,801
15,004 14,083 Less: Provision for impairment 3,801 3,801
11,203 10,282 Others
- considered good 15.2 78,878 82,264 - considered doubtful 10,832 12,659
15.3 89,710 94,923 Less: Provision for impairment 15.4 10,832 12,659
78,878 82,264
Derivative cross currency interest rate swap 15.6 & 15.7 62,991 147,209 153,072 239,755
121Annual Report 2015

Notes to and Forming part of the Financial StatementsFor the year ended June 30, 2015
15.1 The ageing analysis of rent receivables that are past due but not impaired is as follows:
2015 2014-----------(Rupees in ‘000)-----------
Upto 1 month 1,173 837 1 to 6 months 2,111 1,952 More than 6 months 7,919 7,493
11,203 10,282
15.2 As at June 30, 2015, an amount of Rs 78.878 million (2014: Rs 82.264 million) that are past due but not impaired. These receivables have been outstanding for less than one year.
Note 2015 2014-----------(Rupees in ‘000)-----------
15.3 This includes the following:
Receivable from sundry debtors 57,961 67,054 Sales tax refund claims 25,865 26,017 Insurance claims receivable - 29 Others 5,884 1,823
89,710 94,923 15.4 Provision for impairment
Balance at the beginning of the year 12,659 12,659 Provision reversed during the year 35 (1,827) - Balance at the end of the year 15.5 10,832 12,659
15.5 As at June 30, 2015, other receivables of Rs 10.832 million (2014: Rs 12.659 million) were impaired and provided for. These receivables have been outstanding for more than three years.
15.6 The Corporation has entered into a cross currency interest rate swap of Rs 9,995.300 million in respect of its borrowing (note 21). Under the terms of the cross currency swap arrangement, the Corporation is required to pay LIBOR plus 3.75% to the arranging bank on the borrowing denominated in USD (USD notional) for the purpose of cross currency swap, and receive KIBOR plus 2.20% from the arranging bank. Further, the Corporation shall pay / receive any exchange loss / gain on the USD notional outstanding at each quarter end. Furthermore, the Corporation had also entered into an interest rate swap. Under the terms of the interest rate swap, the Corporation receives a fixed interest of 13% per annum, whereas the Corporation has to pay 3 months KIBOR for each quarter. The net fair value of cross currency interest and interest rate swap as determined by the bank were Rs 30.048 million (favourable) (2014: Rs 86.851 million (favourable)) and Rs 9.022 million (favourable) (2014: Rs 14.015 million (favourable)) respectively to the Corporation as of the balance sheet date which has been increased by the net interest receivable and exchange gain aggregating to Rs 23.920 million (2014: Rs 46.343 million) as at June 30, 2015.
15.7 On September 26, 2013, the Corporation early terminated one of its cross currency swap contract having a notional amount aggregating Rs 1,244.880 million. The early termination resulted in a payment by the Corporation to the arranging bank aggregating Rs 87.624 million comprising of net effects of interest received aggregating Rs 7.982 million, exchange loss and swap spread paid amounting to Rs 60.565 million and Rs 35.041 million respectively.
122 Pakistan National Shipping Corporation

Notes to and Forming part of the Financial StatementsFor the year ended June 30, 2015
Note 2015 2014-----------(Rupees in ‘000)-----------
16. SHORT-TERM INVESTMENTS
Term deposits with banks having maturity of:- more than six months but upto twelve months 16.1 300,000 - - three to six months 16.2 1,154,375 1,497,440 - three months or less 16.3 500,000 797,440
1,954,375 2,294,880
16.1 The mark-up on these term deposits denominated in local currency ranges from 8.5% to 8.75% (2014: Nil) per annum.
16.2 The mark-up on these term deposits denominated in local currency ranges from 8.10% to 8.80% (2014: 10% to 10.50%) per annum, whereas mark-up on term deposits denominated in foreign currency ranges from 2.05% to 2.10% (2014: 2%) per annum.
16.3 The mark-up on these term deposits denominated in local currency ranges from 6.70% to 7.00% (2014: 9.75% to 10.50%) per annum, whereas mark-up on term deposits denominated in foreign currency is Nil (2014: 1.6% to 2%) per annum.
Note 2015 2014-----------(Rupees in ‘000)-----------
17. CASH AND BANK BALANCES
Cash at bank- in current accounts
- local currency 779,935 403,585 - foreign currency 516,023 145,426
1,295,958 549,011 - in savings accounts
- local currency 17.1 & 17.2 1,510,442 1,290,962 - foreign currency 17.3 1,423 1,579
1,511,865 1,292,541
Cash in hand 548 979 2,808,371 1,842,531
17.1 The mark-up on savings accounts in local currency ranges from 4.5% to 6.75% (2014: 4.8% to 9.4%) per annum.
17.2 This includes Rs 2.126 million (2014: Rs 2.126 million) and Rs 3 million (2014: Rs 3 million) held as security by Habib Bank Limited, P.N.S.C. Branch and Soneri Bank Limited, AKU Branch respectively against guarantees issued on behalf of the Corporation.
17.3 The mark-up on savings accounts in foreign currency ranges from 0.15% to 0.50% (2014: 0.15% to 0.50%) per annum.
123Annual Report 2015

Notes to and Forming part of the Financial StatementsFor the year ended June 30, 2015
18. SHARE CAPITAL
18.1 Issued, subscribed and fully paid-up
2015 2014 2015 2014--------(No. of Shares)-------- --------(Rupees in ‘000)--------
Ordinary shares of Rs 10 each issued as fully paid to shareholders of former National Shipping Corporation (NSC) and Pakistan Shipping Corporation (PSC) in consideration of their shareholdings in those companies 24,130,789 24,130,789 241,308 241,308
Ordinary shares of Rs 10 each issued as fully paid to GoP for cash received in 1985 25,900,000 25,900,000 259,000 259,000
Ordinary shares of Rs 10 each issued as fully paid to the GoP on the financial restructuring of the Corporation in the year 1989-90 64,309,800 64,309,800 643,098 643,098
Ordinary shares of Rs 10 each issued as fully paid bonus shares 17,722,791 17,722,791 177,228 177,228
132,063,380 132,063,380 1,320,634 1,320,634
18.2 As at June 30, 2015, GoP held 109,919,234 (2014: 109,919,234) ordinary shares of the Corporation.
19. RESERVES Note 2015 2014
-----------(Rupees in ‘000)-----------
Capital reserves 19.1 126,843 126,843 Revenue reserves- remeasurement of post-retirement benefits
obligation - net of tax (342,905) (226,522)- unappropriated profit 7,115,016 6,413,830
6,898,954 6,314,151
19.1 This includes an amount transferred from shareholders’ equity at the time of merger between former NSC and PSC.
124 Pakistan National Shipping Corporation

Notes to and Forming part of the Financial StatementsFor the year ended June 30, 2015
20. SURPLUS ON REVALUATION OF PROPERTY, PLANT AND EQUIPMENT - NET OF TAX
Note 2015 2014-----------(Rupees in ‘000)-----------
Balance at the beginning of the year 804,140 813,778
Add: Surplus arising on revaluation of fixed assets during the current year 460,268 -
Less: Transferred to unappropriated profit: - Surplus relating to incremental depreciation charged during the current year on related assets - net of tax 6,508 7,449 - Related deferred tax liability 3,063 2,189
9,571 9,638 1,254,837 804,140
Less: Related deferred tax liability on: - Revaluation at the beginning of the year 35,892 37,714 - Incremental depreciation charged during the current year on related assets transferred to profit and loss account (3,063) (2,189) - Surplus arising on revaluation of fixed assets during the current year 79,032 -
- Effect of change in statutory tax rate for next year (3,076) 1,109 - Effect of allocation of revenue between presumptive tax regime and normal tax regime 17,745 (742)
9 126,530 35,892 Balance at the end of the year 1,128,307 768,248
21. LONG-TERM FINANCING - secured
Financing under syndicate term finance agreement 21.1 & 21.2 5,918,572 5,142,882 Less: Current portion 1,407,455 1,150,674
4,511,117 3,992,208
Financing under term finance certificates agreement 21.1 580,030 742,861 Less: Current portion 166,208 166,208
413,822 576,653
Financing under musharika agreement 21.2 951,487 - Less: Current portion 128,391 -
823,096 - 5,748,035 4,568,861
21.1 During the year ended June 30, 2011, the Corporation obtained a financing facility of Rs 10,300 million. The financing was obtained in the form of a syndicated term finance loan of Rs 9,000 million, with the remaining amount of Rs 1,300 million in the form of Term Finance Certificates (TFCs), having a face value of Rs 5,000 each by way of private placement.
125Annual Report 2015

Notes to and Forming part of the Financial StatementsFor the year ended June 30, 2015
The financing carries mark-up of KIBOR+2.20%. The loan along with the mark-up is repayable on a quarterly basis with the last repayment date on November 23, 2018. The facility is secured by a first mortgage charge over certain vessels owned by its subsidiary companies, all present and future receivables of the Corporation from three major customers and its investment properties.
As at June 30, 2015, the Corporation has drawn Rs 8,733.757 million (2014: Rs 8,733.757 million) and Rs 1,261.543 million (2014: Rs 1,261.543 million) from syndicated term finance and TFCs respectively. The Corporation has also paid loan arrangement fee amounting to Rs 106.662 million, whereas the remaining amount of Rs 3.155 million has been expensed out upon completion of the drawdowns and expiry of the facility on September 7, 2012.
21.2 During the year ended June 30, 2015, the Corporation obtained a financing facility of Rs 4,500 million. The financing was obtained in the form of syndicated term finance loan of Rs 3,000 million, with the remaining amount of Rs 1,500 million through a musharika agreement.
The financing carries mark-up at the rate of KIBOR+1.60%. The loan along with the mark-up is repayable on a quarterly basis with the last repayment date on November 6, 2022. The facility is secured by a first mortgage charge over certain vessels owned by the subsidiary companies of the Corporation.
During the year ended June 30, 2015, the Corporation has drawn Rs 2,054.250 million and Rs 1,027.125 million from syndicated term finance and musharika respectively. The Corporation has also paid loan arrangement fee amounting to Rs 45 million which was included fully in the amortised cost of the long term financing, whereas an amount of Rs 315,000 is expensed out at the time of drawdown.
Note 2015 2014-----------(Rupees in ‘000)-----------
22. DEFERRED LIABILITIES
Employees’ gratuity- funded 22.1.3 142,289 86,899 - unfunded 22.1.3 167,304 100,995
309,593 187,894 Post-retirement medical benefits 22.1.3 200,989 194,581 Employees’ compensated absences 22.2.3 340,979 235,008
851,561 617,483
22.1 Retirement benefit schemes
22.1.1 The disclosures made in notes 22.1.2 to 22.1.16 are based on the information included in the actuarial valuation report as of June 30, 2015.
126 Pakistan National Shipping Corporation

Notes to and Forming part of the Financial StatementsFor the year ended June 30, 2015
22.1.2 As stated in notes 2.17.2 and 2.17.3 of these financial statements, the Corporation operates a funded retirement gratuity scheme for those permanent employees who joined the Corporation before October 16, 1984, an unfunded retirement gratuity scheme for contractual employees and an unfunded post-retirement medical benefit scheme for permanent and contractual employees. Liability is maintained against these schemes based on the actuarial recommendations. The following significant assumptions were used for the actuarial valuation of the defined benefit obligation schemes:
2015 2014Employees’ Post Employees’ Post
gratuity retirement gratuity retirementFunded Unfunded medical Funded Unfunded medical
benefits benefits
Discount rate 9.75% 10.50% 9.75% 13.25% 13.25% 13.25%
Future salary increases - for permanentemployeesFor the year 2014-15 - - - 40.00% - - For the year 2015-16 2.00% - - 2.00% - - For the year 2016-17 40.00% - - 40.00% - - For the year 2017-18 2.00% - - 2.00% - - For the year 2018-19 40.00% - - 40.00% - - For the year 2019-20 2.00% - - 2.00% - - For the year 2020-21 40.00% - - 13.25% - - For the year 2022-23 and onwards 9.75% - - 13.25% - -
Future salary increases - for contractualemployeesFor the year 2014-15 - - - 15.00% - - For the year 2015-16 - 15.00% - 15.00% - - For the year 2016-17 - 15.00% - 15.00% - - For the year 2017-18 - 15.00% - 15.00% - - For the year 2018-19 - 15.00% - 15.00% - - For the year 2019-20 - 15.00% - 13.25% - - For the year 2020-21 - 10.50% - 13.25% - - For the year 2022- and onwards - 10.50% - 13.25% - -
Medical escalation rate - - 9.75% - - 13.25%Death rate based on SLIC (2001-05) Ultimate mortality tables.
127Annual Report 2015

Notes to and Forming part of the Financial StatementsFor the year ended June 30, 2015
2015 2014Employees’ Post- Employees’ Post-
gratuity retirement gratuity retirementFunded Unfunded medical Funded Unfunded medical
benefits benefits------------------------------------(Rupees in ‘000)------------------------------------
22.1.3 Balance sheet reconciliation
Present value of defined benefit obligation 432,113 167,304 200,989 397,045 100,995 194,581 Fair value of plan assets (289,824) - - (310,146) - - Net liability in the balance sheet 142,289 167,304 200,989 86,899 100,995 194,581
22.1.4 Movement in present value of defined benefitobligation
Balance at the beginning of the year 397,045 100,995 194,581 435,454 67,166 200,957 Current service cost 9,256 20,648 7,717 11,991 11,416 7,232 Interest cost 47,025 14,407 23,671 44,414 6,890 21,032 Benefits paid (93,763) (7,015) (32,401) (83,717) (7,474) (25,938)Recognised prior service cost - - - - - 10,273 Remeasurement on obligation 72,550 38,269 7,421 (11,097) 22,997 (18,975)Balance at the end of the year 432,113 167,304 200,989 397,045 100,995 194,581
22.1.5 Movement in fair value of plan assets
Balance at the beginning of the year 310,146 - - 362,802 - - Expected return on plan assets 36,205 - - 36,829 - - Contribution 50,000 - - - - - Benefits paid (93,763) - - (83,717) - - Remeasurement on plan assets (12,764) - - (5,768) - - Balance at the end of the year 289,824 - - 310,146 - -
22.1.6 Movement in net liability in the balance sheet
Balance at the beginning of the year 86,899 100,995 194,581 72,652 67,166 200,957 Expense recognised for the year 20,076 35,055 31,388 19,576 18,306 38,537 Contributions made by the Corporation /
payments (50,000) (7,015) (32,401) - (7,474) (25,938)Remeasurements recognised in
other comprehensive income 85,314 38,269 7,421 (5,329) 22,997 (18,975) 142,289 167,304 200,989 86,899 100,995 194,581
22.1.7 The amounts recognised in the income statement
Current service cost 9,256 20,648 7,717 11,991 11,416 7,232 Net interest amount 10,820 14,407 23,671 7,585 6,890 21,032 Prior service cost - - - - - 10,273
20,076 35,055 31,388 19,576 18,306 38,537 Less: Charged to subsidiaries 806 1,020 671 310 768 255 Expense 19,270 34,035 30,717 19,266 17,538 38,282
22.1.8 Remeasurements recognised in other comprehensive income
Losses / (gains) from changes in financial assumptions 45,200 15,902 - (24,281) 9,952 -
Experience losses / (gains) 27,350 22,367 7,421 13,184 13,045 (1,381)Remeasurement of fair value of plan assets 12,764 - - 5,768 - (17,594)
85,314 38,269 7,421 (5,329) 22,997 (18,975)
Rupees in ‘000
% Rupees in
‘000 %
22.1.9 Major categories / composition of plan assets
Cash and cash equivalents 138,133 47.66% 33,530 10.81%Term deposit receipts of
private commercial banks (unquoted) 151,691 52.34% 276,616 89.19% 289,824 100% 310,146 100%
128 Pakistan National Shipping Corporation

Notes to and Forming part of the Financial StatementsFor the year ended June 30, 2015
22.1.10 The expenses in respect of employees’ gratuity and post-retirement medical benefits have been charged on the basis of actuarial recommendations and are in accordance with the Administrative and Financial Services Agreement with the subsidiary companies.
22.1.11 Actual gain on plan assets during the year ended June 30, 2015 was Rs 23.481 million (2014: Rs 31.33 million).
22.1.12 Assumed future salary increase rate and discount rate have a significant effect on the employee’s gratuity. A one percentage point change in assumed future salary increase rate and discount rate would have the following effects:
Increase / (decrease) in defined benefit obligation of`Funded Gratuity Scheme Unfunded Gratuity Scheme
Change in assumption
Increase in assumption
Decrease in assumption
Increase in assumption
Decrease in assumption
Discount Rate 1% (10,689) 11,281 (18,178) 22,081 Salary increase rate 1% 11,560 (11,174) 22,025 (18,464)
22.1.13 The weighted average duration of the defined benefit obligations funded and unfunded gratuity scheme is 2.57 and 10.57 years.
22.1.14 Assumed medical cost escalation rate and discount rate have a significant effect on the post-retirement medical benefit. A one percentage point change in assumed medical cost escalation rate and discount rate would have the following effects:
Increase / (decrease) in defined benefit obligation of`Post Retirement Medical Benefits
Permanent Employees Contractual EmployeesChange in
assumptionIncrease in assumption
Decrease in assumption
Increase in assumption
Decrease in assumption
Medical Cost Escalation Rate 1% 3,907 (3,712) 3,139 (2,599)Discount Rate 1% (3,679) 3,944 (2,577) 3,171
22.1.15 The weighted average duration of the defined benefit obligations post medical retirement benefit scheme for permanent and contractual employees is 4.93 years.
22.1.16 The employee gratuity funded and unfunded scheme and post retirement medical benefit plans exposes the Corporation to the following risks:
Investment risk: The risk of the investment underperforming and not being sufficient to meet the liabilities.
Mortality risk: The risk that the actual mortality rate is different. The effect depends on the beneficiaries service/age distribution and the benefit.
Medical cost escalation risks – The risk that the hospitalisation cost could be higher than what we assumed.
Final salary risk: The risk that the final salary at the time of cessation of service is greater than what is assumed. Since the benefit is calculated on the final salary, the benefit amount increases similarly.
Withdrawal risk: The risk of higher or lower withdrawal experienced than assumed. The final effect could go either way depending on the beneficiaries’ service/age distribution and the benefit.
129Annual Report 2015

Notes to and Forming part of the Financial StatementsFor the year ended June 30, 2015
22.2 Employees’ compensated absences
22.2.1 The disclosures made in notes 22.2.2 to 22.2.9 are based on the information included in the actuarial valuation as of June 30, 2015.
22.2.2 As stated in note 2.18, the Corporation operates an employees’ compensated absences scheme. Provision is maintained against this scheme based on the actuarial recommendations. The following significant assumptions were used for the actuarial valuation of the scheme:
2015 2014
Discount rate 9.75% 13.25%Future salary increases - for permanent employees
For the year 2015-16 - 40.00%For the year 2016-17 40.00% 2.00%For the year 2017-18 2.00% 40.00%For the year 2018-19 40.00% 2.00%For the year 2019-20 2.00% 40.00%For the year 2020-21 40.00% 2.00%For the year 2021-22 and onwards 2.00% 13.25%For the year 2023 and onwards 13.25% 13.25%
Future salary increases - for contractual employeesFor the year 2016-17 till 2017-18 15.00% 15.00%For the year 2018-19 15.00% 15.00%For the year 2019-20 15.00% 13.25%For the year 2020-21 15.00% 13.25%For the year 2022 and onwards 9.75% 13.25%
2015 2014-----------(Rupees in ‘000)-----------
22.2.3 Balance sheet reconciliation
Present value of defined benefit obligation (recognised) 340,979 235,008
22.2.4 Movement in present value of defined benefit obligation
Balance at the beginning of the year 235,008 225,799 Current service cost 57,227 58,268 Interest cost 32,277 25,413 Remeasurements of obligation 101,942 (14,231)Benefits paid (85,475) (60,241)Balance at the end of the year 340,979 235,008
22.2.5 Expenses
Current service cost 57,227 58,268 Interest cost 32,277 25,413 Remeasurements of obligation 101,942 (14,231)
191,446 69,450 Less: Charged to subsidiaries 3,123 291 Expense 188,323 69,159
130 Pakistan National Shipping Corporation

Notes to and Forming part of the Financial StatementsFor the year ended June 30, 2015
22.2.6 Amounts for the current period and prior period of the present value of defined benefit obligation are as follows:
2015 2014-----------(Rupees in ‘000)-----------
Present value of defined benefit obligation 340,979 235,008 Experience gain on defined benefit obligation 101,942 (14,231)
22.2.7 Assumed future salary increase rate and discount rate have a significant effect on the employee’s compensated absences. A one percentage point change in assumed future salary increase rate and discount rate would have the following effects:
Increase / (decrease) in defined benefit obligation of`Employees Compensated Absences
Permanent Employees Contractual Employees
Change in assumptionIncrease in assumption
Decrease in assumption
Increase in assumption
Decrease in assumption
Discount rate 1% (7,453) 7,993 (12,831) 16,022 Salary growth rate 1% 8,035 (7,647) 15,940 (13,006)
22.2.8 The risks to which the scheme exposes the Corporation are disclosed in note 22.1.16.
22.2.9 The expenses in respect of employees’ compensated absences have been charged on the basis of actuarial recommendations and are in accordance with the Administrative and Financial Services Agreement with the subsidiary companies.
22.3 Expected retirement benefits costs for the year ending June 30, 2016 are as follows:
(Rupees in ‘000)
Gratuity- Funded 24,512 - Unfunded 58,235 Post-retirement medical benefits 25,838 Compensated absences 126,757
22.4 During the year, the Corporation contributed Rs 12.550 million (2014: Rs 10.589 million) to the provident fund.
131Annual Report 2015

Notes to and Forming part of the Financial StatementsFor the year ended June 30, 2015
23. TRADE AND OTHER PAYABLES Note 2015 2014
-----------(Rupees in ‘000)-----------
Creditors 56,414 37,149 Current account balances with subsidiary companies 23.1 20,934,423 18,628,307 Agents’ and owners’ balances 396,500 804,063 Accrued liabilities 1,091,748 630,121 Deposits 23.2 38,187 42,212 Unclaimed dividends 33,063 29,916 Advances from customers 110,899 128,305 Other liabilities- amounts retained from contractors 27,411 23,695 - others 119,567 99,626
146,978 123,321 22,808,212 20,423,394
23.1 The break-up of current account balances with subsidiary companies is as follows:
Note 2015 2014-----------(Rupees in ‘000)-----------
Bolan Shipping (Private) Limited 861,042 861,559 Chitral Shipping (Private) Limited 1,379,567 1,156,474 Hyderabad Shipping (Private) Limited 1,122,272 1,130,222 Islamabad Shipping (Private) Limited 650,094 638,213 Kaghan Shipping (Private) Limited 1,323,946 885,888 Khairpur Shipping (Private) Limited 448,565 448,838 Makran Shipping (Private) Limited 316,629 316,951 Malakand Shipping (Private) Limited 661,116 910,365 Multan Shipping (Private) Limited 830,543 802,872 Sargodha Shipping (Private) Limited 198,332 197,906 Sibi Shipping (Private) Limited 503,824 524,684 Shalamar Shipping (Private) Limited 1,662,761 1,496,551 Swat Shipping (Private) Limited 1,168,036 1,168,308 Lalazar Shipping (Private) Limited 745,646 745,835 Johar Shipping (Private) Limited 1,229,936 1,230,208 Lahore Shipping (Private) Limited 2,327,248 1,743,813 Karachi Shipping (Private) Limited 2,230,006 1,574,336 Quetta Shipping (Private) Limited 3,274,860 2,795,284
20,934,423 18,628,307
23.2 These deposits are interest free and are repayable on demand or on completion of specific contracts.
Note 2015 2014-----------(Rupees in ‘000)-----------
24. PROVISION AGAINST DAMAGE CLAIMS
Balance at the beginning of the year 31,973 22,338 Charge during the year 34 4,615 15,847 Reversal during the year 35 (16,365) (6,212)Balance at the end of the year 20,223 31,973
132 Pakistan National Shipping Corporation

Notes to and Forming part of the Financial StatementsFor the year ended June 30, 2015
25. CONTINGENCIES AND COMMITMENTS
Contingencies
25.1 The contingent liability in respect of claims not acknowledged as debts by the Corporation, which as at June 30, 2015 aggregated to Rs 201.116 million (2014: Rs 368.244 million). These claims mainly relate to deficiencies in shipping documentation, delay in delivery of cargo and damages to cargo. These include Rs 2.285 million (2014: Rs 2.225 million) approximately in respect of insurance claims which, if accepted, will be borne by the Corporation as the P&I Club, Oceanus Mutual Underwriting Association (Bermuda) Limited has gone into liquidation. Out of the remaining claims, a sum of Rs 180.887 million (2014: Rs 273.186 million) approximately would be recoverable from the P&I Club, Steamship Mutual Underwriting Association (Bermuda) Limited, in the event these claims are accepted by the Corporation. As a matter of prudence, the management has made a total provision of Rs 20.223 million (2014: Rs 31.973 million) against the aforementioned claims in these financial statements.
25.2 The Corporation has not accepted liability in respect of customs duty approximating Rs 2.500 million (2014: Rs 2.500 million) relating to the sale of the vessel M.V. Bhambore during the year ended June 30, 1978. The duty was claimed from the Corporation and the matter has been taken up with the appropriate Government agencies.
25.3 The former owners of East & West Steamship Company, Chittagong Steamship Corporation Limited and Trans Oceanic Steamship Company Limited had initiated litigation that involved the Government of Pakistan and the Corporation.
Following the Supreme Court’s adjudication of the East & West Steamship Company’s matter in favour of the former owners, the Government provisionally assessed additional compensation due to the former owners at approximately Rs 97.012 million (2014: Rs 97.012 million). Although a major portion of this amount has been settled by the Government, the Government holds the Corporation liable for this amount by virtue of the net assets of the East & West Steamship Company having become vested in the Corporation.
In case of Chittagong Steamship Corporation Limited and Trans Oceanic Steamship Company Limited, the litigations relating to compensation to the former owners and the legal suits are pending in the High Court of Sindh. The amounts claimed are approximately Rs 1.300 million (2014: Rs 1.300 million) and Rs 66.800 million (2014: Rs 66.800 million) respectively.
The Corporation disclaims any liability in respect of the above mentioned amounts and any accretions to it upto final determination and settlement of the matters.
25.4 Certain other claims have been filed against the Corporation in respect of employees’ matters for an aggregate amount of approximately Rs 97.817 million (2014: Rs 108.817 million). These cases are pending and the management is confident that the outcome of these cases will be in the Corporation’s favour and accordingly no provision for above claims has been made in these financial statements.
25.5 While framing the tax assessment for the income year ended June 30, 1990, the assessing officer had made an addition to income of Rs 3,974.455 million, being the remission of liabilities due to the Federal government under the scheme of financial restructuring of the Corporation. The resultant tax liability including additional taxes for late payment of tax amounted to Rs 1,293.694 million, part of which was paid by the Corporation and the remaining amount of Rs 1,233.694 million was directly discharged at source by the Federal Government. The assessing officer while framing the order of income year ended June 30, 1996 had treated the aforementioned payment of tax liability by the Government as the income of the Corporation. The Income Tax Appellate Tribunal (ITAT) has given the decision in favour of the Corporation on the appeals filed against the above orders. However, the department has filed an appeal with the Honourable High Court against the aforementioned orders of ITAT. The Honourable High Court has decided the appeal against the Corporation. The leave to appeal filed by the Corporation has been accepted by the Honourable Supreme Court and the decision of the Honourable High Court has been suspended. Hearing of the appeal is pending in the Honourable Supreme Court.
133Annual Report 2015

Notes to and Forming part of the Financial StatementsFor the year ended June 30, 201525.6 During the year ended June 30, 2011, the Officer Inland Revenue (OIR) issued assessment orders under section
122 (5A) of the Income Tax Ordinance, 2001 (ITO, 2001) in respect of tax years 2008, 2009 and 2010. According to the orders, the OIR had made certain additions and determined additional tax demand of Rs 363.421 million. OIR has disallowed a portion of administrative expenses by attributing the same to the subsidiary companies and further disallowed a portion of contribution made to the approved gratuity fund (only in respect of tax year 2008) on the contention that the same is attributable to the subsidiary companies. The Corporation has paid Rs 170 million under protest and filed an appeal with the Commissioner of Income Tax (Appeals). During the year, Commissioner of Income Tax (Appeals) in his order has upheld certain additions and has given decisions in favour of the Corporation on certain matters resulting in refund of Rs 90.579 million. The management has provided for all the matters that have been decided against the Corporation, with the exception of disallowance of allocation of common expenses to profit on debt for tax years 2008 and 2009 which may result in increase of tax liability by Rs 17.848 million. The Corporation has filed an appeal with the ITAT in respect of aforementioned disallowances. The management of the Corporation is confident that the matters in appeals shall be eventually decided in its favour.
25.7 During the year ended June 30, 2012, the OIR issued assessment orders under section 122 (5A) of the ITO, 2001 in respect of tax year 2011. According to the orders, the OIR has made certain additions and determined additional tax demand of Rs 251.092 million. OIR has disallowed a portion of administrative expenses by attributing the same to the subsidiary companies and further disallowed financial expenses incurred by the Corporation on the contention that the same is equity specific and hence being capital in nature. The Corporation had paid Rs 160.513 million (2014: Rs 160.513 million) and adjusted Rs 90.579 million against refunds relating to tax year 2008, 2009 and 2010 under protest. During the year, Commissioner of Income Tax (Appeals) in his order has upheld certain additions and has given decisions in favour of the Corporation on certain matters, and has worked out refund of Rs 15.068 million. The Corporation and the department have filed appeals with the ITAT in respect of aforementioned disallowances. The management of the Corporation is confident that the subject matter in respect of tax year 2011 will eventually be decided in favour of the Corporation.
25.8 During the year ended June 30, 2013, the OIR issued assessment orders under section 122 (5A) of the ITO, 2001 in respect of tax year 2012. According to the orders, the OIR has made certain additions and determined additional tax demand of Rs 107.499 million. OIR has disallowed a portion of administrative expenses by attributing the same to the subsidiary companies and further disallowed financial expenses incurred by the Corporation on the contention that the same is equity specific and hence being capital in nature. The Corporation has paid Rs 65 million under protest and filed an appeal with the Commissioner of Income Tax (Appeals). During the year, Commissioner of Income Tax (Appeals) in his order the has upheld certain additions and has given decisions in favour of the Corporation on certain matters, and has worked out refund of Rs 24.022 million. The Corporation and the department have filed appeals with the ITAT in respect of aforementioned disallowances. The management of the Corporation is confident that the subject matter in respect of tax year 2012 will eventually be decided in favour of the Corporation.
25.9 During the year ended June 30, 2014, the OIR has issued assessment orders under section 122 (5A) of the ITO, 2001 in respect of tax year 2013. According to the orders, the OIR has made certain additions and determined additional tax demand of Rs 303.333 million. OIR has disallowed a portion of retirement benefit expenses by attributing the same to the subsidiary companies and further disallowed financial expenses incurred by the Corporation on the contention that the same is equity specific and hence being capital in nature. Moreover, OIR also disallowed the basis of apportionment of expenses. The Corporation has paid Rs 288.265 million under protest and adjusted Rs 15.068 million against refunds available for the tax year 2011. Further the management has filed an appeal with the Commissioner of Income Tax (Appeals) in his order has upheld certain additions and has given decisions in favour of the Corporation on certain matters, and worked out a Nil demand. The Corporation and the department have filed appeals with the ITAT in respect of aforementioned disallowances.
134 Pakistan National Shipping Corporation

Notes to and Forming part of the Financial StatementsFor the year ended June 30, 201525.10 During the year ended June 30, 2015, Assistant Commissioner Inland Revenue (ACIR) issued assessment order
under section 122 (5A) of the ITO, 2001 in respect of tax year 2014. According to the order the ACIR made certain additions and determined additional tax demand of Rs. 170.436 million in respect of certain disallowances regarding financial expenses, administrative costs and post retirement benefits. The Corporation has paid Rs. 83.438 million under protest and adjusted Rs. 86.998 million against refunds available for tax year 2008, 2009, 2010 and 2013. The management has filed an appeal with the Commissioner of Income Tax (Appeals) and at present the matter is pending for hearing. The management of the Corporation is confident that the subject matter in respect of tax year 2014 will eventually be decided in favour of the Corporation. The Commissioner of Income Tax (Appeals) in his order has upheld certain additions and has given addition in favour of the Corporation on certain matters, however, the appeal effect order has not been passed by the ACIR. The Corporation and the department have filed appeals with the ITAT in respect of aformentioned order of the Commissioner of Income Tax (Appeals).
25.11 During the year ended June 30, 2014, the Deputy Commissioner Inland Revenue (DCIR) had issued orders under section 161 of the ITO, 2001 in respect of tax years 2008 to 2013. According to the orders, the DCIR has held that the Corporation was required to withhold tax under section 152 (2) of the ITO, 2001 while making payments to non-resident shipping Companies, and the failure to deduct tax at source renders it personally liable to pay tax along with default surcharge on the unpaid amount of tax, under sections 161 and 205 of the ITO, 2001. By virtue of above orders a total tax demand of Rs 2,695.502 million was raised by the tax authorities. The Corporation filed an appeal with the Commissioner of Income Tax (Appeals) who maintained the orders passed by the DCIR and consequently an appeal was filed before the ATIR. The ATIR, in the appellate order, has held that the payments made by the Corporation to the non-resident shipping companies are in the nature of “Royalty” and the rate of tax withholding applicable on such payments would be 15 per cent. Accordingly, the tax demand originally raised has been reduced to Rs. 1,659.485 million. The Corporation’s legal counsel has filed a reference in the Honorable High Court against the order passed by the ATIR. A rectification application has also been filed with ATIR which is pending for hearing.
25.12 Further, during the year ended June 30, 2015, the DCIR has issued show cause notice under section 161 of the ITO, 2001 in respect of tax year 2014 proposing to raise tax demand of Rs 1,324.077 million on the aforementioned matter. The Corporation took up the matter to the Honourable High Court and the Court has suspended the show cause notice till further notice. The management of the Corporation is confident that the subject matter in respect of tax years 2008 to 2013 will eventually be decided in favour of the Corporation, and hence no provision has been recorded in the financial statements in respect of the said matter.
25.13 During the year ended June 30, 2014, the Assistant Commissioner Sindh Revenue Board (AC) has passed an order under Sindh Sales Tax on Services Act, 2011 for the tax period July 2011 to June 2012. The AC has held the Corporation liable to pay sales tax on ‘Administrative and Financial Services’ provided to its subsidiaries and has also levied sales tax on the services that are provided by the Corporation outside Sindh. By virtue of above order an additional tax demand of Rs 12.654 million, alongwith default surcharge of Rs 1.012 million was raised by the taxation authorities. The Corporation paid the amount under protest and filed Appeal with Commissioner Appeals - SRB (CA) which was decided against the Corporation. The Corporation has filed another appeal against the decision of CA with the Appellate Tribunal, SRB which is pending for hearing.
Commitments
25.14 Commitments in respect of capital expenditure amount to Rs 86.023 million (2014: Rs 193.057 million).
25.15 Outstanding letters of guarantee amount to Rs 5.126 million (2014: Rs 5.126 million).
26. CHARTERING REVENUE
2015 2014-----------(Rupees in ‘000)-----------
Foreign flag vessels- voyage charter revenue 5,581,009 6,793,294 - slot charter revenue 2,432,556 1,503,241
8,013,565 8,296,535
135Annual Report 2015

Notes to and Forming part of the Financial StatementsFor the year ended June 30, 2015
2015 2014-----------(Rupees in ‘000)-----------
27. SERVICE FEES - NET
Technical and commercial services fee 232,086 225,280 Administrative and financial services fee 77,362 74,126 Sales tax (14,736) (8,781)
294,712 290,625
28. DIVIDEND INCOME FROM SUBSIDIARIES
Chitral Shipping (Private) Limited 96,370 - Hyderabad Shipping (Private) Limited 79,389 - Multan Shipping (Private) Limited 49,192 - Malakand Shipping (Private) Limited 117,606 - Shalamar Shipping (Private) Limited 2,375 - Sibi Shipping (Private) Limited 88,904 -
433,836 -
28.1 During the year ended June 30, 2015, the aforementioned subsidiaries of the Corporation declared interim dividend @ Rs 0.35 per share.
29. FLEET EXPENSES - DIRECT Note 2015 2014
-----------(Rupees in ‘000)-----------
Charter, hire and related expenses 29.1 6,766,060 6,620,384 Exchange loss / (gain) 2,049 (28,600)
6,768,109 6,591,784 29.1 Charter, hire and related expenses
Foreign flag vessels- voyage charter expenses 5,510,301 5,854,181 - slot charter expenses 1,255,759 766,203
6,766,060 6,620,384 30. FLEET EXPENSES - INDIRECT
Salaries and allowances 30.1 19,599 14,838 Agents’ and other general expenses 30.2 5,881 7,293 Depreciation 4.6 499 474 General establishment expenses 770 754
26,749 23,359
30.1 This includes Rs 2.081 million (2014: Rs 1.756 million) in respect of provident fund contribution.
136 Pakistan National Shipping Corporation

Notes to and Forming part of the Financial StatementsFor the year ended June 30, 2015
Note 2015 2014-----------(Rupees in ‘000)-----------
30.2 Agents’ and other general expenses
Printing and stationery 53 57 Advertisement and publicity 1,136 1,185 Telephone, telex and postage 2,946 3,172 Commission charges 342 317 Legal and professional charges 8 1,234 Air freight 1,396 1,328
5,881 7,293 31. VESSEL MANAGEMENT EXPENSES
Workshop management expenses 77,713 56,098 Salaries and allowances 31.1 278,425 220,690 General establishment expenses 31.2 62,938 60,433 Rent, rates and taxes 15,289 5,827 Insurance 2,928 3,112 Depreciation 4.6 19,617 22,341
456,910 368,501
31.1 This includes Rs 5.417 million (2014: Rs 4.571 million) in respect of provident fund contribution.
31.2 General establishment expenses Note 2015 2014
-----------(Rupees in ‘000)-----------
Repairs and maintenance 5,119 4,696 Medical expenses 20,487 25,409 Security charges 1,669 1,187 Travelling and conveyance 6,878 4,797 Entertainment and canteen subsidy 3,878 1,358 Uniform and liveries 1,166 1,084 Printing and stationery 2,709 1,801 Telephone, telex and postage 4,171 3,271 Light, power and water 5,234 4,830 Computer expenses 4,012 3,630 Vehicle running, repairs and maintenance expenses 7,615 8,370
62,938 60,433
32. REAL ESTATE EXPENSES
Salaries and allowances 32.1 39,722 8,658 General establishment expenses 32.2 26,357 25,752 Rent, rates and taxes 5,970 7,286 Insurance 4,038 4,008 Depreciation 4.6 21,901 21,816 Legal and professional charges 795 21
98,783 67,541
32.1 This includes Rs 0.292 million (2014: Rs 0.246 million) in respect of provident fund contribution.
137Annual Report 2015

Notes to and Forming part of the Financial StatementsFor the year ended June 30, 2015
Note 2015 201432.2 General establishment expenses -----------(Rupees in ‘000)-----------
Repairs and maintenance 9,591 5,718 Security charges 9,797 6,632 Light, power and water 6,810 13,064 Vehicle running, repairs and maintenance 159 338
26,357 25,752
33. ADMINISTRATIVE EXPENSES
Salaries and allowances 33.1 330,995 248,057 General establishment expenses 33.2 105,867 91,667 Rent, rates and taxes 1,529 647 Scholarship and training expenses 4,070 2,196 Insurance 293 346 Depreciation 4.6 1,962 2,482 Directors’ fee 41.2 1,770 1,350 Legal and professional charges 48,840 26,555 Sales tax expenses 33,861 17,193
529,187 390,493
33.1 This includes Rs 4.760 million (2014: Rs 4.016 million) in respect of provident fund contribution.
Note 2015 201433.2 General establishment expenses -----------(Rupees in ‘000)-----------
Repairs and maintenance 6,086 5,277 Medical expenses 24,355 28,558 Contribution to employees welfare fund 8 9 Contribution to group term insurance 1,631 1,865 Hajj expenses 2,298 1,551 Security charges 1,985 1,337 Travelling and conveyance 8,177 5,393 Entertainment and canteen subsidy 4,611 1,526 Books, periodicals and subscription 5,863 4,787 Uniform and liveries 117 120 Printing and stationery 3,220 2,024 Telephone, telex and postage 4,959 3,675 Light, power and water 6,222 5,428 Computer expenses 4,769 4,080 Advertisement and publicity 10,599 4,708 Vehicle running, repairs and maintenance expenses 9,053 9,409 Ship inspection expenses 1,798 2,269 Sundry expenses 10,116 9,651
105,867 91,667
138 Pakistan National Shipping Corporation

Notes to and Forming part of the Financial StatementsFor the year ended June 30, 2015
Note 2015 2014-----------(Rupees in ‘000)-----------
34. OTHER EXPENSES
Donations 34.1 1,000 1,000 Auditors’ remuneration 34.2 8,999 6,343 Demurrage expenses 961,381 625,611 Employees’ gratuity
- funded 22.1.7 19,270 19,266 - unfunded 22.1.7 34,035 17,538
53,305 36,804 Post-retirement medical benefits 22.1.7 30,717 38,282 Employees’ compensated absences 22.2.5 188,323 69,159 Loss on revaluation of long-term investments
in listed companies 235 - Loss on revaluation of derivative instruments 61,797 - Provision for doubtful debts 727 - Provision in respect of damage claims 24 4,615 15,847
1,311,099 793,046
34.1 Donations were not made to any donee in which the Corporation or a director or his spouse had any interest.
34.2 Auditors’ remuneration2015 2014
A. F. Ernst & Young Total
A. F. Ernst & YoungTotalFerguson Ford Rhodes Ferguson Ford Rhodes
& Co. Sidat Hyder & Co. Sidat Hyder--------------------------------(Rupees in ‘000)--------------------------------
Audit fee 1,115 1,115 2,230 1,061 1,061 2,122Fee for review of half yearly
financial statements 385 385 770 360 360 720Fee for review of statement of
compliance with best practices of the code of corporate governance 118 118 236 106 106 212
Fee for audit of consolidated financial statements 139 139 278 130 130 260
Tax advisory services fee 4,428 - 4,428 2,262 - 2,262Central Depository Company
certification fees 15 - 15 15 - 15Out of pocket expenses 521 521 1,042 376 376 752
6,721 2,278 8,999 4,310 2,033 6,343
139Annual Report 2015

Notes to and Forming part of the Financial StatementsFor the year ended June 30, 2015
35. OTHER INCOME Note 2015 2014
-----------(Rupees in ‘000)-----------
Income from financial assets / liabilities
Income from saving accounts and term deposits 301,094 271,101 Agency fee 46,894 28,051 Dividend income from investment in listed companies
and another entitiy 2,024 821 Exchange gain 35.1 13,052 9,543 Gain on revaluation of long-term investments - 15,458 Gain on revaluation of swap derivative - net - 210,297 Gain on revaluation of investment properties 6 686,877 - Liabilities no longer payable written back 6,597 - Demurrage income 796,144 496,820
Income from non - financial assets
Gain on disposal of fixed assets 39 - Sale of scrap - 456 Provisions no longer required written back 11.2, 15.4 & 24 18,192 7,093 Sundry income 43,552 33,791
1,914,465 1,073,431
35.1 This represents exchange gain on foreign currency bank deposits maintained outside Pakistan.
Note 2015 2014-----------(Rupees in ‘000)-----------
36. FINANCE COSTS
Interest on long-term financing 854,509 796,913 Gain on cross currency interest rate swap derivative 36.1 (188,648) (251,104)Bank charges 1,374 872
667,235 546,681
36.1 This relates to the amount received during the year on account of quarterly exchanges and terminations under the swap arrangement as explained in note 15.6
37. TAXATION2015 2014
-----------(Rupees in ‘000)-----------Tax charge for:
- current year 175,707 269,045 - prior years (29,730) (42,932)
145,977 226,113 Deferred (85,972) (9,678)
60,005 216,435
37.1 In view of the tax losses for the year, provision for minimum taxation has been made in accordance with section 113 of ITO, 2001.
Minimum tax rate under section 113 of ITO, 2001 for the tax year 2015 is 1 % of turnover. No numeric tax rate reconciliation is given as the Corporation is liable for turnover tax only.
140 Pakistan National Shipping Corporation

Notes to and Forming part of the Financial StatementsFor the year ended June 30, 2015
2015 2014-----------(Rupees in ‘000)-----------
38. EARNINGS PER SHARE - basic and dilutive
Profit for the year attributable to ordinary shareholders 892,773 803,276
-----------(No. of Shares)-----------
Weighted average ordinary shares in issue during the year 132,063,380 132,063,380
--------------(Rupees)--------------
Earnings per share - basic and dilutive 6.76 6.08
There are no dilutive potential ordinary shares outstanding as at June 30, 2015 and 2014.
Note 2015 2014-----------(Rupees in ‘000)-----------
39. CASH GENERATED FROM OPERATIONS
Profit before taxation 952,778 1,019,711
Adjustments for non-cash charges and other items:Depreciation 4.6 43,979 47,113 Gain on disposal of fixed assets 35 (39) - Provision in respect of damage claims 24 4,615 15,847 Provision for employees’ gratuity 22.1.7 53,305 36,804 Provision for post-retirement medical benefits 22.1.7 30,717 38,282 Provision for employees’ compensated absences 22.2.5 188,323 69,159 Dividend income 28 & 35 (435,860) (821)Provision for impairment on doubtful receivables 11.2 727 - Provisions no longer required written back 35 (18,192) (7,093)Liabilities no longer payable written back 35 (6,597) - Interest / mark-up income 35 (301,094) (271,101)Interest / mark-up expense 36 854,509 797,785 Gain on revaluation of investment properties 35 (686,877) - Loss / (gain) on revaluation of long-term investments 34 235 (15,458)Gain on cross currency interest rate swap derivative (126,851) (461,401)Working capital changes 39.1 (344,782) 1,831,742
208,896 3,100,569
141Annual Report 2015

Notes to and Forming part of the Financial StatementsFor the year ended June 30, 2015
Note 2015 2014-----------(Rupees in ‘000)-----------
39.1 Working capital changes
Increase in current assetsStores and spares (42,145) 66,321 Trade debts - unsecured 165,574 (1,215,893)Agents’ and owners’ balances - unsecured 106,759 (115,833)Loans and advances (3,446,695) 8,980 Deposits and short-term prepayments (40,051) (8,478)Other receivables 4,292 (57,096)Incomplete voyages 33,140 44,250
(3,219,126) (1,277,749)Increase in current liabilitiesTrade and other payables 2,874,344 3,109,491
(344,782) 1,831,742
40. CASH AND CASH EQUIVALENTS
Short-term investments having maturity of three months or less 16 500,000 797,440
Cash and bank balances 17 2,808,371 1,842,531 3,308,371 2,639,971
41. REMUNERATION OF CHAIRMAN, EXECUTIVE DIRECTORSAND OTHER EXECUTIVES
The aggregate amount of remuneration including all benefits to the Chairman and Chief Executive, Executive Directors / Directors and Executives of the Corporation were as follows:
2015 2014 2015 2014 2015 2014Chairman & Chief
ExecutiveExecutive Directors Other Executives
------------------------------------(Rupees in ‘000)-------------------------------------Managerial remuneration and
allowances 851 805 21,796 18,812 349,327 264,669 Retirement benefits - - - - 12,235 8,032 House rent 39 - 4,498 2,549 142,930 98,783 Conveyance 589 - 1,685 - 16,845 9,036 Entertainment 726 317 918 705 7,106 3,852 Medical 421 440 1,924 1,645 26,853 15,880 Utilities 468 459 2,185 1,872 44,131 36,926 Personal staff subsidy - - - - 313 121 Club membership fee and
expenses 229 250 366 489 - 99 Bonus 170 - 3,722 2,766 69,931 44,891 Other allowances 776 664 2,901 1,176 270,138 240,358
4,269 2,935 39,995 30,014 939,809 722,647
Number of persons 2 2 5 4 313 267
41.1 Retirement benefits represent amount contributed towards various retirement benefit plans. The Executives of the Corporation are entitled to retirement benefits as outlined in note 2.17 and 2.18 to these financial statements. The Chairman and Chief Executive, Executive Directors and certain Executives are provided with the Corporation owned and maintained cars.
142 Pakistan National Shipping Corporation

Notes to and Forming part of the Financial StatementsFor the year ended June 30, 2015
41.2 The aggregate amount charged in the financial statements for fee to 6 (2014: 6) non-executive directors was Rs 1.770 million (2014: Rs 1.350 million).
41.3 During the year ended June 30, 2015, new Chairman and Chief Executive was appointed. The above amounts also relate to the outgoing Chairman and Chief Executive.
42. FINANCIAL INSTRUMENTS BY CATEGORY2015 2014
-----------(Rupees in ‘000)-----------FINANCIAL ASSETSFair value through profit or lossLong term investments - listed companies 53,334 53,569 Derivative financial instruments 62,991 147,209
Loans and receivables
Loans - employees 59 59 Trade debts - unsecured 1,821,692 1,987,993 Agents’ and owners’ balances - unsecured 18,065 124,824 Deposits 15,913 9,868 Interest / mark-up accrued 37,445 34,539 Other receivables 90,081 92,546 Short-term investments 1,954,375 2,294,880 Cash and bank balances 2,808,371 1,842,531
6,746,001 6,387,240 Available-for-sale financial assetsLong-term investments - other entity 100 100
6,862,426 6,588,118 FINANCIAL LIABILITIESAmortised cost
Trade and other payables 22,697,313 20,295,089 Long-term financing - secured 7,450,089 5,885,743 Accrued mark-up on long-term financing 82,698 78,515
30,230,100 26,259,347
43. FINANCIAL RISK MANAGEMENT
43.1 Financial risk factors
The Corporation finances its operations through equity and management of working capital with a view to maintaining an appropriate mix between various sources of finance to minimise risk. Taken as a whole, the Corporation is exposed to market risk (including interest rate risk, currency risk and other price risk), credit risk and liquidity risk. The Corporation’s principal financial liabilities comprise trade and other payables. The Corporation also has various financial assets such as long term deposits, trade debts, other receivables and bank balances which are directly related to its operations. No changes were made in the objectives, policies or processes and assumptions during the year ended June 30, 2015. The policies for managing each of these risk are summarised below:
43.1.1 Concentration of credit risk
Credit risk arises from cash and cash equivalents, derivative financial instruments and deposits with banks and financial institutions, as well as credit exposures to customers, including trade receivables and committed transactions. Credit risk represents the accounting loss that would be recognised at the reporting date if counter parties fail completely to perform as contracted.
143Annual Report 2015

Notes to and Forming part of the Financial StatementsFor the year ended June 30, 2015
As at June 30, 2015, out of the total financial assets of Rs 6,862.426 million (2014: Rs 6,588.118 million) the financial assets which are subject to credit risk amounted to Rs 6,861.878 million (2014: Rs 6,587,139 million). The management continuously monitors the credit exposure towards the customers and makes provision against those balances considered doubtful of recovery.
Moreover, a significant component of the receivable balances of the Corporation relates to amounts due from the Public Sector organisations. Due to the Corporation’s long standing business relationships with these counterparties and after giving due consideration to their related credit standing, management does not expect non–performance by those counter parties on their obligations to the Corporation.
For banks and financial institutions, only independently rated parties with a minimum credit rating of A are accepted.
The sector wise analysis of receivables, comprising trade debts, agents’ and owners’ balances and deposits is given below:
2015 2014-----------(Rupees in ‘000)-----------
Public Sector 1,839,699 2,005,273 Private Sector 38,800 175,250
1,878,499 2,180,523
Out of Rs 1,878.499 million (2014: Rs 2,180.523 million), the Corporation has provided Rs 22.829 million (2014: Rs 22.102 million) as the amounts being doubtful to be recovered from them.
43.1.2 Market risk
Foreign exchange risk
Foreign exchange risk is the risk that the fair value or future cash flows of a financial instrument will fluctuate because of changes in foreign exchange rates. The Corporation faces foreign currency risk on receivable, payable transactions at foreign ports and the derivative cross currency interest rate swap.
As at June 30, 2015, if the currency had weakened / strengthened by 5% against the US dollar with all other variables held constant, profit before taxation for the year would have been higher / lower by Rs 29.022 million (2014: Rs 21.036 million), mainly as a result of foreign exchange gains / losses on translation of US dollar denominated assets and liabilities.
As at June 30, 2015, the affect of fluctuations in other foreign currency denominated assets or liabilities balances would not be material, therefore, not disclosed.
Cash flow and fair value interest rate risk
Interest rate risk is the risk that the value of a financial instrument will fluctuate due to changes in the market interest rates. The Corporation has a high exposure to interest rate risk due to the long term financing (note 21). In order to manage its exposure to such risks the management of the Corporation has entered into a derivative cross currency interest rate swap (note 15) under which the Corporation receives three months KIBOR on the PKR notional in exchange for payment of three months LIBOR on the USD notional. During the year ended June 30, 2012, to further manage the exposure to such risk, the management has obtained interest rate swap under which the Corporation receives a fixed interest rate of 13% in exchange for payment of KIBOR.
The Corporation has interest bearing liabilities and have floating interest rates. At June 30, 2015, if interest rates on borrowings had been 100 basis points higher / lower with all other variables held constant, profit after taxation for the year would have been higher / lower by Rs 10.432 million (2014: Rs 10.480 million).
144 Pakistan National Shipping Corporation

Notes to and Forming part of the Financial StatementsFor the year ended June 30, 2015
Price risk
Price risk represents the risk that the fair value or future cash flows of a financial instrument will fluctuate because of changes in market prices (other than those arising from interest rate risk or foreign exchange risk), whether those changes are caused by factors specific to the individual financial instrument or its issuer, or factors affecting all similar financial instruments traded in the market.
The effects of changes in fair value of investments made by the Corporation, on the future profits are not considered to be material in the overall context of these financial statements.
43.1.3 Liquidity risk
Liquidity risk is the risk that the Corporation will encounter difficulties in raising funds to meet commitments associated with financial instruments. The Corporation believes that it is not exposed to any significant level of liquidity risk.
The management forecasts the liquidity of the Corporation on basis of expected cash flow considering the level of liquid assets necessary to meet such risk. This involves monitoring balance sheet liquidity ratios and maintaining debt financing plans.
Financial liabilities in accordance with their contractual maturities are presented below:
Contractual cash flows
Less than 1 year
Between 1 to 2 years
Between 2 to 5 years
More than 5 years
2015 ---------------------------------------(Rupees in ‘000)---------------------------------------
Long term financing 9,280,828 2,346,441 2,185,985 2,914,344 1,834,058 Trade and other payables 22,697,313 22,697,313 - - - Accrued mark-up on
long-term financing 82,698 82,698 - - - 32,060,839 25,126,452 2,185,985 2,914,344 1,834,058
2014
Long term financing 7,712,144 1,932,063 1,864,640 3,915,441 - Trade and other payables 20,295,089 20,295,089 - - - Accrued mark-up on
long-term financing 78,515 78,515 - - - 28,085,748 22,305,667 1,864,640 3,915,441 -
43.1.4 Fair value of financial instruments
Fair value is an amount for which an asset could be exchanged, or a liability settled, between knowledgeable willing parties in an arm’s length transaction. Consequently, differences may arise between the carrying value and the fair value estimates.
The Corporation classifies financial instruments measured in the balance sheet at fair value in accordance with the following fair value measurement:
Level 1: Quoted prices in active markets for identical assets or liabilities;
145Annual Report 2015

Notes to and Forming part of the Financial StatementsFor the year ended June 30, 2015
Level 2: Those involving inputs other than quoted prices included in Level 1 that are observable for the asset or liability, either directly (as prices) or indirectly (derived from prices); and
Level 3: Those whose inputs for the asset or liability that are not based on observable market data (unobservable inputs).
Note Level 1 Level 2 Level 3 Total
-----------------------------(Rupees in ‘000)-----------------------------
Long term investment in listed company 8 53,334 - - 53,334
Derivative cross currency interest rate swap 15 - - 62,991 62,991
43.2 Capital risk management
The Corporation’s objectives when managing capital are to safeguard the Corporation’s ability to continue as a going concern in order to provide returns for shareholders and benefits for other stakeholders and to maintain an optimal capital structure to reduce the cost of capital.
The Corporation manages its capital structure by monitoring return on net assets and makes adjustment to it in the light of changes in economic conditions. In order to maintain or adjust the capital structure, the Corporation may adjust the amount of dividends paid to shareholders or issue new shares.
The Corporation is subject to externally imposed capital requirements, which are applicable at consolidated financial statements level.
During the year, the Corporation’s strategy was to maintain the debt equity ratio below 60:40. The debt equity ratios as at June 30, 2015 and 2014 were as follows:
2015 2014-----------(Rupees in ‘000)-----------
Long-term financing - secured (note 21) 7,450,089 5,885,743 Total equity 8,219,588 7,634,785 Total 15,669,677 13,520,528
Debt-to-equity ratio 48:52 44:56
44. ENTITY WIDE INFORMATION
44.1 The Corporation constitutes as a single reportable segment, the principal classes of services provided are transportation of dry cargo, liquid cargo, rental income and service fees through chartered vessels.
146 Pakistan National Shipping Corporation

Notes to and Forming part of the Financial StatementsFor the year ended June 30, 2015
44.2 Information about services
The Corporation’s principal classes of services accounted for the following amount of revenue:
2015 2014-----------(Rupees in ‘000)-----------
Transportation of dry cargo 2,432,556 1,503,241 Transportation of liquid cargo 5,581,009 6,793,294 Rental income 154,272 140,525 Services fee 294,712 290,625
8,462,549 8,727,685
44.3 Information about geographical areas
The Corporation does not hold non-current assets in any foreign country.
44.4 Information about major customers
The Corporation has the following exposure to concentration of credit risk with clients representing greater than 10% of the total revenue balances:
2015Revenue
(Rupees in ‘000) % of Total
Client 1 3,015,690 34%Client 2 1,387,562 16%
4,403,252 50%
2014Revenue
(Rupees in ‘000) % of Total
Client 1 3,716,420 43%Client 2 1,638,296 19%Client 3 868,937 10%
6,223,653 72%
147Annual Report 2015

Notes to and Forming part of the Financial StatementsFor the year ended June 30, 2015
45. RELATED PARTY DISCLOSURES
The Corporation has related party relationships with its subsidiaries, associate, employee benefit plans and its directors and executive officers (including their associates). Transactions with related parties essentially entail investments made in subsidiary companies, dividend income received from related investee companies, freight income and chartering revenue recovered, service fees charged on account of rendering of technical, commercial, administrative and financial services, expenses charged to subsidiary companies on actual cost basis etc. Service fees charges on account of rendering of technical, commercial, administrative and financial services is charged to subsidiary companies and related parties on the basis of mutually agreed terms. Balances with related parties have been disclosed in note 23 to these financial statements. Particulars of remuneration to key management personnel are disclosed in note 41 of these financial statements. Investments in related parties are disclosed in note 7 of these financial statements.
Related party Relationship 2015 2014with the Corporation -----------(Rupees in ‘000)-----------
Service fee charged
Chitral Shipping (Private) Limited Subsidiary 34,850 33,315 Hyderabad Shipping (Private) Limited Subsidiary 13,877 14,449 Kaghan Shipping (Private) Limited Subsidiary - 8,977 Karachi Shipping (Private) Limited Subsidiary 64,822 59,357 Lahore Shipping (Private) Limited Subsidiary 61,020 59,743 Malakand Shipping (Private) Limited Subsidiary 11,578 15,485 Multan Shipping (Private) Limited Subsidiary 12,261 14,221 Quetta Shipping (Private) Limited Subsidiary 53,708 70,941 Sibi Shipping (Private) Limited Subsidiary 11,428 14,139 Shalamar Shipping (Private) Limited Subsidiary 31,168 -
294,712 290,627 Rental expense
Pakistan Co-operative Ship Stores(Private) Limited Subsidiary 682 624
Transfer of stores
Chitral Shipping (Private) Limited Subsidiary 122 148 Hyderabad Shipping (Private) Limited Subsidiary 919 875 Kaghan Shipping (Private) Limited Subsidiary - 201 Karachi Shipping (Private) Limited Subsidiary 5,987 3,848 Lahore Shipping (Private) Limited Subsidiary 8,519 6,600 Malakand Shipping (Private) Limited Subsidiary 229 1,232 Multan Shipping (Private) Limited Subsidiary 163 3,594 Quetta Shipping (Private) Limited Subsidiary 6,706 5,997 Sibi Shipping (Private) Limited Subsidiary 207 163 Shalamar Shipping (Private) Limited Subsidiary 3,392 -
26,244 22,658
148 Pakistan National Shipping Corporation

Notes to and Forming part of the Financial StatementsFor the year ended June 30, 2015
Related party Relationship Note 2015 2014with the Corporation -----------(Rupees in ‘000)-----------
Retirement benefit costs charged
Chitral Shipping (Private) Limited Subsidiary 603 328 Hyderabad Shipping (Private) Limited Subsidiary 1,046 349 Islamabad Shipping (Private) Limited Subsidiary - 240 Kaghan Shipping (Private) Limited Subsidiary 1,612 128 Karachi Shipping (Private) Limited Subsidiary 129 73 Lahore Shipping (Private) Limited Subsidiary 149 80 Malakand Shipping (Private) Limited Subsidiary 386 346 Multan Shipping (Private) Limited Subsidiary 891 - Quetta Shipping (Private) Limited Subsidiary 167 48 Sibi Shipping (Private) Limited Subsidiary 637 32
5,620 1,624
Contribution to provident fund 12,550 10,589
Key management personnel compensation 41 44,264 32,949
Advance to subsidiary against issue of shares 3,402,698 -
45.1 Outstanding balances due from / due to related parties have been disclosed in the respective notes to these financial statements.
45.2 In addition, the Corporation is engaged in making certain payments / collections on behalf of the subsidiary companies in accordance with the ‘Technical and Commercial Services’ and ‘Administrative and Financial Services Agreement’ which are settled through a current account of the subsidiary.
46. PROVIDENT FUND RELATED DISCLOSURES
The following information is based on latest un-audited financial statements of the Provident Fund (the Fund):
Note 2015 2014
-----------(Rupees in ‘000)-----------
Size of the Fund - Total assets 917,339 888,525
Cost of investments made 743,525 850,181
Percentage of investments made 81.05% 95.68%
Fair value of investments 46.1 851,046 841,133
149Annual Report 2015

Notes to and Forming part of the Financial StatementsFor the year ended June 30, 2015
46.1 The break-up of fair value of investments is:
2015 2014(Rupees in
‘000) ----%---- (Rupees in ‘000) ----%----
Government securities 430,060 51% 460,593 55%Mutual funds 420,986 49% 380,540 45%
851,046 100% 841,133 100%
46.2 The investments out of provident fund have been made in accordance with the provisions of Section 227 of the Ordinance and the rules formulated for this purpose.
47. NUMBER OF EMPLOYEES
The total average number of employees during the year and as at June 30, 2015 and 2014 respectively are as follows:
2015 2014---------(No of employees)---------
Average number of employees during the year 1,036 963 Number of employees as at the end of the year 1,117 954
48. NON-ADJUSTING EVENTS AFTER THE BALANCE SHEET DATE
The Board of Directors at their meeting held on September 28, 2015 have proposed for the year ended June 30, 2015 cash dividend of Rs 1.5 per share (2014: Rs 1.5 per share), amounting to Rs 198.095 million (2014: Rs 198.095 million) subject to the approval of the members at the annual general meeting to be held on October 28, 2015. The financial statements for the year ended June 30, 2015 do not include the effect of this appropriation which will be accounted for subsequent to the year end.
49. GENERAL
49.1 Figures have been rounded off to the nearest thousand of rupees unless otherwise stated.
49.2 For better presentation, certain balances were reclassified where necessary.
50. DATE OF AUTHORISATION
These financial statements were authorised for issue on September 28, 2015 by the Board of Directors of the Corporation.
Arif Elahi P.A.S.
Chairman & Chief ExecutiveCapt. Anwar Shah
Director
150 Pakistan National Shipping Corporation

Notes to and Forming part of the Financial StatementsFor the year ended June 30, 2015
No. of Total Shares Shareholders Shareholdings Held 11210 Shareholding From 1 To 100 368,452 3104 Shareholding From 101 To 500 719,207 838 Shareholding From 501 To 1000 613,057 663 Shareholding From 1001 To 5000 1,405,340 75 Shareholding From 5001 To 10000 535,287 23 Shareholding From 10001 To 15000 283,493 14 Shareholding From 15001 To 20000 249,743 4 Shareholding From 20001 To 25000 85,403 7 Shareholding From 25001 To 30000 193,962 1 Shareholding From 30001 To 35000 30,600 3 Shareholding From 35001 To 40000 119,175 3 Shareholding From 55001 To 60000 178,265 2 Shareholding From 60001 To 65000 125,500 1 Shareholding From 70001 To 75000 70,800 1 Shareholding From 75001 To 80000 79,500 1 Shareholding From 85001 To 90000 90,000 1 Shareholding From 90001 To 95000 91,500 2 Shareholding From 95001 To 100000 193,500 1 Shareholding From 115001 To 120000 118,700 1 Shareholding From 125001 To 130000 125,700 1 Shareholding From 145001 To 150000 146,600 1 Shareholding From 155001 To 160000 158,812 3 Shareholding From 170001 To 175000 514,000 2 Shareholding From 195001 To 200000 392,270 1 Shareholding From 220001 To 225000 222,500 1 Shareholding From 225001 To 230000 225,245 1 Shareholding From 370001 To 375000 374,000 1 Shareholding From 435001 To 440000 436,564 1 Shareholding From 535001 To 540000 538,800 1 Shareholding From 605001 To 610000 608,707 1 Shareholding From 1070001 To 1075000 1,072,000 1 Shareholding From 1230001 To 1235000 1,230,173 1 Shareholding From 1345001 To 1350000 1,349,800 1 Shareholding From 1405001 To 1410000 1,410,000 1 Shareholding From 6525001 To 6530000 6,529,897 1 Shareholding From 111175001 To 111180000 111,176,827
15,974 132,063,379
Pattern of Shareholding
151Annual Report 2015

Notes to and Forming part of the Financial StatementsFor the year ended June 30, 2015 Categories of Shareholders No. Shares Held Percentage %
BANKS DEVELOPMENT FINANCIAL INSTITUTIONS, NON 76 723,725 0.55BANKING FINANCIAL INSTITUTIONS. INSURANCE COMPANIES 16 1,498,554 1.13
DIRECTORS, CHIEF EXECUTIVE OFFICER, AND THEIRSPOUSE AND MINOR CHILDREN KHOWAJA OBAID IMRAN ILYAS 1 2,299MR. ANWAR SHAH 1 100KHOWAJA OBAID IMRAN ILYAS 1 115 Sub-Totals : 2,514 0.00 ASSOCIATED COMPANIES, UNDERTAKING AND RELATEDPARTIES. M/S PNSC EMPLOYEES EMPOWERMENT TRUST 1 6,529,897MOHAMMADI ENGG. WORKS LTD 1 4,766 Sub-Totals : 6,534,663 4.95
MODARABAS AND MUTUAL FUNDS. 14 3,422,126 2.59 NIT AND ICP 13 78,087 0.06 FOREIGN INVESTORS 10 113,120 0.09
DIRECTOR GENERAL PORT & SHIPPING 1 111,176,827 84.18 OTHERS 79 1,535,261 1.16
Individuals* 15760 6,978,502 5.28 G-Totals : 15,974 132,063,379 100.00 *Including 3656 shareholders whose current domicile is not knownN.B.:- The above two statements include 1654 shareholders holding 11,556,664 Shares through Central Depository Company of Pakistan Limited.
Categories of ShareholdersFor The Year Ended June 30, 2014
152 Pakistan National Shipping Corporation

Notes to and Forming part of the Financial StatementsFor the year ended June 30, 2015Notice is hereby given that the 37th Annual General Meeting of the shareholders of Pakistan National Shipping Corporation will be held at the Navy Welfare Centre (Pakistan Navy Fleet Club), near Lucky Star Hotel, Saddar, Karachi on 28th October, 2015 at 11:00 a.m. to transact the following business.
ORDINARY BUSINESS:
1. To confirm the minutes of 36th Annual General Meeting of the Shareholders held on 30th October, 2014.
2. To consider and adopt the Audited Accounts of the Corporation and the Consolidated Accounts of the PNSC Group together with the reports of Auditors and Directors for the year ended 30th June, 2015.
3. To consider and approve Board’s recommendation to pay 15% Cash Dividend (i.e.)Rs.1.50/- per share) to the shareholders.
4. To consider Board’s recommendation to re-appoint the retiring auditors A. F. Ferguson & CO., Chartered Accountants and Ford Rhodes Sidat Hyder & Co., Chartered Accountants, as joint auditors of the Corporation for the year 2015-2016 and to fix their remuneration.
5. To transact any other business that may be placed before the meeting with the permission of the chair
By Order of the Board
ZAINAB SULEMAN CORPORATION SECRETARY Dated: September 28, 2015
Note:
1. The Share Transfer Books of the Corporation will remain closed from 21st October, 2015 to 28th October, 2015 (both day inclusive).
2. A shareholder entitled to attend and vote at this meeting is also entitled to appoint his/her proxy to attend the meeting. Proxies must be received at the Head Office of the Corporation not less than 48 hours before the time of holding the meeting.
3. CDC accounts holders are advised to bring their original National Identity Cards to authenticate their identity along with CDC accounts numbers at the meeting. However, if any, proxies are granted by such shareholders, the same shall also have to be accompanied with attested copies of the computerized National Identity Cards of the grantors, and the signature on the proxy form has to be the same as appearing on the computerized national identity card.
4. The shareholders are requested to immediately notify change, if any, in their mailing addresses.
5. The shareholders who have not yet submitted photocopies of their valid computerized National Identity Card (CNIC) to the Corporation are requested to send the same at the earliest to the Corporation’s Share Registrar, Technology Trade (Pvt.) Ltd., Dagia House 241-C,Block-2,P.E.C.H.S Off Shahrah-e-Quaideen, Karachi. Phone: 021-34391316-17, 34387960, 61
Notice of Annual General Meeting
153Annual Report 2015

Notes
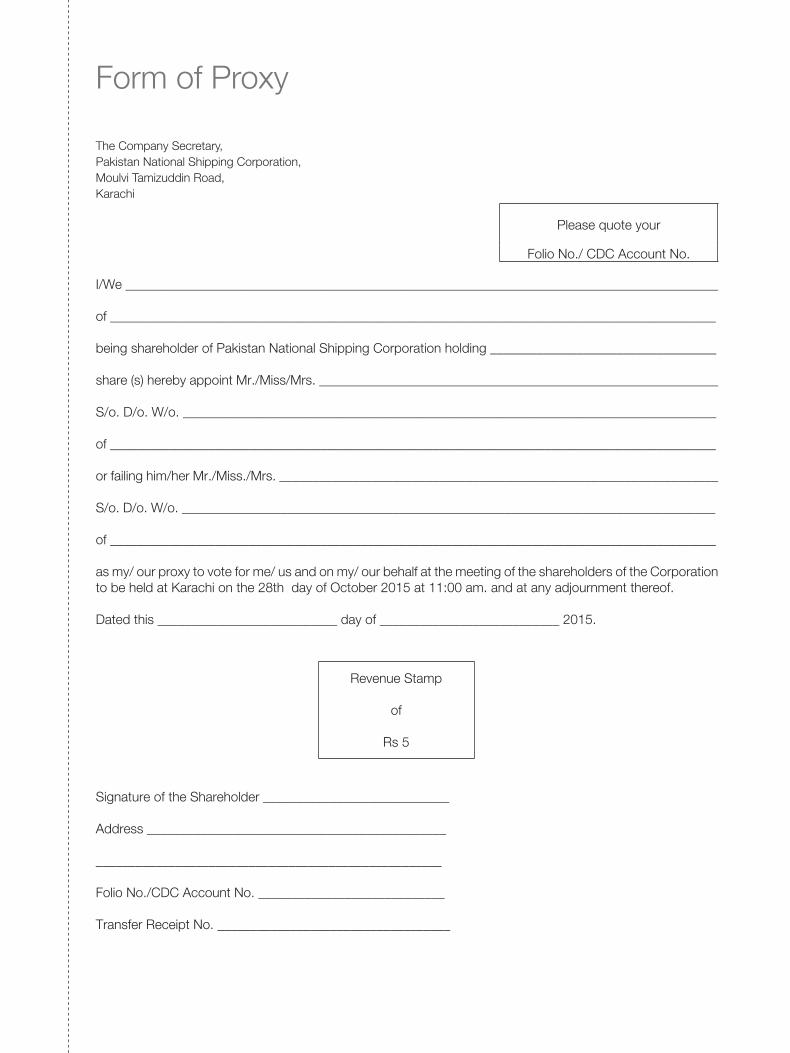
Form of Proxy
The Company Secretary,Pakistan National Shipping Corporation,Moulvi Tamizuddin Road,Karachi
Please quote your
Folio No./ CDC Account No.
I/We __________________________________________________________________________________________
of ____________________________________________________________________________________________
being shareholder of Pakistan National Shipping Corporation holding __________________________________
share (s) hereby appoint Mr./Miss/Mrs. ____________________________________________________________
S/o. D/o. W/o. _________________________________________________________________________________
of ____________________________________________________________________________________________
or failing him/her Mr./Miss./Mrs. __________________________________________________________________
S/o. D/o. W/o. _________________________________________________________________________________
of ____________________________________________________________________________________________
as my/ our proxy to vote for me/ us and on my/ our behalf at the meeting of the shareholders of the Corporation to be held at Karachi on the 28th day of October 2015 at 11:00 am. and at any adjournment thereof.
Dated this ___________________________ day of ___________________________ 2015.
Revenue Stamp
of
Rs 5
Signature of the Shareholder ____________________________
Address _____________________________________________
____________________________________________________
Folio No./CDC Account No. ____________________________
Transfer Receipt No. ___________________________________


Pakistan N
ational S
hipp
ing C
orp
oratio
n
AN
NU
AL R
EP
OR
T 2015