PMPRB BIA Guidelines (PDF) - PMPRB · PDF fileMedicine Prices Review Board Conseil...
64
npduis Patented Medicine Prices Review Board Conseil d’examen du prix des médicaments brevetés Guidelines for Conducting Pharmaceutical Budget Impact Analyses for Submission to Public Drug Plans in Canada Budget Impact Analysis Guidelines Rx Published May 2007
Transcript of PMPRB BIA Guidelines (PDF) - PMPRB · PDF fileMedicine Prices Review Board Conseil...
npduisPatented Medicine Prices Review Board
Conseil d’examen du prix des médicamentsbrevetés
Guidelines for ConductingPharmaceutical Budget Impact
Analyses for Submission toPublic Drug Plans in Canada
Budget Impact Analysis GuidelinesRx
Published May 2007

These guidelines are provided for informational purposes only. Any reliance upon, interpreta-tion of and/or use of the guidelines is solely and exclusively at the discretion of the user. Exceptas may be stated in a written agreement signed by both parties, neither i3 Innovus nor thePatented Medicine Prices Review Board makes any representations or warranties, express orimplied, with respect to the information provided in guidelines, including any representationsor warranties as to accuracy, timeliness, completeness or fitness for a particular purpose.Neither i3 Innovus nor the Patented Medicine Prices Review Board is or will be responsible forany action or failure to act in reliance upon information in these guidelines.
ISBN: 978-0-662-69827-2Cat. no.: H79-1/2007
1 Acknowledgements . . . . . . . . . . . . . . . . . . . . . . . . . . . . . . .1
2 Conflicts of Interest . . . . . . . . . . . . . . . . . . . . . . . . . . . . . . .4
3 Executive Summary . . . . . . . . . . . . . . . . . . . . . . . . . . . . . . .5
3.1 Introduction . . . . . . . . . . . . . . . . . . . . . . . . . . . . . . .5
3.2 Recommendations for Analytic Framework . . . . . . . . .6
3.3 Recommendations for Inputs and Data Sources . . . . . . . . . . . . . . . . . . . . . . . . . . .7
3.4 Recommendation for Reporting Format . . . . . . . . . . . . . . . . . . . . . . . . . . .8
4 Introduction . . . . . . . . . . . . . . . . . . . . . . . . . . . . . . . . . . . . .9
4.1 Use of Budget Impact Analyses in Canada . . . . . . . .10
4.2 Unique Needs of F/P/T Drug Plans . . . . . . . . . . . . .10
4.3 Harmonization of BIA Methodology . . . . . . . . . . . . .11
4.4 Purpose of this Document . . . . . . . . . . . . . . . . . . . .13
5 Recommendations for Analytic Framework . . . . . . . . . . . . .14
5.1 Model Design . . . . . . . . . . . . . . . . . . . . . . . . . . . . .14
5.2 Perspective . . . . . . . . . . . . . . . . . . . . . . . . . . . . . . .15
5.3 Scenarios to be Compared . . . . . . . . . . . . . . . . . . . .16
5.4 Population . . . . . . . . . . . . . . . . . . . . . . . . . . . . . . .17
5.5 Time Horizon . . . . . . . . . . . . . . . . . . . . . . . . . . . . .19
5.6 Calculating Drug Costs . . . . . . . . . . . . . . . . . . . . . . .19
5.7 Characterizing Uncertainty . . . . . . . . . . . . . . . . . . .22
5.8 Discounting and Inflation . . . . . . . . . . . . . . . . . . . .23
5.9 Validation . . . . . . . . . . . . . . . . . . . . . . . . . . . . . . . .24
6 Recommendations for Inputs and Data Sources . . . . . . . . .25
6.1 Estimation of the Current Size of the Market . . . . . .25
6.2 Selection of Relevant Comparators . . . . . . . . . . . . . .30
6.3 Forecasting of the Market Under the Reference Scenario . . . . . . . . . . . . . . . . . . . . . .31
6.4 Forecasting of the Market Under the New Drug Scenario . . . . . . . . . . . . . . . . . . . . . .33
6.5 Estimation of Drug Prices . . . . . . . . . . . . . . . . . . . .36
6.6 Calculation of Budget Impact . . . . . . . . . . . . . . . . . .40
7 Recommendations for Reporting Format . . . . . . . . . . . . . . .41
7.1 Report Contents . . . . . . . . . . . . . . . . . . . . . . . . . . .41
7.2 Interactive Model . . . . . . . . . . . . . . . . . . . . . . . . . .45
7.3 Additional Submission Details . . . . . . . . . . . . . . . . .45
Appendix AMark-ups, Inventory Allowances, Dispensing Fees, and Patient Co-payments . . . . . . . . . . . . . . . . . . . . . . . . . .47
Appendix BSchematic Representations of Budget Impact Model Calculation and Market Size Estimation . . . . . . . . . .49
Appendix CData Sources for Population Statistics and F/P/T Drug Plan Eligible Participant Counts . . . . . . . . . . . .51
Appendix DBIA Completion Checklist . . . . . . . . . . . . . . . . . . . . . . . . . .53
Appendix EList of Terms and Abbreviations . . . . . . . . . . . . . . . . . . . . .55
References . . . . . . . . . . . . . . . . . . . . . . . . . . . . . . . . . . . . . . .56
LIST OF TABLES
Table A 1: Mark-ups, Inventory Allowances, dispensing Fees, and Patient Co-payments to be Reported in Standard Budget Impact Analyses (Last Updated: October 2006) . . . .47
Table A 2: Alberta Health and Wellness: Inventory Allowance and Dispensing Fees . . . . . . . . . . . . . .48
Table A 3: Saskatchewan Health: Pharmacy Mark-up . . . . . . . .48
Table C 1: Selected List of Drug Plan Data (Last Updated: April 2007) . . . . . . . . . . . . . . . . . . . . . . . .51
iBudget Impact Analysis Guidelines
Table of Contents

1Budget Impact Analysis Guidelines
The Guidelines for Conducting Pharmaceutical Budget Impact Analyses for Submission to PublicDrug Plans in Canada and the accompanying Microsoft Excel-based BIA model template weredeveloped by i3 Innovus under contract, after a competitive bidding process, with the PatentedMedicine Prices Review Board (PMPRB) for the National Prescription Drug UtilizationInformation System (NPDUIS). i3 Innovus is a contract research organization that specializes inhealth economics and outcomes research.
The PMPRB personnel who were responsible for the management of this project and for providingappropriate guidance to the developers of the guidelines and its model template were:
Acknowledgements
1
Lokanadha Cheruvu, BAEconomistPolicy and Economic Analysis BranchPatented Medicine Prices Review BoardOttawa, Ontario
Orlando Manti, MASenior EconomistPolicy and Economic Analysis BranchPatented Medicine Prices Review BoardOttawa, Ontario
The following i3 Innovus personnel contributed to the development of the Guidelines forConducting Pharmaceutical Budget Impact Analyses for Submission to Public Drug Plans inCanada and model template:
Patrick Douglas, MSc, IMBAResearch Analysti3 InnovusBurlington, ON
Amy Lee, PhDResearch Analysti3 InnovusBurlington, ON
Deborah Marshall, PhDVice President, Global Health Economicsand Outcomesi3 InnovusBurlington, ON
2 Budget Impact Analysis Guidelines
In addition, the following Principal Consultants of i3 Innovus reviewed and commented on draftsof the guidelines:
Mike Drummond, DPhilProfessor of Health EconomicsUniversity of YorkYork, HeslingtonUnited Kingdom
Stuart MacLeod, MD, PhD, FRCPCExecutive DirectorBritish Columbia Child & Family ResearchInstitute Vancouver, BC
George Torrance, PhDProfessor EmeritusMcMaster UniversityHamilton, ON
This report was produced with the assistance of the NPDUIS Steering Committee. The NPDUISAdvisory Committee worked with i3 Innovus and the PMPRB to review and comment on the guide-lines and template and these comments were incorporated into the final versions of both products.
The NPDUIS Steering Committee members are:
Newfoundland and LabradorColleen JanesDirectorPharmaceutical ServicesDepartment of Health and CommunityServices
British ColumbiaBrett Wilmer, Senior EconomistPharmaceutical Services Division
Prince Edward IslandPatrick CrawfordPharmacy Services ConsultantPEI Drug Programs
YukonDianne TaitManagerExtended Benefits and PharmaceuticalsProgram
Nova ScotiaJohn HoarPharmaceutical Economist PharmaceuticalServices
Non-Insured Health BenefitsProgramGeorges NadonPharmaceutical ConsultantBenefits ManagementFirst Nations and Inuit Health Branch
New BrunswickLeanne JardineHealth Information ConsultantMedicare/Prescription Drug Program
Health CanadaWayne LepineManager, Pharmaceutical PolicyQuality Care, Technology andPharmaceuticals Division
OntarioTommy CheungManager, Pharmaceutical StrategyDrug Programs Branch(Formerly Angie Wong A/Associate DirectorPharmaceutical Services Coordination Unit)
Canadian Institute for HealthInformationMichael HuntManager, Pharmaceuticals
1
3Budget Impact Analysis Guidelines
ManitobaDeborah MalazdrewiczManager, Finance DivisionHealth Information Management
Patented Medicine Prices ReviewBoardRonald Corvari, PhDDirectorPolicy and Economic Analysis Branch(Formerly Paul De CivitaA/DirectorPolicy and Economic Analysis Branch)
SaskatchewanKevin WilsonChair, Steering CommitteeExecutive DirectorDrug Plan & Extended Benefits Branch
Canadian Agency for Drugs andTechnologies in Health (CADTH)Michael TierneyDirector, Common Drug Review
AlbertaDee-Jay KingSenior ManagerPharmaceutical Policy and Programs Branch(Formerly Marilyn ThorntonAssistant DirectorPharmaceutical Policy and Programs Branch)
i3 Innovus recognizes the contribution of its entire staff in the development of these guidelinesand would also like to acknowledge Bindu Islam, formerly of the PMPRB, for her contribution tothis project. i3 Innovus also acknowledges the International Society of Pharmacoeconomics andOutcomes Research (ISPOR) Task Force Good Research Practices – Budget Impact Analysis andits Principles of Good Practice for Budget Impact Analysis Report, which were used during thedevelopment of this Canadian guidance document. In addition, i3 Innovus would like to expressits thanks to Alberta Health and Wellness, Manitoba Health and the Ontario Drug BenefitProgram for use of their BIA templates during the development of the Guidelines for ConductingPharmaceutical Budget Impact Analyses for Submission to Public Drug Plans in Canada andmodel template.
1

i3 Innovus is a global leader in health economics, outcomes research and market informatics tosupport market access and reimbursement of health care products. Part of i3 Innovus’ businessinvolves the development of BIAs on behalf of its clients for eventual submission to Canada’sfederal, provincial, and territorial drug plans.
Drs. George Torrance, Mike Drummond, and Stuart MacLeod are Principal Consultants for i3 Innovus.In addition, Dr. Torrance is a principal of Health Utilities Inc., a company that provides consultingservices to users of the Health Utilities Index (HUI).
4 Budget Impact Analysis Guidelines
Conflicts of Interest
2
3.1 IntroductionFor Canada’s public drug plans, budget impact analysis (BIA) is a tool used to predict andunderstand the potential financial impact of introducing a new pharmaceutical into a drug reim-bursement system that has finite financial resources. Committees and drug plan managers foreach of Canada’s federal, provincial and territorial (F/P/T) drug plans use BIAs to help informdecisions regarding drug reimbursement. Although many of Canada’s F/P/T drug plans use acommon process to aid in their decision-making process, the requirements for each drug planwith respect to BIA drug submissions differ widely. There is currently no standardized methodof performing and presenting BIAs for inclusion in drug submissions.
In 2005, a survey of drug plan managers and a review of previously submitted BIAs revealedthat the quality of submitted BIAs is often unsatisfactory. Key reasons for this evaluation were alack of transparency, inaccurate or misapplied assumptions, generalized analysis (non-specificor inaccurate jurisdiction and/or plan), inappropriate comparator selection, and overall quality(predictive accuracy).
In February 2006, i3 Innovus was awarded the commission by the PMPRB to produce a literaturereview of existing BIA guidance and to subsequently develop guidelines for BIAs submitted tothe F/P/T drug plans of Canada. Guidelines from Australia, England and Wales, Poland, theUnited States were identified as part of the literature review. The International Society ofPharmacoeconomics and Outcomes Research (ISPOR) Principles of Good Practice for BudgetImpact Analysis, which were released after the performed literature review, were utilized alongwith key learnings from the literature review to develop the Canadian guidance document. TheCanadian guidance document was developed to provide those responsible for the preparation,submission, and evaluation of BIAs with clear guidance regarding the methodology and reportingmethods to be used when submitting BIAs to the individual F/P/T drug plans or to Canada’sCommon Drug Review (CDR). Existing guidance from the provincial drug plan templates andthe individual F/P/T drug plans were also considered during the development of these guidelinesto ensure that the BIA guidance reflects the requirements of drug plan managers.
5Budget Impact Analysis Guidelines
Executive Summary
3
3.2 Recommendations for Analytic FrameworkModel Design
To be transparent and accessible, the budget impact model and supporting report should bedesigned in a manner that meets with the needs of the end users, explicitly state all choices andassumptions, use the simplest possible design structure to answer the budget impact question,and be built using readily available software.
Perspective
The BIA should be performed from a drug plan perspective that includes drug-related costs thatare reimbursed by the drug plan. Changes to the drug market that are caused by non-drugrelated changes in practice patterns should also be represented in the model; however, no costsother than drug costs should be included.
Scenarios to be compared
When evaluating the financial impact of granting formulary listing to a given drug, two scenarios,one for the Reference Scenario and one for the New Drug Scenario, should be compared. Allassumptions made to develop each scenario should be explicitly stated and justified using thebest available information, such as historical data from other markets, published forecasts or, ifnecessary, expert opinion.
Population
When establishing the population of interest within a BIA, the population should be definedbased on the manufacturer’s drug label / monograph, plan eligibility / membership, and anyrestrictions to drug access intended by the manufacturer. Growth of the market over time shouldbe based on general population growth estimates, with suitable adjustments being made if drugavailability is anticipated to affect the size of the market. The main analysis presented in the BIAshould not include off-label usage of the new drug.
Time horizon
When reporting data used to forecast the budget impact of a new treatment, four years of datashould be presented. Specifically, a one-year baseline period and a three-year forecast shouldbe presented. All forecasted data and results should be for 12-month periods (e.g., April 2007to March 2008) relative to the intended date of formulary listing.
Calculating Drug Costs
When calculating the cost to a drug plan, BIAs should include the expected reimbursement priceof the new drug, all relevant drug comparators, and all relevant concomitant medications reim-bursed by the drug plan. Drug costs should consider all mark-ups, inventory allowances,dispensing fees, and patient co-payments as per F/P/T drug plan BIA submission requirements.Premiums and deductibles should be excluded.
6 Budget Impact Analysis Guidelines
3

Characterizing Uncertainty
Deterministic sensitivity analyses should be provided with submitted BIAs to inform decision makersof the sensitivity of the model to specific assumptions. Reasonable and/or cited informationregarding the range of uncertainty associated with each assumption should also be included.When reporting the uncertainty analysis, a summary of sensitivity analyses performed on thefollowing parameters should be provided: price, market share of each treatment being compared,market size.
Discounting and Inflation
Results should be neither discounted nor inflated. The budget impact model should allow decisionmakers to easily study the effect of changes to these rates, if desired.
Validation
All submitted budget impact models should undergo internal validation.
3.3 Recommendations for Inputs and Data SourcesEstimation of the current size of the market
When estimating the size of the market, analysts may choose to develop their models based oneither population data or claims data. The use of population data is preferred for BIAs.Whenever possible, the population data used should represent the number of eligible beneficiaries.
If the analyst elects to use claims data to generate forecasts for a BIA, estimates of the size ofthe population that would require the forecasted number of claims should be provided to helpreviewers assess the reasonableness of the presented results.
Selection of relevant comparators
When developing BIAs, the comparators used in the supporting budget impact model shouldreflect drug-based treatment strategies used to treat the same indication(s) as the new drug.Treatment strategies may be composed of one or more drugs, as treatment of a specific indicationmay require that more than one drug be administered as a part of patient treatment. Non-drugtreatments should be excluded from the treatment strategies used in budget impact calculations.Identification of the relevant treatment strategies for a budget impact model should involve theuse of appropriate clinical input (e.g., published research, expert opinion).
Forecasting of the market under the Reference Scenario
To forecast changes in the Reference Scenario market, analysts should use published forecasts,whenever possible. Forecasts developed by the analyst should take into consideration antici-pated changes to the market over the time horizon and should be informed using data fromavailable databases.
When developing Reference Scenario forecasts, analysts should estimate the anticipated growthof the market and the market distribution of the treatment strategies expected to be available.Both of these factors should be estimated for the time horizon of interest and commentaryregarding the data supporting these estimates should be provided.
7Budget Impact Analysis Guidelines
3

Forecasting of the market under the New Drug Scenario
To forecast changes in the New Drug Scenario market, analysts should use current market intelligenceon how the reimbursement of the new drug will affect the market. Markets where the new drug is cur-rently reimbursed should be consulted to inform the forecasting process, whenever possible.
When developing New Drug Scenario forecasts, analysts should estimate the anticipatedgrowth of the market following the listing of the new drug, the expected market share of the newdrug following its listing on a given drug formulary, the effect of any restrictions to access to thenew drug on market size or market share, and estimation of how the new drug will affect themarket share of all relevant treatment strategies. These factors should be considered for theentire time horizon of interest and commentary regarding the data supporting these estimatesshould be provided.
Estimation of drug prices
To price each treatment strategy, analysts should obtain reimbursement prices from the bestavailable source(s), which may include, but is not limited to: the drug plan formulary, the manufac-turer, wholesaler catalogues, or providers of public drug plan data. The cost per day to use thetreatment strategy, which may consider therapeutic equivalence and patient time to refill, shouldbe considered. For a BIA prepared for a specific public drug plan, analysts should include mark-ups, inventory allowances, dispensing fees and patient co-payments as per the drug plan’sspecifications.
Drug prices for currently listed drugs should be estimated based on data from the drug plan formulary,whenever possible. For those drugs that are not currently reimbursed, the best available informationshould be used to price the drug (e.g., setting the comparator’s price equal to that of the new drug).When comparing different treatment strategies, it is important to consider therapeutic equivalencies,which often requires evaluating the number of drug units administered per unit of time.
3.4 Recommendations for Reporting FormatReports submitted to F/P/T drug plans for evaluation, should contain the following sections: reportintroduction, technology, objectives, study design and methods, results, limitations and assumptions,sensitivity analyses, conclusion, references and appendices. The information presented shouldinclude sufficient detail to allow a third party to replicate the submitted results. The inclusion ofsupporting tables and figures is recommended to enhance the clarity of the report.
In addition, the BIA Completion Checklist (Appendix D) should be used to verify that the BIAwas appropriately completed.
Interactive budget impact model
The interactive budget impact model used to produce the results should accompany BIA reports.The model should be developed using the most current interactive budget impact template providedwith the BIA Guidelines, with the analyst making any changes that are deemed necessary toensure the accuracy and clarity of the BIA.
8 Budget Impact Analysis Guidelines
3
Budget impact analysis (BIA) is a tool used to predict and understand the potential financialimpact of introducing a new health care intervention into a health care system that has finitefinancial resources.1 One of the key questions that can be answered through the use of a BIAis whether a new intervention can be afforded by the system of interest. With this knowledge,a better decision regarding reimbursement of the intervention can be made.2 This is in contrastto a cost-effectiveness analysis (CEA), which measures the value of a new intervention in termsof monetary units per additional unit of health benefit (e.g., dollars per symptom free day, dollarsper quality-adjusted life year gained). Both tools should be employed to make an informed decisionregarding the reimbursement of a new intervention at a given price for a specific population.
In some international jurisdictions, BIAs are designed to demonstrate net costs to the overallhealth care system. These comprehensive BIAs will incorporate not only the cost of the new inter-vention (e.g., a new drug) and the reduction in use of the intervention’s direct comparators, butwill also incorporate changes to any other health care resources that could be affected by thenew intervention’s introduction. Such BIAs allow reviewers to study the health care system globallyand assist them as they make decisions that touch all parts of the system. For example, theseBIAs can help managers of health care systems justify changes to the size of drug plan budgets,which can, in turn, allow new treatments to become accessible and affordable.
For jurisdictions that use BIAs for decision-making related to the introduction of new drugs totheir drug formularies, BIAs may focus exclusively on drug costs. Such pharmaceutical BIAs canassist drug plan managers in determining whether a new drug can be afforded by a given drugplan. This becomes more relevant than a BIA that evaluates all health care costs when the drugplan manager has no control over costs outside his or her given drug budget. By using theseBIAs in combination with CEAs, drug plan managers can make informed decisions regardingthe addition of new drugs that are both affordable from the perspective of the drug plan andalso represent good value for money for the health care system as a whole.
In Canada, federal, provincial, and territorial (F/P/T) drug plans use BIAs to aid in their decision-making processes regarding listing and reimbursement of drugs. As such, BIAs are designed ina manner that focuses on the affordability of the new drug. Questions related to the value of thenew drug to the overall health care system, as well as those pertaining to drug safety, efficacyor quality, are better answered through the examination of additional material, such as CEAs.
9Budget Impact Analysis Guidelines
Introduction
4
4.1 Use of Budget Impact Analyses in CanadaIn Canada, the decision to reimburse a new drug lies with the managers of each F/P/T drugplan. The Common Drug Review (CDR) of the Canadian Agency for Drugs and Technologies inHealth (CADTH) ensures that manufacturers submit BIAs to the various drug plans for all newdrugs. BIAs for drugs that have already obtained formulary listing from a given F/P/T drug planand for which expansion of their reimbursement criteria is being sought are sent directly to theF/P/T drug plans.
4.2 Unique Needs of F/P/T Drug PlansAlthough many of Canada’s F/P/T drug plans use the CDR process to inform their decisionsregarding drug reimbursement, the requirements of each drug plan with respect to BIA drug sub-missions differ widely. These differences include, but are not limited to:
• Access to drug therapiesSome drug plans will not add a new drug to their formularies; instead, they will add themto a list of drugs that require special authorization to allow their use. By keeping suchdrugs off drug formularies in this manner, drug plans are better able to control the use ofthese drugs.
• The population covered by the drug planSome drug plans cover any registered individual not covered by another drug plan, whileothers restrict drug plan eligibility to those meeting specific socioeconomic or health care-relatedcriteria. The choice of criteria varies by drug plan.
• Mark-up, dispensing fee and inventory allowance applied to drug costsThe maximum amount that drug plans will pay to cover charges in excess of the manufacturer’sprice (ex-factory price) for a given drug differs across the country.
• Premiums, deductibles and patient co-paymentsEach drug plan sets the amount for premiums, deductibles, and patient co-payments basedon the specific needs of the plan.
• The maximum amount reimbursed for the use of a given drugThe amount that a given F/P/T drug plan will reimburse for a given drug depends on thestructure of the drug plan itself. In some cases, the ex-factory price is reimbursed while, inother cases, the maximum reimbursable unit price is that of the lowest cost alternative tothe drug in question, as defined by the drug plan.
As can be seen from this list, many factors help to define a given drug plan. Although differencesexist with respect to the specific needs of each drug plan, it remains possible to develop generalrules regarding the preparation of BIAs that can provide decision makers with the informationthey need to identify new drugs that should be added to their drug formularies.
10 Budget Impact Analysis Guidelines
4
4.3 Harmonization of BIA MethodologyCurrently, in Canada, there is no standardized method of performing and presenting BIAs forsubmission to F/P/T drug plan managers. Only three jurisdictions (Alberta, Manitoba andOntario) provide manufacturers with documentation regarding the development and / or presentationof BIAs. Given the use of BIAs in the reimbursement decision-making process, it has been recognizedby the National Prescription Drug Utilization Information System (NPDUIS) that this lack of formal,standardized guidance must be addressed.
In September 2001, F/P/T Ministers of Health announced a multi-faceted approach to improvepharmaceutical management. One of the decisions made at that time was to establish NPDUIS,a partnership between the Canadian Institute of Health Information (CIHI) and the PatentedMedicine Prices Review Board (PMPRB). NPDUIS is responsible for providing “critical analysesof price, utilization and cost trends so that Canada’s health system has more comprehensive,accurate information on how prescription drugs are being used, and sources of costincreases.”3 The development of these guidelines was commissioned by the PMPRB.
Phase 1: Budget Impact Analysis Guidelines: Needs Assessment
In 2005, Phase One of the development of the Guidelines for Conducting PharmaceuticalBudget Impact Analyses for Submission to Public Drug Plans in Canada was completed. During thisphase, Panacea Canada Inc. surveyed the members of the NPDUIS Steering Committee, whichincluded representation from Health Canada, CIHI, the PMPRB, and the F/P/T drug plans. Thepurpose of this survey was to assess existing needs for developing BIA guidelines. In respondingto this 12-part survey, Steering Committee members commented on the overall effectiveness andutility of BIAs as they are currently conducted. In addition to this survey, 35 previously submittedBIAs were reviewed to determine the main issues that should be addressed with an analysis.
The findings of the survey and BIA evaluations revealed that drug plan managers often find submittedBIAs to be unsatisfactory. Analysis of the survey responses and the results of the BIA evaluationsidentified 5 key areas of improvements that needed to be addressed in this guidance on thedevelopment of BIAs.4 These key reasons for dissatisfaction amongst drug plan managersregarding BIA submissions were identified as:
• Lack of transparency• Inaccurate or misapplied assumptions• Generalized analysis – non-specific or inaccurate jurisdiction and/or plan• Inappropriate choice of comparators; and• Overall quality (i.e., predictive accuracy).
Based on the findings of Phase One of this process, it was determined that the development ofBIA Guidelines for Canada should be pursued.
11Budget Impact Analysis Guidelines
4

Phase 2: Guideline Development
In February 2006, i3 Innovus was awarded the commission by the PMPRB to complete PhaseTwo of this project - the creation of guidelines for BIAs submitted to Canada’s F/P/T drug plans.The first task for i3 Innovus was to review the existing body of literature regarding BIAs. Publiclyavailable documents from several jurisdictions, including guidance from Australia5,Canada6,7,8,9, England and Wales10, Poland11,12, and the United States13 were consulted tounderstand existing standards of practice for BIAs. Following the submission of this literaturereview14, the NPDUIS Advisory Committee was consulted to determine the requirements andexpectations for the Canadian Guidelines for the Development of Budget Impact Analyses. Thecommittee suggested using the format of the International Society For Pharmacoeconomics andOutcomes Research (ISPOR) Principles of Good Practice for Budget Impact Analysis15 as thebasis for the Canadian guidance document because this was the most current guidance available.
The ISPOR Principles of Good Practice provide general guidance regarding the development ofBIAs. The key recommendations include:
• The budget impact should be computed from data on the size and characteristics of the population with thecondition of interest, the current and new treatment mix, the efficacy and safety of the new and currenttreatments, and the resource use and costs for the treatment and disease symptoms.
• The BIAs should be generated as a series of scenario analyses specific to a particular decision maker’s populationand information needs.
• The primary data sources for estimating the budget impact should be published clinical trial estimates for efficacy and safety of current and new technologies, as well as, where possible, the decision maker’s ownpopulation for the other parameter estimates.
• The disease model used for BIA should compute disease outcomes in the total affected population for eachyear after the new intervention is introduced into clinical practice. The model should be consistent with thatused for the cost-effectiveness analysis with regard to clinical and economic assumptions.
The ISPOR Principles of Good Practice do not provide developers of budget impact models withspecific instruction on how BIAs should be performed (e.g., country- or region-specific datasources that should be used, calculations that should be performed). Further, the guidance providedmay not be applicable in all jurisdictions (e.g., the inclusion of non-drug costs, cost-offsets, and /or treatment effectiveness in the estimation of the budget impact).
The Guidelines for Conducting Pharmaceutical Budget Impact Analyses for Submission to PublicDrug Plans in Canada have been developed to provide more detailed instruction on how BIAsthat are to be submitted to public drug plans in Canada should be performed. Existing guidancefrom the provincial drug plan templates of Alberta16, Manitoba17 and Ontario18, and the individualF/P/T drug plans have been considered to ensure that the BIA guidance reflects the requirementsof F/P/T drug plan managers. As part of the preparation of the Guidelines for ConductingPharmaceutical Budget Impact Analyses for Submission to Public Drug Plans in Canada, aninteractive budget impact model template was developed to facilitate model development. Thistemplate, which can be found on the Web site of the Patented Medicine Prices Review Board(www.pmprb-cepmb.gc.ca), was created to provide analysts with interactive guidance on howto construct their models and includes information that complements the guidance provided inthese BIA Guidelines. Analysts are encouraged to use the template to build their models.
12 Budget Impact Analysis Guidelines
4
4.4 Purpose of this DocumentThe purpose of this document is to provide those who are responsible for the preparation, sub-mission and evaluation of BIAs with clear guidance regarding the methodology and reportingmethods to be used when submitting BIAs to the CDR or to a F/P/T drug plan that is currentlyparticipating in the Common Drug Review process administered by CADTH. The drug plans currentlyparticipating in CADTH that require the submission of a BIA are:
• British Columbia• Alberta• Saskatchewan• Manitoba• Ontario• New Brunswick• Nova Scotia• Prince Edward Island• Newfoundland and Labrador
In addition to these plans, the Non-Insured Health Benefits Program (NIHBP) requires that BIAsbe prepared and submitted. The following F/P/T drug plans do not require the submission ofBIAs through the CDR process:
• Quebec*• Yukon Territory• Northwest Territories• Nunavut Territory• Correctional Service Canada (CSC)• Royal Canadian Mounted Police (RCMP)• Veterans Affairs Canada (VAC)• Department of National Defence (DND)
Using the instructions provided in this document and the associated template, analysts shouldbe able to prepare BIAs that address the requirements of each of the participating drug plans.In addition to being of significance to those developing and submitting BIAs, this document, andthe BIA model template that accompanies it, may also be of interest to those developing BIAsfor submission to other non-participating jurisdictions and agencies. The NPDUIS SteeringCommittee has endorsed these guidelines and template.
The intended audience for these guidelines includes those who develop budget impact modelsor use them to draft and submit BIAs to F/P/T drug plans participating in the CDR, and drugplan managers who evaluate BIA submissions.
13Budget Impact Analysis Guidelines
* Quebec does not participate in the Common Drug Review process.
4
BIAs are commonly conducted using interactive models. By developing these models, both analystsand decision makers are provided with tools that forecast the future impact of decisions madein the present day. The usefulness of these analyses depends on the design of the model, thedata used for forecasting purposes, and whether the uncertainty inherent in the model designand data inputs is demonstrated in a meaningful way. Given these limiting factors, it is importantfor analysts to develop and utilize models built upon a robust analytic framework if their BIAsare to provide information of value to decision makers.
The following section provides an overview of the model design, analytic perspective, time horizon,population, costing, scenarios to be compared, uncertainty analysis, discounting and validationmethods that should be used when preparing a BIA. More specific and detailed guidanceregarding BIA data requirements is provided in Section 6: Recommendations for inputs anddata sources.
5.1 Model DesignAll BIAs should be designed to maximize their transparency for decision makers. This can onlybe achieved through proper model design. Choices made during the development of the BIAshould be fully explained to help decision makers understand how the budget impact modelworks. When developing a model to perform a BIA, the simplest design that generates accurateresults should be selected. In addition, the model should be built using a readily available softwareapplication, such as Microsoft Excel.
To be transparent and accessible, the BIA model and supporting report should:
• Be designed in a manner that meets with the needs of the end users• Explicitly state all choices and assumptions made by the authors of the model• Use the simplest possible design structure to answer the budget impact question• Be built using readily available software
14 Budget Impact Analysis Guidelines
Recommendationsfor AnalyticFramework
5

5.2 PerspectiveThe perspective used in the BIA should be that of the drug plan. As such, only drug costs affectedby adding the new drug to a given drug plan should be included. These costs could include:
• Drug prices (as reimbursed by the drug plan)• Wholesaler mark-ups• Pharmacy mark-ups• Inventory allowances for pharmacies• Dispensing fees
In addition to the adjustment of expected drug costs through mark-ups, allowances and dispensingfees, these costs may need to be reduced to reflect any co-payments made by drug plan beneficiaries.
The decision to include any of the above-mentioned costs is determined by each F/P/T drugplan. Appendix A includes a table specifying the costs to be included in BIAs for each drugplan as of October 2006.
The costs associated with a health care system perspective should be excluded from BIAs submittedto F/P/T drug plans. These costs include, but are not limited to:
• Medical procedures (e.g., surgeries)• Emergency room visits• Physician visits• Diagnostic procedures• Hospitalizations • Reimbursed medical devices
The use of a drug plan perspective that excludes costs specific to a health care system perspectivewas established as the relevant perspective for Canadian BIAs based on the results of the PhaseOne survey of the NPDUIS Steering Committee and the input of the NPDUIS AdvisoryCommittee during Phase Two of this project. Costs specific to the health care system should beexcluded from Canadian BIAs because they do not have a direct impact on the budget of theF/P/T drug plans. Instead, health care costs affect the F/P/T health care budget. These costs,which can be referred to as cost-offsets as they offset the cost of new drug, sometimes result indownstream effects that generate significant savings to both drug budgets and the overall healthcare system. Medical cost-offsets are captured in Canadian economic evaluations (i.e., cost-effectiveness analyses) and the exclusion of these offsets from BIAs is a key reason why F/P/Tdecision makers are encouraged to consider economic evaluations together with BIAs whenmaking formulary decisions.
15Budget Impact Analysis Guidelines
5
Although only the cost of treatments covered by F/P/T drug plans should be included in theanalysis, it is important to ensure that all changes to the dynamics of the public plan marketcaused by external factors such as non-drug treatments or other drug plans (public or private)are reflected in the forecasts used in the BIA. More specifically, the effect of non-drug treatmentswould be seen in projections of market size and market distribution. For example, if the use ofsurgery increased for a given market to correct an illness that was typically treated pharmaco-logically, the number of people receiving pharmacological treatment would decrease, resultingin a reduction in the size of the drug market.
In summary, when specifying the details of the perspective from which the BIA should be performed:
• Only a drug plan perspective that includes drug-related costs that are reimbursed by the drug planshould be included in the analysis
• Changes to the drug market that are caused by non-drug related changes in practice patterns should berepresented in the budget impact model
5.3 Scenarios to be ComparedBIAs are used to forecast the incremental cost or savings that will potentially be realized byF/P/T drug plans if the new drug is added to their respective formularies. To achieve this, it isnecessary to model two distinct scenarios. These two scenarios can be referred to as theReference Scenario and the New Drug Scenario. These scenarios are defined as follows:
Reference Scenario
In the Reference Scenario, the composition of the marketplace is forecasted for the time period ofinterest assuming that the new drug is not added to the F/P/T drug formulary. The composition ofthe forecasted market over the time horizon is based on the current market’s competitive landscapeas well as data and supportable assumptions regarding the discontinuation and/or adoption ofnew therapeutic options.
All assumptions made regarding the market within the Reference Scenario should be explicitlystated and referenced within the BIA report to ensure that F/P/T drug plan managers can assessthe reasonableness of the presented scenario. The information used to inform the BIA should bethe best available, which may include historical data from other markets, published forecasts or,if necessary, expert opinion.
New Drug Scenario
Unlike the Reference Scenario, the New Drug Scenario assumes that the new drug becomeslisted on the drug formulary of the F/P/T drug plan of interest. In this scenario, the composition ofthe marketplace is forecasted for the duration of the time period of interest. The composition of theforecasted market over the time horizon is based on the current market’s competitive landscape,data and supportable assumptions related to how the introduction of the new drug will changethe market, and the discontinuation and/or adoption of new therapeutic options.
16 Budget Impact Analysis Guidelines
5

As is the case for the Reference Scenario, the New Drug Scenario should explicitly state allassumptions made regarding the impact of the new drug on the market. These assumptionsshould be referenced within the BIA report to ensure that F/P/T drug plan managers are providedwith sufficient information to understand and assess the reasonableness of the presented scenario.The information used to inform the BIA should be the best available, which may include historicaldata from other markets, published forecasts or, if necessary, expert opinion.
Finally, the budget impact model should allow F/P/T drug plan managers to evaluate the impactof different New Drug Scenario assumptions in a straightforward manner. All assumptionsshould be made explicitly and inputs within the model that affect these assumptions should bepresented in an intuitive fashion.
In summary, when evaluating the impact on F/P/T drug plans of granting a given drug formularylisting:
• Two scenarios, one for the Reference Scenario and one for the New Drug Scenario, should be compared• All assumptions made to develop a given scenario should be explicitly stated and supporting references
provided
5.4 PopulationA key driver of the cost incurred (or savings realized) by a given F/P/T drug plan for a newtherapy is the size of the covered population that requires access to the new therapy. It is importantto note that the number of beneficiaries and the characteristics of the beneficiaries of interestwill vary depending on the drug plan being evaluated. For example, all residents of Manitoba whoare registered with Manitoba Health and are not covered by another F/P/T drug plan are eligiblefor drug plan benefits. As such, it is reasonable to assume that the age, gender, and diseaseprevalence in this population will mirror that of the general population. In Ontario, those individualswho are eligible for reimbursement by the Ontario Drug Benefit Program (ODB) are seniorsaged 65 and over, those on social assistance, residents of long term care facilities or Homesfor Special Care, and people receiving professional services under Home Care19. It would notbe expected that age, gender, and disease prevalence figures of those individuals who are coveredby the ODB would be similar to those of the entire population of Ontario. Some subpopulationscould be assumed to be similar, however, such as the senior population for Ontario and seniorscovered by the ODB. As a result of these important differences between drug plans, it is criticallyimportant to ensure that the population data used are drug plan-specific.
All drug plan beneficiaries who are expected to be diagnosed and treated for the condition(s)of interest and who are eligible to use the new drug should be included in the BIA. Eligibilityfor drug use is defined by the population specified by the manufacturer’s drug label / monographand the population eligible for coverage within the plan. Coverage eligibility is defined by eachrelevant F/P/T plan.
17Budget Impact Analysis Guidelines
5

In some cases, manufacturers may request that the reimbursed population be restricted topatients who have failed to respond to other therapies or who meet specific criteria. When thisholds true for a given drug, this restricted access should be reflected in the estimation of thoseindividuals who will receive treatment by reducing the number of relevant drug plan beneficiariesaccordingly. For example, if only those patients who have failed to improve following initialtreatment (first-line therapy) should be considered for the newly listed drug, the percentage of thepopulation expected to fail the first-line therapy should be factored into the calculation of thepopulation of interest. All restricted access criteria should be explicitly stated within the BIA report.
Estimation of the size of this population will depend on assumptions made regarding how theintroduction of the new drug will affect overall market dynamics. For example:
• Market growth should be based on standard population growth if the availability of the new drug is notanticipated to affect the size of the market
• Market growth should be based on both standard population growth and growth due to the new drug if theavailability of the new drug is anticipated to affect the size of the market
When determining the size of the population of interest, data from other markets that are known tobe similar to the market of interest should be used to forecast how the market would change overtime. (Evidence from markets that are known to be different from the population of interest may alsobe used; however, this should only be performed in the absence of any other available data.)
If off-label usage is expected due to experience in markets outside the jurisdiction of the F/P/Tdrug plan, expert opinion, or other sources, this should be clearly noted within the BIA report.Further, these data should be used to perform one or more sensitivity analyses that evaluate theeffect of off-label use on the F/P/T drug plan budget. For the main analysis presented in theBIA, predicted off-label usage should not be included, since off-label use cannot be supportedby the indications for use in the product monograph. Details regarding how the size of the marketcan be predicted are provided in Section 6.1.
In summary, when establishing the population of interest within a BIA:
• The population should be defined based on the manufacturer’s drug label / monograph, drug plan eligibility /membership and any restrictions to drug access desired by the manufacturer
• If the new drug is not anticipated to increase the size of the market, market growth should be based onforecasted growth of the target population
• If the new drug is anticipated to increase the size of the market, market growth should be based onforecasted growth of the target population and growth due to the new drug
• The main analysis presented in the BIA should not include off-label usage of the new drug
18 Budget Impact Analysis Guidelines
5

5.5 Time HorizonAs part of Phase One of the development of BIA Guidelines, drug plan managers were surveyedto determine their preferences with respect to submitted BIAs.20 At that time, 83% of respondentsindicated that a time horizon of 3 to 5 years was desirable. As a result of this and in consultationwith the PMPRB and the NPDUIS Advisory Committee, a time horizon of 3 years is requestedfor all submitted BIAs.
Results should be disaggregated over time in one-year periods. To remain in line with existingF/P/T BIA templates, all forecasted data and results should be reported in full 12-month periodsafter the proposed listing date (e.g., if the proposed listing date is April 1, 2007, then the forecastedtime period is from April 1, 2007 to March 31, 2010).21,22,23 Data for the baseline year (the12 months preceding the proposed listing date) should also be reported (e.g., April 1, 2006to March 31, 2007).
In summary, when reporting data used to forecast the budget impact of a new treatment:
• A one-year baseline period should be presented• A three-year time horizon should be presented for the forecast• All forecasted data and results should be for 12-month periods (e.g., April 2007 to March 2008)
5.6 Calculating Drug CostsWhen evaluating the budget impact of reimbursing a new drug, prices for the new drug and itscomparators are instrumental in determining the cost to the F/P/T drug plan following the additionof the drug to the formulary. Details relating to the calculation of drug costs are discussed belowand in Section 6.5.
Drug prices
When pricing the drugs to be included in a BIA for a given F/P/T drug plan, drug prices specificto the F/P/T drug plan should be used. Each drug price should be clearly presented and shouldbe specific to the chemical and dose of interest. To determine the amount reimbursed by eachF/P/T drug plan for a given drug, its price should be obtained from the drug plan formularies,a database that summarizes drug plan data, a wholesaler catalogue or the drug manufacturer.
When the annual cost of reimbursing a given drug is being evaluated for use within the budgetimpact model, the number of times the drug is taken over the period of one year should also beconsidered. For drugs that are taken as needed or that are taken periodically throughout theyear, an average number of treatments should be calculated and used in the evaluation of theannual cost.
19Budget Impact Analysis Guidelines
5
Concomitant medications
In some cases, the use of a given drug therapy requires the use of concomitant medications. Theseconcomitant medications may be reimbursed by the F/P/T drug plan. To estimate the impact ofconcomitant medication use on the budget of a given drug plan, the BIA should calculate thecost of ‘treatment strategies’ rather than the cost of each individual drug. A ‘treatment strategy’is defined as one or more drugs taken together to treat a condition.
When including concomitant drugs in BIAs, only drugs related to the active components of thenew drug may be considered (based on existing treatment guidelines, the indication of the newdrug and the restricted access criteria set by the manufacturer). Treatment strategies that combinedrugs may be intended to provide a strengthened pharmacological effect or allow a patient toundergo treatment without suffering from potential side effects. For example, AngiotensinConverting Enzyme inhibitors (ACE inhibitors) may be taken with a diuretic to provide a morepotent treatment effect in patients suffering from hypertension, and Nonsteroidal Anti-Inflammatory Drugs (NSAIDs) may be taken with gastroprotective agents (GPAs) to allow for themanagement of inflammation in patients at risk of experiencing gastrointestinal side effects. Incases where either of these scenarios exists and the use of the new drug would affect the useof these concomitant medications, the concomitant medications should be combined with theprimary treatment to define the ‘treatment strategy’. As is the case for standard monotherapies,the most current reimbursement price should be used in all relevant calculations within the BIA.
If evidence exists that indicates a new drug will obtain formulary listing during the time horizonof the model and it is known that this new drug will affect assumptions related to concomitantmedication use, the relevant concomitant medications should be included in the BIA and itsimpact studied through sensitivity analyses.
Premiums and deductibles
When performing BIAs for submission to the F/P/T drug plans, premiums and deductiblesshould not be factored into the calculation of costs to the drug plan. This is due to the fact thatpremiums and deductibles should be distributed across all drug therapies taken by a givenpatient in a given calendar year.
Mark-ups, inventory allowances, dispensing fees and patient co-payments
In addition to drug prices, some drug plans require the inclusion of additional F/P/T drug plan-specific charges in submitted BIAs. The additional charges that may be included in F/P/T BIAs are:
• Wholesaler mark-up• Pharmacy mark-up• Inventory allowance • Dispensing fee
20 Budget Impact Analysis Guidelines
5
The dollar value of these mark-ups, inventory allowances and dispensing fees vary by drugplan. Appendix A specifies the mark-ups, inventory allowances and dispensing fees that werein use by F/P/T drug plans as of October 2006. These values must be confirmed every time aBIA submission is performed to ensure that the most current values are being used. Failure toensure that all costs and cost adjustments made within the budget impact model are current mayresult in an underestimation of the impact of reimbursing the new drug.
If the new drug will have a significant impact on the amount reimbursed by the F/P/T drug plansfor mark-ups, inventory allowances or dispensing fees (e.g., the introduction of a fixed combi-nation therapy that reduces the number of dispensing fees paid per year), the actual mark-up,inventory allowance and dispensing fee values paid by the drug plans may be included in theBIA. The methods used to calculate mark-ups, inventory allowances and dispensing fees shouldbe consistent with those that are presented on the F/P/T drug plan websites. If several drugplans within a given province are applicable to the drug in question (e.g., Social assistancedrug plan, Seniors’ drug plan), the mark-ups, inventory allowances and dispensing fees usedshould represent a weighted average of the mark-ups, inventory allowances and dispensingfees of each relevant plan, unless otherwise specified by the drug plan.
Unlike deductibles, patient co-payments are sometimes included in drug cost calculations forBIAs. In cases where F/P/T drug plans request that manufacturers include patient co-paymentsin their budget impact models, patient co-payments should be included. Those drug plans thatrequire patient co-payments and request that they be included in BIA calculations are indicatedin Table A-1 of Appendix A (based on requirements identified in October 2006).
In summary, when calculating the cost to the F/P/T drug plan, BIAs should:
• Consider treatment strategies rather than the cost of each individual drug• Include the expected reimbursement price for all treatment strategies• Include the price of the new drug • Include the price of all relevant comparators as reimbursed by the F/P/T drug plan • Include the price of all relevant concomitant medications as reimbursed by the F/P/T drug plan• Adjust all drug costs according to the F/P/T drug plan’s requirements for BIA submissions• Determine the most current values to be used for all required mark-ups, inventory allowances, dispensing
fees and patient co-payments• Add all required mark-ups, inventory allowances and dispensing fees to drug costs• Subtract patient co-payments from drug costs, when required by the F/P/T drug plan• Exclude premiums and deductibles
21Budget Impact Analysis Guidelines
5
5.7 Characterizing UncertaintyAs the purpose of a BIA is to help its users understand the potential financial impact of introducinga new drug into a system with limited financial resources, it is important for decision makers tobe informed of the level of uncertainty inherent in the estimates from the model. Uncertaintyoccurs when the true value of a parameter is unknown, reflecting the fact that knowledge ormeasurement is imperfect. To ensure the transparency of the BIA, uncertainty analysis shouldalways be included. Access to uncertainty analyses is essential to effective decision making asit demonstrates the range of reasonable values F/P/T drug plans can expect to pay if theychoose to reimburse the new treatment.
To examine uncertainty, deterministic sensitivity analyses (DSAs) should be performed. DSAsmay include one-way analyses, multi-way analyses and analyses of extremes.
One-way sensitivity analyses involve testing various values for one parameter at a time.Varying the price of a comparator therapy that is anticipated to be reimbursed by the timethe new drug achieves formulary listing would constitute a one-way analysis. Multi-way sensitivity analyses involve changing several parameters within the model simul-taneously. An example of this approach would be changing the market share and marketgrowth assumptions simultaneously to illustrate their combined effect on the drug planbudget. Analysis of extremes represents a special case of multi-way sensitivity analysis,where all of the parameters in a model are tested at their lowest values and their highestvalues (i.e., studying the most pessimistic and optimistic conditions). These analyses can be used to reveal the range of possible results that can be obtained using the model andreasonable assumptions.
Probabilistic sensitivity analysis (PSA) is another special case of multi-way sensitivity analysis.The key difference between a DSA and a PSA is that to perform a PSA, a probability distribu-tion is assigned to each parameter and a value is randomly drawn from the distribution for eachmodel simulation. This process is then repeated many times. Although PSA may be worthwhileto explore in pilot studies, it is not recommended as a required component for a BIA submissionat this time.
Values used in sensitivity analyses should be supported by citable data sources whenever pos-sible. For example, if off-label use of the new drug has been noted in a foreign market, thisshould be explored within the sensitivity analyses using data from the foreign market to informthe model. In cases where confidence intervals have not been established for a given value,large changes to the value of the parameter should be tested. The value used should be justifiedin the body of the final report.
22 Budget Impact Analysis Guidelines
5
At a minimum, the following parameters should be tested in a sensitivity analysis to demonstrateto the F/P/T drug plan managers the impact of the assumptions made during model develop-ment, as they represent the three main components of estimating the value of the Reference andNew Drug Scenarios (as shown in Appendix B):
• Changes in the size of the market over the time horizon (including uncertainty regarding the utilized populationforecasts and off-label use estimates from relevant sources)
• Market share distribution amongst the new drug and its comparators (including the evaluation of the impact ofassumptions regarding the future reimbursement of potential comparators and/or concomitant medications)
• Price of any comparators and/or concomitant medications for which uncertainty exists (e.g., are not currently reimbursed but are anticipated to be granted reimbursement statusbetween the time of BIA submission and the end of the modeled time horizon)
Exclusion of any of the above-mentioned sensitivity analyses should be justified within the BIAbased on available data. Analysts are encouraged to include additional sensitivity analyses if theywill provide a better understanding of the impact of assumptions made during model development.These sensitivity analyses may include, but are not limited to:
• Testing model assumptions regarding the percentage of eligible participants with the condition of interest who areexpected to be diagnosed and treated
• Testing of assumptions related to the listing of new comparator treatments over the time horizon of interest• Testing of the variability around time to refill estimates
In summary, the uncertainty analysis provided with submitted BIAs should:
• Provide DSAs (i.e., one-way sensitivity analysis, multi-way sensitivity analysis, analysis of extremes)to inform decision makers of the sensitivity of the model to specific assumptions
• Provide reasonable and/or cited information regarding the range of uncertainty associated with eachassumption
• Provide a summary of sensitivity analyses performed on the following parameters: price, market share,and market size
5.8 Discounting and InflationBudget impact analyses, unlike economic evaluations, should not be discounted. This is becauseF/P/T drug plan managers are concerned with the cost (or savings) their budgets will realizeeach year rather than the value, in present-day terms, of any costs (or savings) brought aboutthrough the reimbursement of a new therapy. Indeed, economic theory suggests that future yearswould have higher costs, due to inflation, not lower costs. While costs in future years could, intheory, be inflated by a predicted inflation rate, this is not recommended. It is recommended thatresults presented in the BIA should be neither discounted nor inflated, but should be presented innominal dollars.
23Budget Impact Analysis Guidelines
5
The budget impact model should provide decision makers with the ability to vary the model’sdiscount rate or inflation rate should they choose to do so.
In summary, when developing budget impact models and performing BIAs:
• Results should not be discounted or inflated (both rates should be set to 0%)• The discount rate and inflation rates of the budget impact model should be user-defined variables
5.9 Validation Validation of the model used to generate each BIA report should be performed in accordancewith the methodology proposed by Weinstein et al in the article: “Principles of good practicefor decision analytic modeling in health-care evaluation: report of the ISPOR Task Force onGood Research Practices—Modeling Studies”. The key points discussed in this article that arerelevant for validating Canadian BIAs are:
Internal validation
• The model should be rigorously tested to ensure that it is technically sound. Evidence of this testing should beprovided.
• The model should be compared to available data, whenever possible, and adjusted programmatically toensure that results returned by the model match (or are close approximations of) available data.
• The programming created by the developer of the budget impact model to perform the analysis (source code)should be made available for review (on the condition that property rights are respected).
As is also mentioned in the ISPOR report, models should be based on the best available infor-mation that can be obtained reasonably. Decisions to obtain additional information to informmodels should consider the value of the information (cost versus improved model accuracy)when assessing what information constitutes the best available information. Once the model hasbeen developed and populated using the collected data, developers need not test every dataestimate or model assumption, as it is understood that the results generated by the model areonly as valid as the assumptions upon which they were based.
In summary, all submitted budget impact models should undergo a validation process thatinvolves:
• Internal validation
24 Budget Impact Analysis Guidelines
5
When developing a budget impact model that will be used to perform a BIA, the selection ofdata and assumptions used to inform the model are of paramount importance. This is truebecause all of the results generated by the developed budget impact model are dependent onthe values that have been inputted into the model and the methodology used to calculate theend results. Although the final results of BIAs cannot be assumed to be a precise prediction ofevents that will occur in the future, they can be expected to represent an accurate reflection ofwhat should be expected given the existing body of knowledge regarding the marketplace.
Data, assumptions, and forecasts are used to develop BIAs, which provide analysts and decisionmakers with an estimate the incremental costs or savings (budget impact) realized by replacingthe Reference Scenario with the New Drug Scenario. The process by which this estimation ofthe budget impact is performed is shown in Figure B-1 of Appendix B. The following sectionsdescribe the recommended inputs and data sources that should be used in a BIA prepared forpublic drug plans in Canada.
6.1 Estimation of the Current Size of the Market During Phase One of the development of Guidelines for Conducting Pharmaceutical BudgetImpact Analyses for Submission to Public Drug Plans in Canada, a review of 35 BIAs revealedthat the current market size for BIAs is typically estimated using one of two alternativeapproaches.26 These approaches, which are schematically presented in Figure B-2 of Appendix B,involved either:
• Designing models that predict the manner in which a given population will respond to the availability of therapeuticoptions (population data-based model); or
• Designing models based on historical drug purchasing behaviour (claims data-based model).
25Budget Impact Analysis Guidelines
Recommendationsfor Inputs and DataSources
6

Use of population data provides an effective means of estimating the number of people whoare eligible for coverage by a given drug plan (eligible participants) over time, while claimsdata-based models are better predictors of the number of eligible participants who file a claimwithin a given year and receive treatment (active beneficiaries).
When appropriate, the use of the population data approach is preferred for BIA submissions,as this approach can provide F/P/T drug plan managers with an estimate of the number of peoplein a given jurisdiction who are likely to have the condition(s) of interest, an estimate of the numberof people who become active beneficiaries by filing a drug claim for treatment of thecondition(s), and the number of active beneficiaries within each specialized drug plan (e.g., socialassistance, seniors) who are receiving treatment for the condition(s).
Claims data may be used instead of population data when sufficient data are available toenable analysts to estimate the size of both the diseased and reimbursed patient populations fora given set of assumptions (e.g., the introduction of a new drug is not expected to increase thenumber of treated individuals). Regardless of the methodology selected, an estimate of both thenumber of people and the number of claims resulting from the Reference and New DrugScenarios should be provided for transparency and completeness. Estimated figures should becompared to historical data to verify that the model is accurately predicting the size of the market.Recommended methods for estimating market size using population and claims data are pro-vided below.
Recommendations for Determining the Size of the Market with aPopulation Data-Based Model
The population data-based approach of forecasting the impact of listing a new drug on a drugformulary is a flexible approach for estimating market size, given that different data sourcesand assumptions can be used to limit the population to individuals with specific characteristics.In this approach, the number of eligible participants should first be determined. For some drugplans, this information is publicly available, while others have data online that can be used toestimate the size of the patient population. A number of drug plans do not have data related toeligible participants in a “ready-to-use” format. In such cases, it is expected that these data willbe obtained from other sources or estimated based on active beneficiary data. Selected datasources should be cited within the submitted report and model. In some extreme cases, datarelated to the number of eligible participants may not be available; in such cases, data from aneighbouring Canadian jurisdiction with a similar drug plan and available eligible participantdata should be used. These data should be adjusted based on the ratio of the general popula-tion sizes of the neighbouring jurisdiction and the jurisdiction of interest to obtain estimates forthe region of interest.
It is important to note that, although many provinces provide statistics regarding the number ofactive beneficiaries using their plans, active beneficiaries represent the sickest of those within theplan and, as such, should not be expected to have the same disease prevalence statistics as thegeneral population or the eligible participant population. In the absence of more accurate data,the active beneficiary data may be used; however, the effect of all disease prevalence, diagnosis,and treatment assumptions should be thoroughly tested to demonstrate the effect these assumptionshave on the final result.
26 Budget Impact Analysis Guidelines
6
Table C-1, found in Appendix C, indicates where data pertaining to eligible participants for eachdrug plan can be obtained. Age-specific details regarding these populations are not providedin all cases. In cases where these data are not available, or where the level of detail suppliedis insufficient for the analysis being performed, the age distribution should be estimated. Dataregarding active beneficiaries may be considered when estimating the distribution of the eligibleparticipant population in the absence of other available information.
When populating a BIA with estimates of the number of eligible participants for 12-month periods,estimates should represent the size of the population halfway through the period of interest. Forexample, for the 12-month period beginning January 1, 2007 and ending December 31, 2007,the size of the population should be defined as the size of the population on July 2, 2007.*This methodology should be used to reflect the fact that the population at the beginning of the12-month period may not be the same as the population at the end of the year, and assumesthat changes to the size of the population over a given 12-month period would be linear in nature.
With the number of eligible participants in each drug plan now known, disease prevalence statistics,as well as available statistics regarding the percentage of people who are diagnosed andtreated for the disease in question should be used to reduce the number of the eligible partici-pants to those individuals who would receive treatment. These details should be obtained froma published source, a public plan database or, if necessary, expert opinion. When valid detailsregarding the percentage of people who are diagnosed and treated are not available, reason-able assumptions should be made. In the absence of data, all eligible participants with thedisease should be expected to be diagnosed and treated. Assumptions should be appropriatelytested using sensitivity analysis to determine their impact on the final results.
Suggested methods for determining the number of eligible participants with the condition(s) ofinterest, in order of data reliability, are outlined below:
Use of prevalence data for the decision maker’s population in combination with population data for the F/P/Tdrug plan
• Published prevalence data that are specific to the decision maker’s population may be used to determine thenumber of people covered by the F/P/T drug plan that would have the condition of interest. This type ofdata is ideally suited to the development of a budget impact model as it provides real-world data pertainingto the population of interest.
27Budget Impact Analysis Guidelines
* July 2, 2007 represents the midpoint of the 12-month period, where 182 days precede the 12-monthperiod’s midpoint and 182 days follow the 12-month period’s midpoint (182 days + 1 day + 182 days= 365 days).
6
Use of prevalence data for the province, territory, or population of interest (e.g., Aboriginal Canadians, notincluding Métis) in combination with population data for the F/P/T drug plan
• Statistics related to the size of the decision maker’s population and the demographic com-position of this population (e.g., age, gender, race, ethnicity) and prevalence data for therelated jurisdiction are used to determine the number of people covered by the F/P/T drugplan that would have the condition of interest (e.g., use of prevalence data for Canada’sAboriginal peoples, excluding the Métis population, and eligible participant statistics forthe NIHBP). It is assumed that the prevalence of the disease in the population of eligibleparticipants is the same as that of the general population, and so the prevalence statisticsare applied to the population of the F/P/T drug plan. This represents the best alternativeto using actual prevalence data for the F/P/T drug plan.
Use of prevalence data from a province, territory, or population that is similar to the population of interest incombination with population data for the F/P/T drug plan
• Statistics related to the size of the decision maker’s population and the demographic com-position of this population (e.g., age, gender, race, ethnicity) and prevalence data for ajurisdiction that is known to be similar to the region of interest are used to determine thenumber of people covered by the F/P/T drug plan that would have the condition of interest(e.g., use of Nova Scotia prevalence data and population statistics for those eligible forreimbursement under the Prince Edward Island Drug Cost Assistance Programs). It isassumed that the prevalence of the disease in the population of eligible participants (byage, gender, race and ethnicity) is the same as that of the population used as a source ofprevalence data, and so the prevalence statistics are applied to the population of theF/P/T drug plan. This represents a less than ideal alternative and should only be usedwhen appropriate data are not available.
Use of national prevalence data in combination with population data for the F/P/T drug plan
• Statistics related to the size of the decision maker’s population and the demographic com-position of this population (e.g., age, gender, race, ethnicity) and Canadian prevalencedata are used to determine the number of people covered by the F/P/T drug plan thatwould have the condition of interest. It is assumed that the prevalence of the disease in thepopulation of eligible participants (by age, gender, race and ethnicity) is the same as thatof the Canadian population, and so the prevalence statistics are applied to the populationof the F/P/T drug plan. This represents a less than ideal alternative and should only beused when appropriate data are not available.
Restricted Access
As not all new drug submissions obtain or seek a formulary listing that is without restrictions, itis important to include budget projections that reflect the scenario under which access to thenew drug may be restricted by one or more conditions. To accomplish this, the market sizeshould be reduced based on available data. For example, if only seniors who are female andhave experienced a fracture should be considered in the analysis, only population data forthose with the desired demographic profile (i.e., females over 65 years of age) would be con-sidered, and this subpopulation would be further restricted to include only those patients whohad experienced a fracture.
The data sources used to calculate the impact of being granted a restricted listing status are thesame sources that would be used to estimate market size and growth.
28 Budget Impact Analysis Guidelines
6

Recommendations for Determining the Size of the Market with aClaims Data-Based Model
When developing a claims data-based analysis, the number of claims dispensed for a givenindication should be determined. Such estimates should be obtained through a database thatprovides detailed claims-based information for public drug plans.
The number of claims used in the model for the baseline year should reflect the number of claimsfiled for all relevant comparators. In cases where the new and existing drugs are used for mul-tiple indications, claims-based data should only be used if the distribution of claims between thetwo or more distinct indications can be made for each comparator. In the event that this is notpossible, a population-based model is recommended. This is because the population-basedmodel allows analysts to define their population(s) of interest based on specific criteria.
It is recommended that claims data-based models be used to calculate the number of active benefi-ciaries. This should be done when performing a claims-based BIA to validate the reasonablenessof the claims estimates and to provide drug plans with an idea of the number of beneficiariesthat are currently being treated for a given indication. The number of active beneficiaries canbe estimated by dividing the annual number of claims for each primary treatment by the averageannual number of claims filed per person. As each claim filed is specific to a particular patient,there should be no double-counting of patients when using this method of estimating the numberof active beneficiaries.
In addition to the general limitations of using active beneficiaries in BIAs, the estimates calculatedusing this approach cannot be subdivided by age and/or gender and thus age- and gender-specific prevalence data cannot be used for forecasting purposes.
In summary, when estimating the size of the market, analysts should:
• Generate estimates using a population data-based approach, when appropriate• Provide reviewers with population estimates when using claims data-based models
29Budget Impact Analysis Guidelines
6
6.2 Selection of Relevant ComparatorsThe drug comparators to be included in the BIA should be an accurate reflection of the existingtherapeutic options for the condition(s) of interest. Comparators should be categorized and studiedby indication to provide F/P/T drug plan managers with the overall impact of reimbursing thenew drug and the effect of this reimbursement by indication. This approach should be usedbecause the market dynamics may differ between subgroups (e.g., subgroup-specific comparatorsmay exist).
As mentioned earlier, the comparators used within a BIA should represent ‘treatment strategies’rather than individual drugs. For example, the use of an NSAID and a GPA should be treatedas a treatment strategy and reported as such, rather than calculating the cost of the NSAID andthe cost of the GPA separately within the model. Fixed combination drug therapies should alsobe considered to be treatment strategies and should be costed in that manner. Use of fractionalcosts to represent the proportion of the fixed combination drug that is a direct comparator is dis-couraged. Non-drug treatments should be excluded from the list of treatment strategies used inthe evaluation of the budget impact.
To determine which pre-existing drugs are likely to be displaced by the new drug, data fromother markets should be used (e.g., published studies, market research). In the absence of suchdata, expert opinion may be used. Information from the manufacturer’s marketing departmentmay also be included to support the selection of comparators and relevant indications.
If no comparators exist for the new drug, a population data-based model should be developed,as the development of the new market will need to be explored.
In summary, to select relevant comparators for a budget impact model, analysts should:
• Group drug comparators by indication• Identify treatment strategies that can be compared to the new drug• Seek adequate input (e.g., published studies, market research, expert opinion) to identify comparators
and their use
30 Budget Impact Analysis Guidelines
6

6.3 Forecasting of the Market Under the Reference ScenarioWith data for the baseline year of the analysis now calculated, the next step is to forecast thedata for the model over the time horizon of the model. When using software to generate forecaststhat will be used in a BIA submission, only tools included in the basic installation of MicrosoftExcel (or the modeling software package being used) should be included. All user-definedmacros should be written and presented in a clear and transparent method and fully docu-mented. These conditions should be met to ensure that F/P/T drug plan managers are able touse, understand, and evaluate the model.
Estimation of market growth
Estimation of market growth should be based on market intelligence and should be forecastedfor the four years of interest (baseline year plus three-year time horizon). Commentary regardingthe data supporting the market growth estimates should be provided. The magnitude of the estimatedmarket growth is the product of two factors: general population growth and disease-specificchanges.
When entering population growth statistics for a region or drug plan into the model, it is rec-ommended that published, publicly available forecasts be used. Use of published forecastsensures transparency and also ensures consistency between different submitted BIAs. If an exist-ing and credible published forecast is available for the population of interest, it should be usedand referenced. If existing forecasts cannot be identified, forecasts that are generated for theBIA should be based on a published and / or reliable source (e.g., a database derived fromF/P/T drug plan data).
Historical population data and population projections for each province can be obtained froma number of reliable sources. The largest collection of relevant data and forecasts can be foundat the Statistics Canada website (www.statcan.ca); however, data are also available directlyfrom several provincial and federal sources. Table C-1 of Appendix C provides a selected listof reports and websites that provide data that can be used when developing BIAs.
To facilitate the estimation of population growth when developing population-based models, thebudget impact model template provided with this document has been configured to incorporatepopulation projections from Statistics Canada for each of the provinces of interest as well as forthe Aboriginal population of Canada (excluding the Métis population). The most appropriatepopulation growth scenario should be selected for the Reference Scenario. This determinationshould be made by comparing historical data to the available forecasts. The most aggressiveand most conservative population projection estimates should be used within the sensitivityanalyses. It has been assumed that the age-specific population growth rates for the general populationare identical to those of the eligible participant population of the F/P/T drug plans.
As a result of changes in health care standards, drug benefit plans and other related issues, itremains possible that the number of patients treated for a given disease may change over thetime horizon. Such changes should also be reflected in the market growth estimates used withinthe BIA. Information related to expected changes in the marketplace should be obtained fromthe drug plan and CADTH websites and publications, published literature, expert opinion, theevaluation of historical data and market intelligence. All references should be provided withinthe BIA report.
In the absence of such information, the growth rate should be assumed to be 0%.
31Budget Impact Analysis Guidelines
6
Estimation of market share distribution
Once market projections have been generated, the next step is to estimate the market share dis-tribution of the available treatment strategies over the time horizon. These estimates are neededfor both the Reference Scenario where the new drug is not listed on the F/P/T formulary andthe New Drug Scenario, where the new drug has obtained reimbursement status.
For the current market, data from a database containing public drug plan data should be used todetermine how patients (or claims) are distributed between the available treatments. Year over yeartrends for each comparator should be calculated and these values should be used to forecastmarket share changes over the time horizon if deemed appropriate following an evaluation ofexpected market trends. If there is evidence to support the hypothesis that the market is stable(i.e., not changing), the market share distribution of the comparators may be left constant overthe time horizon.
In some cases, one or more of the comparators being evaluated in the BIA will be indicatedand used for more than one condition. Depending on the data source, these data may not beseparable by indication. In cases where this separation cannot be performed using a specificdatabase, published studies exploring this question should be accessed to help determine thepercentage of patients being treated with the comparator that are using it for the indication(s)of interest. If published material is unavailable, expert opinion or internal market intelligencemay be used. The selected source or sources should be referenced in the BIA report.
If it is expected that new treatments will become available or that existing treatments willbecome unavailable over the time horizon (e.g., drug discontinuation, anticipated listing ofcompetitor, availability of generics), these estimates should be included in the BIA. In all cases,historical data from the same market for similar drugs should be used to determine how marketdisruptions might shift the distribution of available treatments. Alternatively, historical data froma private or foreign market that is similar to the market being modeled could be used to fore-cast market changes. Available market intelligence can also be used to forecast the marketshare distribution of the comparators. In the absence of all other information, the followingstrategies may be used:
Listing of a new competing treatment• The market share growth of the new treatment should mirror that of the proposed new drug.
Treatment discontinuation• The market share held by the removed drug should be split amongst the remaining treatments proportional to
the size of the market held by each comparator. For example, a treatment that held 80% of the market wouldbe expected to capture 80% of the market share of the treatment that was removed from the marketplace.
If the data suggest that a new comparator will be listed prior to the listing of the proposed newdrug with a high degree of certainty, this should be used in the main analysis presented in theBIA. Sensitivity analysis should be used to evaluate the possibility that listing of the new com-parator does not occur.
32 Budget Impact Analysis Guidelines
6
If the data suggest that a new comparator may be listed, but the likelihood of this event is uncertain,this scenario should be included in sensitivity analyses and the main analysis should be used toevaluate the current market distribution.
In the special case where a new drug is to be listed for which there are no comparators, themarket used in the BIA that represents the Reference Scenario should be composed of no drugs,while the New Drug Scenario should be composed of only the new drug. This analysis representsthe simplest format of a BIA, one where the budget impact is equal to the total cost of the drugbeing introduced.
In all cases, sufficient commentary should be provided in the BIA to explain the selection of datafor all forecasts and the assumptions made to generate the forecasts.
In summary, to forecast changes in the Reference Scenario market, analysts should:
• Avoid forecasting data using computer applications other than the application in which the budget impactmodel was developed
• Use published forecasts, whenever possible• Access available databases to determine the current distribution of treatment strategies• Develop forecasts that take into consideration anticipated changes (e.g. listing of a new competing
treatment or treatment discontinuation) to the market over the time horizon
6.4 Forecasting of the Market Under the New Drug ScenarioFollowing the addition of a new drug to a given F/P/T drug formulary, it is possible that themarket dynamics that previously existed will no longer be applicable. Changes in the rate ofmarket growth, the use of the available treatments and even the amount paid per year by thedrug plan may occur following this addition to the marketplace. As such, it is important for thosedeveloping BIAs to ensure that adequate attention is paid to this issue when generating forecastsof expected market changes following the listing of the new drug.
The new treatment strategy mix used within the BIA should reflect how the market is expectedto change due to the introduction of the new drug. In addition, the change in the market sharedistribution brought about through the introduction of the new drug should be explained. Therate at which the new treatment will capture market share from its comparators should be clearlydocumented and should be reported in a manner that reflects the market share captured fromthe preceding year of a given scenario.
It is recommended that BIA submissions include market data for products that have been on themarket in other jurisdictions. When available, this information should be included either withinthe main body of the report or within an appendix. A brief evaluation of whether the presenteddata and / or data trends are likely to reflect expectations for the F/P/T drug plan marketsshould be provided. When such data are not available, it is up to the manufacturer to deter-mine the best manner in which to predict the impact of having its new drug added to the F/P/Tdrug formulary. In the sections that follow, details pertaining to how these forecasts should beconducted are presented.
33Budget Impact Analysis Guidelines
6
When generating forecasts, the analyst should first assess the information that is available. Ifthe manufacturer has provided the analyst with market share projections for the new drug, theseprojections should be used within the model and should be referenced as being based on internalestimates. Use of these estimates is the preferred methodology of providing market share estimatesas it is expected that the manufacturer will work towards achieving its market share targets overthe time horizon.
If the manufacturer cannot provide market share forecasts, the market share of the new drugshould be estimated based on the market share growth of the new drug in foreign markets orprivate payer markets. Foreign or private payer markets should only be utilized if the market issimilar to the F/P/T drug plan market for which the BIA is being prepared or if the relationshipbetween the F/P/T market and the foreign (or private payer) market is well understood.
If the new drug has not been listed on drug formularies in other jurisdictions, an alternativemethod of estimating its market share over the time horizon is to base projections on the marketshare of a similar product in a foreign or private payer market. As was noted above, data fromthese markets should only be used if the manufacturer is confident that the data are reasonablefor the F/P/T drug plan for which the BIA is being prepared.
In cases where none of the above-mentioned methods can be used to estimate the market shareof the new drug, the rate at which the drug gains market share should be forecasted based onpublished study data, expert opinion, previous experience and/or any other reliable datasources that provide details related to the anticipated usage of the drug. The factors that shouldbe used to calculate the market share of the new drug may include:
• Percentage of users of competing treatments who are eligible to use the new drug• Percentage of physicians who are aware of the new drug• Percentage of physicians who are willing to prescribe the new drug• Percentage of users of competing treatments who are aware of the new drug• Percentage of users of competing treatments who are likely to switch to the new drug• Percentage of those who try and fail to respond to the new drug
Additional criteria may be added to this list, as needed. The product of all the percentages foreach year in the model represents the expected annual market share of the new drug.
Estimation of market growth
If the introduction of the new drug is expected to change the number of individuals treated fora given indication, this should be reflected in the forecasts used in the BIA. Estimates regardingsuch a change should be based on experience in foreign markets or with private payer plans,data from similar drugs that have entered the marketplace and/or expert opinion. Sensitivityanalyses should be performed on any data-based estimates of market growth. If data-basedhigh and low estimates cannot be generated, reasonable low and high estimates of the growthrate should be used. The reason behind the selection of a given low or high estimate shouldalso be provided.
34 Budget Impact Analysis Guidelines
6

In the absence of data from which to extrapolate changes in market growth, market growthcaused by the introduction of the new drug should be assumed to be 0%. This assumptionshould be stated explicitly and tested using sensitivity analyses that study the effect of reasonableannual increases or decreases in the size of the market (e.g., 5% increase). Justification for theuse of a specific value for the sensitivity analyses should be given.
If there is strong evidence (or reliable expert opinion) to suggest that no market growth will berealized through the introduction of the new treatment, sensitivity analyses to study changes inmarket growth should not be performed. Evidence supporting that conclusion should, however,be provided in lieu.
In all cases, projections should be made for the entire time horizon of interest and commentaryregarding the data supporting these estimates should be provided.
Market share estimation for new drug
The potential utilization of the new drug within the market will have a significant impact on theresults of the BIA. As such, it is important to report all assumptions and calculations related tomarket share estimation for the new drug as thoroughly as possible. When estimating the marketshare distribution within the New Drug Scenario, the best source of data to inform the estimationof the market share distribution of the market is the use of historical data for the treatment strategiesof interest from foreign markets or Canadian private payers. This method represents the bestavailable method as it reflects observed market changes. The limitation of this approach is thatit is difficult to evaluate how similar two different markets may be. As a result, information fromone market may not be directly transferable to another.
An alternative approach is to develop a model that forecasts the market share of the new ther-apy based on inputs such as predicted patient awareness of the new drug, physician awarenessof the new drug, probable switching behaviour, and other related factors. Under such a scenario,it is the potential changes in the market that are used in the model to estimate the incrementalcost or savings realized by the F/P/T drug plan. Expert opinion should be used to assess thereasonableness of these estimates.
Estimation of displacement of existing therapies by new drug
The rate at which the new drug will capture market share will need to be estimated based ona series of explicitly stated assumptions. These assumptions should make use of all availableintelligence to ensure that the generated forecasts represent the most reasonable estimate basedon current knowledge and should be fully documented.
When calculating market capture, each forecasted year for the new market should be based onforecasts made for the previous year. For example, if 100% of the market share of a given com-parator were assumed to be captured by the new drug in year 1, the amount of market sharethat would be captured in year 2 by the new drug would be 0%, as the comparator would hold0% market share in the previous year.
35Budget Impact Analysis Guidelines
6
In cases where no data are currently available to improve the quality of the market forecasts foreach comparator or where the new drug is expected to increase the size of the market withoutcausing patient switching, it should be assumed that the rate at which a new drug will capturemarket share from a given comparator is proportional to the market share of the comparator.For example, if Comparator A holds 75% of the market and Comparator B holds 25% of themarket, it would be assumed that 75% of the new drug’s growth would be derived fromComparator A and 25% of the new drug’s growth would be derived from Comparator B.
In summary, to forecast changes in the New Drug Scenario market, analysts should:
• Apply the general rules detailed for the forecasting of the Reference Scenario• Consult drug-specific data from markets where the new drug is currently reimbursed, whenever possible• Consider and appropriately reference current market intelligence on how the reimbursement of the new
drug will affect the market
6.5 Estimation of Drug PricesDrug prices are a key component of BIAs and, as such, should be estimated with care. Factorssuch as the unit price of the drug and price adjustments such as mark-ups, dispensing fees andpatient co-payments all play a role in determining the incremental cost or savings realized bygranting a new drug reimbursement status. The following sections describe how these factorsshould be estimated and used within budget impact models.
Unit price for drugs currently reimbursed by F/P/T drug plans
When obtaining pricing information for the drugs included in the BIA, print or online versionsof the F/P/T drug formulary price lists should be consulted. The most current version of the pricelist should be used. It should be noted that, under certain circumstances, the additional chargesmight already be included in the price shown in the provincial drug lists. As noted in Table A-1of Appendix A:
• The 2006 Alberta Health and Wellness Drug Benefit List includes a 7.5% wholesaler mark-up in some of theprices presented in the list. No distinction is made between those drug prices that include the mark-up and thosethat do not. As no method of distinguishing between those prices with mark-up and those without mark-upsexists, it should be assumed that wholesaler mark-ups have not been included in the price of listed drugs.27
• The 2006 Saskatchewan Health - Drug Plan Formulary includes a wholesaler mark-up in all prices listed inthe formulary.28
• The 2006 Newfoundland and Labrador Interchangeable Drug Products Formulary includes a 9% inventoryadjustment charge in all prices.29
The prices used should be the most appropriate price for each comparator. The most appropriateprice may represent the lowest reimbursed price for a specific chemical, the lowest reimbursedprice for a type of therapy, the actual price of the drug, or some other price. The F/P/T drugformulary will indicate the price that should be used in most cases.
36 Budget Impact Analysis Guidelines
6
If it is known that the price reimbursed for a given drug is based on the drug’s ex-factory price, thedrug price may be obtained from the drug manufacturer. The price of the new drug will typically beobtained in this manner.
If the unit price cannot be obtained from either of these sources, wholesaler drug catalogues orproviders of public drug plan data may be used to extract data pertaining to the price reim-bursed for the drug in question. It is imperative that the data source be as recent as possible,preferably within the same calendar year as the other prices used within the model. This isbecause the prices calculated using these data do not represent current F/P/T drug plan costsand, as a result, may introduce error into the model by utilizing a drug price that is lower orhigher than the actual price.
In all cases, the price used within the BIA should be derived from sources specific to the F/P/Tplan being evaluated. For example, a BIA for the province of Ontario should use Ontario costsand not costs for the province of Alberta. The cost sources used should be clearly documented.
Unit cost estimation for drugs not currently reimbursed by F/P/Tdrug plans
For unlisted drugs that are expected to obtain listing in the future, the price of the drug shouldbe estimated using the available data. If there are data to suggest that the drug will be launchedat a specific price, these data should be used.
If the drug represents a lower dose version of an existing treatment, the price of the existingtreatment should be used. This is because of the likelihood that the new treatment will be moreexpensive than the existing treatment is low. If the new drug represents one of a class of drugs,the lowest priced alternative within the class as defined by the drug plan should be used to setthe price of the new comparator.
If the amount of information regarding the price of the unlisted comparator is limited, the priceof the comparator should be set to the price of the drug for which the BIA is being submitted.This should be done to minimize bias in the analysis.
Any assumptions made about the price of drug comparators should be reported within the BIAreport and tested using DSA.
Estimation of therapeutic equivalencies
When determining the cost per prescription or the patient cost per year within a BIA, it is impor-tant to accurately and transparently evaluate therapeutic equivalences. “Therapeuticequivalences” refers here to equivalence in use, not equivalency in therapeutic efficacy. Forexample, a therapy that is taken once a month and a therapy that is taken once a day cannotbe fairly compared by looking at the unit prices alone. Instead, the frequency of drug use shouldalso be factored into the comparison of the two treatments.
37Budget Impact Analysis Guidelines
6
In order to allow for the equitable comparison of treatments, the number of units of a given treatmentused per day and the number of days used per year should be clearly presented within the BIA.These figures, which are required for all treatments modeled within the BIA, should be derivedfrom a database of public drug plan data. These data would provide a clear indication of theaverage number of units taken per day for each treatment; however, in some cases, this maynot be an accurate reflection of the number of units needed for the budget impact model. Anexample of this would be if a treatment strategy of more than one drug were being examined.Under this scenario, the number of units taken per day as reported in the database would reflectdrug use, irrespective of whether additional drugs were being taken concomitantly.
When estimating therapeutic equivalencies, it is also important to consider the duration overwhich each treatment is taken. For some treatments, patients will be expected to receive a givennumber of units per day each day over a 12-month period. The number of drug units taken peryear and the number of claims filed per year may, however, vary between treatments. As aresult, the days per period of treatment and the number of treatment periods per year should beincluded in the calculation of annual treatment costs.
In cases where data obtained from a public drug plan database can be argued to be inappro-priate, product monographs and / or the Compendium of Pharmaceuticals and Specialties30
may be used to estimate the number of units of treatment administered per day. Alternatively,expert opinion may be sought to inform this component of the budget impact model. In all cases,an explanation of why the selected data source is valid should be provided.
Inclusion of applicable mark-ups, dispensing fees, inventoryallowances and patient co-payments
Each participating F/P/T drug plan has a specific reimbursement formula that it uses to deter-mine the amount it is willing to pay, in excess of the ex-factory drug price, for drug mark-ups,dispensing fees and inventory allowances. In addition, patients are sometimes required to covera portion of the cost of their prescriptions and the amount of this patient co-payment is also drug-planspecific. These price adjustments can be obtained from the web sites of the F/P/T drug plans.To reflect the amount paid by the drug plans accurately, it is necessary to include these priceadjustments in the daily drug costs used within the developed model.
Although exact adherence to the reimbursement formula used by a given F/P/T drug plan willprovide an accurate representation of the amount paid by the drug plan on an annual basis,not all drug plans wish to have all fee adjustments included in BIAs for new drugs. Table A-1,found in Appendix A, shows the 2006 wholesaler mark-up, pharmacy mark-up, inventoryallowance, dispensing fee, and patient co-payment values identified for use in BIAs. These valuesmust be confirmed by the appropriate F/P/T drug plan prior to their use in a submitted BIA.
In situations where F/P/T drug plans request the inclusion of dispensing fees, the number of timesthat dispensing fees are paid per year should be determined. This value should be based on themaximum number of days of drug treatment a pharmacy can dispense for a given claim. Themaximum number of days of treatment can be obtained from the drug plans or from the annualGuidebook on Government Prescription Drug Reimbursement Plans and Related Programs pro-duced by the Canadian Association for Pharmacy Distribution Management (CAPDM).31 Tocalculate the number of claims filed (and the amount paid in dispensing fees), the model shoulddivide the number of days in one year (365 days) by the maximum number of days of treatmentobtained with one claim (e.g., 90 days). The reviewer should be able to vary the number of daysof treatment obtained with one claim within the model to study its impact.
38 Budget Impact Analysis Guidelines
6
When a BIA is being conducted for a fixed combination therapy, dispensing fees should beincluded in the calculation of the impact of the new treatment on the overall drug plan budget.This is because the use of a fixed combination therapy reduces the number of submitted claimsand thereby reduces the amount paid by the drug plan to cover dispensing fees. Wholesalermark-up, pharmacy mark-up and inventory allowance should also be included, if they have adirect impact on the calculation of the dispensing fees covered by the drug plan. Co-paymentsneed only be included in this situation if stipulated by the drug plan in question.
Estimation of Time to Refill (Optional)
In cases where data pertaining to the time between the refilling of patient prescriptions existsfor all treatment strategies, this information may be included in the BIA to calculate the numberof times dispensing fees are paid for each treatment in a given year. These data may not alwaysbe available for all treatment strategies. When evidence for all treatments is available, time torefill estimates may be used instead of the maximum number of days of treatment obtained withone claim provided by the drug plans. If data do not exist for all treatment strategies, time torefill estimates should only be included as sensitivity analyses. In the absence of data, time torefill estimates need not be included.
Time to refill can be estimated using data regarding compliance and persistence to therapy. Forexample, if patients were typically only 90% compliant when taking their medication, both thecost per day and the units taken per day for their medication would be reduced to 90% of theiroriginal values. This would translate into a reduction in the number of claims filled per year andwould ultimately affect the annual impact of dispensing fees on the drug budget. Evidence sup-porting assumptions related to compliance should be documented and drug costs should bereduced accordingly. Data from databases and / or published studies should be used as evidence.
In all cases where time to refill estimates are included in the analysis, the variability around thetime to refill estimates should be studied in sensitivity analyses and the degree of uncertaintyclearly stated. Variability should be represented using the most appropriate method based onthe data available (e.g., minimum and maximum values, 95% confidence intervals, etc.) andthese values should be tested within the model.
In summary, to price each treatment strategy, analysts should:
• Obtain reimbursement prices from the best available source(s), such as drug plan formularies, publicdrug plan databases and wholesaler catalogues
• Estimate the number of days of treatment for each treatment strategy (i.e., consider therapeutic equivalencies)• Include appropriate price adjustments for the F/P/T drug plan for which the BIA is being performed• Consider time to refill data to determine the number of times that dispensing fees are paid for each drug
(optional)
39Budget Impact Analysis Guidelines
6

6.6 Calculation of Budget ImpactAs shown in Figure B-1 of Appendix B, estimates from the Reference Scenario and the NewDrug Scenario should be used to determine the incremental cost (or savings) realized by a drugplan. The value of each scenario is equal to the sum total of the annual cost of each treatmentstrategy. Estimation of the annual cost of a treatment strategy is dependent on the type of BIAperformed by the analyst. If a population data-based model has been used, the annual cost ofa treatment strategy is equal to:
Annual number of patients x Annual market share of treatment strategy x Annual drug costper patient
In the case where a claims data-based model has been used, the annual cost of a treatmentstrategy is equal to:
Annual number of claims x Annual market share of treatment strategy x Drug cost perclaim
The budget impact is equal to the difference between the value of the New Drug Scenario andthe value of the Reference Scenario (i.e., New Drug Scenario Value minus Reference Scenario).A positive budget impact value indicates that the introduction of the new drug will result inincreased expenditures for the drug plan, while a negative value indicates that the drug planwill save money by adopting the new drug.
Incremental prescription drug costs should be calculated for each of the three years of the timehorizon. In addition, the cumulative incremental prescription drug costs for the time horizonshould be evaluated. Summary calculations for the total direct drug costs in each year (Year 1,Year 2 and Year 3) and for all years (Years 1-3), should be presented by scenario to allowreviewers to understand how the budget impact was calculated.
40 Budget Impact Analysis Guidelines
6

The recommended reporting format presented here, which has been adapted from the preferredISPOR structure for BIA reporting, describes the information that should be presented to maxi-mize the transparency of the BIA for each F/P/T drug plan.32 Choices made during thedevelopment of the BIA should be fully documented and clearly described to help decision mak-ers understand the methodology behind the submitted budget impact model.
7.1 Report ContentsReport Introduction
The report introduction should contain a summary of all the relevant epidemiological, clinicaland economic information related to the disease indication of interest. The specific informationto be included in the introduction is the following:
• Epidemiology Age- and gender-specific details regarding the prevalence, incidence, and risk factors forthe disease in question should be reported in the introduction. A brief description of thepathology, prognosis, and progression of the disease should also be included.
• Available and Future TreatmentsAs the market dynamics assumed in the model will be driven by assumptions related toboth pharmacological and non-pharmacological treatment options, both types of treatmentsshould be summarized in this section. If there are additional therapeutic options that areexpected to become available by the end of the BIAs time horizon, these should beincluded in this description as well.
• Economic impact Studies that discuss the indication and treatments of interest should be discussed. Thesestudies may include:
• Previous BIA studies in the condition of interest for another drug• Burden of illness studies• Cost-effectiveness or cost-utility studies.
41Budget Impact Analysis Guidelines
Recommendationsfor Reporting Format
7
Technology
In this section, the characteristics of the new drug should be described. The description shouldinclude details regarding how the new technology compares to existing treatments. The specificcharacteristics that should be addressed in this section are:
• Indication (based on the product monograph)• Formulation• Onset of action• Efficacy• Side effects• Serious adverse events• Intermediate outcomes• Adherence/Compliance
A brief summary of the clinical trials should also be provided in this section, including informationon the design, study population, follow-up period, and clinical outcomes. This summary may beprovided in a tabular format, if desired.
Objectives
The objective(s) of the BIA should be clearly stated. These objectives should state the populationfor which reimbursement is being sought, the time horizon being reported and the perspectiveused within the report. A clear statement of any limits to this analysis should also be included.For example, if the new drug will not affect current drug utilization patterns (i.e., market sharedistribution) but will decrease the need for specific health care resources, it should be noted thatsavings to the health care system have not been included due to the use of a drug plan perspective.
Study Design and Methods
The methods section of the report should provide sufficient detail to allow a third party to replicatethe analysis. Each of the following model characteristics should be included:
• Patient population The patient population of interest should be clearly and succinctly defined within this section ofthe report. Details regarding restricted access to the new drug following its obtaining formularylisting should be noted.
• Treatment strategy mix Assumptions made regarding the treatment strategy mix included in the model for theReference Scenario and the New Drug Scenario should be presented with justification. Theselected treatment strategies should represent the treatment patterns and clinical guidelinesof the F/P/T region of interest.
42 Budget Impact Analysis Guidelines
7
• Perspective, Target audience and Time horizonUnlike BIAs that may be performed in some other jurisdictions, Canadian BIAs focus exclusivelyon the impact that the listing of a new drug on the F/P/T drug formulary will have on thedrug plan budget. Confirmation that the perspective used in the analysis is that of a drugplan should be provided. The specific plan for which the BIA was prepared should also bestated.
The reported time horizon should be three years from the anticipated date of listing for the newtreatment.
• Model description A schematic illustration of the model should be provided, along with a detailed descriptionof the structure of the BIA model.
• Input data and data sourcesTo allow reviewers to replicate the submitted results, all values used within the BIA to generateresults for all developed analyses should be presented within the report. Depending on thestructure of the budget impact model, these parameters may include cost, epidemiological,or drug utilization data items. Each parameter value or set of parameter values should be described and referenced toallow the reader to assess the validity of the selected data. Selection criteria for studiesand databases should be discussed to provide guidance for this assessment process. Inaddition, an indication should be given of the direction and magnitude of potential bias inthe data sources that were used.
• Data collection The methods and processes employed for any primary data collection (e.g., expert opinion) ordata abstraction (e.g., from databases) should be provided. In addition, any data, summaryreports, or data collection forms / queries should be included as report appendices.
• Primary analysis A description of the methods used to calculate the total budget required to introduce thenew drug and incremental prescription cost compared to the Reference Scenario should beprovided for the main analysis. The description should be of sufficient detail and clarity toallow the reader to perform the same analysis and obtain the same results.
Results
When reporting the model results, both the total budget and the incremental budget impactshould be presented for each year of the time horizon. Tables showing aggregated and disag-gregated drug costs over time before and after applying costing information (e.g., mark-up,dispensing fees, patient co-payment) should be provided. An explanation of these results shouldaccompany the provided tables.
43Budget Impact Analysis Guidelines
7
Limitations and Assumptions
The submitted report should contain a clearly identified section that itemizes the known limita-tions and assumptions made to develop the model and / or report. The reason behind eachlimitation or assumption should be briefly noted within this section. In addition, a summary tableshould be included for simplified access to this information. The Limitations and Assumptionssection should, at the very least, consist of the following subsections:
• Limitations and Assumptions: Model Structure• Limitations and Assumptions: Input Data and Data Sources
Sensitivity Analyses
The results of the sensitivity analyses should be described and the choices made with respect tochanges to the inputs used in the Reference Scenario should be justified. A table summarizingthe results of the sensitivity analyses should be provided in this section. A graphical representationof the results should also be included (e.g., Tornado chart).
Sensitivity analyses should be presented within the main body of the report. Related sensitivityanalyses should be reported together (e.g., sensitivity analyses pertaining to market size shouldbe reported together and the range of the market size sensitivity analyses should be reportedexplicitly.)
Any limitations or assumptions specific to the sensitivity analyses should be reported as a sub-section of this section in a manner similar to that used in the Limitations and Assumptions section.
Conclusion
A conclusion that summarizes the key information presented in the report should be included.The incremental budget impact for each of the three forecasted years as well as the incrementalbudget impact for the time horizon should be reported in this section.
References and Appendices
References should be provided and appendices are strongly advised to ensure the transparencyof submitted BIAs. The inclusion of information related to data inputs used in the model andreport will facilitate the assessment of each submission’s validity.
44 Budget Impact Analysis Guidelines
7

7.2 Interactive ModelSubmitted BIA models should include detailed descriptions and justification for all calculationsteps performed. Models should be presented as a series of clearly defined steps to facilitatemodel review.
When developing a model to perform a BIA, the simplest design that generates reasonableresults should be selected. For example, as BIAs do not consider the clinical impact of treatment,a disease model that employs more complex modeling techniques (e.g., Markov modeling)should not be required. In addition, the designed model should be built using a readily availablesoftware application, such as Microsoft Excel.
It is recommended that submitted BIA models be developed from the interactive BIA templateprovided with these guidelines. Analysts may modify the template to ensure that the final BIA iscalculated as accurately as possible based on available data while maintaining overall modeltransparency.
7.3 Additional Submission DetailsUse of Tables and Figures
Inclusion of graphical and / or tabular representations of the model structure, inputs and resultswill provide drug plan managers with a clearer vision of the structure and function of the budgetimpact model used to estimate a new drug’s future budget impact.
All provided reports should contain the following items:
• Schematic Representation of ModelA diagram that clearly explains the model’s function should be provided. Sample formatsinclude influence diagrams and decision tree structures. All schemas should be providedwith descriptive text. This diagram may be developed as a drug-specific adaptation of thediagrams provided in Appendix B and the BIA model template.
• Tables of Inputs and Outputs Listing the model inputs (along with their references) and outputs in tables provides reviewerswith an easily accessed summary of the model. These tables should be included in theInput data and data sources section of the report.
• Table of Limitations and Assumptions Listing the limitations and assumptions of the model improves its overall transparency. Thistable should be included in the Limitations and Assumptions sections of the report.
• Schematic Representation of Uncertainty Analysts are encouraged to use diagrams (such as Tornado diagrams) as an effective meansof presenting the variables with the greatest impact on the model’s results to BIA reviewers.These diagrams should be included in the Sensitivity Analysis section of the report.
45Budget Impact Analysis Guidelines
7
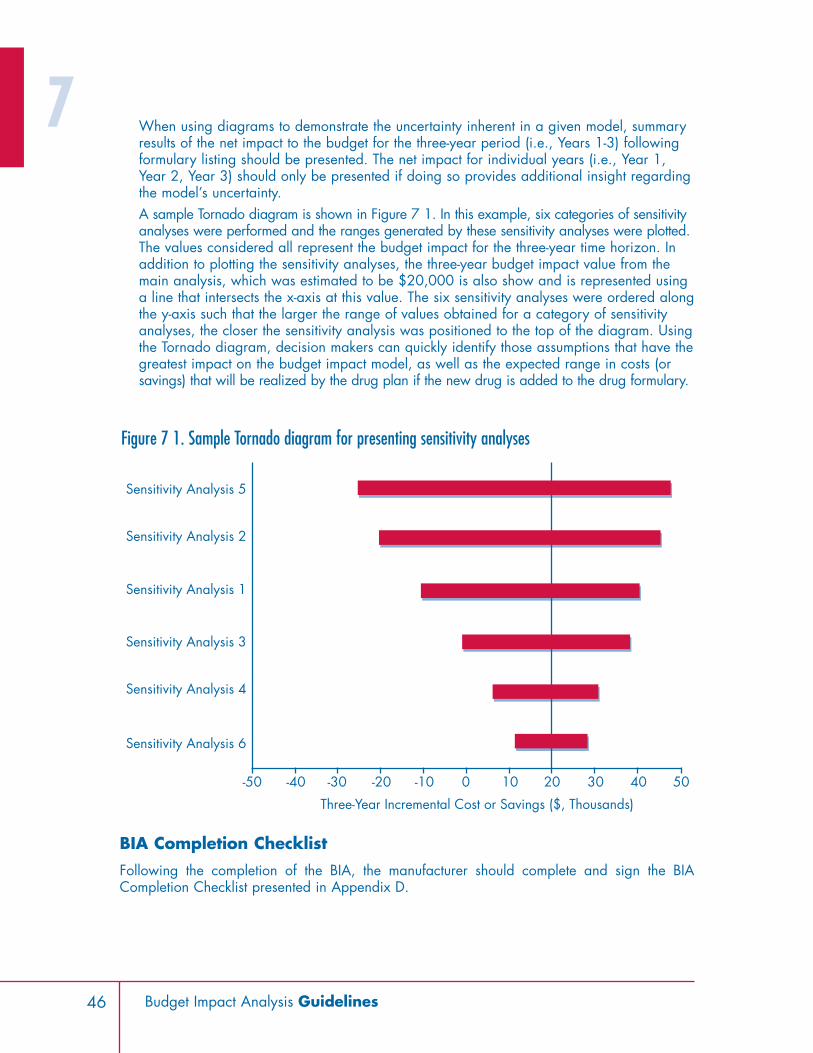
When using diagrams to demonstrate the uncertainty inherent in a given model, summaryresults of the net impact to the budget for the three-year period (i.e., Years 1-3) followingformulary listing should be presented. The net impact for individual years (i.e., Year 1,Year 2, Year 3) should only be presented if doing so provides additional insight regardingthe model’s uncertainty.A sample Tornado diagram is shown in Figure 7 1. In this example, six categories of sensitivityanalyses were performed and the ranges generated by these sensitivity analyses were plotted.The values considered all represent the budget impact for the three-year time horizon. Inaddition to plotting the sensitivity analyses, the three-year budget impact value from themain analysis, which was estimated to be $20,000 is also show and is represented usinga line that intersects the x-axis at this value. The six sensitivity analyses were ordered alongthe y-axis such that the larger the range of values obtained for a category of sensitivityanalyses, the closer the sensitivity analysis was positioned to the top of the diagram. Usingthe Tornado diagram, decision makers can quickly identify those assumptions that have thegreatest impact on the budget impact model, as well as the expected range in costs (orsavings) that will be realized by the drug plan if the new drug is added to the drug formulary.
BIA Completion Checklist
Following the completion of the BIA, the manufacturer should complete and sign the BIACompletion Checklist presented in Appendix D.
46 Budget Impact Analysis Guidelines
-50 -40 -20-30 -10 100 3020 5040
Sensitivity Analysis 6
Sensitivity Analysis 4
Sensitivity Analysis 3
Sensitivity Analysis 1
Sensitivity Analysis 2
Sensitivity Analysis 5
Three-Year Incremental Cost or Savings ($, Thousands)
Figure 7 1. Sample Tornado diagram for presenting sensitivity analyses
7
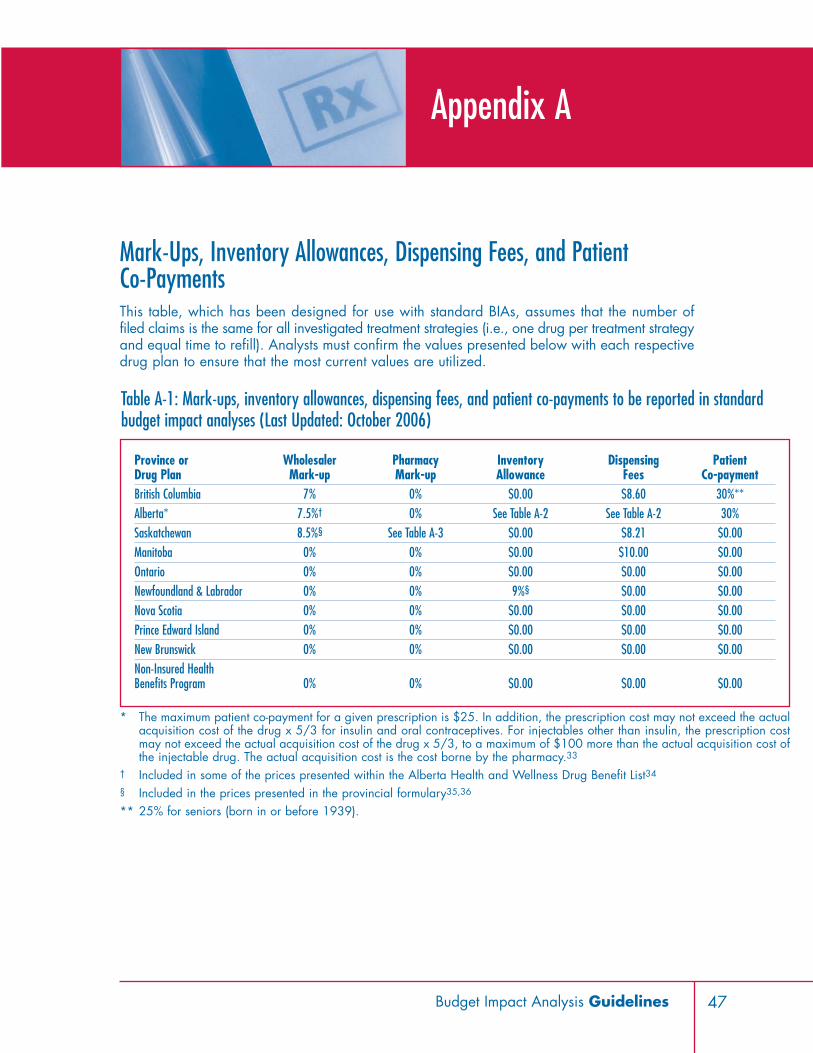
Mark-Ups, Inventory Allowances, Dispensing Fees, and Patient Co-PaymentsThis table, which has been designed for use with standard BIAs, assumes that the number offiled claims is the same for all investigated treatment strategies (i.e., one drug per treatment strategyand equal time to refill). Analysts must confirm the values presented below with each respectivedrug plan to ensure that the most current values are utilized.
47Budget Impact Analysis Guidelines
Appendix A
Province or Wholesaler Pharmacy Inventory Dispensing PatientDrug Plan Mark-up Mark-up Allowance Fees Co-paymentBritish Columbia 7% 0% $0.00 $8.60 30%**Alberta* 7.5%† 0% See Table A-2 See Table A-2 30%Saskatchewan 8.5%§ See Table A-3 $0.00 $8.21 $0.00Manitoba 0% 0% $0.00 $10.00 $0.00Ontario 0% 0% $0.00 $0.00 $0.00Newfoundland & Labrador 0% 0% 9%§ $0.00 $0.00Nova Scotia 0% 0% $0.00 $0.00 $0.00Prince Edward Island 0% 0% $0.00 $0.00 $0.00New Brunswick 0% 0% $0.00 $0.00 $0.00Non-Insured Health Benefits Program 0% 0% $0.00 $0.00 $0.00
* The maximum patient co-payment for a given prescription is $25. In addition, the prescription cost may not exceed the actualacquisition cost of the drug x 5/3 for insulin and oral contraceptives. For injectables other than insulin, the prescription costmay not exceed the actual acquisition cost of the drug x 5/3, to a maximum of $100 more than the actual acquisition cost ofthe injectable drug. The actual acquisition cost is the cost borne by the pharmacy.33
† Included in some of the prices presented within the Alberta Health and Wellness Drug Benefit List34
§ Included in the prices presented in the provincial formulary35,36
** 25% for seniors (born in or before 1939).
Table A-1: Mark-ups, inventory allowances, dispensing fees, and patient co-payments to be reported in standardbudget impact analyses (Last Updated: October 2006)
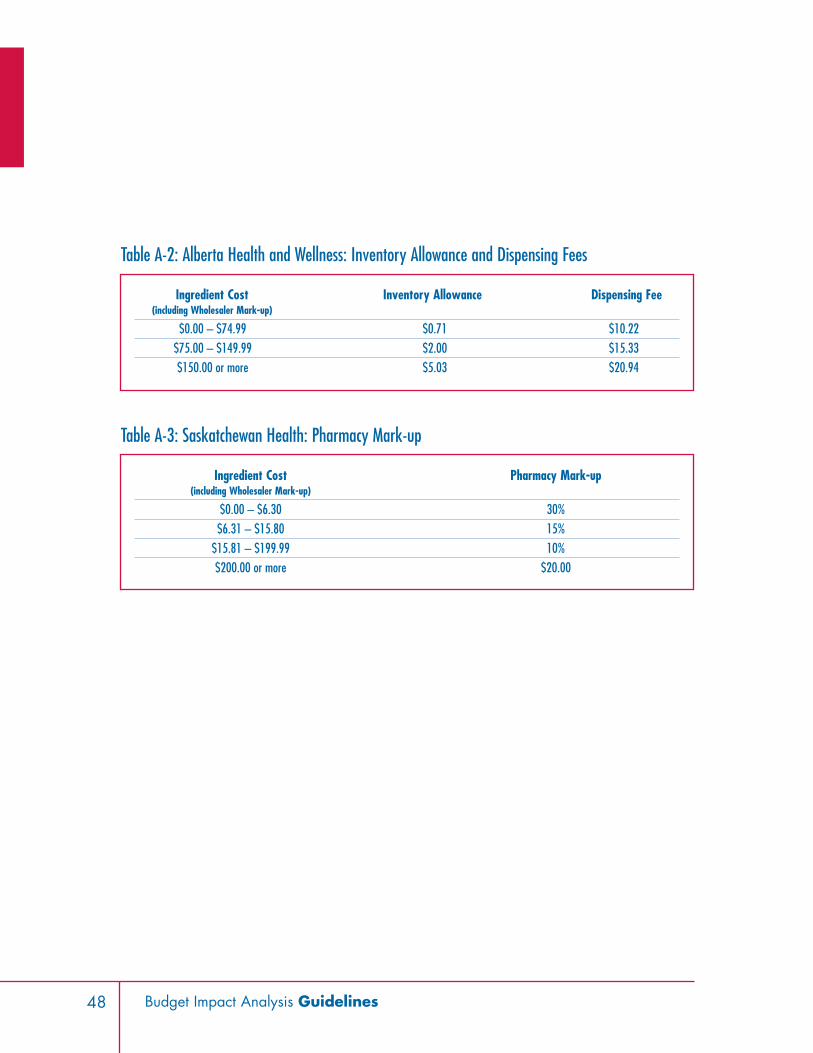
48 Budget Impact Analysis Guidelines
Ingredient Cost Inventory Allowance Dispensing Fee(including Wholesaler Mark-up)
$0.00 – $74.99 $0.71 $10.22$75.00 – $149.99 $2.00 $15.33$150.00 or more $5.03 $20.94
Table A-2: Alberta Health and Wellness: Inventory Allowance and Dispensing Fees
Ingredient Cost Pharmacy Mark-up (including Wholesaler Mark-up)
$0.00 – $6.30 30%$6.31 – $15.80 15%
$15.81 – $199.99 10%$200.00 or more $20.00
Table A-3: Saskatchewan Health: Pharmacy Mark-up

49Budget Impact Analysis Guidelines
Schematic Representations of Budget Impact Model Calculation andMarket Size Estimation
Appendix B
Budget Impact
Drug Costs
MarketDistribution
Market of Interest
Incremental Prescription Costs (Savings) over Reference Scenario
Historical market share distribution of relevant comparators
Reference Scenario New Drug Scenario
Forecasted market share distribution of all
relevant comparators
Forecasted market share distribution of all relevant comparators, including
the new drug
Cost per patientOR
Cost per claim
Cost per patientOR
Cost per claim
Direct Prescription Costs in Reference Scenario
Direct Prescription Costs in New Drug Scenario
Figure B-1. Calculation of Budget Impact
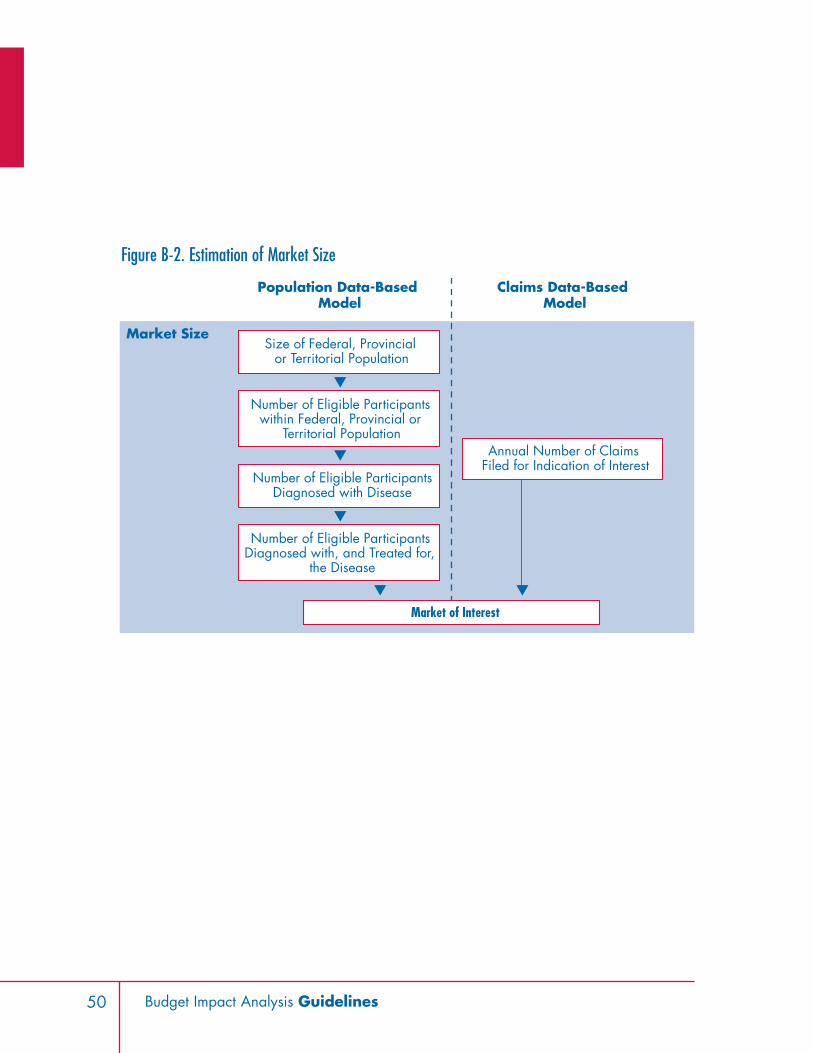
50 Budget Impact Analysis Guidelines
Market Size
Market of Interest
Population Data-Based Model
Claims Data-Based Model
Size of Federal, Provincial or Territorial Population
Number of Eligible ParticipantsDiagnosed with Disease
Number of Eligible Participants within Federal, Provincial or
Territorial Population
Number of Eligible Participants Diagnosed with, and Treated for,
the Disease
Annual Number of Claims Filed for Indication of Interest
Figure B-2. Estimation of Market Size

51Budget Impact Analysis Guidelines
Data Sources for Population Statistics and F/P/T Drug Plan EligibleParticipant Counts
Appendix C
Table C-1: Selected list of drug plan data (Last updated: April 2007)
F/P/T Drug Plan Eligible Participant Data Available CommentsBritish Columbia BC STATS: Population and Demographics,
http://www.bcstats.gov.bc.ca/data/pop/popstart.aspCalculated by subtracting the NIHBP population from thegeneral population.Assumes that all those who are eligible to enrol in theprogram participate in the program and that participantsin federal drug programs are negligible relative to theNIHBP population.
Alberta Alberta Ministry of Health and Wellness - Alberta Health CareInsurance Plan Statistical Supplement 2004/2005,http://www.health.gov.ab.ca/resources/publications.html
Saskatchewan Saskatchewan Health, http://www.health.gov.sk.ca/mc_publications_ar_archive.html
Calculated by subtracting the NIHBP population from thegeneral population.Assumes that all those who are eligible to enrol in theprogram participate in the program and that participantsin federal drug programs are negligible relative to theNIHBP population.
Manitoba Manitoba Health Annual Statistics 2003-2004,http://www.gov.mb.ca/health/annstats/200304/index.html
Calculated by subtracting the NIHBP population from thegeneral population.Assumes that all those who are eligible to enrol in theprogram participate in the program and that participantsin federal drug programs are negligible relative to theNIHBP population.
Ontario http://www.pmprb-cepmb.gc.ca/CMFiles/PTOR_June_0638MBI-6232006-5829.pdf
Data are not available by age.
Newfoundland &Labrador
Not currently available Active beneficiary data available athttp://www.ag.gov.nl.ca/ag/2005AnnualReport/CH2.11.pdf.
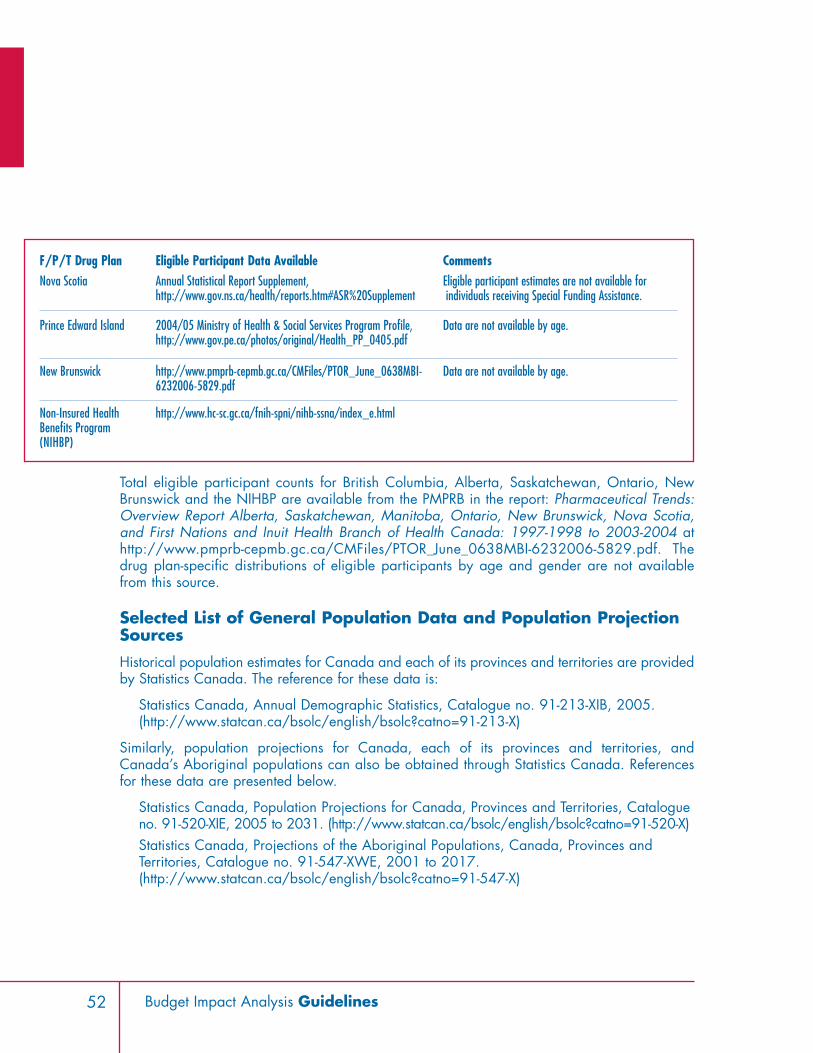
52 Budget Impact Analysis Guidelines
Total eligible participant counts for British Columbia, Alberta, Saskatchewan, Ontario, NewBrunswick and the NIHBP are available from the PMPRB in the report: Pharmaceutical Trends:Overview Report Alberta, Saskatchewan, Manitoba, Ontario, New Brunswick, Nova Scotia,and First Nations and Inuit Health Branch of Health Canada: 1997-1998 to 2003-2004 athttp://www.pmprb-cepmb.gc.ca/CMFiles/PTOR_June_0638MBI-6232006-5829.pdf. Thedrug plan-specific distributions of eligible participants by age and gender are not availablefrom this source.
Selected List of General Population Data and Population ProjectionSources
Historical population estimates for Canada and each of its provinces and territories are providedby Statistics Canada. The reference for these data is:
Statistics Canada, Annual Demographic Statistics, Catalogue no. 91-213-XIB, 2005.(http://www.statcan.ca/bsolc/english/bsolc?catno=91-213-X)
Similarly, population projections for Canada, each of its provinces and territories, andCanada’s Aboriginal populations can also be obtained through Statistics Canada. Referencesfor these data are presented below.
Statistics Canada, Population Projections for Canada, Provinces and Territories, Catalogueno. 91-520-XIE, 2005 to 2031. (http://www.statcan.ca/bsolc/english/bsolc?catno=91-520-X)Statistics Canada, Projections of the Aboriginal Populations, Canada, Provinces andTerritories, Catalogue no. 91-547-XWE, 2001 to 2017.(http://www.statcan.ca/bsolc/english/bsolc?catno=91-547-X)
F/P/T Drug Plan Eligible Participant Data Available CommentsNova Scotia Annual Statistical Report Supplement,
http://www.gov.ns.ca/health/reports.htm#ASR%20SupplementEligible participant estimates are not available forindividuals receiving Special Funding Assistance.
Prince Edward Island 2004/05 Ministry of Health & Social Services Program Profile,http://www.gov.pe.ca/photos/original/Health_PP_0405.pdf
Data are not available by age.
New Brunswick http://www.pmprb-cepmb.gc.ca/CMFiles/PTOR_June_0638MBI-6232006-5829.pdf
Data are not available by age.
Non-Insured HealthBenefits Program(NIHBP)
http://www.hc-sc.gc.ca/fnih-spni/nihb-ssna/index_e.html

BIA Completion Checklist Upon completion of the BIA, the ‘Checklist’ should be completed and signed.
❏ Data specific to each drug plan are used. ❏ Justification is provided where data specific to a drug plan have not been used. ❏ Projections are for a 3-year time horizon. ❏ Projections are for each F/P/T drug plan.❏ All relevant comparators are stated, including non-drug alternatives. ❏ All approved indications are listed, with recommended dosages and durations. ❏ Only relevant drug-based comparators are used for forecasting purposes.❏ Total treatment strategy cost/patient/year (or total treatment strategy cost/claim(s)/year) is
calculated, for each indication, based on recommended dose and using CURRENT pricingadjustment information for BIAs (i.e., mark-ups, inventory allowances, dispensing fees andpatient co-payments).
❏ Disease prevalence information, specific to F/P/T drug plans, is provided. ❏ Justification is provided where F/P/T specific data have not been used.
❏ Projected market share is reported as total number of patients (or claims), and percentageof total market.
❏ Market share is projected for 12 months from proposed listing date. ❏ Sources of market share, and proportion of market share from each source, are reported. ❏ Total drug costs are reported for F/P/T drug plans.
❏ Lowest cost alternative is used, where applicable. ❏ Projections are calculated using stated prevalence, market share and prescription costs. ❏ All assumptions are listed, and references cited.
❏ Net budget impact is reported for F/P/T drug plans. ❏ All assumptions are listed and references cited.
53Budget Impact Analysis Guidelines
Appendix D
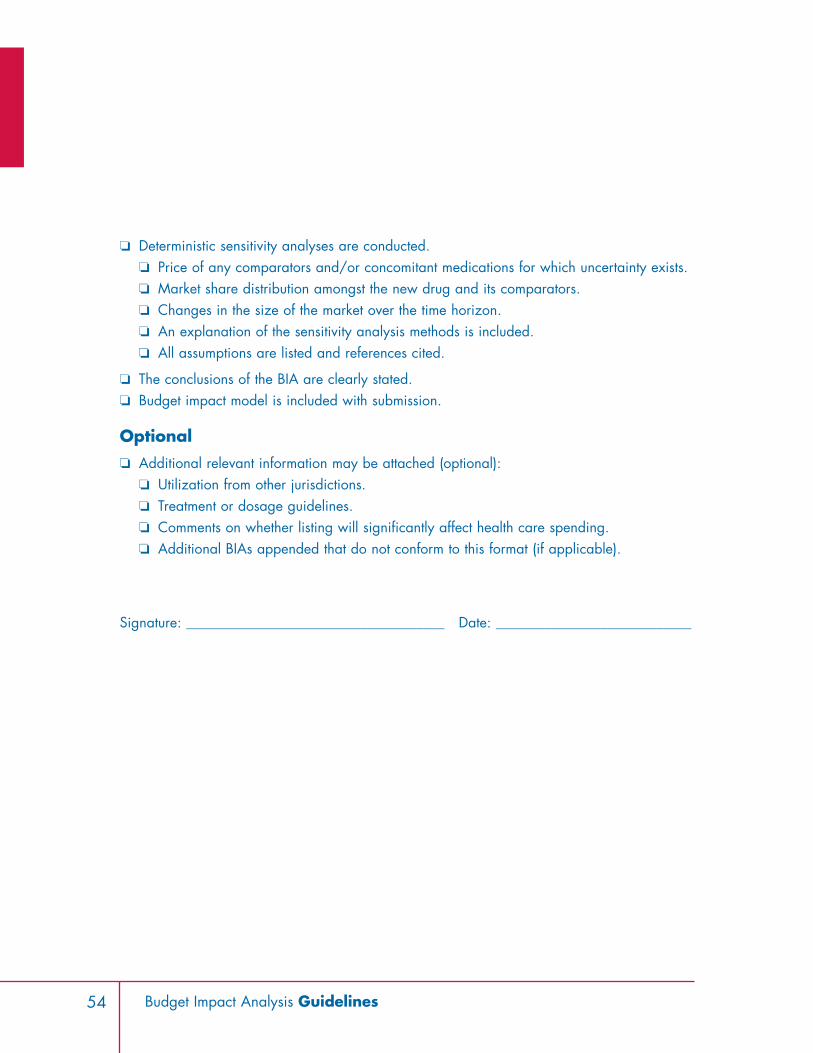
❏ Deterministic sensitivity analyses are conducted. ❏ Price of any comparators and/or concomitant medications for which uncertainty exists. ❏ Market share distribution amongst the new drug and its comparators.❏ Changes in the size of the market over the time horizon.❏ An explanation of the sensitivity analysis methods is included. ❏ All assumptions are listed and references cited.
❏ The conclusions of the BIA are clearly stated. ❏ Budget impact model is included with submission.
Optional
❏ Additional relevant information may be attached (optional): ❏ Utilization from other jurisdictions. ❏ Treatment or dosage guidelines. ❏ Comments on whether listing will significantly affect health care spending. ❏ Additional BIAs appended that do not conform to this format (if applicable).
Signature: _____________________________________ Date: ____________________________
54 Budget Impact Analysis Guidelines

55Budget Impact Analysis Guidelines
List of Terms and AbbreviationsActive beneficiary – An eligible participant who files a claim
Budget Impact Analysis or BIA – An analysis of the impact of a new drug product on drug planexpenditures
CADTH – Canadian Agency for Drugs and Technologies in Health
CDR – Common Drug Review
CSC – Correctional Service Canada
DIN – Drug Information Number
Discount rate – The amount by which future costs and benefits are adjusted to enable the compar-ison of different years with each other and with current costs and benefits
DND – Department of National Defence
Drug – An active substance considered to be a drug under the Canadian Food and Drugs Actand Regulations, which is sold for human use
Eligible participant – A person who is eligible for coverage by a given F/P/T drug plan
Ex-factory price – The price charged by the manufacturer for a particular drug
F/P/T – Federal, provincial and/or territorial
Formulary – A list of drugs that are covered as benefits as determined by each F/P/T drug plan
Inflation rate – The average change in the price of goods and services over a period of time
ISPOR – International Society For Pharmacoeconomics and Outcomes Research
Manufacturer – A drug manufacturer
New Drug – A new active substance that has not previously been marketed in Canada
NIHBP – Non-Insured Health Benefits Program
NPDUIS – National Prescription Drug Utilization Information System
PMPRB – Patented Medicines Prices Review Board
RCMP – Royal Canadian Mounted Police
Treatment strategy – One or more active substances used in combination for the treatment of amedical condition
VAC – Veterans Affairs Canada
Appendix E
56 Budget Impact Analysis Guidelines
1 Mauskopf JA, Sullivan SD, Annemans L, Caro JJ, Mullins CD, Nuijten M, Orlewska E, TruemanP, Watkins J. Principles of Good Practice for Budget Impact Analysis: Report of the ISPOR TaskForce on Good Research Practices – Budget Impact Analysis, Last accessed October 13, 2006at http://www.ispor.org/workpaper/BudgetImpactAnalysis/BIA_TF0906.asp.
2 Mauskopf JA, Sullivan SD, Annemans L, Caro JJ, Mullins CD, Nuijten M, Orlewska E,Trueman P, Watkins J. Principles of Good Practice for Budget Impact Analysis: Report ofthe ISPOR Task Force on Good Research Practices – Budget Impact Analysis, Lastaccessed October 13, 2006 athttp://www.ispor.org/workpaper/BudgetImpactAnalysis/BIA_TF0906.asp.
3 Patented Medicine Prices Review Board, National Prescription Drug UtilizationInformation System (NPDUIS), Last accessed October 13, 2006 at http://www.pmprb-cepmb.gc.ca/english/View.asp?x=116.
4 Budget Impact Analysis Guidelines: Needs Assessment, National Prescription DrugUtilization Information System (NPDUIS), 2005.
5 Commonwealth of Australia DoHaA. Guidelines for the Pharmaceutical Industry OnPreparation of Submissions to the Pharmaceutical Benefits Advisory Committee. 2002.Canberra, Commonwealth of Australia, Department of Health and Ageing.
6 Canadian Coordinating Office for Health Technology Assessment (CCOHTA). CommonDrug Review Submission Guidelines for Manufacturers. 7-25-2005. Ottawa, CanadianCoordinating Office for Health Technology Assessment (CCOHTA).
7 Alberta Health and Wellness, Budget Impact Assessment for the Alberta Health andWellness Drug Benefit List, Version 6: July 2006, Last accessed October 13, 2006 athttp://www.ab.bluecross.ca/dbl/pdfs/bia2006.pdf.
8 Manitoba Health, Budget Impact Assessment For The Manitoba Health Manitoba DrugBenefits and Interchangeability Formulary, Version 1.0: July 30, 2003, Last accessedOctober 13, 2006 at http://www.gov.mb.ca/health/documents/bia.doc.
9 Ontario Ministry of Health and Long-Term Care, Ontario Drug Benefits Program: OntarioGuidelines for Drug Submission and Evaluation, Last Modified: 08/16/2006 10:32:12,Last accessed October 13, 2006 athttp://www.health.gov.on.ca/english/providers/pub/drugs/dsguide/dsguide_mn.html.
10 National Institute for Clinical Excellence. Guide to the Methods of Technology Appraisal.2004.
11 Orlewska E, Mierzejewski P. Proposal of Polish guidelines for conducting financial analy-sis and their comparison to existing guidance on budget impact in other countries. ValueHealth 2004; 7(1):1-10.
References
12 Orlewska E, Mierzejewski P. Polish Guidelines for Conducting Financial Analysis (project).Farmakoekonomika 2002 Suplement 1: 6-8.
13 Academy of Managed Care Pharmacy. Format for Formulary Submissions. Academy ofManaged Care Pharmacy, editor. Version 2. 2002.
14 Canadian and International Guidance Regarding Budget Impact Analysis: A LiteratureReview, i3 Innovus, April 2006.
15 Mauskopf JA, Sullivan SD, Annemans L, Caro JJ, Mullins CD, Nuijten M, Orlewska E, TruemanP, Watkins J. Principles of Good Practice for Budget Impact Analysis: Report of the ISPOR TaskForce on Good Research Practices – Budget Impact Analysis, Last accessed October 13, 2006at http://www.ispor.org/workpaper/BudgetImpactAnalysis/BIA_TF0906.asp.
16 Alberta Health and Wellness, Budget Impact Assessment for the Alberta Health andWellness Drug Benefit List, Version 6: July 2006, Last accessed October 13, 2006 athttp://www.ab.bluecross.ca/dbl/pdfs/bia2006.pdf.
17 Manitoba Health, Budget Impact Assessment For The Manitoba Health Manitoba DrugBenefits and Interchangeability Formulary, Version 1.0: July 30, 2003, Last accessedOctober 13, 2006 at http://www.gov.mb.ca/health/documents/bia.doc.
18 Ontario Ministry of Health and Long-Term Care, Ontario Drug Benefits Program: OntarioGuidelines for Drug Submission and Evaluation, Last Modified: 08/16/2006 10:32:12,Last accessed October 13, 2006 athttp://www.health.gov.on.ca/english/providers/pub/drugs/dsguide/dsguide_mn.html.
19 Canadian Association for Pharmacy Distribution Management, 2005 Guidebook onGovernment Prescription Drug Reimbursement Plans and Related Programs, March 2005.
20 Budget Impact Analysis Guidelines: Needs Assessment, National Prescription DrugUtilization Information System (NPDUIS), 2005.
21 Alberta Health and Wellness, Budget Impact Assessment for the Alberta Health andWellness Drug Benefit List, Version 6: July 2006, Last accessed October 13, 2006 athttp://www.ab.bluecross.ca/dbl/pdfs/bia2006.pdf.
22 Manitoba Health, Budget Impact Assessment For The Manitoba Health Manitoba DrugBenefits and Interchangeability Formulary, Version 1.0: July 30, 2003, Last accessedOctober 13, 2006 at http://www.gov.mb.ca/health/documents/bia.doc.
23 Ontario Ministry of Health and Long-Term Care, Ontario Drug Benefits Program: OntarioGuidelines for Drug Submission and Evaluation, Last Modified: 08/16/2006 10:32:12,Last accessed October 13, 2006 athttp://www.health.gov.on.ca/english/providers/pub/drugs/dsguide/dsguide_mn.html.
57Budget Impact Analysis Guidelines
24 Canadian Agency for Drugs and Technologies in Health, Common Drug Review SubmissionGuidelines for Manufacturers, September 2006, Last accessed October 20, 2006 athttp://www.cadth.ca/media/cdr/process/CDR_SubmissionGuidelines_2006_Sept20.pdf
25 Weinstein MC, O’Brien B, Hornberger J, Jackson J, Johannesson M, McCabe C et al.Principles of good practice for decision analytic modeling in health-care evaluation:report of the ISPOR Task Force on Good Research Practices—Modeling Studies. ValueHealth 2003; 6(1):9-17.
26 Budget Impact Analysis Guidelines: Needs Assessment, National Prescription DrugUtilization Information System (NPDUIS), 2005.
27 Robin Burns, Alberta Health and Wellness, personal communication, September 15, 2006.
28 Saskatchewan Health, Drug Plan Formulary, 56th edition, Last accessed October 13, 2006at http://formulary.drugplan.health.gov.sk.ca/publications/Formularyv56.pdf.
29 Health and Community Services, Government of Newfoundland and Labrador,Introduction to the Newfoundland and Labrador Interchangeable Drug Products Formulary,Last accessed October 13, 2006 at http://www.health.gov.nl.ca/health/nlpdp/intro.htm.
30 Canadian Pharmacists Association, e-CPS, Last accessed April 5, 2007 athttps://www.e-therapeutics.ca/wps/portal/!ut/p/.scr/Login.
31 Canadian Association for Pharmacy Distribution Management, 2005 Guidebook onGovernment Prescription Drug Reimbursement Plans and Related Programs, March 2005.
32 Mauskopf JA, Sullivan SD, Annemans L, Caro JJ, Mullins CD, Nuijten M, Orlewska E, TruemanP, Watkins J. Principles of Good Practice for Budget Impact Analysis: Report of the ISPOR TaskForce on Good Research Practices – Budget Impact Analysis, Last accessed October 13, 2006at http://www.ispor.org/workpaper/BudgetImpactAnalysis/BIA_TF0906.asp.
33 Alberta Health and Wellness, Budget Impact Assessment for the Alberta Health andWellness Drug Benefit List, Version 6: July 2006, Last accessed October 13, 2006 athttp://www.ab.bluecross.ca/dbl/pdfs/bia2006.pdf.
34 Robin Burns, Alberta Health and Wellness, personal communication, September 15, 2006.
35 Saskatchewan Health, Drug Plan Formulary, 56th edition, Last accessed October 13,2006 at http://formulary.drugplan.health.gov.sk.ca/publications/Formularyv56.pdf.
36 Health and Community Services, Government of Newfoundland and Labrador, Introductionto the Newfoundland and Labrador Interchangeable Drug Products Formulary, Lastaccessed October 13, 2006 at http://www.health.gov.nl.ca/health/nlpdp/intro.htm.
58 Budget Impact Analysis Guidelines