PLUG-IN - sci.brooklyn.cuny.edufirat/mis/PlugInT02.pdfThis plug-in introduces the basics of using...
22
T2-2 Plug-In T2 Basic Skills Using Excel * PLUG-IN T2 Basic Skills Using Excel 1. Describe how to open, close, and save an Excel workbook. 2. Explain how to insert and delete an Excel worksheet. 3. Describe how to insert, delete, merge, and split cells in an Excel worksheet. 4. Explain how to set up a worksheet in Excel for printing. 5. Describe how to insert and delete rows and columns in an Excel worksheet. 6. Explain how to create and edit formulas in Excel using the formula bar. 7. Describe how to create a chart using Excel. Introduction to Excel Microsoft Excel is a spreadsheet program that enables you to enter, manipulate, calcu- late, and chart data. An Excel file is referred to as a workbook, which is a collection of worksheets. Each worksheet is comprised of rows and columns of data that you can perform calculations on. It is these calculations that make Excel such a powerful tool. You can use Excel for a wide variety of purposes, from calculating payments for a personal loan, to creating a personal budget, to tracking employee sales and calcu- lating bonuses for your business. This plug-in introduces the basics of using Excel. It is designed to show you the nuts and bolts, along with a few fancy features, to get you off to a good start using the pro- gram. However, you should review the CD, MISource, which accompanies this text for additional material, animated tutorials, and simulated practice files that go beyond what we cover in the text. Figure T2.1 displays all the tasks and lessons that are provid- ed on the MISource CD. This plug-in will focus on the following six areas: 1. Workbooks and worksheets. 2. Working with cells and cell data. 3. Printing worksheets. 4. Formatting worksheets. 5. Formulas. 6. Working with charts and graphics. LEARNING OUTCOMES
Transcript of PLUG-IN - sci.brooklyn.cuny.edufirat/mis/PlugInT02.pdfThis plug-in introduces the basics of using...
T2-2 Plug-In T2 Basic Skills Using Excel*
P L U G - I N
T2 Basic Skills Using Excel
1. Describe how to open, close, and save an Excel workbook.
2. Explain how to insert and delete an Excel worksheet.
3. Describe how to insert, delete, merge, and split cells in an Excel worksheet.
4. Explain how to set up a worksheet in Excel for printing.
5. Describe how to insert and delete rows and columns in an Excel worksheet.
6. Explain how to create and edit formulas in Excel using the formula bar.
7. Describe how to create a chart using Excel.
Introduction to ExcelMicrosoft Excel is a spreadsheet program that enables you to enter, manipulate, calcu-late, and chart data. An Excel file is referred to as a workbook, which is a collection ofworksheets. Each worksheet is comprised of rows and columns of data that you canperform calculations on. It is these calculations that make Excel such a powerful tool.
You can use Excel for a wide variety of purposes, from calculating payments for apersonal loan, to creating a personal budget, to tracking employee sales and calcu-lating bonuses for your business.
This plug-in introduces the basics of using Excel. It is designed to show you the nutsand bolts, along with a few fancy features, to get you off to a good start using the pro-gram. However, you should review the CD, MISource, which accompanies this text foradditional material, animated tutorials, and simulated practice files that go beyondwhat we cover in the text. Figure T2.1 displays all the tasks and lessons that are provid-ed on the MISource CD. This plug-in will focus on the following six areas:
1. Workbooks and worksheets.
2. Working with cells and cell data.
3. Printing worksheets.
4. Formatting worksheets.
5. Formulas.
6. Working with charts and graphics.
LEARNING OUTCOMES
haa23684_PlugInT2CD.qxd 9/26/06 7:28 PM Page 2

Plug-In T2 Basic Skills Using Excel T2-3*
*
FIGURE T2.1
MISource Excel Lessons
(Continued)
MISource CD Microsoft Excel Lessons
Introduction to Excel Printing Worksheets
■ Introduction to Excel 2003 ■ Setting up the page for printing
■ Opening and closing workbooks ■ Setting up margins for printing
■ Creating workbooks ■ Setting up the sheet for printing
■ Using templates ■ Setting and clearing the print area
■ Creating folders for saving workbooks ■ Previewing a print area
■ Saving a workbook in a new format ■ Printing selections, worksheets, and
■ Using the research tool workbooks
Managing Workbooks Analyzing Data
■ Inserting worksheets ■ Using Autofilter
■ Deleting worksheets ■ Creating and sorting lists
■ Hiding and unhiding worksheets ■ Adding functions to formulas using the
■ Moving and copying worksheets Autosum button
■ Formatting worksheets ■ Entering formulas
■ Splitting and arranging workbooks ■ Creating and editing formulas using the
■ Arranging and hiding/unhiding formula bar
■ Entering a range in a formula by dragging
■ Using absolute and relative references
■ Using the insert function feature
■ Creating formulas using the SUM function
■ Creating formulas using the MIN and MAX functions
■ Creating formulas using the DATE or NOW function
■ Creating formulas using the PMT function
■ Creating formulas using the IF function
Working with Cells and Cell Data Working with Charts and Graphics
■ Inserting cells ■ Creating a chart using the chart wizard
■ Deleting cells ■ Modifying charts
■ Merging and splitting cells ■ Moving a chart
■ Cutting, copying and pasting cells ■ Adding graphics
■ Moving selected cells using ■ Modifying graphic propertiesdrag-and-drop ■ Positioning graphics
■ Entering text in cells
■ Using the fill handle tool editing text in cells
■ Clearing cell content
■ Finding and replacing cell content
■ Using go to
■ Finding and replacing formatting in cells
■ Changing the look of cells
■ Using format painter
■ Applying number formats
■ Applying styles
haa23684_PlugInT2CD.qxd 9/26/06 7:28 PM Page 3

Workbooks and WorksheetsOpening a file retrieves it from storage and displays it on your computer screen. Toopen an existing workbook:
1. Click the Open button on the standard toolbar.
2. The Open dialog box appears; make sure the location in the Look in: box is correct.
3. Select the workbook name in the large list box.
4. Click the Open button in the dialog box (see Figure T2.2).
Closing a workbook removes it from your computer screen and stores the lastsaved version for future use. If you have not saved your latest changes, Excel pre-vents you from losing work by displaying a dialog box that asks if you want to savethe changes you made before closing. You must click one of the three options in thedialog box before Excel will close the workbook.
To close a workbook and save your latest changes:
1. Click Close Window on the menu bar. Be carefulnot to click the Close button above the Close Win-dow button; they look the same, but the Close but-ton will exit the application.
2. Click Yes in the dialog box.
When the Open dialog box appears, the last locationyou used appears as the default location in the box. Ifthis is not the location of the workbook you want, clickthe up one level button to the right of the Look in: boxuntil the correct location is displayed (you may have todouble-click a different folder or drive). Another methodis to click the arrow to open the drop-down list, whichdisplays different drives. Next, click the desired driveand double-click folders until you see your workbookname in the large list box.
If you have made no changes since the last time yousaved the workbook, it will close immediately. Ifchanges have been made, Excel displays a dialog boxasking if you want to save the changes you made be-fore closing. Click Yes to save the changes. Click No to
T2-4 Plug-In T2 Basic Skills Using Excel*
FIGURE T2.2
Opening a Workbook
Verify the location inthe Look in: box.
Click the workbook inthe list box.
Click here to Open theworkbook.
FIGURE T2.1
(Continued)MISource CD Microsoft Excel Lessons
Formatting Worksheets Workgroup Collaboration
■ Inserting rows and columns ■ Using Web page preview
■ Deleting rows and columns ■ Saving worksheets as Web pages
■ Hiding and unhiding rows and columns ■ Inserting and editing hyperlinks
■ Freezing and unfreezing rows and ■ Adding comments
columns modifying row heights ■ Editing comments
■ Modifying column widths
■ Changing alignment
■ Applying an autoformat
■ Changing worksheet orientation
■ Adding headers and footers
haa23684_PlugInT2CD.qxd 9/26/06 7:28 PM Page 4
close the workbook without saving your latest changes. Click Cancel to keep theworkbook open.
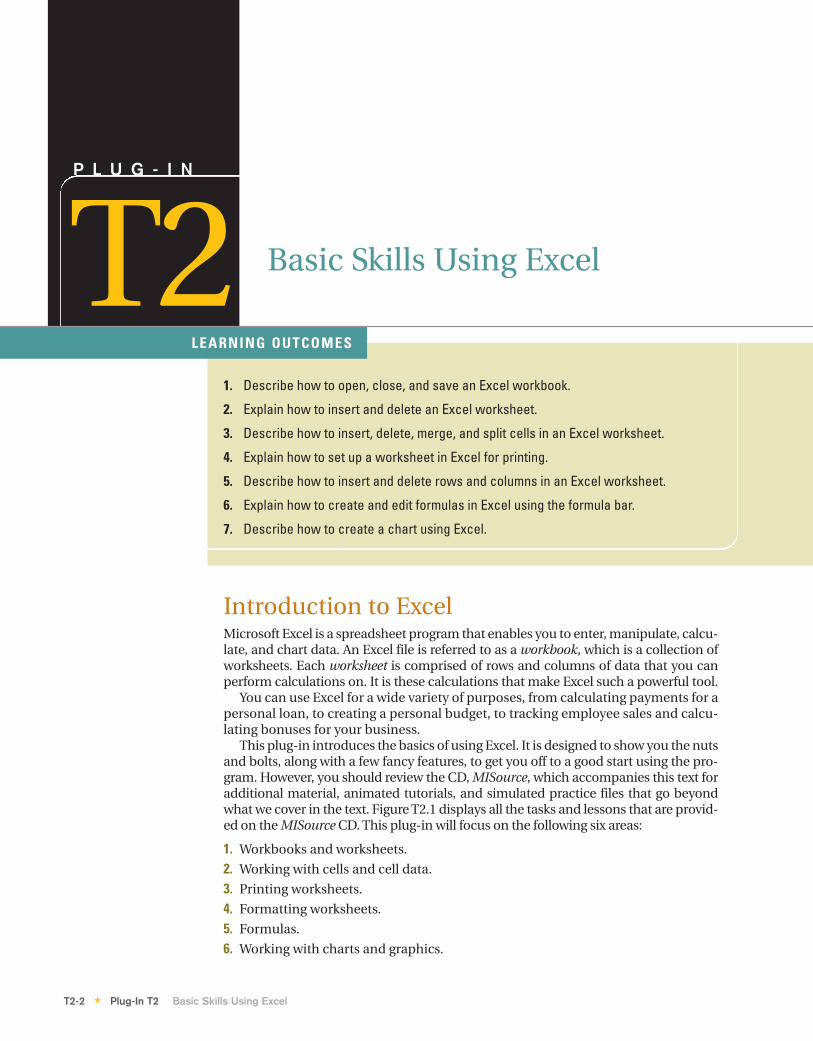
CREATING WORKBOOKS USING TEMPLATES
A template is a file with predefined settings that you can use as a starting point foryour workbook. An Excel template makes creating a new workbook easy and resultsin a professional appearance. Some examples of workbook templates are BalanceSheet, Sales Invoice, and Loan Amortization.
To create a workbook using a template:
1. Click New... on the File menu.
2. Click On my computer... in the Templates area of the New Workbook task pane.
3. Click the Spreadsheet Solutions tab in the Templates dialog box.
4. Click a template icon to see a preview in the right pane (see Figure T2.3).
5. Click OK.
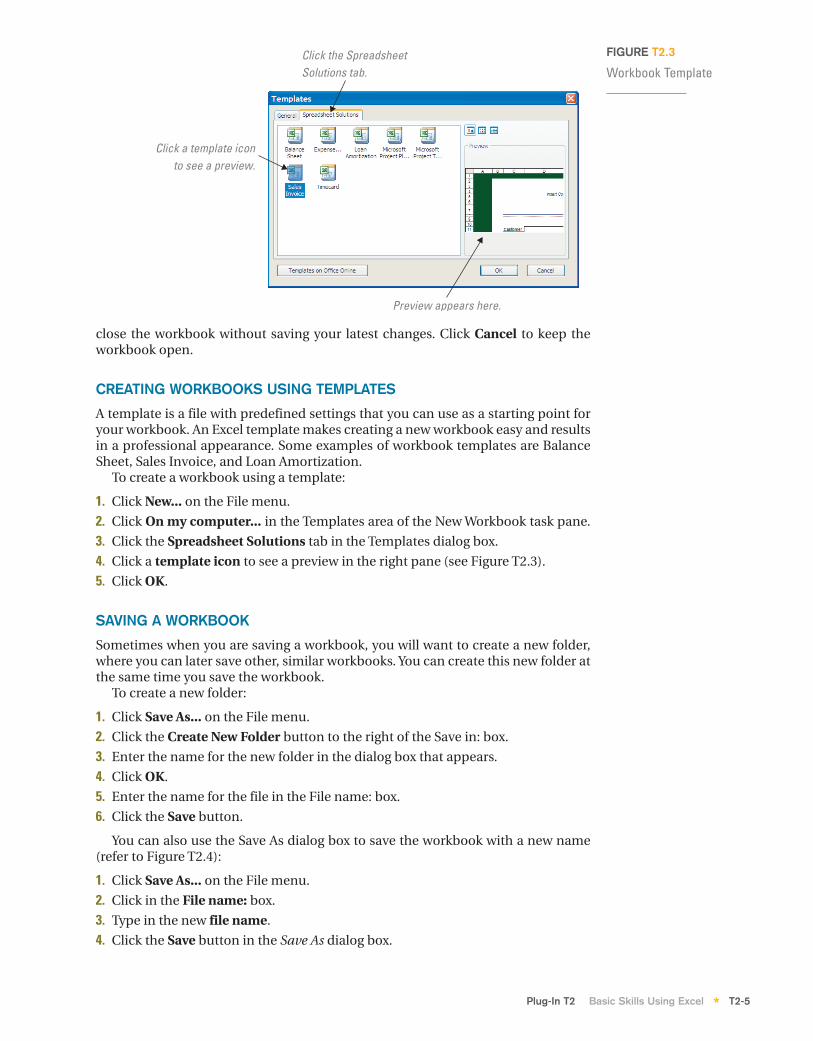
SAVING A WORKBOOK
Sometimes when you are saving a workbook, you will want to create a new folder,where you can later save other, similar workbooks. You can create this new folder atthe same time you save the workbook.
To create a new folder:
1. Click Save As... on the File menu.
2. Click the Create New Folder button to the right of the Save in: box.
3. Enter the name for the new folder in the dialog box that appears.
4. Click OK.
5. Enter the name for the file in the File name: box.
6. Click the Save button.
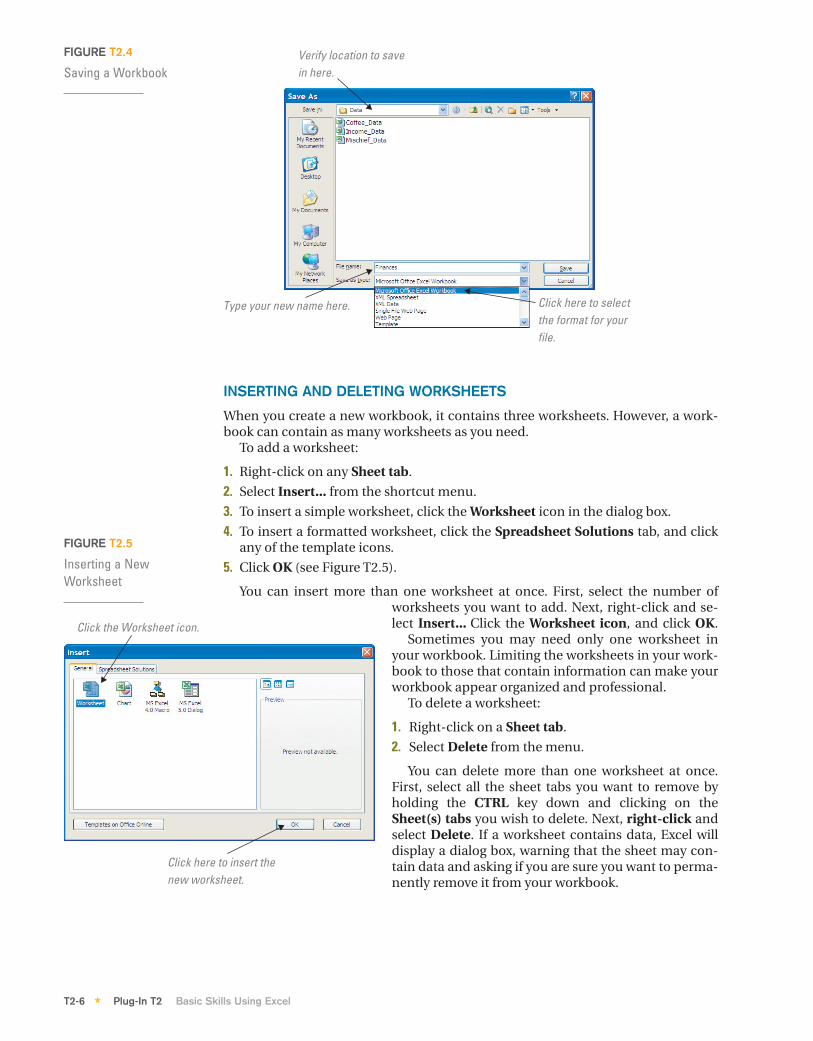
You can also use the Save As dialog box to save the workbook with a new name(refer to Figure T2.4):
1. Click Save As... on the File menu.
2. Click in the File name: box.
3. Type in the new file name.
4. Click the Save button in the Save As dialog box.
Plug-In T2 Basic Skills Using Excel T2-5*
FIGURE T2.3
Workbook TemplateClick the SpreadsheetSolutions tab.
Click a template iconto see a preview.
Preview appears here.
haa23684_PlugInT2CD.qxd 9/26/06 7:28 PM Page 5
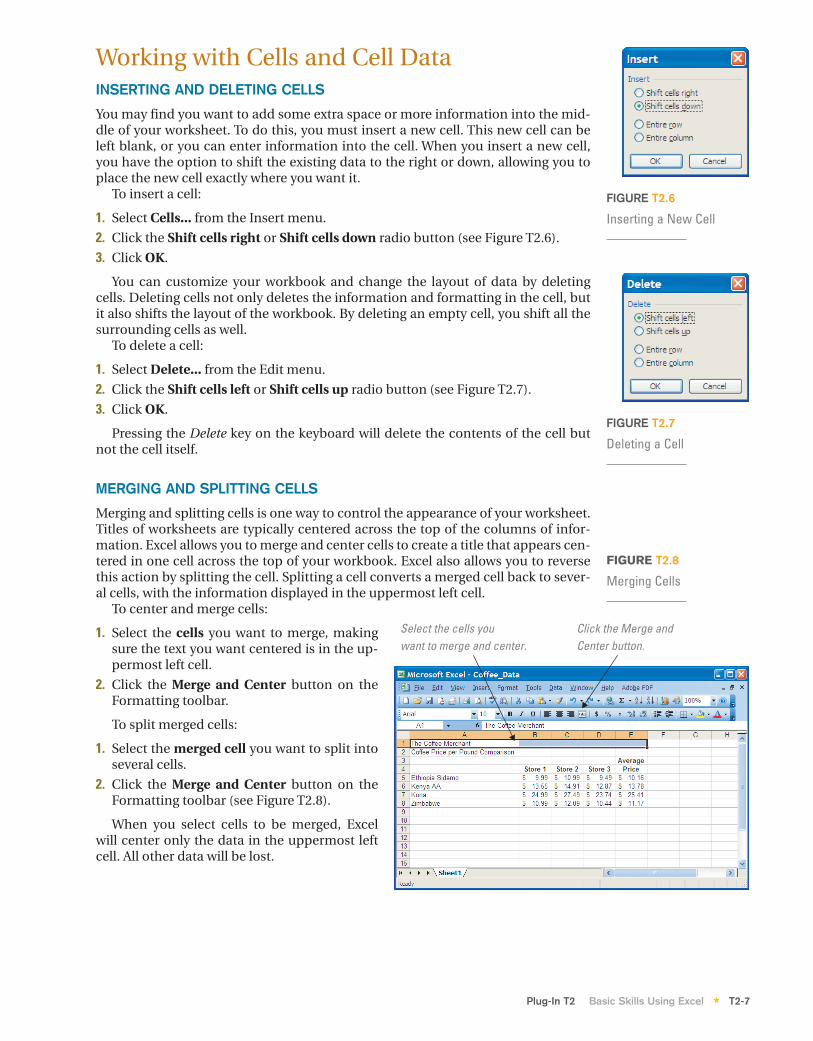
INSERTING AND DELETING WORKSHEETS
When you create a new workbook, it contains three worksheets. However, a work-book can contain as many worksheets as you need.
To add a worksheet:
1. Right-click on any Sheet tab.
2. Select Insert... from the shortcut menu.
3. To insert a simple worksheet, click the Worksheet icon in the dialog box.
4. To insert a formatted worksheet, click the Spreadsheet Solutions tab, and clickany of the template icons.
5. Click OK (see Figure T2.5).
You can insert more than one worksheet at once. First, select the number ofworksheets you want to add. Next, right-click and se-lect Insert... Click the Worksheet icon, and click OK.
Sometimes you may need only one worksheet inyour workbook. Limiting the worksheets in your work-book to those that contain information can make yourworkbook appear organized and professional.
To delete a worksheet:
1. Right-click on a Sheet tab.
2. Select Delete from the menu.
You can delete more than one worksheet at once.First, select all the sheet tabs you want to remove byholding the CTRL key down and clicking on theSheet(s) tabs you wish to delete. Next, right-click andselect Delete. If a worksheet contains data, Excel willdisplay a dialog box, warning that the sheet may con-tain data and asking if you are sure you want to perma-nently remove it from your workbook.
T2-6 Plug-In T2 Basic Skills Using Excel*
FIGURE T2.4
Saving a WorkbookVerify location to savein here.
Type your new name here. Click here to selectthe format for yourfile.
FIGURE T2.5
Inserting a NewWorksheet
Click the Worksheet icon.
Click here to insert thenew worksheet.
haa23684_PlugInT2CD.qxd 9/26/06 7:28 PM Page 6
Working with Cells and Cell DataINSERTING AND DELETING CELLS
You may find you want to add some extra space or more information into the mid-dle of your worksheet. To do this, you must insert a new cell. This new cell can beleft blank, or you can enter information into the cell. When you insert a new cell,you have the option to shift the existing data to the right or down, allowing you toplace the new cell exactly where you want it.
To insert a cell:
1. Select Cells... from the Insert menu.
2. Click the Shift cells right or Shift cells down radio button (see Figure T2.6).
3. Click OK.
You can customize your workbook and change the layout of data by deletingcells. Deleting cells not only deletes the information and formatting in the cell, butit also shifts the layout of the workbook. By deleting an empty cell, you shift all thesurrounding cells as well.
To delete a cell:
1. Select Delete... from the Edit menu.
2. Click the Shift cells left or Shift cells up radio button (see Figure T2.7).
3. Click OK.
Pressing the Delete key on the keyboard will delete the contents of the cell butnot the cell itself.
MERGING AND SPLITTING CELLS
Merging and splitting cells is one way to control the appearance of your worksheet.Titles of worksheets are typically centered across the top of the columns of infor-mation. Excel allows you to merge and center cells to create a title that appears cen-tered in one cell across the top of your workbook. Excel also allows you to reversethis action by splitting the cell. Splitting a cell converts a merged cell back to sever-al cells, with the information displayed in the uppermost left cell.
To center and merge cells:
1. Select the cells you want to merge, makingsure the text you want centered is in the up-permost left cell.
2. Click the Merge and Center button on theFormatting toolbar.
To split merged cells:
1. Select the merged cell you want to split intoseveral cells.
2. Click the Merge and Center button on theFormatting toolbar (see Figure T2.8).
When you select cells to be merged, Excelwill center only the data in the uppermost leftcell. All other data will be lost.
Plug-In T2 Basic Skills Using Excel T2-7*
FIGURE T2.6
Inserting a New Cell
FIGURE T2.7
Deleting a Cell
FIGURE T2.8
Merging Cells
Select the cells youwant to merge and center.
Click the Merge andCenter button.
haa23684_PlugInT2CD.qxd 9/26/06 7:28 PM Page 7
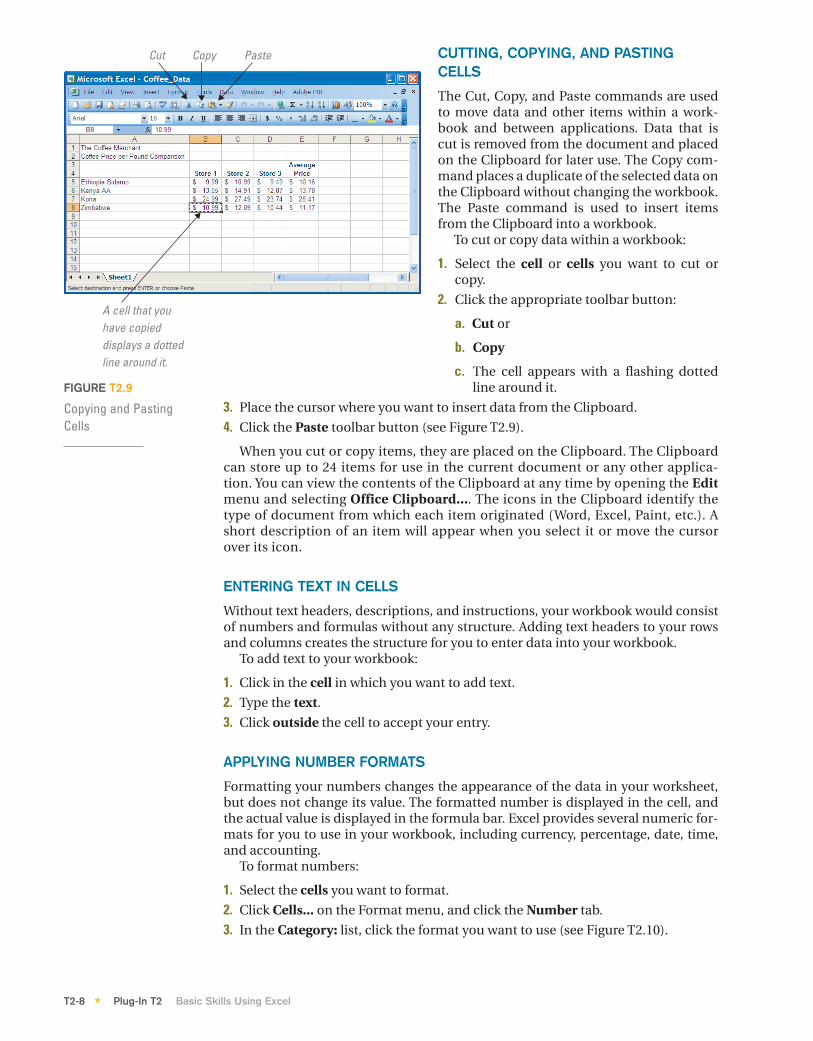
CUTTING, COPYING, AND PASTINGCELLS
The Cut, Copy, and Paste commands are usedto move data and other items within a work-book and between applications. Data that iscut is removed from the document and placedon the Clipboard for later use. The Copy com-mand places a duplicate of the selected data onthe Clipboard without changing the workbook.The Paste command is used to insert itemsfrom the Clipboard into a workbook.
To cut or copy data within a workbook:
1. Select the cell or cells you want to cut orcopy.
2. Click the appropriate toolbar button:
a. Cut or
b. Copy
c. The cell appears with a flashing dottedline around it.
3. Place the cursor where you want to insert data from the Clipboard.
4. Click the Paste toolbar button (see Figure T2.9).
When you cut or copy items, they are placed on the Clipboard. The Clipboardcan store up to 24 items for use in the current document or any other applica-tion. You can view the contents of the Clipboard at any time by opening the Editmenu and selecting Office Clipboard.... The icons in the Clipboard identify thetype of document from which each item originated (Word, Excel, Paint, etc.). Ashort description of an item will appear when you select it or move the cursorover its icon.
ENTERING TEXT IN CELLS
Without text headers, descriptions, and instructions, your workbook would consistof numbers and formulas without any structure. Adding text headers to your rowsand columns creates the structure for you to enter data into your workbook.
To add text to your workbook:
1. Click in the cell in which you want to add text.
2. Type the text.
3. Click outside the cell to accept your entry.
APPLYING NUMBER FORMATS
Formatting your numbers changes the appearance of the data in your worksheet,but does not change its value. The formatted number is displayed in the cell, andthe actual value is displayed in the formula bar. Excel provides several numeric for-mats for you to use in your workbook, including currency, percentage, date, time,and accounting.
To format numbers:
1. Select the cells you want to format.
2. Click Cells... on the Format menu, and click the Number tab.
3. In the Category: list, click the format you want to use (see Figure T2.10).
T2-8 Plug-In T2 Basic Skills Using Excel*
FIGURE T2.9
Copying and Pasting Cells
Cut Copy Paste
A cell that youhave copieddisplays a dottedline around it.
haa23684_PlugInT2CD.qxd 9/26/06 7:28 PM Page 8
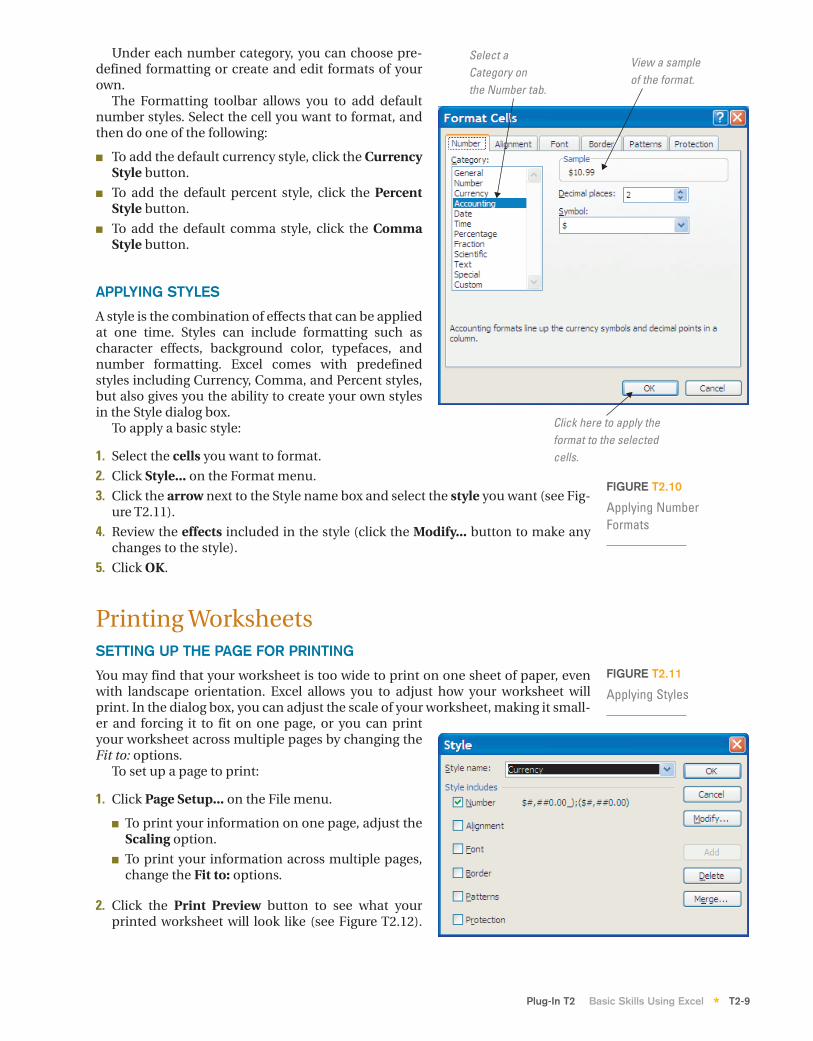
Under each number category, you can choose pre-defined formatting or create and edit formats of yourown.
The Formatting toolbar allows you to add defaultnumber styles. Select the cell you want to format, andthen do one of the following:
■ To add the default currency style, click the CurrencyStyle button.
■ To add the default percent style, click the PercentStyle button.
■ To add the default comma style, click the CommaStyle button.
APPLYING STYLES
A style is the combination of effects that can be appliedat one time. Styles can include formatting such ascharacter effects, background color, typefaces, andnumber formatting. Excel comes with predefinedstyles including Currency, Comma, and Percent styles,but also gives you the ability to create your own stylesin the Style dialog box.
To apply a basic style:
1. Select the cells you want to format.
2. Click Style... on the Format menu.
3. Click the arrow next to the Style name box and select the style you want (see Fig-ure T2.11).
4. Review the effects included in the style (click the Modify... button to make anychanges to the style).
5. Click OK.
Printing WorksheetsSETTING UP THE PAGE FOR PRINTING
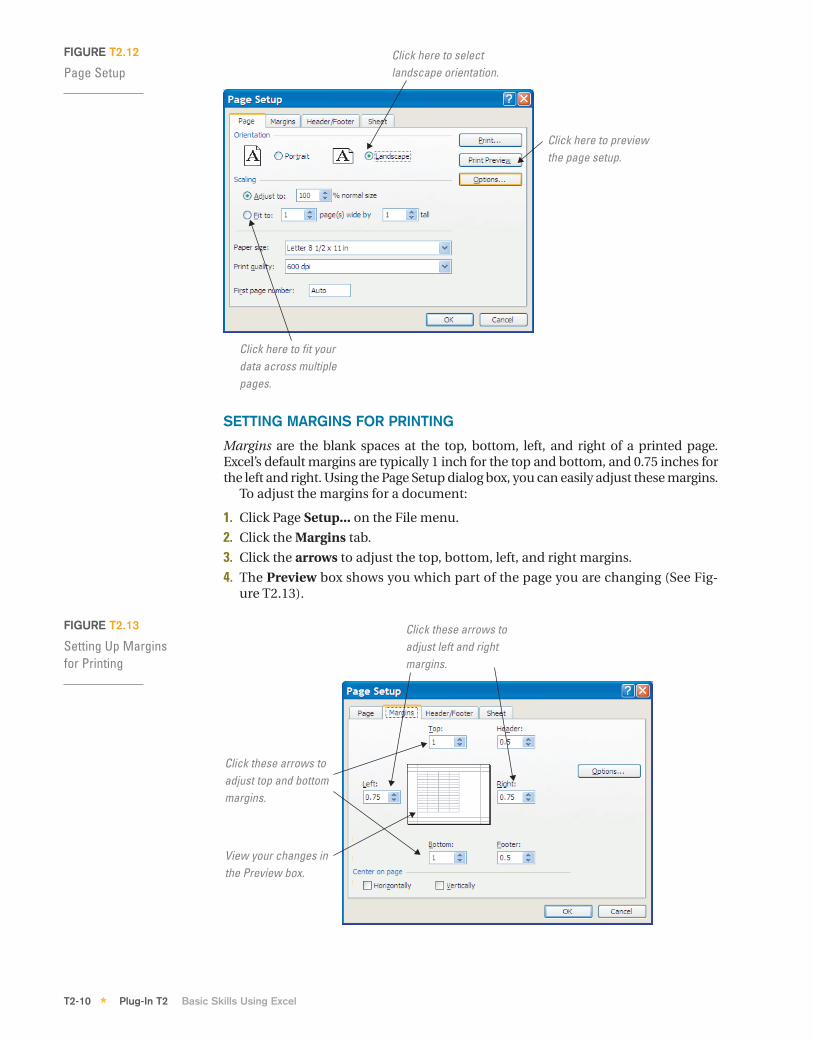
You may find that your worksheet is too wide to print on one sheet of paper, evenwith landscape orientation. Excel allows you to adjust how your worksheet willprint. In the dialog box, you can adjust the scale of your worksheet, making it small-er and forcing it to fit on one page, or you can printyour worksheet across multiple pages by changing theFit to: options.
To set up a page to print:
1. Click Page Setup... on the File menu.
■ To print your information on one page, adjust theScaling option.
■ To print your information across multiple pages,change the Fit to: options.
2. Click the Print Preview button to see what yourprinted worksheet will look like (see Figure T2.12).
Plug-In T2 Basic Skills Using Excel T2-9*
FIGURE T2.10
Applying Number Formats
Select aCategory onthe Number tab.
View a sampleof the format.
Click here to apply theformat to the selectedcells.
FIGURE T2.11
Applying Styles
haa23684_PlugInT2CD.qxd 9/26/06 7:28 PM Page 9
SETTING MARGINS FOR PRINTING
Margins are the blank spaces at the top, bottom, left, and right of a printed page.Excel’s default margins are typically 1 inch for the top and bottom, and 0.75 inches forthe left and right. Using the Page Setup dialog box, you can easily adjust these margins.
To adjust the margins for a document:
1. Click Page Setup... on the File menu.
2. Click the Margins tab.
3. Click the arrows to adjust the top, bottom, left, and right margins.
4. The Preview box shows you which part of the page you are changing (See Fig-ure T2.13).
T2-10 Plug-In T2 Basic Skills Using Excel*
FIGURE T2.12
Page SetupClick here to selectlandscape orientation.
Click here to previewthe page setup.
Click here to fit yourdata across multiplepages.
FIGURE T2.13
Setting Up Margins for Printing
Click these arrows toadjust left and rightmargins.
Click these arrows toadjust top and bottommargins.
View your changes inthe Preview box.
haa23684_PlugInT2CD.qxd 9/26/06 7:28 PM Page 10
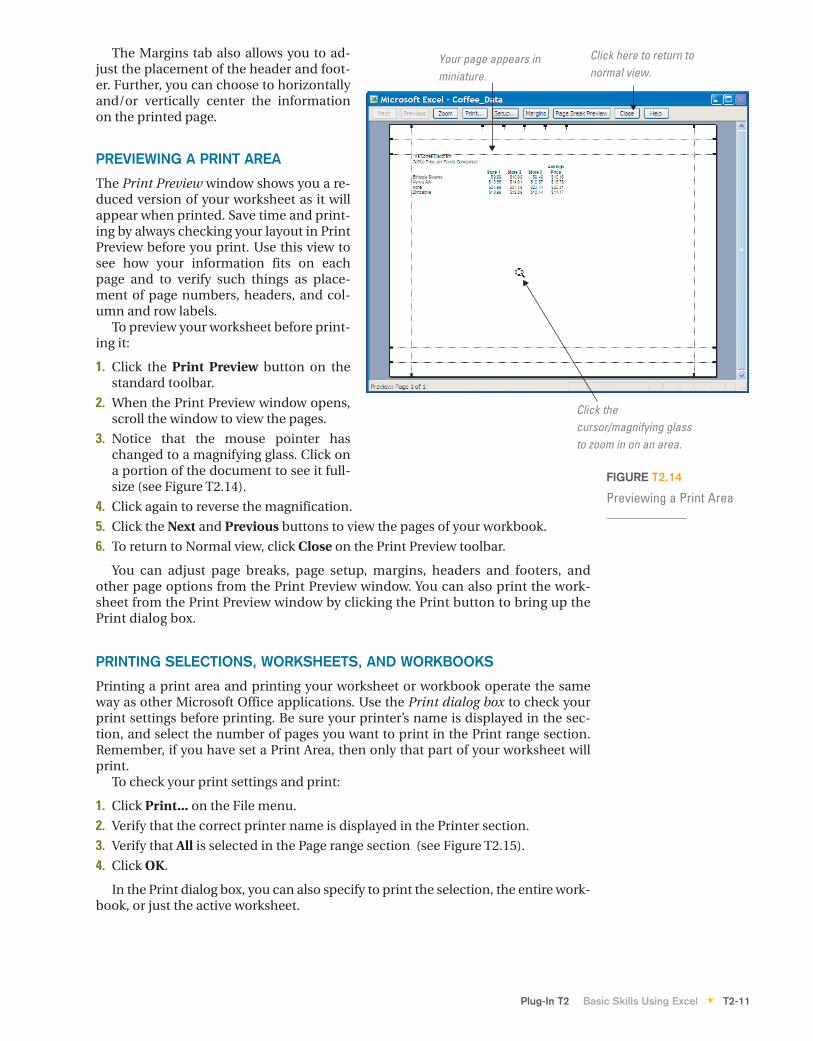
The Margins tab also allows you to ad-just the placement of the header and foot-er. Further, you can choose to horizontallyand/or vertically center the informationon the printed page.
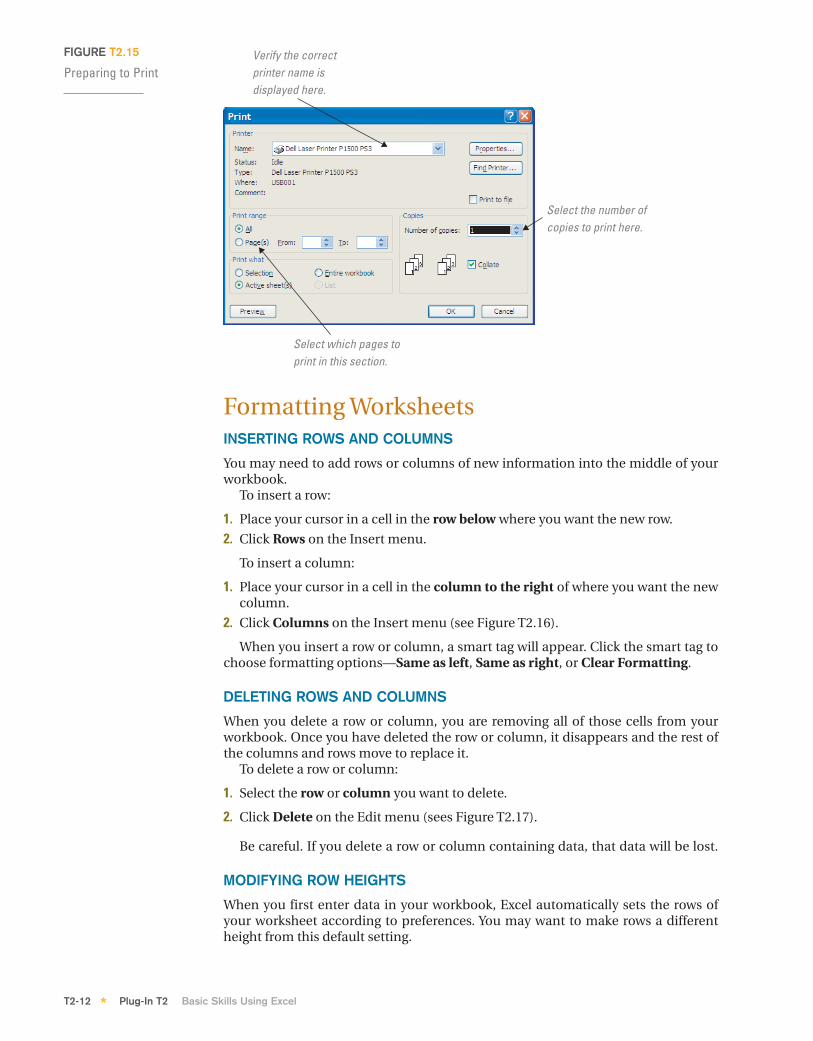
PREVIEWING A PRINT AREA
The Print Preview window shows you a re-duced version of your worksheet as it willappear when printed. Save time and print-ing by always checking your layout in PrintPreview before you print. Use this view tosee how your information fits on eachpage and to verify such things as place-ment of page numbers, headers, and col-umn and row labels.
To preview your worksheet before print-ing it:
1. Click the Print Preview button on thestandard toolbar.
2. When the Print Preview window opens,scroll the window to view the pages.
3. Notice that the mouse pointer haschanged to a magnifying glass. Click ona portion of the document to see it full-size (see Figure T2.14).
4. Click again to reverse the magnification.
5. Click the Next and Previous buttons to view the pages of your workbook.
6. To return to Normal view, click Close on the Print Preview toolbar.
You can adjust page breaks, page setup, margins, headers and footers, andother page options from the Print Preview window. You can also print the work-sheet from the Print Preview window by clicking the Print button to bring up thePrint dialog box.
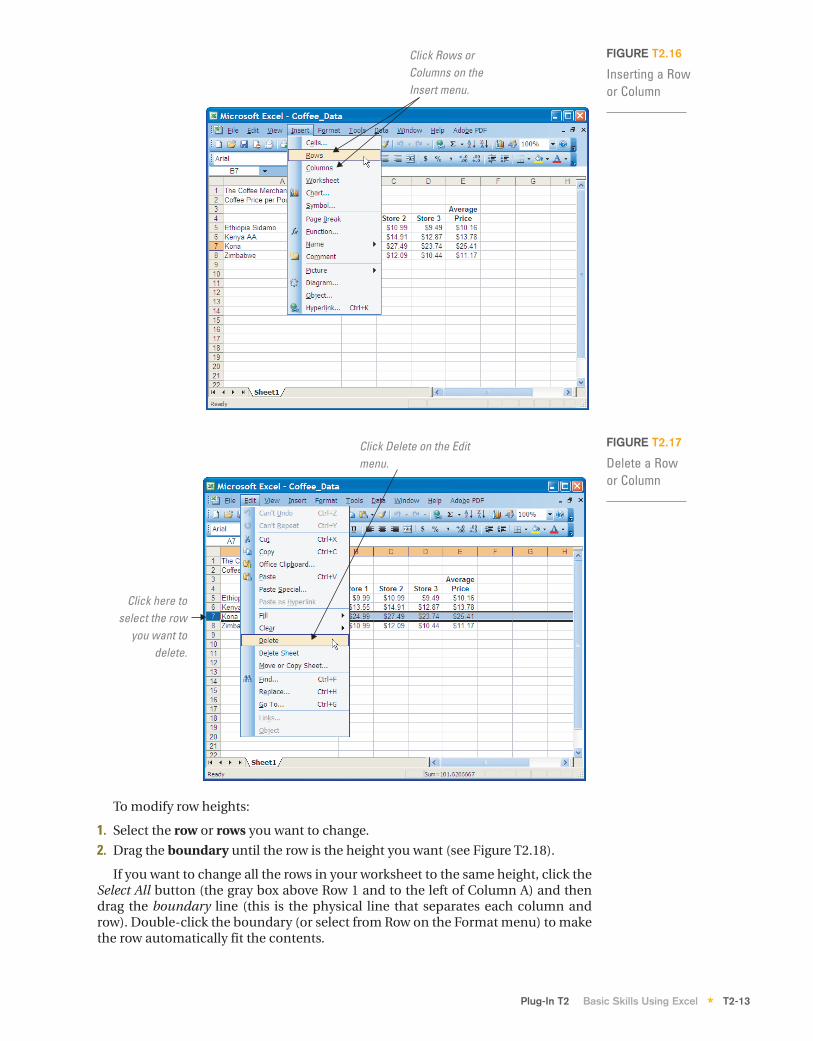
PRINTING SELECTIONS, WORKSHEETS, AND WORKBOOKS
Printing a print area and printing your worksheet or workbook operate the sameway as other Microsoft Office applications. Use the Print dialog box to check yourprint settings before printing. Be sure your printer’s name is displayed in the sec-tion, and select the number of pages you want to print in the Print range section.Remember, if you have set a Print Area, then only that part of your worksheet willprint.
To check your print settings and print:
1. Click Print... on the File menu.
2. Verify that the correct printer name is displayed in the Printer section.
3. Verify that All is selected in the Page range section (see Figure T2.15).
4. Click OK.
In the Print dialog box, you can also specify to print the selection, the entire work-book, or just the active worksheet.
Plug-In T2 Basic Skills Using Excel T2-11*
FIGURE T2.14
Previewing a Print Area
Your page appears inminiature.
Click here to return tonormal view.
Click the cursor/magnifying glassto zoom in on an area.
haa23684_PlugInT2CD.qxd 9/26/06 7:28 PM Page 11
Formatting WorksheetsINSERTING ROWS AND COLUMNS
You may need to add rows or columns of new information into the middle of yourworkbook.
To insert a row:
1. Place your cursor in a cell in the row below where you want the new row.
2. Click Rows on the Insert menu.
To insert a column:
1. Place your cursor in a cell in the column to the right of where you want the newcolumn.
2. Click Columns on the Insert menu (see Figure T2.16).
When you insert a row or column, a smart tag will appear. Click the smart tag tochoose formatting options—Same as left, Same as right, or Clear Formatting.
DELETING ROWS AND COLUMNS
When you delete a row or column, you are removing all of those cells from yourworkbook. Once you have deleted the row or column, it disappears and the rest ofthe columns and rows move to replace it.
To delete a row or column:
1. Select the row or column you want to delete.
2. Click Delete on the Edit menu (sees Figure T2.17).
Be careful. If you delete a row or column containing data, that data will be lost.
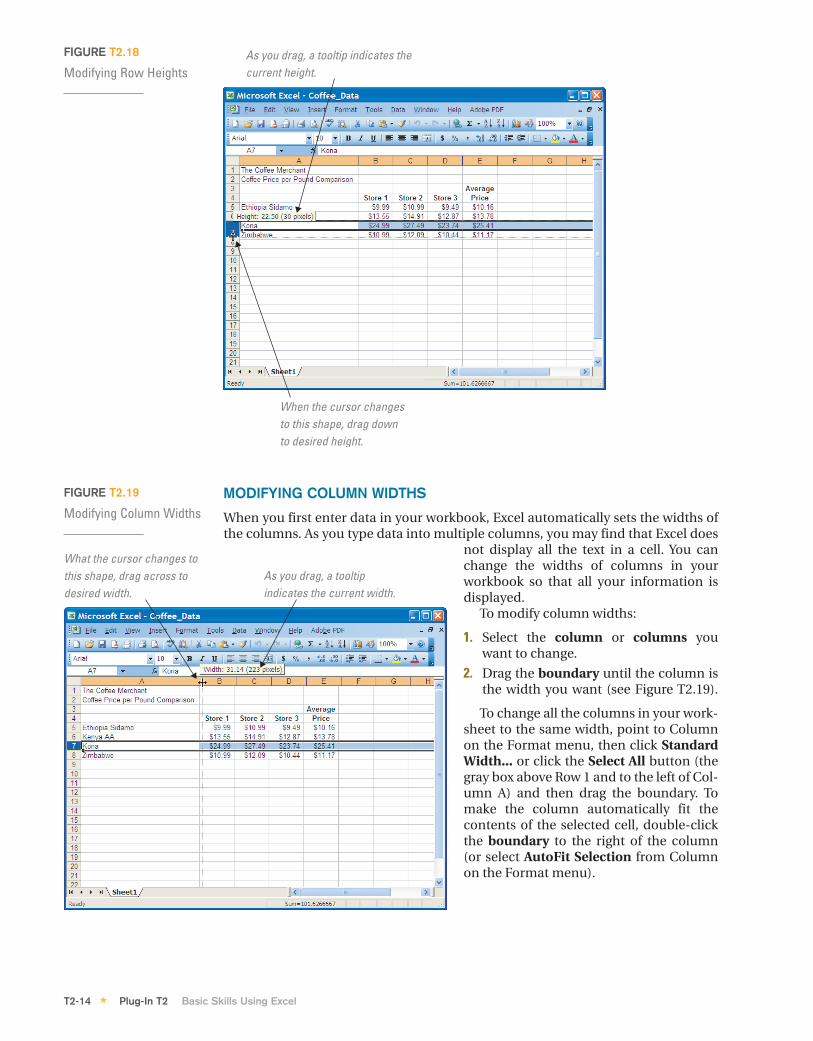
MODIFYING ROW HEIGHTS
When you first enter data in your workbook, Excel automatically sets the rows ofyour worksheet according to preferences. You may want to make rows a differentheight from this default setting.
T2-12 Plug-In T2 Basic Skills Using Excel*
FIGURE T2.15
Preparing to PrintVerify the correctprinter name isdisplayed here.
Select the number ofcopies to print here.
Select which pages toprint in this section.
haa23684_PlugInT2CD.qxd 9/26/06 7:28 PM Page 12
Plug-In T2 Basic Skills Using Excel T2-13*
FIGURE T2.16
Inserting a Row or Column
Click Rows orColumns on theInsert menu.
FIGURE T2.17
Delete a Row or Column
Click Delete on the Editmenu.
Click here toselect the row
you want todelete.
To modify row heights:
1. Select the row or rows you want to change.
2. Drag the boundary until the row is the height you want (see Figure T2.18).
If you want to change all the rows in your worksheet to the same height, click theSelect All button (the gray box above Row 1 and to the left of Column A) and thendrag the boundary line (this is the physical line that separates each column androw). Double-click the boundary (or select from Row on the Format menu) to makethe row automatically fit the contents.
haa23684_PlugInT2CD.qxd 9/26/06 7:28 PM Page 13
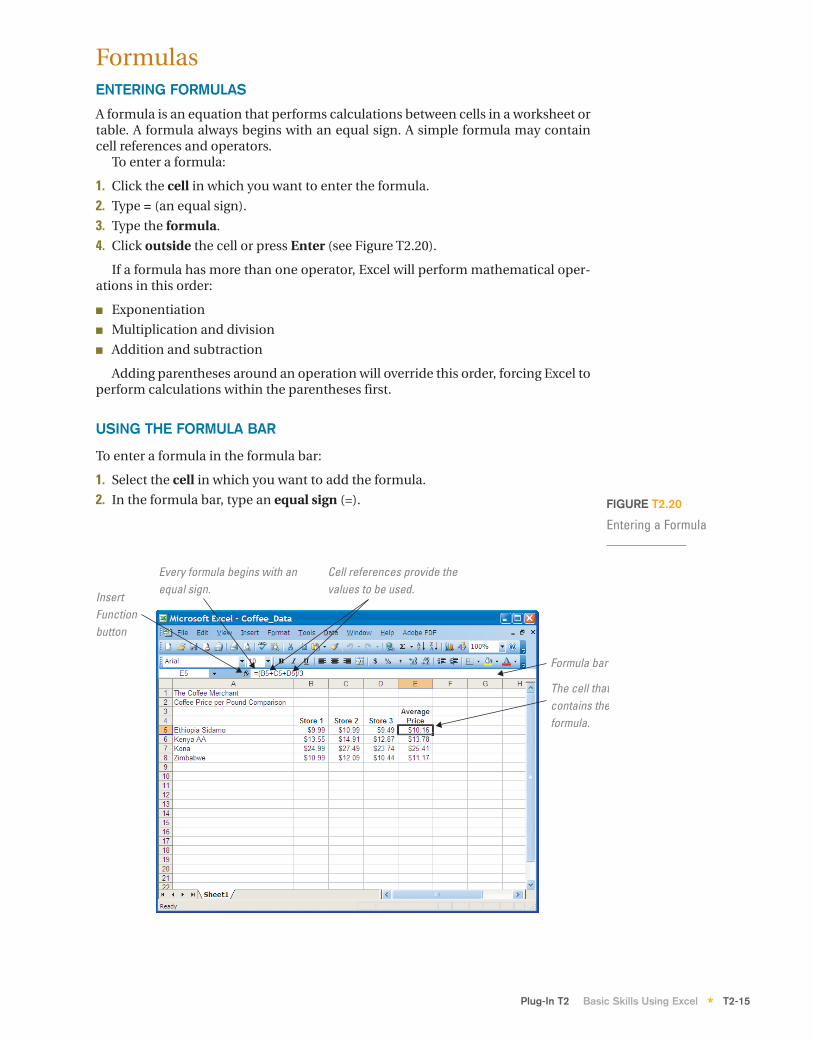
MODIFYING COLUMN WIDTHS
When you first enter data in your workbook, Excel automatically sets the widths ofthe columns. As you type data into multiple columns, you may find that Excel does
not display all the text in a cell. You canchange the widths of columns in yourworkbook so that all your information isdisplayed.
To modify column widths:
1. Select the column or columns youwant to change.
2. Drag the boundary until the column isthe width you want (see Figure T2.19).
To change all the columns in your work-sheet to the same width, point to Columnon the Format menu, then click StandardWidth... or click the Select All button (thegray box above Row 1 and to the left of Col-umn A) and then drag the boundary. Tomake the column automatically fit thecontents of the selected cell, double-clickthe boundary to the right of the column(or select AutoFit Selection from Columnon the Format menu).
T2-14 Plug-In T2 Basic Skills Using Excel*
FIGURE T2.18
Modifying Row Heights
When the cursor changesto this shape, drag downto desired height.
As you drag, a tooltip indicates thecurrent height.
FIGURE T2.19
Modifying Column Widths
What the cursor changes tothis shape, drag across todesired width.
As you drag, a tooltipindicates the current width.
haa23684_PlugInT2CD.qxd 9/26/06 7:28 PM Page 14
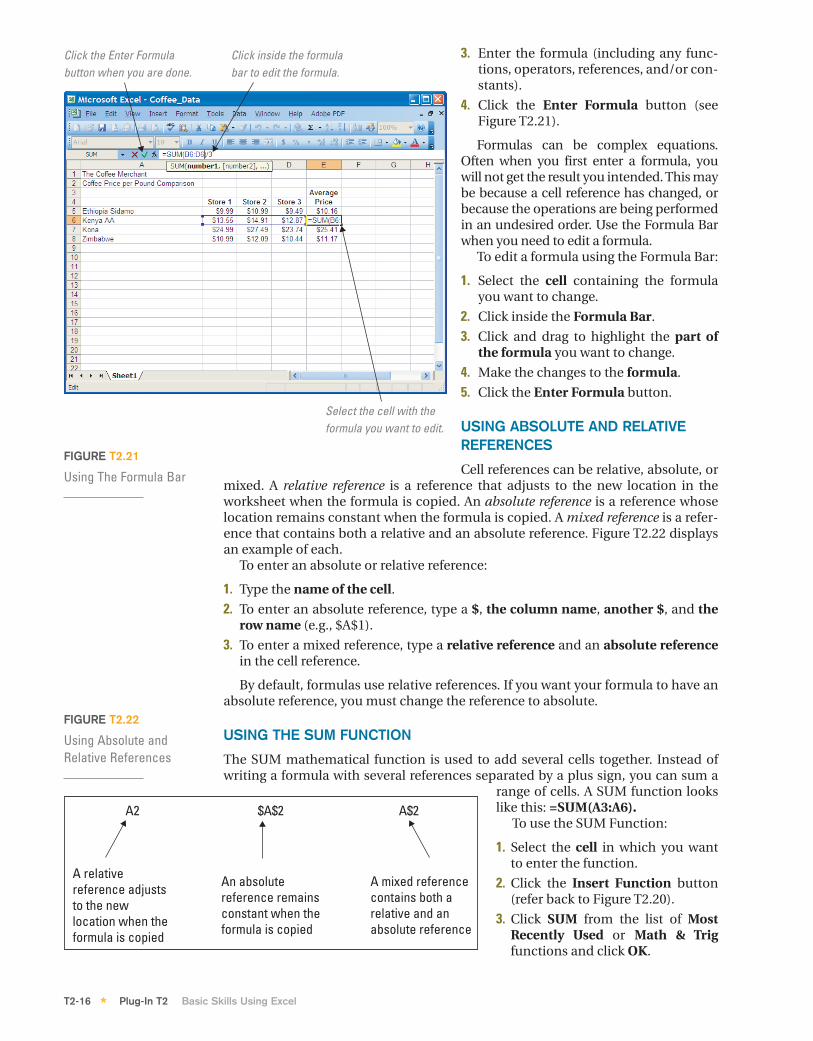
FormulasENTERING FORMULAS
A formula is an equation that performs calculations between cells in a worksheet ortable. A formula always begins with an equal sign. A simple formula may containcell references and operators.
To enter a formula:
1. Click the cell in which you want to enter the formula.
2. Type = (an equal sign).
3. Type the formula.
4. Click outside the cell or press Enter (see Figure T2.20).
If a formula has more than one operator, Excel will perform mathematical oper-ations in this order:
■ Exponentiation
■ Multiplication and division
■ Addition and subtraction
Adding parentheses around an operation will override this order, forcing Excel toperform calculations within the parentheses first.
USING THE FORMULA BAR
To enter a formula in the formula bar:
1. Select the cell in which you want to add the formula.
2. In the formula bar, type an equal sign (=).
Plug-In T2 Basic Skills Using Excel T2-15*
FIGURE T2.20
Entering a Formula
Every formula begins with anequal sign.
Cell references provide thevalues to be used.
The cell thatcontains theformula.
Formula bar
InsertFunctionbutton
haa23684_PlugInT2CD.qxd 9/26/06 7:28 PM Page 15
3. Enter the formula (including any func-tions, operators, references, and/or con-stants).
4. Click the Enter Formula button (seeFigure T2.21).
Formulas can be complex equations.Often when you first enter a formula, youwill not get the result you intended. This maybe because a cell reference has changed, orbecause the operations are being performedin an undesired order. Use the Formula Barwhen you need to edit a formula.
To edit a formula using the Formula Bar:
1. Select the cell containing the formulayou want to change.
2. Click inside the Formula Bar.
3. Click and drag to highlight the part ofthe formula you want to change.
4. Make the changes to the formula.
5. Click the Enter Formula button.
USING ABSOLUTE AND RELATIVEREFERENCES
Cell references can be relative, absolute, ormixed. A relative reference is a reference that adjusts to the new location in theworksheet when the formula is copied. An absolute reference is a reference whoselocation remains constant when the formula is copied. A mixed reference is a refer-ence that contains both a relative and an absolute reference. Figure T2.22 displaysan example of each.
To enter an absolute or relative reference:
1. Type the name of the cell.
2. To enter an absolute reference, type a $, the column name, another $, and therow name (e.g., $A$1).
3. To enter a mixed reference, type a relative reference and an absolute referencein the cell reference.
By default, formulas use relative references. If you want your formula to have anabsolute reference, you must change the reference to absolute.
USING THE SUM FUNCTION
The SUM mathematical function is used to add several cells together. Instead ofwriting a formula with several references separated by a plus sign, you can sum a
range of cells. A SUM function lookslike this: =SUM(A3:A6).
To use the SUM Function:
1. Select the cell in which you wantto enter the function.
2. Click the Insert Function button(refer back to Figure T2.20).
3. Click SUM from the list of MostRecently Used or Math & Trigfunctions and click OK.
T2-16 Plug-In T2 Basic Skills Using Excel*
Click the Enter Formulabutton when you are done.
Click inside the formulabar to edit the formula.
Select the cell with theformula you want to edit.
FIGURE T2.21
Using The Formula Bar
FIGURE T2.22
Using Absolute andRelative References
A2 $A$2 A$2
A relativereference adjuststo the newlocation when theformula is copied
An absolutereference remainsconstant when theformula is copied
A mixed referencecontains both arelative and anabsolute reference
haa23684_PlugInT2CD.qxd 9/26/06 7:28 PM Page 16
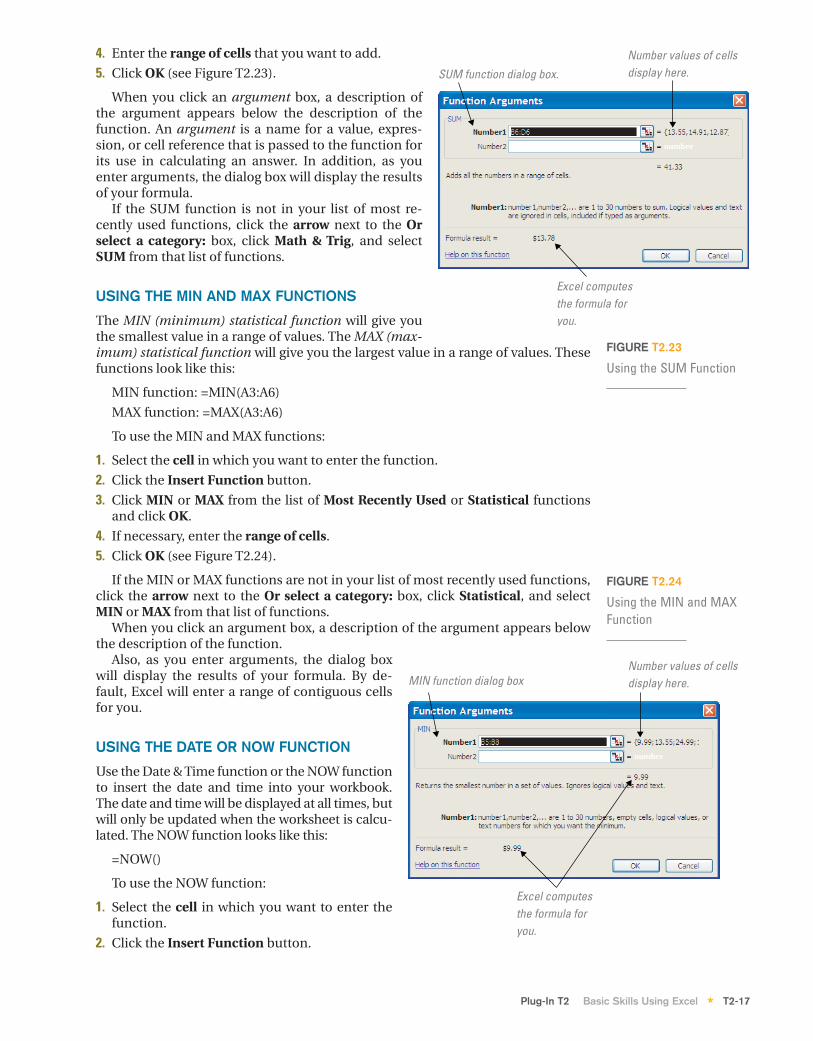
4. Enter the range of cells that you want to add.
5. Click OK (see Figure T2.23).
When you click an argument box, a description ofthe argument appears below the description of thefunction. An argument is a name for a value, expres-sion, or cell reference that is passed to the function forits use in calculating an answer. In addition, as youenter arguments, the dialog box will display the resultsof your formula.
If the SUM function is not in your list of most re-cently used functions, click the arrow next to the Orselect a category: box, click Math & Trig, and selectSUM from that list of functions.
USING THE MIN AND MAX FUNCTIONS
The MIN (minimum) statistical function will give youthe smallest value in a range of values. The MAX (max-imum) statistical function will give you the largest value in a range of values. Thesefunctions look like this:
MIN function: =MIN(A3:A6)
MAX function: =MAX(A3:A6)
To use the MIN and MAX functions:
1. Select the cell in which you want to enter the function.
2. Click the Insert Function button.
3. Click MIN or MAX from the list of Most Recently Used or Statistical functionsand click OK.
4. If necessary, enter the range of cells.
5. Click OK (see Figure T2.24).
If the MIN or MAX functions are not in your list of most recently used functions,click the arrow next to the Or select a category: box, click Statistical, and selectMIN or MAX from that list of functions.
When you click an argument box, a description of the argument appears belowthe description of the function.
Also, as you enter arguments, the dialog boxwill display the results of your formula. By de-fault, Excel will enter a range of contiguous cellsfor you.
USING THE DATE OR NOW FUNCTION
Use the Date & Time function or the NOW functionto insert the date and time into your workbook.The date and time will be displayed at all times, butwill only be updated when the worksheet is calcu-lated. The NOW function looks like this:
=NOW()
To use the NOW function:
1. Select the cell in which you want to enter thefunction.
2. Click the Insert Function button.
Plug-In T2 Basic Skills Using Excel T2-17*
FIGURE T2.23
Using the SUM Function
Excel computesthe formula foryou.
SUM function dialog box.Number values of cellsdisplay here.
FIGURE T2.24
Using the MIN and MAXFunction
Excel computesthe formula foryou.
MIN function dialog boxNumber values of cellsdisplay here.
haa23684_PlugInT2CD.qxd 9/26/06 7:28 PM Page 17
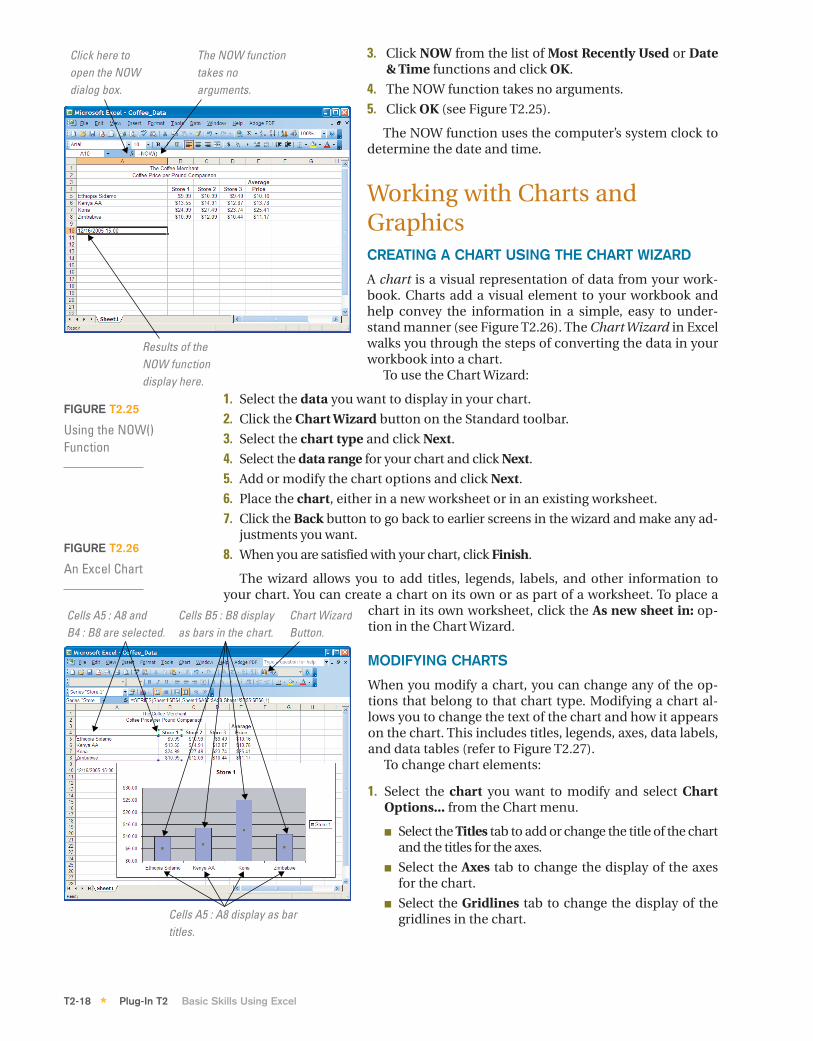
3. Click NOW from the list of Most Recently Used or Date& Time functions and click OK.
4. The NOW function takes no arguments.
5. Click OK (see Figure T2.25).
The NOW function uses the computer’s system clock todetermine the date and time.
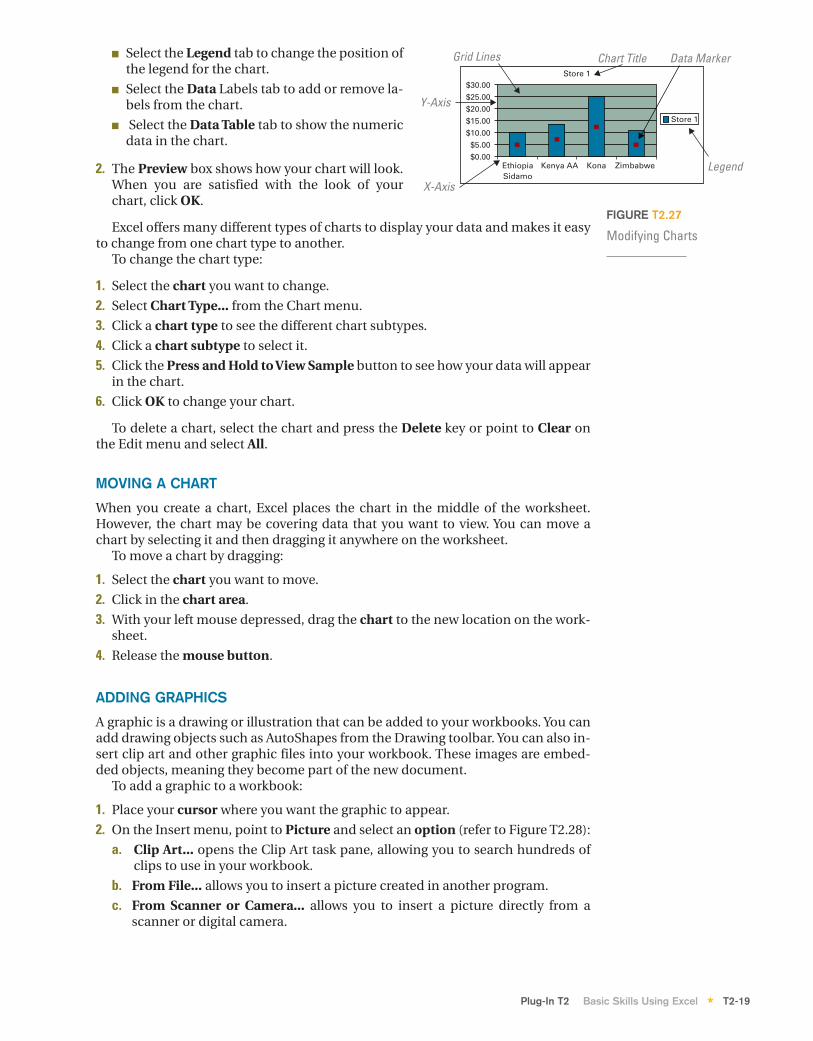
Working with Charts andGraphicsCREATING A CHART USING THE CHART WIZARD
A chart is a visual representation of data from your work-book. Charts add a visual element to your workbook andhelp convey the information in a simple, easy to under-stand manner (see Figure T2.26). The Chart Wizard in Excelwalks you through the steps of converting the data in yourworkbook into a chart.
To use the Chart Wizard:
1. Select the data you want to display in your chart.
2. Click the Chart Wizard button on the Standard toolbar.
3. Select the chart type and click Next.
4. Select the data range for your chart and click Next.
5. Add or modify the chart options and click Next.
6. Place the chart, either in a new worksheet or in an existing worksheet.
7. Click the Back button to go back to earlier screens in the wizard and make any ad-justments you want.
8. When you are satisfied with your chart, click Finish.
The wizard allows you to add titles, legends, labels, and other information toyour chart. You can create a chart on its own or as part of a worksheet. To place a
chart in its own worksheet, click the As new sheet in: op-tion in the Chart Wizard.
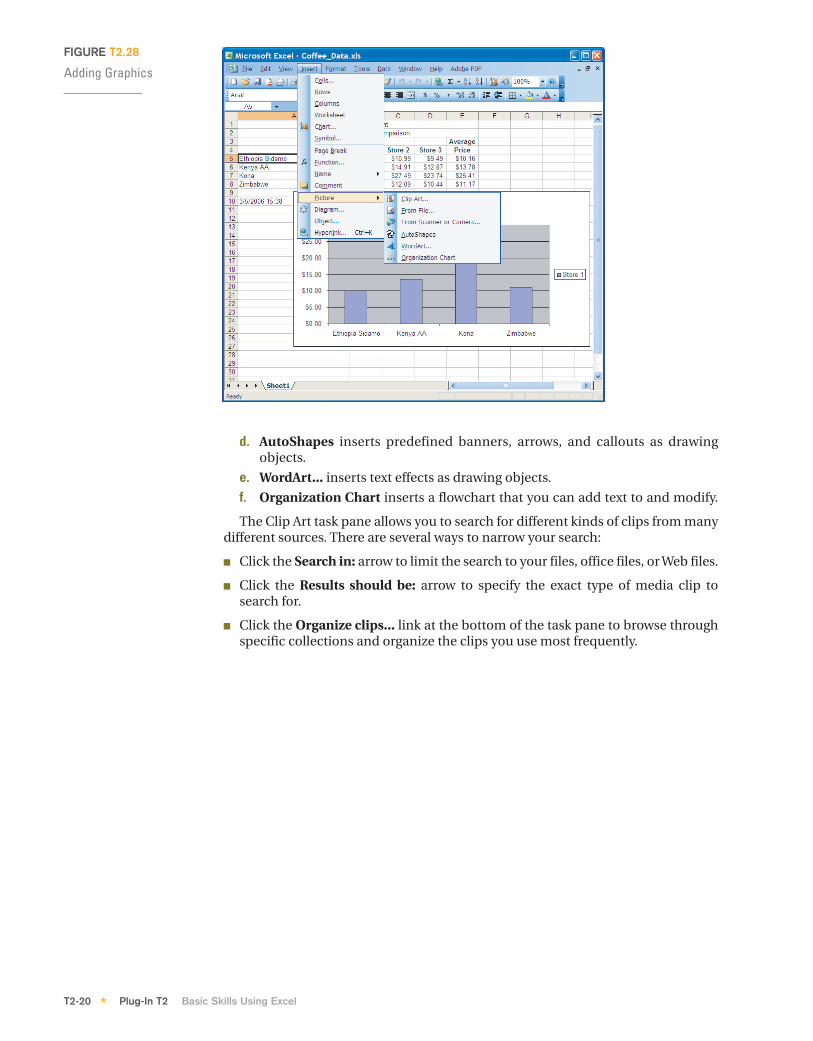
MODIFYING CHARTS
When you modify a chart, you can change any of the op-tions that belong to that chart type. Modifying a chart al-lows you to change the text of the chart and how it appearson the chart. This includes titles, legends, axes, data labels,and data tables (refer to Figure T2.27).
To change chart elements:
1. Select the chart you want to modify and select ChartOptions... from the Chart menu.
■ Select the Titles tab to add or change the title of the chartand the titles for the axes.
■ Select the Axes tab to change the display of the axesfor the chart.
■ Select the Gridlines tab to change the display of thegridlines in the chart.
T2-18 Plug-In T2 Basic Skills Using Excel*
FIGURE T2.25
Using the NOW() Function
Click here toopen the NOWdialog box.
The NOW functiontakes noarguments.
Results of theNOW functiondisplay here.
FIGURE T2.26
An Excel Chart
Cells A5 : A8 andB4 : B8 are selected.
Cells B5 : B8 displayas bars in the chart.
Chart WizardButton.
Cells A5 : A8 display as bartitles.
haa23684_PlugInT2CD.qxd 9/26/06 7:28 PM Page 18
■ Select the Legend tab to change the position ofthe legend for the chart.
■ Select the Data Labels tab to add or remove la-bels from the chart.
■ Select the Data Table tab to show the numericdata in the chart.
2. The Preview box shows how your chart will look.When you are satisfied with the look of yourchart, click OK.
Excel offers many different types of charts to display your data and makes it easyto change from one chart type to another.
To change the chart type:
1. Select the chart you want to change.
2. Select Chart Type... from the Chart menu.
3. Click a chart type to see the different chart subtypes.
4. Click a chart subtype to select it.
5. Click the Press and Hold to View Sample button to see how your data will appearin the chart.
6. Click OK to change your chart.
To delete a chart, select the chart and press the Delete key or point to Clear onthe Edit menu and select All.
MOVING A CHART
When you create a chart, Excel places the chart in the middle of the worksheet.However, the chart may be covering data that you want to view. You can move achart by selecting it and then dragging it anywhere on the worksheet.
To move a chart by dragging:
1. Select the chart you want to move.
2. Click in the chart area.
3. With your left mouse depressed, drag the chart to the new location on the work-sheet.
4. Release the mouse button.
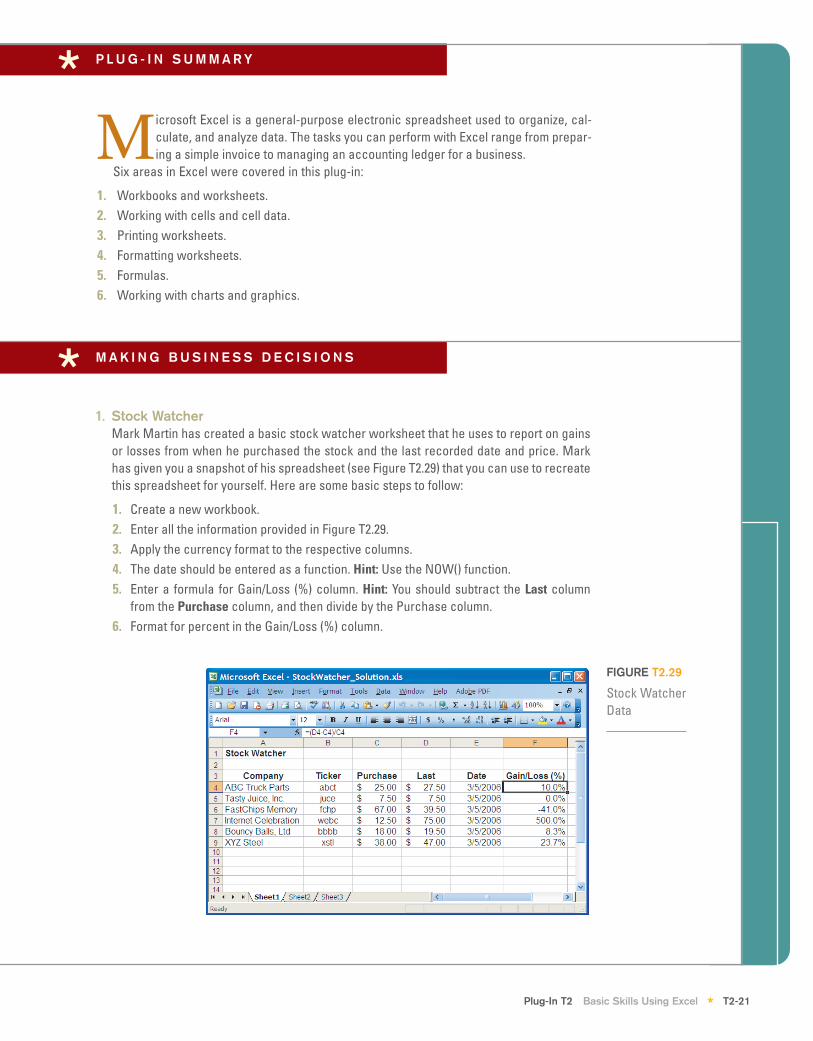
ADDING GRAPHICS
A graphic is a drawing or illustration that can be added to your workbooks. You canadd drawing objects such as AutoShapes from the Drawing toolbar. You can also in-sert clip art and other graphic files into your workbook. These images are embed-ded objects, meaning they become part of the new document.
To add a graphic to a workbook:
1. Place your cursor where you want the graphic to appear.
2. On the Insert menu, point to Picture and select an option (refer to Figure T2.28):
a. Clip Art... opens the Clip Art task pane, allowing you to search hundreds ofclips to use in your workbook.
b. From File... allows you to insert a picture created in another program.
c. From Scanner or Camera... allows you to insert a picture directly from ascanner or digital camera.
Plug-In T2 Basic Skills Using Excel T2-19*
FIGURE T2.27
Modifying Charts
Chart Title
Legend
Grid Lines Data Marker
Y-Axis
X-Axis
EthiopiaSidamo
Kenya AA Kona Zimbabwe
$30.00
$25.00
$20.00
$15.00
$10.00
$5.00
$0.00
Store 1
Store 1
haa23684_PlugInT2CD.qxd 9/26/06 7:28 PM Page 19
d. AutoShapes inserts predefined banners, arrows, and callouts as drawingobjects.
e. WordArt... inserts text effects as drawing objects.
f. Organization Chart inserts a flowchart that you can add text to and modify.
The Clip Art task pane allows you to search for different kinds of clips from manydifferent sources. There are several ways to narrow your search:
■ Click the Search in: arrow to limit the search to your files, office files, or Web files.
■ Click the Results should be: arrow to specify the exact type of media clip tosearch for.
■ Click the Organize clips... link at the bottom of the task pane to browse throughspecific collections and organize the clips you use most frequently.
T2-20 Plug-In T2 Basic Skills Using Excel*
FIGURE T2.28
Adding Graphics
haa23684_PlugInT2CD.qxd 9/26/06 7:28 PM Page 20
P L U G - I N S U M M A R Y*
M A K I N G B U S I N E S S D E C I S I O N S*
Plug-In T2 Basic Skills Using Excel T2-21*
Microsoft Excel is a general-purpose electronic spreadsheet used to organize, cal-culate, and analyze data. The tasks you can perform with Excel range from prepar-ing a simple invoice to managing an accounting ledger for a business.
Six areas in Excel were covered in this plug-in:
1. Workbooks and worksheets.2. Working with cells and cell data.3. Printing worksheets.4. Formatting worksheets.5. Formulas.6. Working with charts and graphics.
1. Stock WatcherMark Martin has created a basic stock watcher worksheet that he uses to report on gainsor losses from when he purchased the stock and the last recorded date and price. Markhas given you a snapshot of his spreadsheet (see Figure T2.29) that you can use to recreatethis spreadsheet for yourself. Here are some basic steps to follow:
1. Create a new workbook.2. Enter all the information provided in Figure T2.29.3. Apply the currency format to the respective columns.4. The date should be entered as a function. Hint: Use the NOW() function.5. Enter a formula for Gain/Loss (%) column. Hint: You should subtract the Last column
from the Purchase column, and then divide by the Purchase column.6. Format for percent in the Gain/Loss (%) column.
FIGURE T2.29
Stock Watcher Data
haa23684_PlugInT2CD.qxd 9/26/06 7:28 PM Page 21

2. Total MischiefMischief, Inc., is a regional pet toy supplier that tracks its business sales in a spreadsheet. Theowner, Lisa Derrick, has provided you with a skeleton worksheet, T2_TotalMischief_Data.xls,with the totals for each quarter by sales region. Lisa needs you to total each column and row,and then provide her with a clustered column chart of each region by quarter. See Figure T2.30for a sample of what Lisa would like you to do.
3. Recycling CanFor the past 10 years, five Colorado cities have held a recycling contest to see which citydoes the best job of recycling plastic, glass, and aluminum. Those participating in thisyear’s contest are Arvada, Centennial, Lakewood, Highlands Ranch, and Parker.
To make the contest fair for both large and small cities, the winning city will be the onethat recycles the largest number of cans per capita—the number of cans recycled dividedby the number of city residents.
You have been asked to help the coordinator, Jill Slater, to compile the numbers in anExcel worksheet and create the formulas to compute the total recycling by city eachmonth, total recycling for all cities each month, and the per capita recycling value that de-termines the contest winner. In addition, Jill wants to know a few statistics about themonthly recycling efforts, including the minimum, average, and maximum number of cansrecycled. Jill has provided you with sample data, T2_RecyclingCans_Data.xls. Figure T2.31shows a sample of what Jill would like to see as a completed worksheet.
4. MusicPlayerz Sales ProjectionsMusicPlayerz is a wholesale MP3 distributor headquartered in Morrison, Colorado. Corpo-rate buyers for the retail stores contract with MusicPlayerz to supply and ship MP3s to ware-houses scattered throughout the western United States. MusicPlayerz chief procurement
T2-22 Plug-In T2 Basic Skills Using Excel*
FIGURE T2.30
Total MischiefSpreadsheet
haa23684_PlugInT2CD.qxd 9/26/06 7:28 PM Page 22
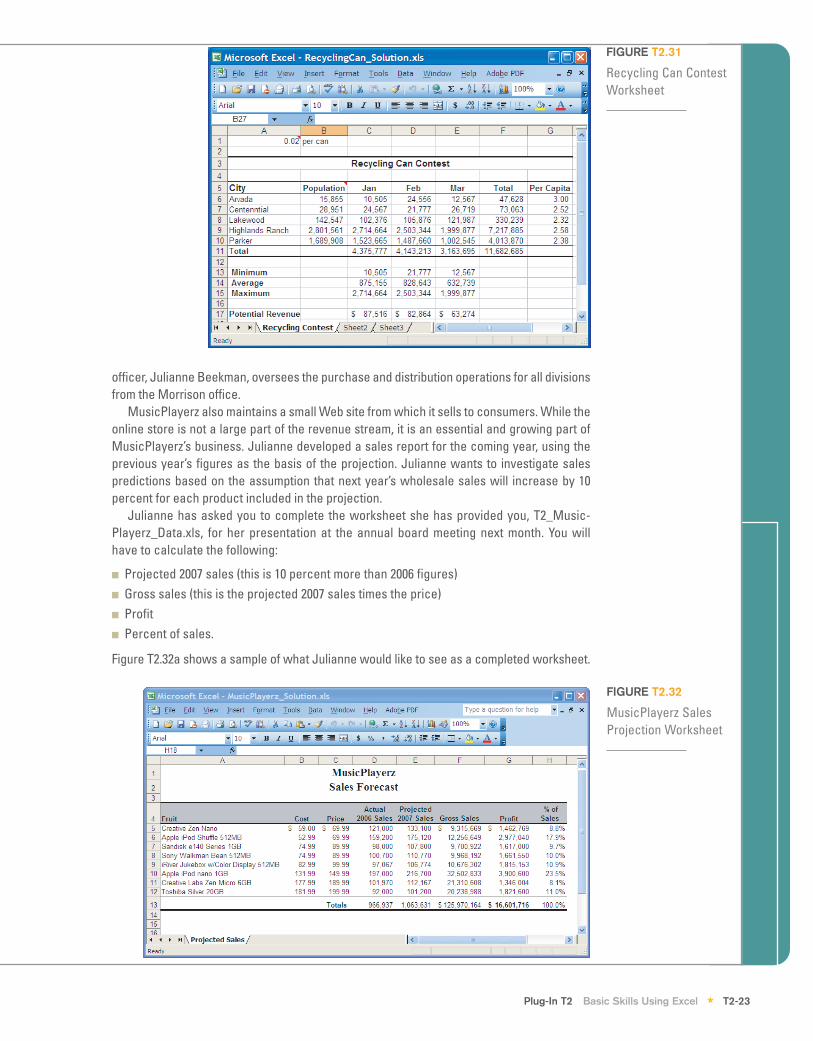
officer, Julianne Beekman, oversees the purchase and distribution operations for all divisionsfrom the Morrison office.
MusicPlayerz also maintains a small Web site from which it sells to consumers. While theonline store is not a large part of the revenue stream, it is an essential and growing part ofMusicPlayerz’s business. Julianne developed a sales report for the coming year, using theprevious year’s figures as the basis of the projection. Julianne wants to investigate salespredictions based on the assumption that next year’s wholesale sales will increase by 10percent for each product included in the projection.
Julianne has asked you to complete the worksheet she has provided you, T2_Music-Playerz_Data.xls, for her presentation at the annual board meeting next month. You willhave to calculate the following:
■ Projected 2007 sales (this is 10 percent more than 2006 figures)■ Gross sales (this is the projected 2007 sales times the price)■ Profit■ Percent of sales.
Figure T2.32a shows a sample of what Julianne would like to see as a completed worksheet.
Plug-In T2 Basic Skills Using Excel T2-23*
FIGURE T2.32
MusicPlayerz SalesProjection Worksheet
FIGURE T2.31
Recycling Can ContestWorksheet
haa23684_PlugInT2CD.qxd 9/26/06 7:28 PM Page 23