plotting with matlab - ETH Z · 2013-09-30 Modeling and Simulating Social Systems with MATLAB 33...
34
2013-09-30 Modeling and Simulating Social Systems with MATLAB Lecture 2 – Statistics and plotting in MATLAB continued © ETH Zürich | Tobias Kuhn and Olivia Woolley Chair of Sociology, in particular of Modeling and Simulation
Transcript of plotting with matlab - ETH Z · 2013-09-30 Modeling and Simulating Social Systems with MATLAB 33...

2013-09-30
Modeling and Simulating Social Systems with MATLAB
Lecture 2 – Statistics and plotting in MATLAB continued
© ETH Zürich |
Tobias Kuhn and Olivia Woolley
Chair of Sociology, in particular of
Modeling and Simulation

2013-09-30 Modeling and Simulating Social Systems with MATLAB 22
Lesson 1: Exercise 1
Compute:
a) b)
c)
18+1075×25 ∑
i=0
100
i
∑i=5
10
( i2−i )
2013-09-30 Modeling and Simulating Social Systems with MATLAB 33
Lesson 1: Exercise 1 – solution
Compute:
a)
18+1075×25
>> (18+107)/(5*25)
ans =
1

2013-09-30 Modeling and Simulating Social Systems with MATLAB 44
Lesson 1: Exercise 1 – solution
Compute:
b)
∑i=0
100
i
>> s=sum(1:100)or>> s=sum(1:1:100)or>> s=sum(linspace(1,100)) or>> s=sum(linspace(1,100,100))
s =
5050
default value
default value

2013-09-30 Modeling and Simulating Social Systems with MATLAB 55
Lesson 1: Exercise 1 – solution
Compute:
c) ∑i=5
10
( i2−i )
>> s=0;>> for i=5:10>> s=s+i^2-i; >> end>> s
s =
310

2013-09-30 Modeling and Simulating Social Systems with MATLAB 66
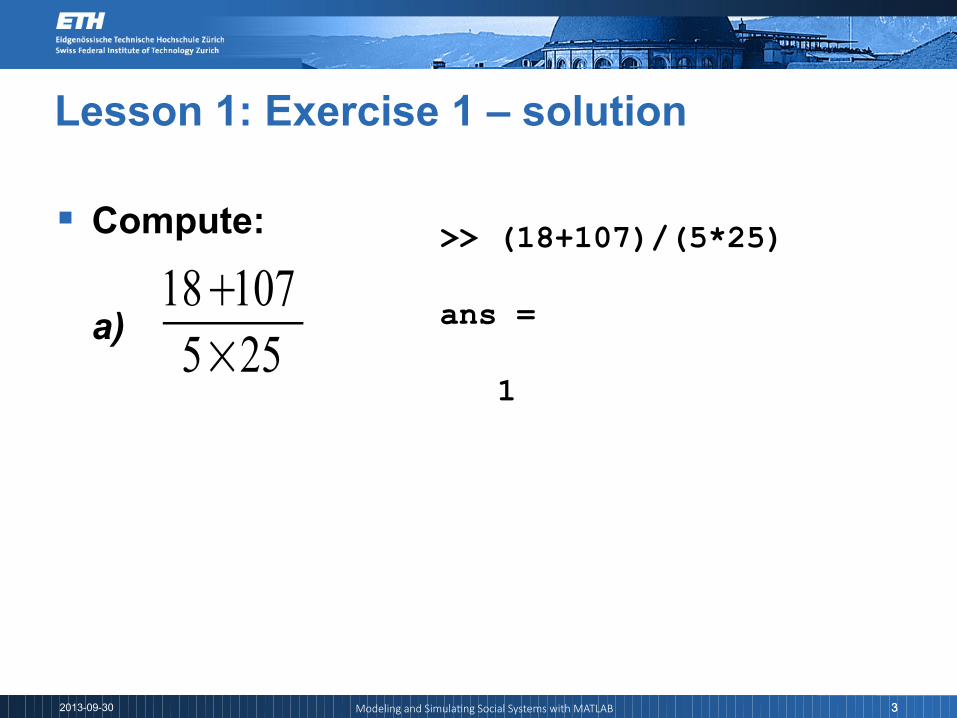
Lesson 1: Exercise 2
Solve for x:
2x1−3x2− x3+4x4=12x1+3x 2−3x3+2x4=22x1−x2− x3−x 4=32x1−x2+2x3+5x4=4
2013-09-30 Modeling and Simulating Social Systems with MATLAB 77
Lesson 1: Exercise 2 – solution>> A=[2 -3 -1 4; 2 3 -3 2; 2 -1 -1 -1; 2 -1 2 5];>> b=[1; 2; 3; 4];>> x=A\b
x = 1.9755 0.3627 0.8431 -0.2549
>> A*xans = 1.0000 2.0000 3.0000 4.0000
2x1−3x2− x3+4x4=12x1+3x 2−3x3+2x4=22x1−x2− x3−x 4=32x1−x2+2x3+5x4=4
Ax=b

2013-09-30 Modeling and Simulating Social Systems with MATLAB 88
Lesson 1: Exercise 3
Fibonacci sequence: Write a function which
computes the Fibonacci sequence until a given
number n and return the result in a vector.
The Fibonacci sequence F(n) is given by :

2013-09-30 Modeling and Simulating Social Systems with MATLAB 99
Lesson 1: Exercise 3 – iterative solution
fibonacci.m:
function [v] = Fibonacci(n) v(1) = 0; if ( n>=1 ) v(2) = 1; end for i=3:n+1 v(i) = v(i-1) + v(i-2); endend
>> Fibonacci(7)ans = 0 1 1 2 3 5 8 13

2013-09-30 Modeling and Simulating Social Systems with MATLAB 1010
Lesson 1: Exercise 3 – recursive solution
fibo_rec.m:
function f = fibo_rec(n) if n == 0 f(1) = 0;
elseif n == 1 f(2) = 1; elseif n > 1 f = fibo_rec(n - 1); f(n + 1) = f(n) + f(n - 1); endend
>> fibo_rec(7)ans = 0 1 1 2 3 5 8 13

2013-09-30 Modeling and Simulating Social Systems with MATLAB 1111
Plotting and Statistics in Matlab Contd.
2013-09-30 Modeling and Simulating Social Systems with MATLAB 1212
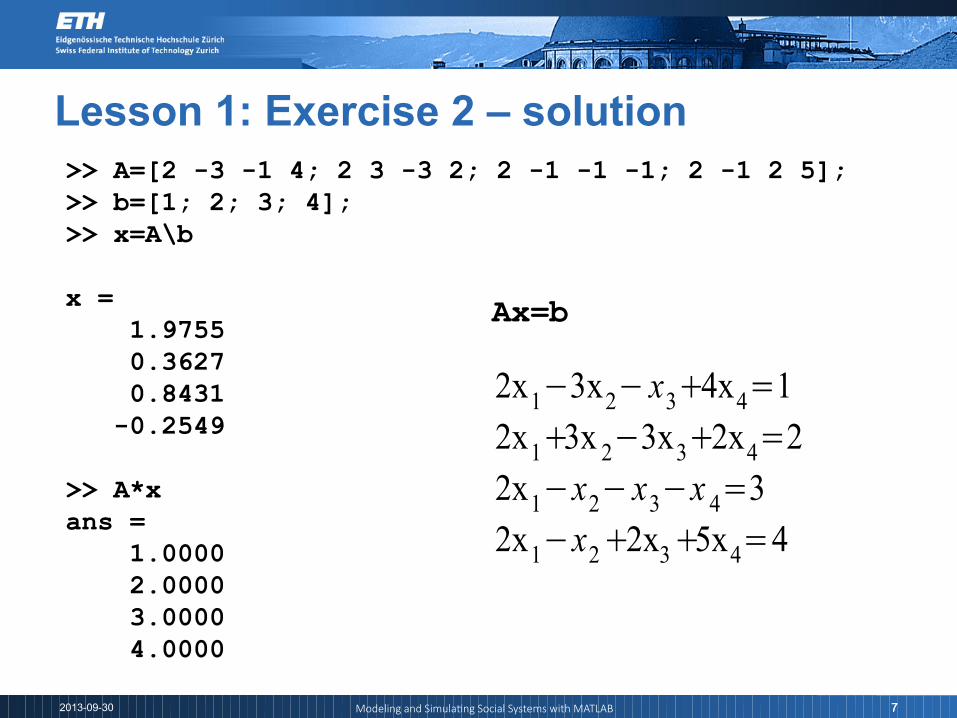
Back to plotting… details of plot
An additional parameter can be provided to
plot() to define how the curve will look like:
plot(x, y, ‘key’)
Where key is a string which can contain:
Color codes: ‘r’, ‘g’, ‘b’, ‘k’, ‘y’, …
Line codes: ‘-’, ‘--’, ‘.-’ (solid, dashed, etc.)
Marker codes: ‘*’, ‘.’, ‘s’, ’x’
Examples: plot(x, y, ‘r--’)
plot(x, y, ‘g*’) * * * *

2013-09-30 Modeling and Simulating Social Systems with MATLAB 1313
Plotting tips
To make the plots look nicer, the following
commands can be used:
Set label on x axis:
xlabel(‘text’)
Set label on y axis:
ylabel(‘text’)
Set title:
title(‘text’)

2013-09-30 Modeling and Simulating Social Systems with MATLAB 1414
Setting axes limits xlim([xmin xmax]) ylim([ymin ymax])
Plotting tips
2013-09-30 Modeling and Simulating Social Systems with MATLAB 1515
Two additional useful commands: hold on|off grid on|off
>> x=[-5:0.1:5];
>> y1=exp(-x.^2);
>> y2=2*exp(-x.^2);
>> y3=exp(-(x.^2)/3);
Plotting tips

2013-09-30 Modeling and Simulating Social Systems with MATLAB 1616
Plotting tips
>> plot(x,y1);
>> hold on
>> plot(x,y2,’r’);>> plot(x,y3,’g’);

2013-09-30 Modeling and Simulating Social Systems with MATLAB 1717
Plotting tips
>> plot(x,y1);
>> hold on
>> plot(x,y2,’r’);>> plot(x,y3,’g’);>> grid on

2013-09-30 Modeling and Simulating Social Systems with MATLAB 1818
Subplot()
subplot(m,n,p) breaks the figure window into an m-by-n matrix and selects the pth axes object for the current plot.
The axes are counted along the top row of the figure window, then the second row, etc.

2013-09-30 Modeling and Simulating Social Systems with MATLAB 1919
Subplot() by the way…
We have already seen an example of a chart created using subplot last lecture. Can you reproduce it?

2013-09-30 Modeling and Simulating Social Systems with MATLAB 2020
Handles, figure(), set() and get()
h = figure(...)adds a new figure window to the screen. It also returns the handle to it, so it can be further processed.
Figure handle: gcf Axes handle: gca
get(handle,'PropertyName')
set(handle,'PropertyName',PropertyValue,...)
e.g. set(gcf, 'Position', [100 100 150 150]) [left bottom width height];

2013-09-30 Modeling and Simulating Social Systems with MATLAB 2121
Saving and printing figures
saveas(handle,’myimage.fig’);
saveas(handle,’myimage.jpg’);
export_fig from MathWorks File Exchange http://www.mathworks.com/matlabcentral/fileexchange/23629-exportfig
export_fig('/plots/myimage.pdf', '-pdf', '-nocrop')

2013-09-30 Modeling and Simulating Social Systems with MATLAB 2222
Exercises: working with datasets
Two datasets for statistical plotting can be found
on the course web page (with NETHZ login)
http://www.soms.ethz.ch/matlab
you will find the files:
countries.m
cities.m

2013-09-30 Modeling and Simulating Social Systems with MATLAB 2323
Exercises: Datasets
Download the files countries.m and
cities.m and save them in the working
directory of MATLAB.

2013-09-30 Modeling and Simulating Social Systems with MATLAB 2424
Exercises: Datasets – countries
This dataset countries.m contains a matrix A
with the following specification:
Rows: Different countries
Column 1: Population
Column 2: Annual growth (%)
Column 3: Percentage of youth
Column 4: Life expectancy (years)
Column 5: Mortality

2013-09-30 Modeling and Simulating Social Systems with MATLAB 2525
Exercises: Datasets – countries
Most often, we want to access complete
columns in the matrix. This can be done by
A(:, index)
For example if you are interested in the life-
expectancy column, it is recommended to do:
>> life = x(:,4);
and then the vector life can be used to access
the vector containing all life expectancies.

2013-09-30 Modeling and Simulating Social Systems with MATLAB 2626
Exercises: Datasets – countries
The sort() function can be used to sort all
items of a vector in inclining order.
>> life = A(:, 4);
>> plot(life)
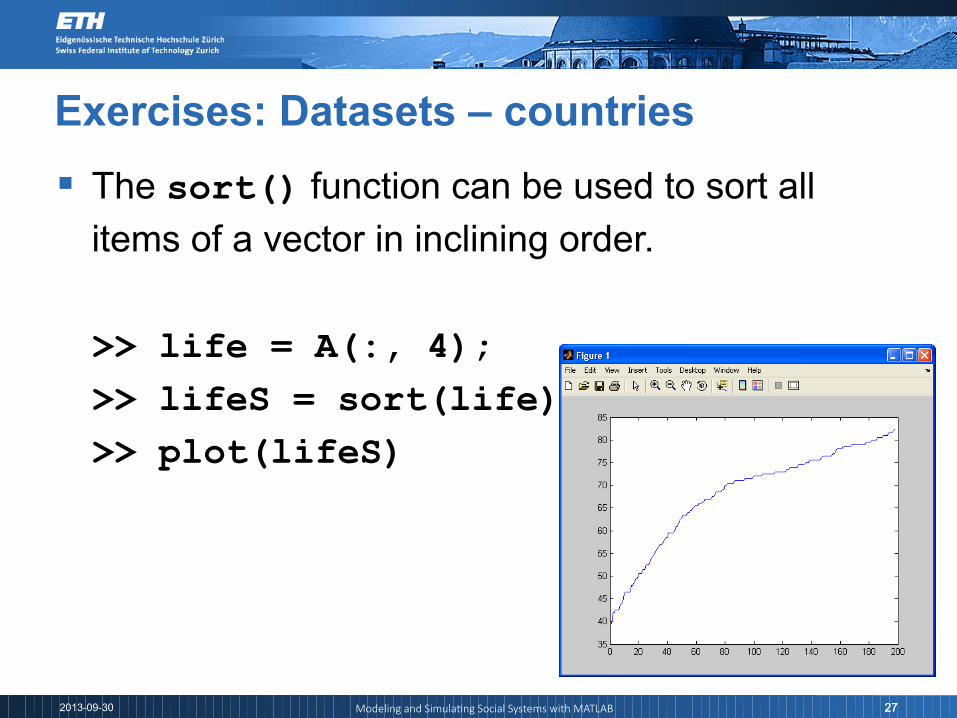
2013-09-30 Modeling and Simulating Social Systems with MATLAB 2727
Exercises: Datasets – countries
The sort() function can be used to sort all
items of a vector in inclining order.
>> life = A(:, 4);
>> lifeS = sort(life);
>> plot(lifeS)

2013-09-30 Modeling and Simulating Social Systems with MATLAB 2828
Exercises: Datasets – countries
The histogram hist() is useful for getting the
distribution of the values of a vector.
>> life = A(:, 4);
>> hist(life)

2013-09-30 Modeling and Simulating Social Systems with MATLAB 2929
Exercises: Datasets – countries
Alternatively, a second parameter specifies the
number of bars:
>> life = A(:, 4);
>> hist(life, 30)

2013-09-30 Modeling and Simulating Social Systems with MATLAB 3030
Exercise 1
Statistics: Generate a vector of N random
numbers with randn(N,1)
Calculate the mean and standard deviation. Do
the mean and standard deviation converge to
certain values, for an increasing N?
Optional: Display the histogram and compare the
output of the following two commands
hist(randn(N,1))
hist(rand(N,1))
2013-09-30 Modeling and Simulating Social Systems with MATLAB 3131
Exercise 2
Demographics: From the countries.m dataset,
find out why there is such a large difference
between the mean and the median population of
all countries.
Hint: Use hist(x, n)
Also sort() can be useful.
Plus: play with subplot()

2013-09-30 Modeling and Simulating Social Systems with MATLAB 3232
Exercise 3
Demographics: From the countries.m dataset,
see which columns have strongest correlation.
Can you explain why these columns have
stronger correlations?
Hint: Use corrcoef() to find the correlation
between columns. Use imagesc()to get an
immediate visualization of the correlations.

2013-09-30 Modeling and Simulating Social Systems with MATLAB 3333
Exercise 4 – optional
Zipf’s law: Zipf’s law says that the rank, x, of
cities (1: largest, 2: 2nd largest, 3: 3rd largest, ...)
and the size, y, of cities (population) has a
power-law relation: y ~ xb
Test if Zipf’s law holds for the cases in the
cities.m file. Try to estimate b.
Hint: Use log() and plot() (or loglog())
Plus: use the fitting tool cftool() to get b

2013-09-30 Modeling and Simulating Social Systems with MATLAB 3434
References
Additional material on plotting on the home page
of the course http://www.soms.ethz.ch/matlab
"Log or Linear? Distinct Intuitions of the Number
Scale in Western and Amazonian Indigene
Cultures”, Science 320 (5880): 1217
Fechner law


