
PLoS ONE - UAEH1 Multichannel detrended fluctuation analysis reveals synchronized patterns of...
43
PLoS ONE Multichannel detrended fluctuation analysis reveals synchronized patterns of spontaneous spinal activity in anesthetized cats --Manuscript Draft-- Manuscript Number: PONE-D-11-11959R1 Article Type: Research Article Full Title: Multichannel detrended fluctuation analysis reveals synchronized patterns of spontaneous spinal activity in anesthetized cats Short Title: Synchronized spontaneous spinal activity Corresponding Author: Enrique Hernandez-Lemus National Institute of Genomic Medicine Mexico D.F., MEXICO Keywords: Spontaneous spinal activity, detrended fluctuations analysis, correlation, synchronization Abstract: The analysis of the interaction and synchronization of relative large ensembles of neurons is fundamental for the understanding of complex functions of the nervous system. It is known that the temporal synchronization of neural ensembles is involved in the generation of specific motor, sensory or cognitive processes. Also, the intersegmental coherence of spinal spontaneous activity may indicate the existence of synaptic neural pathways between different pairs of lumbar segments. We present a multichannel detrended fluctuation analysis method (mDFA) to analyze the correlation dynamics of spontaneous spinal activity (SSA) from time series analysis. This method together with the classical detrended fluctuation analysis (DFA) were used to find out whether the SSA recorded in one or several segments in the spinal cord of the anesthetized cat occurs either in a random or in an organized manner. Our results are consistent with a non-random organization of the sets of neurons involved in the generation of spontaneous cord dorsum potentials (CDPs) recorded either from one lumbar segment or simultaneously from several lumbar segments. To test the sensitivity of the mDFA method we also examined the effects of small spinal lesions aimed to partially interrupt connectivity between neighboring lumbosacral segments. We found that the synchronization and correlation between the CDPs recorded from the L5 and L6 segments in both sides of the spinal cord were reduced when a lesion comprising the left dorsal quadrant was performed between the segments L5 and L6. The synchronization and correlation were reduced even further after a similar additional right spinal lesion. The mDFA method properly reveals the synchronization of multiple groups of neurons in several segments of the spinal cord. This method is envisaged as a useful tool to characterize the structure of higher order ensembles of cord dorsum spontaneous potentials after spinal cord or peripheral nerve lesions. All Authors: Erika E. Rodríguez Enrique Hernandez-Lemus Benjamín A. Itzá-Ortiz Ismael Jiménez Pablo Rudomín Suggested Reviewers: Alajendro Raul Hernandez Montoya, Ph.D. Professor, Universidad Veracruzana [email protected] Powered by Editorial Manager® and Preprint Manager® from Aries Systems Corporation
Transcript of PLoS ONE - UAEH1 Multichannel detrended fluctuation analysis reveals synchronized patterns of...

PLoS ONE
Multichannel detrended fluctuation analysis reveals synchronized patterns ofspontaneous spinal activity in anesthetized cats
--Manuscript Draft--
Manuscript Number: PONE-D-11-11959R1
Article Type: Research Article
Full Title: Multichannel detrended fluctuation analysis reveals synchronized patterns ofspontaneous spinal activity in anesthetized cats
Short Title: Synchronized spontaneous spinal activity
Corresponding Author: Enrique Hernandez-LemusNational Institute of Genomic MedicineMexico D.F., MEXICO
Keywords: Spontaneous spinal activity, detrended fluctuations analysis, correlation,synchronization
Abstract: The analysis of the interaction and synchronization of relative large ensembles ofneurons is fundamentalfor the understanding of complex functions of the nervous system. It is known that thetemporal synchronization of neural ensembles is involved in the generation of specificmotor, sensory or cognitive processes. Also, the intersegmental coherence of spinalspontaneous activity may indicate the existence of synaptic neural pathways betweendifferent pairs of lumbar segments. We present a multichannel detrended fluctuationanalysis method (mDFA) to analyze the correlation dynamics of spontaneous spinalactivity (SSA) from time series analysis. This method together with the classicaldetrended fluctuation analysis (DFA) were used to find out whether the SSA recordedin one or severalsegments in the spinal cord of the anesthetized cat occurs either in a random or in anorganized manner.Our results are consistent with a non-random organization of the sets of neuronsinvolved in the generationof spontaneous cord dorsum potentials (CDPs) recorded either from one lumbarsegment or simultaneously from several lumbar segments. To test the sensitivity of themDFA method we also examined the effects of small spinal lesions aimed to partiallyinterrupt connectivitybetween neighboring lumbosacral segments. We found that the synchronization andcorrelation betweenthe CDPs recorded from the L5 and L6 segments in both sides of the spinal cord werereduced whena lesion comprising the left dorsal quadrant was performed between the segments L5and L6. The synchronization and correlation werereduced even further after a similar additional right spinal lesion. The mDFA methodproperly reveals the synchronization of multiple groups of neurons inseveral segments of the spinal cord. This method is envisaged as a useful tool tocharacterize the structureof higher order ensembles of cord dorsum spontaneous potentials after spinal cord orperipheral nervelesions.
All Authors: Erika E. Rodríguez
Enrique Hernandez-Lemus
Benjamín A. Itzá-Ortiz
Ismael Jiménez
Pablo Rudomín
Suggested Reviewers: Alajendro Raul Hernandez Montoya, Ph.D.Professor, Universidad [email protected]
Powered by Editorial Manager® and Preprint Manager® from Aries Systems Corporation

Professor Hernández-Montoya is a well known scholar in the field of non-linearanalysis of time series. In particular he has been devoted to the detrended fluctuationsanalysis methodology.
Dante Chialvo, M.D., Ph.D.Professor, Northwestern [email protected] Chialvo is a world-leader in the research of complex series analysis ofneuronal functional data from electrophysiological records
Opposed Reviewers:
Powered by Editorial Manager® and Preprint Manager® from Aries Systems Corporation

COVER LETTER FOR THE SUBMISSION OF THE MANUSCRIPT:
Multichannel detrended fluctuation analysis reveals synchronized patterns of spontaneous spinal activity in
anesthetized catsBy Erika E. Rodríguez, Enrique Hernández-Lemus, Benjamín A. Itzá-Ortiz,
Ismael Jiménez and Pablo RudomínTo be considered for publication in PLoS ONE Journal
Dear PLoS ONE editors:
This letter will explain the contributions made by the submitted manuscript to the current scientific literature in the area:
The analysis of the interaction and synchronization of relative large ensembles of neurons is fundamental for the understanding of complex functions of the nervous system. In this regard It has been claimed that the central nervous system is an intrinsically synchronized dynamical system. Synchronicity in the neuronal activity appears to be an important process for information transmission. It allows the coordination of the activity of single neurons with either part or the entire population of neurons involved in the generation of specific motor, sensory or cognitive processes. Hence, there is a need for a better understanding of the correlation and synchronicity structure in such sets of neurons.
In this study we present a multichannel version of the detrended fluctuation analysis method to analyze the correlation dynamics of spontaneous spinal activity from time series analysis. This method together with the classical detrended fluctuation analysis were used to find out whether the spontaneous activity recorded in one or several segments in the spinal cord of the anesthetized cat occurs either in a random or in an organized manner. We feel that our paper will fill an existing gap in the field and hopefully will stimulate further research in this area.
Sincerely yours,
Enrique Hernández-Lemus, Ph.D.Computational Genomics Department
Nacional Institute of Genomic Medicine
Cover Letter
1 2 3 4 5 6 7 8 9 10 11 12 13 14 15 16 17 18 19 20 21 22 23 24 25 26 27 28 29 30 31 32 33 34 35 36 37 38 39 40 41 42 43 44 45 46 47 48 49 50 51 52 53 54 55 56 57 58 59 60 61 62 63 64 65

1
Multichannel detrended fluctuation analysis revealssynchronized patterns of spontaneous spinal activity inanesthetized catsErika E. Rodrıguez 1,2, Enrique Hernandez-Lemus 3,4,∗∗, Benjamın A. Itza-Ortiz 2, Ismael Jimenez 1,Pablo Rudomın 1,∗
1 Department of Physiology, Biophysics and Neurosciences, Center for Research andAdvanced Studies (CINVESTAV), Mexico City, Mexico.2 Center for Research in Mathematics, Autonomous University of Hidalgo (UAEH),Pachuca, Mexico.3 Computational Genomics Department, National Institute of Genomic Medicine, MexicoCity, Mexico.4 Center for Complexity Sciences, National Autonomous University of Mexico (UNAM),Mexico City, Mexico.∗ Corresponding author e-mail: [email protected]∗∗ Corresponding author e-mail: [email protected]
Abstract
The analysis of the interaction and synchronization of relative large ensembles of neurons is fundamen-tal for the understanding of complex functions of the nervous system. It is known that the temporalsynchronization of neural ensembles is involved in the generation of specific motor, sensory or cognitiveprocesses. Also, the intersegmental coherence of spinal spontaneous activity may indicate the existenceof synaptic neural pathways between different pairs of lumbar segments. In this study we present amultichannel version of the detrended fluctuation analysis method (mDFA) to analyze the correlationdynamics of spontaneous spinal activity (SSA) from time series analysis. This method together with theclassical detrended fluctuation analysis (DFA) were used to find out whether the SSA recorded in one orseveral segments in the spinal cord of the anesthetized cat occurs either in a random or in an organizedmanner. Our results are consistent with a non-random organization of the sets of neurons involved inthe generation of spontaneous cord dorsum potentials (CDPs) recorded either from one lumbar segment(DFA-α mean = 1.04 ± 0.09) or simultaneously from several lumbar segments (mDFA-α mean = 1.01± 0.06), where α = 0.5 indicates randomness while α > 0.5 indicates long-term correlations. To test thesensitivity of the mDFA method we also examined the effects of small spinal lesions aimed to partiallyinterrupt connectivity between neighboring lumbosacral segments. We found that the synchronizationand correlation between the CDPs recorded from the L5 and L6 segments in both sides of the spinal cordwere reduced when a lesion comprising the left dorsal quadrant was performed between the segments L5and L6 (mDFA-α = 0.992 as compared to initial conditions mDFA-α = 1.186). The synchronization andcorrelation were reduced even further after a similar additional right spinal lesion (mDFA-α = 0.924). Incontrast to the classical methods, such as correlation and coherence quantification that define a relationbetween two sets of data, the mDFA method properly reveals the synchronization of multiple groups ofneurons in several segments of the spinal cord. This method is envisaged as a useful tool to character-ize the structure of higher order ensembles of cord dorsum spontaneous potentials after spinal cord orperipheral nerve lesions.
Introduction
It has been claimed that the central nervous system is an intrinsically synchronized dynamical system [1].In this sense, synchronization refers to functional coordination characterized by rhythmic or repetitiveneural activity. In the case of neural ensembles, synchronized activity of multiple neurons can give rise
*Manuscript LaTeX template includes figure calls, but no figuresCommon.Links.ClickHereToDownload
1 2 3 4 5 6 7 8 9 10 11 12 13 14 15 16 17 18 19 20 21 22 23 24 25 26 27 28 29 30 31 32 33 34 35 36 37 38 39 40 41 42 43 44 45 46 47 48 49 50 51 52 53 54 55 56 57 58 59 60 61 62 63 64 65

2
to macroscopic oscillations, which can be experimentally observed by means of both electrophysiologicalrecords and imaging techniques [2]. Synchronicity in the neuronal activity appears to be an importantprocess for information transmission. It allows the coordination of the activity of single neurons witheither part or the entire population of neurons involved in the generation of specific motor, sensory orcognitive processes. Synchronization phenomena have been analyzed during different embryonic stagesof animals and it is considered as a probable training or preparatory step for neural network control ofseveral physiological processes [3]. For example, developing networks in the chicken become spontaneouslyactive and synchronized during early stages of development and remain this way until hatching. Thespontaneous and synchronized activity has been shown to play a fundamental role in the developmentof neurons and muscles [4]. In the field of cognitive neuroscience, reports have been given of enhancedsynchronization in groups and individual neurons during the attentive and expectation stages for visualstimuli [1]. Synchronicity of multiple regions has been found in the visual and parietal cortices of catsperforming go and no go tasks [5]. These tasks show a strong dependency in the low frequency range forα and θ signals (4-12 Hz) in electroencephalogram recordings. This behavior is stronger during go tasksthan under no go tasks and such observations have been related to expectancy [6, 7]. In human subjectsunder situations involving object [8], learning [9], language processing [10] and emotional evaluation [11],an enhancement in high-frequency α-components have been observed. This has been taken as evidencethat synchronization phenomena are the result of intrinsic dynamic interaction of sensory circuits [1].
Spontaneous cord dorsum potentials (CDPs) were first recorded in the spinal cord of the cat morethan 60 years ago by Bremer [12] and ten Cate [13]. CDPs are characterized by a noise-like backgroundactivity or basal activity generated in absence of any stimulation. Mark and Gasteiger reported thatspontaneous CDPs persisted after deafferentation or spinalization [14] and suggested they were generatedby intrinsic spinal mechanisms. Studies using intact and free moving cats indicated that the spontaneousCDPs were similar to those recorded in anesthetized animals but with lower frequency and smaller am-plitude [15].
Manjarrez and colleagues [16] reported the occurrence of spontaneous CDPs in the anesthetized catthat appear simultaneously in a variable number of segments along the spinal cord. They suggestedthat these potentials were generated by the synchronized activation of dorsal horn neuronal aggregatesdistributed along the lumbosacral spinal segments [17]. Later on, Garcıa et al [18] showed that thesynchronization between the spontaneous CDPs recorded from neighboring segments was reduced by aninterposed spinal lesion. Studies in humans provide interesting, but mostly descriptive information, onthe alterations of the spontaneous CDPs under normal and pathological conditions such as spinal cordand/or nerve lesions [19, 20].
The characterization of a possible structure of spontaneous CDPs simultaneously recorded from severalspinal segments, could give some light on the mechanisms involved in their generation and propagation.In this sense it would be very useful to have an analytical method for the analysis of synchronicity inspontaneous activated groups of neurons. In contrast to the classical methods, such as correlation andcoherence that define a relation between two sets of data, and the classical detrended fluctuation analysis(DFA) method that examines the correlation dynamics in a single channel, we present a method thatis able to characterize the structure of higher order ensembles of spontaneous CDPs in a quantitativemanner. Here we present a couple of examples aimed to explore the sensitivity of the mDFA method tocharacterize changes produced by spinal lesions which partially interrupted connectivity between neigh-boring lumbosacral segments.
1 2 3 4 5 6 7 8 9 10 11 12 13 14 15 16 17 18 19 20 21 22 23 24 25 26 27 28 29 30 31 32 33 34 35 36 37 38 39 40 41 42 43 44 45 46 47 48 49 50 51 52 53 54 55 56 57 58 59 60 61 62 63 64 65

3
Analysis
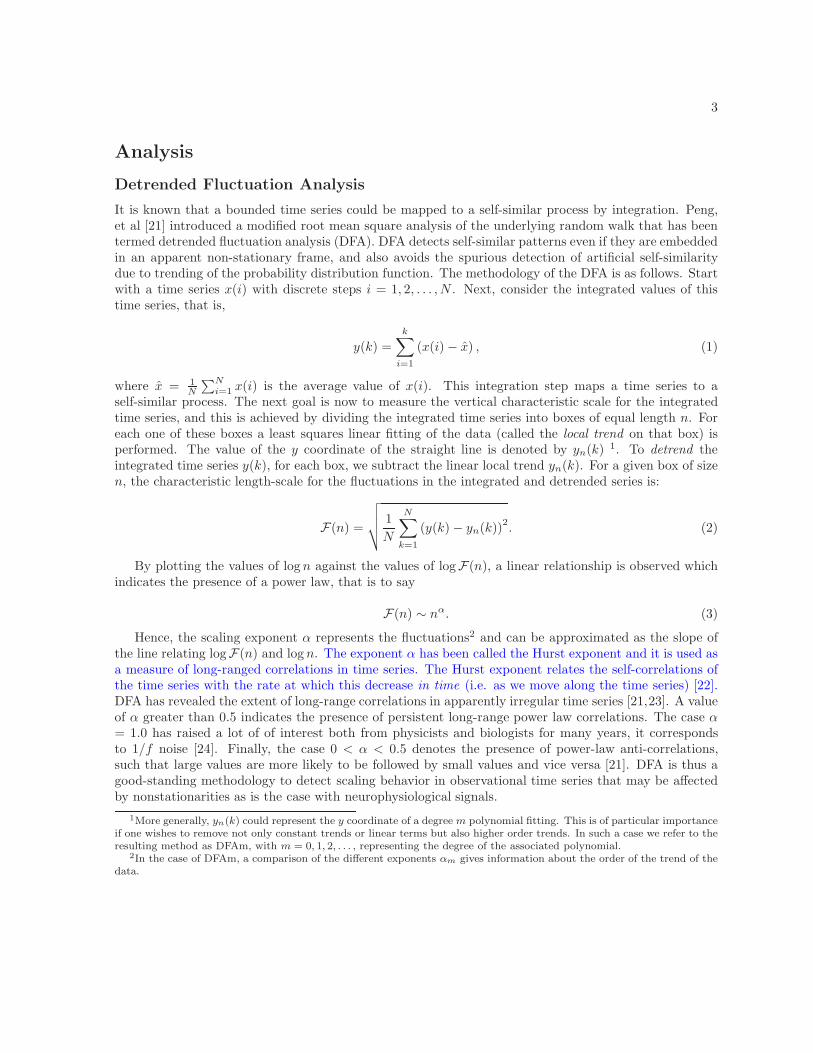
Detrended Fluctuation Analysis
It is known that a bounded time series could be mapped to a self-similar process by integration. Peng,et al [21] introduced a modified root mean square analysis of the underlying random walk that has beentermed detrended fluctuation analysis (DFA). DFA detects self-similar patterns even if they are embeddedin an apparent non-stationary frame, and also avoids the spurious detection of artificial self-similaritydue to trending of the probability distribution function. The methodology of the DFA is as follows. Startwith a time series x(i) with discrete steps i = 1, 2, . . . , N . Next, consider the integrated values of thistime series, that is,
y(k) =
k∑
i=1
(x(i)− x) , (1)
where x = 1
N
∑N
i=1x(i) is the average value of x(i). This integration step maps a time series to a
self-similar process. The next goal is now to measure the vertical characteristic scale for the integratedtime series, and this is achieved by dividing the integrated time series into boxes of equal length n. Foreach one of these boxes a least squares linear fitting of the data (called the local trend on that box) isperformed. The value of the y coordinate of the straight line is denoted by yn(k)
1. To detrend theintegrated time series y(k), for each box, we subtract the linear local trend yn(k). For a given box of sizen, the characteristic length-scale for the fluctuations in the integrated and detrended series is:
F(n) =
√√√√ 1
N
N∑
k=1
(y(k)− yn(k))2. (2)
By plotting the values of logn against the values of logF(n), a linear relationship is observed whichindicates the presence of a power law, that is to say
F(n) ∼ nα. (3)
Hence, the scaling exponent α represents the fluctuations2 and can be approximated as the slope ofthe line relating logF(n) and logn. The exponent α has been called the Hurst exponent and it is used asa measure of long-ranged correlations in time series. The Hurst exponent relates the self-correlations ofthe time series with the rate at which this decrease in time (i.e. as we move along the time series) [22].DFA has revealed the extent of long-range correlations in apparently irregular time series [21,23]. A valueof α greater than 0.5 indicates the presence of persistent long-range power law correlations. The case α= 1.0 has raised a lot of of interest both from physicists and biologists for many years, it correspondsto 1/f noise [24]. Finally, the case 0 < α < 0.5 denotes the presence of power-law anti-correlations,such that large values are more likely to be followed by small values and vice versa [21]. DFA is thus agood-standing methodology to detect scaling behavior in observational time series that may be affectedby nonstationarities as is the case with neurophysiological signals.
1More generally, yn(k) could represent the y coordinate of a degree m polynomial fitting. This is of particular importanceif one wishes to remove not only constant trends or linear terms but also higher order trends. In such a case we refer to theresulting method as DFAm, with m = 0, 1, 2, . . . , representing the degree of the associated polynomial.
2In the case of DFAm, a comparison of the different exponents αm gives information about the order of the trend of thedata.
1 2 3 4 5 6 7 8 9 10 11 12 13 14 15 16 17 18 19 20 21 22 23 24 25 26 27 28 29 30 31 32 33 34 35 36 37 38 39 40 41 42 43 44 45 46 47 48 49 50 51 52 53 54 55 56 57 58 59 60 61 62 63 64 65

4
Multichannel Detrended Fluctuation Analysis
Classical DFA [21, 24] involves time series which are sequences of observations consisting of just oneinput. The goal of DFA is to assess the long range correlation of the data involved, for example, in thenon-stationary heartbeat time series [23] and nonlinear analysis of anesthesia dynamics [25]. Since, thecentral nervous system is an intrinsically synchronized dynamic system and synchronization of multipleneuronal areas are required to process information, it seems evident the need for a similar analysis thatinvolves time series of several inputs. That is, to assess the long range correlation of multichannel data.
Attempts to apply DFA to multichannel time series have been used in the past to seismic fluctuationsdata [26] and was also used for multifractal analysis of DNA walks and trails [27]. The role of multi-dimensionality has also been discussed in relation to multifractality [28]. In the case of reference [27],DFA techniques have been compared with wavelet transform techniques and have been based in the con-sideration of a d-dimensional random walk. Both reference [26] and reference [27] applied DFA to twodimensional time series and suggested that is possible to describe a formula for multidimensional timeseries data using their formulas. Kantelhardt, et al [28] also considered the relation between the Hurstexponents and the singularity spectrum via Legendre transformation, the role of statistical deviations inDFA for short time series and the presence of correlated randomness.
Here we present a generalization of DFA that begins with a time series ~x(i) with discrete stepsi = 1, 2, . . . , N , so that each ~x(i) = (x(i)1, x(i)2, . . . , x(i)m) is a m-dimensional vector, where m is thenumber of inputs of each recording. The multichannel DFA (mDFA) could now be implemented byconsidering the integrated values of this time series as in equation (1), that is,
~y(k) =
k∑
i=1
(~x(i)− x) , (4)
where x = 1
N
∑N
i=1~x(i) is the vector consisting of the average values of the components of the vectors
~x(1), ~x(2), . . . , ~x(N) conforming our time series. As consequence of this integration step, we now have acomponentwise self-similar process. Next, we measure the vertical characteristic scale for the integratedtime series, component by component. To achieve this, we divide each component of the integrated timeseries into boxes of equal length n. For each one of this boxes and for the data of each component, aleast squares linear fitting (called the local trend of the component on that box) is performed. The vectorof values of the y coordinates of the straight lines is denoted by −→yn(k). To detrend the integrated timeseries ~y(k), we detrend component by component, so that we subtract −→yn(k). By modifying equation (2)in such a way that individual contributions for the detrended fluctuations of every vector componenti = 1, 2, . . . ,m is taken into account, we define
F(n) =
√√√√ 1
N
N∑
k=1
‖~y(k)−−→yn(k)‖2. (5)
By plotting the the values of logn against the values of logF(n), a linear relationship is observedwhich indicates the presence of a power law, that is to say
F(n) ∼ nα. (6)
Hence, the scaling exponent α represents the fluctuations and can be approximated as the slope of theline relating logF(n) and logn, as in the classic DFA situation. A value of α greater than 0.5 indicatesthe presence of persistent long-range power law correlations, while the case 0 < α < 0.5 denotes thepresence of power-law anti-correlations such that large values are more likely to be followed by smallvalues and vice versa.
1 2 3 4 5 6 7 8 9 10 11 12 13 14 15 16 17 18 19 20 21 22 23 24 25 26 27 28 29 30 31 32 33 34 35 36 37 38 39 40 41 42 43 44 45 46 47 48 49 50 51 52 53 54 55 56 57 58 59 60 61 62 63 64 65
5
Materials and Methods
General procedures
The data describe here were obtained from 10 experiments performed in adult cats. Guidelines containedin Principles of Laboratory Animal Care (NIH publications 85-23, revised in 1985) were followed in allcases and the experiments were also approved by the Institutional Bioethical Committee (Protocol num-ber: 0126-03). The animals were initially anesthetized with pentobarbitone sodium (40 mg / kg i.p) andadditional doses were given intravenously to maintain an adequate level of anesthesia, tested by assessingthat withdrawal reflexes were absent, that the pupils were constricted and the arterial blood pressurewas between 100 and 120 mm/Hg. The carotid artery, radial vein, trachea and urinary bladder werecannulated. A solution of 100 mM of sodium bicarbonate with glucose 5% was given i.v. (0.03 ml / min)to prevent acidosis [29]. When necessary, dextran 10% or ethylephrine (Effortil, Boering-Ingelheim) wasadministered to keep blood pressure above 100 mm / Hg.
The lumbosacral and low thoracic spinal segments were exposed. After the surgical procedures, theanimals were transferred to a stereotaxic metal frame allowing immobilization of the spinal cord, paralyzedwith pancuronium bromide (0.1 mg / kg) and artificially ventilated. The tidal volume was adjusted tomaintain 4% of CO2 concentration in the exhaled air. To prevent desiccation of the exposed tissues, poolswere made with the skin flaps, filled with paraffin oil and maintained between 36 and 37o C by means ofradiant heat. Usually six ball electrodes were placed on the cord dorsum of the lumbosacral enlargementat different spinal segments to record the spontaneous CDPs against an indifferent electrode placed onthe paravertebral muscles (band pass filters 0.3 Hz to 10 kHz). Left and right spinal lesions were madebetween segments L5 and L6 with particular care to avoid touching the recording electrodes.
Computational and statistical analysis
Calculations involved in computing DFA scaling exponent were implemented using computational me-thods included in the PhysioToolkit library [30] via the DFA package and the original DFA. A modifiedversion, termed multichannel detrended fluctuation analysis (mDFA) has been implemented in RapidMinerver.5.0 according to equations 4, 5 and 6. Source code for the programs may be provided if requested.Recordings of spinal lumbar segments lasted 10 minutes or 1 million points. Statistical Student t-test wasused to compare control and lesioned animals. The coherence was calculated using mscohere of MatLabver. 7.4.
Results
Intact neuroaxis and randomized spontaneous CDPs recordings
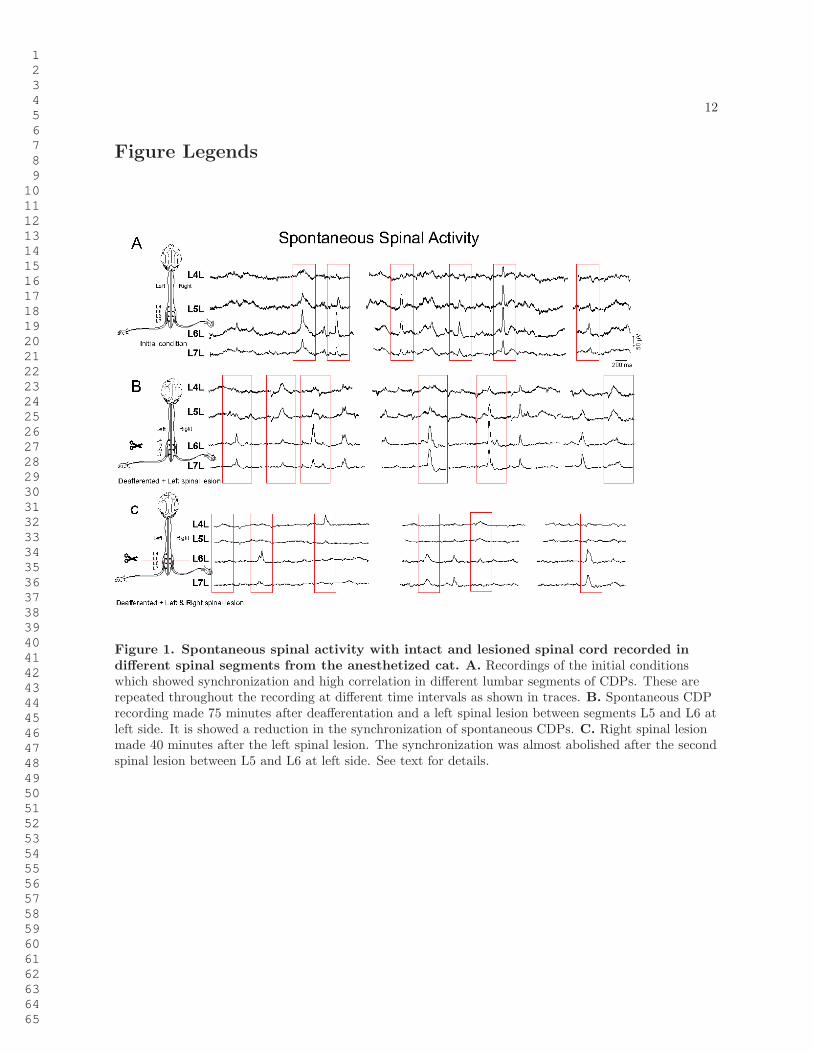
Simultaneous recordings from several segments in the cord dorsum of the lumbosacral enlargement re-vealed synchronized spontaneous potentials of different shapes and amplitudes. Figure 1A shows thespontaneous CDPs simultaneously recorded from four spinal segments (L4 to L7) in the left side in apreparation with intact neuroaxis. It may be seen that at one time the CDPs recorded in the L5 andL6 segments on the left side were larger than those recorded in the other segments. Later on, simulta-neous CDPs appeared in all segments. Particular combinations of spontaneous CDPs could be observedseveral times during a single recording period (see also Manjarrez, et. al. [16]). Since the CDPs lastapproximately from 100 ms to 300 ms, we used windows of this size in order to include the low frequencycomponents of these potentials.
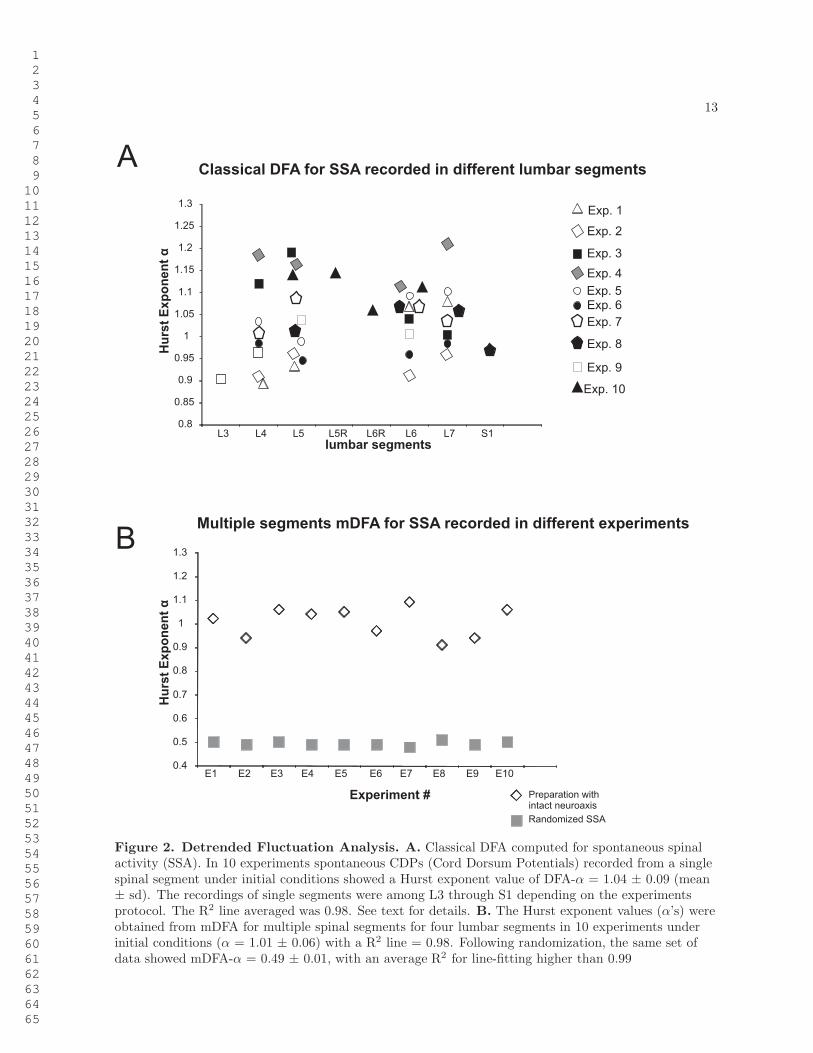
In 10 preparations with intact neuroaxis we registered the spontaneous activity simultaneously fromseveral segments (from L3 to S1) and for each single spinal segment we calculated the Hurst exponent
1 2 3 4 5 6 7 8 9 10 11 12 13 14 15 16 17 18 19 20 21 22 23 24 25 26 27 28 29 30 31 32 33 34 35 36 37 38 39 40 41 42 43 44 45 46 47 48 49 50 51 52 53 54 55 56 57 58 59 60 61 62 63 64 65

6
with the classical DFA (Figure 2A). The mean value of all Hurst exponents was 1.04 ± 0.09 (mean ±sd). In addition, we calculated the Hurst exponent by using the method mDFA, for signals recordedsimultaneously from 4 spinal segments. We obtained a mean value of 1.01 ± 0.06.
According to the criteria stated in Sections detrended fluctuation analysis and multichannel detrendedfluctuation analysis, where α = 0.5 indicates randomness while α > 0.5 indicates long-term correlations,the classical DFA data depicted in Figure 2A as well as the mDFA data of Figure 2B indicate that thespontaneous CDPs had a non-random structure suggesting that they arise from a structured neuronalorganization. In contrast, when randomized, the same set of data showed mean mDFA-α = 0.49 ± 0.01(Figure 2B ), while the mean of DFA-α = 0.49 ± 0.02.
Decoupling produced by spinal cord lesions
Spontaneous CDPs were simultaneously recorded from several spinal segments before and after a firstlesion in the left side between segments L5 and L6 and a second lesion in the right side, also betweensegments L5 and L6, both comprising the dorsolateral quadrant of the spinal cord. In order to excludepossible influences from peripheral inputs, these recordings were taken after the bilateral transection ofthe L3-S1 dorsal roots. After the left spinal lesion, the CDPs recorded from the four segments still remainsynchronized, but to a lesser degree than before the lesion (Figure 1B). After the additional lesion of theright dorsal quadrant, the synchronization between these segments was significantly reduced (Figure 1C).Yet, there was still a significant synchronicity between potentials recorded from pairs of segments eitherrostrally or caudally to the lesion. (i.e. L4 and L5 or L6 and L7). This could be interpreted as evidencefor the hypothesis that left and right groups of neurons in different segments are both interconnected bypathways running in the same as well as in the opposite sides (see Garcıa et al [18] ).
Changes in the fractal structure of spontaneous CDPs with an interposed spinal lesion
The DFA of potentials recorded in the L5L and L6L segments were reduced after the first spinal lesionin the same side, possibly because of interruption of interconnecting pathways (Figure 3A and B, blacksquares). On the other hand, the right spinal lesion had opposite effects on the Hurst values of thepotentials recorded rostrally and caudally to the lesion. Namely, the Hurst values of the L5L wereincreased from 1.098 to 1.152 and those of the L6L were reduced from 0.973 to 0.856 (Figure 3A andB, triangles). It is to be noted that these spinal lesions had different effects on logF(n), which is anindex of the fluctuations of the potentials, which varied according to the window size. In the case of thepotentials recorded from L5L, both spinal lesions produced a marked reduction of logF(n). In contrast,for L6L logF(n) remained essentially the same. The Hurst values calculated with the mDFA for theL5L - L6L ensemble were also reduced after the spinal lesions when compared with the values obtainedin the preparation with intact neuroaxis (Figure 3D and Table 1). logF(n), was also reduced, but toa smaller, yet statistically significant extent, particularly for the largest window sizes. For comparison,we also examined the changes in coherence between the L5L and L6L potentials produced by the spinallesions. (Coherence is defined as the correlation of the frequency components). We found that aftereach of the two spinal lesions the coherence was reduced throughout the whole frequency range (figure3C). Most likely, the remaining correlation was introduced by the pathways spared by the spinal lesions.These changes of the fractal correlation structure are believed to have a functional origin since it hasbeen proposed that the segmental synchronizations of dorsal root reflexes and dorsal root potentialsare mediated by the spinal cord connections through the lateral funiculi in rats and hamsters [32, 33].Therefore, if the dorsolateral fasciculus (DLF) mediates the intersegmental synchronization in the spinalcord of the anesthetized cat then a lesion comprising DLF would decouple the adjacent segments wherethe lesion was made. Partial spinal lesion reduced the amplitude of spontaneous CDPs for the segmentswith an interposed lesion (Figure 1B). Total spinal lesion almost abolished the temporal synchronizationbetween the adjacent segments where the lesion was located. The occurrence of spontaneous CDPs in the
1 2 3 4 5 6 7 8 9 10 11 12 13 14 15 16 17 18 19 20 21 22 23 24 25 26 27 28 29 30 31 32 33 34 35 36 37 38 39 40 41 42 43 44 45 46 47 48 49 50 51 52 53 54 55 56 57 58 59 60 61 62 63 64 65
7
segments L5 and L6 was significantly reduced by the complete spinal lesion (Figure 1C). On the otherhand, coherence showed a significantly reduced correlation in the low frequency components which arerelated to the spontaneous CDPs. Furthermore, the mDFA shows a reduction when compared to theintact neuroaxis and fluctuations were significantly reduced for the windows with sizes that comprisedthe spontaneous CDPs (Figure 3). Since the reduction in the correlation of spontaneous CDPs betweenthe segments with an interposed lesion (Figure 1C) reveals a reduction of mDFA Hurst values (Figure3D), this points out that spinal cord lesions changed the fractal structure of spontaneous cord dorsumpotentials.
Changes in the fractal structure of spontaneous CDPs recorded rostral to lesions
The DFA of potentials recorded in L5L and L5R segments, both above the lesion, were reduced afterthe first left spinal lesion (Figure 4A and B, black squares) and slightly increased after the second lesion.More specifically, the Hurst values of the L5L and L5R were increased from 1.098 to 1.152 and from 1.043to 1.358, respectively (Figure 4A and B, triangles). In addition, logF(n) was reduced throughout thewhole window range (Table 2). The Hurst values calculated with the mDFA for the L5L - L5R ensemblewere also reduced after the first left spinal lesion when compared with values obtained while the neuroaxiswas still intact (from 1.201 to 1.069) and subsequently increased after the second spinal lesion to 1.246(Figure 4D and Table 2). logF(n) was also significantly reduced, throughout the whole window range(Table 2). Quite interestingly, in this case the coherence between the potentials recorded from L5L andL5R was increased throughout the whole frequency range (Figure 4C).
Changes in the fractal structure of spontaneous CDPs recorded caudal to the lesion.
The DFA of potentials recorded in L6L and L6R were reduced after each of the two spinal lesions. Namely,the Hurst values of the L6L were reduced from 1.182 to 0.973 and 0.856 and those of the L6R from 1.146to 0.882 and 0.837 (Figure 5A and B, squares and triangles). However, logF(n) for both L6L and L6Rremained essentially the same (Table 3). A similar behavior was seen with the Hurst values calculatedwith the mDFA for the L6L-L6R ensemble (from 1.163 to 0.902 and 0.914 after the first and secondlesions, respectively (Figure 5D and Table 3). logF(n), was not significantly changed. In this case, thecoherence between the L6L and L6R potentials was reduced after the first spinal lesion and increasedafter the second lesion as the mDFA of L6L-L6R.(Figure 5C and D).
mDFA for multiple lumbar segments recordings
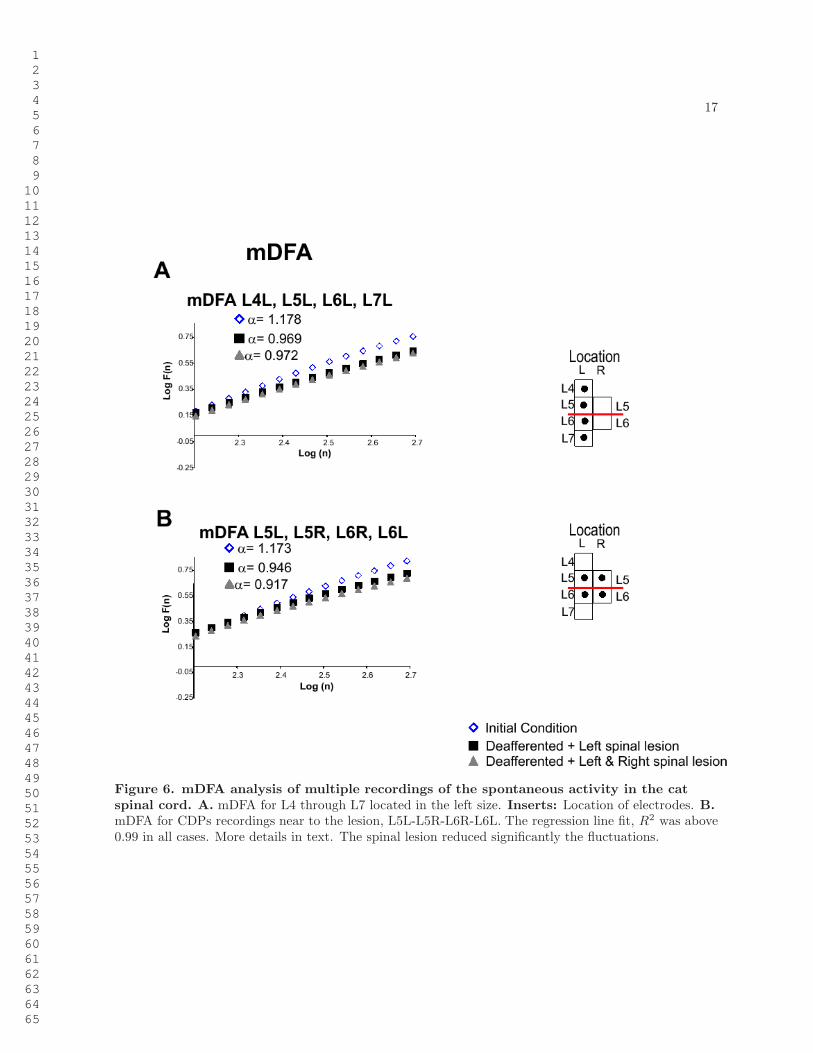
One of the purposes of the mDFA was to examine the fractal structure of the potentials recorded frommultiple segments. To this end we analyzed the mDFA of the ensemble of potentials recorded from theL4 to L7 segments in the left side, as indicated in insert in Figure 6A. After the left spinal lesion betweenL5L and L6L, the Hurst value of the mDFA was reduced from 1.178 to 0.969 and remained essentiallythe same after the lesion in the right side (0.972). logF(n) was larger than the values calculated forthe single segments (Figures 3- 5), suggesting larger fluctuations or intersegmental synchronizations. Wealso analyzed the changes produced for the ensemble of 4 sets of potentials obtained from the L5 and L6segments in both sides (L5L - L5R - L6R - L6L; see insert in Figure 6B). The mDFA Hurst exponentswere reduced from 1.173 to 0.946 and 0.917, after the first and second spinal lesions, respectively. Alsothe fluctuations were significantly reduced for the largest window size (Table 4). Note the mDFA valuesof the adjacent segments to the lesion (Figure 6B) were reduced more than those located rostrocaudally(Figure 6A).
1 2 3 4 5 6 7 8 9 10 11 12 13 14 15 16 17 18 19 20 21 22 23 24 25 26 27 28 29 30 31 32 33 34 35 36 37 38 39 40 41 42 43 44 45 46 47 48 49 50 51 52 53 54 55 56 57 58 59 60 61 62 63 64 65

8
Discussion
We have shown that detrended fluctuations analysis (DFA) of the spontaneous cord dorsum potentials al-lows detection of dynamic signatures characteristic of long-range correlations. This may indicate a fractalstructure of the neuronal sets involved in the generation of these potentials. As it was shown by means ofrandomized versions of the experimental data, these long-ranged correlations are not artifacts, but rathera characteristic feature of spontaneous CDPs. As an example of the utility of the method, we analyzeddata from one typical experiment aimed to examine the effects of partial spinal lesions. We could showthat spinal damage reduced the Hurst exponents of individual spinal segments as well as the correlationlength of the signals. logF(n), which is an index of the fluctuations of the potentials was also reducedafter the spinal lesions. This is in agreement with previous findings, where it was shown that these le-sions reduced the correlation between the CDPs recorded from segments adjacent to the spinal lesions [31].
An important feature of this work is the introduction of multichannel detrended fluctuations analysis(mDFA), as a generalization of DFA for multichannel signals. By means of mDFA we studied the effectof long range of correlations in multiple spinal segments measurements of SSA also noticing the presenceof a long range correlation structure in intact spinal cord recordings. mDFA also revealed an alreadyenvisioned temporal synchronization in the activity of multiple segmental signals, thus revealing spinalcommunication as a complex coupled phenomenon. To reveal the effect of synchronization in the intactneuroaxis and spinal cord damage we performed mDFA calculations of multiple-segmental signals. Theseresults point out to multiple segments SSA as highly correlated, highly synchronized phenomena for theintact neuroaxis and spinal damage caused both decorrelation and desynchronization of SSA signals.
In contrast to the classical methods, such as correlation and coherence quantification that define arelation between two sets of data, and the classical DFA method that analyzes the correlation dynamicsin a single channel, the mDFA method presented here appears to be adequate to examine the synchro-nization between spontaneous potentials recorded from multiple spinal segments. It thus seems thatthe mDFA may be useful approach to characterize the functional state of the network under differentexperimental conditions, such as those induced by acute peripheral nerve or dorsal root section or partialspinal lesions. To test the method we compared mDFA values of multiple-segmental signals before andafter spinal lesions in a typical experiment. After the first spinal lesion, the mDFA values were reducedfor sets of the segments located rostrally, caudally and also with interposed lesions. logF(n), which inthis case is an index of the fluctuations of the potentials recorded in the whole ensemble, was also reducedafter the first spinal lesion, mainly for sets located rostrally and with interposed lesions. After the secondspinal lesion the mDFA values increased for recordings located rostrally or caudally to the lesion, in con-trast with the reduced mDFA values for segments adjacent to the lesion. The observed differences in themDFA for pairs located rostrally and caudally to the lesion can be accounted for by assuming that therostral segments were subjected to descending influences which may be different from those affecting thesegments located caudally to the lesion. The interposed lesions show a reduction in the intersegmentalcorrelation, which was reflected in the reduction in the mDFA α values as well as logF(n), particularlyfor the largest window sizes. This suggests that the interconnections between the segments adjacent tothe spinal lesions were largely reduced. It should be noted that in general the observed changes in mDFAwere consistent with the changes in coherence (Figure 3C, 4C and 5C).
The mDFA method has thus revealed as an effective algorithm for the analysis of correlation andsynchronization of spontaneous CDPs in different segments. The ensembles involved in the generationof these potentials have a non-random organization of interconnected sets distributed throughout thelumbosacral spinal cord that depends on the overall balance between the descending and segmentalinputs, presumably in both sides of the spinal cord [31]. This may explain the inability of a lesion in oneside of the spinal cord to completely desynchronize the spontaneous CDPs. The mDFA method may have
1 2 3 4 5 6 7 8 9 10 11 12 13 14 15 16 17 18 19 20 21 22 23 24 25 26 27 28 29 30 31 32 33 34 35 36 37 38 39 40 41 42 43 44 45 46 47 48 49 50 51 52 53 54 55 56 57 58 59 60 61 62 63 64 65

9
a potential use to characterize the state of the spinal cord in those instances where a fast quantitativedetermination of spinal damage is needed. mDFA may have have thus potential use in clinical instancesfor a fast quantitative determination of spinal damage. More detailed neurophysiological studies areneeded to determine the actual mechanisms of spinal synchronization and correlation.
Acknowledgments
The first and last authors gratefully acknowledge partial support by grants: NIH NS 09196 and CONACyT50900. We also acknowledge technical support from Cirilo Leon, Edson Hernandez, Diogenes Chavez.Implementation of mDFA in RapidMiner was done by Dr. Javier Bejar and Prof. Ulises Cortes, membersof the BCN team of the Technical University of Catalonia. We also thank Patricia Pliego Pastrana fromAutonomous University of Hidalgo and Guillermo Romero Melendez from University of Las Americas fortheir useful comments.
References
1. Engel A K, Fries P, Singer W (2001) Dynamic predictions oscillations and synchrony in top-downprocessing. Reviews Macmillan Magazines Ltd 2, 704-716.
2. Izhikevich EM (2007), Dynamical systems in neuroscience, The MIT Press, Cambridge, Mas-sachusetts.
3. O’Donovan M J (1999) The origin of spontaneous activity in developing networks of the vertebratenervous system. Current Opinion in Neurobiology 9, 94-104.
4. O’Donovan M J, Chub N, Wenner P (1998) Mechanisms of spontaneous activity in developingspinal networks. J. Neurobiol. 37, 131-145.
5. Roelfsema P R, Engel A K, Konig P, Singer, W (1997) Visuomotor integration is associated withzero-time lag synchronization among cortical areas. Nature 385, 157-161.
6. Von Stein A, Chiang C, Konig P,(2000)Top-down processing mediated by interareal synchronization.Proc. Natl. Acad. Sci. USA 97, 14748-14753.
7. Bernasconi C, Von Stein A, Chiang C, Konig, P (2000) Bidirectional interactions between visualareas in the awake behaving cat. Neuroreport 11, 1-4.
8. Rodriguez E, George N, Lachaux J P, Martinerie J, Renault B, Varela F J (1999) Perception’sshadow: long-distance synchronization of human brain activity. Nature 397, 430-433.
9. Miltner WHR, Braun C, Arnold M, Witte H, Taub E (1999) Coherence of gamma-band EEGactivity as a basis for associative learning. Nature 397, 434-436.
10. Pulvermuller F, Lutzenberger W, Preissl H, Birbaumer N (1995) Spectral responses in the gamma-band: physiological signs of higher cognitive processes?. Neuroreport 6, 2059-2064.
11. Muller MM, Keil A, Gruber T, Elbert T (1999) Processing of affective picture modulates right-hemispheric gamma band EEG activity. Clin. Neurophysiol. 110, 1913-1920.
12. Bremer F (1941) Lactivite electrique ’spontaee’ de la moelle epinere. Arch. Internat. Physiologie51:51-84.
1 2 3 4 5 6 7 8 9 10 11 12 13 14 15 16 17 18 19 20 21 22 23 24 25 26 27 28 29 30 31 32 33 34 35 36 37 38 39 40 41 42 43 44 45 46 47 48 49 50 51 52 53 54 55 56 57 58 59 60 61 62 63 64 65

10
13. ten Cate J (1950) Spontaneous electrical activity of the spinal cord, Electroenceph. Clin. Neuro-physiol. 2, 445-451.
14. Mark V H, Gasteiger E L (1953) Observations on the role of afferent and descending impulses onthe spontaneous potentials of the spinal cord. Electroenceph. Clin. Neurophysiol. 5, 251-258.
15. Kasprzak H, Gasteiger E L (1970) Spinal electrogram of freely moving cat: Supraspinal and seg-mental influences. Brain Res. 22, 207-220.
16. Manjarrez E, Jimenez I, Rudomin P (2003) Intersegmental synchronization of spontaneous activityof dorsal horn neurons in the cat spinal cord. Exp. Brain Res. 148, 401-413.
17. Manjarrez E, Rojas-Piloni JG, Jimnez I, Rudomin P (2000), Modulation of synaptic transmissionfrom segmental afferents by spontaneous activity of dorsal horn spinal neurones in the cat. Journalof Physiology (London) 529: 445-460
18. Garcıa C A, Chavez D, Jimenez I, Rudomin P (2004) Effects of spinal and peripheral nerve lesionson the intersegmental synchronization of the spontaneous activity of dorsal horn neurons in the catlumbosacral spinal cord. Neurosci. Lett. 361, 102-105.
19. Ertekin C, Sarica Y, Uckardesler L (1983) Studies on the human spontaneous electromyelogram(EMycloG) I. Normal subjects. EEG & Clin. Neurophysiol. 55, 13-23.
20. Gerasimenko Y P, Bogacheva I N, Shcherbakova N A, Makarovskii A N (2001) Bioelectric activityof spinal cord in patients with vertebrospinal pathologies. Bull. Esp. Biol. Med. 11, 575-578.
21. Peng C-K, Buldyrev S V, Havlin S, Simons M, Stanley H E, Goldberger A L (1994) Mosaicorganization of DNA nucleotides. Phys. Rev. E 49, 1685-1689.
22. Feder J (1988), Fractals, New York; Plenum Press. ISBN 0-306-42851-2
23. Peng C-K, Havlin S, Stanley H E, Goldberger A L (1995) Quantification of scaling exponents andcrossover phenomena in nonstationary heartbeat time series. Chaos 5, 82-87.
24. Li W, Holste D (2005) Universal 1/f noise, crossovers of scaling exponents, and chromosome-specific patterns of guanine-cytosine content in DNA sequences of the human genome. PhysicalReview E 71, 0419410-19.
25. Gifani P, Rabiee H R, Hashemi M R, Taslimi P, Ghanbari M (2006) Nonlinear analysis of anesthesiadynamics by Fractal Scaling Exponent. Conf Proc. IEEE Eng. Med. Biol. Soc. 1, 6225-8.
26. Telesca L, Lovallo M, Lapenna V, Macchiato M (2007) Long-range correlations in two dimensionalspatio-temporal seismic fluctuations. Physica A 377, 279-284.
27. Rosas A, Nogueira E, Fontanari J F (2002) Multifractal analysis of DNA walks and trails. PhysicalReview E 66, 1-6.
28. Kantelhardt J W, Zschiegner S A, Koscielny-Bunde E, Havlin S, Bunde A, Stanley H E (2002)Multifractal detrended fluctuation analysis of nonstationary time series. Physica A 316, 87-114.
29. Rudomin P, Hernandez E, Lomeli J (2007) Tonic and phasic differential GABAergic inhibition ofsynaptic actions of joint afferents in the cat. Exp. Brain Res. 176, 98-118.
30. Goldberger A L, Amaral L A, Glass L, Hausdorff J M, Ivanov P C, Mark R G, Mietus J E, MoodyG B, Peng C-K, Stanley H E (2000) PhysioBank, PhysioToolkit, and PhysioNet: components of anew research resource for complex physiologic signals. Circulation 101, 215-20.
1 2 3 4 5 6 7 8 9 10 11 12 13 14 15 16 17 18 19 20 21 22 23 24 25 26 27 28 29 30 31 32 33 34 35 36 37 38 39 40 41 42 43 44 45 46 47 48 49 50 51 52 53 54 55 56 57 58 59 60 61 62 63 64 65

11
31. Chavez D, Rodriguez E, Jimenez I, and Rudomin P (2011) Changes in correlation between spon-taneous activity of dorsal horn neurones and differential recruitment of inhibitory pathways in thecat. submitted to J Physiol/2011/212381.
32. Kerkut GA, Bagust J (1995), The isolated mammalian spinal cord, Prog Neurobiol. 46(1):1-48
33. Lidierth M, Wall PD, (1996) Synchronous inherent oscillations of potentials within the rat lumbarspinal cord, Neurosci Lett. 220(1):25-8
1 2 3 4 5 6 7 8 9 10 11 12 13 14 15 16 17 18 19 20 21 22 23 24 25 26 27 28 29 30 31 32 33 34 35 36 37 38 39 40 41 42 43 44 45 46 47 48 49 50 51 52 53 54 55 56 57 58 59 60 61 62 63 64 65
12
Figure Legends
Figure 1. Spontaneous spinal activity with intact and lesioned spinal cord recorded indifferent spinal segments from the anesthetized cat. A. Recordings of the initial conditionswhich showed synchronization and high correlation in different lumbar segments of CDPs. These arerepeated throughout the recording at different time intervals as shown in traces. B. Spontaneous CDPrecording made 75 minutes after deafferentation and a left spinal lesion between segments L5 and L6 atleft side. It is showed a reduction in the synchronization of spontaneous CDPs. C. Right spinal lesionmade 40 minutes after the left spinal lesion. The synchronization was almost abolished after the secondspinal lesion between L5 and L6 at left side. See text for details.
1 2 3 4 5 6 7 8 9 10 11 12 13 14 15 16 17 18 19 20 21 22 23 24 25 26 27 28 29 30 31 32 33 34 35 36 37 38 39 40 41 42 43 44 45 46 47 48 49 50 51 52 53 54 55 56 57 58 59 60 61 62 63 64 65
13
0.8
0.85
0.9
0.95
1
1.05
1.1
1.15
1.2
1.25
1.3
L3 L4 L5 L5R L6R L6 L7 S1
lumbar segments
Classical DFA for SSA recorded in different lumbar segments
Exp. 9
Exp. 1
Exp. 2
Exp. 3
Exp. 4
Exp. 5Exp. 6
Exp. 7
Exp. 8
Exp. 10
0.4
0.5
0.6
0.7
0.8
0.9
1
1.1
1.2
1.3
E1 E2 E3 E4 E5 E6 E7 E8 E9 E10
Preparation withintact neuroaxis
Randomized SSA
Hu
rst
Ex
po
ne
nt
α
Experiment #
Multiple segments mDFA for SSA recorded in different experiments
Hu
rst
Ex
po
ne
nt
αA
B
Figure 2. Detrended Fluctuation Analysis. A. Classical DFA computed for spontaneous spinalactivity (SSA). In 10 experiments spontaneous CDPs (Cord Dorsum Potentials) recorded from a singlespinal segment under initial conditions showed a Hurst exponent value of DFA-α = 1.04 ± 0.09 (mean± sd). The recordings of single segments were among L3 through S1 depending on the experimentsprotocol. The R2 line averaged was 0.98. See text for details. B. The Hurst exponent values (α’s) wereobtained from mDFA for multiple spinal segments for four lumbar segments in 10 experiments underinitial conditions (α = 1.01 ± 0.06) with a R2 line = 0.98. Following randomization, the same set ofdata showed mDFA-α = 0.49 ± 0.01, with an average R2 for line-fitting higher than 0.99
1 2 3 4 5 6 7 8 9 10 11 12 13 14 15 16 17 18 19 20 21 22 23 24 25 26 27 28 29 30 31 32 33 34 35 36 37 38 39 40 41 42 43 44 45 46 47 48 49 50 51 52 53 54 55 56 57 58 59 60 61 62 63 64 65

14
Figure 3. Recordings of spontaneous spinal activity with an interposed lesion in initialconditions, deafferented and spinal lesions. A. Classical DFA for L5L. Insert: Location ofelectrodes. B. Classical DFA for L6L. C. Coherence between L5L-L6L. D. mDFA L5L-L6L. Thecoherence was reduced after lesions as well as mDFA Hurst exponents. The regression line fit, R2 wasabove 0.99 in all cases. The spinal lesion reduced the fluctuations significantly. More details in text.
1 2 3 4 5 6 7 8 9 10 11 12 13 14 15 16 17 18 19 20 21 22 23 24 25 26 27 28 29 30 31 32 33 34 35 36 37 38 39 40 41 42 43 44 45 46 47 48 49 50 51 52 53 54 55 56 57 58 59 60 61 62 63 64 65

15
Figure 4. Recordings of spontaneous spinal activity above the lesion with initialconditions, deafferented and spinal lesions. A. Classical DFA for L5L. Insert: Boxes indicatingthe location of electrodes L5 left and L5 right (black dots). B. Classical DFA for L5R. C. Coherence forL5L- L5R increased after lesions. D. mDFA L5L-L5R. The regression line fit, R2 was higher than 0.99in all cases. Note that the spinal lesion significantly reduced the logarithm of the fluctuations of signals(P < 0.001). The fractal structure increased after the second lesion for both classical DFA and mDFAfor the recordings above the lesion. See details in text.
1 2 3 4 5 6 7 8 9 10 11 12 13 14 15 16 17 18 19 20 21 22 23 24 25 26 27 28 29 30 31 32 33 34 35 36 37 38 39 40 41 42 43 44 45 46 47 48 49 50 51 52 53 54 55 56 57 58 59 60 61 62 63 64 65

16
Figure 5. Spontaneous spinal recordings located below the lesion. A. classical DFA for L6L.Insert: Location of electrodes. B. Classical DFA for L6R. C. Coherence between L6L-L6R wasreduced for first lesion and followed by an increased for the second lesion as well as mDFA. D. mDFAfor L6L and L6R. The regression line fit, R2 was above 0.99 in all cases. More details in text. Note thatthe spinal lesion reduced the fluctuations, but such effect was not significant.
1 2 3 4 5 6 7 8 9 10 11 12 13 14 15 16 17 18 19 20 21 22 23 24 25 26 27 28 29 30 31 32 33 34 35 36 37 38 39 40 41 42 43 44 45 46 47 48 49 50 51 52 53 54 55 56 57 58 59 60 61 62 63 64 65
17
Figure 6. mDFA analysis of multiple recordings of the spontaneous activity in the catspinal cord. A. mDFA for L4 through L7 located in the left size. Inserts: Location of electrodes. B.mDFA for CDPs recordings near to the lesion, L5L-L5R-L6R-L6L. The regression line fit, R2 was above0.99 in all cases. More details in text. The spinal lesion reduced significantly the fluctuations.
1 2 3 4 5 6 7 8 9 10 11 12 13 14 15 16 17 18 19 20 21 22 23 24 25 26 27 28 29 30 31 32 33 34 35 36 37 38 39 40 41 42 43 44 45 46 47 48 49 50 51 52 53 54 55 56 57 58 59 60 61 62 63 64 65

18
Tables
Table 1. p-values for significance tests of fluctuations reduction caused by lesions in L5Land L6L
Interposed lesions Left spinal lesion Right spinal lesion
DFA L5L p < 2.14 × 10⁻¹⁸ p < 7.01 × 10⁻²²
DFA L6L p < 9.0 × 10⁻³ p < 1.4 × 10⁻²
mDFA L5L-L6L p < 3.18 × 10⁻⁶ p < 2.04 × 10⁻⁷
Table 2. p-values for significance tests of fluctuations reduction caused by lesions in L5Land L5R
Rostral to the lesion Left spinal lesion Right spinal lesion
DFA L5L p < 2.14 × 10⁻¹⁸ p < 7.01 × 10⁻²²
DFA L5R p < 2.70 × 10⁻¹² p < 2.89 × 10⁻¹⁴
mDFA L5L-L5R p < 2.22 × 10⁻¹⁵ p < 9.49 × 10⁻²¹
1 2 3 4 5 6 7 8 9 10 11 12 13 14 15 16 17 18 19 20 21 22 23 24 25 26 27 28 29 30 31 32 33 34 35 36 37 38 39 40 41 42 43 44 45 46 47 48 49 50 51 52 53 54 55 56 57 58 59 60 61 62 63 64 65

19
Table 3. p-values for significance tests of fluctuations reduction caused by lesions in L6Land L6R
Caudal to the lesion Left spinal lesion Right spinal lesion
DFA L6L p < 9.0 × 10⁻³ p < 1.4 × 10⁻²
DFA L6R p < 2.29 × 10⁻¹ p < 9.93 × 10⁻¹
mDFA L6L-L6R p < 6.7 × 10⁻² p < 2.4 × 10⁻¹
Table 4. p-values for significance tests of fluctuations reduction caused by lesions in L6Land L6R
mDFA Left spinal lesion Right spinal lesion
mDFA L4L-L5L-L6L-L7L p < 3.66 × 10⁻⁶ p < 2.44 × 10⁻⁷
mDFA L5L-L5R-L6R-L6L p < 5.0 × 10⁻⁴ p < 1.44 × 10⁻⁵
1 2 3 4 5 6 7 8 9 10 11 12 13 14 15 16 17 18 19 20 21 22 23 24 25 26 27 28 29 30 31 32 33 34 35 36 37 38 39 40 41 42 43 44 45 46 47 48 49 50 51 52 53 54 55 56 57 58 59 60 61 62 63 64 65

1
Multichannel detrended fluctuation analysis revealssynchronized patterns of spontaneous spinal activity inanesthetized catsErika E. Rodrıguez 1,2, Enrique Hernandez-Lemus 3,4,∗∗, Benjamın A. Itza-Ortiz 2, Ismael Jimenez 1,Pablo Rudomın 1,∗
1 Department of Physiology, Biophysics and Neurosciences, Center for Research andAdvanced Studies (CINVESTAV), Mexico City, Mexico.2 Center for Research in Mathematics, Autonomous University of Hidalgo (UAEH),Pachuca, Mexico.3 Computational Genomics Department, National Institute of Genomic Medicine, MexicoCity, Mexico.4 Center for Complexity Sciences, National Autonomous University of Mexico (UNAM),Mexico City, Mexico.∗ Corresponding author e-mail: [email protected]∗∗ Corresponding author e-mail: [email protected]
Abstract
The analysis of the interaction and synchronization of relative large ensembles of neurons is fundamen-tal for the understanding of complex functions of the nervous system. It is known that the temporalsynchronization of neural ensembles is involved in the generation of specific motor, sensory or cognitiveprocesses. Also, the intersegmental coherence of spinal spontaneous activity may indicate the existenceof synaptic neural pathways between different pairs of lumbar segments. In this study we present amultichannel version of the detrended fluctuation analysis method (mDFA) to analyze the correlationdynamics of spontaneous spinal activity (SSA) from time series analysis. This method together with theclassical detrended fluctuation analysis (DFA) were used to find out whether the SSA recorded in one orseveral segments in the spinal cord of the anesthetized cat occurs either in a random or in an organizedmanner. Our results are consistent with a non-random organization of the sets of neurons involved inthe generation of spontaneous cord dorsum potentials (CDPs) recorded either from one lumbar segment(DFA-α mean = 1.04 ± 0.09) or simultaneously from several lumbar segments (mDFA-α mean = 1.01± 0.06), where α = 0.5 indicates randomness while α > 0.5 indicates long-term correlations. To test thesensitivity of the mDFA method we also examined the effects of small spinal lesions aimed to partiallyinterrupt connectivity between neighboring lumbosacral segments. We found that the synchronizationand correlation between the CDPs recorded from the L5 and L6 segments in both sides of the spinal cordwere reduced when a lesion comprising the left dorsal quadrant was performed between the segments L5and L6 (mDFA-α = 0.992 as compared to initial conditions mDFA-α = 1.186). The synchronization andcorrelation were reduced even further after a similar additional right spinal lesion (mDFA-α = 0.924). Incontrast to the classical methods, such as correlation and coherence quantification that define a relationbetween two sets of data, the mDFA method properly reveals the synchronization of multiple groups ofneurons in several segments of the spinal cord. This method is envisaged as a useful tool to character-ize the structure of higher order ensembles of cord dorsum spontaneous potentials after spinal cord orperipheral nerve lesions.
Introduction
It has been claimed that the central nervous system is an intrinsically synchronized dynamical system [1].In this sense, synchronization refers to functional coordination characterized by rhythmic or repetitiveneural activity. In the case of neural ensembles, synchronized activity of multiple neurons can give rise
Revised Manuscript with Track Changes
2
to macroscopic oscillations, which can be experimentally observed by means of both electrophysiologicalrecords and imaging techniques [2]. Synchronicity in the neuronal activity appears to be an importantprocess for information transmission. It allows the coordination of the activity of single neurons witheither part or the entire population of neurons involved in the generation of specific motor, sensory orcognitive processes. Synchronization phenomena have been analyzed during different embryonic stagesof animals and it is considered as a probable training or preparatory step for neural network control ofseveral physiological processes [3]. For example, developing networks in the chicken become spontaneouslyactive and synchronized during early stages of development and remain this way until hatching. Thespontaneous and synchronized activity has been shown to play a fundamental role in the developmentof neurons and muscles [4]. In the field of cognitive neuroscience, reports have been given of enhancedsynchronization in groups and individual neurons during the attentive and expectation stages for visualstimuli [1]. Synchronicity of multiple regions has been found in the visual and parietal cortices of catsperforming go and no go tasks [5]. These tasks show a strong dependency in the low frequency range forα and θ signals (4-12 Hz) in electroencephalogram recordings. This behavior is stronger during go tasksthan under no go tasks and such observations have been related to expectancy [6, 7]. In human subjectsunder situations involving object [8], learning [9], language processing [10] and emotional evaluation [11],an enhancement in high-frequency α-components have been observed. This has been taken as evidencethat synchronization phenomena are the result of intrinsic dynamic interaction of sensory circuits [1].
Spontaneous cord dorsum potentials (CDPs) were first recorded in the spinal cord of the cat morethan 60 years ago by Bremer [12] and ten Cate [13]. CDPs are characterized by a noise-like backgroundactivity or basal activity generated in absence of any stimulation. Mark and Gasteiger reported thatspontaneous CDPs persisted after deafferentation or spinalization [14] and suggested they were generatedby intrinsic spinal mechanisms. Studies using intact and free moving cats indicated that the spontaneousCDPs were similar to those recorded in anesthetized animals but with lower frequency and smaller am-plitude [15].
Manjarrez and colleagues [16] reported the occurrence of spontaneous CDPs in the anesthetized catthat appear simultaneously in a variable number of segments along the spinal cord. They suggestedthat these potentials were generated by the synchronized activation of dorsal horn neuronal aggregatesdistributed along the lumbosacral spinal segments [17]. Later on, Garcıa et al [18] showed that thesynchronization between the spontaneous CDPs recorded from neighboring segments was reduced by aninterposed spinal lesion. Studies in humans provide interesting, but mostly descriptive information, onthe alterations of the spontaneous CDPs under normal and pathological conditions such as spinal cordand/or nerve lesions [19, 20].
The characterization of a possible structure of spontaneous CDPs simultaneously recorded from severalspinal segments, could give some light on the mechanisms involved in their generation and propagation.In this sense it would be very useful to have an analytical method for the analysis of synchronicity inspontaneous activated groups of neurons. In contrast to the classical methods, such as correlation andcoherence that define a relation between two sets of data, and the classical detrended fluctuation analysis(DFA) method that examines the correlation dynamics in a single channel, we present a method thatis able to characterize the structure of higher order ensembles of spontaneous CDPs in a quantitativemanner. Here we present a couple of examples aimed to explore the sensitivity of the mDFA method tocharacterize changes produced by spinal lesions which partially interrupted connectivity between neigh-boring lumbosacral segments.
3
Analysis
Detrended Fluctuation Analysis
It is known that a bounded time series could be mapped to a self-similar process by integration. Peng,et al [21] introduced a modified root mean square analysis of the underlying random walk that has beentermed detrended fluctuation analysis (DFA). DFA detects self-similar patterns even if they are embeddedin an apparent non-stationary frame, and also avoids the spurious detection of artificial self-similaritydue to trending of the probability distribution function. The methodology of the DFA is as follows. Startwith a time series x(i) with discrete steps i = 1, 2, . . . , N . Next, consider the integrated values of thistime series, that is,
y(k) =
k∑
i=1
(x(i)− x) , (1)
where x = 1
N
∑N
i=1x(i) is the average value of x(i). This integration step maps a time series to a
self-similar process. The next goal is now to measure the vertical characteristic scale for the integratedtime series, and this is achieved by dividing the integrated time series into boxes of equal length n. Foreach one of these boxes a least squares linear fitting of the data (called the local trend on that box) isperformed. The value of the y coordinate of the straight line is denoted by yn(k)
1. To detrend theintegrated time series y(k), for each box, we subtract the linear local trend yn(k). For a given box of sizen, the characteristic length-scale for the fluctuations in the integrated and detrended series is:
F(n) =
√√√√ 1
N
N∑
k=1
(y(k)− yn(k))2. (2)
By plotting the values of logn against the values of logF(n), a linear relationship is observed whichindicates the presence of a power law, that is to say
F(n) ∼ nα. (3)
Hence, the scaling exponent α represents the fluctuations2 and can be approximated as the slope ofthe line relating logF(n) and logn. The exponent α has been called the Hurst exponent and it is used asa measure of long-ranged correlations in time series. The Hurst exponent relates the self-correlations ofthe time series with the rate at which this decrease in time (i.e. as we move along the time series) [22].DFA has revealed the extent of long-range correlations in apparently irregular time series [21,23]. A valueof α greater than 0.5 indicates the presence of persistent long-range power law correlations. The case α= 1.0 has raised a lot of of interest both from physicists and biologists for many years, it correspondsto 1/f noise [24]. Finally, the case 0 < α < 0.5 denotes the presence of power-law anti-correlations,such that large values are more likely to be followed by small values and vice versa [21]. DFA is thus agood-standing methodology to detect scaling behavior in observational time series that may be affectedby nonstationarities as is the case with neurophysiological signals.
1More generally, yn(k) could represent the y coordinate of a degree m polynomial fitting. This is of particular importanceif one wishes to remove not only constant trends or linear terms but also higher order trends. In such a case we refer to theresulting method as DFAm, with m = 0, 1, 2, . . . , representing the degree of the associated polynomial.
2In the case of DFAm, a comparison of the different exponents αm gives information about the order of the trend of thedata.

4
Multichannel Detrended Fluctuation Analysis
Classical DFA [21, 24] involves time series which are sequences of observations consisting of just oneinput. The goal of DFA is to assess the long range correlation of the data involved, for example, in thenon-stationary heartbeat time series [23] and nonlinear analysis of anesthesia dynamics [25]. Since, thecentral nervous system is an intrinsically synchronized dynamic system and synchronization of multipleneuronal areas are required to process information, it seems evident the need for a similar analysis thatinvolves time series of several inputs. That is, to assess the long range correlation of multichannel data.
Attempts to apply DFA to multichannel time series have been used in the past to seismic fluctuationsdata [26] and was also used for multifractal analysis of DNA walks and trails [27]. The role of multi-dimensionality has also been discussed in relation to multifractality [28]. In the case of reference [27],DFA techniques have been compared with wavelet transform techniques and have been based in the con-sideration of a d-dimensional random walk. Both reference [26] and reference [27] applied DFA to twodimensional time series and suggested that is possible to describe a formula for multidimensional timeseries data using their formulas. Kantelhardt, et al [28] also considered the relation between the Hurstexponents and the singularity spectrum via Legendre transformation, the role of statistical deviations inDFA for short time series and the presence of correlated randomness.
Here we present a generalization of DFA that begins with a time series ~x(i) with discrete stepsi = 1, 2, . . . , N , so that each ~x(i) = (x(i)1, x(i)2, . . . , x(i)m) is a m-dimensional vector, where m is thenumber of inputs of each recording. The multichannel DFA (mDFA) could now be implemented byconsidering the integrated values of this time series as in equation (1), that is,
~y(k) =
k∑
i=1
(~x(i)− x) , (4)
where x = 1
N
∑N
i=1~x(i) is the vector consisting of the average values of the components of the vectors
~x(1), ~x(2), . . . , ~x(N) conforming our time series. As consequence of this integration step, we now have acomponentwise self-similar process. Next, we measure the vertical characteristic scale for the integratedtime series, component by component. To achieve this, we divide each component of the integrated timeseries into boxes of equal length n. For each one of this boxes and for the data of each component, aleast squares linear fitting (called the local trend of the component on that box) is performed. The vectorof values of the y coordinates of the straight lines is denoted by −→yn(k). To detrend the integrated timeseries ~y(k), we detrend component by component, so that we subtract −→yn(k). By modifying equation (2)in such a way that individual contributions for the detrended fluctuations of every vector componenti = 1, 2, . . . ,m is taken into account, we define
F(n) =
√√√√ 1
N
N∑
k=1
‖~y(k)−−→yn(k)‖2. (5)
By plotting the the values of logn against the values of logF(n), a linear relationship is observedwhich indicates the presence of a power law, that is to say
F(n) ∼ nα. (6)
Hence, the scaling exponent α represents the fluctuations and can be approximated as the slope of theline relating logF(n) and logn, as in the classic DFA situation. A value of α greater than 0.5 indicatesthe presence of persistent long-range power law correlations, while the case 0 < α < 0.5 denotes thepresence of power-law anti-correlations such that large values are more likely to be followed by smallvalues and vice versa.

5
Materials and Methods
General procedures
The data describe here were obtained from 10 experiments performed in adult cats. Guidelines containedin Principles of Laboratory Animal Care (NIH publications 85-23, revised in 1985) were followed in allcases and the experiments were also approved by the Institutional Bioethical Committee (Protocol num-ber: 0126-03). The animals were initially anesthetized with pentobarbitone sodium (40 mg / kg i.p) andadditional doses were given intravenously to maintain an adequate level of anesthesia, tested by assessingthat withdrawal reflexes were absent, that the pupils were constricted and the arterial blood pressurewas between 100 and 120 mm/Hg. The carotid artery, radial vein, trachea and urinary bladder werecannulated. A solution of 100 mM of sodium bicarbonate with glucose 5% was given i.v. (0.03 ml / min)to prevent acidosis [29]. When necessary, dextran 10% or ethylephrine (Effortil, Boering-Ingelheim) wasadministered to keep blood pressure above 100 mm / Hg.
The lumbosacral and low thoracic spinal segments were exposed. After the surgical procedures, theanimals were transferred to a stereotaxic metal frame allowing immobilization of the spinal cord, paralyzedwith pancuronium bromide (0.1 mg / kg) and artificially ventilated. The tidal volume was adjusted tomaintain 4% of CO2 concentration in the exhaled air. To prevent desiccation of the exposed tissues, poolswere made with the skin flaps, filled with paraffin oil and maintained between 36 and 37o C by means ofradiant heat. Usually six ball electrodes were placed on the cord dorsum of the lumbosacral enlargementat different spinal segments to record the spontaneous CDPs against an indifferent electrode placed onthe paravertebral muscles (band pass filters 0.3 Hz to 10 kHz). Left and right spinal lesions were madebetween segments L5 and L6 with particular care to avoid touching the recording electrodes.
Computational and statistical analysis
Calculations involved in computing DFA scaling exponent were implemented using computational me-thods included in the PhysioToolkit library [30] via the DFA package and the original DFA. A modifiedversion, termed multichannel detrended fluctuation analysis (mDFA) has been implemented in RapidMinerver.5.0 according to equations 4, 5 and 6. Source code for the programs may be provided if requested.Recordings of spinal lumbar segments lasted 10 minutes or 1 million points. Statistical Student t-test wasused to compare control and lesioned animals. The coherence was calculated using mscohere of MatLabver. 7.4.
Results
Intact neuroaxis and randomized spontaneous CDPs recordings
Simultaneous recordings from several segments in the cord dorsum of the lumbosacral enlargement re-vealed synchronized spontaneous potentials of different shapes and amplitudes. Figure 1A shows thespontaneous CDPs simultaneously recorded from four spinal segments (L4 to L7) in the left side in apreparation with intact neuroaxis. It may be seen that at one time the CDPs recorded in the L5 andL6 segments on the left side were larger than those recorded in the other segments. Later on, simulta-neous CDPs appeared in all segments. Particular combinations of spontaneous CDPs could be observedseveral times during a single recording period (see also Manjarrez, et. al. [16]). Since the CDPs lastapproximately from 100 ms to 300 ms, we used windows of this size in order to include the low frequencycomponents of these potentials.
In 10 preparations with intact neuroaxis we registered the spontaneous activity simultaneously fromseveral segments (from L3 to S1) and for each single spinal segment we calculated the Hurst exponent
6
with the classical DFA (Figure 2A). The mean value of all Hurst exponents was 1.04 ± 0.09 (mean ±sd). In addition, we calculated the Hurst exponent by using the method mDFA, for signals recordedsimultaneously from 4 spinal segments. We obtained a mean value of 1.01 ± 0.06.
According to the criteria stated in Sections detrended fluctuation analysis and multichannel detrendedfluctuation analysis, where α = 0.5 indicates randomness while α > 0.5 indicates long-term correlations,the classical DFA data depicted in Figure 2A as well as the mDFA data of Figure 2B indicate that thespontaneous CDPs had a non-random structure suggesting that they arise from a structured neuronalorganization. In contrast, when randomized, the same set of data showed mean mDFA-α = 0.49 ± 0.01(Figure 2B ), while the mean of DFA-α = 0.49 ± 0.02.
Decoupling produced by spinal cord lesions
Spontaneous CDPs were simultaneously recorded from several spinal segments before and after a firstlesion in the left side between segments L5 and L6 and a second lesion in the right side, also betweensegments L5 and L6, both comprising the dorsolateral quadrant of the spinal cord. In order to excludepossible influences from peripheral inputs, these recordings were taken after the bilateral transection ofthe L3-S1 dorsal roots. After the left spinal lesion, the CDPs recorded from the four segments still remainsynchronized, but to a lesser degree than before the lesion (Figure 1B). After the additional lesion of theright dorsal quadrant, the synchronization between these segments was significantly reduced (Figure 1C).Yet, there was still a significant synchronicity between potentials recorded from pairs of segments eitherrostrally or caudally to the lesion. (i.e. L4 and L5 or L6 and L7). This could be interpreted as evidencefor the hypothesis that left and right groups of neurons in different segments are both interconnected bypathways running in the same as well as in the opposite sides (see Garcıa et al [18] ).
Changes in the fractal structure of spontaneous CDPs with an interposed spinal lesion
The DFA of potentials recorded in the L5L and L6L segments were reduced after the first spinal lesionin the same side, possibly because of interruption of interconnecting pathways (Figure 3A and B, blacksquares). On the other hand, the right spinal lesion had opposite effects on the Hurst values of thepotentials recorded rostrally and caudally to the lesion. Namely, the Hurst values of the L5L wereincreased from 1.098 to 1.152 and those of the L6L were reduced from 0.973 to 0.856 (Figure 3A andB, triangles). It is to be noted that these spinal lesions had different effects on logF(n), which is anindex of the fluctuations of the potentials, which varied according to the window size. In the case of thepotentials recorded from L5L, both spinal lesions produced a marked reduction of logF(n). In contrast,for L6L logF(n) remained essentially the same. The Hurst values calculated with the mDFA for theL5L - L6L ensemble were also reduced after the spinal lesions when compared with the values obtainedin the preparation with intact neuroaxis (Figure 3D and Table 1). logF(n), was also reduced, but toa smaller, yet statistically significant extent, particularly for the largest window sizes. For comparison,we also examined the changes in coherence between the L5L and L6L potentials produced by the spinallesions. (Coherence is defined as the correlation of the frequency components). We found that aftereach of the two spinal lesions the coherence was reduced throughout the whole frequency range (figure3C). Most likely, the remaining correlation was introduced by the pathways spared by the spinal lesions.These changes of the fractal correlation structure are believed to have a functional origin since it hasbeen proposed that the segmental synchronizations of dorsal root reflexes and dorsal root potentialsare mediated by the spinal cord connections through the lateral funiculi in rats and hamsters [32, 33].Therefore, if the dorsolateral fasciculus (DLF) mediates the intersegmental synchronization in the spinalcord of the anesthetized cat then a lesion comprising DLF would decouple the adjacent segments wherethe lesion was made. Partial spinal lesion reduced the amplitude of spontaneous CDPs for the segmentswith an interposed lesion (Figure 1B). Total spinal lesion almost abolished the temporal synchronizationbetween the adjacent segments where the lesion was located. The occurrence of spontaneous CDPs in the

7
segments L5 and L6 was significantly reduced by the complete spinal lesion (Figure 1C). On the otherhand, coherence showed a significantly reduced correlation in the low frequency components which arerelated to the spontaneous CDPs. Furthermore, the mDFA shows a reduction when compared to theintact neuroaxis and fluctuations were significantly reduced for the windows with sizes that comprisedthe spontaneous CDPs (Figure 3). Since the reduction in the correlation of spontaneous CDPs betweenthe segments with an interposed lesion (Figure 1C) reveals a reduction of mDFA Hurst values (Figure3D), this points out that spinal cord lesions changed the fractal structure of spontaneous cord dorsumpotentials.
Changes in the fractal structure of spontaneous CDPs recorded rostral to lesions
The DFA of potentials recorded in L5L and L5R segments, both above the lesion, were reduced afterthe first left spinal lesion (Figure 4A and B, black squares) and slightly increased after the second lesion.More specifically, the Hurst values of the L5L and L5R were increased from 1.098 to 1.152 and from 1.043to 1.358, respectively (Figure 4A and B, triangles). In addition, logF(n) was reduced throughout thewhole window range (Table 2). The Hurst values calculated with the mDFA for the L5L - L5R ensemblewere also reduced after the first left spinal lesion when compared with values obtained while the neuroaxiswas still intact (from 1.201 to 1.069) and subsequently increased after the second spinal lesion to 1.246(Figure 4D and Table 2). logF(n) was also significantly reduced, throughout the whole window range(Table 2). Quite interestingly, in this case the coherence between the potentials recorded from L5L andL5R was increased throughout the whole frequency range (Figure 4C).
Changes in the fractal structure of spontaneous CDPs recorded caudal to the lesion.
The DFA of potentials recorded in L6L and L6R were reduced after each of the two spinal lesions. Namely,the Hurst values of the L6L were reduced from 1.182 to 0.973 and 0.856 and those of the L6R from 1.146to 0.882 and 0.837 (Figure 5A and B, squares and triangles). However, logF(n) for both L6L and L6Rremained essentially the same (Table 3). A similar behavior was seen with the Hurst values calculatedwith the mDFA for the L6L-L6R ensemble (from 1.163 to 0.902 and 0.914 after the first and secondlesions, respectively (Figure 5D and Table 3). logF(n), was not significantly changed. In this case, thecoherence between the L6L and L6R potentials was reduced after the first spinal lesion and increasedafter the second lesion as the mDFA of L6L-L6R.(Figure 5C and D).
mDFA for multiple lumbar segments recordings
One of the purposes of the mDFA was to examine the fractal structure of the potentials recorded frommultiple segments. To this end we analyzed the mDFA of the ensemble of potentials recorded from theL4 to L7 segments in the left side, as indicated in insert in Figure 6A. After the left spinal lesion betweenL5L and L6L, the Hurst value of the mDFA was reduced from 1.178 to 0.969 and remained essentiallythe same after the lesion in the right side (0.972). logF(n) was larger than the values calculated forthe single segments (Figures 3- 5), suggesting larger fluctuations or intersegmental synchronizations. Wealso analyzed the changes produced for the ensemble of 4 sets of potentials obtained from the L5 and L6segments in both sides (L5L - L5R - L6R - L6L; see insert in Figure 6B). The mDFA Hurst exponentswere reduced from 1.173 to 0.946 and 0.917, after the first and second spinal lesions, respectively. Alsothe fluctuations were significantly reduced for the largest window size (Table 4). Note the mDFA valuesof the adjacent segments to the lesion (Figure 6B) were reduced more than those located rostrocaudally(Figure 6A).

8
Discussion
We have shown that detrended fluctuations analysis (DFA) of the spontaneous cord dorsum potentials al-lows detection of dynamic signatures characteristic of long-range correlations. This may indicate a fractalstructure of the neuronal sets involved in the generation of these potentials. As it was shown by means ofrandomized versions of the experimental data, these long-ranged correlations are not artifacts, but rathera characteristic feature of spontaneous CDPs. As an example of the utility of the method, we analyzeddata from one typical experiment aimed to examine the effects of partial spinal lesions. We could showthat spinal damage reduced the Hurst exponents of individual spinal segments as well as the correlationlength of the signals. logF(n), which is an index of the fluctuations of the potentials was also reducedafter the spinal lesions. This is in agreement with previous findings, where it was shown that these le-sions reduced the correlation between the CDPs recorded from segments adjacent to the spinal lesions [31].
An important feature of this work is the introduction of multichannel detrended fluctuations analysis(mDFA), as a generalization of DFA for multichannel signals. By means of mDFA we studied the effectof long range of correlations in multiple spinal segments measurements of SSA also noticing the presenceof a long range correlation structure in intact spinal cord recordings. mDFA also revealed an alreadyenvisioned temporal synchronization in the activity of multiple segmental signals, thus revealing spinalcommunication as a complex coupled phenomenon. To reveal the effect of synchronization in the intactneuroaxis and spinal cord damage we performed mDFA calculations of multiple-segmental signals. Theseresults point out to multiple segments SSA as highly correlated, highly synchronized phenomena for theintact neuroaxis and spinal damage caused both decorrelation and desynchronization of SSA signals.
In contrast to the classical methods, such as correlation and coherence quantification that define arelation between two sets of data, and the classical DFA method that analyzes the correlation dynamicsin a single channel, the mDFA method presented here appears to be adequate to examine the synchro-nization between spontaneous potentials recorded from multiple spinal segments. It thus seems thatthe mDFA may be useful approach to characterize the functional state of the network under differentexperimental conditions, such as those induced by acute peripheral nerve or dorsal root section or partialspinal lesions. To test the method we compared mDFA values of multiple-segmental signals before andafter spinal lesions in a typical experiment. After the first spinal lesion, the mDFA values were reducedfor sets of the segments located rostrally, caudally and also with interposed lesions. logF(n), which inthis case is an index of the fluctuations of the potentials recorded in the whole ensemble, was also reducedafter the first spinal lesion, mainly for sets located rostrally and with interposed lesions. After the secondspinal lesion the mDFA values increased for recordings located rostrally or caudally to the lesion, in con-trast with the reduced mDFA values for segments adjacent to the lesion. The observed differences in themDFA for pairs located rostrally and caudally to the lesion can be accounted for by assuming that therostral segments were subjected to descending influences which may be different from those affecting thesegments located caudally to the lesion. The interposed lesions show a reduction in the intersegmentalcorrelation, which was reflected in the reduction in the mDFA α values as well as logF(n), particularlyfor the largest window sizes. This suggests that the interconnections between the segments adjacent tothe spinal lesions were largely reduced. It should be noted that in general the observed changes in mDFAwere consistent with the changes in coherence (Figure 3C, 4C and 5C).
The mDFA method has thus revealed as an effective algorithm for the analysis of correlation andsynchronization of spontaneous CDPs in different segments. The ensembles involved in the generationof these potentials have a non-random organization of interconnected sets distributed throughout thelumbosacral spinal cord that depends on the overall balance between the descending and segmentalinputs, presumably in both sides of the spinal cord [31]. This may explain the inability of a lesion in oneside of the spinal cord to completely desynchronize the spontaneous CDPs. The mDFA method may have

9
a potential use to characterize the state of the spinal cord in those instances where a fast quantitativedetermination of spinal damage is needed. mDFA may have have thus potential use in clinical instancesfor a fast quantitative determination of spinal damage. More detailed neurophysiological studies areneeded to determine the actual mechanisms of spinal synchronization and correlation.
Acknowledgments
The first and last authors gratefully acknowledge partial support by grants: NIH NS 09196 and CONACyT50900. We also acknowledge technical support from Cirilo Leon, Edson Hernandez, Diogenes Chavez.Implementation of mDFA in RapidMiner was done by Dr. Javier Bejar and Prof. Ulises Cortes, membersof the BCN team of the Technical University of Catalonia. We also thank Patricia Pliego Pastrana fromAutonomous University of Hidalgo and Guillermo Romero Melendez from University of Las Americas fortheir useful comments.
References
1. Engel A K, Fries P, Singer W (2001) Dynamic predictions oscillations and synchrony in top-downprocessing. Reviews Macmillan Magazines Ltd 2, 704-716.
2. Izhikevich EM (2007), Dynamical systems in neuroscience, The MIT Press, Cambridge, Mas-sachusetts.
3. O’Donovan M J (1999) The origin of spontaneous activity in developing networks of the vertebratenervous system. Current Opinion in Neurobiology 9, 94-104.
4. O’Donovan M J, Chub N, Wenner P (1998) Mechanisms of spontaneous activity in developingspinal networks. J. Neurobiol. 37, 131-145.
5. Roelfsema P R, Engel A K, Konig P, Singer, W (1997) Visuomotor integration is associated withzero-time lag synchronization among cortical areas. Nature 385, 157-161.
6. Von Stein A, Chiang C, Konig P,(2000)Top-down processing mediated by interareal synchronization.Proc. Natl. Acad. Sci. USA 97, 14748-14753.
7. Bernasconi C, Von Stein A, Chiang C, Konig, P (2000) Bidirectional interactions between visualareas in the awake behaving cat. Neuroreport 11, 1-4.
8. Rodriguez E, George N, Lachaux J P, Martinerie J, Renault B, Varela F J (1999) Perception’sshadow: long-distance synchronization of human brain activity. Nature 397, 430-433.
9. Miltner WHR, Braun C, Arnold M, Witte H, Taub E (1999) Coherence of gamma-band EEGactivity as a basis for associative learning. Nature 397, 434-436.
10. Pulvermuller F, Lutzenberger W, Preissl H, Birbaumer N (1995) Spectral responses in the gamma-band: physiological signs of higher cognitive processes?. Neuroreport 6, 2059-2064.
11. Muller MM, Keil A, Gruber T, Elbert T (1999) Processing of affective picture modulates right-hemispheric gamma band EEG activity. Clin. Neurophysiol. 110, 1913-1920.
12. Bremer F (1941) Lactivite electrique ’spontaee’ de la moelle epinere. Arch. Internat. Physiologie51:51-84.

10
13. ten Cate J (1950) Spontaneous electrical activity of the spinal cord, Electroenceph. Clin. Neuro-physiol. 2, 445-451.
14. Mark V H, Gasteiger E L (1953) Observations on the role of afferent and descending impulses onthe spontaneous potentials of the spinal cord. Electroenceph. Clin. Neurophysiol. 5, 251-258.
15. Kasprzak H, Gasteiger E L (1970) Spinal electrogram of freely moving cat: Supraspinal and seg-mental influences. Brain Res. 22, 207-220.
16. Manjarrez E, Jimenez I, Rudomin P (2003) Intersegmental synchronization of spontaneous activityof dorsal horn neurons in the cat spinal cord. Exp. Brain Res. 148, 401-413.
17. Manjarrez E, Rojas-Piloni JG, Jimnez I, Rudomin P (2000), Modulation of synaptic transmissionfrom segmental afferents by spontaneous activity of dorsal horn spinal neurones in the cat. Journalof Physiology (London) 529: 445-460
18. Garcıa C A, Chavez D, Jimenez I, Rudomin P (2004) Effects of spinal and peripheral nerve lesionson the intersegmental synchronization of the spontaneous activity of dorsal horn neurons in the catlumbosacral spinal cord. Neurosci. Lett. 361, 102-105.
19. Ertekin C, Sarica Y, Uckardesler L (1983) Studies on the human spontaneous electromyelogram(EMycloG) I. Normal subjects. EEG & Clin. Neurophysiol. 55, 13-23.
20. Gerasimenko Y P, Bogacheva I N, Shcherbakova N A, Makarovskii A N (2001) Bioelectric activityof spinal cord in patients with vertebrospinal pathologies. Bull. Esp. Biol. Med. 11, 575-578.
21. Peng C-K, Buldyrev S V, Havlin S, Simons M, Stanley H E, Goldberger A L (1994) Mosaicorganization of DNA nucleotides. Phys. Rev. E 49, 1685-1689.
22. Feder J (1988), Fractals, New York; Plenum Press. ISBN 0-306-42851-2
23. Peng C-K, Havlin S, Stanley H E, Goldberger A L (1995) Quantification of scaling exponents andcrossover phenomena in nonstationary heartbeat time series. Chaos 5, 82-87.
24. Li W, Holste D (2005) Universal 1/f noise, crossovers of scaling exponents, and chromosome-specific patterns of guanine-cytosine content in DNA sequences of the human genome. PhysicalReview E 71, 0419410-19.
25. Gifani P, Rabiee H R, Hashemi M R, Taslimi P, Ghanbari M (2006) Nonlinear analysis of anesthesiadynamics by Fractal Scaling Exponent. Conf Proc. IEEE Eng. Med. Biol. Soc. 1, 6225-8.
26. Telesca L, Lovallo M, Lapenna V, Macchiato M (2007) Long-range correlations in two dimensionalspatio-temporal seismic fluctuations. Physica A 377, 279-284.
27. Rosas A, Nogueira E, Fontanari J F (2002) Multifractal analysis of DNA walks and trails. PhysicalReview E 66, 1-6.
28. Kantelhardt J W, Zschiegner S A, Koscielny-Bunde E, Havlin S, Bunde A, Stanley H E (2002)Multifractal detrended fluctuation analysis of nonstationary time series. Physica A 316, 87-114.
29. Rudomin P, Hernandez E, Lomeli J (2007) Tonic and phasic differential GABAergic inhibition ofsynaptic actions of joint afferents in the cat. Exp. Brain Res. 176, 98-118.

11
30. Goldberger A L, Amaral L A, Glass L, Hausdorff J M, Ivanov P C, Mark R G, Mietus J E, MoodyG B, Peng C-K, Stanley H E (2000) PhysioBank, PhysioToolkit, and PhysioNet: components of anew research resource for complex physiologic signals. Circulation 101, 215-20.
31. Chavez D, Rodriguez E, Jimenez I, and Rudomin P (2011) Changes in correlation between spon-taneous activity of dorsal horn neurones and differential recruitment of inhibitory pathways in thecat. submitted to J Physiol/2011/212381.
32. Kerkut GA, Bagust J (1995), The isolated mammalian spinal cord, Prog Neurobiol. 46(1):1-48
33. Lidierth M, Wall PD, (1996) Synchronous inherent oscillations of potentials within the rat lumbarspinal cord, Neurosci Lett. 220(1):25-8

12
Figure Legends
Figure 1. Spontaneous spinal activity with intact and lesioned spinal cord recorded indifferent spinal segments from the anesthetized cat. A. Recordings of the initial conditionswhich showed synchronization and high correlation in different lumbar segments of CDPs. These arerepeated throughout the recording at different time intervals as shown in traces. B. Spontaneous CDPrecording made 75 minutes after deafferentation and a left spinal lesion between segments L5 and L6 atleft side. It is showed a reduction in the synchronization of spontaneous CDPs. C. Right spinal lesionmade 40 minutes after the left spinal lesion. The synchronization was almost abolished after the secondspinal lesion between L5 and L6 at left side. See text for details.

13
0.8
0.85
0.9
0.95
1
1.05
1.1
1.15
1.2
1.25
1.3
L3 L4 L5 L5R L6R L6 L7 S1
lumbar segments
Classical DFA for SSA recorded in different lumbar segments
Exp. 9
Exp. 1
Exp. 2
Exp. 3
Exp. 4
Exp. 5Exp. 6
Exp. 7
Exp. 8
Exp. 10
0.4
0.5
0.6
0.7
0.8
0.9
1
1.1
1.2
1.3
E1 E2 E3 E4 E5 E6 E7 E8 E9 E10
Preparation withintact neuroaxis
Randomized SSA
Hu
rst
Ex
po
ne
nt
α
Experiment #
Multiple segments mDFA for SSA recorded in different experiments
Hu
rst
Ex
po
ne
nt
αA
B
Figure 2. Detrended Fluctuation Analysis. A. Classical DFA computed for spontaneous spinalactivity (SSA). In 10 experiments spontaneous CDPs (Cord Dorsum Potentials) recorded from a singlespinal segment under initial conditions showed a Hurst exponent value of DFA-α = 1.04 ± 0.09 (mean± sd). The recordings of single segments were among L3 through S1 depending on the experimentsprotocol. The R2 line averaged was 0.98. See text for details. B. The Hurst exponent values (α’s) wereobtained from mDFA for multiple spinal segments for four lumbar segments in 10 experiments underinitial conditions (α = 1.01 ± 0.06) with a R2 line = 0.98. Following randomization, the same set ofdata showed mDFA-α = 0.49 ± 0.01, with an average R2 for line-fitting higher than 0.99

14
Figure 3. Recordings of spontaneous spinal activity with an interposed lesion in initialconditions, deafferented and spinal lesions. A. Classical DFA for L5L. Insert: Location ofelectrodes. B. Classical DFA for L6L. C. Coherence between L5L-L6L. D. mDFA L5L-L6L. Thecoherence was reduced after lesions as well as mDFA Hurst exponents. The regression line fit, R2 wasabove 0.99 in all cases. The spinal lesion reduced the fluctuations significantly. More details in text.

15
Figure 4. Recordings of spontaneous spinal activity above the lesion with initialconditions, deafferented and spinal lesions. A. Classical DFA for L5L. Insert: Boxes indicatingthe location of electrodes L5 left and L5 right (black dots). B. Classical DFA for L5R. C. Coherence forL5L- L5R increased after lesions. D. mDFA L5L-L5R. The regression line fit, R2 was higher than 0.99in all cases. Note that the spinal lesion significantly reduced the logarithm of the fluctuations of signals(P < 0.001). The fractal structure increased after the second lesion for both classical DFA and mDFAfor the recordings above the lesion. See details in text.

16
Figure 5. Spontaneous spinal recordings located below the lesion. A. classical DFA for L6L.Insert: Location of electrodes. B. Classical DFA for L6R. C. Coherence between L6L-L6R wasreduced for first lesion and followed by an increased for the second lesion as well as mDFA. D. mDFAfor L6L and L6R. The regression line fit, R2 was above 0.99 in all cases. More details in text. Note thatthe spinal lesion reduced the fluctuations, but such effect was not significant.

17
Figure 6. mDFA analysis of multiple recordings of the spontaneous activity in the catspinal cord. A. mDFA for L4 through L7 located in the left size. Inserts: Location of electrodes. B.mDFA for CDPs recordings near to the lesion, L5L-L5R-L6R-L6L. The regression line fit, R2 was above0.99 in all cases. More details in text. The spinal lesion reduced significantly the fluctuations.

18
Tables
Table 1. p-values for significance tests of fluctuations reduction caused by lesions in L5Land L6L
Interposed lesions Left spinal lesion Right spinal lesion
DFA L5L p < 2.14 × 10⁻¹⁸ p < 7.01 × 10⁻²²
DFA L6L p < 9.0 × 10⁻³ p < 1.4 × 10⁻²
mDFA L5L-L6L p < 3.18 × 10⁻⁶ p < 2.04 × 10⁻⁷
Table 2. p-values for significance tests of fluctuations reduction caused by lesions in L5Land L5R
Rostral to the lesion Left spinal lesion Right spinal lesion
DFA L5L p < 2.14 × 10⁻¹⁸ p < 7.01 × 10⁻²²
DFA L5R p < 2.70 × 10⁻¹² p < 2.89 × 10⁻¹⁴
mDFA L5L-L5R p < 2.22 × 10⁻¹⁵ p < 9.49 × 10⁻²¹

19
Table 3. p-values for significance tests of fluctuations reduction caused by lesions in L6Land L6R
Caudal to the lesion Left spinal lesion Right spinal lesion
DFA L6L p < 9.0 × 10⁻³ p < 1.4 × 10⁻²
DFA L6R p < 2.29 × 10⁻¹ p < 9.93 × 10⁻¹
mDFA L6L-L6R p < 6.7 × 10⁻² p < 2.4 × 10⁻¹
Table 4. p-values for significance tests of fluctuations reduction caused by lesions in L6Land L6R
mDFA Left spinal lesion Right spinal lesion
mDFA L4L-L5L-L6L-L7L p < 3.66 × 10⁻⁶ p < 2.44 × 10⁻⁷
mDFA L5L-L5R-L6R-L6L p < 5.0 × 10⁻⁴ p < 1.44 × 10⁻⁵

1
Multichannel detrended fluctuation analysis revealssynchronized patterns of spontaneous spinal activity inanesthetized cats: Response to comments from the reviewersErika E. Rodrıguez 1,2, Enrique Hernandez-Lemus 3,4,∗∗, Benjamın A. Itza-Ortiz 2, Ismael Jimenez 1,Pablo Rudomın 1,∗
1 Department of Physiology, Biophysics and Neurosciences, Center for Research andAdvanced Studies (CINVESTAV), Mexico City, Mexico.2 Center for Research in Mathematics, Autonomous University of Hidalgo (UAEH),Pachuca, Mexico.3 Computational Genomics Department, National Institute of Genomic Medicine, MexicoCity, Mexico.4 Center for Complexity Sciences, National Autonomous University of Mexico (UNAM),Mexico City, Mexico.∗ Corresponding author e-mail: [email protected]∗∗ Corresponding author e-mail: [email protected]
1 Reviewers’ comments -response in blue
We agree with all the comments from the referees, The manuscript has been corrected accordingly.
1.1 Reviewer 1
In my opinion this is an interesting paper concerning the application of DFA and mDFA to detect syn-chronization of physiological signals. Also, it is well written and both their methodology and findings areclearly exposed. However, the authors just need to make a few corrections in order to improve their paper:
1. to correct some misprints, for example in line 35 and line 51, page 4 The manuscript has beencorrected and double-checked for misprints and typos
2. it is not explicitly stated in the text what is the Hurst exponent, particularly the exponent given byeq(6) This point has been corrected in the manuscript by including appropriate explanations andreferences
3. there are several definitions of synchronization of signals, so the authors need to state in whichsense the term synchronization is being used in their paper This point has been corrected in themanuscript by including appropriate explanations and references
1.2 Reviewer 2
The submitted work is a methodological proposal to characterize the structure of neuronal activity inhigher level ensembles of cells from intact and lesioned spinal cord preparations. The method testedhas a significant advantage over the traditional methodology (detrended fluctuations analysis), as it al-lows to analyze sequences of observations coming from several different simultaneous inputs and estimatesynchronicity and coherence of the signals. The results confirm the power of the method to characterizecoherence and synchronicity and the ability to detect a reduction in those phenomena after spinal injuries.To the best of my knowledge, though this method has been used to describe skin blood flow oscillations,no previous work had approached the study of coincident neuronal signals. Therefore, it is a new andcompelling proposal.
Response to Reviewers

2
Are the experiments, statistics, and other analyses performed to a high technical standard and aredescribed in sufficient detail? Yes, however the manuscript would improve after the followed changes:
1. PLoS ONE is a generalist journal and potential readers could not be familiarized with the relevanceof synchronicity and coherence for neuronal functions. Thus, the abstract needs a sentence where thefunctional importance of these phenomena is highlighted. Abstract has been corrected accordingly
2. In the analysis section, authors have to indicate and explain what the Hurst exponent refers as it isa central part of the results. Does it refer ¡alpha¿ exponent? -Same as point 2 of Reviewer 1- Thispoint has been corrected in the manuscript by including appropriate explanations and references
Are the conclusions presented in an appropriate fashion with speculations and hypotheses identifiedas such?
3. Authors suggested that spinal cord lesions changed the fractal structure of spontaneous cord dorsumpotentials. This suggestion requires to be explained and justified properly. This section of themanuscript has been corrected accordingly
4. Discussion is concise and aims at the point, but it would improve with a further explanation of thesignification and future applications of the results.This section of the manuscript has been correctedaccordingly
Is the article presented in an intelligible fashion and written in English? Yes
Does the research meet all applicable standards with regard to the ethics of experimentation andresearch integrity? Yes, as the general animal procedures followed the Principles of Laboratory AnimalCare (NIH publications 85-23, revised in 1985).
Does the article adhere to appropriate reporting guidelines and community standards for data avail-ability? Yes.
1.3 Reviewer 3
This is a particularly useful contribution to the literature on spontaneous cord dorsum potentials (SCDPs).The authors introduce the multichannel detrended fluctuation analysis method to detect randomness orlong term correlations in time series of SCDPs recorded from several spinal segments. The authors showthat SCDPs exhibit a non-random organization, which can be reduced after selective spinal lesions. Thefigures and the text are clear. I recommend publication of this paper in PLoS ONE.
Minor comments:
1. The article: Manjarrez et al (2000) J Physiol should be included in the references. This article hasbeen added in the body of the manuscript and in the references