TECHNICAL ANALYSIS - efghermes.comefghermes.com/en/OurServices/Research/Documents/Trader's...
24
TECHNICAL ANALYSIS Trader’s Guide|EGYPT Devise Your Investment Strategy THE GRAY AREA KEEP CALM AND Get Ready For 2016 Walid Khalil, MFTA, CFTe, CETA Chief Technical Analyst [email protected] Disclaimer: This report must be read with the disclaimer at the end page, which forms part of it.
Transcript of TECHNICAL ANALYSIS - efghermes.comefghermes.com/en/OurServices/Research/Documents/Trader's...

TECHNICAL ANALYSIS
Trader’s Guide|EGYPT
Devise Your Investment Strategy
THE GRAY AREA KEEP CALM
AND Get Ready For
2016 Walid Khalil, MFTA, CFTe, CETA
Chief Technical Analyst
Disclaimer: This report must be read with the disclaimer at the end page, which forms part of it.

Contents EGX30 OVERVIEW ............................................................................................................................................................................................................... 1
Long Term Cycles .............................................................................................................................................................................................................................. 1
Long Term Price Patterns ................................................................................................................................................................................................................. 2
Medium Term Analysis ..................................................................................................................................................................................................................... 3
Conclusion .......................................................................................................................................................................................................................................................... 4
Recommendation ............................................................................................................................................................................................................................................... 4
Final word about the current market actions .................................................................................................................................................................................................... 4
COMMERCIAL INTERNATIONAL BANK (COMI.CA) ................................................................................................................................................................ 5
Long Term View ................................................................................................................................................................................................................................ 5
Medium Term View .......................................................................................................................................................................................................................... 6
Conclusion .......................................................................................................................................................................................................................................................... 7
Recommendation ............................................................................................................................................................................................................................................... 7
BEFORE GOING BULLISH ..................................................................................................................................................................................................... 8
TOP PICKS ........................................................................................................................................................................................................................... 8
AMER GROUP HOLDING (AMER.CA) .................................................................................................................................................................................... 9
Long Term View ................................................................................................................................................................................................................................ 9
Medium Term View ........................................................................................................................................................................................................................ 10
Conclusion ........................................................................................................................................................................................................................................................ 11
Recommendation ............................................................................................................................................................................................................................................. 11
Arabia Investments Development Financial Investments Holding (AIND.CA) ..................................................................................................................... 12
Long Term View .............................................................................................................................................................................................................................. 12
Medium Term View ........................................................................................................................................................................................................................ 13
Conclusion ........................................................................................................................................................................................................................................................ 14

Recommendation ............................................................................................................................................................................................................................................. 14
Pioneers Holding (PIOH.CA) .............................................................................................................................................................................................. 15
Long Term View .............................................................................................................................................................................................................................. 15
Medium Term View ........................................................................................................................................................................................................................ 16
Conclusion ........................................................................................................................................................................................................................................................ 17
Recommendation ............................................................................................................................................................................................................................................. 17
Orascom Telecom Media & Technology Holding (OTMT.CA) .............................................................................................................................................. 18
Long Term View .............................................................................................................................................................................................................................. 18
Medium Term View ........................................................................................................................................................................................................................ 19
Conclusion ........................................................................................................................................................................................................................................................ 20
Recommendation ............................................................................................................................................................................................................................................. 20
DISCLAIMER ..................................................................................................................................................................................................................... 21

1 | P a g e
EGX30 OVERVIEW
Long Term Cycles
The chart on the right shows on the upper panel EGX30 monthly log scale chart and on the lower panel is the Detrended Price Oscillator.
While examining the index’s long term cycles we have found unusual major corrections’ cycle (red shaded zones).
The index has the following cycles: EGX30 tends to form a peak
every 26 months with 80% accuracy (Vertical Green Lines).
EGX30 tends to form a trough every 18 months with 67% accuracy (Vertical Red Lines).
Due to the time difference between peaks and troughs cycles, the correction periods
vary. (The shaded area between the green and red lines) Most of the index’s major corrections have fallen within those areas. As seen on the chart, the index has entered one of the corrections zones since January 2015 and still trading within the major correction zone. Depending on the above, a major trough should be expected during December 2015 which should be followed by a strong rally through 2016 as the next
expected major peak is due on December 2016.

2 | P a g e
Long Term Price Patterns
After the strong 5 years (2003-
2008) rally, EGX30 has entered
a balance area which took the
shape of a symmetrical
triangle which also took 5
years to be completed.
During the symmetrical
triangle period, volume moved
in a bullish rhythm as it
increased with almost every
rally and declined with
corrections.
During 2013, EGX30 completed
the pattern and the break
came with increasing volume
which reached a record
volume during 2014 confirming
the strength.
The symmetrical triangle target
is 13,000 point which should
be seen in 2016.
During the latest market
correction, volume is clearly
decreasing which is a positive
sign.

3 | P a g e
Medium Term Analysis
From 2009 to mid-2013, EGX30’s 200
weeks moving average worked as a
strong resistance for the index (Red
Circles).
During 2013, the index has managed to
break above its 200 weeks moving
average (Green Circle) to experience a
strong rally till the high of 2015.
The index has entered a 9 months
distribution area which took the shape of
a complex Head & Shoulder.
The target zone of the H&S was between
6400-6600 point which was at the same
time at the 200 weeks moving average.
The index has reached its first target of
6600 point and touched the 200 weeks
moving average (Blue Circle) before
rebounding.
The second target of 6400 point is still
valid and will not be disregarded until
the break of 8300 point.
The level around 6400 point will work as
a strong support for the index as it
coincide with a long term trend line.
During the last 6 years, EGX30 has
formed a *major bottom when the
indicator in the lower panel has reached
its oversold level, which we believe will
be reached with is next selloff.
*Major bottoms
The first rally started 2009 and remained for 16 months. The index moved from 3380 point to 7690 point.
The second rally started 2012 and remained for 36 months. The index moved from 3600 point to 10,000 point.

4 | P a g e
Conclusion From what we have described, all long and medium term technical evidences imply the following:
The market is searching form a major bottom around the current levels. The area between 6400-6600 point should hold any decline. The market has more than 75% chance to experience a medium to long term rally during 2016 with potential reward of 75% and a risk of 20%
from current levels. Long term target is set at 13,000 point while the stop loss is set at 6000 point.
Recommendation On the short term, we expect the index to re-test the recorded lows around 6600 point within the coming 2 months. Medium and long term investors are advised to buy dips around that area. Buying around 6600 point will increase the reward to risk ratio to 9.7 : 1.0.
Final word about the current market actions The main question that concerns everyone is; did the market found its bottom at 6600 point?
Actually we have only 25% probability that the market has found its bottom and 75% probability that another selloff should be expected for two
main reasons.
- First, if 6600 point was the major bottom, volume should have been increased significantly by now.
- Second, most of the stocks should have been joined the rally which is not the case.
Unfortunately, to confirm that 6600 point was the bottom, the index has to break above 8250 point.
From our perspective, and as the major bottom is near, some stocks have already found its major bottom and trying to gain ground to avoid
recording new lows when the market start is final down move.
Although it is too early to tell, we believe stocks that rallied away from the record low when the market reached 6600 point along with some of
2013’ most advanced stocks are the ones that should outperform the index on the medium term.
The coming sections will describe the market risky stocks and stocks that we think have reached its major bottom.
First Risky Stocks

5 | P a g e
COMMERCIAL INTERNATIONAL BANK (COMI.CA) Long Term View
Since 2003, Commercial International Bank (COMI.CA) has been moving
in a major uptrend and most of the time outperformed the market.
COMI.CA MACD indicator has just issued a long term sell signal from
extreme level.
Often, an extreme reading in MACD will correspond to the extreme of
Elliott wave three.
COMI.CA has formed a short term toping formation around EGP59.00
which increases the probability of starting corrective wave 4.
Target of wave four is between EGP35.00 and EGP42.00 which is
expected before the end of 2015.
We expect COMI.CA to start wave 5 early 2016 which will have a target of
EGP75.00 and is expected before the end of 2016.

6 | P a g e
Medium Term View
Since mid-2013, COMI.CA has been moving above its 35 weeks moving
average (Green Line) which acted as a strong support for the share.
COMI.CA CCI indicator, started to show weakness since the start of 2015
as it showed a negative diversion with the price movement which was an
early warning sign.
As a result, during July 2015, COMI.CA has broken below the moving
average followed by completing a reversal double top formation.
Last month, COMI.CA has tried to break above its 35 weeks moving
average (EGP55.00) and failed confirming the strength of that average
which expects to reverse rule and work as a strong resistance for the
share.
Breaking below EGP50.00 will be the trigger for the new selloff that
should reach wave 4 target between EGP35.00-EGP42.00.

7 | P a g e
Conclusion From what we have described, all long and medium term technical evidences show:
Most of the time COMI.CA is an outperformed and market leader. The wave structure of the share suggests that COMI.CA has started the corrective wave 4 which should target the zone between EGP35.00-
EGP42.00. We don’t believe that COMI.CA will be able to break above EGP55.00 at the current time.
Recommendation On the short term, sell rallies is recommended. Medium and long term investors are advised to buy dips around in the target zone between EGP35.00-EGP42.00 with a stop loss of EGP32.00. 2016’s target is set around EGP75.00.

8 | P a g e
BEFORE GOING BULLISH
From what we have listed so far, the next market action is depending solely on the movement of the heavy weight share COMMERCIAL INTERNATIONAL
BANK (COMI.CA) which represents nearly 38% of the main index EGX30.
In fact, COMI.CA is the main reason behind not going bullish after many of the market stocks.
COMMERCIAL INTERNATIONAL BANK (COMI.CA) has 2 scenarios to follow during the last quarter of 2015.
- The first scenario (75% probability): o The share to break below EGP50.00 and achieve wave four’s target zone. o This will put pressure on most of the market stocks especially blue chips. o We believe that COMI.CA will give some stocks (Top Picks) the time need to rally away from its recorded lows to avoid recording new low
when COMI.CA starts its down move. - The second scenario (25% probability):
o Through the last quarter, COMI.CA moves sideways between EGP50.00 and EGP55.00. o This will give the time needed for its technical indicators to ease and to pave the way for 2016’s rally. o In this case, some stocks (Top Picks) which have a good chance founding a major bottom around the current areas will start its rally earlier than
the market.
Accordingly, traders should put in mind the 2 scenarios of COMI.CA before going bullish on our top picks below by either adjusting their portfolios quantities
or by taking the risk and strictly follow the mentioned stop loss level taking all actions needed to protect their profits or to cut the losses short.
TOP PICKS
A M E R G R O U P H O L D I N G ( A M E R . C A ) A R A B I A I N V E S T M E N T S D E V E L O P M E N T F I N A N C I A L I N V E S T M E N T S H O L D I N G ( A I N D . C A ) P I O N E E R S H O L D I N G ( P I O H . C A ) O R A S C O M T E L E C O M M E D I A & T E C H N O L O G Y H O L D I N G ( O T M T . C A )

9 | P a g e
AMER GROUP HOLDING (AMER.CA) Long Term View
The above monthly chart shows Ichimoku Cloud indicator on the upper
panel and volatility indicator in the lower panel.
AMER.CA has reached a long term support zone represented with the
cloud. The strength of the support is determined by the width of the
cloud.
Ichimoku indicators has a positive long term forecast which is seen the
green cloud.
The volatility indicator has reached its oversold zone which resulted is the
impulse wave that was seen from mid-2013 to mid-2014.

10 | P a g e
Medium Term View
Examining the medium term cycle, AMER.CA tends to form a trough
every 39 weeks with 80% accuracy.
2 weeks ago, AMER.CA has entered the expected bottom zone which at
the same time coincided with 61% retracement level of the previous rally
which usually provides support and represents a potential reversal point.
Also, EGP0.72 coincided with the 200 weeks moving average which also
works as a strong support.
According to our Elliot waves count, the current area could end the
corrective wave 4 and should pave the way for wave 5 rally.
Wave 5 target should be at least the previous high around EGP1.50.

11 | P a g e
Conclusion From what we have described, all long and medium term technical evidences show:
AMER.CA has 80% probability finding a bottom around the current level. Confirmation will be triggered with a weekly close above EGP0.92.
Recommendation On the short term, buy dips is recommended for the targets of EGP0.85 and EGP0.92. Short term stop loss is set at EGP0.70. Medium and long term investors are advised to buy dips around the current levels for the targets of EGP1.10, EGP1.30 and EGP1.50 with a stop loss
of EGP0.60.

12 | P a g e
Arabia Investments Development Financial Investments Holding (AIND.CA) Long Term View
The above monthly chart shows Ichimoku Cloud indicator on the upper
panel and volatility indicator in the lower panel.
During 2013, AIND.CA has managed to travel through most of the cloud
width indicating strength. Usually when this pattern appears, it paves the
way for breaking above the cloud.
Last month, AIND.CA has formed a bullish Tweezer Bottom candle
formation which paves the way for more advances.
Forming a monthly tweezer bottom while volatility indicators are in
oversold areas and with positive Ichimoku forecast are seen as a
confirmed buy signal.
13 | P a g e
Medium Term View
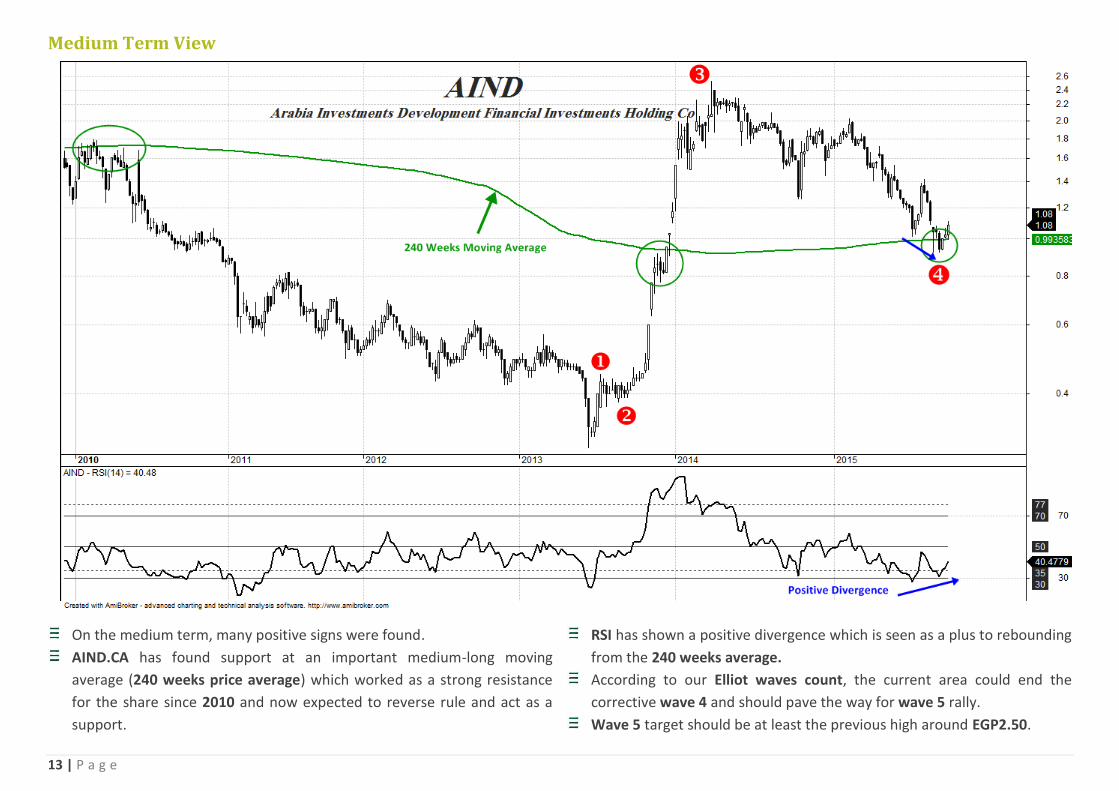
On the medium term, many positive signs were found.
AIND.CA has found support at an important medium-long moving
average (240 weeks price average) which worked as a strong resistance
for the share since 2010 and now expected to reverse rule and act as a
support.
RSI has shown a positive divergence which is seen as a plus to rebounding
from the 240 weeks average.
According to our Elliot waves count, the current area could end the
corrective wave 4 and should pave the way for wave 5 rally.
Wave 5 target should be at least the previous high around EGP2.50.

14 | P a g e
Conclusion From what we have described, all long and medium term technical evidences show:
AIND.CA has a high probability finding a bottom around the current level. Breaking below EGP0.92 at the near term has low probability.
Recommendation On the short term, buy dips is recommended for the targets of EGP1.25 and EGP1.40. Short term stop loss is set at EGP0.92. Medium and long term investors are advised to buy dips around the current levels for the targets of EGP1.60 and EGP2.40 with a stop loss of
EGP0.92.

15 | P a g e
Pioneers Holding (PIOH.CA) Long Term View
During 2014, PIOH.CA has managed to travel through most of the cloud
width indicating strength.
PIOH.CA has found support at the cloud which coincided with the major
support at EGP6.00 to witness a 30% reward rally increasing the reliability
of that support forming monthly hammer bullish candle formation.
Ichimoku indicators has a positive long term forecast which is seen the
green cloud.
According to our Elliot waves count, the current area could end the
corrective wave 4 and should pave the way for wave 5 rally.
Wave 5 target should be at least the previous high around EGP16.00.

16 | P a g e
Medium Term View
On the medium term, many positive signs were found.
PIOH.CA has found support at an important medium-long moving average
(220 weeks price average) which worked as a strong resistance for the
share since 2012 and now expected to reverse rule and act as a support.
While testing the 220 weeks moving average, PIOH.CA has formed a
weekly bullish hammer formation which adds to the reliability of that
average.
Medium term indicators have reached an extreme oversold condition
which resulted in a strong rally when it has been reached before.
17 | P a g e
Conclusion From what we have described, all long and medium term technical evidences show:
PIOH.CA has a high probability finding a bottom around the current level. Breaking below EGP6.00 at the near term has low probability.
Recommendation On the short term, buy dips is recommended for the targets of EGP8.00 and EGP8.70. Short term stop loss is set at EGP6.80. Medium and long term investors are advised to buy dips around the current levels for the targets of EGP10.00, EGP11.00 and EGP14.00 with a stop
loss of EGP6.00.
18 | P a g e
Orascom Telecom Media & Technology Holding (OTMT.CA) Long Term View
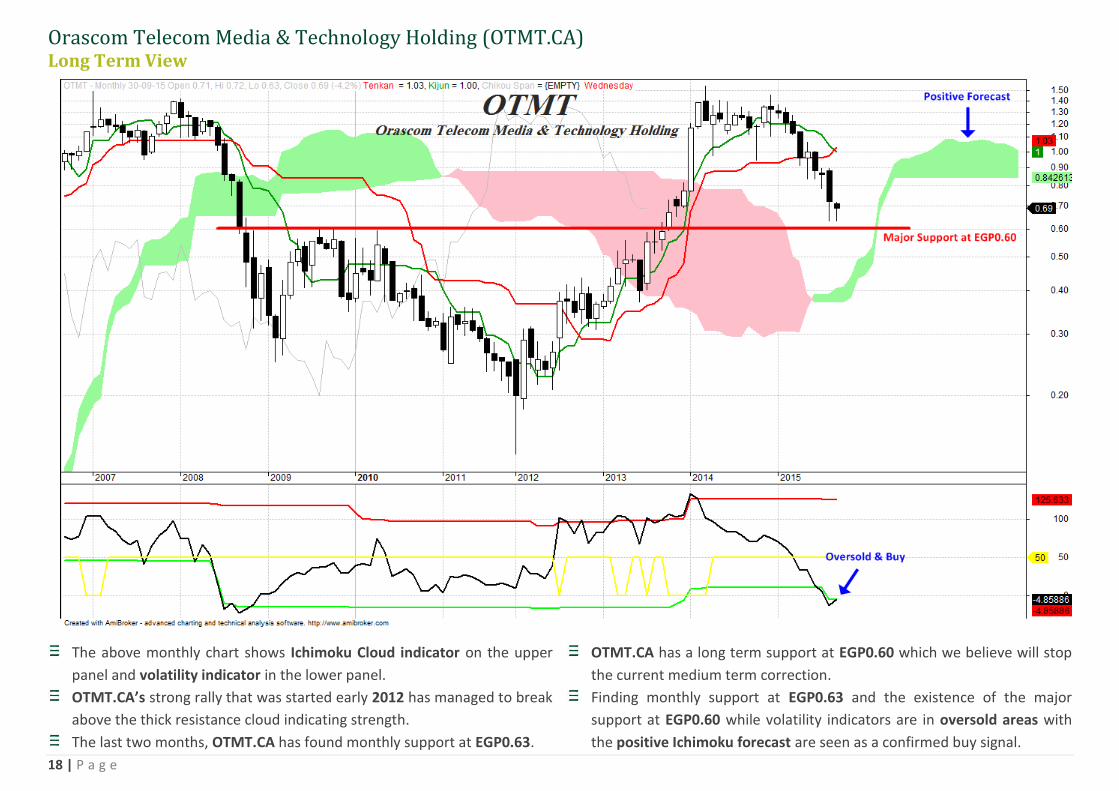
The above monthly chart shows Ichimoku Cloud indicator on the upper
panel and volatility indicator in the lower panel.
OTMT.CA’s strong rally that was started early 2012 has managed to break
above the thick resistance cloud indicating strength.
The last two months, OTMT.CA has found monthly support at EGP0.63.
OTMT.CA has a long term support at EGP0.60 which we believe will stop
the current medium term correction.
Finding monthly support at EGP0.63 and the existence of the major
support at EGP0.60 while volatility indicators are in oversold areas with
the positive Ichimoku forecast are seen as a confirmed buy signal.

19 | P a g e
Medium Term View
OTMT.CA has found support at an important medium-long moving
average (220 weeks price average) which expected to reverse rule and
act as a support. The 220 MA coincided with 61% retracement level of
the previous rally which should provide more power to the support zone
between EGP0.60 and EGP0.63.
Medium term indicators have reached an extreme oversold condition
which resulted in a strong rally when it has been reached before.
According to our Elliot waves count, the current area could end the
corrective wave 4 and should pave the way for wave 5 rally.
Wave 5 target should be at least the previous high around EGP1.50.

20 | P a g e
Conclusion From what we have described, all long and medium term technical evidences show:
OTMT.CA has a high probability finding a bottom around the current level. Breaking below EGP0.60 at the near term has low probability.
Recommendation On the short term, buy dips around EGP0.65 or buy the break of EGP0.72 is recommended for the targets of EGP0.80 and EGP0.90. Short term stop loss is set at EGP0.63. Medium and long term investors are advised to buy dips around the current levels for the targets of EGP1.00, EGP1.20 and EGP1.40 with a stop loss
of EGP0.60.

21 | P a g e
DISCLAIMER
This report has been prepared according to the general data available for public, in accordance with the professional standards applied in that career to the
best knowledge of the reporter. The recommendations mentioned are a guiding tool representing a professional opinion, and not granting any profits,
consequently it is not obligatory for our valued customers and investors. EFG Hermes shall not be liable for any direct, indirect, incidental, or consequential
damages, including limitation losses, lost revenues, or lost profits that may result from these materials. Republishing this report or any of its contents is
subject to prior approval; referring to the source is a must. Opinions expressed are subject to change without notice and may differ or be contrary to the
opinions or recommendations of EFG-Hermes Investment Research or the opinions expressed by other business areas or groups of EFG-Hermes as a result of
depending solely on the historical technical behavior (price and volume). EFG-Hermes may, as principal or agent, have position in, underwrite, buy or sell,
enter into derivatives transactions in relation to any financial instrument or asset referred to in this email.