Plasma kinetics in a nanosecond pulsed filamentary ...
17
1 © 2018 IOP Publishing Ltd Printed in the UK Journal of Physics D: Applied Physics Plasma kinetics in a nanosecond pulsed filamentary discharge sustained in Ar–H 2 O and H 2 O Yuchen Luo 1 , Amanda M Lietz 2 , Shurik Yatom 1,4 , Mark J Kushner 3 and Peter J Bruggeman 1 1 Department of Mechanical Engineering, University of Minnesota, 111 Church Street SE, Minneapolis, MN 55455, United States of America 2 Department of Nuclear Engineering and Radiological Sciences, University of Michigan, 2355 Bonisteel Blvd., Ann Arbor, Michigan 48109-2104, Ann Arbor, MI 48109-2125, United States of America 3 Department of Electrical Engineering and Computer Science, University of Michigan, 1301 Beal Ave, Ann Arbor, MI 48109-2122, United States of America E-mail: [email protected], [email protected], [email protected] , [email protected] and [email protected] Received 23 June 2018, revised 1 October 2018 Accepted for publication 24 October 2018 Published 16 November 2018 Abstract The plasma kinetics of Ar–H 2 O and H 2 O at atmospheric pressure are of interest for applications in biotechnology where rare-gas plasma jets treat liquid surfaces and in water treatment where discharges are generated in bubbles or directly in liquid water. Due to evaporation resulting from heat transfer to the liquid, for many conditions the mole fraction of water in the plasma can be large—approaching nearly pure water. In this paper, results are discussed from a combined experimental and computational investigation of the chemical kinetics in a high electron density plasma filament sustained in Ar–H 2 O at atmospheric pressure. The chemical kinetics were simulated using a 0D global model, validated by measurements of the absolute OH and H densities by laser induced fluorescence (LIF) and two-photon absorption LIF. The primary sources of H and OH during the discharge pulse are dissociative excitation transfer from metastable Ar atoms and Ar dimer excimers at low water concentration and electron impact dissociation of H 2 O at high water concentration. In spite of their similar sources, the density of OH was measured to be two orders of magnitude smaller than that of H at power densities on the order of 10 5 Jm −3 . This disparity is due to electron impact dissociation of OH during the discharge pulse and rapid reactions of OH in the presence of high H and O densities in the afterglow. It is often assumed that OH is the dominant non-selective reactive species in water-containing plasmas. These results reinforce the importance of atomic species such as H and O in water containing high energy density plasmas. A numerical parametric study revealed that the lowest energy cost for H 2 O 2 production is achieved at low energy densities in pure water. The high concentration of atomic radicals, which rapidly recombine, results in an overall lower energy efficiency of reactive species production. In particular, the selectivity of H 2 O 2 production decreases with increasing power density which instead favors H 2 and O 2 production. Keywords: plasmas in liquids, chemical kinetics, pulsed plasmas, water vapor, H 2 O 2 production, 0D kinetics modeling, laser induced fluoresence (Some figures may appear in colour only in the online journal) 4 Current address: Princeton Plasma Physics Laboratory, Princeton University, 100 Stellarator rd., Princeton, NJ 08450, United States of America. 1361-6463/19/044003+17$33.00 https://doi.org/10.1088/1361-6463/aaeb14 J. Phys. D: Appl. Phys. 52 (2019) 044003 (17pp)
Transcript of Plasma kinetics in a nanosecond pulsed filamentary ...

1 © 2018 IOP Publishing Ltd Printed in the UK
Journal of Physics D: Applied Physics
Plasma kinetics in a nanosecond pulsed filamentary discharge sustained in Ar–H2O and H2O
Yuchen Luo1, Amanda M Lietz2 , Shurik Yatom1,4, Mark J Kushner3 and Peter J Bruggeman1
1 Department of Mechanical Engineering, University of Minnesota, 111 Church Street SE, Minneapolis, MN 55455, United States of America2 Department of Nuclear Engineering and Radiological Sciences, University of Michigan, 2355 Bonisteel Blvd., Ann Arbor, Michigan 48109-2104, Ann Arbor, MI 48109-2125, United States of America3 Department of Electrical Engineering and Computer Science, University of Michigan, 1301 Beal Ave, Ann Arbor, MI 48109-2122, United States of America
E-mail: [email protected], [email protected], [email protected], [email protected] and [email protected]
Received 23 June 2018, revised 1 October 2018Accepted for publication 24 October 2018Published 16 November 2018
AbstractThe plasma kinetics of Ar–H2O and H2O at atmospheric pressure are of interest for applications in biotechnology where rare-gas plasma jets treat liquid surfaces and in water treatment where discharges are generated in bubbles or directly in liquid water. Due to evaporation resulting from heat transfer to the liquid, for many conditions the mole fraction of water in the plasma can be large—approaching nearly pure water. In this paper, results are discussed from a combined experimental and computational investigation of the chemical kinetics in a high electron density plasma filament sustained in Ar–H2O at atmospheric pressure. The chemical kinetics were simulated using a 0D global model, validated by measurements of the absolute OH and H densities by laser induced fluorescence (LIF) and two-photon absorption LIF. The primary sources of H and OH during the discharge pulse are dissociative excitation transfer from metastable Ar atoms and Ar dimer excimers at low water concentration and electron impact dissociation of H2O at high water concentration. In spite of their similar sources, the density of OH was measured to be two orders of magnitude smaller than that of H at power densities on the order of 105 Jm−3. This disparity is due to electron impact dissociation of OH during the discharge pulse and rapid reactions of OH in the presence of high H and O densities in the afterglow. It is often assumed that OH is the dominant non-selective reactive species in water-containing plasmas. These results reinforce the importance of atomic species such as H and O in water containing high energy density plasmas. A numerical parametric study revealed that the lowest energy cost for H2O2 production is achieved at low energy densities in pure water. The high concentration of atomic radicals, which rapidly recombine, results in an overall lower energy efficiency of reactive species production. In particular, the selectivity of H2O2 production decreases with increasing power density which instead favors H2 and O2 production.
Keywords: plasmas in liquids, chemical kinetics, pulsed plasmas, water vapor, H2O2 production, 0D kinetics modeling, laser induced fluoresence
(Some figures may appear in colour only in the online journal)
Y Luo et al
Printed in the UK
044003
JPAPBE
© 2018 IOP Publishing Ltd
52
J. Phys. D: Appl. Phys.
JPD
10.1088/1361-6463/aaeb14
Paper
4
Journal of Physics D: Applied Physics
IOP
4 Current address: Princeton Plasma Physics Laboratory, Princeton University, 100 Stellarator rd., Princeton, NJ 08450, United States of America.
2019
1361-6463
1361-6463/19/044003+17$33.00
https://doi.org/10.1088/1361-6463/aaeb14J. Phys. D: Appl. Phys. 52 (2019) 044003 (17pp)

Y Luo et al
2
1. Introduction
Water containing atmospheric pressure discharges have been the focus of several investigations due to their wide range of applications, including environmental remediation, mat-erial synthesis, surface treatment and medicine [1]. Plasmas in and in contact with liquids have been intensively studied in the context of water purification [2–4]. Discharges having significant mole fractions of water typically produce large densities of highly reactive species such as OH radicals [5]. The OH radical is generally a non-selective oxidizing species and is the precursor species to forming H2O2, an important long-lived agent in the chemical reactivity of plasmas for both water treatment and plasma medicine [6–8]. Although water containing plasmas are effective in remediating organic or inorganic pollutants, the energy efficiencies are usually low compared with conventional water treatment [4, 9]. While investigations of plasma-induced liquid phase chemistry have been reported [10, 11], investigations of the composition of discharges having large mole fractions of water vapor are rather limited [1].
The kinetics of water containing discharges in the gas phase have been investigated both experimentally and numer-ically. Earlier work consists of corona discharges in humid air in the context of polymer and exhaust gas treatment [12, 13]. Extensive reaction sets and chemical kinetics models have been reported for humid air [14, 15], Ar–air–H2O [16, 17] and He–(air–)H2O [18–20] discharges. These reaction sets have been applied to many types of plasmas including coronas [13, 14], plasma jets [18, 21], radio frequency (RF) discharges [19, 22], discharges in bubbles [23] and plasma in contact with liquid interfaces [24, 25].
Several studies have computationally and experimentally addressed water containing plasmas. Stalder et al [26] used a zero-dimensional (0D) global model to study atmospheric pressure glow discharges in helium and helium air mix-tures, and compared predicted densities of metastable helium He(23S) with those measured by laser collisional-induced fluorescence. Soloshenko et al [14] developed a humid air reaction set to study the effect of humidity on the produc-tion of O3, HNO2, HNO3 and NO3 in an air dielectric bar-rier discharge (DBD). They obtained excellent agreement between the simulation and measured concentrations. NO and O production have been modeled for a RF plasma jet using the chemical reaction set reported by van Gaens and Bogaerts [16]. Predictions were validated by laser induced fluorescence (LIF) measurements [27]. The He–H2O chemical kinetics set reported by Liu et al [22] has been used to model a capaci-tively coupled RF discharge; and the predicted OH and H2O2 densities in the model showed good agreement with the exper-imentally measured values [28]. The kinetics of pure water discharges have not been extensively studied by either experi-ments or modeling, with few exceptions [29, 30].
In diffuse water containing discharges having a low elec-tron density (~1017 m−3), OH is dominantly produced by electron impact dissociation of water [28] for which the elec-tron-initiated reactions are well known [31]. However, many applications of atmospheric pressure plasmas are filamentary
discharges with electron densities as high as 1020–1024 m−3 [1, 5]. At these higher electron densities, ionic recombination and charge exchange reactions become important sources of radicals. The production mechanism of OH in high electron density discharges can be significantly different compared to their low electron density counterparts.
For example, the production of OH radicals mainly occurs in the afterglow of a nanosecond pulsed high electron den-sity (1022 m−3) helium-water discharge [32]. This observation implies that processes other than direct electron impact dis-sociation of water are important for OH production. (For mol-ecules that dissociatively attach electrons at thermal energies, such as Cl2 and SF6, significant radical production can occur by reactions with low energy electrons in an afterglow. However, H2O is not such a species.) Unfortunately, the branching ratios of ion–electron recombination are not as accurately known as electron-induced dissociation reactions of H2O [1]. Another significant difference between high electron density filamen-tary discharges and diffuse low-density discharges is that the dissociation degree of H2O can be large. Verreycken et al reported nOH/nH2O ≈ 0.7 [32] consistent with a large disso-ciation fraction of water in the core of a filamentary discharge.
In this paper, we report on a combined experimental and computational investigation of the kinetics of nanosecond pulsed filamentary, high electron density discharges sustained in Ar/H2O mixtures. The plasma-chemical kinetics were com-putationally investigated using the 0D model, GlobalKin [33]. This model was validated with measurements of H atom [34] and OH densities. As the discharge is operated in an open-air environment with argon shielding, we also investigated the effects of air on Ar–H2O kinetics and the formation path-ways of the H and OH radicals. The validated reaction set was subsequently used to simulate a similar nanosecond pulsed discharge in Ar–H2O with different admixtures of water and energy deposition. A numerical parametric study was per-formed to assess energy efficiencies and selectivities in H2O2 production. This study includes an analysis of the underpin-ning kinetics of radical and reactive species production.
2. Experimental and computational methods
2.1. Experiment setup and diagnostics
The plasma source used in this study is a nanosecond pulsed atmospheric pressure plasma jet with shielding co-flow. The setup has been described in detail in [34] and a schematic is shown in figure 1. The core gas flow (Ar + 0.26% H2O) is fed through a quartz tube (I.D. 1.5 mm, O.D. 3 mm) with a flow rate of 1.34 standard liter per minute (slm). The core flow is shielded from the surrounding air by a flow of dry argon through a coaxial tube with a flow rate of 2 slm. The tungsten needle electrode in the center of the quartz tube is connected to a DEI PVX-4110 high voltage pulse generator providing a voltage pulse with a full width at half maximum (FWHM) of 200 ns, a voltage amplitude of 4.7 kV and a repetition rate of 5 kHz. The cathode plate electrode is separated from ground by a 50 kΩ resistor, and so the voltage across the discharge drops when a spark is formed and current increases. These
J. Phys. D: Appl. Phys. 52 (2019) 044003

Y Luo et al
3
conditions lead to a transient spark which self-limits the dis-charge power. The main discharge energy is supplied within 20 ns and an additional energy deposition occurs when the applied voltage is reduced to zero after 200 ns [34]. Except for the absolute OH density and gas temperature measured by LIF in this study, all the other experimental data are taken from [34], where all details of the experimental procedures can also be found. A brief overview of the experimental pro-cedures is given below. All experimental data presented here were recorded at a distance of 4 mm from the nozzle, as shown in figure 1.
The current was measured by a Rogowski coil (Pearson 2877) and the voltage drop across the discharge was measured by two high voltage probes (Tektronix P6015A). The power is obtained by multiplying the voltage drop across the discharge gap with the current from which the capacitive contribution has been subtracted. The electron density was measured by the Stark line broadening of the hydrogen Balmer β-line. The spectral resolution of the spectrometer was 60 pm FWHM. For the experimental conditions, Doppler and van der Waals broadening can be neglected compared to Stark broadening [34]. The neutral gas density was measured by Rayleigh scat-tering. Nanosecond pulsed discharges can experience fast gas heating which leads to an increase in pressure [35]. One can only deduce the gas temperature from the neutral gas density assuming constant pressure in the afterglow at time scales longer than the hydrodynamic relaxation time of the gas den-sity. This relaxation time for a 100 µm filament in argon is 250–300 ns.
The absolute atomic H density was measured using two-photon absorption LIF. The calibration was performed with Kr using the method first reported by Niemi et al [36]. A Nd:YAG laser operating at 532 nm with a FWHM of 6 ns (Spectra-Physics LAB-170-10H) pumped a dye laser (Sirah, Precision Scan) with a mixture of rhodamine B and rhodamine 101 dyes dissolved in ethanol resulting in lasing at 615 nm. The required 205 nm laser beam for TaLIF of H was produced by sum frequency mixing in a BBO crystal of the residual original 615 nm dye laser beam generated with its frequency doubled beam (produced in a KDP crystal) at 312.5 nm to generate the third harmonic. The ground state H atom was excited to the 3d2D3/2,5/2 level. Fluorescence at 656.28 nm (Hα), originating from the decay of these states is recorded by an intensified charged coupled device (ICCD, Andor IStar DH340T). The absolute calibration of the TaLIF signal con-siders the overlap integral of the line profile of the laser beam and the atomic absorption line and quenching of the emitting H(n = 3) state by ambient gases [36], dominated by Ar for the experimental conditions. An important uncertainty in the derived H density is due to the variation in the gas temper-ature and Ar density during the discharge pulse. In this case, three gas temperatures were used to assess the uncertainty of the H density during the discharge pulse—room temperature, the temperature obtained from Rayleigh scattering assuming atmospheric pressure and the gas temperature derived from the power deposition assuming that all power is instantane-ously converted into gas heating.
The density and the rotational temperature of the OH ground state were also measured during a different set of experiments while keeping the conditions as close as possible to the current experiment. Differences between the prior and current experiments include a variation in the power deposi-tion. It was confirmed that the OH density is insensitive to the power for the range of power variations investigated, as discussed below. The LIF of OH was produced using the same laser system as for TaLIF of H with the exception of using rhodamine 6G dye. After frequency doubling with a BBO crystal, the dye laser produces a beam around 282 nm. As in the experiments described in [37], the P1(2) transition of OH [A(ν′ = 1) ← X(ν″ = 0)] was excited to obtain the absolute density. The choice for this transition was motivated by the corresponding ground level having a large relative population among all rotational levels of OH(A) and the line being well separated from neighboring transitions for the experimental conditions. The fluorescence was detected using the same ICCD camera as for TaLIF by imaging with a Nikon 105 mm F4.5 UV lens. The camera gate width was typically kept at 200 ns to ensure that all fluorescence was collected. However, within the first 5 µs of the discharge period, the camera gate was reduced to 30 ns to reduce the amount of discharge pro-duced emission that was collected. The fluorescence signal was corrected to account for this shorter gate time in the cali-bration process.
The water and air concentration in argon were obtained by measuring the fluorescence decay of OH(A) at 100 µs after the discharge pulse with a gate of 5 ns. This time is approxi-mately two times larger than the characteristic diffusion time
Figure 1. Schematic of the experimental setup.
J. Phys. D: Appl. Phys. 52 (2019) 044003

Y Luo et al
4
of H2O for a 200 µm filament in Ar. The absolute calibration of the OH LIF was performed using Rayleigh scattering. The four-level LIF model and techniques are discussed in [37, 38]. The collisional quenching constants, required for the abso-lute calibration, were taken from [39, 40]. The laser energy was ≈27 µJ and the diameter of the laser spot at the position of the plasma filament was 93 ± 4 µm, resulting in the meas-urement being performed in the linear LIF region.
Another measurement of the gas temperature was obtained by excitation LIF of OH using the technique described in [41]. The technique measures the rotational temperature of OH in the ground state which is in equilibrium with the translational temperature of the gas at atmospheric pressure [42]. The Boltzmann plot yielding the rotational temperature is con-structed using six levels of the OH ground state obtained by exciting the P1(1) to P1(6) transitions.
2.2. 0D kinetics model
The modeling was performed using the 0D model, GlobalKin, described in [33]. Electron impact rate coefficients and transport coefficients for use in the model are obtained from solutions of Boltzmann’s equation for the electron energy distribution (EED). Boltzmann’s equation is solved for a range of E/N (electric field/gas number density) to produce a table of rate coefficients as a function of the mean electron energy. This table is then interpolated during the execution of the model using the mean average energy produced by the electron energy conservation equation. For all cases discussed here, these tables were recalculated every 1 ns during the voltage pulse (first 200 ns) to reflect changes in gas mole frac-tions and gas temperature. The evolution of the mean electron energy is obtained by solving an electron energy equation that assumes all electrical energy is first transferred to electrons and the electrons lose their energy through collisions. The gas temperature is obtained by solving an energy balance equa-tion for the heavy species that includes ion charge exchange heating, electron elastic collision heating, Franck–Condon heating and the change of enthalpy due to chemical reactions. The basic reaction mechanism is essentially the same as that described in [16] with the following modifications to accom-modate higher energy densities.
(1) Dissociative ionization of H2O branching to OH+ was added [31]
e− + H2O → 2e− + OH+ + H. (R1)
(2) A full set of electron impact and heavy particle reac-tions of vibrationally excited water were added to avoid the accumulation of H2O(v). The electron impact cross sections are the same as for the ground state with the threshold energy shifted by the vibrational quanta, and the corresponding superlastic processes added. The heavy particle reaction rate coefficients are the same as their counterpart for the ground state of water with the activa-tion energy shifted by the vibrational quanta.
(3) Penning ionization of water by Ar(4D) and specific excita-tion of Ar(4D) having a threshold energy of 14.7 eV were added [43]. Quenching and Penning reactions of Ar(4D) were estimated to be the same as for Ar(4P).
The computational study was limited to conditions for which the gas temperature does not exceed 1000 K as the reac-tion mechanism was initially developed to describe the kinetics in plasmas having gas heating of at most only several hundreds of degrees. The power density and gas composition were used as input for the simulation. The model includes radial losses of neutral species, radial losses of charged species (ambipolar diffusion) and radial heat losses. The boundary temperature is set at 370 K, the experimentally measured gas temperature surrounding the filament [34], though results of the model were not overly sensitive to moderate changes of the location of the radial boundary. The radial heat loss is significant in the late afterglow, and was accounted for using computed thermal conductivity coefficients based on Lennard–Jones parameters of the gas constituents [34].
In this study, rather than using the measured power den-sity, which requires the determination of the filament volume, we used the experimentally obtained power and scaled the absolute value of this power waveform by fitting the exper-imentally obtained peak electron density with the model. In a 0D model for which electron loss is not dominated by dif-fusion, as at atmospheric pressure, electron density is typi-cally a function of power density. This approach was chosen over the method of directly using the measured power density, since determining the plasma volume by emission intensity profiles is prone to significant uncertainty. The power density was fixed when the simulation yielded a maximum electron density within 5% of the experimental value. We used the lower limit of the experimentally obtained gas temperature to minimize possible discrepancies between results of the model and measured gas temperatures.
The experiment was performed at a repetition rate of 5 kHz. The gas residence time 4 mm from the nozzle, the posi-tion at which the measurements and calculations were per-formed, was estimated as 250–300 µs using computational fluid dynamics [34]. Transport due to the gas flow is therefore not significantly impacting the discharge kinetics on the time-scale of interest (200 µs).
3. Model validation
3.1. Determining the gas composition
The air and H2O concentrations used for the initial gas compo-sition in the model were determined by measuring quenching rates of OH(A) 100 µs after the discharge pulse, twice the diffusion time of H2O and air into a 200 µm filament, to verify that no significant dissociation of the molecular spe-cies influence the measurement. The total quenching time of OH(A) (τQ) was determined by the inverse sum of the rates of quenching by the individual gas components (N2, O2, Ar, H2O),
J. Phys. D: Appl. Phys. 52 (2019) 044003
Y Luo et al
5
τQ =1
nairqair + nH2OqH2O + nArqAr (1)
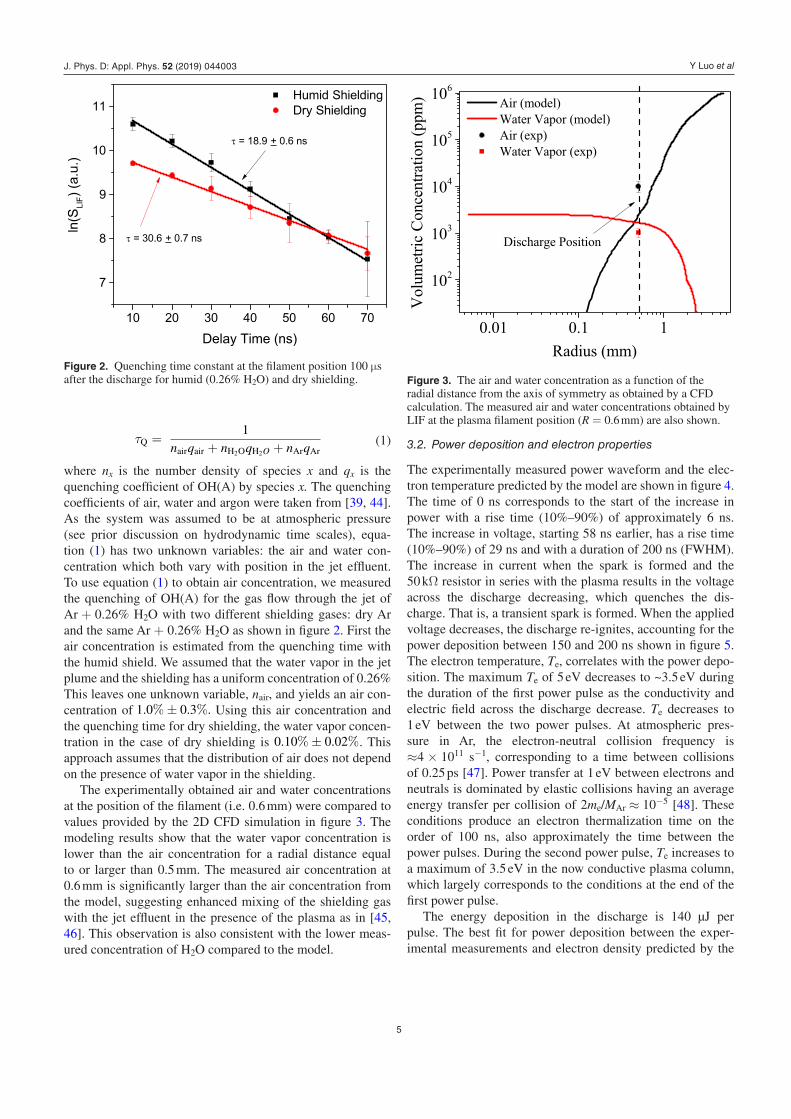
where nx is the number density of species x and qx is the quenching coefficient of OH(A) by species x. The quenching coefficients of air, water and argon were taken from [39, 44]. As the system was assumed to be at atmospheric pressure (see prior discussion on hydrodynamic time scales), equa-tion (1) has two unknown variables: the air and water con-centration which both vary with position in the jet effluent. To use equation (1) to obtain air concentration, we measured the quenching of OH(A) for the gas flow through the jet of Ar + 0.26% H2O with two different shielding gases: dry Ar and the same Ar + 0.26% H2O as shown in figure 2. First the air concentration is estimated from the quenching time with the humid shield. We assumed that the water vapor in the jet plume and the shielding has a uniform concentration of 0.26% This leaves one unknown variable, nair, and yields an air con-centration of 1.0%± 0.3%. Using this air concentration and the quenching time for dry shielding, the water vapor concen-tration in the case of dry shielding is 0.10%± 0.02%. This approach assumes that the distribution of air does not depend on the presence of water vapor in the shielding.
The experimentally obtained air and water concentrations at the position of the filament (i.e. 0.6 mm) were compared to values provided by the 2D CFD simulation in figure 3. The modeling results show that the water vapor concentration is lower than the air concentration for a radial distance equal to or larger than 0.5 mm. The measured air concentration at 0.6 mm is significantly larger than the air concentration from the model, suggesting enhanced mixing of the shielding gas with the jet effluent in the presence of the plasma as in [45, 46]. This observation is also consistent with the lower meas-ured concentration of H2O compared to the model.
3.2. Power deposition and electron properties
The experimentally measured power waveform and the elec-tron temperature predicted by the model are shown in figure 4. The time of 0 ns corresponds to the start of the increase in power with a rise time (10%–90%) of approximately 6 ns. The increase in voltage, starting 58 ns earlier, has a rise time (10%–90%) of 29 ns and with a duration of 200 ns (FWHM). The increase in current when the spark is formed and the 50 kΩ resistor in series with the plasma results in the voltage across the discharge decreasing, which quenches the dis-charge. That is, a transient spark is formed. When the applied voltage decreases, the discharge re-ignites, accounting for the power deposition between 150 and 200 ns shown in figure 5. The electron temperature, Te, correlates with the power depo-sition. The maximum Te of 5 eV decreases to ~3.5 eV during the duration of the first power pulse as the conductivity and electric field across the discharge decrease. Te decreases to 1 eV between the two power pulses. At atmospheric pres-sure in Ar, the electron-neutral collision frequency is ≈4 × 10¹¹ s−1, corre sponding to a time between collisions of 0.25 ps [47]. Power transfer at 1 eV between electrons and neutrals is dominated by elastic collisions having an average energy transfer per collision of 2me/MAr ≈ 10−5 [48]. These conditions produce an electron thermalization time on the order of 100 ns, also approximately the time between the power pulses. During the second power pulse, Te increases to a maximum of 3.5 eV in the now conductive plasma column, which largely corresponds to the conditions at the end of the first power pulse.
The energy deposition in the discharge is 140 µJ per pulse. The best fit for power deposition between the exper-imental measurements and electron density predicted by the
Figure 2. Quenching time constant at the filament position 100 µs after the discharge for humid (0.26% H2O) and dry shielding. Figure 3. The air and water concentration as a function of the
radial distance from the axis of symmetry as obtained by a CFD calculation. The measured air and water concentrations obtained by LIF at the plasma filament position (R = 0.6 mm) are also shown.
J. Phys. D: Appl. Phys. 52 (2019) 044003

Y Luo et al
6
model produces a peak power density of 2.8 × 10⁷ W cm−3. Assuming the power is homogeneously distributed throughout the entire filament, this yields a plasma filament diameter of 261 µm. The image of the discharge filament in figure 5 has a core with strong emission with a diameter of 120 ± 40 µm while the FWHM of the filament is 410 ± 40 µm. Although there is some uncertainty in the diameter of the filament, dif-ferent filament diameters did not have a significant impact on the predicted species density as long as the power density is kept constant. In the simulations discussed here, we used a fil-ament diameter of 261 µm (the length of the filament is 9 mm).
A comparison of the measured and calculated electron density is in figure 5. The experimental electron density was obtained from the broadening of the hydrogen β line origi-nating from the H(n = 4) state. While to our knowledge there are no quenching lifetime measurements for H(n = 4), the quenching rate is likely to be similar to those for H(n = 3), which is approximately 1010 s−1 (100 ps lifetime) for the experimental conditions [36]. The lifetime of the excited state
is sufficiently short to enable the measurement of the electron density with a time resolution of 3 nanoseconds (i.e. the gate of the ICCD).
Although the agreement between the experiment and the model is good, there are uncertainties in both the model and the experiment. For example, the dominant electron loss mechanism was investigated with the model by removing spe-cific electron loss processes from the reaction mechanism and assessing the impact on the electron density. Although Ar+ is the dominant ion during the voltage pulse, the dissociative recombination reaction
e− + Ar+2 → Ar + Ar(4s) (R2)
most strongly contributes to the decrease in electron density. (In our notation, Ar refers to the ground state, and Ar(4s) refers to the 3s23p54s multiplet, consisting of two resonant and two metastable states.) The associative ionization reaction
Ar + Ar+ + M → Ar+2 + M (R3)
is sufficiently fast for the experimental conditions that the argon ion density is dominated by the dimer in the afterglow [49]. Reaction (R2) has only a moderate dependence on the electron temperature (∼ T−0.66
e ) and therefore is not overly sensitive to uncertainties in the calculated electron temper-ature. The gas temperature dependence of associative ioniz-ation (R3) is poorly known. A dimensional analysis of 3-body ion conversion reactions provides a temperature depend-
ence of T−3/4g [49] whereas reaction (R2) has a theoretical
temper ature scaling of TgT−1/2e [49]. Hence both the domi-
nant production and destruction rate coefficients of Ar+2 have some sensitivity to the gas temperature which contributes to uncertainties.
Uncertainties from the experimental side largely originate from the calculation of power deposition. The power is exper-imentally obtained by multiplying the voltage across the dis-charge gap with the resistive current waveform. To obtain the resistive current waveform, the capacitive current needs to be subtracted, a process that has its own uncertainties [34]. In addi-tion, the measured power deposition is for the entire discharge while the electron density is measured locally at a distance of 4 mm from the nozzle. The power deposition as a function of time at the point of measurement could certainly be different than that resulting from the filament averaged power deposition.
3.3. Gas temperature
The gas temperature Tg measured by Rayleigh scattering and LIF of OH is compared with that predicted by the model in figure 6. The predicted Tg shows fast gas heating during the two power pulses, which is not directly indicated by the mea-surements. Recall that Rayleigh scattering is a direct measure-ment of the gas density which requires some assumption on pressure to obtain Tg. As discussed above, the hydrodynamic time scale is commensurate with the length of the discharge pulse, and so there are some uncertainties in converting Rayleigh scattering measurements to gas temperature. For example, fast gas heating can produce increases in Tg within
Figure 4. Experimentally determined power waveform and electron temperature as obtained from the 0D model. The time origin corresponds to the start of the increase in power.
Figure 5. Comparison of the measured and calculated electron density. The insert shows an image of the filament diameter.
J. Phys. D: Appl. Phys. 52 (2019) 044003

Y Luo et al
7
nanoseconds, which would produce a nearly instantaneous increase in pressure, a process that would not be resolved by Rayleigh scattering. The gas temperature obtained by OH LIF and Rayleigh scattering is similar however discharge-produced emission at times below 1 µs is strong and inter-feres with the LIF measurement. The model overestimates the experimentally obtained gas temperature by 20% during the afterglow. This indicates that the energy deposition (which will determine the maximum Tg) is reasonably well captured by the model within the accuracy of the power measurement.
Fast gas heating is typically associated with dissociative processes resulting from the Franck–Condon effect that con-verts the potential energy of the dissociative state into the translational energy of the fragments [50]. In atomic gases, the source of fast gas heating is less clear. The gas temperature in the model is obtained from [33]:
d( 32 NgcpTg)
dt= Pion + Pelast + PFC + Preaction − Pconv − Pcond,
(2)where Ng is the gas density, cp is heat capacity, Pion is ion heating resulting from ion–neutral collisions where ions have been accelerated by the ambipolar electric field, Pelast is heavy particle heating due to elastic collisions with electrons, PFC is Franck–Condon heating, Preaction is the heating related to enthalpy changes during chemical reactions, Pconv is the heat loss due to convection resulting from cool gas flowing into the volume and hot gas flowing out, and Pcond is the heat loss due to radial conduction. The gas residence time was estimated as 2 × 10⁻⁴ s from CFD simulations and the conduction term is based on a diffusion length for the cylindrical geometry of the filament. Convection has a small effect on Tg for these condi-tions. The analysis shows that fast gas heating during the first 100 ns is mainly due to the translational energy release by asso-ciative charge exchange reactions of Ar+ leading to formation of molecular ions, Penning ionization, collisional quenching of excited states and associative collisions of atomic excited
states produced molecular excited states. Nonetheless elastic collisions of electrons contribute to 20% of the increase in gas temperature on short time scales. Neglecting heat loss and all heat sources except Pelast produces a heating rate in pure Ar of ~10 K ns−1. This value is consistent with the gas temperature increase without the contribution of Preaction on a time scale of 10–15 ns (figure 6).
3.4. Reaction set validation
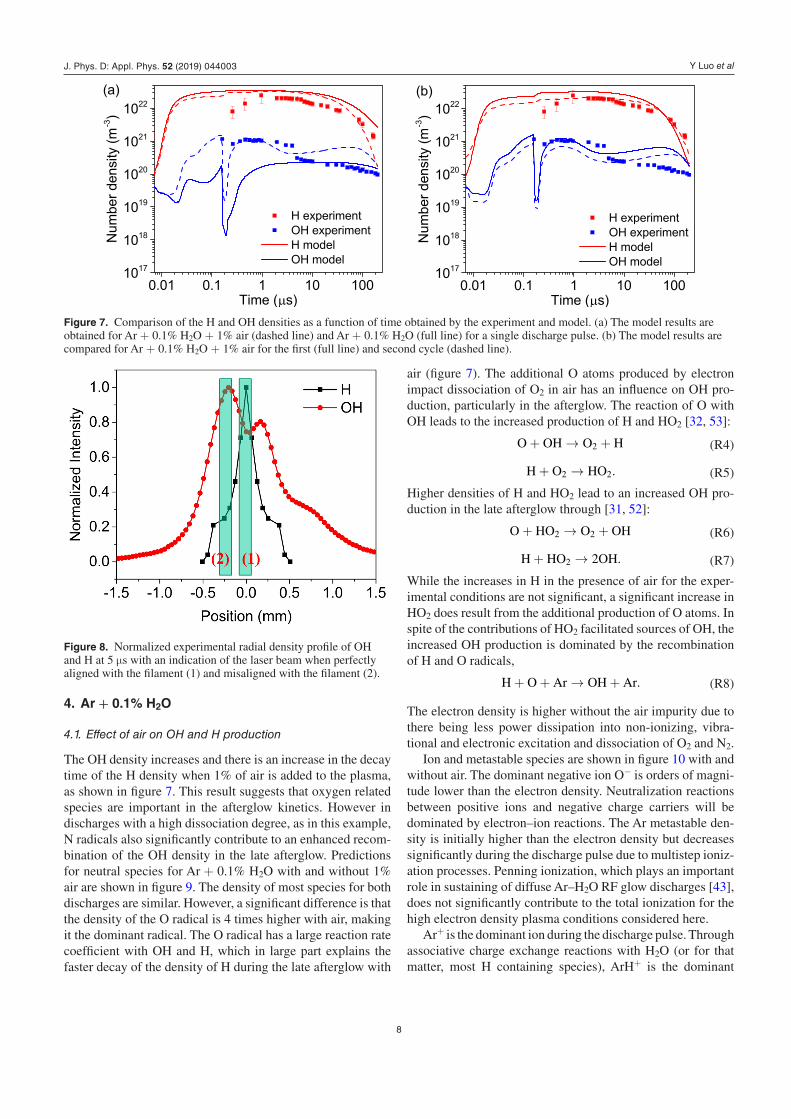
Comparisons of the densities of H and OH from the experiment and model are shown in figure 7 for Ar + 0.1% H2O + 1% air, corresponding to the experimental conditions, and Ar + 0.1% H2O. The presence of air, even at ten times the concentration of H2O, does not significantly impact the H density in the model although its presence does enhance the recombination of H in the late afterglow. The presence of 1% air does increase the OH density by at most a factor 3. Hence the experimental uncertainty in the H2O and air concentration will not significantly impact the comparison between the experiment and model.
The H density is not frequently measured in atmospheric pressure plasmas. In many studies considering Ar–H2O or He–H2O discharges, the OH density is often assumed to be equal to the H density during the discharge when dissocia-tion of water is the dominant source of both species [38, 51, 52]. The H density from both measurements and the model is more than one order of magnitude higher than the OH density during the discharge both with and without air.
The simulated OH and H densities are compared in figure 7(b) for the first and second plasma cycles with a time delay between the cycles of 200 µs as in the experiment. The difference between H and OH densities for the first and second cycle is within a factor 2. The model agrees with the experiment data for the second cycle within a factor 2. The discrepancies during the discharge pulse, similar to those for the electron density, are likely due to uncertainties in the power input waveform. During the discharge pulse, the H den-sity is underestimated and the OH density is overestimated. This trend most likely results from experimental limitations as the laser beam size is similar to the plasma filament diameter at the time of ignition of the discharge. (The OH LIF beam diameter is 93 ± 4 µm.) The radial distributions of the H and OH densities with an aligned and misaligned laser beam are shown in figure 8. When the laser beam is misaligned, the local depletion of the OH density and corresponding off-center maximum in the OH density leads to a larger OH den-sity. The maximum H density is however in the core of the discharge filament and a misalignment of the laser beam will lead to a lower measured H density. While the filament is on average stable, small spatial displacements might occur on a shot-to-shot basis resulting in some misalignment. The align-ment of the laser beam with the plasma filament is performed through maximizing the TaLIF signal and minimizing the LIF signal for a radial displacement of the laser beam. The acc-uracy of the alignment is therefore limited by the experimental shot-to-shot fluctuation of the fluorescence intensity (typically ~10%–20%).
Figure 6. Gas temperature as obtained by Rayleigh scattering, OH LIF and the model. The model results for both with and without heating related to enthalpy changes during chemical reactions (Preaction) are shown.
J. Phys. D: Appl. Phys. 52 (2019) 044003
Y Luo et al
8
4. Ar + 0.1% H2O
4.1. Effect of air on OH and H production
The OH density increases and there is an increase in the decay time of the H density when 1% of air is added to the plasma, as shown in figure 7. This result suggests that oxygen related species are important in the afterglow kinetics. However in discharges with a high dissociation degree, as in this example, N radicals also significantly contribute to an enhanced recom-bination of the OH density in the late afterglow. Predictions for neutral species for Ar + 0.1% H2O with and without 1% air are shown in figure 9. The density of most species for both discharges are similar. However, a significant difference is that the density of the O radical is 4 times higher with air, making it the dominant radical. The O radical has a large reaction rate coefficient with OH and H, which in large part explains the faster decay of the density of H during the late afterglow with
air (figure 7). The additional O atoms produced by electron impact dissociation of O2 in air has an influence on OH pro-duction, particularly in the afterglow. The reaction of O with OH leads to the increased production of H and HO2 [32, 53]:
O + OH → O2 + H (R4)
H + O2 → HO2. (R5)
Higher densities of H and HO2 lead to an increased OH pro-duction in the late afterglow through [31, 52]:
O + HO2 → O2 + OH (R6)
H + HO2 → 2OH. (R7)
While the increases in H in the presence of air for the exper-imental conditions are not significant, a significant increase in HO2 does result from the additional production of O atoms. In spite of the contributions of HO2 facilitated sources of OH, the increased OH production is dominated by the recombination of H and O radicals,
H + O + Ar → OH + Ar. (R8)
The electron density is higher without the air impurity due to there being less power dissipation into non-ionizing, vibra-tional and electronic excitation and dissociation of O2 and N2.
Ion and metastable species are shown in figure 10 with and without air. The dominant negative ion O− is orders of magni-tude lower than the electron density. Neutralization reactions between positive ions and negative charge carriers will be dominated by electron–ion reactions. The Ar metastable den-sity is initially higher than the electron density but decreases significantly during the discharge pulse due to multistep ioniz-ation processes. Penning ionization, which plays an important role in sustaining of diffuse Ar–H2O RF glow discharges [43], does not significantly contribute to the total ionization for the high electron density plasma conditions considered here.
Ar+ is the dominant ion during the discharge pulse. Through associative charge exchange reactions with H2O (or for that matter, most H containing species), ArH+ is the dominant
Figure 7. Comparison of the H and OH densities as a function of time obtained by the experiment and model. (a) The model results are obtained for Ar + 0.1% H2O + 1% air (dashed line) and Ar + 0.1% H2O (full line) for a single discharge pulse. (b) The model results are compared for Ar + 0.1% H2O + 1% air for the first (full line) and second cycle (dashed line).
Figure 8. Normalized experimental radial density profile of OH and H at 5 µs with an indication of the laser beam when perfectly aligned with the filament (1) and misaligned with the filament (2).
J. Phys. D: Appl. Phys. 52 (2019) 044003

Y Luo et al
9
ion the afterglow, while the dissociative recombination with Ar+2 dominates the electron losses. This is due to the five orders of magnitude smaller reaction rate coefficient for elec-tron dissociative recombination of ArH+ compared to the one of Ar+2 .
4.2. Energy deposition
To assess the effect of energy deposition on reactive species production, we varied the deposited energy from 0.25 µJ to 180 µJ (corresponding to an energy density of 519 to 3.7 × 10⁵ Jm−3) in the model while keeping the filament size, power waveform and water vapor concentration the same. The resulting maximum radical and electron densities as a function of energy deposition are shown in figure 11(a). The experimental case of 140 µJ is on the high end of this range. The maximum gas temperature for 180 µJ is 695 K. With increasing energy deposition, H2O becomes highly dissoci-ated during the discharge pulse. The H and O densities exceed the water density with an energy deposition greater than 10 µJ.
Above this energy, the OH density decreases with increasing energy deposition, eventually becoming two orders of magni-tude smaller than the O and H densities.
The large degree of dissociation of water has major effects on the density of long-lived species as shown in figure 11(b). At low energy deposition the major long-lived species are H2 and H2O2. At high energy deposition, H2 remains a dominant species, but O2 replaces H2O2 as a dominant long-lived species. The average OH density is relatively insensitive to the energy deposition at high deposition. The OH density is determined by a balance between production and destruction reactions that are dominated by O and H radicals. With the depletion of H2O at high energy deposition, there is an upper limit to the den-sities of O and H. Once this limit has been reached, the OH densities then also reach a corresponding limit.
4.3. Production and destruction pathways of H and OH
The contributions of reaction pathways for H and OH were investigated in the model by removing individual processes
Figure 9. Neutral species densities as a function of time for (a) Ar + 0.1% H2O + 1% air and (b) Ar + 0.1% H2O. The red dashed line indicates the end of the voltage pulse.
Figure 10. Ion and metastable species densities as a function of time for (a) Ar + 0.1% H2O + 1% air and (b) Ar + 0.1% H2O. The red dashed line indicates the end of the voltage pulse.
J. Phys. D: Appl. Phys. 52 (2019) 044003

Y Luo et al
10
from the reaction mechanism and integrating their net pro-duction rates over time. Due to the relatively low concentra-tion of H2O (0.1%), a small fraction of power is dissipated in electron-induced dissociation of H2O. Dissociative excitation transfer between Ar and H2O plays a more dominant role in OH and H production during the discharge pulse [43, 54]. In particular, metastable molecular argon (Ar∗2) is responsible for more than 60% of the H and OH production for the lowest energy deposition shown in figure 11.
Ar∗2 + H2O → 2Ar + H + OH (R9)
The recombination of H and OH predominantly occurs by
OH + H + Ar → H2O + Ar (R10)
OH + OH + Ar → H2O2 + Ar. (R11)
The dominant reaction pathways for higher energy densities become more complex due to the large fractional dissociation of H2O. The reaction pathways contributing more than 5% of the total production and destruction for energy deposition of more than 10 µJ are shown in figure 12. Although not shown, the main reactions are the same both with and without air although their relative importance may be different.
The decrease in the relative importance of dissociative exci-tation transfer reactions of Ar with H2O for OH and H produc-tion with increasing energy deposition is a trend characteristic of high electron density plasmas. In these plasmas, metastable states are depleted by electron impact reactions (e.g. multi-step ionization or super-elastic collisions) more rapidly than by heavy particle reactions with impurities. For these condi-tions, electron–ion recombination reactions may dominate radical formation. Indeed, with a large fraction of discharge
Figure 11. (a) Maximum radical and electron densities as a function of energy per pulse. In addition, the minimum water density is also shown as a measure of the H2O dissociation degree during the discharge. (b) Average densities of major species as a function of energy per pulse.
Figure 12. H/OH reaction pathways for the Ar + 0.1% H2O discharge for energies between 10 and 180 µJ.
J. Phys. D: Appl. Phys. 52 (2019) 044003

Y Luo et al
11
power dissipated in the production of Ar+, charge exchange with H2O produces H2O+, OH and ArH+. H2O+ undergoes charge exchange with H2O producing H3O+ and OH. The dis-sociative recombination of electrons with H2O+ and H3O+ are then efficient sources of H and OH, and dominantly contribute to OH and H production. While ArH+ is a dominant ion in the afterglow, its recombination does not significantly contribute to H production.
Several of these reactions produce equal amounts of OH and H and so cannot explain the large difference in OH and H densities. The key reaction responsible for the smaller OH density is direct electron impact dissociation of OH:
e− + OH → e− + H + O. (R12)
This reaction is responsible for the production of O when no air is present and also contributes to the production of H during the discharge pulse. The destruction rate of OH by reaction (R12) becomes equal to the production rate by dissociative excitation transfer reactions of Ar with H2O at approximately 10 µJ. With the depletion of H2O at higher energies, the pro-duction of OH does not compensate for the increased loss of OH by reaction (R12).
There is a tight coupling between production of OH by recombination of O and H (reaction (R8)) and the consump-tion of OH by reactions with O atoms in the afterglow.
OH + O → H + O2. (R13)
The dominant loss mechanisms of H are reactions with H and O forming H2 and OH, respectively.
5. Effect of water concentration
The maximum radical and electron densities as a function of water vapor concentration for a fixed energy of 35 µJ per pulse (corresponding to an energy density of 7.3 × 10⁴ Jm−3) are shown in figure 13. The electron density decreases with increasing water vapor concentration due to the increased energy losses by vibrational excitation, attachment and disso-ciation of water. The H, O and OH densities initially increase
with increasing water vapor concentration. The H and O den-sities reach a maximum at 2% H2O and decrease for higher water concentrations. The OH density overtakes O at higher H2O densities and converges to the same density as H for the highest water concentration. With increasing water concentra-tion and decreasing electron density the relative importance of electron impact dissociation of OH (reaction (R12)) decreases. With reaction (R12), being the major source for O during the discharge while rates of dissociation of H2O increase, the OH density can then exceed that of O at higher H2O concentra-tions where the electron density is lower.
The gas temperature increases with increasing water vapor concentration reaching a maximum of 930 K at 5% water. The maximum gas temperature then decreases with further increases in water concentration. This behavior is due to a change in the dominant gas heating mech anisms and addi-tional electron energy loss pathways with increasing H2O concentration. At lower water concentrations, the majority of the discharge energy is used for excitation and ionization of Ar. Charge exchange and excitation transfer reactions of these species in collisions with water are fast and lead to significant gas heating. However at higher water concentra-tions additional electron energy loss by vibrational excitation and dissociation of H2O occurs, which together with attach-ment significantly reduces the electron density. While the quenching of vibrationally excited water molecules through VT (vibrational-translational) collisions and the association of atoms to form molecules contribute to gas heating, these reactions typically occur on longer time scales and hence reduce the maximum gas temperature at constant energy input.
6. Comparison of low energy Ar − 1% H2O with pure water discharge
Discharges in pure water vapor often occur in direct liquid dis-charges or discharges generated in bubbles [1]. The kinetics of pure water discharges have not been extensively investigated by
Figure 13. (a) Maximum radical and electron densities as a function of water vapor concentration for 35 µJ energy deposition per pulse. The maximum gas temperature is also included. (b) Corresponding average densities of major long-lived species as a function of water vapor concentration.
J. Phys. D: Appl. Phys. 52 (2019) 044003

Y Luo et al
12
either experiments or modeling with few exceptions [29, 30]. As absolute LIF measurements of OH and H in pure water dis-charges are challenging due to the high collisional quenching rate of water with the excited states of OH and H [44, 55], we only computationally investigated these discharges. The H2O number density in these simulations were initialized at 2 × 1025 m−3, and the initial temperature was kept at 370 K to maintain consistency with the Ar–H2O cases. The filament size and the power wave-form were the same as that of the Ar–H2O cases. To keep the gas temperature below 1000 K, we only consider energies below 80 µJ (1.7 × 10⁵ Jm−3) or 0.052 eV/molecule for pure water.
The time resolved electron, total positive ion, O, OH and H densities for energy deposition corresponding to 5 µJ/pulse in Ar + 1% H2O2 and pure H2O are shown in figure 14. The max-imum electron densities are 6 × 10²⁰ m−3 and 2 × 10¹⁹ m−3, respectively. These values are within the range of measured electron densities in filamentary discharges in DBDs [56, 57]. In the case of pure water, the discharge is highly electronegative with the maximum electron density being one order of mag-nitude lower than the total positive (and negative) ion density.
The dominant negative ion during the voltage pulse is OH−. The reaction responsible for 90% of the electron pro-duction is then
H + OH− → H2O + e−. (R14)
This detachment reaction is responsible for the increase of the electron density after the two peaks in power. The initial increase in the electron density is due to direct electron impact ionization of H2O. The OH density is comparable to the H density during the discharge but decreases quickly afterward, with H (and also O in the case of pure H2O) becoming the most abundant radicals in the afterglow.
The reactivity of plasmas with high radical densities can be significantly reduced by radicals recombining into non-reactive stable species such as O2, H2 and H2O. Reactions of OH can also produce H2O2, a long-lived oxidizer. The time evolution of these long-lived species is shown in figure 15 for Ar + 1% H2O and pure H2O at a discharge energy of 5 µJ/pulse. In both cases, H2 and H2O2 are dominant while for the Ar + 1% H2O discharge, O2 has a significantly higher density
Figure 14. Electron, total positive ion (M+) and radical species densities as a function of time for the discharge with an energy of 5 µJ/pulse in Ar + 1% H2O (a) and pure H2O (b) respectively. The red dashed line indicates the end of the voltage pulse.
Figure 15. Dominant long-lived species densities as a function of time for the discharge with an energy of 5 µJ/pulse in Ar + 1% H2O (a) and pure H2O (b), respectively. The red dashed line indicates the end of the voltage pulse.
J. Phys. D: Appl. Phys. 52 (2019) 044003

Y Luo et al
13
than for pure water in spite of the very similar atomic species densities for both cases. This difference results from the five times larger 3-body association rate constant for H with O2 with H2O as the third body compared to Ar as the third body.
Reactions that contribute more than 5% of the total produc-tion or consumption of H and OH for the range of 1–80 µJ/pulse in pure water are shown in figure 16. The dominant OH production is due to electron impact dissociation of water and hydration of H2O+
H2O + H2O+ → H3O+ + OH. (R15)
The destruction of OH proceeds through 3-body radical-radical recombination reactions as in (R10) and (R11) though with the 3rd body being H2O instead of Ar. Electron impact dis-sociation of water produces H and OH at the same rate for low specific energies. However as the discharge at low energies is electronegative, positive ion-negative ion neutralization sig-nificantly contributes to H formation, for example,
H3O+ + OH− → 2H + O + H2O. (R16)These conditions may be unique to nanosecond pulsed dis-charges that have sufficiently high Te to make electron-induced reactions dominant during the discharge pulse and sufficiently low energy deposition to produce moderate gas temperatures. Microsecond pulsed or continuous discharges having high specific energy will produce conditions where thermal, heavy particle reactions might dominate radical production [30].
The consumption of H proceeds dominantly through reac-tions with OH (reaction (R12)) and H
H + H + M → H2 + M, (R17)
with M being water. The production of H2O2 is due to the association of OH radicals (reaction (R11)) for both cases. OH, H and O are the main three species responsible for the destruction of H2O2.
7. H2O2 production selectivity and energy efficiency
H2O2 densities in Ar–H2O mixtures for a range of energies between 1 and 80 µJ/pulse and a water concentration between 0.1%–100% are shown in figure 17. Energy deposition has
been limited to values for which temperatures do not exceed 1000 K. The H2O2 density increases with increasing energy until it reaches a maximum after which it starts to decrease due to increase in H and O density for concentrations up to 25% H2O. This maximum in H2O2 density occurs at increasing energy for increasing water concentrations and is outside the experimentally investigated range for the highest water con-centrations. The second increase in H2O2 density observed for the higher energies at a water concentration of 0.1% and 1% is due to an increase in the OH density, the precursor species of H2O2, in the afterglow as can be seen in figure 11(b). This increase in OH density is mainly due to the three body recom-bination of H and O atoms (R8) in the afterglow.
Two important factors in the production of reactive species from an application point of view are selectivity and energy efficiency. The H2O2 selectivity (η) is defined as
ηH2O2 =nH2O2
nH2O2 + nH2 + nO2
. (3)
An important consequence of high radical densities is that radical–radical reactions can begin to dominate the kinetics.
Figure 16. H/OH radical production and destruction pathways.
Figure 17. H2O2 densities as a function of energy per pulse in Ar–H2O for a range of water concentrations between 0.1% and 100%.
J. Phys. D: Appl. Phys. 52 (2019) 044003
Y Luo et al
14
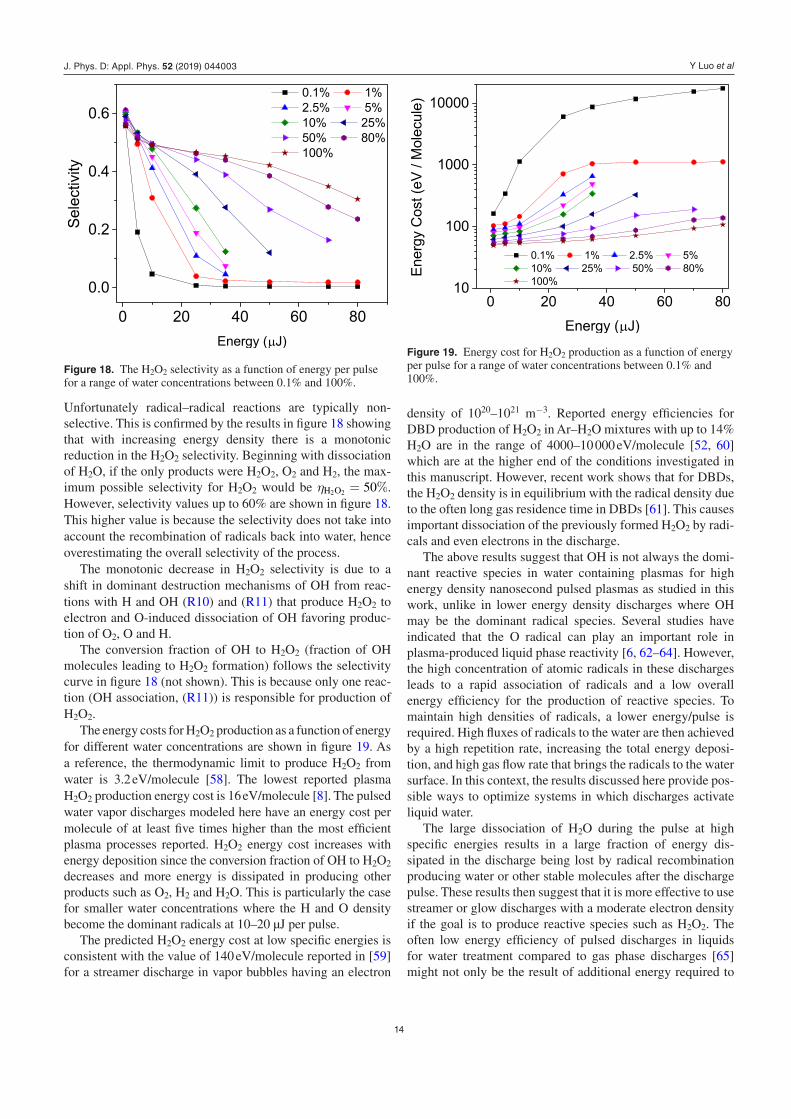
Unfortunately radical–radical reactions are typically non-selective. This is confirmed by the results in figure 18 showing that with increasing energy density there is a monotonic reduction in the H2O2 selectivity. Beginning with dissociation of H2O, if the only products were H2O2, O2 and H2, the max-imum possible selectivity for H2O2 would be ηH2O2 = 50%. However, selectivity values up to 60% are shown in figure 18. This higher value is because the selectivity does not take into account the recombination of radicals back into water, hence overestimating the overall selectivity of the process.
The monotonic decrease in H2O2 selectivity is due to a shift in dominant destruction mechanisms of OH from reac-tions with H and OH (R10) and (R11) that produce H2O2 to electron and O-induced dissociation of OH favoring produc-tion of O2, O and H.
The conversion fraction of OH to H2O2 (fraction of OH molecules leading to H2O2 formation) follows the selectivity curve in figure 18 (not shown). This is because only one reac-tion (OH association, (R11)) is responsible for production of H2O2.
The energy costs for H2O2 production as a function of energy for different water concentrations are shown in figure 19. As a reference, the thermodynamic limit to produce H2O2 from water is 3.2 eV/molecule [58]. The lowest reported plasma H2O2 production energy cost is 16 eV/molecule [8]. The pulsed water vapor discharges modeled here have an energy cost per molecule of at least five times higher than the most efficient plasma processes reported. H2O2 energy cost increases with energy deposition since the conversion fraction of OH to H2O2 decreases and more energy is dissipated in producing other products such as O2, H2 and H2O. This is par ticularly the case for smaller water concentrations where the H and O density become the dominant radicals at 10–20 µJ per pulse.
The predicted H2O2 energy cost at low specific energies is consistent with the value of 140 eV/molecule reported in [59] for a streamer discharge in vapor bubbles having an electron
density of 1020–1021 m−3. Reported energy efficiencies for DBD production of H2O2 in Ar–H2O mixtures with up to 14% H2O are in the range of 4000–10 000 eV/molecule [52, 60] which are at the higher end of the conditions investigated in this manuscript. However, recent work shows that for DBDs, the H2O2 density is in equilibrium with the radical density due to the often long gas residence time in DBDs [61]. This causes important dissociation of the previously formed H2O2 by radi-cals and even electrons in the discharge.
The above results suggest that OH is not always the domi-nant reactive species in water containing plasmas for high energy density nanosecond pulsed plasmas as studied in this work, unlike in lower energy density discharges where OH may be the dominant radical species. Several studies have indicated that the O radical can play an important role in plasma-produced liquid phase reactivity [6, 62–64]. However, the high concentration of atomic radicals in these discharges leads to a rapid association of radicals and a low overall energy efficiency for the production of reactive species. To maintain high densities of radicals, a lower energy/pulse is required. High fluxes of radicals to the water are then achieved by a high repetition rate, increasing the total energy deposi-tion, and high gas flow rate that brings the radicals to the water surface. In this context, the results discussed here provide pos-sible ways to optimize systems in which discharges activate liquid water.
The large dissociation of H2O during the pulse at high specific energies results in a large fraction of energy dis-sipated in the discharge being lost by radical recombination producing water or other stable molecules after the discharge pulse. These results then suggest that it is more effective to use streamer or glow discharges with a moderate electron density if the goal is to produce reactive species such as H2O2. The often low energy efficiency of pulsed discharges in liquids for water treatment compared to gas phase discharges [65] might not only be the result of additional energy required to
Figure 18. The H2O2 selectivity as a function of energy per pulse for a range of water concentrations between 0.1% and 100%.
Figure 19. Energy cost for H2O2 production as a function of energy per pulse for a range of water concentrations between 0.1% and 100%.
J. Phys. D: Appl. Phys. 52 (2019) 044003
Y Luo et al
15
evaporate the liquid but also the high power density producing large electron and radical densities that rapidly recombine and form non-reactive stable molecules.
8. Conclusions
In this paper, results from a 0D kinetics study of a nanosecond pulsed plasma filament in argon-water were discussed and compared to absolute density measurements of H and OH radicals. Previously reported reaction mechanisms intended to address lower power density conditions were initially used to model the filament discharges studied here. Adding reactions including electron impact of vibrationally excited water and Penning ionization enable these reaction mechanisms to be more compatible with high electron density water containing plasmas.
H and OH production and destruction pathways were investigated in high density Ar–H2O nanosecond pulsed dis-charges. H and OH are mainly produced by charge exchange and electron–ion recombination reactions. The dominant con-sumption reactions of H are three body recombination with O and H. The OH radical is largely consumed by electron impact dissociation during the discharge pulse (which is an additional source of H and O radicals) and atomic oxygen recombination in the afterglow. Air concentrations in the argon discharge up to a factor ten larger than water have a limited impact on OH and H densities and their dominant production and destruction pathways. Nonetheless, the presence of air (1%), significantly increases the atomic oxygen density and reactions of OH and H with O become more dominant.
The computational investigations were extended to pure water for moderate energy deposition. The reaction path-ways remain similar to those for low concentrations of water except that direct electron dissociation of water becomes a more dominant production pathway for OH and H. A high energy density increases the atomic H and O densities leading to rapid radical recombination mainly producing H2, O2 and H2O. A higher selectivity and energy efficiency for H2O2 production occurs at lower discharge energies for the highest concentrations of water. Total radical production (e.g. OH, O, H) will increase with increasing power (or energy) deposition regardless of conditions until H2O is depleted. The long-term disposition of that reactivity is then determined by subsequent reactions between the radicals. At one extreme, the survival efficiency of small densities of radicals can be high as there are fewer avenues for radical–radical reactions that can deplete the radicals. At another extreme, if the H2O is fully dissociated, particularly at lower H2O concentrations, the production of radicals essentially terminates and the only processes left are radical–radical reactions that deplete that reactivity.
Acknowledgment
This work is funded by the National Science Foundation (PHY 1500135) and US Department of Energy, Office of Fusion Energy Sciences (DESC0001939).
ORCID iDs
Amanda M Lietz https://orcid.org/0000-0001-6423-5042Mark J Kushner https://orcid.org/0000-0001-7437-8573Peter J Bruggeman orcid.org/0000-0003-3346-7275
References
[1] Bruggeman P J et al 2016 Plasma–liquid interactions: a review and roadmap Plasma Sources Sci. Technol. 25 053002
[2] Magureanu M, Piroi D, Mandache N B, David V, Medvedovici A and Parvulescu V I 2010 Degradation of pharmaceutical compound pentoxifylline in water by non-thermal plasma treatment Water Res. 44 3445–53
[3] Hoeben W F L M, van Veldhuizen E M, Rutgers W R, Cramers C A M G and Kroesen G M W 2000 The degradation of aqueous phenol solutions by pulsed positive corona discharges Plasma Sources Sci. Technol. 9 361–9
[4] Chang J S 2001 Recent development of plasma pollution control technology: a critical review Sci. Technol. Adv. Mater. 2 571–6
[5] Bruggeman P J and Leys C 2009 Non-thermal plasmas in and in contact with liquids J. Phys. D: Appl. Phys. 42 053001
[6] Wende K et al 2015 Identification of the biological active liquid chemistry induced by a nonthermal atmospheric pressure plasma jet Biointerphases 10 029518
[7] Reuter S, Winter J, Schmidt-Bleker A, Tresp H, Hammer M H and Weltmann K-D 2012 Controlling the ambient air affected reactive species composition in the effluent of an argon plasma jet IEEE Trans. Plasma Sci. 40 11
[8] Locke B R and Shih K Y 2011 Review of the methods to form hydrogen peroxide in electrical discharge plasma with liquid water Plasma Sources Sci. Technol. 20 034006
[9] Malik M A 2010 Water purification by plasmas: which reactors are most energy efficient? Plasma Chem. Plasma Process 30 21–31
[10] Lukes P, Dolezalova E, Sisrova I and Clupek M 2014 Aqueous-phase chemistry and bactericidal effects from an air discharge plasma in contact with water: evidence for the formation of peroxynitrite through a pseudo-second-order post-discharge reaction of H2O2 and HNO2, Plasma Sources Sci. Technol. 23 015019
[11] Kolb J F, Joshi R P, Xiao S and Schoenbach K H 2008 Streamers in water and other dielectric liquids J. Phys. D: Appl. Phys. 41 234007
[12] Dorai R and Kushner M J 2003 A model for plasma modification of polypropylene using atmospheric pressure discharges J. Phys. D: Appl. Phys. 36 666
[13] Van Veldhuizen E M 2000 Electrical Discharges for Environmental Purposes: Fundamentals and Applications (Huntington, NY: Nova Science)
[14] Soloshenko I A, Tsiolko V V, Pogulay S S, Kalyuzhnaya A G, Bazhenov V Y and Shchedrin A I 2009 Effect of water adding on kinetics of barrier discharge in air Plasma Sources Sci. Technol. 18 045019
[15] Sakiyama Y, Graves D B, Chang H W, Shimizu T and Morfill G E 2012 Plasma chemistry model of surface microdischarge in humid air and dynamics of reactive neutral species J. Phys. D: Appl.Phys. 45 425201
[16] Van Gaens W and Bogaerts A 2013 Kinetic modelling for an atmospheric pressure argon plasma jet in humid air J. Phys. D: Appl. Phys. 46 275201
[17] Van Gaens W and Bogaerts A 2014 Reaction pathways of biomedically active species in an Ar plasma jet Plasma Source Sci. Technol. 23 035015
J. Phys. D: Appl. Phys. 52 (2019) 044003

Y Luo et al
16
[18] Murakami T, Niemi T, Gans T, O’Connell D and Graham W G 2013 Interacting kinetics of neutral and ionic species in an atmospheric-pressure helium–oxygen plasma with humid air impurities Plasma Sources Sci. Technol. 22 045010
[19] Liu D X, Rong M Z, Wang X H, Iza F, Kong M G and Bruggeman P J 2010 Main species and physicochemical processes in cold atmospheric-pressure He + O2 plasmas Plasma Process. Polym. 7 846–65
[20] Murakami T, Niemi K, Gans T, O’Connell D and Graham W G 2013 Chemical kinetics and reactive species in atmospheric pressure helium-oxygen plasmas with humid-air impurities Plasma Sources Sci. Technol. 22 015003
[21] Van Gaens W, Iseni S, Schmidt-Bleker A, Weltmann K D, Reuter S and Bogaerts A 2015 Numerical analysis of the effect of nitrogen and oxygen admixtures on the chemistry of an argon plasma jet operating at atmospheric pressure New J. Phys. 17 033003
[22] Liu D X, Bruggeman P J, Iza F, Rong M Z and Kong M G 2010 Global model of low-temperature atmospheric-pressure He + H2O plasmas Plasma Sources Sci. Technol. 19 025018
[23] Tian W, Tachibana K and Kushner M J 2014 Plasmas sustained in bubbles in water: optical emission and excitation mechanisms J. Phys. D: Appl. Phys. 47 055202
[24] Bobkova E S, Smirnov S A, Zalipaeva Y V and Rybkin V V 2014 Modeling chemical composition for an atmospheric pressure DC discharge in air with water cathode by 0-D model Plasma Chem. Plasma Process. 34 721–43
[25] Tian W and Kushner M J 2014 Atmospheric pressure dielectric barrier discharges interacting with liquid covered tissue J. Phys. D: Appl. Phys. 47 165201
[26] Stalder K R, Vidmar R J, Nersisyan G and Graham W G 2006 Modeling the chemical kinetics of high-pressure glow discharges in mixtures of helium with real air J. Appl. Phys. 99 09330
[27] Van Gaens W, Bruggeman P J and Bogaerts A 2014 Numerical analysis of the NO and O generation mechanism in a needle-type plasma jet New J. Phys. 16 063054
[28] Vasko C A, Liu D X, van Veldhuizen E M, Iza F and Bruggeman P J 2014 Hydrogen peroxide production in an atmospheric pressure RF glow discharge: comparison of models and experiments Plasma Chem and plasma Process 34 1081–99
[29] Sainct F P, Lacoste D A, Kirkpatrick M J, Odic E and Laux C O 2014 Temporal evolution of temperature and OH density produced by nanosecond repetitively pulsed discharges in water vapor at atmospheric pressure J.Phys. D: Appl. Phys. 47 075204
[30] Mededovic S and Locke B R 2007 Primary chemical reactions in pulsed electrical discharge channels in water J. Phys. D: Appl. Phys. 40 7734
[31] Itikawa Y and Mason N 2005 Cross sections for electron collisions with water molecules J. Phys. Chem. Ref. Data 34 1–22
[32] Verreycken T, Sadeghi N and Bruggeman P J 2014 Time-resolved absolute OH density of a nanosecond pulsed discharge in atmospheric pressure He–H2O: absolute calibration, collisional quenching and the importance of charged species in OH production Plasma Sources Sci. Technol. 23 045005
[33] Lietz A M and Kushner M J 2016 Air plasma treatment of liquid covered tissue: long timescale chemistry J. Phys. D: Appl. Phys. 49 425204
[34] Yatom S, Luo Y, Xiong Q and Bruggeman P J 2017 Nanosecond pulsed humid Ar plasma jet in air: shielding,
discharge characteristics and atomic hydrogen production J. Phys. D: Appl. Phys. 50 415204
[35] Xu D A, Shneider M N, Lacoste D A and Laux C O 2014 Thermal and hydrodynamic effects of nanosecond discharges in atmospheric pressure air J. Phys. D: Appl. Phys. 47 235202
[36] Niemi K, Schulz-von der Gathen V and Dobele H F 2001 Absolute calibration of atomic density measurements by laser-induced fluorescence spectroscopy with two-photon excitation J. Phys. D: Appl. Phys. 34 2330
[37] Verreycken T, Mensink R, van der Horst R, Sadeghi N and Bruggeman P J 2013 Absolute OH density measurements in the effluent of a cold atmospheric-pressure Ar–H2O RF plasma jet in air Plasma Sources Sci. Technol. 22 055014
[38] Verreycken T, van der Horst R M, Sadeghi N and Bruggeman P J 2013 Absolute calibration of OH density in a nanosecond pulsed plasma filament in atmospheric pressure He–H2O: comparison of independent calibration methods J. Phys. D: Appl. Phys. 46 464004
[39] Dilecce G and De Benedictis S 2011 Laser diagnostics of high-pressure discharges: laser induced fluorescence detection of OH in He/Ar–H2O dielectric barrier discharges Plasma Phys. Control. Fusion 53 124006
[40] Williams L R and Crosley D R 1996 Collisional vibrational energy transfer of OH () J. Chem. Phys. 104 6507–14
[41] Verreycken T, van der Horst R M, Baede A H M F, Van Veldhuizen E M and Bruggeman P J 2012 Time and spatially resolved LIF of OH in a plasma filament in atmospheric pressure He–H2O J. Phys. D: Appl. Phys. 45 045205
[42] Bruggeman P J, Sadeghi N, Schram D C and Linss V 2014 Gas temperature determination from rotational lines in non-equilibrium plasmas: a review Plasma Sources Sci. Technol. 23 023001
[43] Tavant A and Lieberman M A 2016 Hybrid global model of water cluster ions in atmospheric pressure Ar/H2O RF capacitive discharges J. Phys. D: Appl. Phys. 49 465201
[44] Martini L M, Gatti N, Dilecce G, Scotoni M and Tosi P 2017 Rate constants of quenching and vibrational relaxation in the OH (), manifold with various colliders J. Phys. D: Appl. Phys. 50 114003
[45] Zhang S, Sobota A, van Veldhuizen E M and Bruggeman P J 2015 Gas flow characteristics of a time modulated APPJ: the effect of gas heating on flow dynamics J. Phys. D: Appl. Phys. 48 015203
[46] Lietz A M, Johnsen E and Kushner M J 2017 Plasma-induced flow instabilities in atmospheric pressure plasma jets Appl. Phys. Lett. 111 114101
[47] Raizer Y P 1991 Gas Discharge Physics (Berlin: Springer)[48] Lieberman M A and Lichtenberg A J 2005 Principles of
Plasma Discharges and Materials Processing 2nd edn (New York: Wiley)
[49] Fridman A 2008 Plasma Chemistry (NewYork: Cambridge University Press)
[50] Popov N A 2016 Pulsed nanosecond discharge in air at high specific deposited energy: fast gas heating and active particle production Plasma Sources Sci. Technol. 25 044003
[51] Tochikubo K, Uchida S and Watanabe T 2004 Study on decay characteristics of OH radical density in pulsed discharge in Ar/H2O Japan. J. Appl. Phys. 43 315
[52] Kirkpatrick M, Dodet B and Odic E 2007 Atmospheric pressure humid argon DBD plasma for the application of sterilization—measurement and simulation of hydrogen, oxygen, and hydrogen peroxide formation Int. J. Plasma Environ. Sci. Technol. 1 96–101
J. Phys. D: Appl. Phys. 52 (2019) 044003
Y Luo et al
17
[53] Komuro A, Ono R and Oda T 2013 Behaviour of OH radicals in an atmospheric-pressure streamer discharge studied by two-dimensional numerical simulation J. Phys. D: Appl. Phys. 46 175206
[54] Artamonova E et al 2008 Low pressure water vapour discharge as a light source: I. Spectroscopic characteristics and efficiency J. Phys. D: Appl. Phys. 41 15520
[55] Bittner J, Kohse-Hoinghaus K, Meer U and Just Th 1988 Quenching of two-photon-excited H (3s, 3d) and O (3p 3P2,1,0) atoms by rare gases and small molecules Chem. Phys. Lett. 143 571–6
[56] Balcon N, Aanesland A and Boswell R 2007 Pulsed RF discharges, glow and filamentary mode at atmospheric pressure in argon Plasma Sources Sci. Technol. 16 217–25
[57] Dong L, Qi Y, Zhao Z and Li Y 2008 Electron density of an individual microdischarge channel in patterns in a dielectric barrier discharge at atmospheric pressure Plasma Sources Sci. Technol. 17 015015
[58] Bruggeman P and Locke B R 2013 Assessment of potential applications of plasma with water Low Temperature Plasma Technology: Methods and Applications eds P Chu and X P Lu (Boca Raton, FL: CRC Press)
[59] Bruggeman J, Schram D, Gonzalez M A, Rego R, Kong M G and Leys C 2009 Characterization of a direct dc-excited
discharge in water by optical emission spectroscopy Plasma Sources Sci. Technol. 18 025017
[60] Vasko C 2015 PhD Thesis Eindhoven University of Technology, The Netherlands
[61] Du Y, Nayak G, Oinuma G, Peng Z and Bruggeman P J 2017 Effect of water vapor on plasma morphology, OH and H2O2 production in He and Ar atmospheric pressure dielectric barrier discharge J. Phys. D: Appl. Phys. 50 145201
[62] Benedikt J, Mokhtar Hefny M, Shaw A, Buckley B R, Iza F, Schakermann S and Bandow J F 2018 The fate of plasma generated oxygen atoms in aqueous solutions: non-equilibrium atmospheric pressure plasmas as an efficient source of atomic O(aq) Phys. Chem. Chem. Phys. 20 12037
[63] Elg D T, Yang I W and Graves D B 2017 Production of TEMPO by O atoms in atmospheric pressure non-thermal plasma–liquid interactions J. Phys. D: Appl. Phys. 50 475201
[64] Hefny M M, Pattyn C, Lukes P and Benedikt J 2016 Atmospheric plasma generates oxygen atoms as oxidizing species in aqueous solutions J. Phys. D: Appl. Phys. 49 404002
[65] Dang T H, Denat A, Lesaint O and Teissedre G 2009 Pulsed electrical discharges in water for removal of organic pollutants: a comparative study Eur. Phys. J. Appl. Phys. 47 22818
J. Phys. D: Appl. Phys. 52 (2019) 044003


![Experimental Study of Nanosecond Repetitively Pulsed ... · microwave discharge and radio frequency discharge [7, 8]. On the other hand, water dissociation using non-thermal plasma](https://static.fdocuments.in/doc/165x107/60cbc39cbf11295abe6adfd0/experimental-study-of-nanosecond-repetitively-pulsed-microwave-discharge-and.jpg)