Plant biomass and production and CO2 exchange in an ...
12
Journal of Ecology 2002 90 , 25 –36 © 2002 British Ecological Society Blackwell Science Ltd Plant biomass and production and CO 2 exchange in an ombrotrophic bog TIM R. MOORE†, JILL L. BUBIER‡, STEVE E. FROLKING§, PETER M. LAFLEUR¶ and NIGEL T. ROULET† † Department of Geography and Centre for Climate & Global Change Research, McGill University, 805 Sherbrooke St. W., Montreal, QC, H3A 2K6, Canada; ‡ Environmental Studies Program, Mount Holyoke College, South Hadley, MA 01075-6418, USA; § Institute for the Study of Earth, Oceans, and Space, University of New Hampshire, Durham, NH 03824, USA; and ¶ Department of Geography, Trent University, Peterborough, ON, K9J 7B8, Canada Summary 1 Above-ground biomass was measured at bog hummock, bog hollow and poor-fen sites in Mer Bleue, a large, raised ombrotrophic bog near Ottawa, Ont., Canada. The average above-ground biomass was 587 g m –2 in the bog, composed mainly of shrubs and Sphagnum capitula. In the poor fen, the average biomass was 317 g m –2 , comprising mainly sedges and herbs and Sphagnum capitula. Vascular plant above-ground biomass was greater where the water table was lower, with a similar but weaker relationship for Sphagnum capitula and vascular leaf biomass. 2 Below-ground biomass averaged 2400 g m –2 at the bog hummock site, of which 300 g m –2 was fine roots (< 2 mm diameter), compared with 1400 g m –2 in hollows (fine roots 450 g m –2 ) and 1200 g m –2 at the poor-fen site. 3 Net Ecosystem Exchange (NEE) of CO 2 was measured in chambers and used to derive ecosystem respiration and photosynthesis. Under high light flux (PAR of 1500 μ mol m –2 s –1 ), NEE ranged across sites from 0.08 to 0.22 mg m –2 s –1 (a positive value indicates ecosystem uptake) in the spring and summer, but fell to –0.01 to –0.13 mg m –2 s –1 (i.e. a release of CO 2 ) during a late-summer dry period. 4 There was a general agreement between a combination of literature estimates of photosynthetic capacity for shrubs and mosses and measured biomass and summer- time CO 2 uptake determined by the eddy covariance technique within a bog footprint (0.40 and 0.35 – 0.40 mg m –2 s –1 , respectively). 5 Gross photosynthesis was estimated to be about 530 g m –2 year –1 , total respiration 460 g m –2 year –1 , and export of DOC, DIC and CH 4 10 g m –2 year –1 , leaving an annual C sequestration rate of 60 g m –2 year –1 . Root production and decomposition are important parts of the C budget of the bog. Root C production was estimated to be 161–176 g m –2 year –1 , resulting in fractional turnover rates of 0.2 and 1 year –1 for total and fine roots, respectively. Key-words : carbon cycling, hydrology, net ecosystem exchange, net primary produc- tion, roots Journal of Ecology (2002) 90 , 25 –36 Introduction Peatlands cover extensive areas of boreal and temper- ate regions and are characterized by slow rates of CO 2 uptake from, and release to, the atmosphere. Based on several chamber and tower measurements of CO 2 flux, bright-sunshine CO 2 fixation rates in peatlands range from 0.15 to 0.35 mg m –2 s –1 and summer CO 2 respiration rates range from 0.1 to 0.2 mg m –2 s –1 (Frolking et al . 1998). Both values are small compared to forest and grassland ecosystems but persistent C sequestration at 20–30 g m –2 year –1 (Gorham 1991; Clymo et al . 1998), resulted in a store of between 250 and 450 Gt of C accumulating in northern peatlands over the past 10 000 years. This represents about one-third of the C stored in soils globally in regions which are anticipated to undergo significant changes in climate associated with increasing atmospheric concentrations of greenhouse Correspondence: Tim R. Moore (e-mail [email protected]).
Transcript of Plant biomass and production and CO2 exchange in an ...
Journal of Ecology
2002
90
, 25–36
© 2002 British Ecological Society
Blackwell Science Ltd
Plant biomass and production and CO
2
exchange in an ombrotrophic bog
TIM R. MOORE†, JILL L. BUBIER‡, STEVE E. FROLKING§, PETER M. LAFLEUR¶ and NIGEL T. ROULET†
†
Department of Geography and Centre for Climate & Global Change Research, McGill University, 805 Sherbrooke St. W., Montreal, QC, H3A 2K6, Canada;
‡
Environmental Studies Program, Mount Holyoke College, South Hadley, MA 01075-6418, USA;
§
Institute for the Study of Earth, Oceans, and Space, University of New Hampshire, Durham, NH 03824, USA; and
¶
Department of Geography, Trent University, Peterborough, ON, K9J 7B8, Canada
Summary
1
Above-ground biomass was measured at bog hummock, bog hollow and poor-fensites in Mer Bleue, a large, raised ombrotrophic bog near Ottawa, Ont., Canada. Theaverage above-ground biomass was 587 g m
–2
in the bog, composed mainly of shrubsand
Sphagnum
capitula. In the poor fen, the average biomass was 317 g m
–2
, comprisingmainly sedges and herbs and
Sphagnum
capitula. Vascular plant above-ground biomasswas greater where the water table was lower, with a similar but weaker relationship for
Sphagnum
capitula and vascular leaf biomass.
2
Below-ground biomass averaged 2400 g m
–2
at the bog hummock site, of which 300 g m
–2
was fine roots (< 2 mm diameter), compared with 1400 g m
–2
in hollows (fine roots 450 g m
–2
)and 1200 g m
–2
at the poor-fen site.
3
Net Ecosystem Exchange (NEE) of CO
2
was measured in chambers and used toderive ecosystem respiration and photosynthesis. Under high light flux (PAR of1500
µ
mol m
–2
s
–1
), NEE ranged across sites from 0.08 to 0.22 mg m
–2
s
–1
(a positivevalue indicates ecosystem uptake) in the spring and summer, but fell to –0.01 to–0.13 mg m
–2
s
–1
(i.e. a release of CO
2
) during a late-summer dry period.
4
There was a general agreement between a combination of literature estimates ofphotosynthetic capacity for shrubs and mosses and measured biomass and summer-time CO
2
uptake determined by the eddy covariance technique within a bog footprint(0.40 and 0.35–0.40 mg m
–2
s
–1
, respectively).
5
Gross photosynthesis was estimated to be about 530 g m
–2
year
–1
, total respiration460 g m
–2
year
–1
, and export of DOC, DIC and CH
4
10 g m
–2
year
–1
, leaving an annual Csequestration rate of 60 g m
–2
year
–1
. Root production and decomposition are importantparts of the C budget of the bog. Root C production was estimated to be 161–176 g m
–2
year
–1
, resulting in fractional turnover rates of 0.2 and 1 year
–1
for total and fine roots,respectively.
Key-words
: carbon cycling, hydrology, net ecosystem exchange, net primary produc-tion, roots
Journal of Ecology
(2002)
90
, 25–36
Introduction
Peatlands cover extensive areas of boreal and temper-ate regions and are characterized by slow rates of CO
2
uptake from, and release to, the atmosphere. Based onseveral chamber and tower measurements of CO
2
flux,bright-sunshine CO
2
fixation rates in peatlands rangefrom 0.15 to 0.35 mg m
–2
s
–1
and summer CO
2
respiration
rates range from 0.1 to 0.2 mg m
–2
s
–1
(Frolking
et al
.1998). Both values are small compared to forest andgrassland ecosystems but persistent C sequestrationat 20–30 g m
–2
year
–1
(Gorham 1991; Clymo
et al
.1998), resulted in a store of between 250 and 450 Gt ofC accumulating in northern peatlands over the past10 000 years. This represents about one-third of the Cstored in soils globally in regions which are anticipatedto undergo significant changes in climate associated withincreasing atmospheric concentrations of greenhouse
Correspondence: Tim R. Moore (e-mail [email protected]).
JEC_633.fm Page 25 Monday, January 28, 2002 5:53 PM
26
T. R. Moore
et al.
© 2002 British Ecological Society,
Journal of Ecology
,
90
, 25–36
gases (Moore
et al
. 1998). Consequently, there hasbeen considerable interest in determining the rates of Cexchange between peatlands and the atmosphere andthe ecological and climatic controls on this exchange,with the aim of being able to predict the effect of climaticchange.
At the Mer Bleue ombrotrophic bog, eddy covari-ance measurements of CO
2
flux (Lafleur
et al
. 2001)have shown an annual net CO
2
-C exchange with theatmosphere of
c
. 80 g CO
2
-C m
–2
year
–1
. Export of C asdissolved organic carbon (DOC), dissolved inorganiccarbon (DIC) and methane emission were estimatedto total approximately 10 g m
–2
year
–1
(Fraser 1999),yielding an annual uptake of about 70 g m
–2
year
–1
. Thisis about three times the long-term C sequestration rateover the past 6000 years (P. Richard
pers. comm
.). Therates of, and controls on, CO
2
emission through peatdecomposition and export of DOC and DIC at MerBleue have been reported by Scanlon & Moore (2000)and Fraser
et al
. (2001), respectively. Vegetation pat-terns of boreal–temperate peatlands are well knownand the primary controls on these patterns, such aswater table position and peat water chemistry, havebeen established (e.g. Glaser
et al
. 1990). Earlierstudies (e.g. Smith & Forrest 1978; collated in Campbell
et al
. 2000) have described the distribution of biomasswithin peatlands, primarily above-ground, but there havebeen few measurements of below-ground biomass.Little attempt has been made to relate biomass valuesto rates of net primary production (NPP) and photo-synthetic capacity, or to rates of ecosystem CO
2
exchange and C sequestration in order to develop Cexchange models for peatlands.
We describe further results from this peatland in thecool temperate region of eastern Canada. We examineabove- and below-ground plant biomass at bog hum-mock, bog hollow and poor-fen sites, and we estimaterates of plant production. We relate these measure-ments to the observed net ecosystem exchange of CO
2
(NEE) derived from chamber and micrometeorologi-cal measurements and develop an overall C budget ofthe Mer Bleue peatland.
Materials and methods
The Mer Bleue peatland is a raised, low-shrub, ombrotro-phic bog covering 25 km
2
, 10 km east of Ottawa, Ontario,Canada. The central portion of the peatland, whichstarted to form about 8400 years ago (P. Richard,
pers.comm
.), is 5–6 m thick, thinning towards the margins.The peatland pore-water is acid, rich in DOC butpoor in nutrients. On the bog hummocks, the vegeta-tion is a mixture of evergreen shrubs (dominantly
Chamaedaphne calyculata
,
Kalmia angustifolia
, and
Ledum groenlandicum
), occasional deciduous shrubs(such as
Vaccinium myrtilloides
), underlain by
Sphagnum
mosses (dominantly
Sphagnum capillifolium
and
Sphagnum fuscum
).
K. angustifolia
,
Maianthemumtrifolium
(
Smilacina trifolia
),
Eriophorum vaginatum
and
Sphagnum magellanicum
and
Sphagnum angustifo-lium
are dominant species in bog hollows and
Carexoligosperma
,
Sphagnum magellanicum
and
S. papillosum
,with some
K. angustifolia
, in areas of poor fen. Thenomenclature follows Anderson (1990) for
Sphagnum
and Fernald (1950) for vascular species.Above-ground biomass was measured by clipping 19
0.5
×
0.5 m quadrats in mid-August and sorting thematerial by species and into leaves and shoots. An esti-mate of the photosynthetically active portion of the
Sphagnum
biomass was made by clipping at the base ofthe capitulum. As noted by Clymo (1970), there is noclear division of live and dead plant material in
Sphag-num
, so this is an arbitrary but consistent approach.Plant tissues were oven-dried at 80
°
C. Leaf Area Index(LAI) was calculated from the leaf mass and density forindividual species. Water table position, relative to the
Sphagnum
surface, was monitored in a 3-cm diameterwell inserted into each quadrat. Here, we use theSeptember 17, 1999 (Julian day 260) water table meas-urements, which are very close to the 1999 growingseason average (Julian days 100–300) recorded con-tinuously within the bog (Lafleur
et al
. 2001). Fraser(1999) showed that there was a very strong temporalcorrelation among water tables in the peatland.
Below-ground biomass was determined by the exca-vation of 0.25
×
0.25 m pits at eight quadrats (threehummock, two hollow and three fen) in early Septem-ber to a depth of 110 cm in 10 cm increments. The livebelow-ground biomass was sorted from the peat andascribed to coarse and fine fractions (> and < 2 mmdiameter, respectively), and to a shrub or a sedge/herborigin, and weighed after oven-drying at 80
°
C.Above-ground net primary productivity (NPP) was
estimated for the shrubs from published relationshipsbetween above-ground biomass and NPP.
Sphagnum
NPP was measured by the cranked wire method(Clymo 1970) at bog hummock and hollow and fensites during the 1998 and 1999 growing seasons.
Relationships between net ecosystem exchange ofCO
2
(NEE) and photosynthetically active radiation(PAR) were established using clear, climate-controlledchambers, in which all plants, including shrubs, wereenclosed. The chamber walls (0.6
×
0.6
×
0.45 mheight) were constructed of clear lexan, plexiglass andTeflon film with a removable top to allow equilibrationof plant communities to ambient conditions before andafter sampling. A circulation fan and a heat exchangercontrolled temperature and humidity to within 1
°
Cand 10% of ambient conditions, respectively. Alumin-ium collars were inserted into the peat (three each in thebog hummocks and hollows; four in the poor fen) andthe chamber inserted into a groove that was filled withwater before each sampling run to ensure an air-tightseal. Shrouds with different mesh sizes were used toreduce the light entering the chamber to 1/2 and 1/4 fulllight when measuring NEE and an opaque shroudwas used when measuring ecosystem respiration(autotrophic and heterotrophic). Four 2.5 min sampling
JEC_633.fm Page 26 Monday, January 28, 2002 5:53 PM
27
Plant biomass, production and CO
2
exchange in a bog
© 2002 British Ecological Society,
Journal of Ecology
,
90
, 25–36
runs at different light fluxes were conducted at eachcollar location three times on May 28–30, July 7–8 andAugust 31–September 2, 1999. See Bubier
et al
. (1998)for more detail on NEE methods.
NEE is the instantaneous difference between grossphotosynthesis (GP) and respiration (R). The relation-ship between NEE and photosynthetically activeradiation (PAR) was described by a rectangularhyperbola using a curve-fitting technique (Thornley &Johnson 1990):
eqn 1
where
α
is the initial slope of the rectangular hyperbola(also called the apparent quantum yield), GP
max
is theasymptotic gross photosynthesis above light saturation,and R is the
y
(GP) axis intercept, or dark respiration.We adopted a sign convention of CO
2
uptake by whichthe ecosystem is positive and CO
2
emission fromrespiration is negative. Data analyses were performedwith the statistical software
-
(SAS Institute1996).
Results
- -
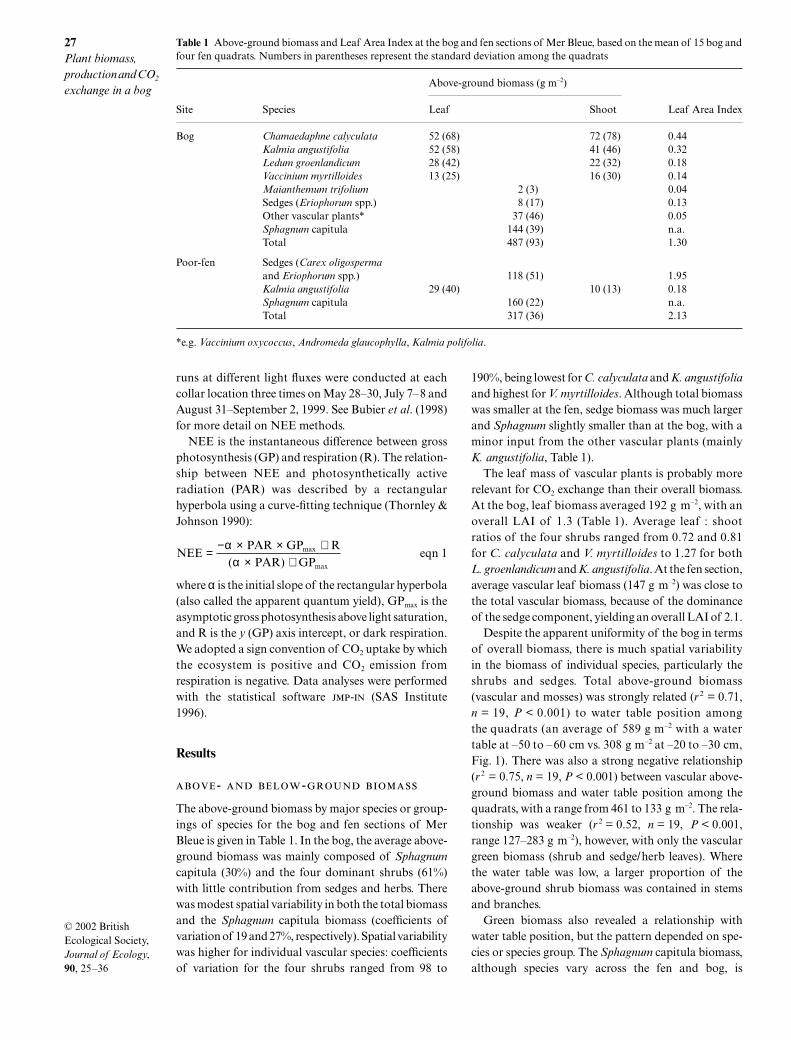
The above-ground biomass by major species or group-ings of species for the bog and fen sections of MerBleue is given in Table 1. In the bog, the average above-ground biomass was mainly composed of
Sphagnum
capitula (30%) and the four dominant shrubs (61%)with little contribution from sedges and herbs. Therewas modest spatial variability in both the total biomassand the
Sphagnum
capitula biomass (coefficients ofvariation of 19 and 27%, respectively). Spatial variabilitywas higher for individual vascular species: coefficientsof variation for the four shrubs ranged from 98 to
190%, being lowest for
C. calyculata
and
K. angustifolia
and highest for
V. myrtilloides
. Although total biomasswas smaller at the fen, sedge biomass was much largerand
Sphagnum
slightly smaller than at the bog, with aminor input from the other vascular plants (mainly
K. angustifolia
, Table 1).The leaf mass of vascular plants is probably more
relevant for CO
2
exchange than their overall biomass.At the bog, leaf biomass averaged 192 g m
–2
, with anoverall LAI of 1.3 (Table 1). Average leaf : shootratios of the four shrubs ranged from 0.72 and 0.81for
C. calyculata
and
V. myrtilloides
to 1.27 for both
L. groenlandicum
and
K. angustifolia
. At the fen section,average vascular leaf biomass (147 g m
–2
) was close tothe total vascular biomass, because of the dominanceof the sedge component, yielding an overall LAI of 2.1.
Despite the apparent uniformity of the bog in termsof overall biomass, there is much spatial variabilityin the biomass of individual species, particularly theshrubs and sedges. Total above-ground biomass(vascular and mosses) was strongly related (
r
2
= 0.71,
n
= 19,
P
< 0.001) to water table position amongthe quadrats (an average of 589 g m
–2
with a watertable at –50 to –60 cm vs. 308 g m
–2
at –20 to –30 cm,Fig. 1). There was also a strong negative relationship(
r
2
= 0.75,
n
= 19,
P
< 0.001) between vascular above-ground biomass and water table position among thequadrats, with a range from 461 to 133 g m
–2
. The rela-tionship was weaker (
r
2
= 0.52,
n
= 19,
P
< 0.001,range 127–283 g m
–2
), however, with only the vasculargreen biomass (shrub and sedge/herb leaves). Wherethe water table was low, a larger proportion of theabove-ground shrub biomass was contained in stemsand branches.
Green biomass also revealed a relationship withwater table position, but the pattern depended on spe-cies or species group. The
Sphagnum
capitula biomass,although species vary across the fen and bog, is
Table 1 Above-ground biomass and Leaf Area Index at the bog and fen sections of Mer Bleue, based on the mean of 15 bog andfour fen quadrats. Numbers in parentheses represent the standard deviation among the quadrats
Above-ground biomass (g m–2)
Site Species Leaf Shoot Leaf Area Index
Bog Chamaedaphne calyculata 52 (68) 72 (78) 0.44Kalmia angustifolia 52 (58) 41 (46) 0.32Ledum groenlandicum 28 (42) 22 (32) 0.18Vaccinium myrtilloides 13 (25) 16 (30) 0.14Maianthemum trifolium 2 (3) 0.04Sedges (Eriophorum spp.) 8 (17) 0.13Other vascular plants* 37 (46) 0.05Sphagnum capitula 144 (39) n.a.Total 487 (93) 1.30
Poor-fen Sedges (Carex oligospermaand Eriophorum spp.) 118 (51) 1.95Kalmia angustifolia 29 (40) 10 (13) 0.18Sphagnum capitula 160 (22) n.a.Total 317 (36) 2.13
*e.g. Vaccinium oxycoccus, Andromeda glaucophylla, Kalmia polifolia.
NEE PAR GP R
PAR GPmax
max
=− × × +
× +
( )
αα
JEC_633.fm Page 27 Monday, January 28, 2002 5:53 PM

28T. R. Moore et al.
© 2002 British Ecological Society, Journal of Ecology, 90, 25–36
remarkably constant over the water table range, withthe exception of a decrease at the sites with the lowestwater table, less than –50 cm (Fig. 1). Among theshrubs, L. groenlandicum and V. myrtilloides showedlittle consistent difference (their distribution appearsto be patchy) whereas leaf biomass of C. calyculataand K. angustifolia peaked at –50 to –60 cm and –30 to–40 cm, respectively. The sedge biomass (Carex spp.and Eriophorum spp.) showed a pronounced increasewhere the water table was higher than –35 cm (Fig. 1).
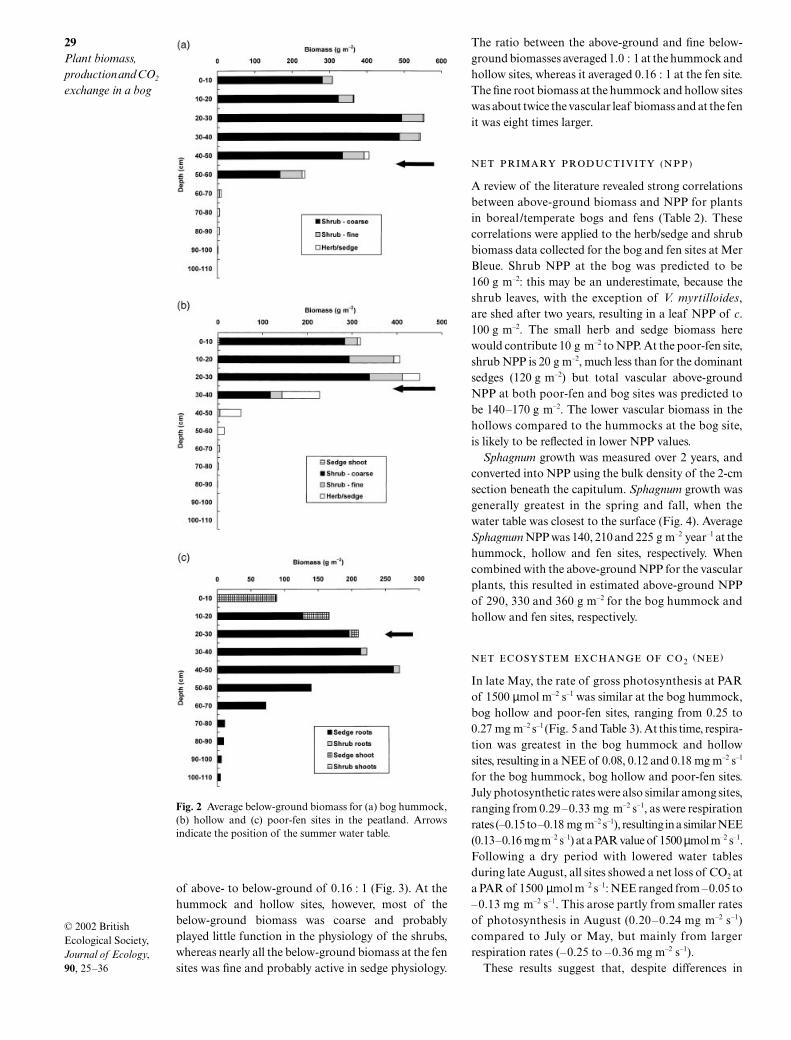
Below-ground biomass at the bog hummock aver-aged a total of 2400 kg m–2 to a depth of 1.1 m (Fig. 2a).Shrub coarse roots formed 86% of the total, but thesewere mainly shoots that developed root functions afterbeing enveloped by the rising moss. Shrub fine roots(< 2 mm diameter) amounted to only 300 g m–2 and theherbs and sedges contributed 48 g m–2. The shrub rootbiomass peaked at a depth of 20–40 cm, but did notextend beneath the average growing season water tabledepth of about –50 cm. The sedge and herb roots peaked
close to this depth and extended down to 1 m, albeit insmall amounts (< 10 g m–2). The bog hollow root biomassaveraged 1500 kg m–2, again mainly coarse materialrepresenting old shrub shoots (70% of the total),whereas shrub fine roots amounted to 231 g m–2 (Fig. 2b).The peak shrub root biomass in the hollows occurredat 10–30 cm and was again not found beneath theaverage growing-season water table depth of –30 cm.The herb/sedge roots amounted to 215 g m–2, peakingclose to the water table and extending down to 1 m.
At the fen site the root biomass totalled 1200 g m–2,dominated by sedges (87% of the total) and there was asignificant amount of sedge shoots (36 g m–2) growingthrough the Sphagnum mat near the surface (Fig. 2c).The sedge root biomass peaked at a depth of 30–50 cm,just beneath the average growing-season position of thewater table (–25 cm), and significant amounts of sedgeroots were noted at depths down to 1 m (10–20 g m–2).
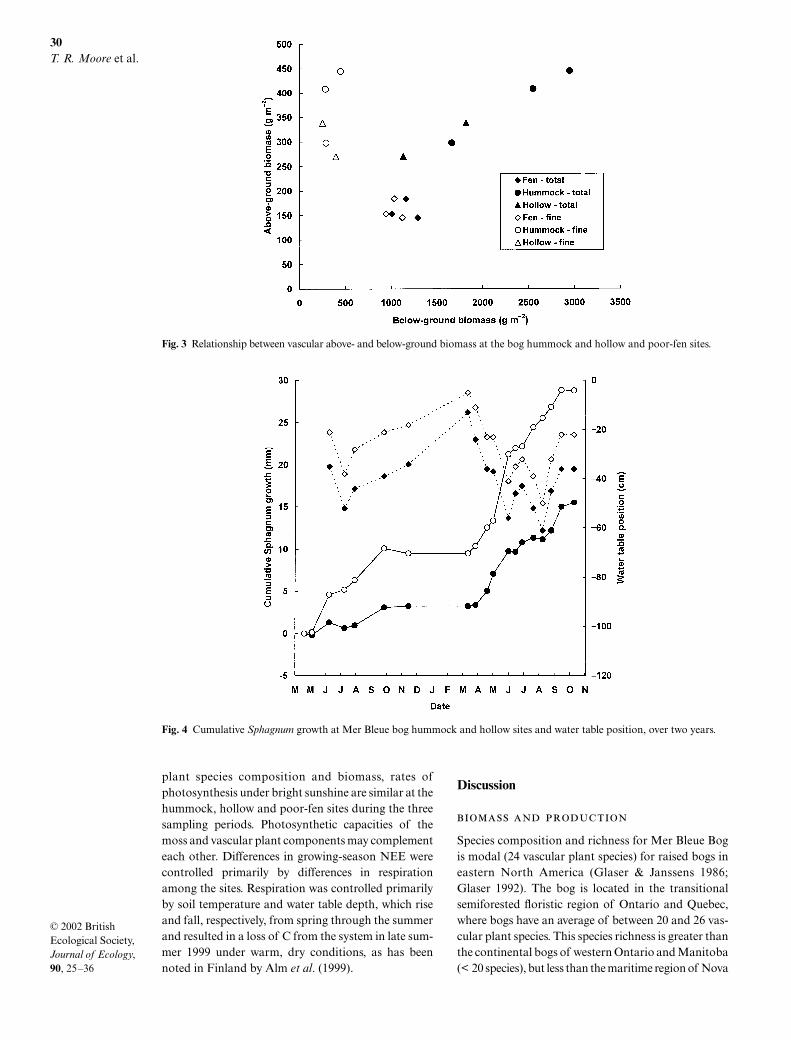
Above- and below-ground biomass at the hummock,hollow and fen sites were related, with an average ratio
Fig. 1 Relationship between water table position and above-ground total and green biomass of plant species at the bog and poor-fen sections of the Mer Bleue peatland, by water table depth category.
Table 2 Relationships between above-ground NPP and above-ground biomass for herb/sedge, shrub and tree groups withinnorthern peatlands, derived from Backéus (1990), Grigal et al. (1985), Reader & Stewart (1972), Szumigalski & Bayley (1997),Thormann & Bayley (1997), and Vasander (1982, 1992). Units, NPP g m–2 year–1; biomass g m–2
Group Regression n r 2
Herb/sedge log10 NPP = 1.000 log10biomass – 0.001 28 0.999Shrub log10 NPP = 0.985 log10biomass – 0.409 52 0.963Tree log10 NPP = 0.846 log10biomass – 0.600 5 0.327
JEC_633.fm Page 28 Monday, January 28, 2002 5:53 PM
29Plant biomass, production and CO2 exchange in a bog
© 2002 British Ecological Society, Journal of Ecology, 90, 25–36
of above- to below-ground of 0.16 : 1 (Fig. 3). At thehummock and hollow sites, however, most of thebelow-ground biomass was coarse and probablyplayed little function in the physiology of the shrubs,whereas nearly all the below-ground biomass at the fensites was fine and probably active in sedge physiology.
The ratio between the above-ground and fine below-ground biomasses averaged 1.0 : 1 at the hummock andhollow sites, whereas it averaged 0.16 : 1 at the fen site.The fine root biomass at the hummock and hollow siteswas about twice the vascular leaf biomass and at the fenit was eight times larger.
( )
A review of the literature revealed strong correlationsbetween above-ground biomass and NPP for plantsin boreal /temperate bogs and fens (Table 2). Thesecorrelations were applied to the herb/sedge and shrubbiomass data collected for the bog and fen sites at MerBleue. Shrub NPP at the bog was predicted to be160 g m–2: this may be an underestimate, because theshrub leaves, with the exception of V. myrtilloides,are shed after two years, resulting in a leaf NPP of c.100 g m–2. The small herb and sedge biomass herewould contribute 10 g m–2 to NPP. At the poor-fen site,shrub NPP is 20 g m–2, much less than for the dominantsedges (120 g m–2) but total vascular above-groundNPP at both poor-fen and bog sites was predicted tobe 140–170 g m–2. The lower vascular biomass in thehollows compared to the hummocks at the bog site,is likely to be reflected in lower NPP values.
Sphagnum growth was measured over 2 years, andconverted into NPP using the bulk density of the 2-cmsection beneath the capitulum. Sphagnum growth wasgenerally greatest in the spring and fall, when thewater table was closest to the surface (Fig. 4). AverageSphagnum NPP was 140, 210 and 225 g m–2 year–1 at thehummock, hollow and fen sites, respectively. Whencombined with the above-ground NPP for the vascularplants, this resulted in estimated above-ground NPPof 290, 330 and 360 g m–2 for the bog hummock andhollow and fen sites, respectively.
2 ( )
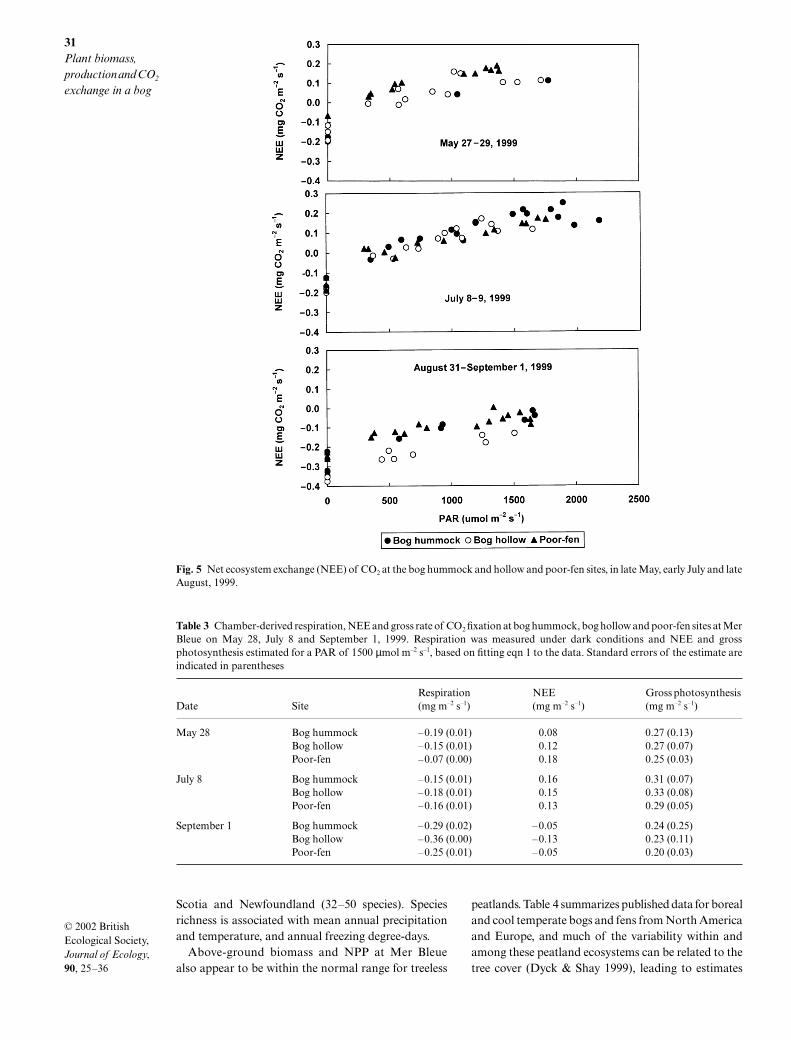
In late May, the rate of gross photosynthesis at PARof 1500 µmol m–2 s–1 was similar at the bog hummock,bog hollow and poor-fen sites, ranging from 0.25 to0.27 mg m–2 s–1 (Fig. 5 and Table 3). At this time, respira-tion was greatest in the bog hummock and hollowsites, resulting in a NEE of 0.08, 0.12 and 0.18 mg m–2 s–1
for the bog hummock, bog hollow and poor-fen sites.July photosynthetic rates were also similar among sites,ranging from 0.29–0.33 mg m–2 s–1, as were respirationrates (–0.15 to –0.18 mg m–2 s–1), resulting in a similar NEE(0.13–0.16 mg m–2 s–1) at a PAR value of 1500 µmol m–2 s–1.Following a dry period with lowered water tablesduring late August, all sites showed a net loss of CO2 ata PAR of 1500 µmol m–2 s–1: NEE ranged from –0.05 to–0.13 mg m–2 s–1. This arose partly from smaller ratesof photosynthesis in August (0.20–0.24 mg m–2 s–1)compared to July or May, but mainly from largerrespiration rates (–0.25 to –0.36 mg m–2 s–1).
These results suggest that, despite differences in
Fig. 2 Average below-ground biomass for (a) bog hummock,(b) hollow and (c) poor-fen sites in the peatland. Arrowsindicate the position of the summer water table.
JEC_633.fm Page 29 Monday, January 28, 2002 5:53 PM
30T. R. Moore et al.
© 2002 British Ecological Society, Journal of Ecology, 90, 25–36
plant species composition and biomass, rates ofphotosynthesis under bright sunshine are similar at thehummock, hollow and poor-fen sites during the threesampling periods. Photosynthetic capacities of themoss and vascular plant components may complementeach other. Differences in growing-season NEE werecontrolled primarily by differences in respirationamong the sites. Respiration was controlled primarilyby soil temperature and water table depth, which riseand fall, respectively, from spring through the summerand resulted in a loss of C from the system in late sum-mer 1999 under warm, dry conditions, as has beennoted in Finland by Alm et al. (1999).
Discussion
Species composition and richness for Mer Bleue Bogis modal (24 vascular plant species) for raised bogs ineastern North America (Glaser & Janssens 1986;Glaser 1992). The bog is located in the transitionalsemiforested floristic region of Ontario and Quebec,where bogs have an average of between 20 and 26 vas-cular plant species. This species richness is greater thanthe continental bogs of western Ontario and Manitoba(< 20 species), but less than the maritime region of Nova
Fig. 3 Relationship between vascular above- and below-ground biomass at the bog hummock and hollow and poor-fen sites.
Fig. 4 Cumulative Sphagnum growth at Mer Bleue bog hummock and hollow sites and water table position, over two years.
JEC_633.fm Page 30 Monday, January 28, 2002 5:53 PM
31Plant biomass, production and CO2 exchange in a bog
© 2002 British Ecological Society, Journal of Ecology, 90, 25–36
Scotia and Newfoundland (32–50 species). Speciesrichness is associated with mean annual precipitationand temperature, and annual freezing degree-days.
Above-ground biomass and NPP at Mer Bleuealso appear to be within the normal range for treeless
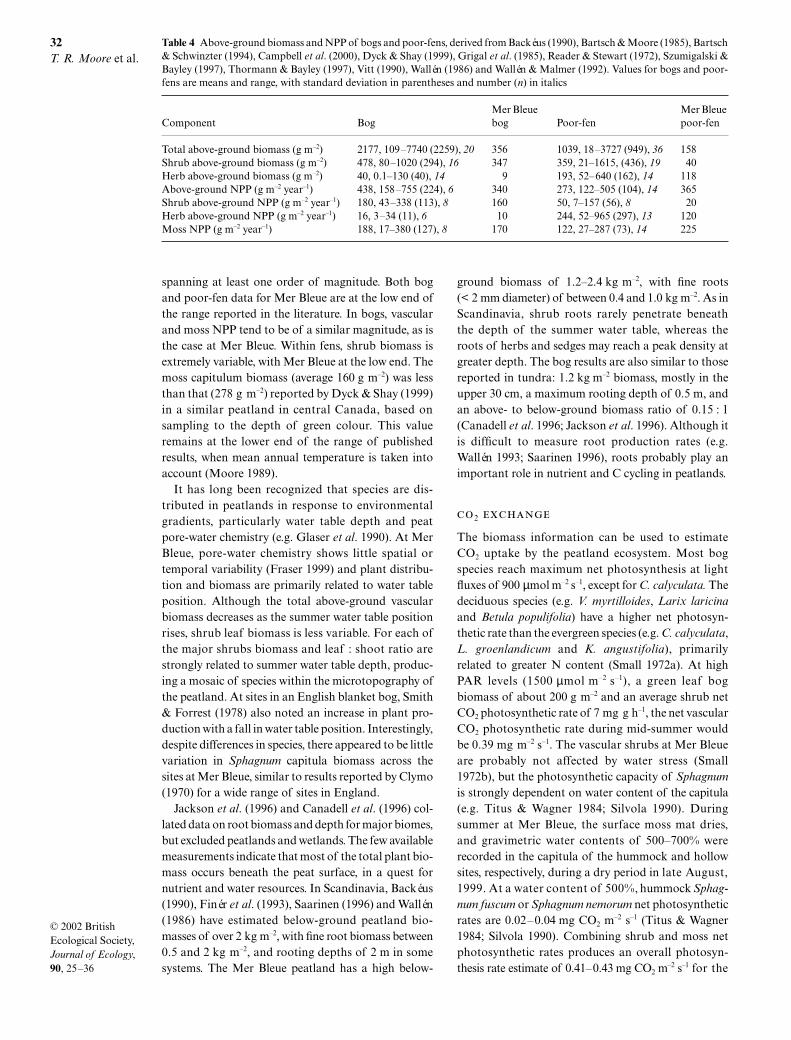
peatlands. Table 4 summarizes published data for borealand cool temperate bogs and fens from North Americaand Europe, and much of the variability within andamong these peatland ecosystems can be related to thetree cover (Dyck & Shay 1999), leading to estimates
Fig. 5 Net ecosystem exchange (NEE) of CO2 at the bog hummock and hollow and poor-fen sites, in late May, early July and lateAugust, 1999.
Table 3 Chamber-derived respiration, NEE and gross rate of CO2 fixation at bog hummock, bog hollow and poor-fen sites at MerBleue on May 28, July 8 and September 1, 1999. Respiration was measured under dark conditions and NEE and grossphotosynthesis estimated for a PAR of 1500 µmol m–2 s–1, based on fitting eqn 1 to the data. Standard errors of the estimate areindicated in parentheses
Date SiteRespiration (mg m–2 s–1)
NEE (mg m–2 s–1)
Gross photosynthesis (mg m–2 s–1)
May 28 Bog hummock –0.19 (0.01) 0.08 0.27 (0.13)Bog hollow –0.15 (0.01) 0.12 0.27 (0.07)Poor-fen –0.07 (0.00) 0.18 0.25 (0.03)
July 8 Bog hummock –0.15 (0.01) 0.16 0.31 (0.07)Bog hollow –0.18 (0.01) 0.15 0.33 (0.08)Poor-fen –0.16 (0.01) 0.13 0.29 (0.05)
September 1 Bog hummock –0.29 (0.02) –0.05 0.24 (0.25)Bog hollow –0.36 (0.00) –0.13 0.23 (0.11)Poor-fen –0.25 (0.01) –0.05 0.20 (0.03)
JEC_633.fm Page 31 Monday, January 28, 2002 5:53 PM
32T. R. Moore et al.
© 2002 British Ecological Society, Journal of Ecology, 90, 25–36
spanning at least one order of magnitude. Both bogand poor-fen data for Mer Bleue are at the low end ofthe range reported in the literature. In bogs, vascularand moss NPP tend to be of a similar magnitude, as isthe case at Mer Bleue. Within fens, shrub biomass isextremely variable, with Mer Bleue at the low end. Themoss capitulum biomass (average 160 g m–2) was lessthan that (278 g m–2) reported by Dyck & Shay (1999)in a similar peatland in central Canada, based onsampling to the depth of green colour. This valueremains at the lower end of the range of publishedresults, when mean annual temperature is taken intoaccount (Moore 1989).
It has long been recognized that species are dis-tributed in peatlands in response to environmentalgradients, particularly water table depth and peatpore-water chemistry (e.g. Glaser et al. 1990). At MerBleue, pore-water chemistry shows little spatial ortemporal variability (Fraser 1999) and plant distribu-tion and biomass are primarily related to water tableposition. Although the total above-ground vascularbiomass decreases as the summer water table positionrises, shrub leaf biomass is less variable. For each ofthe major shrubs biomass and leaf : shoot ratio arestrongly related to summer water table depth, produc-ing a mosaic of species within the microtopography ofthe peatland. At sites in an English blanket bog, Smith& Forrest (1978) also noted an increase in plant pro-duction with a fall in water table position. Interestingly,despite differences in species, there appeared to be littlevariation in Sphagnum capitula biomass across thesites at Mer Bleue, similar to results reported by Clymo(1970) for a wide range of sites in England.
Jackson et al. (1996) and Canadell et al. (1996) col-lated data on root biomass and depth for major biomes,but excluded peatlands and wetlands. The few availablemeasurements indicate that most of the total plant bio-mass occurs beneath the peat surface, in a quest fornutrient and water resources. In Scandinavia, Backéus(1990), Finér et al. (1993), Saarinen (1996) and Wallén(1986) have estimated below-ground peatland bio-masses of over 2 kg m–2, with fine root biomass between0.5 and 2 kg m–2, and rooting depths of 2 m in somesystems. The Mer Bleue peatland has a high below-
ground biomass of 1.2–2.4 kg m–2, with fine roots(< 2 mm diameter) of between 0.4 and 1.0 kg m–2. As inScandinavia, shrub roots rarely penetrate beneaththe depth of the summer water table, whereas theroots of herbs and sedges may reach a peak density atgreater depth. The bog results are also similar to thosereported in tundra: 1.2 kg m–2 biomass, mostly in theupper 30 cm, a maximum rooting depth of 0.5 m, andan above- to below-ground biomass ratio of 0.15 : 1(Canadell et al. 1996; Jackson et al. 1996). Although itis difficult to measure root production rates (e.g.Wallén 1993; Saarinen 1996), roots probably play animportant role in nutrient and C cycling in peatlands.
2
The biomass information can be used to estimateCO2 uptake by the peatland ecosystem. Most bogspecies reach maximum net photosynthesis at lightfluxes of 900 µmol m–2 s–1, except for C. calyculata. Thedeciduous species (e.g. V. myrtilloides, Larix laricinaand Betula populifolia) have a higher net photosyn-thetic rate than the evergreen species (e.g. C. calyculata,L. groenlandicum and K. angustifolia), primarilyrelated to greater N content (Small 1972a). At highPAR levels (1500 µmol m–2 s–1), a green leaf bogbiomass of about 200 g m–2 and an average shrub netCO2 photosynthetic rate of 7 mg g h–1, the net vascularCO2 photosynthetic rate during mid-summer wouldbe 0.39 mg m–2 s–1. The vascular shrubs at Mer Bleueare probably not affected by water stress (Small1972b), but the photosynthetic capacity of Sphagnumis strongly dependent on water content of the capitula(e.g. Titus & Wagner 1984; Silvola 1990). Duringsummer at Mer Bleue, the surface moss mat dries,and gravimetric water contents of 500–700% wererecorded in the capitula of the hummock and hollowsites, respectively, during a dry period in late August,1999. At a water content of 500%, hummock Sphag-num fuscum or Sphagnum nemorum net photosyntheticrates are 0.02–0.04 mg CO2 m
–2 s–1 (Titus & Wagner1984; Silvola 1990). Combining shrub and moss netphotosynthetic rates produces an overall photosyn-thesis rate estimate of 0.41–0.43 mg CO2 m
–2 s–1 for the
Table 4 Above-ground biomass and NPP of bogs and poor-fens, derived from Backéus (1990), Bartsch & Moore (1985), Bartsch& Schwinzter (1994), Campbell et al. (2000), Dyck & Shay (1999), Grigal et al. (1985), Reader & Stewart (1972), Szumigalski &Bayley (1997), Thormann & Bayley (1997), Vitt (1990), Wallén (1986) and Wallén & Malmer (1992). Values for bogs and poor-fens are means and range, with standard deviation in parentheses and number (n) in italics
Component BogMer Bleue bog Poor-fen
Mer Bleue poor-fen
Total above-ground biomass (g m–2) 2177, 109–7740 (2259), 20 356 1039, 18–3727 (949), 36 158Shrub above-ground biomass (g m–2) 478, 80–1020 (294), 16 347 359, 21–1615, (436), 19 40Herb above-ground biomass (g m–2) 40, 0.1–130 (40), 14 9 193, 52–640 (162), 14 118Above-ground NPP (g m–2 year–1) 438, 158–755 (224), 6 340 273, 122–505 (104), 14 365Shrub above-ground NPP (g m–2 year–1) 180, 43–338 (113), 8 160 50, 7–157 (56), 8 20Herb above-ground NPP (g m–2 year–1) 16, 3–34 (11), 6 10 244, 52–965 (297), 13 120Moss NPP (g m–2 year–1) 188, 17–380 (127), 8 170 122, 27–287 (73), 14 225
JEC_633.fm Page 32 Monday, January 28, 2002 5:53 PM
33Plant biomass, production and CO2 exchange in a bog
© 2002 British Ecological Society, Journal of Ecology, 90, 25–36
hummocks. In the hollows, the shrub leaf biomassis smaller (160 g m–2), but this is compensated by aSphagnum mat with a larger water content. Combina-tion of vascular (0.31 mg CO2 m
–2 s–1) and moss(0.07 mg CO2 m
–2 s–1, Sphagnum fallax – Titus &Wagner (1984)) net photosynthetic capacities resultsin an overall estimate of 0.38 mg CO2 m
–2 s–1 in thehollows.
These estimated photosynthetic rates can be com-pared with the peatland CO2 uptake rates observedby the eddy-covariance measurements (Lafleur et al.2001) and chamber measurements. During July andAugust, 1998, NEE rates determined by eddy-covari-ance were 0.24 mg CO2 m–2 s–1 at a PAR value of1500 µmol m–2 s–1. Subtracting the respiration values,derived from night-time flux, these translate intophotosynthetic rates of 0.35–0.40 mg CO2 m
–2 s–1 andGPmax values of 0.39–0.46 mg CO2 m
–2 s–1. This rangeis similar to that obtained above for hummock andhollow sites (0.42 and 0.38 mg CO2 m
–2 s–1, respectively)using the biomass data and net photosynthetic ratesfrom Small (1972a) and Titus & Wagner (1984). Thephotosynthetic rates from the chamber measurementsat hummock and hollow sites in July, 1999 rangefrom 0.31 to 0.33 mg CO2 m
–2 s–1, somewhat less thanobserved by eddy-covariance techniques and predictedfrom biomass.
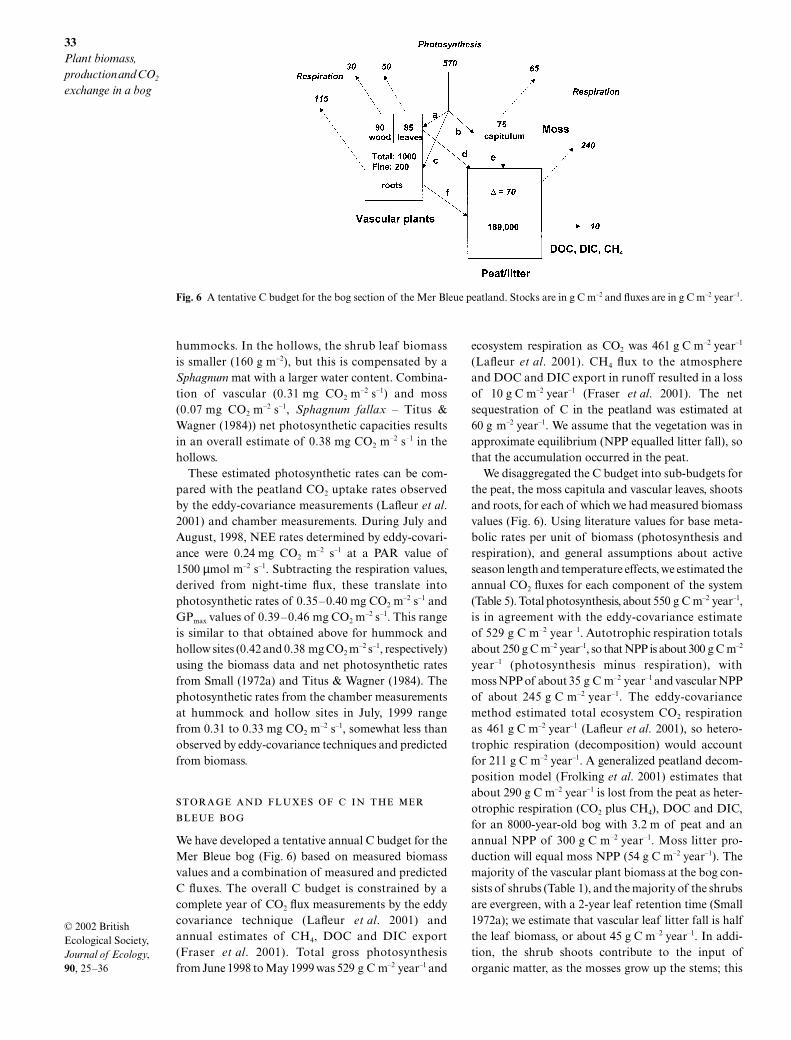
We have developed a tentative annual C budget for theMer Bleue bog (Fig. 6) based on measured biomassvalues and a combination of measured and predictedC fluxes. The overall C budget is constrained by acomplete year of CO2 flux measurements by the eddycovariance technique (Lafleur et al. 2001) andannual estimates of CH4, DOC and DIC export(Fraser et al. 2001). Total gross photosynthesisfrom June 1998 to May 1999 was 529 g C m–2 year–1 and
ecosystem respiration as CO2 was 461 g C m–2 year–1
(Lafleur et al. 2001). CH4 flux to the atmosphereand DOC and DIC export in runoff resulted in a lossof 10 g C m–2 year–1 (Fraser et al. 2001). The netsequestration of C in the peatland was estimated at60 g m–2 year–1. We assume that the vegetation was inapproximate equilibrium (NPP equalled litter fall), sothat the accumulation occurred in the peat.
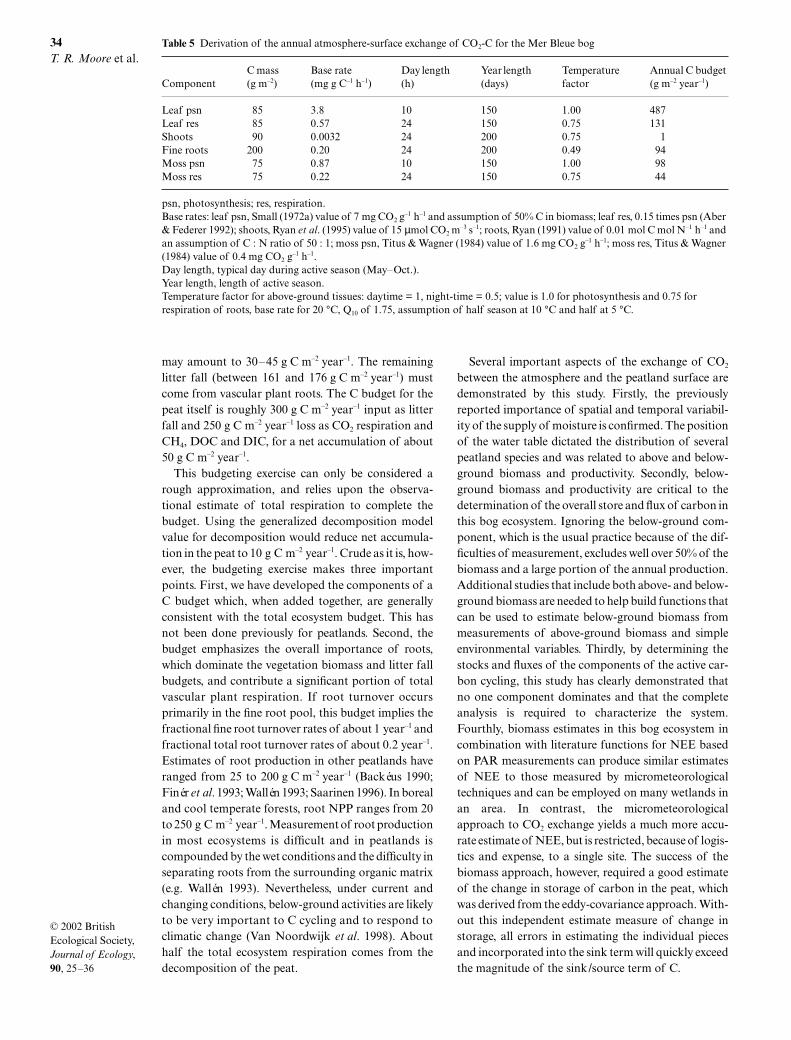
We disaggregated the C budget into sub-budgets forthe peat, the moss capitula and vascular leaves, shootsand roots, for each of which we had measured biomassvalues (Fig. 6). Using literature values for base meta-bolic rates per unit of biomass (photosynthesis andrespiration), and general assumptions about activeseason length and temperature effects, we estimated theannual CO2 fluxes for each component of the system(Table 5). Total photosynthesis, about 550 g C m–2 year–1,is in agreement with the eddy-covariance estimateof 529 g C m–2 year–1. Autotrophic respiration totalsabout 250 g C m–2 year–1, so that NPP is about 300 g C m–2
year–1 (photosynthesis minus respiration), withmoss NPP of about 35 g C m–2 year–1 and vascular NPPof about 245 g C m–2 year–1. The eddy-covariancemethod estimated total ecosystem CO2 respirationas 461 g C m–2 year–1 (Lafleur et al. 2001), so hetero-trophic respiration (decomposition) would accountfor 211 g C m–2 year–1. A generalized peatland decom-position model (Frolking et al. 2001) estimates thatabout 290 g C m–2 year–1 is lost from the peat as heter-otrophic respiration (CO2 plus CH4), DOC and DIC,for an 8000-year-old bog with 3.2 m of peat and anannual NPP of 300 g C m–2 year–1. Moss litter pro-duction will equal moss NPP (54 g C m–2 year–1). Themajority of the vascular plant biomass at the bog con-sists of shrubs (Table 1), and the majority of the shrubsare evergreen, with a 2-year leaf retention time (Small1972a); we estimate that vascular leaf litter fall is halfthe leaf biomass, or about 45 g C m–2 year–1. In addi-tion, the shrub shoots contribute to the input oforganic matter, as the mosses grow up the stems; this
Fig. 6 A tentative C budget for the bog section of the Mer Bleue peatland. Stocks are in g C m–2 and fluxes are in g C m–2 year–1.
JEC_633.fm Page 33 Monday, January 28, 2002 5:53 PM
34T. R. Moore et al.
© 2002 British Ecological Society, Journal of Ecology, 90, 25–36
may amount to 30–45 g C m–2 year–1. The remaininglitter fall (between 161 and 176 g C m–2 year–1) mustcome from vascular plant roots. The C budget for thepeat itself is roughly 300 g C m–2 year–1 input as litterfall and 250 g C m–2 year–1 loss as CO2 respiration andCH4, DOC and DIC, for a net accumulation of about50 g C m–2 year–1.
This budgeting exercise can only be considered arough approximation, and relies upon the observa-tional estimate of total respiration to complete thebudget. Using the generalized decomposition modelvalue for decomposition would reduce net accumula-tion in the peat to 10 g C m–2 year–1. Crude as it is, how-ever, the budgeting exercise makes three importantpoints. First, we have developed the components of aC budget which, when added together, are generallyconsistent with the total ecosystem budget. This hasnot been done previously for peatlands. Second, thebudget emphasizes the overall importance of roots,which dominate the vegetation biomass and litter fallbudgets, and contribute a significant portion of totalvascular plant respiration. If root turnover occursprimarily in the fine root pool, this budget implies thefractional fine root turnover rates of about 1 year–1 andfractional total root turnover rates of about 0.2 year–1.Estimates of root production in other peatlands haveranged from 25 to 200 g C m–2 year–1 (Backéus 1990;Finér et al. 1993; Wallén 1993; Saarinen 1996). In borealand cool temperate forests, root NPP ranges from 20to 250 g C m–2 year–1. Measurement of root productionin most ecosystems is difficult and in peatlands iscompounded by the wet conditions and the difficulty inseparating roots from the surrounding organic matrix(e.g. Wallén 1993). Nevertheless, under current andchanging conditions, below-ground activities are likelyto be very important to C cycling and to respond toclimatic change (Van Noordwijk et al. 1998). Abouthalf the total ecosystem respiration comes from thedecomposition of the peat.
Several important aspects of the exchange of CO2
between the atmosphere and the peatland surface aredemonstrated by this study. Firstly, the previouslyreported importance of spatial and temporal variabil-ity of the supply of moisture is confirmed. The positionof the water table dictated the distribution of severalpeatland species and was related to above and below-ground biomass and productivity. Secondly, below-ground biomass and productivity are critical to thedetermination of the overall store and flux of carbon inthis bog ecosystem. Ignoring the below-ground com-ponent, which is the usual practice because of the dif-ficulties of measurement, excludes well over 50% of thebiomass and a large portion of the annual production.Additional studies that include both above- and below-ground biomass are needed to help build functions thatcan be used to estimate below-ground biomass frommeasurements of above-ground biomass and simpleenvironmental variables. Thirdly, by determining thestocks and fluxes of the components of the active car-bon cycling, this study has clearly demonstrated thatno one component dominates and that the completeanalysis is required to characterize the system.Fourthly, biomass estimates in this bog ecosystem incombination with literature functions for NEE basedon PAR measurements can produce similar estimatesof NEE to those measured by micrometeorologicaltechniques and can be employed on many wetlands inan area. In contrast, the micrometeorologicalapproach to CO2 exchange yields a much more accu-rate estimate of NEE, but is restricted, because of logis-tics and expense, to a single site. The success of thebiomass approach, however, required a good estimateof the change in storage of carbon in the peat, whichwas derived from the eddy-covariance approach. With-out this independent estimate measure of change instorage, all errors in estimating the individual piecesand incorporated into the sink term will quickly exceedthe magnitude of the sink/source term of C.
Table 5 Derivation of the annual atmosphere-surface exchange of CO2-C for the Mer Bleue bog
ComponentC mass (g m–2)
Base rate (mg g C–1 h–1)
Day length (h)
Year length (days)
Temperature factor
Annual C budget (g m–2 year–1)
Leaf psn 85 3.8 10 150 1.00 487Leaf res 85 0.57 24 150 0.75 131Shoots 90 0.0032 24 200 0.75 1Fine roots 200 0.20 24 200 0.49 94Moss psn 75 0.87 10 150 1.00 98Moss res 75 0.22 24 150 0.75 44
psn, photosynthesis; res, respiration.Base rates: leaf psn, Small (1972a) value of 7 mg CO2 g
–1 h–1 and assumption of 50% C in biomass; leaf res, 0.15 times psn (Aber & Federer 1992); shoots, Ryan et al. (1995) value of 15 µmol CO2 m
–3 s–1; roots, Ryan (1991) value of 0.01 mol C mol N–1 h–1 and an assumption of C : N ratio of 50 : 1; moss psn, Titus & Wagner (1984) value of 1.6 mg CO2 g
–1 h–1; moss res, Titus & Wagner (1984) value of 0.4 mg CO2 g
–1 h–1.Day length, typical day during active season (May–Oct.).Year length, length of active season.Temperature factor for above-ground tissues: daytime = 1, night-time = 0.5; value is 1.0 for photosynthesis and 0.75 for respiration of roots, base rate for 20 °C, Q10 of 1.75, assumption of half season at 10 °C and half at 5 °C.
JEC_633.fm Page 34 Monday, January 28, 2002 5:53 PM

35Plant biomass, production and CO2 exchange in a bog
© 2002 British Ecological Society, Journal of Ecology, 90, 25–36
Acknowledgements
We thank Mike Dalva, Colin Fraser, and Colette Isern-hagen for field and laboratory assistance; the NationalCapital Commission for permission to use Mer Bleue,a Ramsar-designated site; and NSERC grants to TRMand NTR and a NASA New Investigator Program inEarth Science grant to JLB for financial support.
References
Aber, J.D. & Federer, C.A. (1992) A generalized, lumpedparameter model of photosynthesis, evapotranspirationand net primary production in temperate and boreal forestecosystems. Oecologia, 92, 463–474.
Alm, J., Schulman, L., Walden, J., Nykänen, H., Martikainen, P.J.& Silvola, J. (1999) Carbon balance of a boreal bog duringa year with an exceptionally dry summer. Ecology, 80, 161–174.
Anderson, L.E. (1990) A checklist of Sphagnum in NorthAmerica north of Mexico. The Bryologist, 93, 500–501.
Backéus, I. (1990) Production and depth distribution of fineroots in a boreal open bog. Annales Botanici Fennici, 27,261–265.
Bartsch, I. & Moore, T.R. (1985) A preliminary investigationof primary production and decomposition in subarcticpeatlands. Canadian Journal of Botany, 63, 1241–1248.
Bartsch, I. & Schwinzter, C. (1994) Growth of Chamaedaphnecalyculata at two peatland sites in relation to nutrient avail-ability. Wetlands, 14, 147–158.
Bubier, J.L., Crill, P.M., Moore, T.R., Savage, K. & Varner, R.K.(1998) Seasonal patterns and controls on net ecosystemCO2 exchange in a boreal peatland complex. Global Bio-geochemical Cycles, 12, 703–714.
Campbell, C., Vitt, D.H., Halsey, L.A., Campbell, I.D.,Thormann, M.N. & Bayley, S.E. (2000) Net primaryproduction and standing biomass in northern continentalwetlands. Canadian Forestry Service Information ReportNOR-X-369, Canadian Forestry Service, Edmonton,Alberta, Canada.
Canadell, J., Jackson, R.B., Ehleringer, J.R., Mooney, H.A.,Sala, O.E. & Schulze, E.-D. (1996) Maximum rooting depthof vegetation types at the global scale. Oecologia, 108, 583–595.
Clymo, R.S. (1970) The growth of Sphagnum: methods ofmeasurement. Journal of Ecology, 58, 13–49.
Clymo, R.S., Turunen, J. & Tolonen, K. (1998) Carbon accu-mulation in peatlands. Oikos, 81, 368–388.
Dyck, B.S. & Shay, J.M. (1999) Biomass and carbon pools oftwo bogs in the Experimental Lakes Area, northwesternOntario. Canadian Journal of Botany, 77, 291–304.
Fernald, M.L. (1950) Gray’s Manual of Botany. Van NostrandRheinhold, New York. Reprinted by Dioscorides, Portland,Oregon, 1987.
Finér, L., Laine, J. & Halko, L. (1993) Fine root dynamics ontwo drained peatland sites. Suo (Helsinki), 4–5, 207–210.
Fraser, C.J.D. (1999) The hydrology and dissolved organiccarbon biogeochemistry in a boreal peatland. MSc Thesis,McGill University.
Fraser, C.J.D., Roulet, N.T. & Moore, T.R. (2001) Dissolvedorganic carbon biogeochemistry and hydrology at a tem-perate bog. Hydrological Processes, 15, 3151–3166.
Frolking, S.S., Bubier, J.L., Moore, T.R., Ball, T., Bellisario, L.M.,Bhardwaj, A., Carroll, P., Crill, P.M., Lafleur, P.M.,McCaughey, J.H., Roulet, N.T., Suyker, A.E., Verma, S.B.,Waddington, J.M. & Whiting, G.J. (1998) Relationshipbetween ecosystem productivity and photosyntheticallyactive radiation from northern peatlands. Global Biogeo-chemical Cycles, 12, 115–126.
Frolking, S., Roulet, N.T., Moore, T.R., Lavoie, M. & Muller,S.D. (2001) Modeling northern peatland decompositionand peat accumulation. Ecosystems, 4, 479–498.
Glaser, P.H. (1992) Raised bogs in eastern North America– regional controls for species richness and floristicassemblages. Journal of Ecology, 80, 535–554.
Glaser, P.H. & Janssens, J.A. (1986) Raised bogs in easternNorth America: transitions in landforms and stratigraphy.Canadian Journal of Botany, 64, 395–415.
Glaser, P.H., Janssens, J.A. & Siegel, D.I. (1990) The responseof vegetation to chemical and hydrologic gradients inthe Lost River Peatland, northern Minnesota. Journal ofEcology, 78, 1021–1048.
Gorham, E. (1991) Northern peatlands: role in the carboncycle and probable responses to climatic warming. Ecolo-gical Applications, 1, 182–195.
Grigal, D.F., Buttleman, C.G. & Kernick, L.K. (1985) Bio-mass and productivity of the woody strata of forested bogsin northern Minnesota. Canadian Journal of Botany, 63,2416–2424.
Jackson, R.B., Canadell, J., Ehleringer, J.R., Mooney, H.A.,Sala, O.E. & Schulze, E.-D. (1996) A global analysis of rootdistributions of terrestrial biomes. Oecologia, 108, 389–411.
Lafleur, P.M., Roulet, N.T. & Admiral, S. (2001) The annualcycle of CO2 exchange at a boreal bog peatland. Journal ofGeophysical Research, 106, 3071–3081.
Moore, T.R. (1989) Growth and net production of Sphagnumat five fen sites, subarctic eastern Canada. Canadian Journalof Botany, 67, 1203–1207.
Moore, T.R., Roulet, N.T. & Waddington, J.M. (1998) Uncer-tainties in predicting the effect of climatic change on thecarbon cycling of Canadian peatlands. Climatic Change,40, 229–245.
Reader, R.J. & Stewart, J.M. (1972) The relationship betweennet primary production and accumulation for a peatland insoutheastern Manitoba. Ecology, 53, 1024–1037.
Ryan, M.G. (1991) Effects of climatic change on plant respira-tion. Ecological Applications, 1, 157–167.
Ryan, M.G., Gower, S.T., Hubbard, R.M., Waring, R.H.,Gholz, L.H., Cropper, W.P. & Running, S.W. (1995) Woodytissue maintenance respiration of four conifers in contrast-ing climates. Oecologia, 101, 133–140.
Saarinen, T. (1996) Biomass and production of two vascularplants in a boreal mesotrophic fen. Canadian Journal ofBotany, 74, 934–938.
Scanlon, D. & Moore, T. (2000) Carbon dioxide productionfrom peatland soil profiles: the influence of temperature,oxic/anoxic conditions and substrate. Soil Science, 165,153–160.
Silvola, J. (1990) Combined effect of varying water contentand CO2 concentration on photosynthesis in Sphagnumfuscum. Holarctic Ecology, 13, 224–228.
Small, E. (1972a) Photosynthetic rates in relation to nitrogenrecycling as an adaptation to nutrient deficiency in peat bogplants. Canadian Journal of Botany, 50, 2227–2233.
Small, E. (1972b) Water relations of plants in raised Sphag-num peat bogs. Ecology, 53, 726–728.
Smith, R.A.H. & Forrest, G.I. (1978) Field estimates of primaryproduction. Production Ecology of British Moors andMontane Grasslands (eds O.W. Heal & D.F. Perkins),pp. 17–37. Springer, Berlin.
Szumigalski, A.R. & Bayley, S.E. (1997) Net abovegroundprimary production along a peatland gradient in centralAlberta in relation to environmental factors. Ecoscience, 4,385–393.
Thormann, M.N. & Bayley, S.E. (1997) Aboveground netprimary production along a bog–fen–marsh gradient insouthern boreal Alberta, Canada. Ecoscience, 4, 374–384.
Thornley, J.H.M. & Johnson, I.R. (1990) Plant and CropModelling: a Mathematical Approach to Plant and CropPhysiology. Clarendon, Oxford.
JEC_633.fm Page 35 Monday, January 28, 2002 5:53 PM

36T. R. Moore et al.
© 2002 British Ecological Society, Journal of Ecology, 90, 25–36
Titus, J.E. & Wagner, D.J. (1984) Carbon balance for twoSphagnum mosses: water balance resolves a physiologicalparadox. Ecology, 65, 1765–1774.
Van Noordwijk, M., Martikainen, P., Bottner, P., Cuevas, E.,Rouland, C. & Dhillon, S.S. (1998) Global change and rootfunction. Global Change Biology, 4, 59–772.
Vasander, H. (1982) Plant biomass and production in virgin,drained and fertilized sites in a raised bog in southernFinland. Annales Botanici Fennici, 19, 103–125.
Vasander, H. (1992) Plant Biomass, its Production andDiversity on Virgin and Drained Southern Boreal Mires.Publication 18. Department of Botany, University ofHelsinki, Finland.
Vitt, D.H. (1990) Growth and production dynamics of boreal
mosses over climatic, chemical and topographical gradients.Botanical Journal of the Linnaean Society, 104, 35–59.
Wallén, B. (1986) Above and below ground dry mass of thethree main vascular plants on hummocks on a subarcticpeat bog. Oikos, 46, 51–56.
Wallén, B. (1993) Methods for studying below-ground pro-duction in mire ecosystems. Suo (Helsinki), 43, 155–162.
Wallén, B. & Malmer, N. (1992) Distribution of biomassalong hummock–hollow gradients: a comparison betweena North American and a Scandinavian peat bog. ActaSocietatis Botanicorum Poloniae, 61, 75–87.
Received 23 October 2000 revision accepted 31 May 2001
JEC_633.fm Page 36 Monday, January 28, 2002 5:53 PM