
User manual CO - RVO.nl manual CO2... · User manual CO2-tool for electricity, ... counting the...
25
Transcript of User manual CO - RVO.nl manual CO2... · User manual CO2-tool for electricity, ... counting the...
User manual CO2-tool for electricity, gas and heat from biomass
This document gives practical instructions on how to use the CO2 tool. Background
information on the methodology and data sources used in the CO2 tool can be found
in the methodology document that accompanies this tool.
Contact information
This CO2-tool was developed by Ecofys by order of NL Agency. For information on this
tool please contact:
Har van Himbergen, NL Agency, [email protected]
Ella Lammers, NL Agency, [email protected]
Version
1.0
Date
May 2011
Disclaimer
No rights may be derived from this publication, nor may NL Agency be held liable for
the consequences arising from the use thereof.
i
Table of contents
1 Introduction ............................................................................................. 1
1.1 Background........................................................................................... 1
1.2 How to use the tool and this manual ........................................................ 1
2 Composition of the spreadsheets.............................................................. 2
2.1 Methodology ......................................................................................... 2
2.2 General overview................................................................................... 3
3 The data entry boxes ................................................................................ 4
3.1 Overview results.................................................................................... 4
3.2 Allocation factors and conversion efficiencies............................................. 5
3.3 Emission reduction................................................................................. 5
3.4 Calculated emissions .............................................................................. 6
3.5 Data input for calculation........................................................................ 7
3.5.1 Cultivation ............................................................................................ 7
3.5.2 Transport before processing.................................................................... 8
3.5.3 Processing before conversion .................................................................. 9
3.5.4 Transport before conversion...................................................................12
3.5.5 Conversion...........................................................................................13
3.5.6 Processing after conversion....................................................................15
3.6 Other fields..........................................................................................15
3.7 Total results.........................................................................................16
4 Adapting parameters and pathways ....................................................... 17
Appendix A Example of adding a new step .............................................. 18

| 1
1 Introduction
1.1 Background
Biomass can be converted into final energy in the form of electricity, heat or biofuels.
This final energy is considered ‘green’ since it does not result in the release of CO2
with ‘fossil carbon’. However, several steps in producing this final energy from
biomass do generate fossil carbon emission. Examples are: Cultivation and harvesting,
transport, drying, size reductions, etc. The reduction in greenhouse gas (GHG)
emission compared to final energy from a fossil fuel is therefore less than 100%. How
much less than 100% depends on the type of biomass, the transport distance and
method and the processing steps. The diversity in biomass, conversion technologies,
ways of transport and the geographical spread of both biomass sources and the
energy demand result in numerous possible biomass-to-energy chains. Each of these
chains have a different GHG emission performance. The calculation of the total GHG-
emission from a specific chain is time-consuming. The CO2-tool is software to make
these calculations easier.
1.2 How to use the tool and this manual
The tool has a number of pre-defined biomass-to-energy chains; each chain on a
separate sheet. All those sheets are accessible from the sheet ‘Directory’. The sheet
‘Standard values’ contains pre-defined emission factors. This sheet cannot be
modified. The sheet ‘About’ contains some general information.
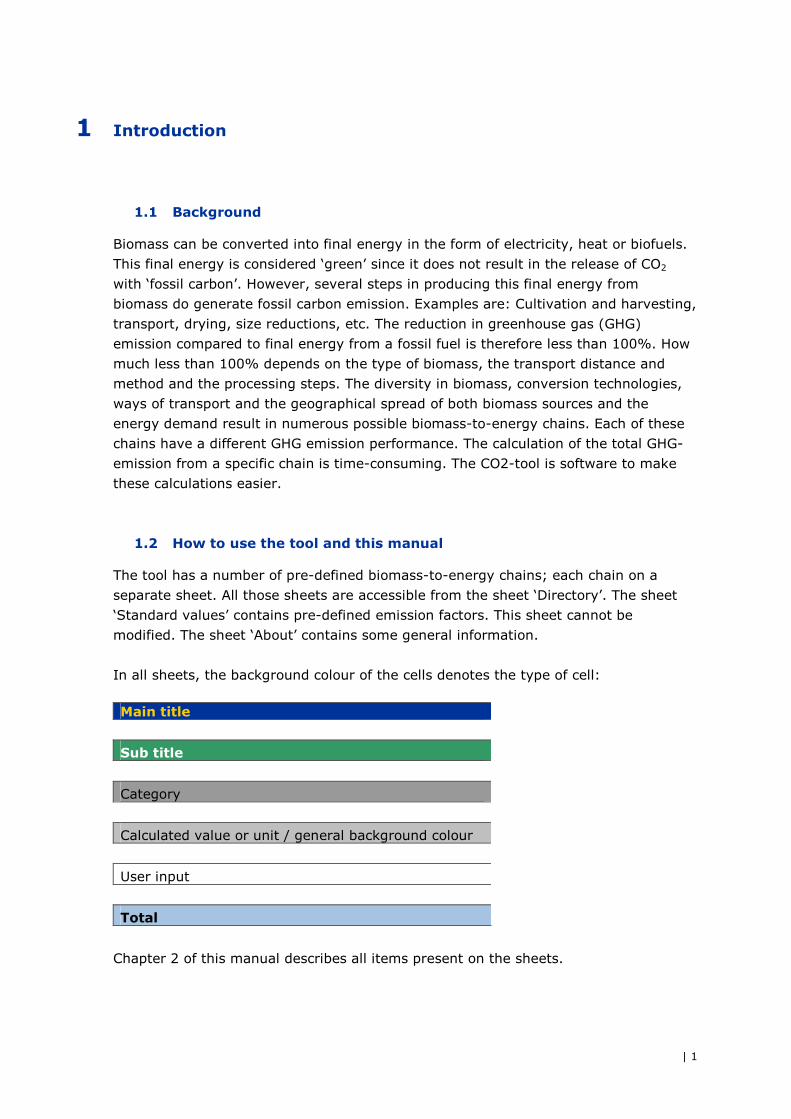
In all sheets, the background colour of the cells denotes the type of cell:
Main title
Sub title
Category
Calculated value or unit / general background colour
User input
Total
Chapter 2 of this manual describes all items present on the sheets.
| 2
2 Composition of the spreadsheets
2.1 Methodology
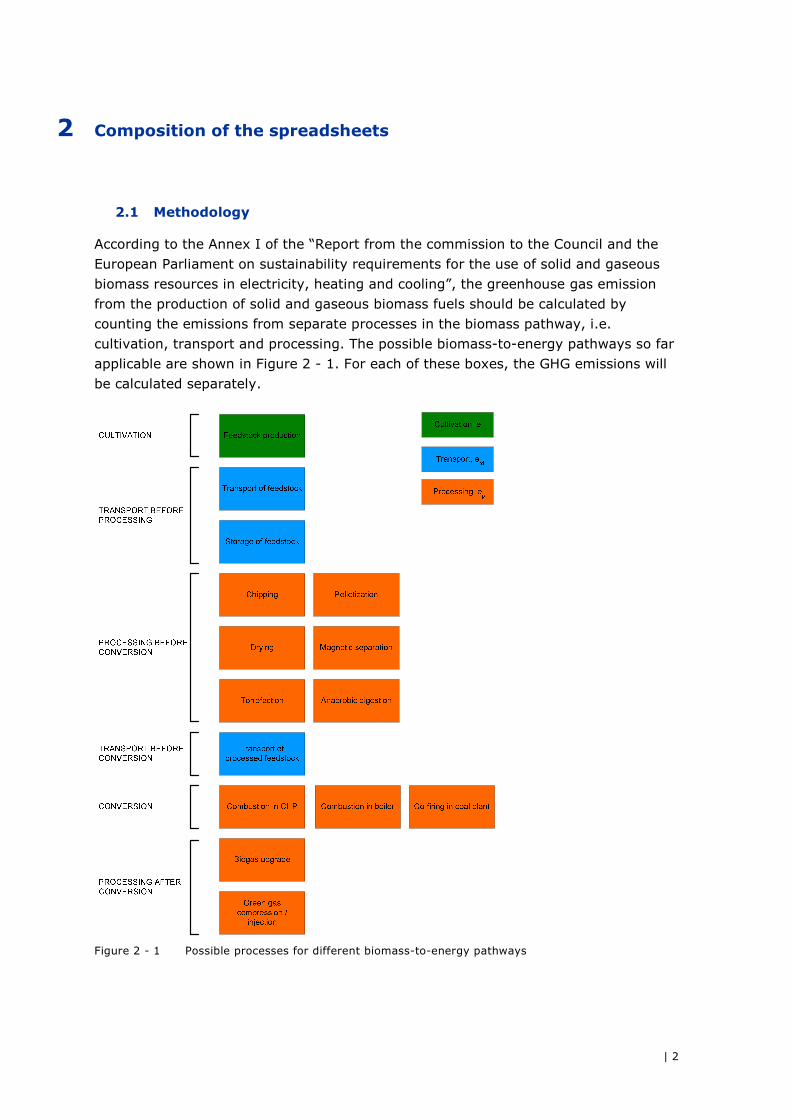
According to the Annex I of the “Report from the commission to the Council and the
European Parliament on sustainability requirements for the use of solid and gaseous
biomass resources in electricity, heating and cooling”, the greenhouse gas emission
from the production of solid and gaseous biomass fuels should be calculated by
counting the emissions from separate processes in the biomass pathway, i.e.
cultivation, transport and processing. The possible biomass-to-energy pathways so far
applicable are shown in Figure 2 - 1. For each of these boxes, the GHG emissions will
be calculated separately.
Figure 2 - 1 Possible processes for different biomass-to-energy pathways
| 3
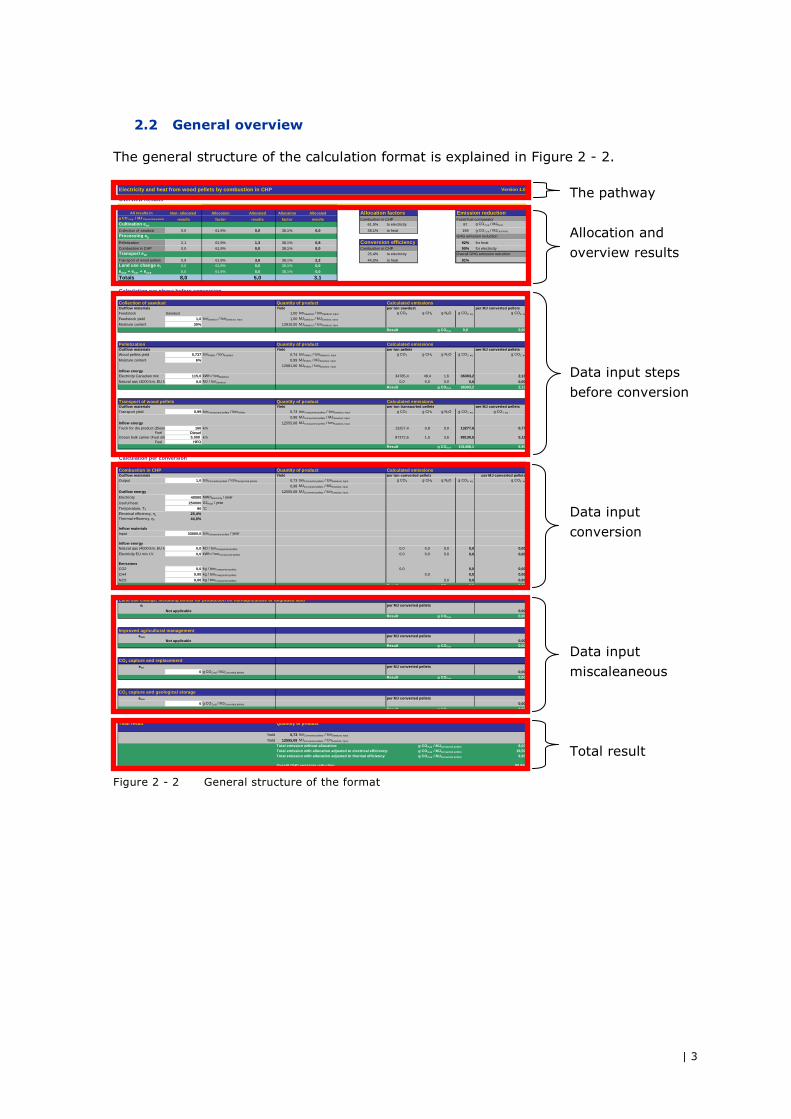
2.2 General overview
The general structure of the calculation format is explained in Figure 2 - 2.
Electricity and heat from wood pellets by combustion in CHP Version 1.0
Overview Results
All results in Non- allocated Allocation Allocated Allocation Allocated Allocation factors Emission reductiong CO 2,eq / MJ Converted pellets results factor results factor results Combustion in CHP Fossil fuel comparatorCultivation eec 61,9% to electricity 87 g CO2,eq / MJHeat
Collection of sawdust 0,0 61,9% 0,0 38,1% 0,0 38,1% to heat 198 g CO2,eq / MJElectricity
Processing ep GHG emission reduction
Pelletization 2,1 61,9% 1,3 38,1% 0,8 Conversion efficiency 92% for heat
Combustion in CHP 0,0 61,9% 0,0 38,1% 0,0 Combustion in CHP 90% for electricityTransport etd 25,4% to electricity Overall GHG emission reduction
Transport of wood pellets 5,9 61,9% 3,6 38,1% 2,2 44,0% to heat 91%Land use change el 0,0 61,9% 0,0 38,1% 0,0
esca + eccr + eccs 0,0 61,9% 0,0 38,1% 0,0
Totals 8,0 5,0 3,1
Calculation per phase before conversion
Collection of sawdust Quantity of product Calculated emissionsOutflow materials Yield per ton sawdust per MJ converted pelletsFeedstock Sawdust 1,00 tonSawdust / tonSawdust, input g CO2 g CH4 g N2O g CO2, eq g CO2, eq
Feedstock yield 1,0 tonSawdust / tonSawdust, input 1,00 MJSawdust / MJSawdust, input
Moisture content 30% 12810,00 MJSawdust / tonSawdust, input
Result g CO2,eq 0,0 0,00
Pelletization Quantity of product Calculated emissionsOutflow materials Yield per ton pellets per MJ converted pelletsWood pellets yield 0,737 tonPellets / tonSawdust 0,74 tonPellets / tonSawdust, input g CO2 g CH4 g N2O g CO2, eq g CO2, eq
Moisture content 6% 0,99 MJPellets / MJSawdust, input
12681,90 MJPellets / tonSawdust, input
Inflow energyElectricity Canadian mix 115,0 kWh / tonSawdust 34785,4 48,4 1,6 36303,2 2,13
Natural gas (4000 km, EU M 0,0 MJ / tonSawdust 0,0 0,0 0,0 0,0 0,00Result g CO2,eq 36303,2 2,13
Transport of wood pellets Quantity of product Calculated emissionsOutflow materials Yield per ton transported pellets per MJ converted pelletsTransport yield 0,99 tonTransported pellets / tonPellets 0,73 tonTransported pellets / tonSawdust, input g CO2 g CH4 g N2O g CO2, eq g CO2, eq
0,98 MJTransported pellets / MJSawdust, input
Inflow energy 12555,08 MJTransported pellets / tonSawdust, input
Truck for dry product (Diese 160 km 13257,4 0,8 0,0 13277,6 0,77Fuel Diesel
Ocean bulk carrier (Fuel oil) 5.000 km 87372,6 1,5 3,6 88130,5 5,12Fuel HFO
Result g CO2,eq 101408,1 5,90
Calculation per conversion
Combustion in CHP Quantity of product Calculated emissionsOutflow materials Yield per ton converted pellets per MJ converted pelletsOutput 1,0 tonConverted pellets / tonTransproted pellets 0,73 tonConverted pellets / tonSawdust, input g CO2 g CH4 g N2O g CO2, eq g CO2, eq
0,98 MJConverted pellets / MJSawdust, input
Outflow energy 12555,08 MJConverted pellets / tonSawdust, input
Electricity 40000 MWhElectricity / year
Useful heat 250000 GJHeat / year
Temperature, Th 90 °CElectrical efficiency, ηel 25,4%Thermal efficiency, ηh 44,0%
Inflow materialsInput 33000,0 tonTransported pellets / year
Inflow energyNatural gas (4000 km, EU M 0,0 MJ / tonTransported pellets 0,0 0,0 0,0 0,0 0,00
Electricity EU mix LV 0,0 kWh / tonTransported pellets 0,0 0,0 0,0 0,0 0,00
EmissionsCO2 0,0 kg / tonTransported pellets 0,0 0,0 0,00
CH4 0,00 kg / tonTransported pellets 0,0 0,0 0,00
N2O 0,00 kg / tonTransported pellets 0,0 0,0 0,00Result g CO2,eq 0,0 0,00
Land use change, including bonus for production on non-agriculture or degraded landel per MJ converted pellets
Not applicable 0,00Result g CO2,eq 0,00
Improved agricultural managementesca per MJ converted pellets
Not applicable 0,00Result g CO2,eq 0,00
CO2 capture and replacementeccr per MJ converted pellets
0 g CO2,eq / MJConverted pellets 0,00Result g CO2,eq 0,00
CO2 capture and geological storageeccs per MJ converted pellets
0 g CO2,eq / MJConverted pellets 0,00Result g CO2,eq 0,00
Total result Quantity of product
Yield 0,73 tonConverted pellets / tonSawdust, input
Yield 12555,08 MJConverted pellets / tonSawdust, input
Total emission without allocation: g CO2,eq / MJConverted pellets 8,03Total emission with allocation adjusted to electrical efficiency: g CO2,eq / MJConverted pellets 19,59Total emission with allocation adjusted to thermal efficiency: g CO2,eq / MJConverted pellets 6,95
Overall GHG emission reduction 90,8%
Product electricity Product heat
Figure 2 - 2 General structure of the format
The pathway
Allocation and
overview results
Data input steps
before conversion
Data input
conversion
Data input
miscaleaneous
Total result
| 4
3 The data entry boxes
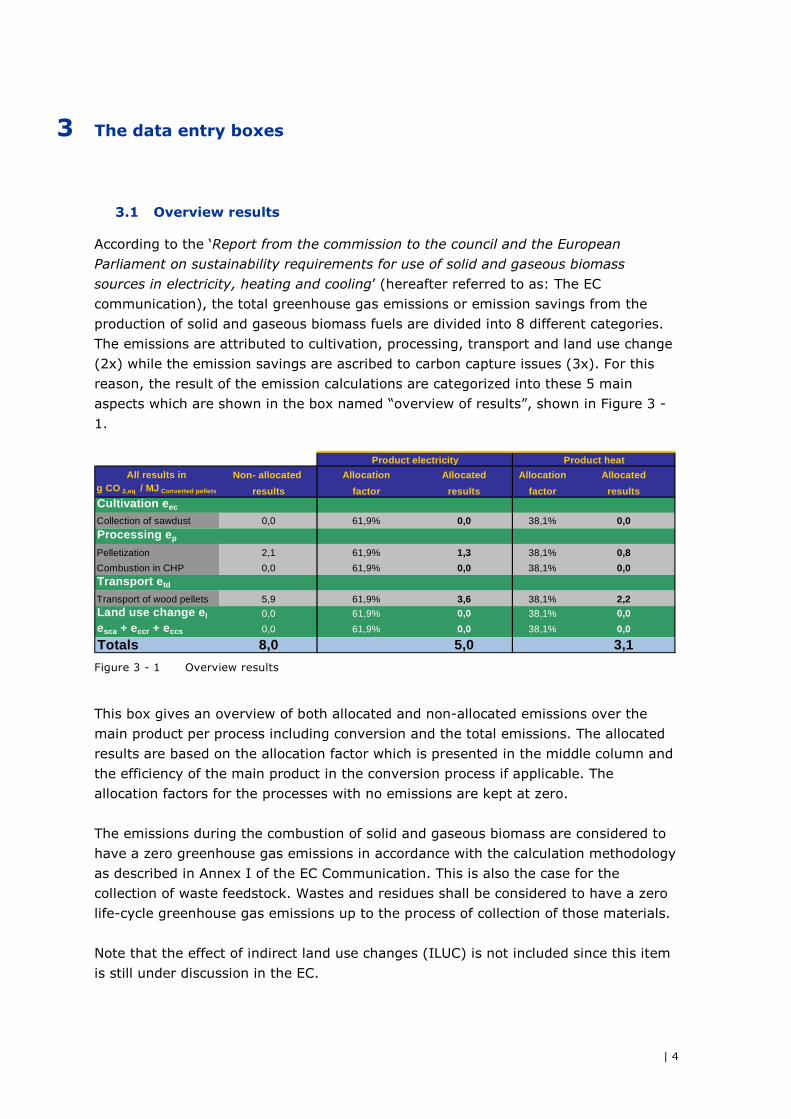
3.1 Overview results
According to the ‘Report from the commission to the council and the European
Parliament on sustainability requirements for use of solid and gaseous biomass
sources in electricity, heating and cooling’ (hereafter referred to as: The EC
communication), the total greenhouse gas emissions or emission savings from the
production of solid and gaseous biomass fuels are divided into 8 different categories.
The emissions are attributed to cultivation, processing, transport and land use change
(2x) while the emission savings are ascribed to carbon capture issues (3x). For this
reason, the result of the emission calculations are categorized into these 5 main
aspects which are shown in the box named “overview of results”, shown in Figure 3 -
1.
All results in Non- allocated Allocation Allocated Allocation Allocatedg CO 2,eq / MJ Converted pellets results factor results factor resultsCultivation eec
Collection of sawdust 0,0 61,9% 0,0 38,1% 0,0Processing ep
Pelletization 2,1 61,9% 1,3 38,1% 0,8
Combustion in CHP 0,0 61,9% 0,0 38,1% 0,0Transport etd
Transport of wood pellets 5,9 61,9% 3,6 38,1% 2,2Land use change el 0,0 61,9% 0,0 38,1% 0,0
esca + eccr + eccs 0,0 61,9% 0,0 38,1% 0,0
Totals 8,0 5,0 3,1
Product electricity Product heat
Figure 3 - 1 Overview results
This box gives an overview of both allocated and non-allocated emissions over the
main product per process including conversion and the total emissions. The allocated
results are based on the allocation factor which is presented in the middle column and
the efficiency of the main product in the conversion process if applicable. The
allocation factors for the processes with no emissions are kept at zero.
The emissions during the combustion of solid and gaseous biomass are considered to
have a zero greenhouse gas emissions in accordance with the calculation methodology
as described in Annex I of the EC Communication. This is also the case for the
collection of waste feedstock. Wastes and residues shall be considered to have a zero
life-cycle greenhouse gas emissions up to the process of collection of those materials.
Note that the effect of indirect land use changes (ILUC) is not included since this item
is still under discussion in the EC.
| 5
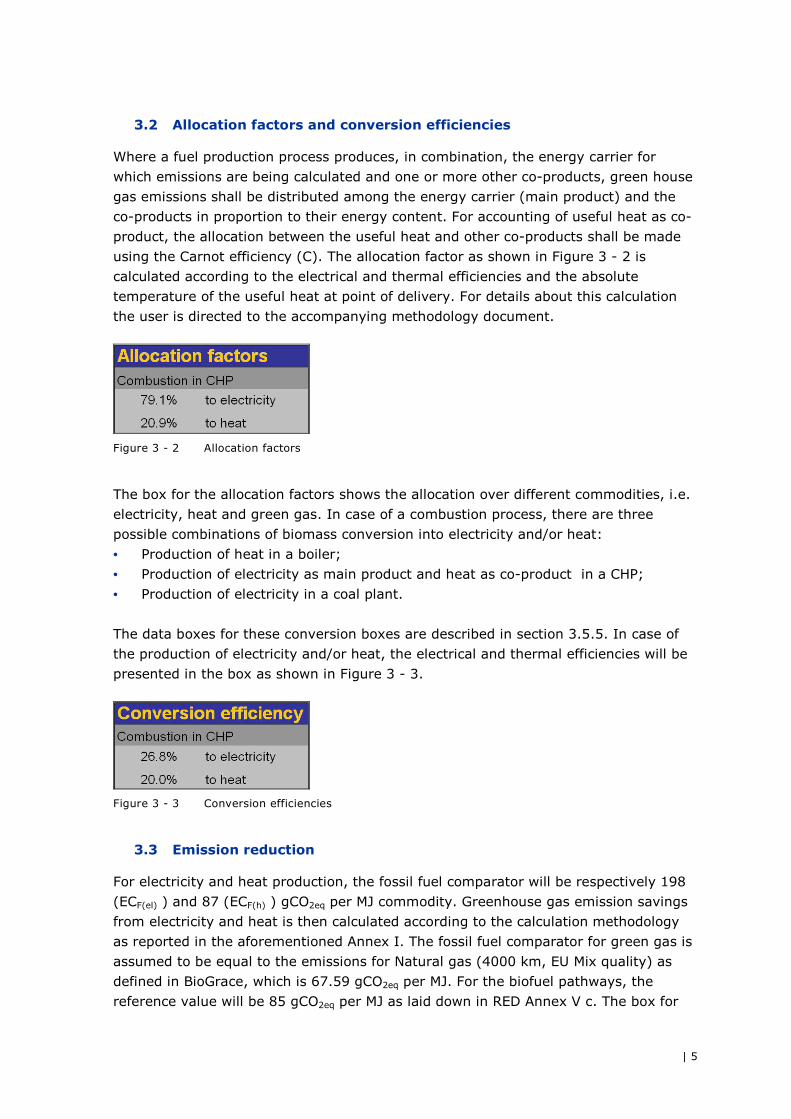
3.2 Allocation factors and conversion efficiencies
Where a fuel production process produces, in combination, the energy carrier for
which emissions are being calculated and one or more other co-products, green house
gas emissions shall be distributed among the energy carrier (main product) and the
co-products in proportion to their energy content. For accounting of useful heat as co-
product, the allocation between the useful heat and other co-products shall be made
using the Carnot efficiency (C). The allocation factor as shown in Figure 3 - 2 is
calculated according to the electrical and thermal efficiencies and the absolute
temperature of the useful heat at point of delivery. For details about this calculation
the user is directed to the accompanying methodology document.
Figure 3 - 2 Allocation factors
The box for the allocation factors shows the allocation over different commodities, i.e.
electricity, heat and green gas. In case of a combustion process, there are three
possible combinations of biomass conversion into electricity and/or heat:
• Production of heat in a boiler;
• Production of electricity as main product and heat as co-product in a CHP;
• Production of electricity in a coal plant.
The data boxes for these conversion boxes are described in section 3.5.5. In case of
the production of electricity and/or heat, the electrical and thermal efficiencies will be
presented in the box as shown in Figure 3 - 3.
Figure 3 - 3 Conversion efficiencies
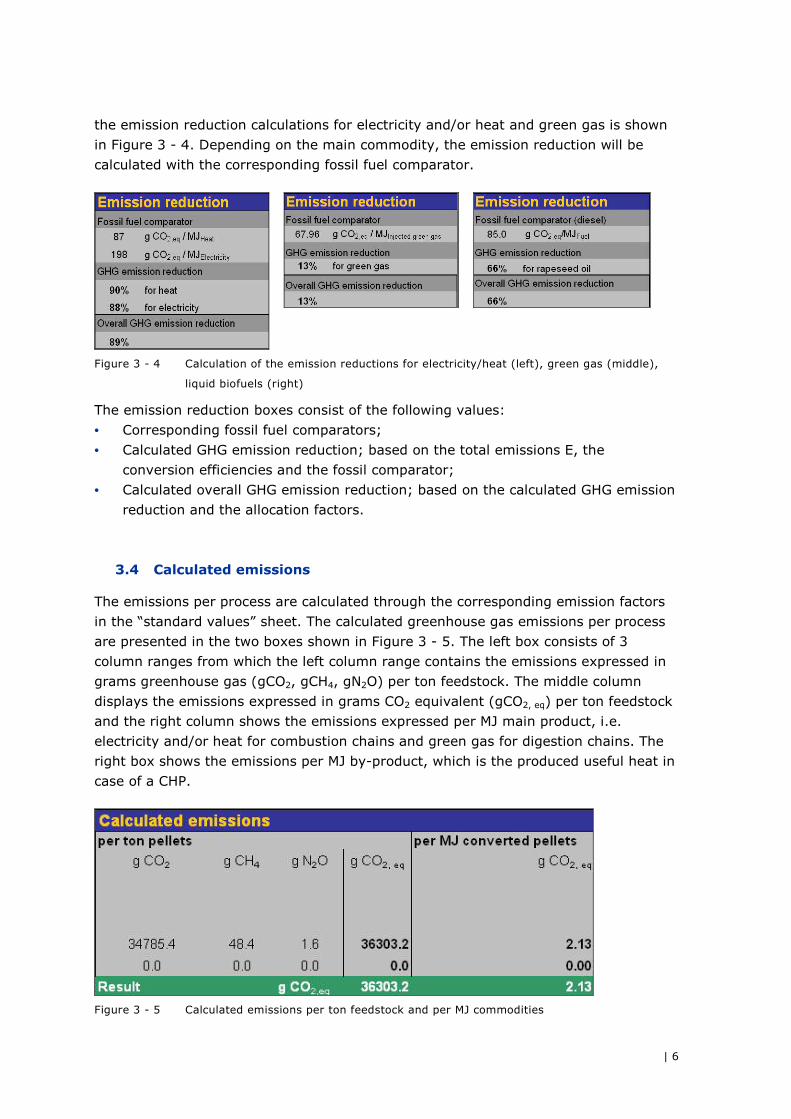
3.3 Emission reduction
For electricity and heat production, the fossil fuel comparator will be respectively 198
(ECF(el) ) and 87 (ECF(h) ) gCO2eq per MJ commodity. Greenhouse gas emission savings
from electricity and heat is then calculated according to the calculation methodology
as reported in the aforementioned Annex I. The fossil fuel comparator for green gas is
assumed to be equal to the emissions for Natural gas (4000 km, EU Mix quality) as
defined in BioGrace, which is 67.59 gCO2eq per MJ. For the biofuel pathways, the
reference value will be 85 gCO2eq per MJ as laid down in RED Annex V c. The box for
| 6
the emission reduction calculations for electricity and/or heat and green gas is shown
in Figure 3 - 4. Depending on the main commodity, the emission reduction will be
calculated with the corresponding fossil fuel comparator.
Figure 3 - 4 Calculation of the emission reductions for electricity/heat (left), green gas (middle),
liquid biofuels (right)
The emission reduction boxes consist of the following values:
• Corresponding fossil fuel comparators;
• Calculated GHG emission reduction; based on the total emissions E, the
conversion efficiencies and the fossil comparator;
• Calculated overall GHG emission reduction; based on the calculated GHG emission
reduction and the allocation factors.
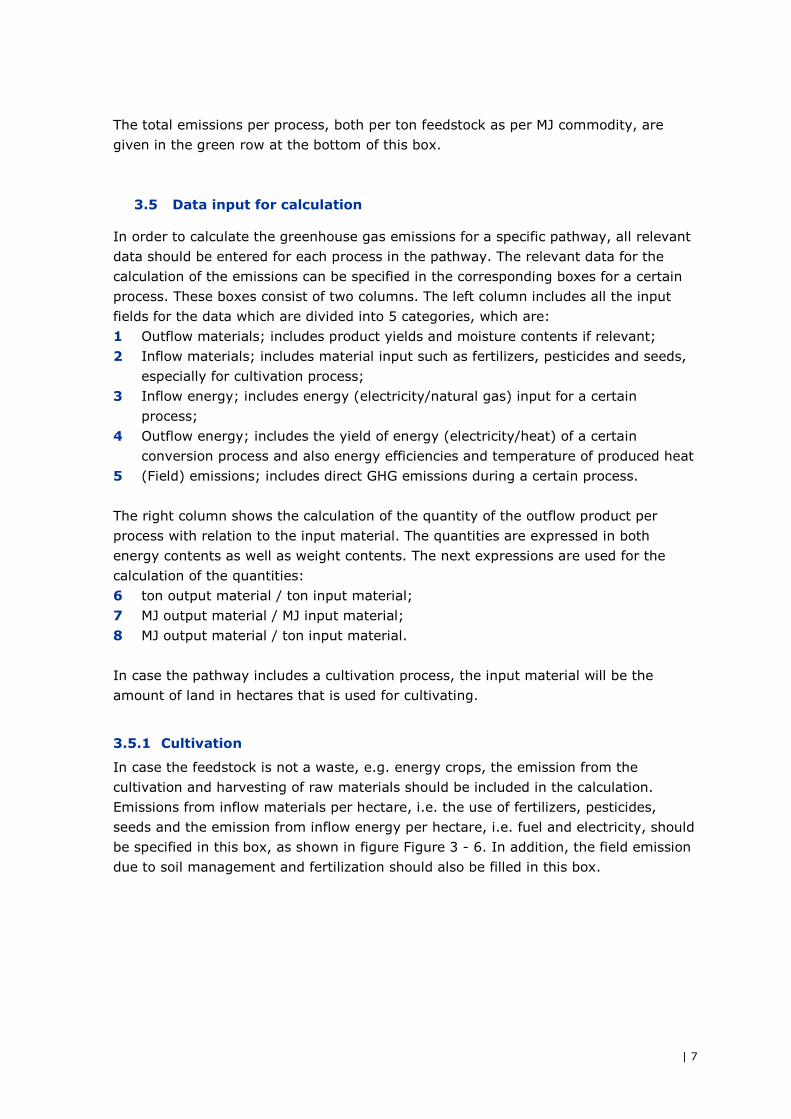
3.4 Calculated emissions
The emissions per process are calculated through the corresponding emission factors
in the “standard values” sheet. The calculated greenhouse gas emissions per process
are presented in the two boxes shown in Figure 3 - 5. The left box consists of 3
column ranges from which the left column range contains the emissions expressed in
grams greenhouse gas (gCO2, gCH4, gN2O) per ton feedstock. The middle column
displays the emissions expressed in grams CO2 equivalent (gCO2, eq) per ton feedstock
and the right column shows the emissions expressed per MJ main product, i.e.
electricity and/or heat for combustion chains and green gas for digestion chains. The
right box shows the emissions per MJ by-product, which is the produced useful heat in
case of a CHP.
Figure 3 - 5 Calculated emissions per ton feedstock and per MJ commodities
| 7
The total emissions per process, both per ton feedstock as per MJ commodity, are
given in the green row at the bottom of this box.
3.5 Data input for calculation
In order to calculate the greenhouse gas emissions for a specific pathway, all relevant
data should be entered for each process in the pathway. The relevant data for the
calculation of the emissions can be specified in the corresponding boxes for a certain
process. These boxes consist of two columns. The left column includes all the input
fields for the data which are divided into 5 categories, which are:
1 Outflow materials; includes product yields and moisture contents if relevant;
2 Inflow materials; includes material input such as fertilizers, pesticides and seeds,
especially for cultivation process;
3 Inflow energy; includes energy (electricity/natural gas) input for a certain
process;
4 Outflow energy; includes the yield of energy (electricity/heat) of a certain
conversion process and also energy efficiencies and temperature of produced heat
5 (Field) emissions; includes direct GHG emissions during a certain process.
The right column shows the calculation of the quantity of the outflow product per
process with relation to the input material. The quantities are expressed in both
energy contents as well as weight contents. The next expressions are used for the
calculation of the quantities:
6 ton output material / ton input material;
7 MJ output material / MJ input material;
8 MJ output material / ton input material.
In case the pathway includes a cultivation process, the input material will be the
amount of land in hectares that is used for cultivating.
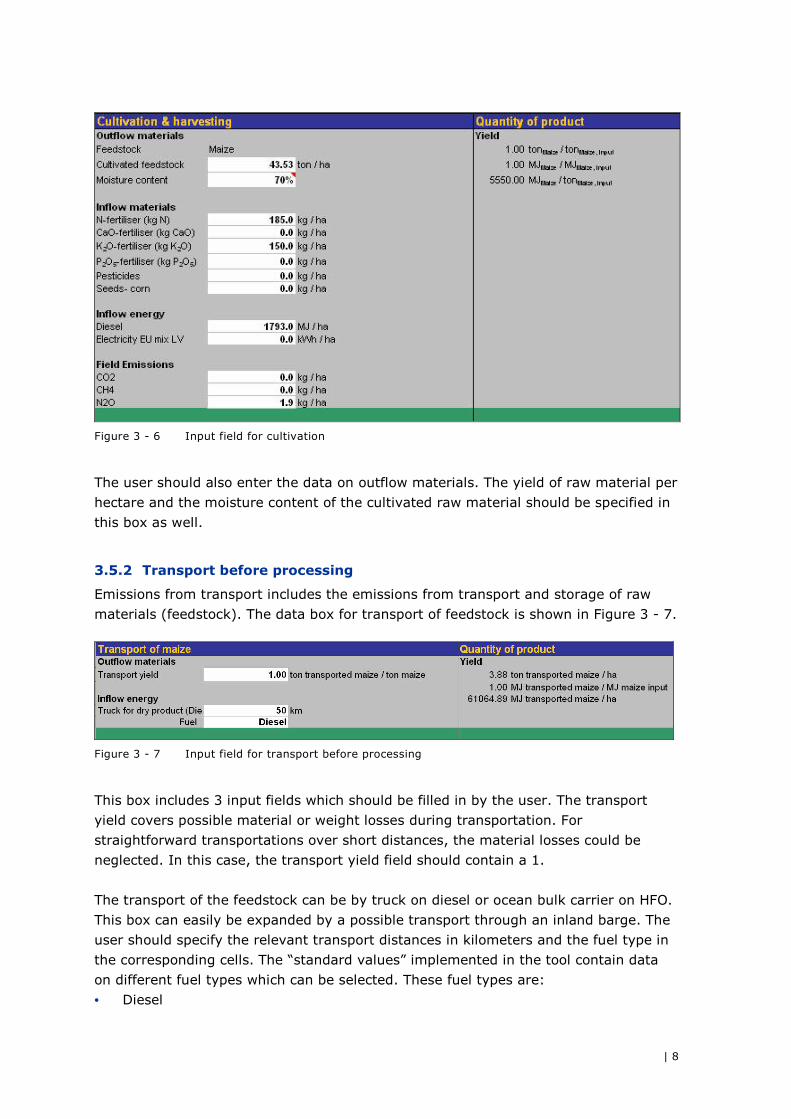
3.5.1 Cultivation
In case the feedstock is not a waste, e.g. energy crops, the emission from the
cultivation and harvesting of raw materials should be included in the calculation.
Emissions from inflow materials per hectare, i.e. the use of fertilizers, pesticides,
seeds and the emission from inflow energy per hectare, i.e. fuel and electricity, should
be specified in this box, as shown in figure Figure 3 - 6. In addition, the field emission
due to soil management and fertilization should also be filled in this box.
| 8
Figure 3 - 6 Input field for cultivation
The user should also enter the data on outflow materials. The yield of raw material per
hectare and the moisture content of the cultivated raw material should be specified in
this box as well.
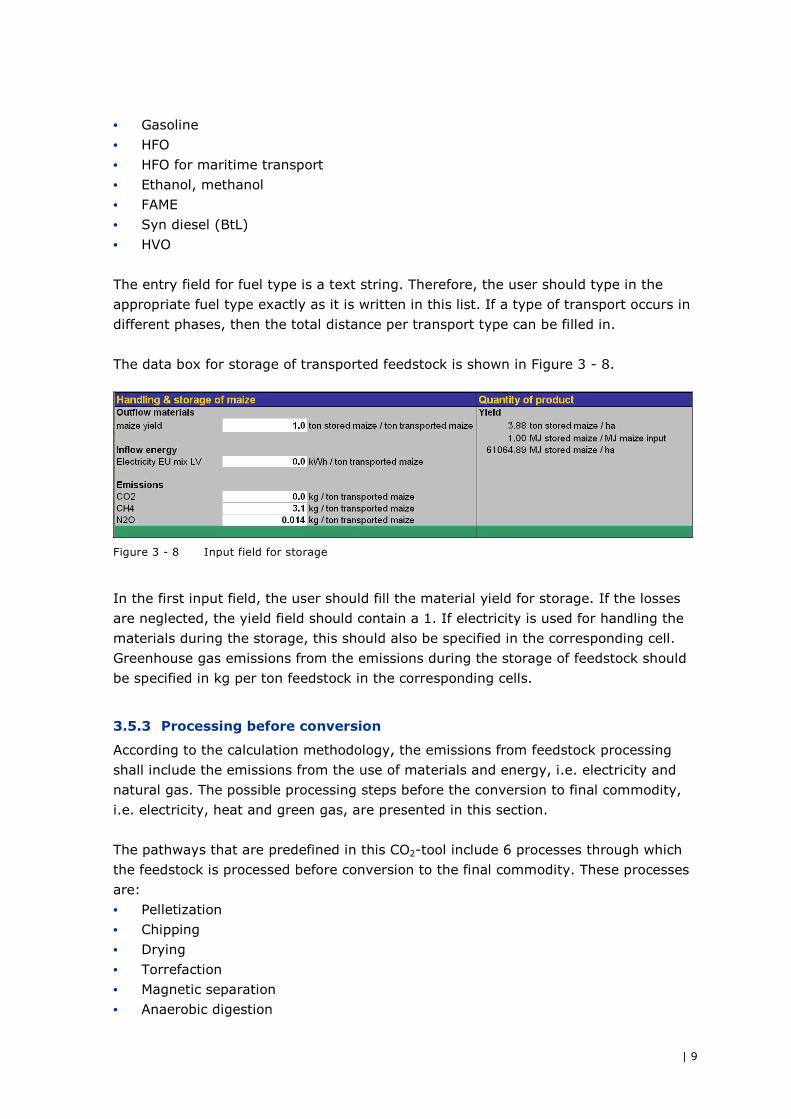
3.5.2 Transport before processing
Emissions from transport includes the emissions from transport and storage of raw
materials (feedstock). The data box for transport of feedstock is shown in Figure 3 - 7.
Figure 3 - 7 Input field for transport before processing
This box includes 3 input fields which should be filled in by the user. The transport
yield covers possible material or weight losses during transportation. For
straightforward transportations over short distances, the material losses could be
neglected. In this case, the transport yield field should contain a 1.
The transport of the feedstock can be by truck on diesel or ocean bulk carrier on HFO.
This box can easily be expanded by a possible transport through an inland barge. The
user should specify the relevant transport distances in kilometers and the fuel type in
the corresponding cells. The “standard values” implemented in the tool contain data
on different fuel types which can be selected. These fuel types are:
• Diesel
| 9
• Gasoline
• HFO
• HFO for maritime transport
• Ethanol, methanol
• FAME
• Syn diesel (BtL)
• HVO
The entry field for fuel type is a text string. Therefore, the user should type in the
appropriate fuel type exactly as it is written in this list. If a type of transport occurs in
different phases, then the total distance per transport type can be filled in.
The data box for storage of transported feedstock is shown in Figure 3 - 8.
Figure 3 - 8 Input field for storage
In the first input field, the user should fill the material yield for storage. If the losses
are neglected, the yield field should contain a 1. If electricity is used for handling the
materials during the storage, this should also be specified in the corresponding cell.
Greenhouse gas emissions from the emissions during the storage of feedstock should
be specified in kg per ton feedstock in the corresponding cells.
3.5.3 Processing before conversion
According to the calculation methodology, the emissions from feedstock processing
shall include the emissions from the use of materials and energy, i.e. electricity and
natural gas. The possible processing steps before the conversion to final commodity,
i.e. electricity, heat and green gas, are presented in this section.
The pathways that are predefined in this CO2-tool include 6 processes through which
the feedstock is processed before conversion to the final commodity. These processes
are:
• Pelletization
• Chipping
• Drying
• Torrefaction
• Magnetic separation
• Anaerobic digestion
| 10
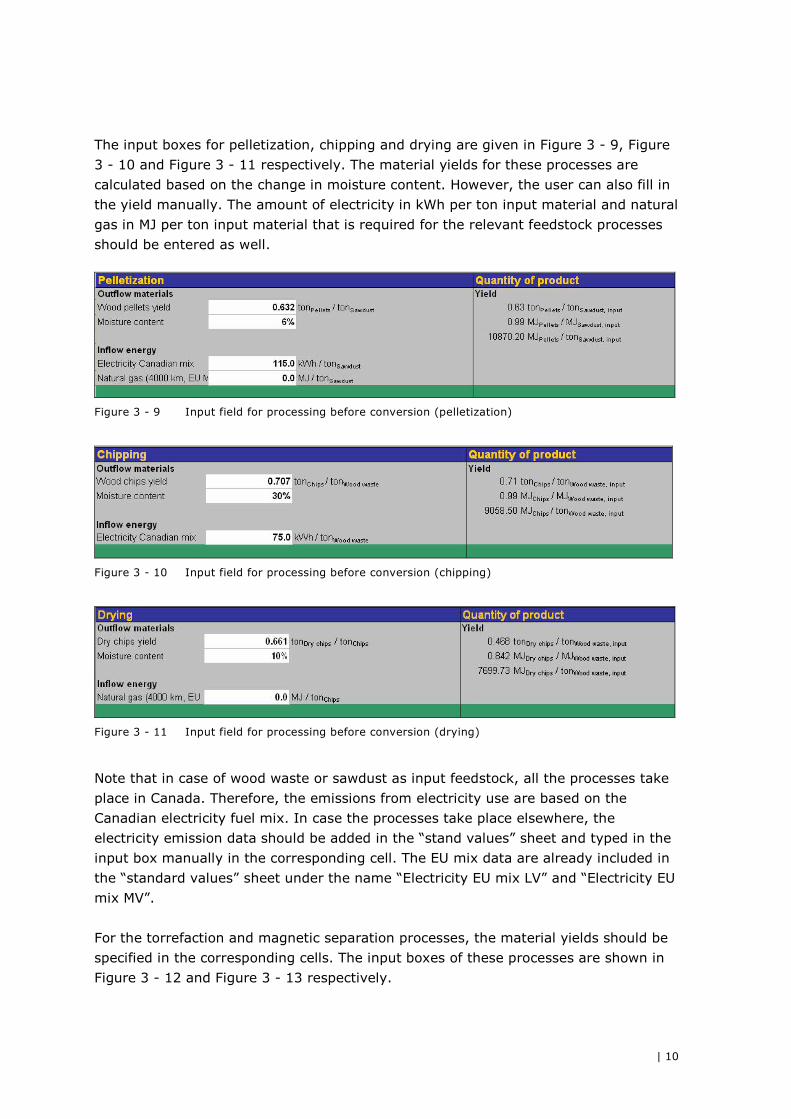
The input boxes for pelletization, chipping and drying are given in Figure 3 - 9, Figure
3 - 10 and Figure 3 - 11 respectively. The material yields for these processes are
calculated based on the change in moisture content. However, the user can also fill in
the yield manually. The amount of electricity in kWh per ton input material and natural
gas in MJ per ton input material that is required for the relevant feedstock processes
should be entered as well.
Figure 3 - 9 Input field for processing before conversion (pelletization)
Figure 3 - 10 Input field for processing before conversion (chipping)
Figure 3 - 11 Input field for processing before conversion (drying)
Note that in case of wood waste or sawdust as input feedstock, all the processes take
place in Canada. Therefore, the emissions from electricity use are based on the
Canadian electricity fuel mix. In case the processes take place elsewhere, the
electricity emission data should be added in the “stand values” sheet and typed in the
input box manually in the corresponding cell. The EU mix data are already included in
the “standard values” sheet under the name “Electricity EU mix LV” and “Electricity EU
mix MV”.
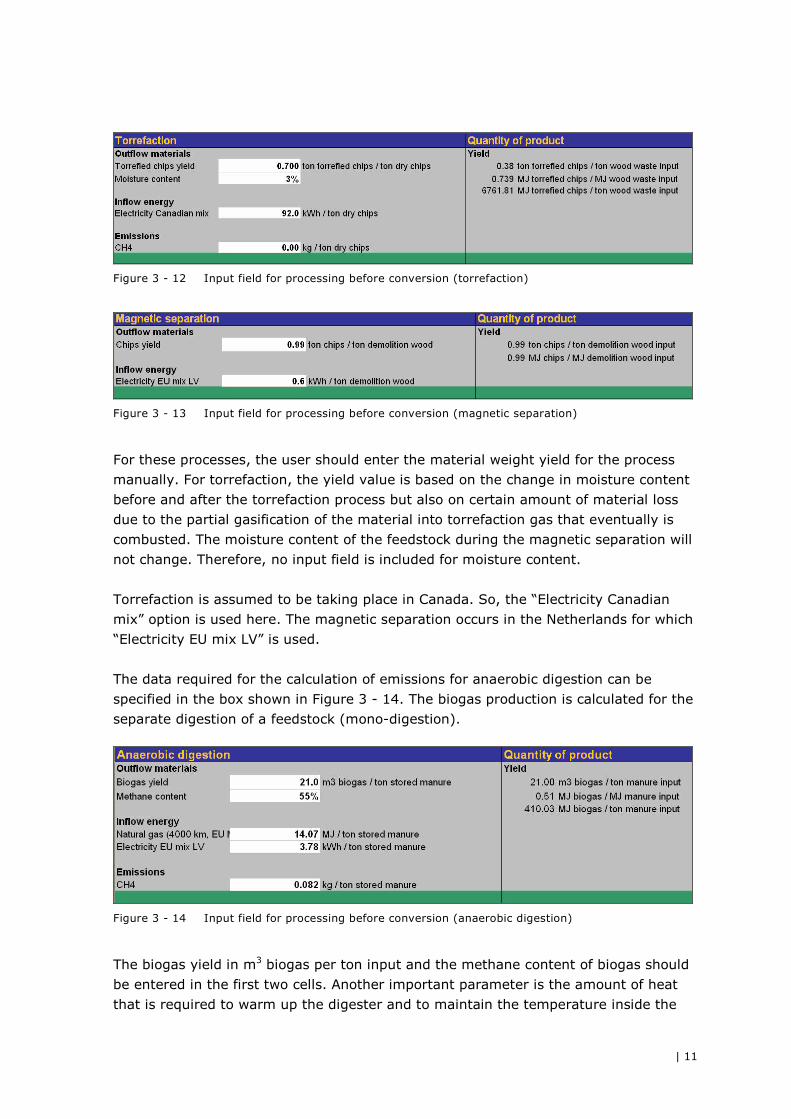
For the torrefaction and magnetic separation processes, the material yields should be
specified in the corresponding cells. The input boxes of these processes are shown in
Figure 3 - 12 and Figure 3 - 13 respectively.
| 11
Figure 3 - 12 Input field for processing before conversion (torrefaction)
Figure 3 - 13 Input field for processing before conversion (magnetic separation)
For these processes, the user should enter the material weight yield for the process
manually. For torrefaction, the yield value is based on the change in moisture content
before and after the torrefaction process but also on certain amount of material loss
due to the partial gasification of the material into torrefaction gas that eventually is
combusted. The moisture content of the feedstock during the magnetic separation will
not change. Therefore, no input field is included for moisture content.
Torrefaction is assumed to be taking place in Canada. So, the “Electricity Canadian
mix” option is used here. The magnetic separation occurs in the Netherlands for which
“Electricity EU mix LV” is used.
The data required for the calculation of emissions for anaerobic digestion can be
specified in the box shown in Figure 3 - 14. The biogas production is calculated for the
separate digestion of a feedstock (mono-digestion).
Figure 3 - 14 Input field for processing before conversion (anaerobic digestion)
The biogas yield in m3 biogas per ton input and the methane content of biogas should
be entered in the first two cells. Another important parameter is the amount of heat
that is required to warm up the digester and to maintain the temperature inside the
| 12
digester. The required heat and electricity for the digester should be specified in MJ
per ton input and kWh per ton input respectively.
During the digestion process, certain amount of methane will leak from the digester.
The emissions due to methane leakage in kg per ton input should be entered in the
corresponding cell.
In practice, often co-digestion of combinations of substrates is applied. In order to
calculate biogas production of co-digestion of substrates, a linear relationship between
the amount of biogas production and amount of digested substrates is assumed. In
other words, the biogas production of the digestion of a combination of substrates is
the sum of the biogas production of the digestion of the separate substrates. This
assumption is a simplification of reality. For example, if the materials are very
different in composition of readily degradable matter this linear relationship might not
hold. However, if the retention time of the material in the digester is large one might
assume that the potential biogas production may be reached. In these cases the
assumption of a linear relationship is acceptable.
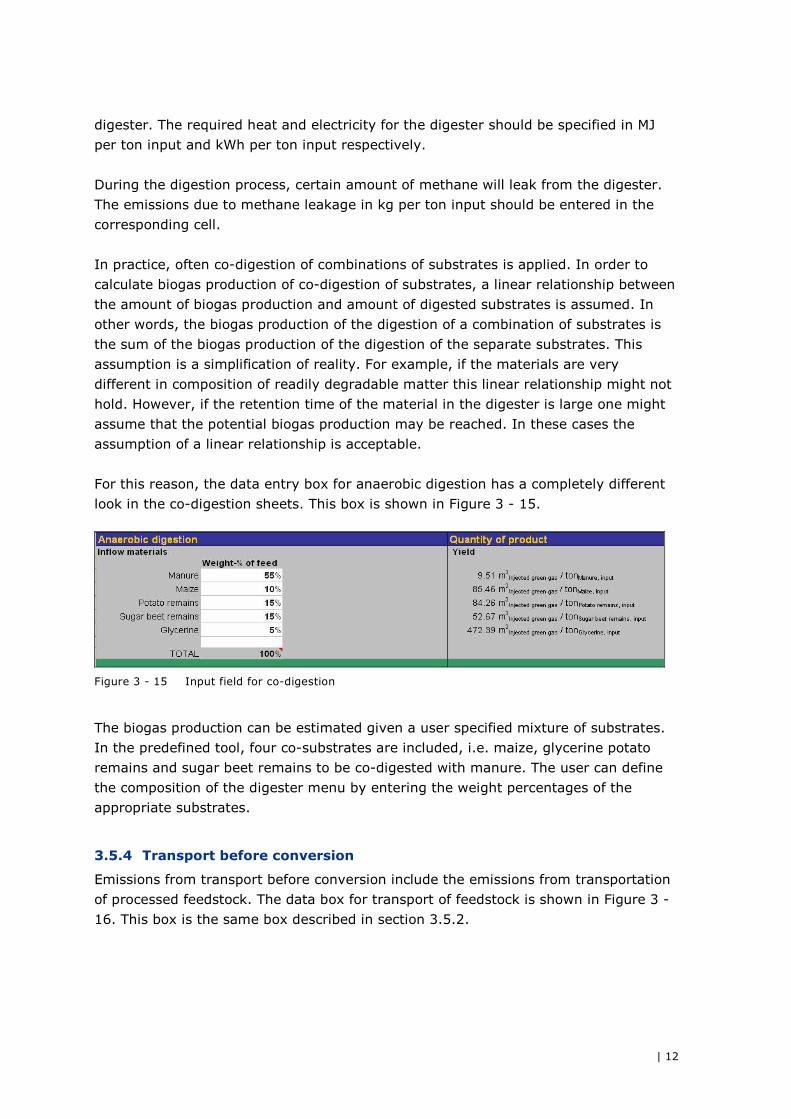
For this reason, the data entry box for anaerobic digestion has a completely different
look in the co-digestion sheets. This box is shown in Figure 3 - 15.
Figure 3 - 15 Input field for co-digestion
The biogas production can be estimated given a user specified mixture of substrates.
In the predefined tool, four co-substrates are included, i.e. maize, glycerine potato
remains and sugar beet remains to be co-digested with manure. The user can define
the composition of the digester menu by entering the weight percentages of the
appropriate substrates.
3.5.4 Transport before conversion
Emissions from transport before conversion include the emissions from transportation
of processed feedstock. The data box for transport of feedstock is shown in Figure 3 -
16. This box is the same box described in section 3.5.2.
| 13
Figure 3 - 16 Input field for transport before conversion
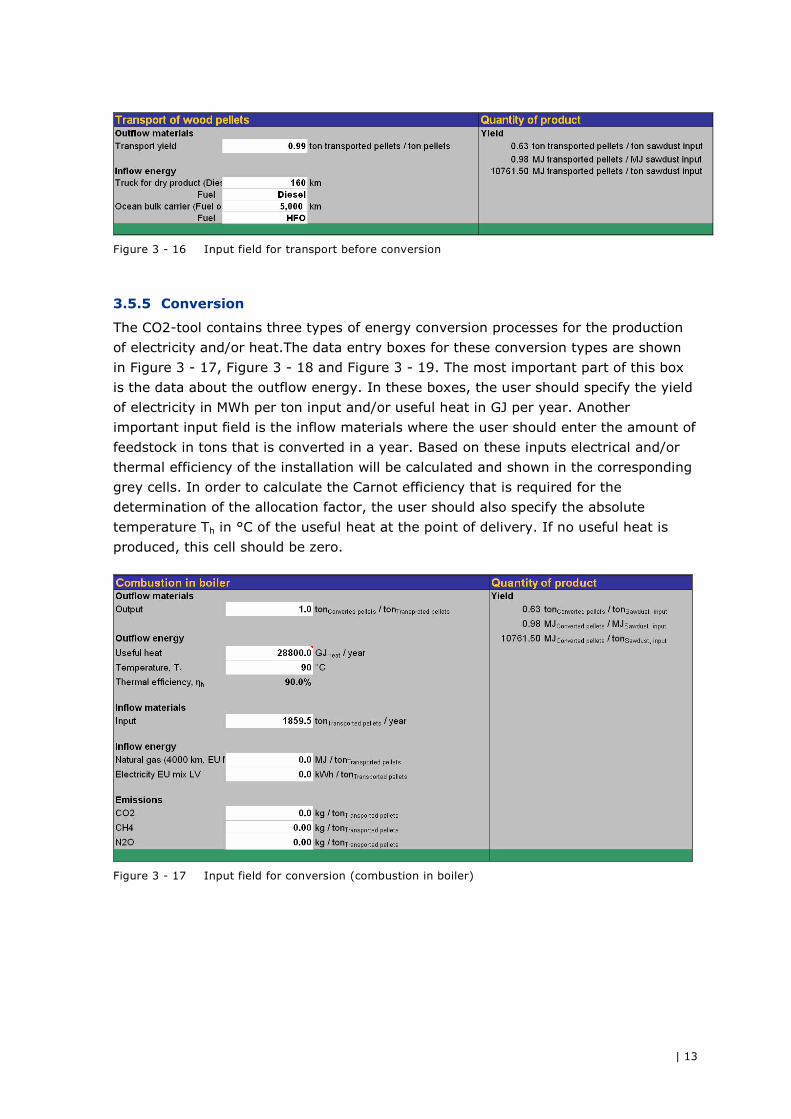
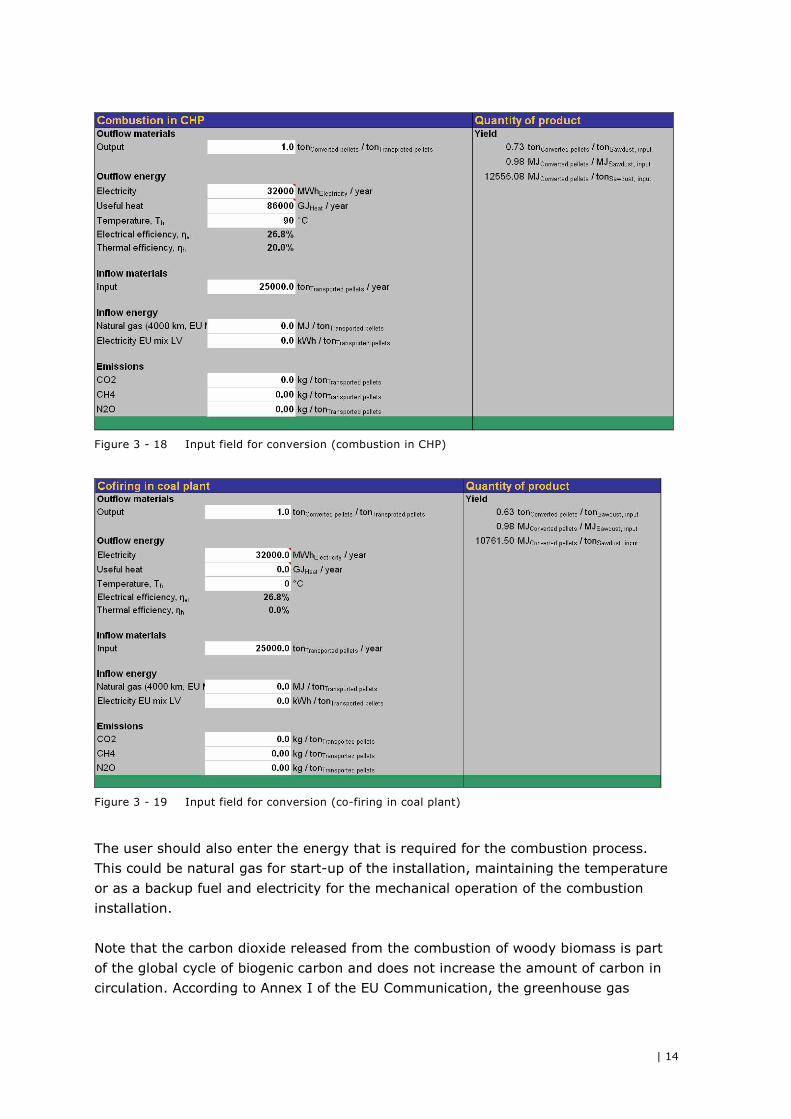
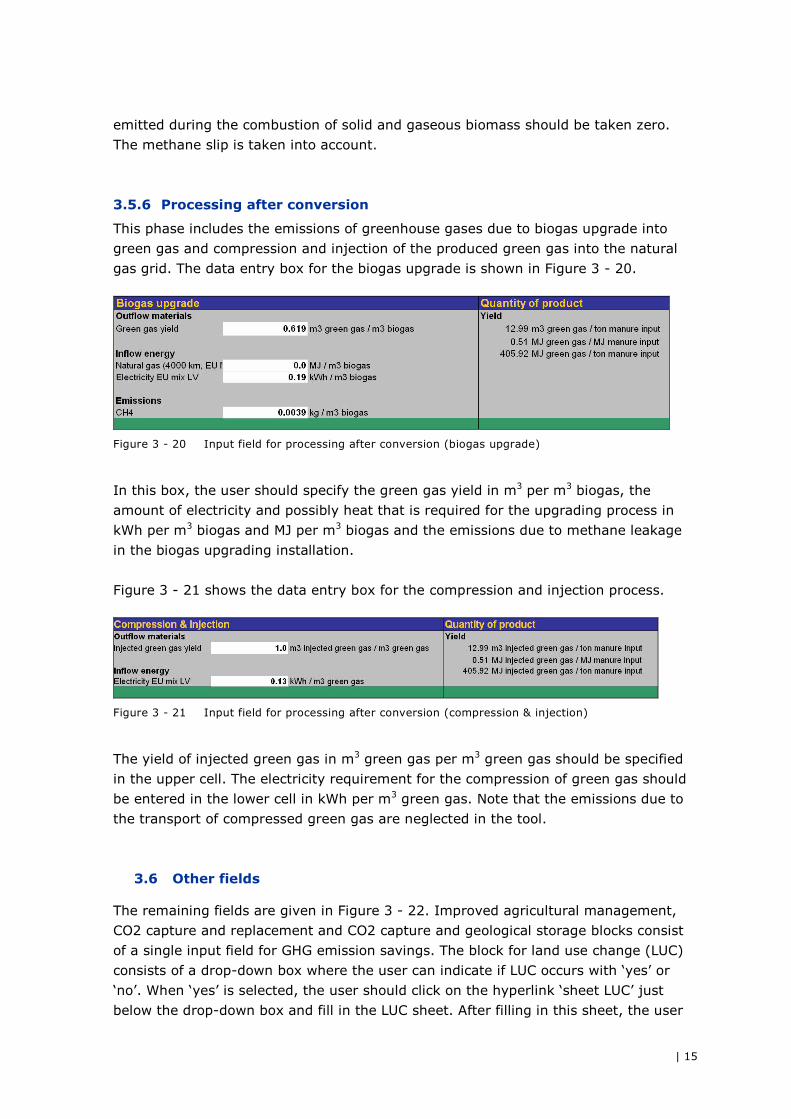
3.5.5 Conversion
The CO2-tool contains three types of energy conversion processes for the production
of electricity and/or heat.The data entry boxes for these conversion types are shown
in Figure 3 - 17, Figure 3 - 18 and Figure 3 - 19. The most important part of this box
is the data about the outflow energy. In these boxes, the user should specify the yield
of electricity in MWh per ton input and/or useful heat in GJ per year. Another
important input field is the inflow materials where the user should enter the amount of
feedstock in tons that is converted in a year. Based on these inputs electrical and/or
thermal efficiency of the installation will be calculated and shown in the corresponding
grey cells. In order to calculate the Carnot efficiency that is required for the
determination of the allocation factor, the user should also specify the absolute
temperature Th in °C of the useful heat at the point of delivery. If no useful heat is
produced, this cell should be zero.
Figure 3 - 17 Input field for conversion (combustion in boiler)
| 14
Figure 3 - 18 Input field for conversion (combustion in CHP)
Figure 3 - 19 Input field for conversion (co-firing in coal plant)
The user should also enter the energy that is required for the combustion process.
This could be natural gas for start-up of the installation, maintaining the temperature
or as a backup fuel and electricity for the mechanical operation of the combustion
installation.
Note that the carbon dioxide released from the combustion of woody biomass is part
of the global cycle of biogenic carbon and does not increase the amount of carbon in
circulation. According to Annex I of the EU Communication, the greenhouse gas
| 15
emitted during the combustion of solid and gaseous biomass should be taken zero.
The methane slip is taken into account.
3.5.6 Processing after conversion
This phase includes the emissions of greenhouse gases due to biogas upgrade into
green gas and compression and injection of the produced green gas into the natural
gas grid. The data entry box for the biogas upgrade is shown in Figure 3 - 20.
Figure 3 - 20 Input field for processing after conversion (biogas upgrade)
In this box, the user should specify the green gas yield in m3 per m3 biogas, the
amount of electricity and possibly heat that is required for the upgrading process in
kWh per m3 biogas and MJ per m3 biogas and the emissions due to methane leakage
in the biogas upgrading installation.
Figure 3 - 21 shows the data entry box for the compression and injection process.
Figure 3 - 21 Input field for processing after conversion (compression & injection)
The yield of injected green gas in m3 green gas per m3 green gas should be specified
in the upper cell. The electricity requirement for the compression of green gas should
be entered in the lower cell in kWh per m3 green gas. Note that the emissions due to
the transport of compressed green gas are neglected in the tool.
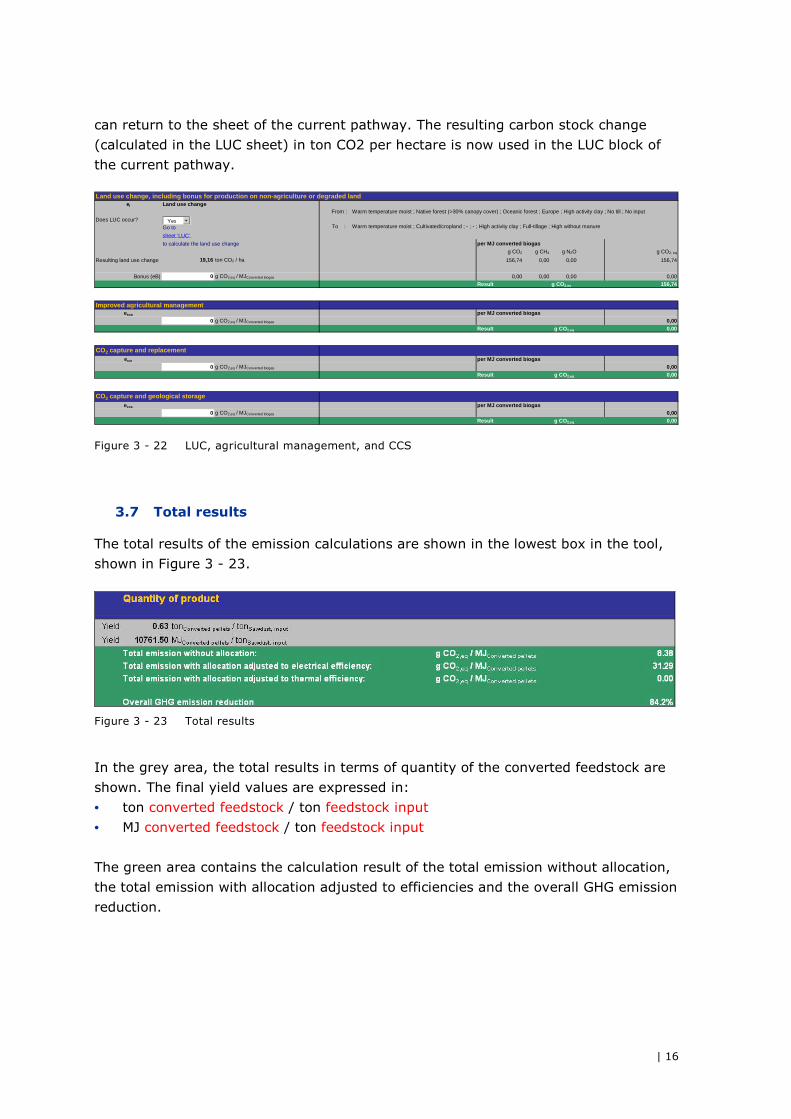
3.6 Other fields
The remaining fields are given in Figure 3 - 22. Improved agricultural management,
CO2 capture and replacement and CO2 capture and geological storage blocks consist
of a single input field for GHG emission savings. The block for land use change (LUC)
consists of a drop-down box where the user can indicate if LUC occurs with ‘yes’ or
‘no’. When ‘yes’ is selected, the user should click on the hyperlink ‘sheet LUC’ just
below the drop-down box and fill in the LUC sheet. After filling in this sheet, the user
| 16
can return to the sheet of the current pathway. The resulting carbon stock change
(calculated in the LUC sheet) in ton CO2 per hectare is now used in the LUC block of
the current pathway.
Land use change, including bonus for production on non-agriculture or degraded land
el Land use change
Yes From :
Does LUC occur? No
Go to To :
sheet 'LUC'
to calculate the land use change per MJ converted biogas
g CO2 g CH4 g N2O g CO2, eq
Resulting land use change 19,16 ton CO2 / ha 156,74 0,00 0,00 156,74
Bonus (eB) 0 g CO2,eq / MJConverted biogas 0,00 0,00 0,00 0,00Result g CO2,eq 156,74
Improved agricultural managementesca per MJ converted biogas
0 g CO2,eq / MJConverted biogas 0,00Result g CO2,eq 0,00
CO2 capture and replacementeccr per MJ converted biogas
0 g CO2,eq / MJConverted biogas 0,00Result g CO2,eq 0,00
CO2 capture and geological storageeccs per MJ converted biogas
0 g CO2,eq / MJConverted biogas 0,00Result g CO2,eq 0,00
Warm temperature moist ; Cultivated/cropland ; - ; - ; High activity clay ; Full-tillage ; High without manure
Warm temperature moist ; Native forest (>30% canopy cover) ; Oceanic forest ; Europe ; High activity clay ; No till ; No input
Yes
Figure 3 - 22 LUC, agricultural management, and CCS
3.7 Total results
The total results of the emission calculations are shown in the lowest box in the tool,
shown in Figure 3 - 23.
Figure 3 - 23 Total results
In the grey area, the total results in terms of quantity of the converted feedstock are
shown. The final yield values are expressed in:
• ton converted feedstock / ton feedstock input
• MJ converted feedstock / ton feedstock input
The green area contains the calculation result of the total emission without allocation,
the total emission with allocation adjusted to efficiencies and the overall GHG emission
reduction.
| 17
4 Adapting parameters and pathways
The CO2-tool was created in spreadsheet programme Excel and contains no macro’s,
Visual Basic code or Wizards. Therfore there are no warnings for out of range inputs
and most cells are not protected. As a consequence, the tool is only suitable for users
with a basic understanding of greenhouse calculations. On the other hand, the simple
structure and the lack of macro’s makes the tool transparent and easy to adapt. For
adding parameters or steps in a pathway, only a basic understanding of spreadsheets
is required. Below we describe how a pathway can be changed.
Changing a parameter
All parameters with a white background can be changed by simple overwriting the
current value.
Adding a new parameter
A new input parameter can be added by inserting a new row. For example, when in
the Wood pellet – boiler pathway, in the box Pelletization also diesel is used:
• Select row 35 (the one with Natural gas) • Choose: Insert � rows
• In column A from the new row, type: Diesel (note that this should be in the list of
parameter on the tab ‘Standard values’)
• Type the unit in column C. This is always in MJ / output of the current step
(except for electricity where kWh’s are used instead of MJ’s)
• Type the value in column B
• Copy the formulas from cells I36 through N36 one row up
Warnings:
• When the parameter in column B is not in the list of the tab ‘Standard values’,
Excel will show an error message
• Please note that all fuels are in MJ except for electricity; this is in kWh. This is
converted to MJ’s in the formula’s in columns I, J and K. In the abovementioned
example, copying the formulas from row 34 down instead of from 36 up, would
have had resulted in an incorrect equation
Adding a new step in a pathway
A new step can be added by copying an excising step. One should be cautious for the
same issues as mentioned at ‘Adding a new parameter’. In addition to that, it is
necessary to complete the summation with the final value of the new box. For
example: in the Wood pellet – boiler pathway, the summation is in cell M103 (Total
emissions without allocation). This summation should be completed with the sum of
the new box (bottom cell in column N of the new box).
Appendix A gives an elaborate example of adding a step. One should understand that
adding a step requires an in-depth understanding of the calculation sheets.
| 18
Appendix A Example of adding a new step
In this appendix we explain how to add a step in a pathway by an illustrated example.
We take the pathway of wood pellets in a CHP where we add a transport step (100 km
by truck) between the collection of sawdust and pelletization. This can be a real case
situation when sawdust from small sawmills are collected to a large centralized pellet
plant.
We tried to limit the reference to row numbers in the text below since these easily
change when a sheet is adapted.
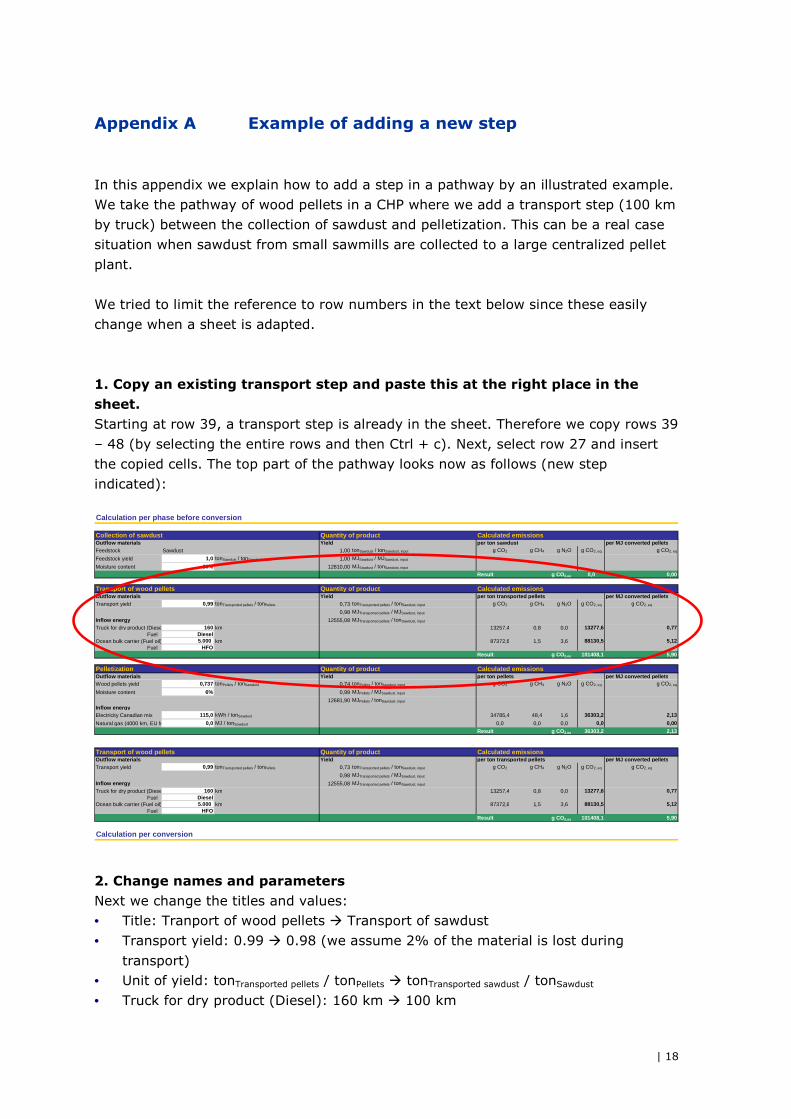
1. Copy an existing transport step and paste this at the right place in the sheet. Starting at row 39, a transport step is already in the sheet. Therefore we copy rows 39
– 48 (by selecting the entire rows and then Ctrl + c). Next, select row 27 and insert
the copied cells. The top part of the pathway looks now as follows (new step
indicated):
Calculation per phase before conversion
Collection of sawdust Quantity of product Calculated emissionsOutflow materials Yield per ton sawdust per MJ converted pelletsFeedstock Sawdust 1,00 tonSawdust / tonSawdust, input g CO2 g CH4 g N2O g CO2, eq g CO2, eq
Feedstock yield 1,0 tonSawdust / tonSawdust, input 1,00 MJSawdust / MJSawdust, input
Moisture content 30% 12810,00 MJSawdust / tonSawdust, input
Result g CO2,eq 0,0 0,00
Transport of wood pellets Quantity of product Calculated emissionsOutflow materials Yield per ton transported pellets per MJ converted pelletsTransport yield 0,99 tonTransported pellets / tonPellets 0,73 tonTransported pellets / tonSawdust, input g CO2 g CH4 g N2O g CO2, eq g CO2, eq
0,98 MJTransported pellets / MJSawdust, input
Inflow energy 12555,08 MJTransported pellets / tonSawdust, input
Truck for dry product (Diese 160 km 13257,4 0,8 0,0 13277,6 0,77Fuel Diesel
Ocean bulk carrier (Fuel oil) 5.000 km 87372,6 1,5 3,6 88130,5 5,12Fuel HFO
Result g CO2,eq 101408,1 5,90
Pelletization Quantity of product Calculated emissionsOutflow materials Yield per ton pellets per MJ converted pelletsWood pellets yield 0,737 tonPellets / tonSawdust 0,74 tonPellets / tonSawdust, input g CO2 g CH4 g N2O g CO2, eq g CO2, eq
Moisture content 6% 0,99 MJPellets / MJSawdust, input
12681,90 MJPellets / tonSawdust, input
Inflow energyElectricity Canadian mix 115,0 kWh / tonSawdust 34785,4 48,4 1,6 36303,2 2,13
Natural gas (4000 km, EU M 0,0 MJ / tonSawdust 0,0 0,0 0,0 0,0 0,00
Result g CO2,eq 36303,2 2,13
Transport of wood pellets Quantity of product Calculated emissionsOutflow materials Yield per ton transported pellets per MJ converted pelletsTransport yield 0,99 tonTransported pellets / tonPellets 0,73 tonTransported pellets / tonSawdust, input g CO2 g CH4 g N2O g CO2, eq g CO2, eq
0,98 MJTransported pellets / MJSawdust, input
Inflow energy 12555,08 MJTransported pellets / tonSawdust, input
Truck for dry product (Diese 160 km 13257,4 0,8 0,0 13277,6 0,77Fuel Diesel
Ocean bulk carrier (Fuel oil) 5.000 km 87372,6 1,5 3,6 88130,5 5,12Fuel HFO
Result g CO2,eq 101408,1 5,90
Calculation per conversion
2. Change names and parameters Next we change the titles and values: • Title: Tranport of wood pellets � Transport of sawdust
• Transport yield: 0.99 � 0.98 (we assume 2% of the material is lost during
transport) • Unit of yield: tonTransported pellets / tonPellets � tonTransported sawdust / tonSawdust
• Truck for dry product (Diesel): 160 km � 100 km
| 19
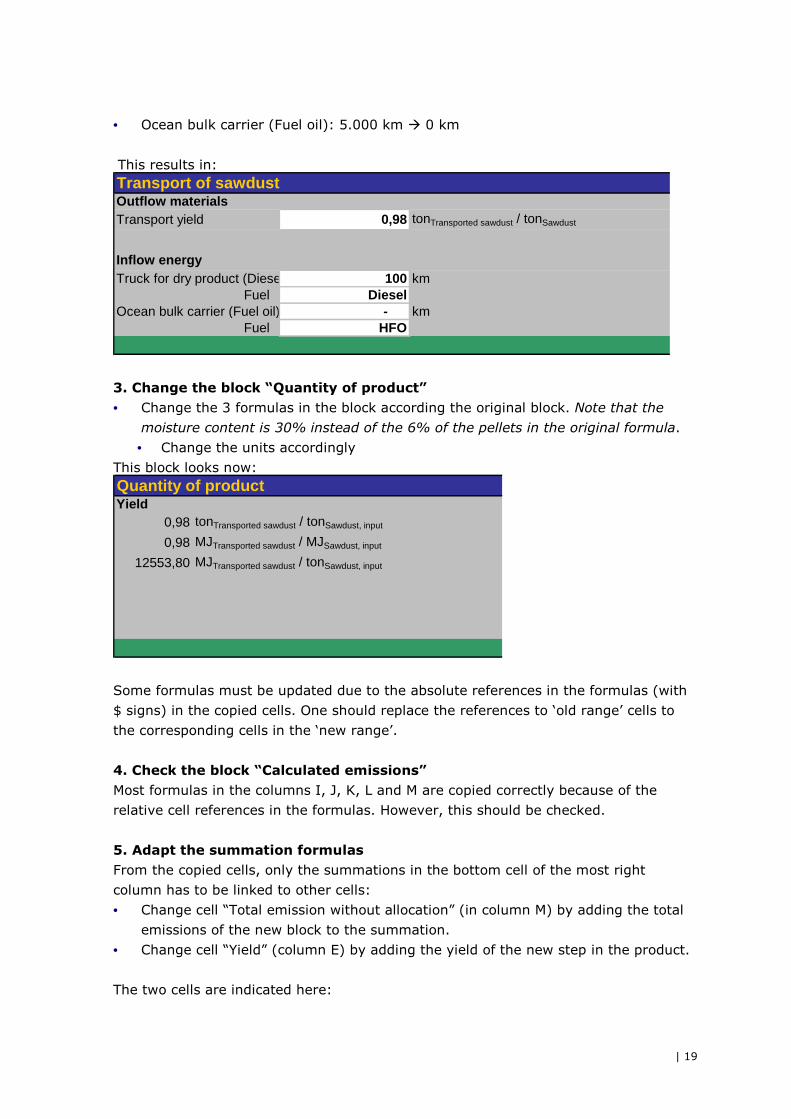
• Ocean bulk carrier (Fuel oil): 5.000 km � 0 km
This results in: Transport of sawdustOutflow materialsTransport yield 0,98 tonTransported sawdust / tonSawdust
Inflow energyTruck for dry product (Diese 100 km
Fuel DieselOcean bulk carrier (Fuel oil) - km
Fuel HFO
3. Change the block “Quantity of product”
• Change the 3 formulas in the block according the original block. Note that the
moisture content is 30% instead of the 6% of the pellets in the original formula.
• Change the units accordingly
This block looks now: Quantity of productYield
0,98 tonTransported sawdust / tonSawdust, input
0,98 MJTransported sawdust / MJSawdust, input
12553,80 MJTransported sawdust / tonSawdust, input
Some formulas must be updated due to the absolute references in the formulas (with
$ signs) in the copied cells. One should replace the references to ‘old range’ cells to
the corresponding cells in the ‘new range’.
4. Check the block “Calculated emissions” Most formulas in the columns I, J, K, L and M are copied correctly because of the
relative cell references in the formulas. However, this should be checked.
5. Adapt the summation formulas From the copied cells, only the summations in the bottom cell of the most right
column has to be linked to other cells:
• Change cell “Total emission without allocation” (in column M) by adding the total
emissions of the new block to the summation.
• Change cell “Yield” (column E) by adding the yield of the new step in the product.
The two cells are indicated here:
| 20
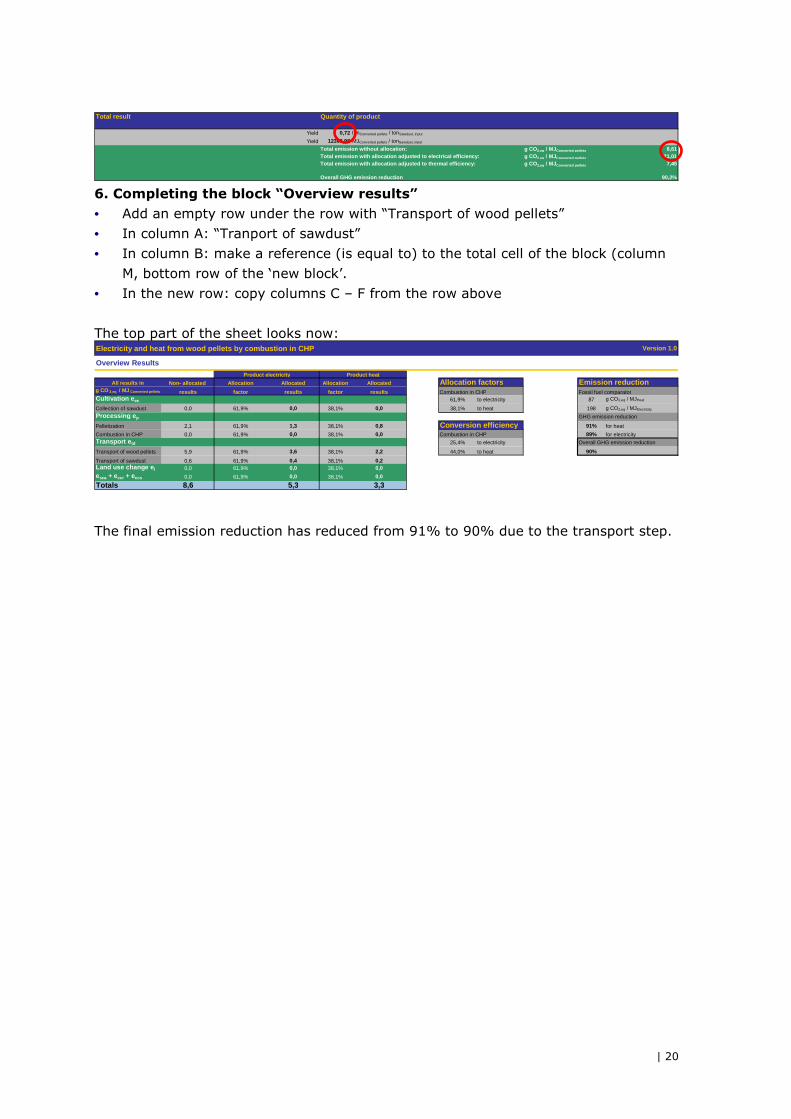
Total result Quantity of product
Yield 0,72 tonConverted pellets / tonSawdust, input
Yield 12303,98 MJConverted pellets / tonSawdust, input
Total emission without allocation: g CO2,eq / MJConverted pellets 8,61Total emission with allocation adjusted to electrical efficiency: g CO2,eq / MJConverted pellets 21,01Total emission with allocation adjusted to thermal efficiency: g CO2,eq / MJConverted pellets 7,45
Overall GHG emission reduction 90,2%
6. Completing the block “Overview results”
• Add an empty row under the row with “Transport of wood pellets”
• In column A: “Tranport of sawdust”
• In column B: make a reference (is equal to) to the total cell of the block (column
M, bottom row of the ‘new block’.
• In the new row: copy columns C – F from the row above
The top part of the sheet looks now: Electricity and heat from wood pellets by combustion in CHP Version 1.0
Overview Results
All results in Non- allocated Allocation Allocated Allocation Allocated Allocation factors Emission reductiong CO 2,eq / MJ Converted pellets results factor results factor results Combustion in CHP Fossil fuel comparatorCultivation eec 61,9% to electricity 87 g CO2,eq / MJHeat
Collection of sawdust 0,0 61,9% 0,0 38,1% 0,0 38,1% to heat 198 g CO2,eq / MJElectricity
Processing ep GHG emission reduction
Pelletization 2,1 61,9% 1,3 38,1% 0,8 Conversion efficiency 91% for heat
Combustion in CHP 0,0 61,9% 0,0 38,1% 0,0 Combustion in CHP 89% for electricityTransport etd 25,4% to electricity Overall GHG emission reduction
Transport of wood pellets 5,9 61,9% 3,6 38,1% 2,2 44,0% to heat 90%
Transport of sawdust 0,6 61,9% 0,4 38,1% 0,2Land use change el 0,0 61,9% 0,0 38,1% 0,0
esca + eccr + eccs 0,0 61,9% 0,0 38,1% 0,0
Totals 8,6 5,3 3,3
Product electricity Product heat
The final emission reduction has reduced from 91% to 90% due to the transport step.

| 21