Plant-Based Food Retail Market Overview - GFI
70
Copyright 2020 Good Food Institute. All rights reserved. Plant-Based Food Retail Market Overview Presented by: Caroline Bushnell & Kyle Gaan
Transcript of Plant-Based Food Retail Market Overview - GFI
Copyright 2020 Good Food Institute. All rights reserved.
Plant-Based Food Retail Market OverviewPresented by: Caroline Bushnell & Kyle Gaan

Presenters for today’s webinar
gfi.org | Page 2
Caroline BushnellAssociate Director, Corporate [email protected]
Kyle GaanResearch Analyst

The Good Food Institute
Accelerating the shift to a sustainable, healthy, and just food system through three key areas of work:
We act as a force multiplier, bringing the expertise of our departments to the rest of the world.
Science and TechnologyAdvancing and open-sourcing the foundational science of plant-based and cultivated meat
Corporate EngagementConsulting with the world’s biggest food companies to help them capitalize on opportunities in the plant-based market
PolicyAdvocating for fair regulation of plant-based and cultivated meat and lobbying for governmental investment in sustainable protein R&D
UNITED STATESBRAZILINDIAISRAEL
EUROPEASIA PACIFIC
90+ staff in 6 countries
GFI officially earned GuideStar’s 2019 Platinum Seal of Transparency -obtained by less than 1% of nonprofits, reflecting our commitment to maximum impact, efficacy, and transparency.
How will we feed 10 billion people by 2050?
Sustainably Efficiently Safely
gfi.org | Page 4
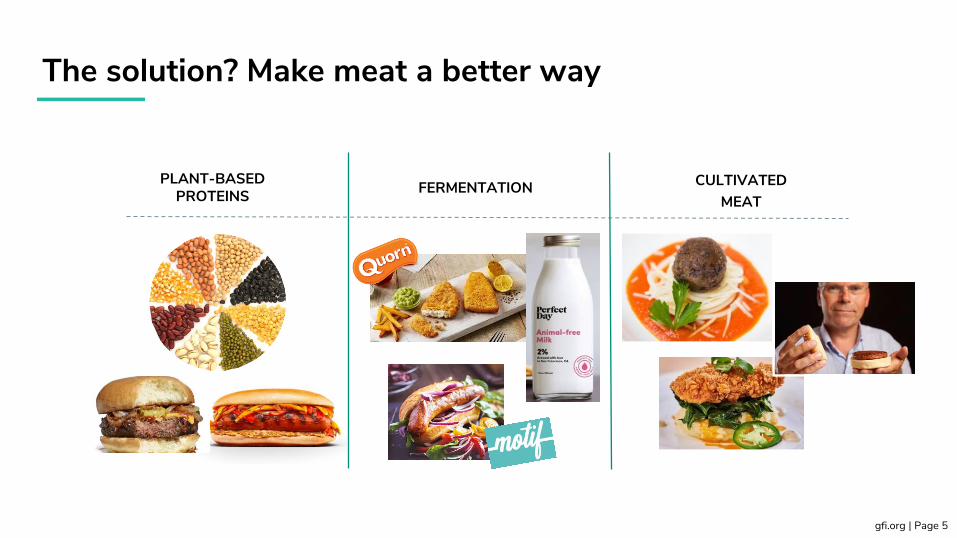
The solution? Make meat a better way
gfi.org | Page 5
CULTIVATEDMEAT
FERMENTATIONPLANT-BASED PROTEINS

GFI services
• Global & regional market overviews• Syndicated retail sales data• Industry mapping• Primary consumer research
• Consumer trends and insights• Innovation guidance• Menu and merchandising strategy• Product marketing & positioning
• Plant-based & cultivated technology• Recombinant protein & synthetic
biology• Technical plan or research plan
review
• Technical insights and exploration• Research grant program• Funding & investment opportunities
Technical Expertise & Guidance
Marketing & Strategy

U.S. plant-based market overview
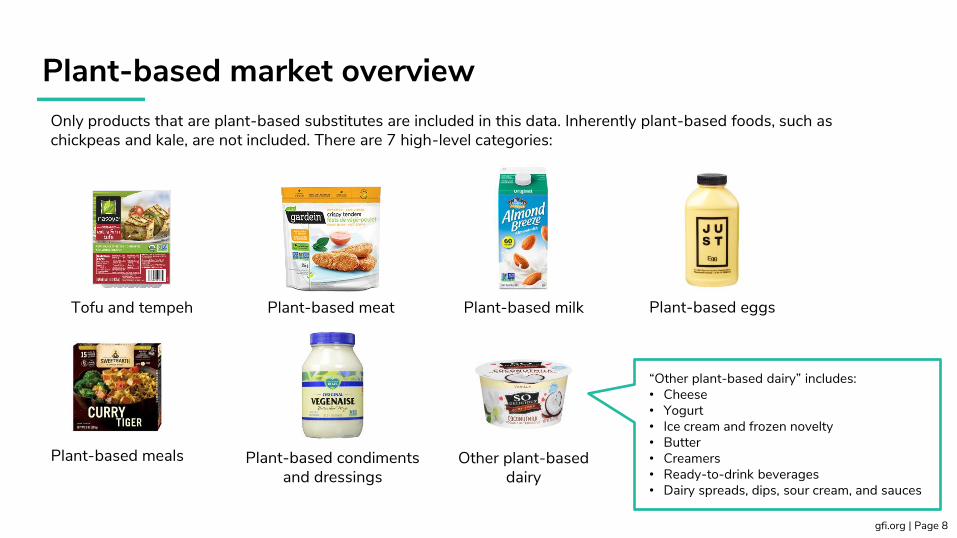
Plant-based market overview
gfi.org | Page 8
Only products that are plant-based substitutes are included in this data. Inherently plant-based foods, such as chickpeas and kale, are not included. There are 7 high-level categories:
Tofu and tempeh Plant-based meat Plant-based milk
Other plant-based dairy
Plant-based eggs
Plant-based meals Plant-based condiments and dressings
“Other plant-based dairy” includes:• Cheese• Yogurt• Ice cream and frozen novelty• Butter• Creamers• Ready-to-drink beverages• Dairy spreads, dips, sour cream, and sauces
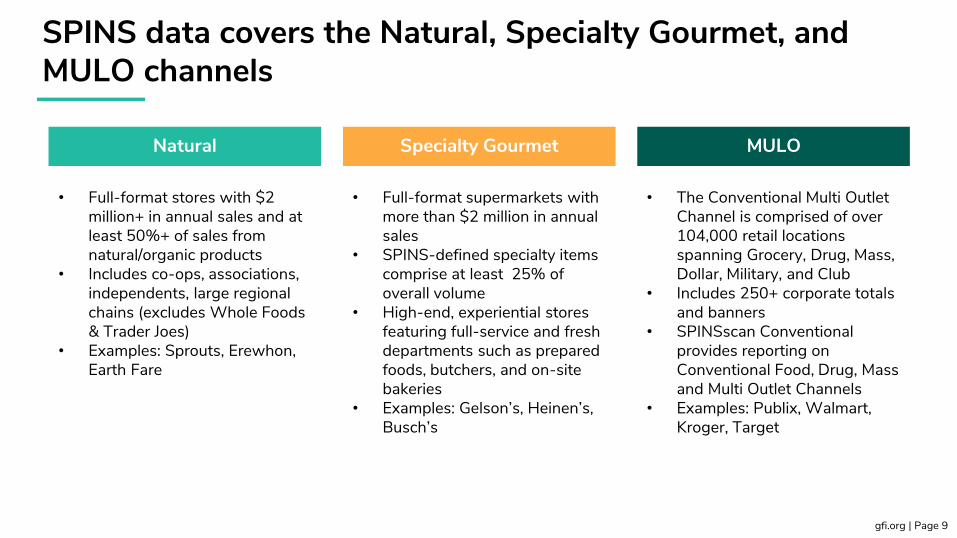
SPINS data covers the Natural, Specialty Gourmet, and MULO channels
gfi.org | Page 9
Natural Specialty Gourmet MULO
• Full-format stores with $2 million+ in annual sales and at least 50%+ of sales from natural/organic products
• Includes co-ops, associations, independents, large regional chains (excludes Whole Foods & Trader Joes)
• Examples: Sprouts, Erewhon, Earth Fare
• Full-format supermarkets with more than $2 million in annual sales
• SPINS-defined specialty items comprise at least 25% of overall volume
• High-end, experiential stores featuring full-service and fresh departments such as prepared foods, butchers, and on-site bakeries
• Examples: Gelson’s, Heinen’s, Busch’s
• The Conventional Multi Outlet Channel is comprised of over 104,000 retail locations spanning Grocery, Drug, Mass, Dollar, Military, and Club
• Includes 250+ corporate totals and banners
• SPINSscan Conventional provides reporting on Conventional Food, Drug, Mass and Multi Outlet Channels
• Examples: Publix, Walmart, Kroger, Target
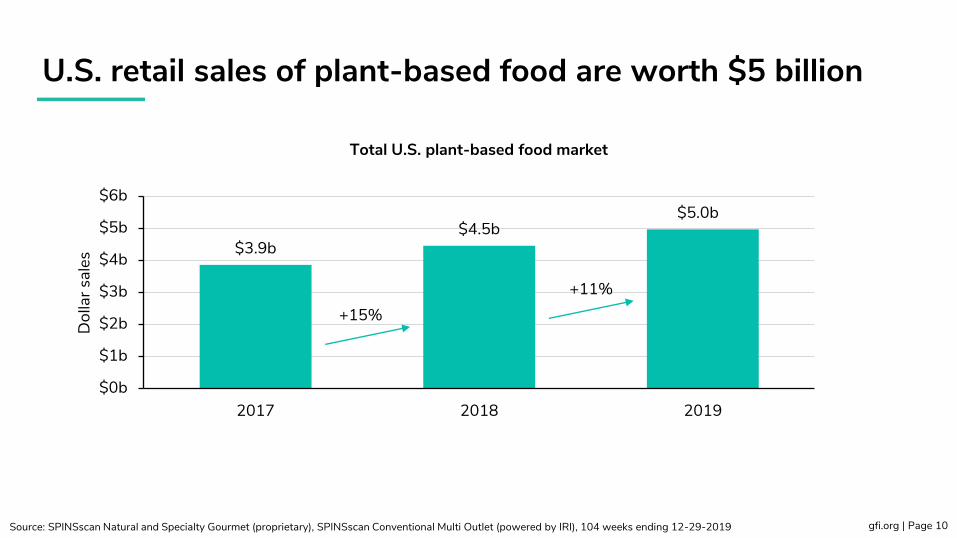
$3.9b$4.5b
$5.0b
$0b
$1b
$2b
$3b
$4b
$5b
$6b
2017 2018 2019
Dol
lar s
ales
U.S. retail sales of plant-based food are worth $5 billion
gfi.org | Page 10Source: SPINSscan Natural and Specialty Gourmet (proprietary), SPINSscan Conventional Multi Outlet (powered by IRI), 104 weeks ending 12-29-2019
Total U.S. plant-based food market
+15%+11%
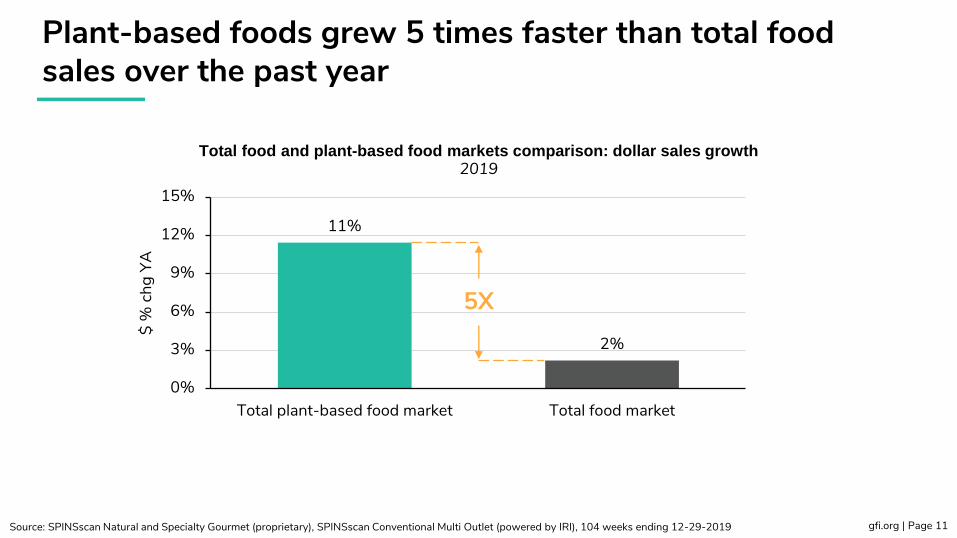
11%
2%
0%
3%
6%
9%
12%
15%
Total plant-based food market Total food market
$ %
chg
YA
Plant-based foods grew 5 times faster than total food sales over the past year
gfi.org | Page 11Source: SPINSscan Natural and Specialty Gourmet (proprietary), SPINSscan Conventional Multi Outlet (powered by IRI), 104 weeks ending 12-29-2019
Total food and plant-based food markets comparison: dollar sales growth2019
5X
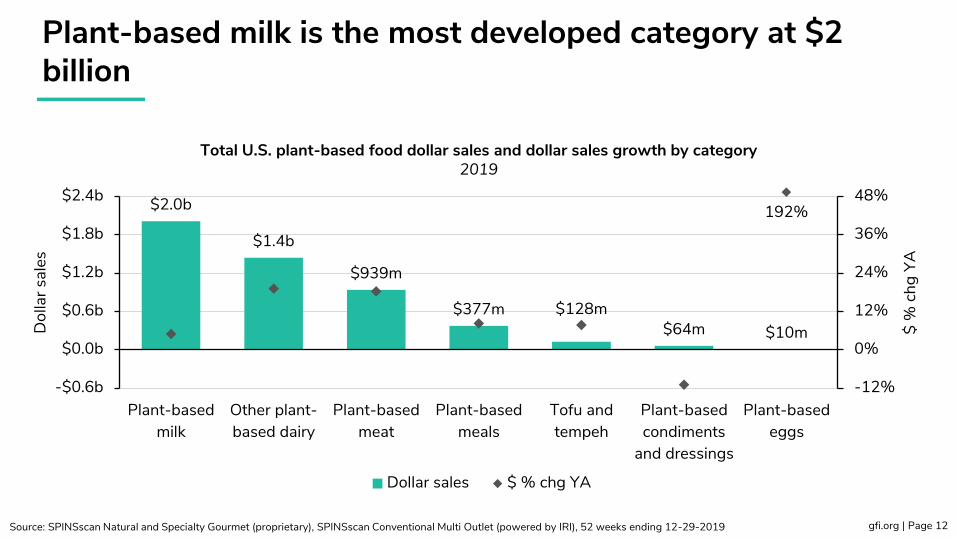
$2.0b
$1.4b
$939m
$377m $128m$64m $10m
-12%
0%
12%
24%
36%
48%
-$0.6b
$0.0b
$0.6b
$1.2b
$1.8b
$2.4b
Plant-basedmilk
Other plant-based dairy
Plant-basedmeat
Plant-basedmeals
Tofu andtempeh
Plant-basedcondiments
and dressings
Plant-basedeggs
$ %
chg
YA
Dol
lar s
ales
Dollar sales $ % chg YA
Plant-based milk is the most developed category at $2 billion
gfi.org | Page 12Source: SPINSscan Natural and Specialty Gourmet (proprietary), SPINSscan Conventional Multi Outlet (powered by IRI), 52 weeks ending 12-29-2019
Total U.S. plant-based food dollar sales and dollar sales growth by category2019
192%

192%
34% 31% 18% 18% 8% 6% 5%
-10%
6%
-1%
3% 1% 3% 2% 0.1%
-40%
0%
40%
80%
120%
160%
200%
Eggs Creamer Yogurt Meat Cheese Butter Ice creamand frozen
novelty
Milk
$ %
chg
YA
Plant-based Animal-based
Plant-based food sales growth outperforms animal-based food sales growth across key categories
gfi.org | Page 13Source: SPINSscan Natural and Specialty Gourmet (proprietary), SPINSscan Conventional Multi Outlet (powered by IRI), 52 weeks ending 12-29-2019
Animal-based and plant-based product comparison: dollar sales growth2019
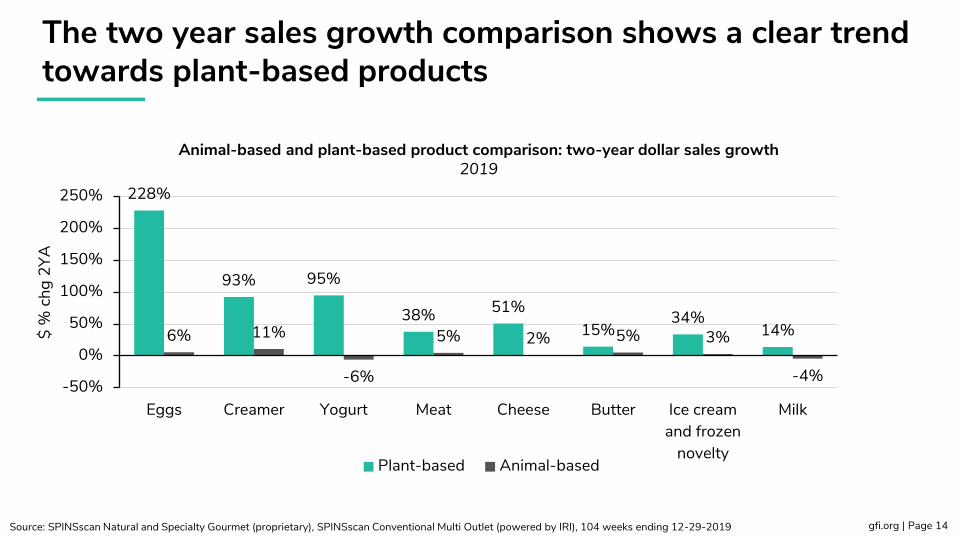
228%
93% 95%
38% 51%15%
34%14%6% 11%
-6%
5% 2% 5% 3%
-4%-50%
0%
50%
100%
150%
200%
250%
Eggs Creamer Yogurt Meat Cheese Butter Ice creamand frozen
novelty
Milk
$ %
chg
2YA
Plant-based Animal-based
The two year sales growth comparison shows a clear trend towards plant-based products
gfi.org | Page 14Source: SPINSscan Natural and Specialty Gourmet (proprietary), SPINSscan Conventional Multi Outlet (powered by IRI), 104 weeks ending 12-29-2019
Animal-based and plant-based product comparison: two-year dollar sales growth2019

14%
6% 5%4%
3%1% 1% 0.2%
0%
4%
8%
12%
16%
Milk Butter Creamer Yogurt Ice cream andfrozen novelty
Meat* Cheese Eggs
% s
hare
Plant-based milk has the greatest share of total market; other dairy categories are gaining share
gfi.org | Page 15
Plant-based share by category2019
Note: SPINS does not report non-UPC meat counter sales. To account for this, the plant-based meat total retail share calculation uses the $95 billion total meat market size reported by Nielsen, as this number includes both retail packaged meat sales and non-UPC meat counter salesSource: SPINSscan Natural and Specialty Gourmet (proprietary), SPINSscan Conventional Multi Outlet (powered by IRI), 52 weeks ending 12-29-2019; Nielsen (2019), The F Word: Flexitarian Is Not a Curse to the Meat Industry
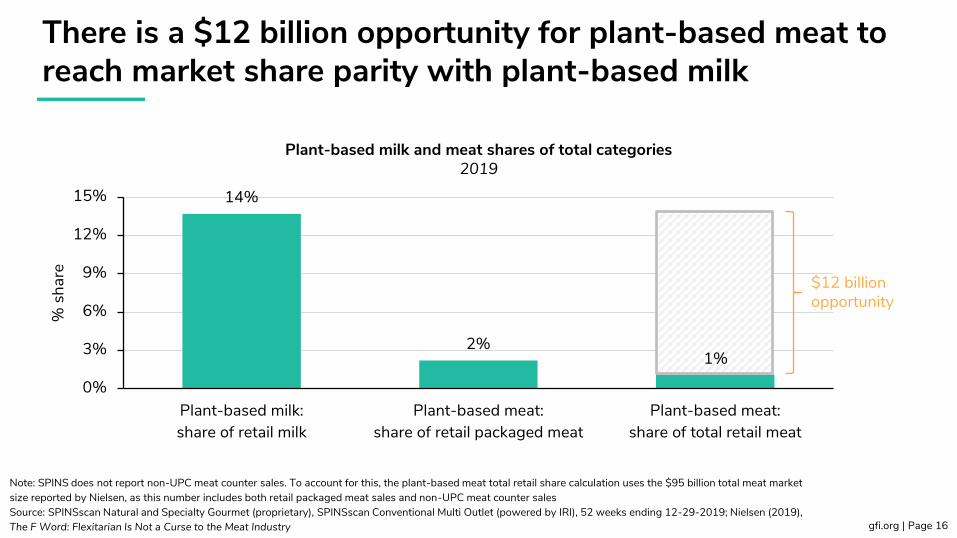
14%
2%1%
0%
3%
6%
9%
12%
15%
Plant-based milk:share of retail milk
Plant-based meat:share of retail packaged meat
Plant-based meat:share of total retail meat
% s
hare
There is a $12 billion opportunity for plant-based meat to reach market share parity with plant-based milk
gfi.org | Page 16
Note: SPINS does not report non-UPC meat counter sales. To account for this, the plant-based meat total retail share calculation uses the $95 billion total meat market size reported by Nielsen, as this number includes both retail packaged meat sales and non-UPC meat counter salesSource: SPINSscan Natural and Specialty Gourmet (proprietary), SPINSscan Conventional Multi Outlet (powered by IRI), 52 weeks ending 12-29-2019; Nielsen (2019), The F Word: Flexitarian Is Not a Curse to the Meat Industry
Plant-based milk and meat shares of total categories2019
$12 billion opportunity
1%

41%
18%
34%
22%
30%
8%
17%
2%
20%
7%11%
6% 6%3% 2% 0.
4%
13%
5% 5% 3% 2% 1% 1% 0.1%
0%
10%
20%
30%
40%
50%
Milk Butter Creamer Yogurt Ice cream andfrozen novelty
Meat* Cheese Eggs
% s
hare
Natural Specialty Gourmet MULO
Plant-based foods have the largest share of their respective categories in the Natural channel
gfi.org | Page 17
Note: SPINS does not report non-UPC meat counter sales. To account for this, the plant-based meat total retail share calculation uses the $95 billion total meat market size reported by Nielsen, as this number includes both retail packaged meat sales and non-UPC meat counter salesSource: SPINSscan Natural and Specialty Gourmet (proprietary), SPINSscan Conventional Multi Outlet (powered by IRI), 52 weeks ending 12-29-2019; Nielsen (2019), The F Word: Flexitarian Is Not a Curse to the Meat Industry
Plant-based share by category and channel2019

27k25k
17k 16k
12k
7k 7k 6k 5k 4k 3k 2k 1k0k
6k
12k
18k
24k
30k
TDP
Plant-based milk has the highest distribution, with room for growth across categories
gfi.org | Page 18Source: SPINSscan Natural and Specialty Gourmet (proprietary), SPINSscan Conventional Multi Outlet (powered by IRI), 52 weeks ending 12-29-2019
Total distribution points by plant-based category 2019
Milk Ice cream and frozen novelty
Yogurt Cheese Condiments, dressings, and
mayo
Butter Eggs
Meat Meals Creamer RTD Beverages Tofu andtempeh
Dairy spreads, dips, sour cream, and
sauces
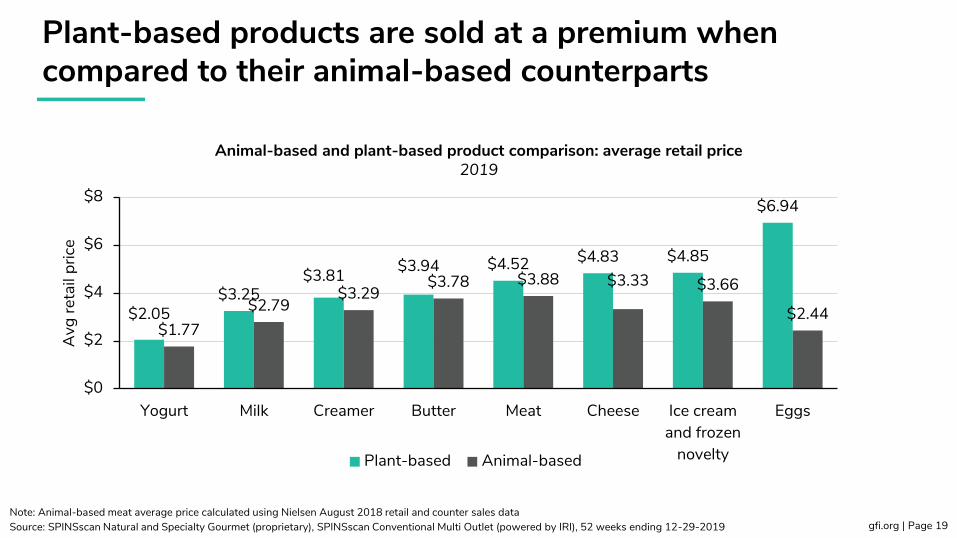
Plant-based products are sold at a premium when compared to their animal-based counterparts
gfi.org | Page 19Note: Animal-based meat average price calculated using Nielsen August 2018 retail and counter sales dataSource: SPINSscan Natural and Specialty Gourmet (proprietary), SPINSscan Conventional Multi Outlet (powered by IRI), 52 weeks ending 12-29-2019
$2.05$3.25
$3.81 $3.94 $4.52 $4.83 $4.85
$6.94
$1.77$2.79
$3.29$3.78 $3.88 $3.33 $3.66
$2.44
$0
$2
$4
$6
$8
Yogurt Milk Creamer Butter Meat Cheese Ice creamand frozen
novelty
Eggs
Avg
reta
il pr
ice
Plant-based Animal-based
Animal-based and plant-based product comparison: average retail price2019
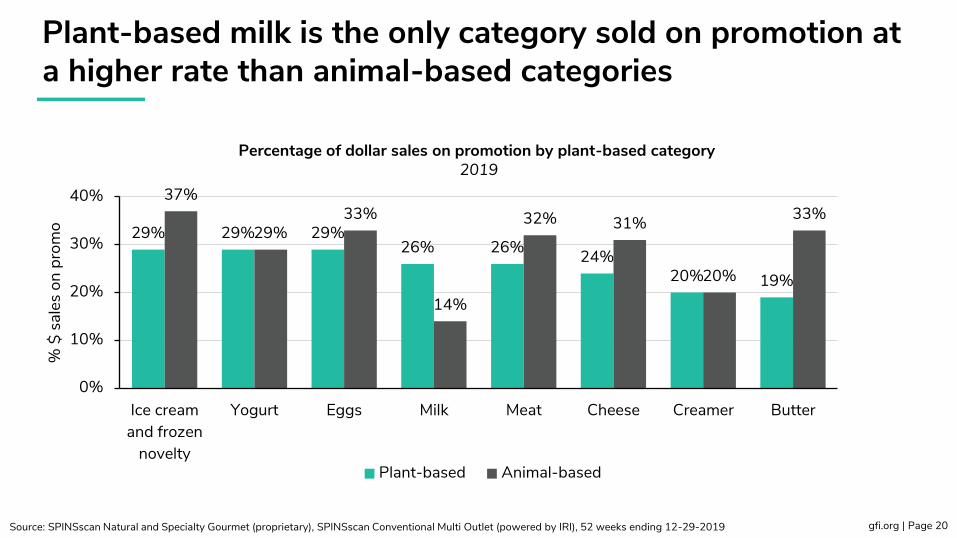
29% 29% 29%26% 26% 24%
20% 19%
37%
29%33%
14%
32% 31%
20%
33%
0%
10%
20%
30%
40%
Ice creamand frozen
novelty
Yogurt Eggs Milk Meat Cheese Creamer Butter
% $
sal
es o
n pr
omo
Plant-based Animal-based
Plant-based milk is the only category sold on promotion at a higher rate than animal-based categories
gfi.org | Page 20Source: SPINSscan Natural and Specialty Gourmet (proprietary), SPINSscan Conventional Multi Outlet (powered by IRI), 52 weeks ending 12-29-2019
Percentage of dollar sales on promotion by plant-based category 2019

Purchasing dynamics
40%
13%
41%
14%
0%
10%
20%
30%
40%
50%
Plant-based milk Plant-based meat
Hou
seho
ld p
enet
ratio
n
Year ending October 2018Year ending October 2019
Year ending November 2018Year ending November 2019
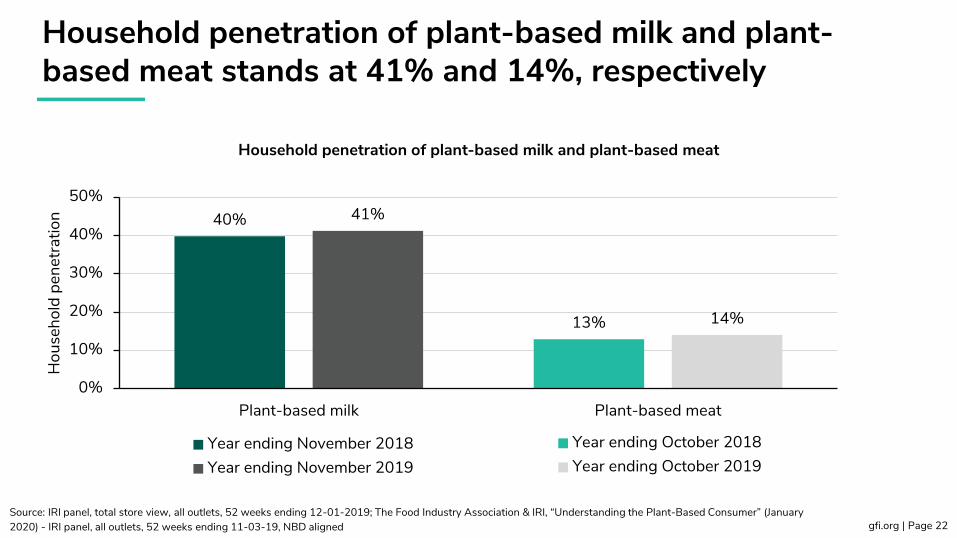
Household penetration of plant-based milk and plant-based meat stands at 41% and 14%, respectively
gfi.org | Page 22Source: IRI panel, total store view, all outlets, 52 weeks ending 12-01-2019; The Food Industry Association & IRI, “Understanding the Plant-Based Consumer” (January 2020) - IRI panel, all outlets, 52 weeks ending 11-03-19, NBD aligned
Household penetration of plant-based milk and plant-based meat
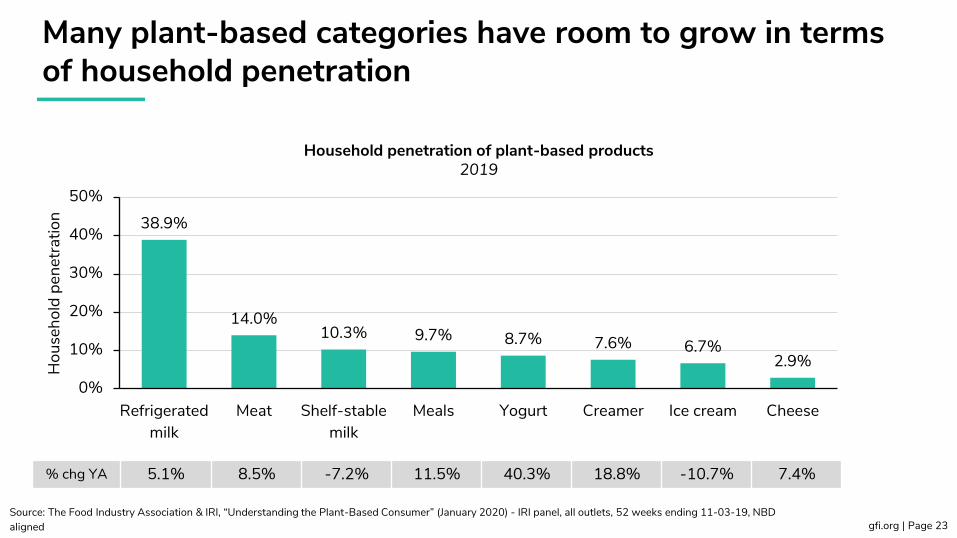
Many plant-based categories have room to grow in terms of household penetration
gfi.org | Page 23Source: The Food Industry Association & IRI, “Understanding the Plant-Based Consumer” (January 2020) - IRI panel, all outlets, 52 weeks ending 11-03-19, NBD aligned
38.9%
14.0%10.3% 9.7% 8.7% 7.6% 6.7%
2.9%0%
10%
20%
30%
40%
50%
Refrigeratedmilk
Meat Shelf-stablemilk
Meals Yogurt Creamer Ice cream Cheese
Hou
seho
ld p
enet
ratio
n
Household penetration of plant-based products2019
% chg YA 5.1% 8.5% -7.2% 11.5% 40.3% 18.8% -10.7% 7.4%

The majority of households are purchasing refrigerated plant-based milk and plant-based meat 2 or more times
gfi.org | Page 24
75.6%60.1% 51.6% 47.7% 49.7% 59.3%
48.0% 54.9%
24.4%39.9% 48.4% 52.3% 50.3% 40.7%
52.0% 45.1%
0%
20%
40%
60%
80%
100%
Refrigeratedmilk
Meat Shelf-stablemilk
Meals Yogurt Creamer Ice cream Cheese
Hou
seho
ld p
enet
ratio
n
Share of households buying 2x+ Share of households buying 1x
Household penetration of plant-based products by 1x and 2x buyers2019
Source: The Food Industry Association & IRI, “Understanding the Plant-Based Consumer” (January 2020) - IRI panel, all outlets, 52 weeks ending 11-03-19, NBD aligned
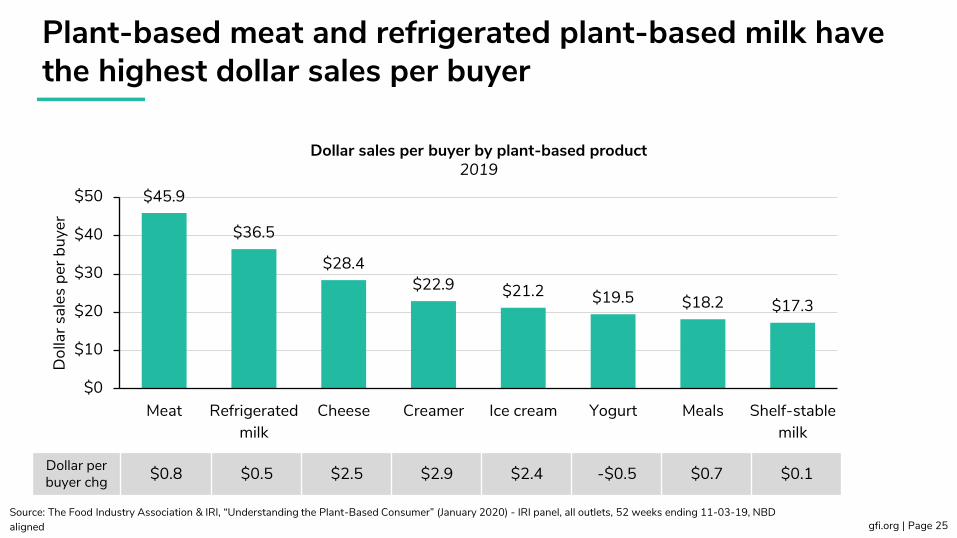
Plant-based meat and refrigerated plant-based milk have the highest dollar sales per buyer
gfi.org | Page 25
$45.9
$36.5
$28.4$22.9 $21.2 $19.5 $18.2 $17.3
$0
$10
$20
$30
$40
$50
Meat Refrigeratedmilk
Cheese Creamer Ice cream Yogurt Meals Shelf-stablemilk
Dol
lar s
ales
per
buy
er
Dollar sales per buyer by plant-based product2019
Source: The Food Industry Association & IRI, “Understanding the Plant-Based Consumer” (January 2020) - IRI panel, all outlets, 52 weeks ending 11-03-19, NBD aligned
Dollar per buyer chg $0.8 $0.5 $2.5 $2.9 $2.4 -$0.5 $0.7 $0.1
9.15.4
2.85.0 3.7 3.0 3.4 3.9
0
5
10
Refrigeratedmilk
Meat Meals Creamer Yogurt Ice cream Shelf-stablemilk
Cheese
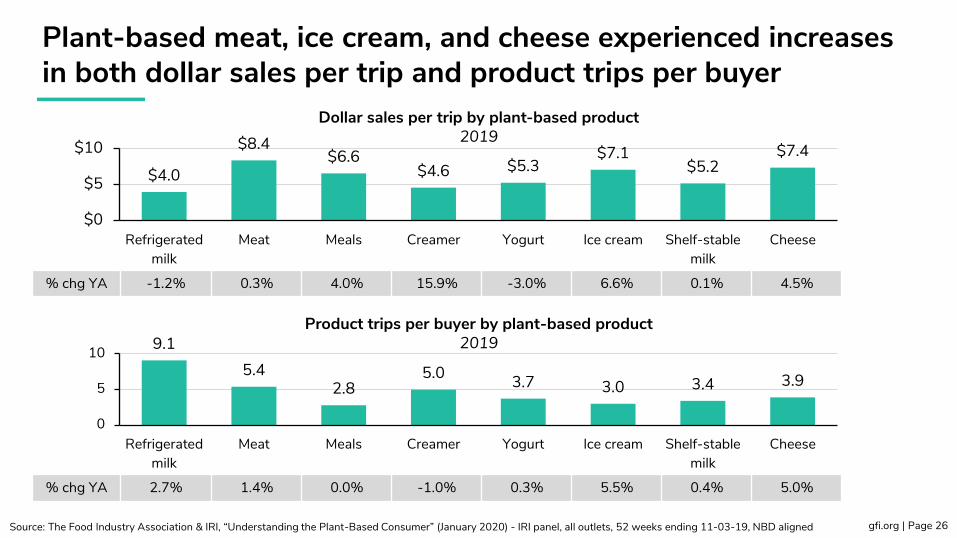
Plant-based meat, ice cream, and cheese experienced increases in both dollar sales per trip and product trips per buyer
gfi.org | Page 26
$4.0
$8.4$6.6
$4.6 $5.3$7.1
$5.2$7.4
$0
$5
$10
Refrigeratedmilk
Meat Meals Creamer Yogurt Ice cream Shelf-stablemilk
Cheese
Dollar sales per trip by plant-based product2019
Source: The Food Industry Association & IRI, “Understanding the Plant-Based Consumer” (January 2020) - IRI panel, all outlets, 52 weeks ending 11-03-19, NBD aligned
% chg YA -1.2% 0.3% 4.0% 15.9% -3.0% 6.6% 0.1% 4.5%
Product trips per buyer by plant-based product2019
% chg YA 2.7% 1.4% 0.0% -1.0% 0.3% 5.5% 0.4% 5.0%

Plant-based meat
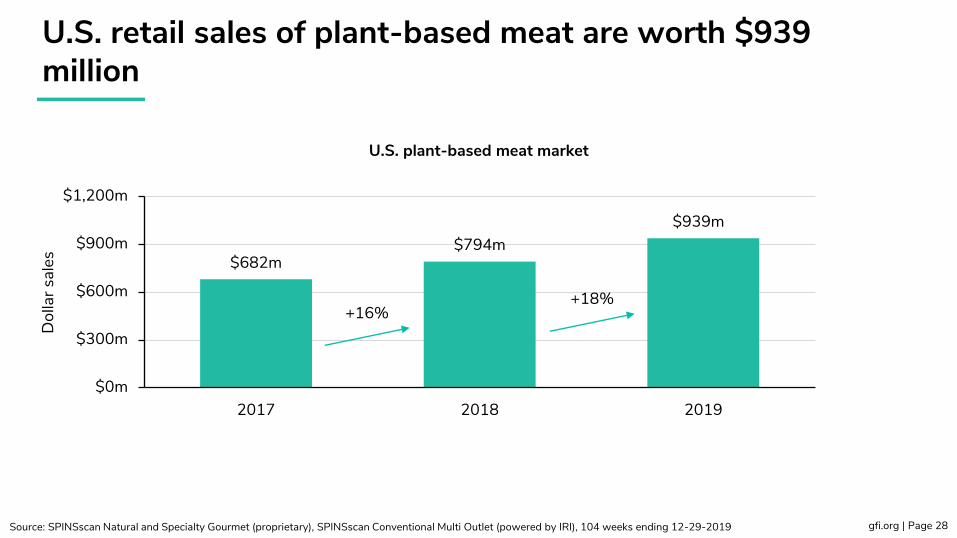
U.S. retail sales of plant-based meat are worth $939 million
gfi.org | Page 28Source: SPINSscan Natural and Specialty Gourmet (proprietary), SPINSscan Conventional Multi Outlet (powered by IRI), 104 weeks ending 12-29-2019
$682m$794m
$939m
$0m
$300m
$600m
$900m
$1,200m
2017 2018 2019
Dol
lar s
ales
U.S. plant-based meat market
+16%+18%
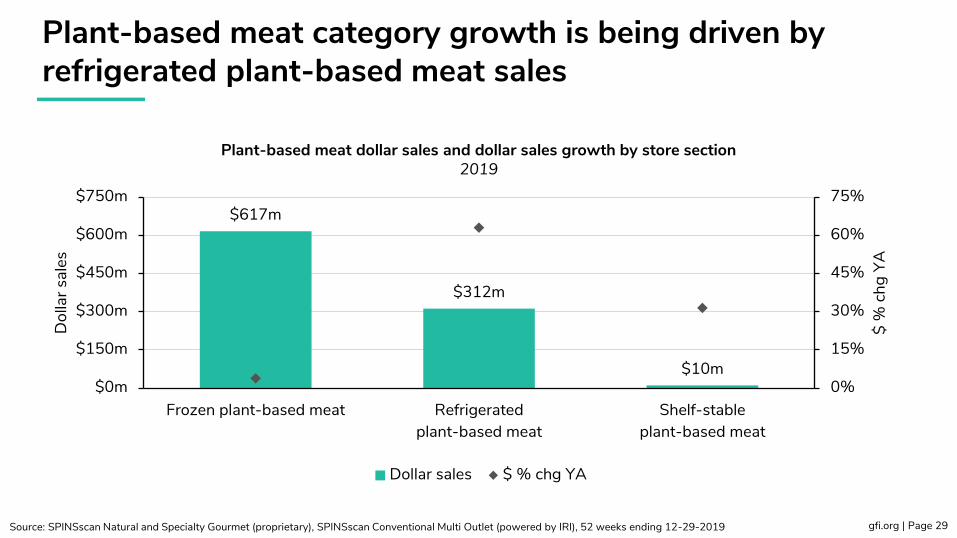
$617m
$312m
$10m0%
15%
30%
45%
60%
75%
$0m
$150m
$300m
$450m
$600m
$750m
Frozen plant-based meat Refrigeratedplant-based meat
Shelf-stableplant-based meat
$ %
chg
YA
Dol
lar s
ales
Dollar sales $ % chg YA
Plant-based meat category growth is being driven by refrigerated plant-based meat sales
gfi.org | Page 29Source: SPINSscan Natural and Specialty Gourmet (proprietary), SPINSscan Conventional Multi Outlet (powered by IRI), 52 weeks ending 12-29-2019
Plant-based meat dollar sales and dollar sales growth by store section2019
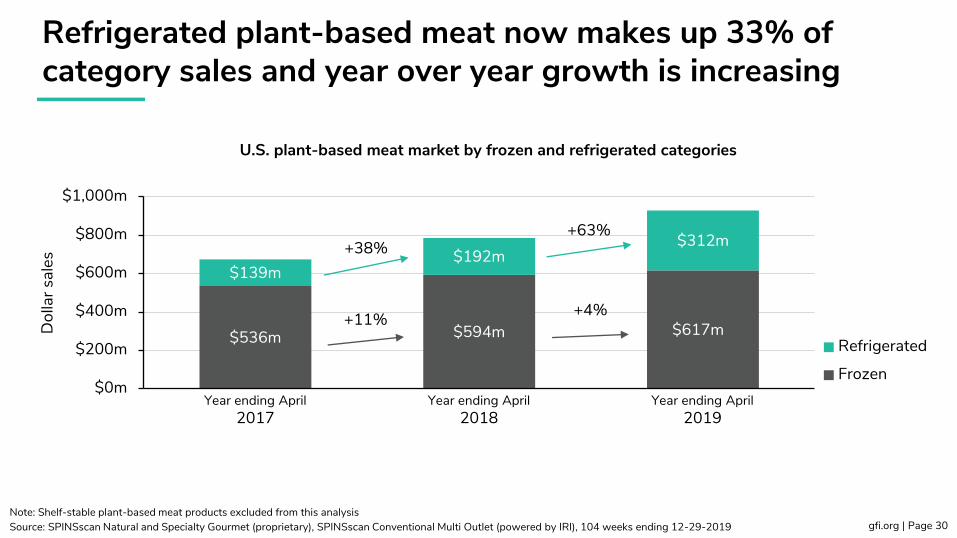
$536m $594m $617m
$139m$192m
$312m
$0m
$200m
$400m
$600m
$800m
$1,000m
Dol
lar s
ales
Refrigerated
Frozen
Refrigerated plant-based meat now makes up 33% of category sales and year over year growth is increasing
gfi.org | Page 30Note: Shelf-stable plant-based meat products excluded from this analysisSource: SPINSscan Natural and Specialty Gourmet (proprietary), SPINSscan Conventional Multi Outlet (powered by IRI), 104 weeks ending 12-29-2019
U.S. plant-based meat market by frozen and refrigerated categories
Year ending April2017
Year ending April2018
Year ending April2019
+11% +4%
+38%+63%
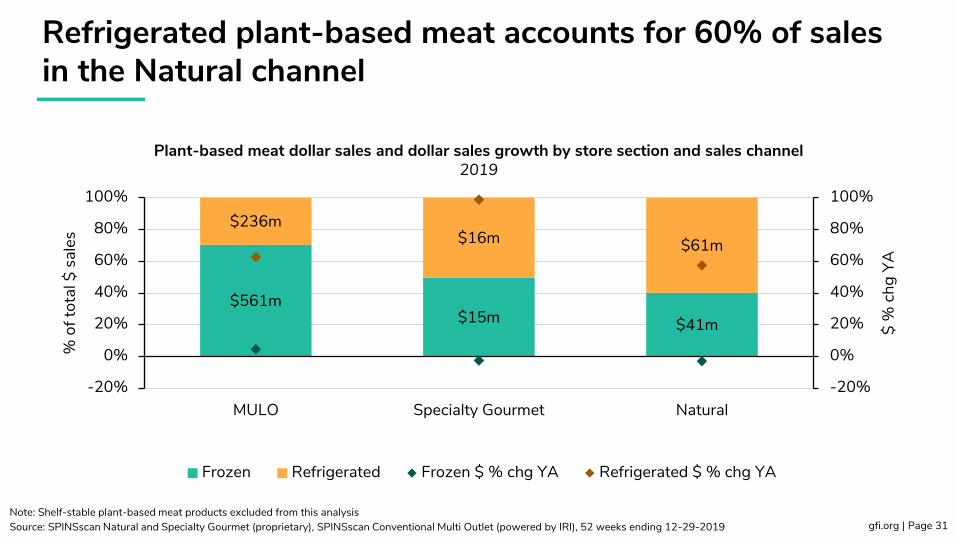
Refrigerated plant-based meat accounts for 60% of sales in the Natural channel
gfi.org | Page 31Note: Shelf-stable plant-based meat products excluded from this analysisSource: SPINSscan Natural and Specialty Gourmet (proprietary), SPINSscan Conventional Multi Outlet (powered by IRI), 52 weeks ending 12-29-2019
$561m$15m $41m
$236m$16m $61m
-20%
0%
20%
40%
60%
80%
100%
-20%
0%
20%
40%
60%
80%
100%
MULO Specialty Gourmet Natural
$ %
chg
YA
% o
f tot
al $
sal
es
Frozen Refrigerated Frozen $ % chg YA Refrigerated $ % chg YA
Plant-based meat dollar sales and dollar sales growth by store section and sales channel2019

0k
4k
8k
12k
16k
2017 2018 2019
Tota
l dis
trib
utio
n po
ints
Frozen plant-based meat Refrigerated plant-based meat Shelf-stable plant-based meat
Total distribution points for plant-based meat have increased across all store sections
gfi.org | Page 32Source: SPINSscan Natural and Specialty Gourmet (proprietary), SPINSscan Conventional Multi Outlet (powered by IRI), 104 weeks ending 12-29-2019
Plant-based meat total distribution points by department
+2% +9%
+2% +27%
-2% +50%
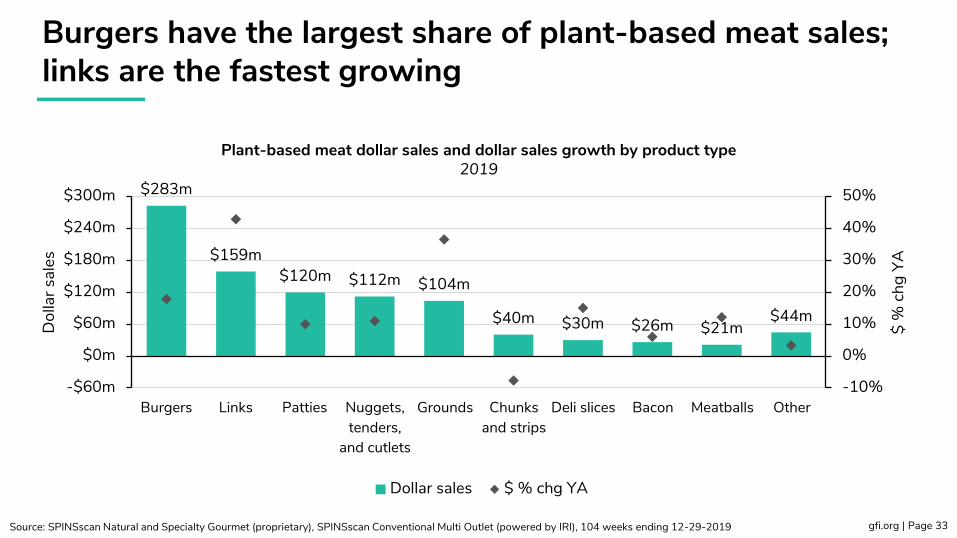
Burgers have the largest share of plant-based meat sales; links are the fastest growing
gfi.org | Page 33Source: SPINSscan Natural and Specialty Gourmet (proprietary), SPINSscan Conventional Multi Outlet (powered by IRI), 104 weeks ending 12-29-2019
$283m
$159m$120m $112m $104m
$40m $30m $26m $21m$44m
-10%
0%
10%
20%
30%
40%
50%
-$60m
$0m
$60m
$120m
$180m
$240m
$300m
$ %
chg
YA
Dol
lar s
ales
Dollar sales $ % chg YA
Plant-based meat dollar sales and dollar sales growth by product type2019
Burgers Links Patties Nuggets, tenders,
and cutlets
Grounds Chunks and strips
Deli slices Bacon Meatballs Other
123%
248%
48%
100%57%
6%15%
69%
13%
-4%
9% 11% 14% 15%
-10%
3% 5%
95%
-60%
0%
60%
120%
180%
240%
300%
Burgers Patties Nuggets,tenders,
and cutlets
Grounds Links Chunksand strips
Bacon Meatballs Deli slices
$ %
chg
YA
Refrigerated $ % chg YA Frozen $ % chg YA
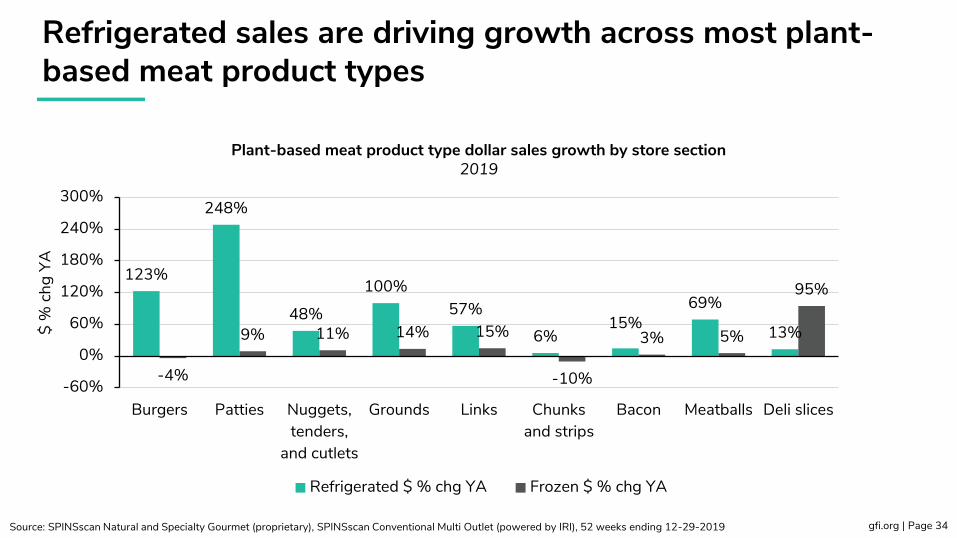
Refrigerated sales are driving growth across most plant-based meat product types
gfi.org | Page 34Source: SPINSscan Natural and Specialty Gourmet (proprietary), SPINSscan Conventional Multi Outlet (powered by IRI), 52 weeks ending 12-29-2019
Plant-based meat product type dollar sales growth by store section2019

• Mimics appearance of meat• Mimics taste of meat• Uses meat-like terminology (e.g. chick’n, beef)
Plant-based meat products vary in the degree to which they are analogs or non-analogs of animal-based meat
gfi.org | Page 35
Analog Non-analog
• Emphasizes vegetable ingredients• Maintains vegetable-like texture and/or flavor

Analog plant-based meat products make up slightly more than 60% of UPC’s but almost 85% of dollar sales
gfi.org | Page 36Source: SPINSscan Natural and Specialty Gourmet (proprietary), SPINSscan Conventional Multi Outlet (powered by IRI), 52 weeks ending 12-29-2019
63%84% 85%
37%16% 15%
0%
20%
40%
60%
80%
100%
UPCs $ sales Unit sales
Analog Non-analog
Analog and non-analog plant-based meat product comparison2019
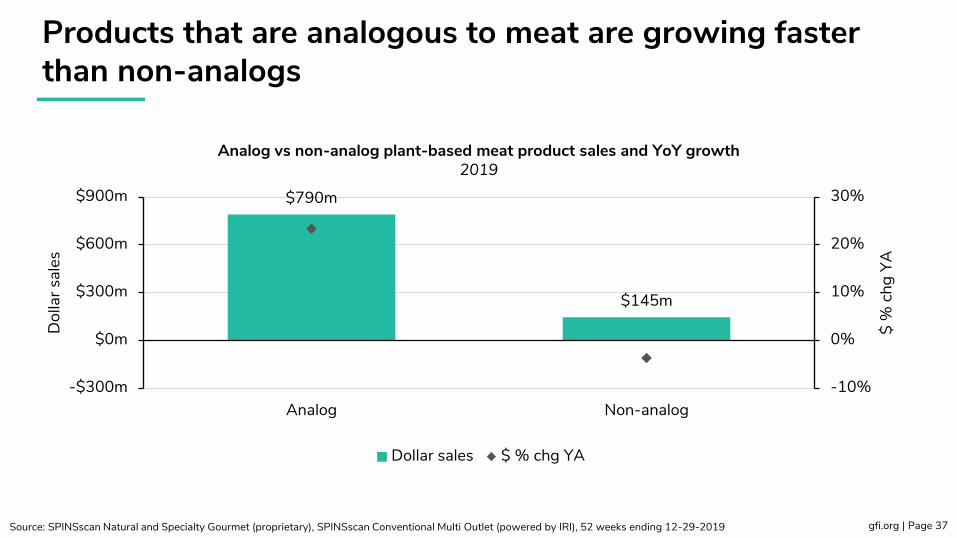
Products that are analogous to meat are growing faster than non-analogs
gfi.org | Page 37Source: SPINSscan Natural and Specialty Gourmet (proprietary), SPINSscan Conventional Multi Outlet (powered by IRI), 52 weeks ending 12-29-2019
Analog vs non-analog plant-based meat product sales and YoY growth2019
$790m
$145m
-10%
0%
10%
20%
30%
-$300m
$0m
$300m
$600m
$900m
Analog Non-analog
$ %
chg
YA
Dol
lar s
ales
Dollar sales $ % chg YA
$270m
$201m$179m
$131m$97m
$30m $7m $6m $19m
-10%
0%
10%
20%
30%
40%
50%
-$60m
$0m
$60m
$120m
$180m
$240m
$300m
Beef Chicken Pork Non-analog(vegetable)
Analog (notspecified)
Turkey Fish Non-analog(Jackfruit)
Other
$ %
chg
YA
Dol
lar s
ales
Dollar sales $ % chg YA
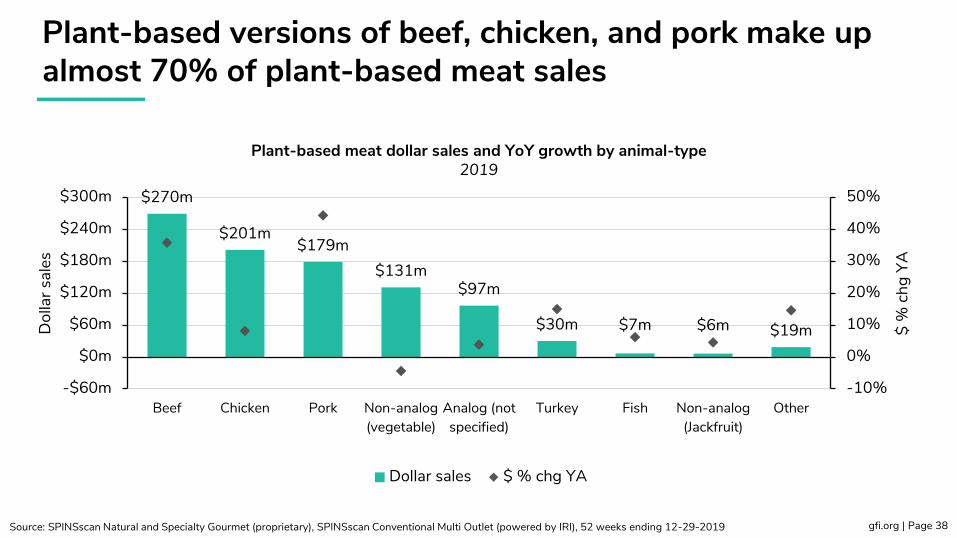
Plant-based versions of beef, chicken, and pork make up almost 70% of plant-based meat sales
gfi.org | Page 38Source: SPINSscan Natural and Specialty Gourmet (proprietary), SPINSscan Conventional Multi Outlet (powered by IRI), 52 weeks ending 12-29-2019
Plant-based meat dollar sales and YoY growth by animal-type2019
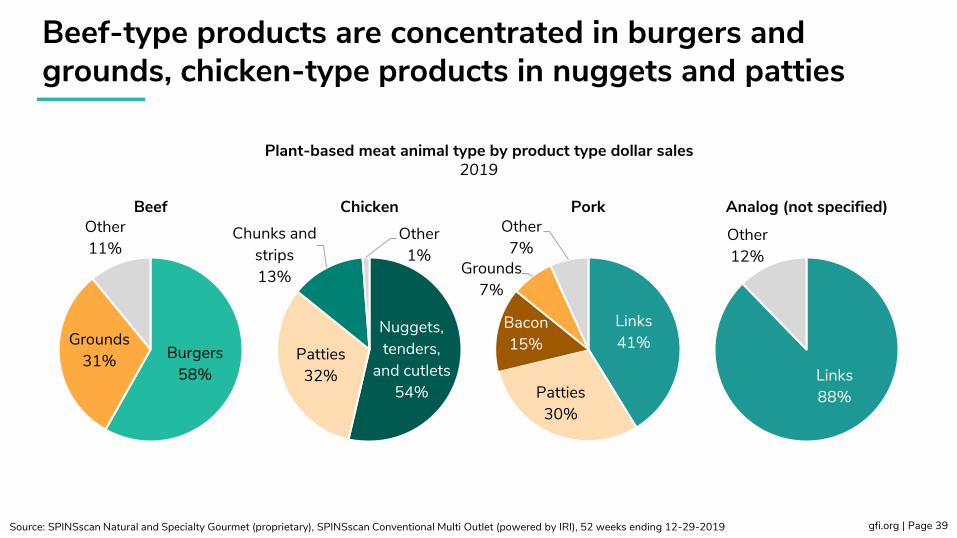
Burgers58%
Grounds31%
Other11%
Beef
Nuggets, tenders,
and cutlets54%
Patties32%
Chunks and strips13%
Other1%
Chicken
Links88%
Other12%
Analog (not specified)
Beef-type products are concentrated in burgers and grounds, chicken-type products in nuggets and patties
gfi.org | Page 39Source: SPINSscan Natural and Specialty Gourmet (proprietary), SPINSscan Conventional Multi Outlet (powered by IRI), 52 weeks ending 12-29-2019
Plant-based meat animal type by product type dollar sales2019
Links41%
Patties30%
Bacon15%
Grounds7%
Other7%
Pork
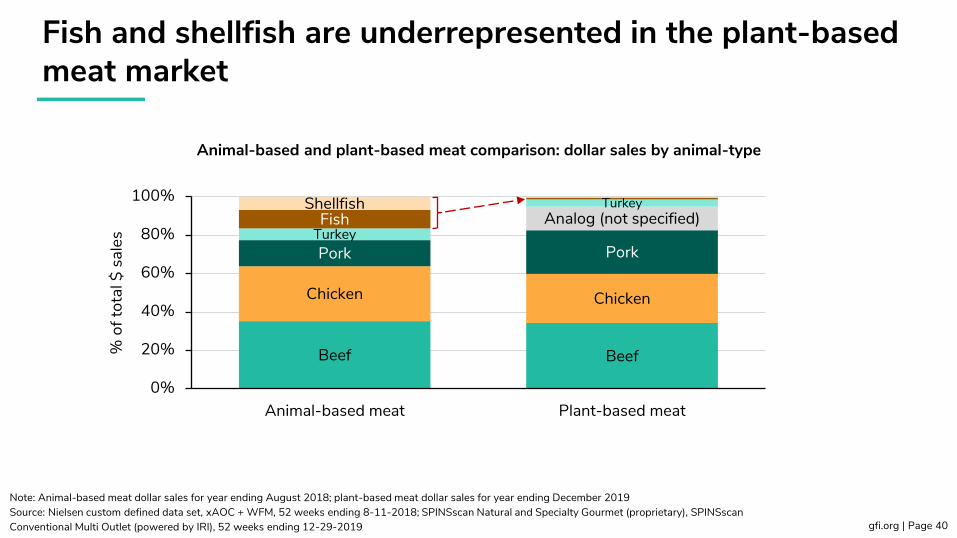
Fish and shellfish are underrepresented in the plant-based meat market
gfi.org | Page 40
Note: Animal-based meat dollar sales for year ending August 2018; plant-based meat dollar sales for year ending December 2019Source: Nielsen custom defined data set, xAOC + WFM, 52 weeks ending 8-11-2018; SPINSscan Natural and Specialty Gourmet (proprietary), SPINSscanConventional Multi Outlet (powered by IRI), 52 weeks ending 12-29-2019
Beef Beef
Chicken Chicken
Pork Pork
Analog (not specified)Turkey
TurkeyFish
Shellfish
0%
20%
40%
60%
80%
100%
Animal-based meat Plant-based meat
% o
f tot
al $
sal
es
Animal-based and plant-based meat comparison: dollar sales by animal-type

Plant-based fish makes up almost 70% of the plant-based seafood category
gfi.org | Page 41Source: SPINSscan Natural and Specialty Gourmet (proprietary), SPINSscan Conventional Multi Outlet (powered by IRI), 52 weeks ending 12-29-2019
Plant-based seafood sales and YoY growth by seafood type2019
$7m
$3m
-25%
0%
25%
50%
75%
100%
-$2m
$0m
$2m
$4m
$6m
$8m
Fish Shellfish
$ %
chg
YA
Dol
lar s
ales
Dollar sales $ % chg YA
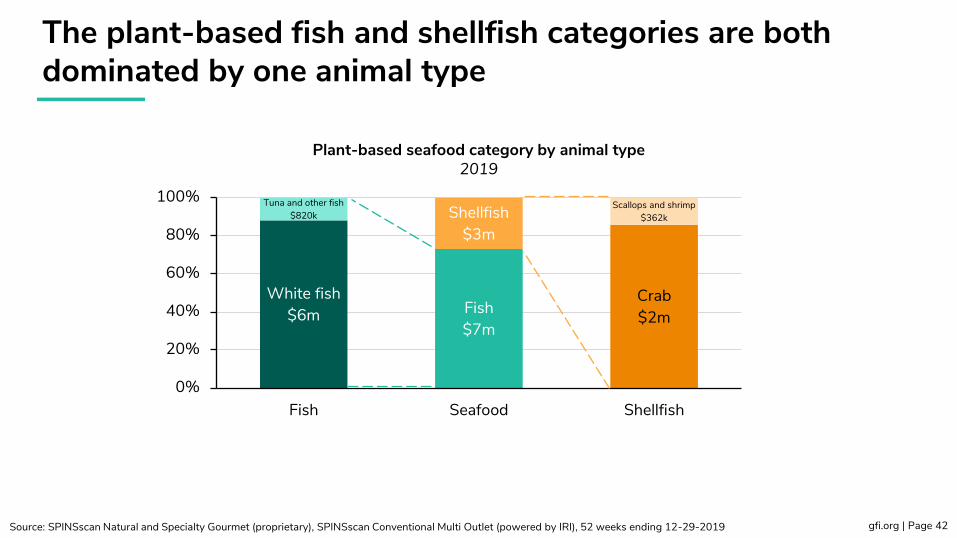
The plant-based fish and shellfish categories are both dominated by one animal type
gfi.org | Page 42Source: SPINSscan Natural and Specialty Gourmet (proprietary), SPINSscan Conventional Multi Outlet (powered by IRI), 52 weeks ending 12-29-2019
White fish$6m
Tuna and other fish$820k
Fish$7m
Shellfish$3m
Crab$2m
Scallops and shrimp$362k
0%
20%
40%
60%
80%
100%
Fish Seafood Shellfish
Plant-based seafood category by animal type2019

Plant-based milk
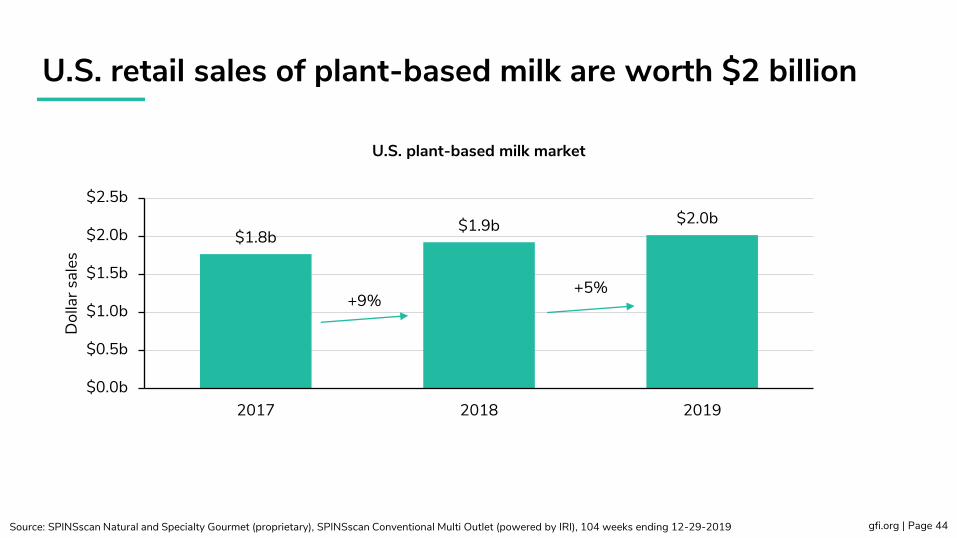
U.S. retail sales of plant-based milk are worth $2 billion
gfi.org | Page 44Source: SPINSscan Natural and Specialty Gourmet (proprietary), SPINSscan Conventional Multi Outlet (powered by IRI), 104 weeks ending 12-29-2019
$1.8b$1.9b $2.0b
$0.0b
$0.5b
$1.0b
$1.5b
$2.0b
$2.5b
2017 2018 2019
Dol
lar s
ales
U.S. plant-based milk market
+9%+5%

Refrigerated plant-based milk sales make up the majority of the category and are driving category growth
gfi.org | Page 45Source: SPINSscan Natural and Specialty Gourmet (proprietary), SPINSscan Conventional Multi Outlet (powered by IRI), 52 weeks ending 12-29-2019
U.S. plant-based milk dollar sales and dollar sales growth by store section2019
$1.8b
$211m
-5%
0%
5%
10%
15%
-$800m
$0m
$800m
$1,600m
$2,400m
Refigerated plant-based milk Shelf-stable plant-based milk
$ %
chg
YA
Dol
lar s
ales
Dollar sales $ % chg YA

gfi.org | Page 46

10k
11k
12k
13k
14k
15k
2017 2018 2019
Tota
l dis
trib
utio
n po
ints
Refrigerated plant-based milk Shelf-stable plant-based milk
Refrigerated plant-based milk TDP growth has increased as volume moves to the fresh dairy case
gfi.org | Page 47Source: SPINSscan Natural and Specialty Gourmet (proprietary), SPINSscan Conventional Multi Outlet (powered by IRI), 104 weeks ending 12-29-2019
Plant-based milk total distribution points by department
-1%
+8%
+2%
-4%
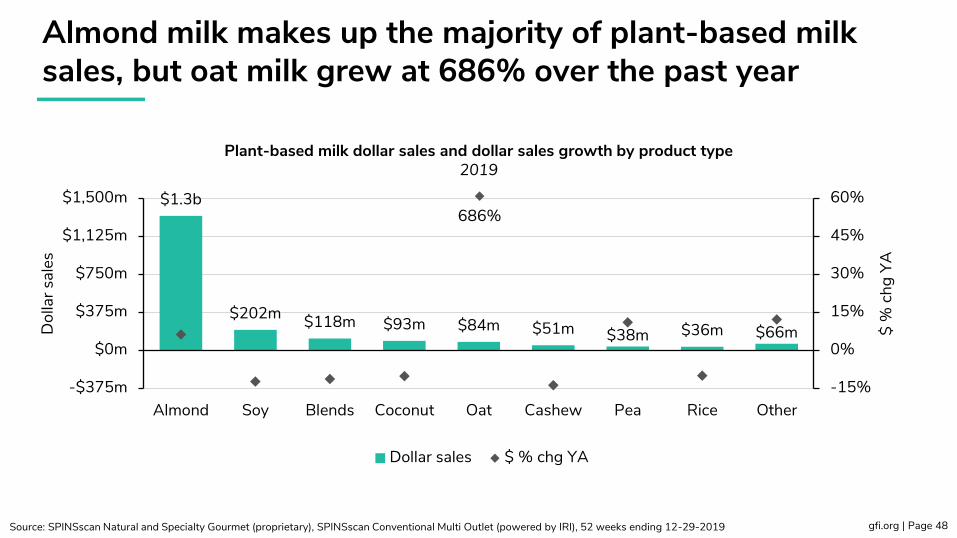
$1.3b
$202m $118m $93m $84m $51m $38m $36m $66m
-15%
0%
15%
30%
45%
60%
-$375m
$0m
$375m
$750m
$1,125m
$1,500m
Almond Soy Blends Coconut Oat Cashew Pea Rice Other
$ %
chg
YA
Dol
lar s
ales
Dollar sales $ % chg YA
Almond milk makes up the majority of plant-based milk sales, but oat milk grew at 686% over the past year
gfi.org | Page 48Source: SPINSscan Natural and Specialty Gourmet (proprietary), SPINSscan Conventional Multi Outlet (powered by IRI), 52 weeks ending 12-29-2019
Plant-based milk dollar sales and dollar sales growth by product type2019
686%
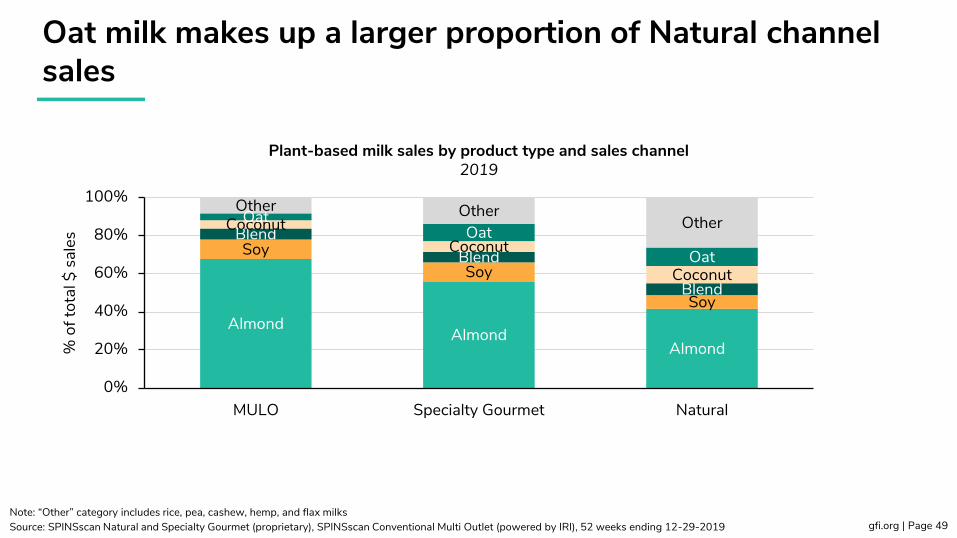
Oat milk makes up a larger proportion of Natural channel sales
gfi.org | Page 49Note: “Other” category includes rice, pea, cashew, hemp, and flax milksSource: SPINSscan Natural and Specialty Gourmet (proprietary), SPINSscan Conventional Multi Outlet (powered by IRI), 52 weeks ending 12-29-2019
AlmondAlmond
Almond
SoySoy
Soy
BlendBlend
Blend
CoconutCoconut
Coconut
OatOat
Oat
Other OtherOther
0%
20%
40%
60%
80%
100%
MULO Specialty Gourmet Natural
% o
f tot
al $
sal
es
Plant-based milk sales by product type and sales channel2019

Plant-based other dairy
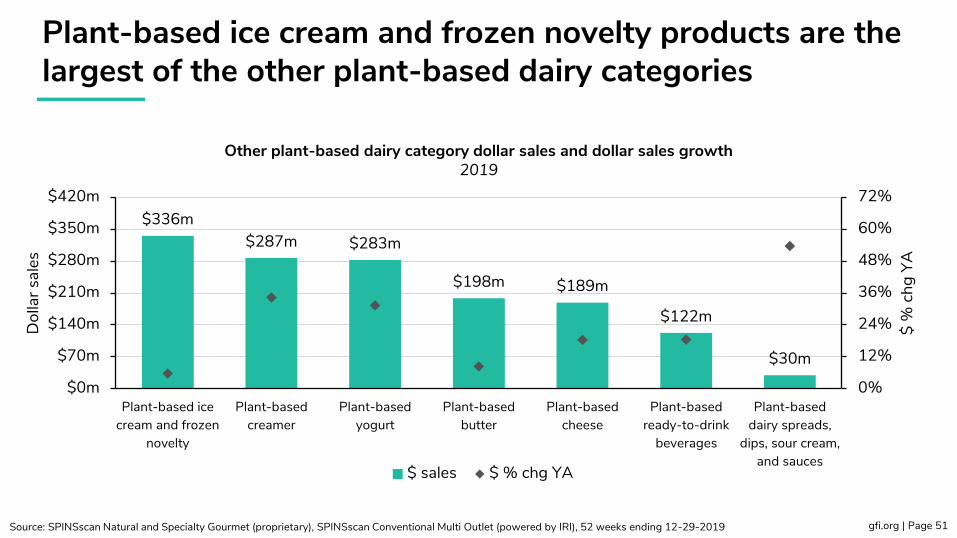
Plant-based ice cream and frozen novelty products are the largest of the other plant-based dairy categories
gfi.org | Page 51Source: SPINSscan Natural and Specialty Gourmet (proprietary), SPINSscan Conventional Multi Outlet (powered by IRI), 52 weeks ending 12-29-2019
$336m$287m $283m
$198m $189m
$122m
$30m
0%
12%
24%
36%
48%
60%
72%
$0m
$70m
$140m
$210m
$280m
$350m
$420m
Plant-based icecream and frozen
novelty
Plant-basedcreamer
Plant-basedyogurt
Plant-basedbutter
Plant-basedcheese
Plant-basedready-to-drink
beverages
Plant-baseddairy spreads,
dips, sour cream,and sauces
$ %
chg
YA
Dol
lar s
ales
$ sales $ % chg YA
Other plant-based dairy category dollar sales and dollar sales growth2019
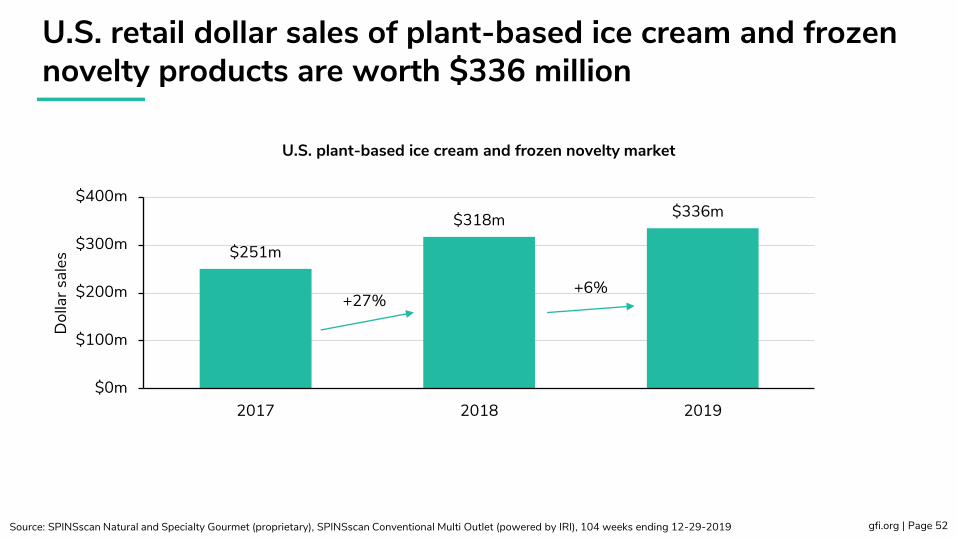
U.S. retail dollar sales of plant-based ice cream and frozen novelty products are worth $336 million
gfi.org | Page 52Source: SPINSscan Natural and Specialty Gourmet (proprietary), SPINSscan Conventional Multi Outlet (powered by IRI), 104 weeks ending 12-29-2019
$251m
$318m $336m
$0m
$100m
$200m
$300m
$400m
2017 2018 2019
Dol
lar s
ales
U.S. plant-based ice cream and frozen novelty market
+27%+6%
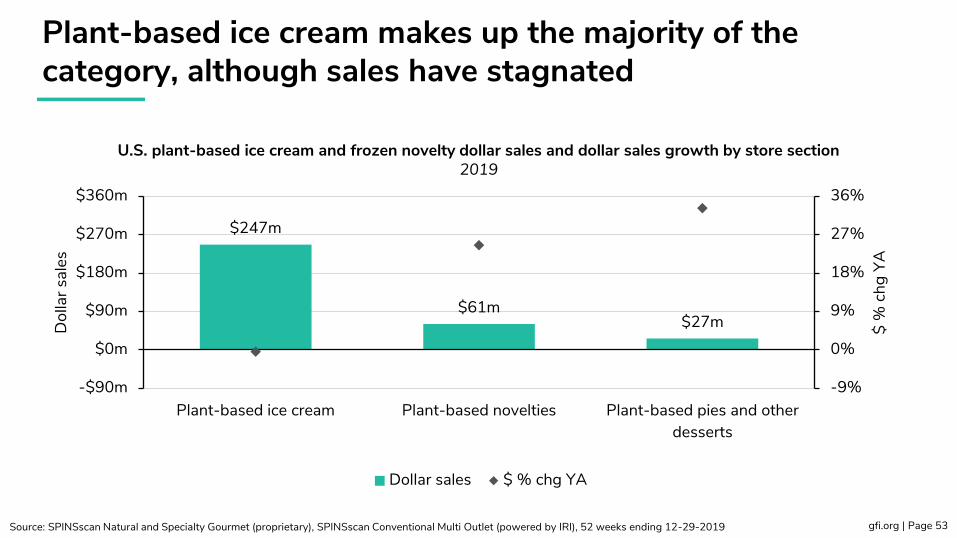
Plant-based ice cream makes up the majority of the category, although sales have stagnated
gfi.org | Page 53Source: SPINSscan Natural and Specialty Gourmet (proprietary), SPINSscan Conventional Multi Outlet (powered by IRI), 52 weeks ending 12-29-2019
U.S. plant-based ice cream and frozen novelty dollar sales and dollar sales growth by store section2019
$247m
$61m$27m
-9%
0%
9%
18%
27%
36%
-$90m
$0m
$90m
$180m
$270m
$360m
Plant-based ice cream Plant-based novelties Plant-based pies and otherdesserts
$ %
chg
YA
Dol
lar s
ales
Dollar sales $ % chg YA
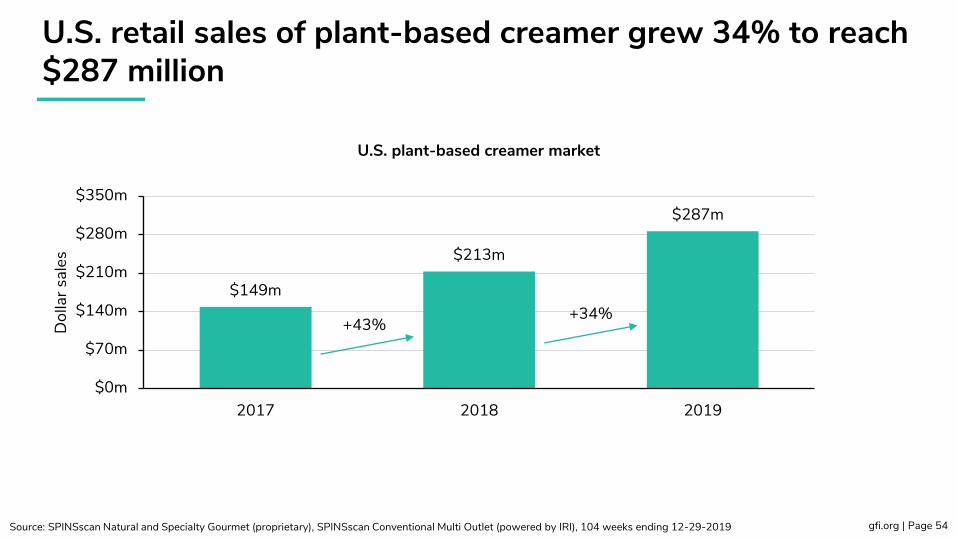
U.S. retail sales of plant-based creamer grew 34% to reach $287 million
gfi.org | Page 54Source: SPINSscan Natural and Specialty Gourmet (proprietary), SPINSscan Conventional Multi Outlet (powered by IRI), 104 weeks ending 12-29-2019
$149m
$213m
$287m
$0m
$70m
$140m
$210m
$280m
$350m
2017 2018 2019
Dol
lar s
ales
U.S. plant-based creamer market
+43%+34%
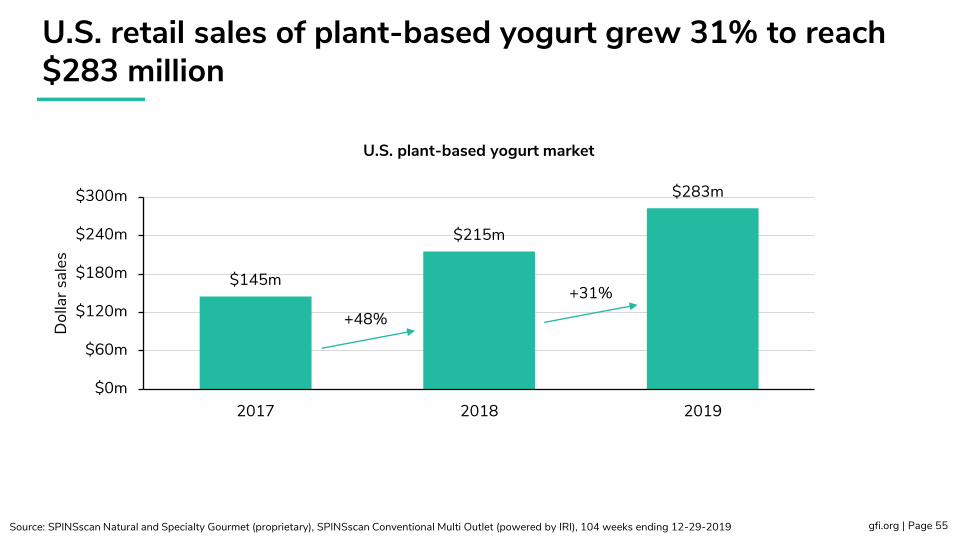
U.S. retail sales of plant-based yogurt grew 31% to reach $283 million
gfi.org | Page 55Source: SPINSscan Natural and Specialty Gourmet (proprietary), SPINSscan Conventional Multi Outlet (powered by IRI), 104 weeks ending 12-29-2019
$145m
$215m
$283m
$0m
$60m
$120m
$180m
$240m
$300m
2017 2018 2019
Dol
lar s
ales
U.S. plant-based yogurt market
+48%+31%

$127m
$87m
$44m$24m
-9%
0%
9%
18%
27%
36%
45%
-$27m
$0m
$27m
$54m
$81m
$108m
$135m
Coconut Almond Soy Other
$ %
chg
YA
Dol
lar S
ales
Dollar sales $ % chg YA
Coconut and almond yogurts make up ~76% of category sales, and are growing at 42% and 39% respectively
gfi.org | Page 56Source: SPINSscan Natural and Specialty Gourmet (proprietary), SPINSscan Conventional Multi Outlet (powered by IRI), 52 weeks ending 12-29-2019
Plant-based yogurt dollar sales with dollar sales growth, by type2019

U.S. retail sales of plant-based butter grew 8% to reach $198 million
gfi.org | Page 57Source: SPINSscan Natural and Specialty Gourmet (proprietary), SPINSscan Conventional Multi Outlet (powered by IRI), 104 weeks ending 12-29-2019
$173m $183m$198m
$0m
$50m
$100m
$150m
$200m
$250m
2017 2018 2019
Dol
lar s
ales
U.S. plant-based butter market
+6% +8%
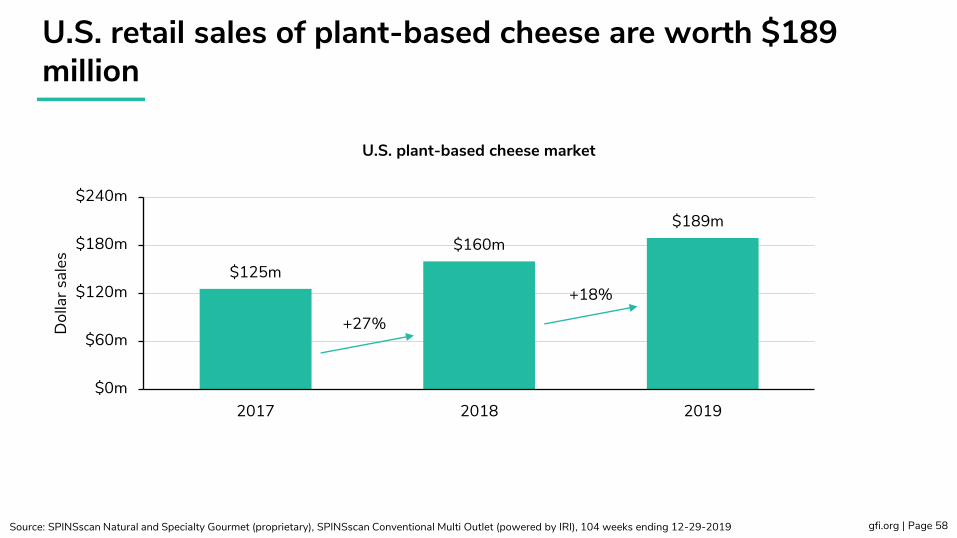
U.S. retail sales of plant-based cheese are worth $189 million
gfi.org | Page 58Source: SPINSscan Natural and Specialty Gourmet (proprietary), SPINSscan Conventional Multi Outlet (powered by IRI), 104 weeks ending 12-29-2019
$125m
$160m$189m
$0m
$60m
$120m
$180m
$240m
2017 2018 2019
Dol
lar s
ales
U.S. plant-based cheese market
+27%
+18%
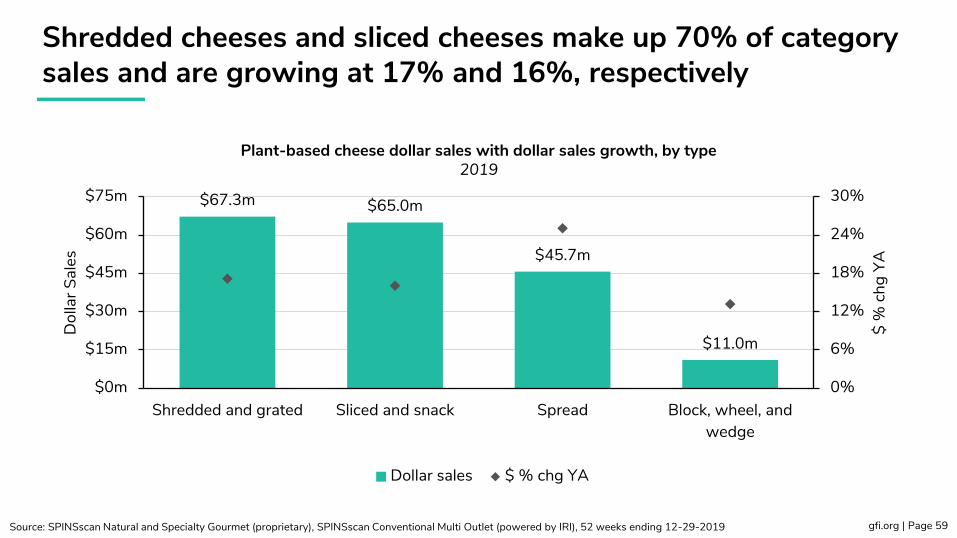
$67.3m $65.0m
$45.7m
$11.0m
0%
6%
12%
18%
24%
30%
$0m
$15m
$30m
$45m
$60m
$75m
Shredded and grated Sliced and snack Spread Block, wheel, andwedge
$ %
chg
YA
Dol
lar S
ales
Dollar sales $ % chg YA
Shredded cheeses and sliced cheeses make up 70% of category sales and are growing at 17% and 16%, respectively
gfi.org | Page 59Source: SPINSscan Natural and Specialty Gourmet (proprietary), SPINSscan Conventional Multi Outlet (powered by IRI), 52 weeks ending 12-29-2019
Plant-based cheese dollar sales with dollar sales growth, by type2019

U.S. retail sales of plant-based ready to drink beverages grew 18% to reach $122 million
gfi.org | Page 60Source: SPINSscan Natural and Specialty Gourmet (proprietary), SPINSscan Conventional Multi Outlet (powered by IRI), 104 weeks ending 12-29-2019
$88m$103m
$122m
$0m
$27m
$54m
$81m
$108m
$135m
2017 2018 2019
Dol
lar s
ales
U.S. plant-based ready-to-drink beverages market
+18%+18%
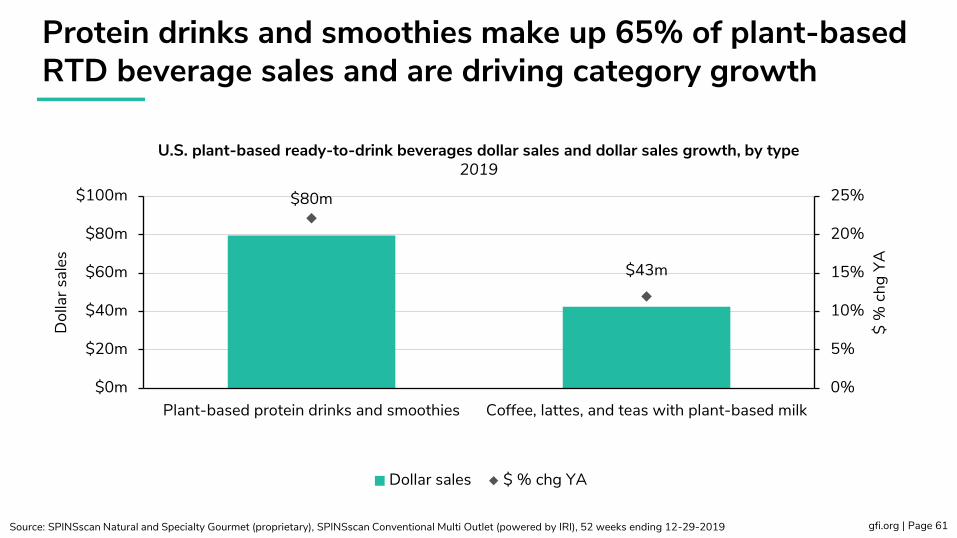
Protein drinks and smoothies make up 65% of plant-based RTD beverage sales and are driving category growth
gfi.org | Page 61Source: SPINSscan Natural and Specialty Gourmet (proprietary), SPINSscan Conventional Multi Outlet (powered by IRI), 52 weeks ending 12-29-2019
U.S. plant-based ready-to-drink beverages dollar sales and dollar sales growth, by type2019
$80m
$43m
0%
5%
10%
15%
20%
25%
$0m
$20m
$40m
$60m
$80m
$100m
Plant-based protein drinks and smoothies Coffee, lattes, and teas with plant-based milk
$ %
chg
YA
Dol
lar s
ales
Dollar sales $ % chg YA
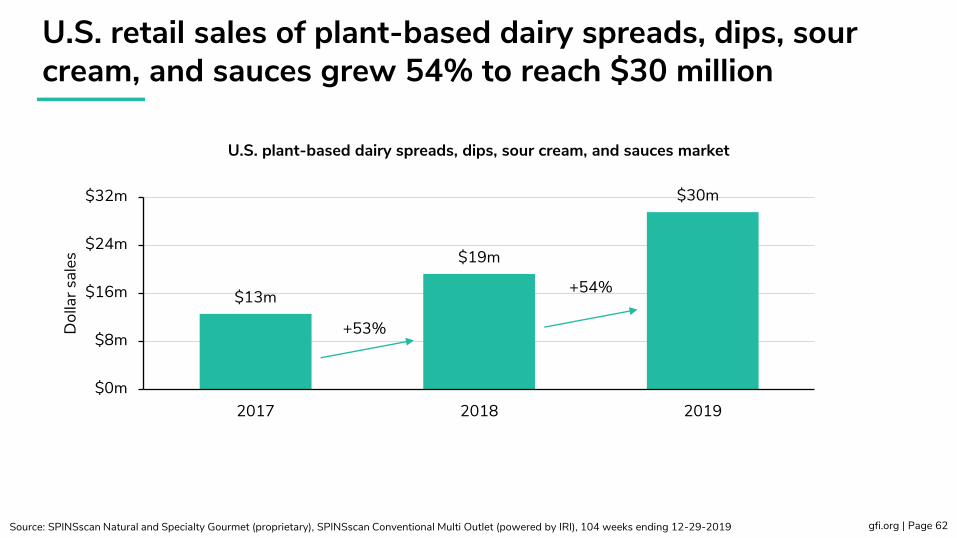
U.S. retail sales of plant-based dairy spreads, dips, sour cream, and sauces grew 54% to reach $30 million
gfi.org | Page 62Source: SPINSscan Natural and Specialty Gourmet (proprietary), SPINSscan Conventional Multi Outlet (powered by IRI), 104 weeks ending 12-29-2019
$13m
$19m
$30m
$0m
$8m
$16m
$24m
$32m
2017 2018 2019
Dol
lar s
ales
U.S. plant-based dairy spreads, dips, sour cream, and sauces market
+53%
+54%

Other plant-based categories

U.S. retail sales of plant-based meals grew 8% to reach $377 million
gfi.org | Page 64Source: SPINSscan Natural and Specialty Gourmet (proprietary), SPINSscan Conventional Multi Outlet (powered by IRI), 104 weeks ending 12-29-2019
$300m$348m
$377m
$0m
$100m
$200m
$300m
$400m
$500m
2017 2018 2019
Dol
lar s
ales
U.S. plant-based meals market
+16%+8%

U.S. retail sales of tofu and tempeh grew 8% to reach $128 million
gfi.org | Page 65Source: SPINSscan Natural and Specialty Gourmet (proprietary), SPINSscan Conventional Multi Outlet (powered by IRI), 104 weeks ending 12-29-2019
$112m $119m$128m
$0m
$30m
$60m
$90m
$120m
$150m
2017 2018 2019
Dol
lar s
ales
U.S. tofu and tempeh market
+6%+8%
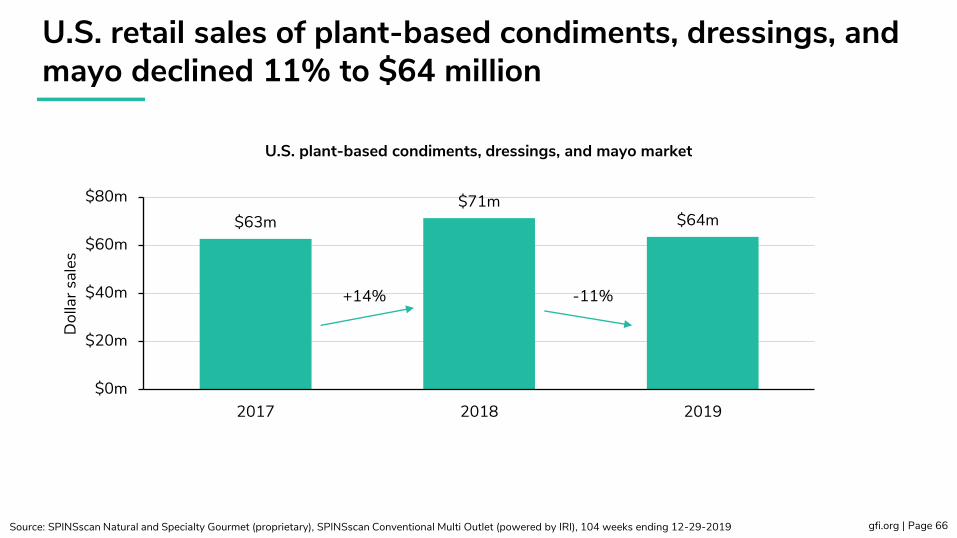
U.S. retail sales of plant-based condiments, dressings, and mayo declined 11% to $64 million
gfi.org | Page 66Source: SPINSscan Natural and Specialty Gourmet (proprietary), SPINSscan Conventional Multi Outlet (powered by IRI), 104 weeks ending 12-29-2019
$63m$71m
$64m
$0m
$20m
$40m
$60m
$80m
2017 2018 2019
Dol
lar s
ales
U.S. plant-based condiments, dressings, and mayo market
+14% -11%
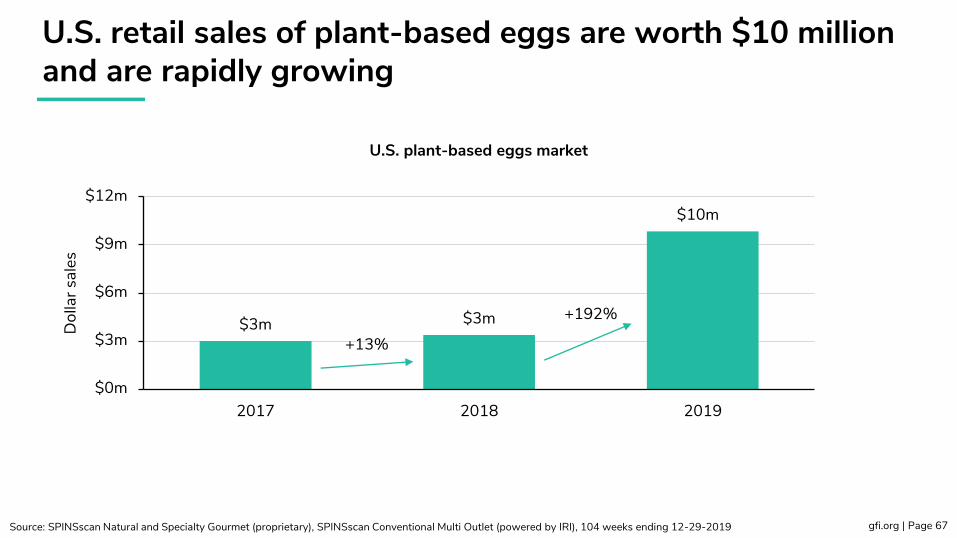
U.S. retail sales of plant-based eggs are worth $10 million and are rapidly growing
gfi.org | Page 67Source: SPINSscan Natural and Specialty Gourmet (proprietary), SPINSscan Conventional Multi Outlet (powered by IRI), 104 weeks ending 12-29-2019
$3m $3m
$10m
$0m
$3m
$6m
$9m
$12m
2017 2018 2019
Dol
lar s
ales
U.S. plant-based eggs market
+13%
+192%
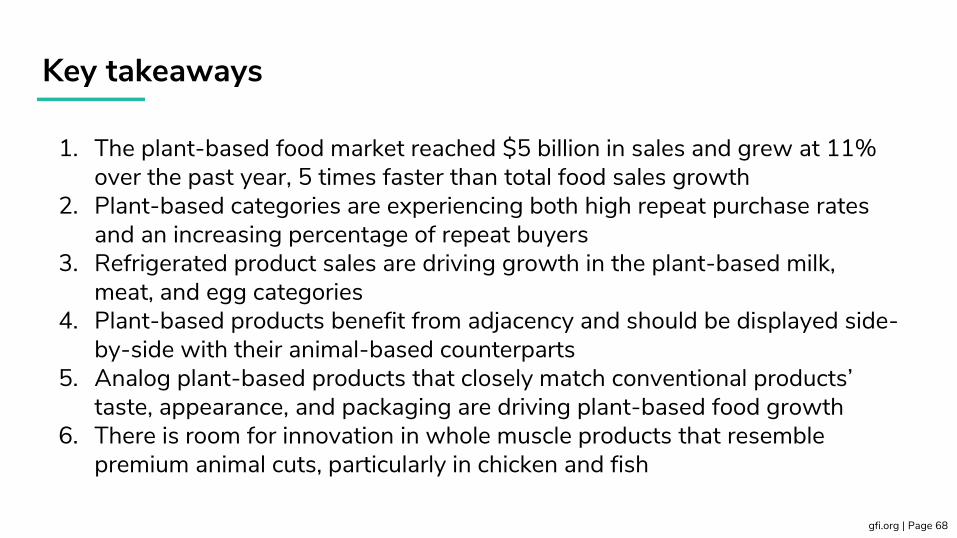
Key takeaways
gfi.org | Page 68
1. The plant-based food market reached $5 billion in sales and grew at 11% over the past year, 5 times faster than total food sales growth
2. Plant-based categories are experiencing both high repeat purchase rates and an increasing percentage of repeat buyers
3. Refrigerated product sales are driving growth in the plant-based milk, meat, and egg categories
4. Plant-based products benefit from adjacency and should be displayed side-by-side with their animal-based counterparts
5. Analog plant-based products that closely match conventional products’ taste, appearance, and packaging are driving plant-based food growth
6. There is room for innovation in whole muscle products that resemble premium animal cuts, particularly in chicken and fish

Q&A

Thank you for attending our webinar!
gfi.org | Page 70
Caroline BushnellAssociate Director, Corporate [email protected]
Kyle GaanResearch Analyst