Planning Field TECHNICAL MEMORANDUM … SITK CONTROL DIVISION Remedial Planning Field Investigation...
89
HAZARDOUS SITK CONTROL DIVISION Remedial Planning Field Investigation Team (REM FIT) ZONE II CON I R AC I \(). 0 l-()()*)2 CHj.\ \HHILL Lc:olo^y& Environment TECHNICAL MEMORANDUM PHASE II WATER QUALITY SAMPLING VERONA WELL FIELD BATTLE CREEK, MICHIGAN May 17, 1985
Transcript of Planning Field TECHNICAL MEMORANDUM … SITK CONTROL DIVISION Remedial Planning Field Investigation...

HAZARDOUSSITK CONTROL
DIVISION
RemedialPlanning
FieldInvestigation
Team(REM FIT)
ZONE II
CON I R AC I \().0 l - ( ) ( ) * ) 2
CHj.\ \HHILLLc:olo^y&
Environment
TECHNICAL MEMORANDUMPHASE II WATER QUALITY SAMPLING
VERONA WELL FIELDBATTLE CREEK, MICHIGAN
May 17, 1985

TECHNICAL MEMORANDUMPHASE II WATER QUALITY SAWM.ING
VERONA WELL FIELDBATTLE CREEK, MICHIGAN
May 17, 1985
0003071

May 17, 1985 TC-1
TABLE OF CONTENTS
Page No.
INTRODUCTION 1
A. Purpose and Scope 1
B. Phase I Investigation Errata 2
C. General 2
METHODS OF INVESTIGATION 3
A. General Procedures 3
B. Special Sampling Methods 6
C. Decontamination Procedures 6
D. Tracer Test 7
E. Chain of Custody 9
F, Quality Assurance/Quality Control Review 9
RESULTS OF INVESTIGATION 10
A. Groundwater Flow 10
B. General Water Quality Results 11
C. Off-Site Volatile Organic Results 15
1. Southern Plume 16
2. Eastern Plume 20
D. Thomas Solvent's Volatile Organic Results 22
1. Thomas Solvent's Annex 22
2. Thomas Solvent's Raymond Road Facility 25
SUMMARY 29
CLOSING REMARKS 29
REFERENCES 30
0003075

flay 17, 1985 -1-
TECHNICAL MEMORANDUMPHASE II WATER QUALITY SAMPLING
VERONA WELL FIELDBATTLE CREEK, MICHIGAN
INTRODUCTION
A. Purpose and Scope
This technical memorandum describes the methods and results of the Remedial
Investigation, Phase II Water Quality Sampling at the Verona Well Field,
Battle Creek, Michigan. This report Includes the work efforts described in
Subtask 6-8 of the July 3, 1984 Work Plan Revision, Remedial Investigation/
Feasibility Study and In part satisfies the technical memorandum described
in Subtask 6-10. The technical memorandum titled "Phase II Drilling and
Sampling, Verona Well Field, Battle Creek, Michigan" describes the well
installation, development procedures and other work efforts described in
Task 6. The purpose of the water quality sampling was to obtain a second
round of samples from selected wells sampled in the Phase I investigation
and to sample recently Installed wells in areas which required further
characterization of the horizontal and vertical extent of contaminated
groundwater. The sampling program encompassed water sampling within the
well field, at two Thomas Solvent facilities, within the Grand Trunk Western
Railroad's (GTWRR) Marshaling Yard, and other monitoring wells and private
wel ls within the study area.
The discussion of the results of this Investigation relies In part on the
general discussion of the hydrogeology as described In the technical memorandum
titled "Phase II Drilling and Sampling, Verona Well Field, Battle Creek,
0003076
May 17, 1985 TC-2
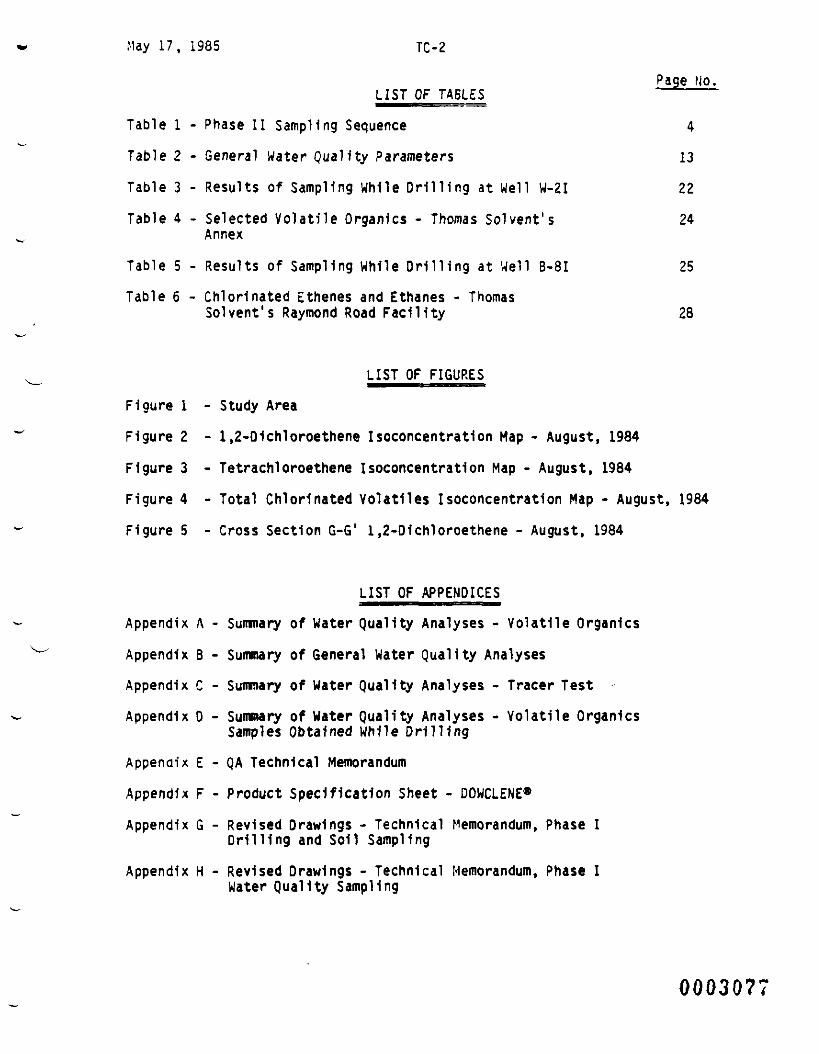
Page No,LIST OF TABLES ———
Table 1 - Phase II Sampling Sequence 4
Table 2 - General Water Quality Parameters 13
Table 3 - Results of Sampling While Drilling at Well W-2I 22
Table 4 - Selected Volatile Organics - Thomas Solvent's 24Annex
Table 5 - Results of Sampling While Drilling at Well B-8I 25
Table 6 - Chlorinated Ethenes and Ethanes - ThomasSolvent's Raymond Road Facility 28
LIST OF FIGURES
Figure 1 - Study Area
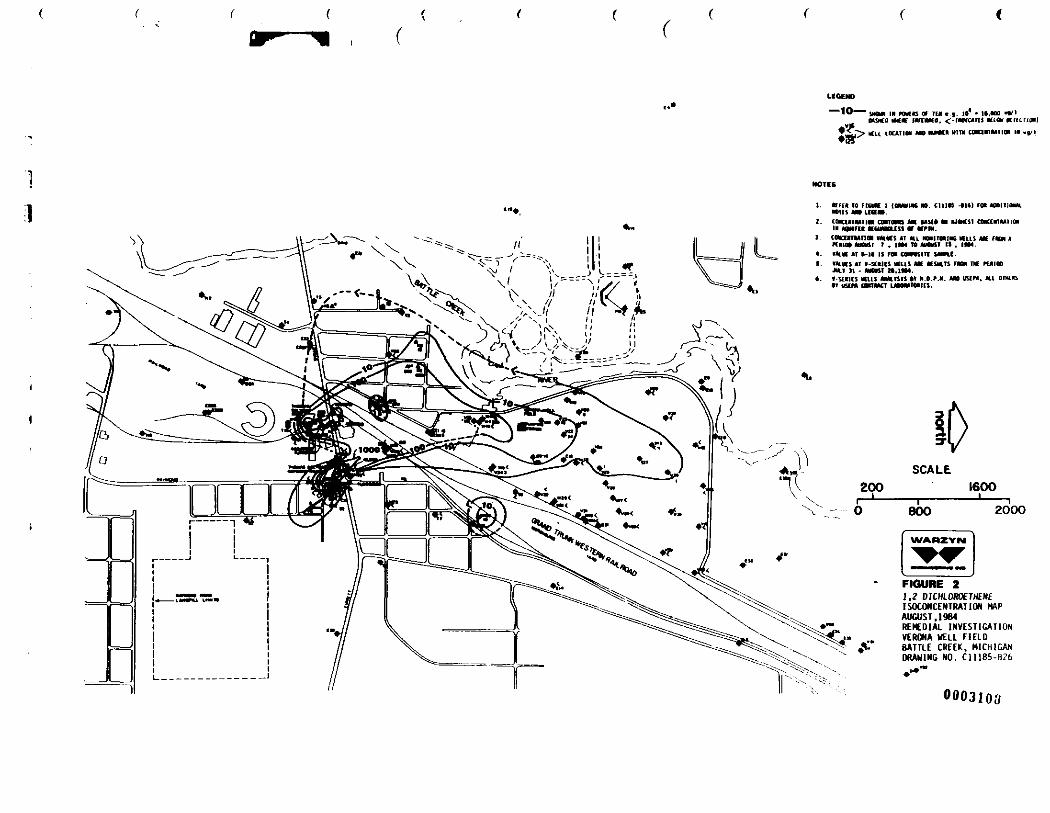
Figure 2 - l,2-D1ch1oroethene Isoconcentration Map - August, 1984
Figure 3 - Tetrachloroethene Isoconcentration Map - August, 1984
Figure 4 - Total Chlorinated Volatlles Isoconcentration Map - August, 1984
Figure 5 - Cross Section G-G1 1,2-D1chloroethene - August, 1984
LIST OF APPENDICES
Appendix A - Summary of Water Quality Analyses - Volatile Organics
Appendix B - Summary of General Water Quality AnalysesAppendix C - Summary of Water Quality Analyses - Tracer Test
Appendix D - Summary of Water Quality Analyses - Volatile OrganicsSamples Obtained While Drilling
Appendix E - QA Technical Memorandum
Appendix F - Product Specification Sheet - DOWCLENE«
Appendix G - Revised Drawings - Technical Memorandum, Phase IDrilling and Soil Sampling
Appendix H - Revised Drawings - Technical Memorandum, Phase IWater Quality Sampling
0003077

May 17, 1985 -2-
Mlchigan". A brief update of the groundwater flow direction using the most
recent water table maps is provided for clarity. The water table maps are
presented in the Phase II Drilling and Sampling Technical Memorandum.
3. Phase I Investigation Errata
Two Technical Memorandums were issued presenting the results of the Phase I
investigation, Phase I Drilling and Soil Sampling, and Phase I Water Quality
Sampling. Several cross sections were presented 1n these reports which had
minor errors In scale. Appendix G contains a new set of drawings for the
Technical Memorandum Phase I Drilling and Soil Sampling and Appendix H contains
a new set of drawings for the Technical Memorandum Phase I Water Quality
Sampling. Results of the investigation or discussion presented in the text
of these Technical Memorandums are basically unaffected.
C. General
The water quality sampling took place between August 7 and August 15, 1984.The sampling methods followed the plans outlined In the August 3, 1984 updated
sampling plan. Water samples were collected from wells as shown in Table 1(see Figure 1 for well locations). A summary of the volatile organic results
is 1n Appendix A and a summary of the general water quality results are
included in Appendix B. Appendix D contains analytical results of water
samples collected during drilling. The results of these samples provide
additional data as to the vertical distribution of the contaminants. The
methods used to collect these samples is contained in the Phase II Drilling
and Soil Sampling Technical Memorandum.
0003073

May 17, 19&5 -3-
The selected private wells, located In the subdivision north of Emmett Street
and west of the GTWRR Marshaling Yard, included three wells that had previously
shown high concentrations of contaminants identified in the well field and
two private wells located west of the private wells previously shown to be
slightly affected.
All laboratory results, quality control information and chain of custody
records are included 1n a separate document titled Support Documentation,Phase II Investigation, Remedial Investigation, Verona Well Field, BattleCreek, Michigan. The Information In that document is summarized 1n this
Technical Memorandum and 1s not essential for review of this TechnicalMemorandum.
METHODS OF INVESTIGATION
A. General Procedures
The depth to groundwater was measured using a clean, fiberglass measuring
tape with a sounding device. Water levels were recorded to within -0.02
feet. Groundwater depth measurements were referenced to the top of thesurveyed well pipe. All tools and devices were decontaminated before
entering the well as discussed below.
0003079

May 17, 1985 -4-
TABLE 1
PHASE IIWELL SAMPLING SEQUENCE
Sampling Crew: 1 Sampling Crew: 2
Date
3-7-84
3-8-84
8-9-84
8-10-84
8-13-84
8-14-84
8-15-84
SampleNumber
W-7ST-9
E-7W-13SW-14ST-6W-10I
W-12DB-23T-58-24B-25
6-88-8 1B-9B-19B-20
8-22B-21B-14
B-17B-17IB-18IB-18A8-18
5 PrivateWells(H1-H5)
PurgingMethod
Pitcher PumpPitcher Pump
Stainless BailerStainless BailerStainless BailerStainless BailerPitcher Pump
Pitcher PumpStainless BailerStainless BailerStainless BailerStainless Bailer
Stainless BailerPitcher PumpStainless BailerStainless BailerStainless Bailer
Stainless BailerStainless BailerStainless Bailer
Stainless BailerStainless BailerStainless BailerStainless BailerStainless Bailer
Pump Installed1n well (Jet Pump)
Date
8-8-84
8-9-84
8-10-84
8-13-84
8-14-84
SampleNumber
T-7W-11DT-16B-lT-lW-5S
W-1SW-1IW-3SU-2SW-2IT-ll
T-10W-4SW-4IW-40
W-6SW-6IW-6DE-8w-asW-8IW-80
W-9SW-16SW-16IE-14
PurgingMethod
Pitcher PumpPitcher PumpPitcher PumpPitcher PumpPitcher PumpStainless Bailer
Pitcher PumpStainless BailerStainless BailerStainless BailerPitcher PumpPitcher Pump
Pitcher PumpPitcher PumpPitcher PumpPitcher Pump
Stainless BailerPitcher PumpPitcher PumpStainless BailerStainless BailerPitcher PumpPitcher Pump
Stainless BailerStainless BailerStainless BailerStainless Bailer
[blc-65-12]
0003050

May 17, 1935 -5-
The total well depth was measured with the weighted tape, then the volume
of water 1n the well was calculated. Generally, 4 to 7 well volumes were
purged from each well before obtaining a sample. Wells 1n relatively lower
permeable areas (8-1, W-3S, W-14S) had 2 1/2 to 3 1/2 well volumes purged
before obtaining a sample. Two methods of purging were used:
1. Pitcher pump with, or without, galvanized steel riser pipe;
2. Hand balling using either a top loading or bottom loading stainlesssteel bailer. (See Table 1 for specific methods employed at eachwell.)
A hand-operated pitcher pump was used where groundwater was at a shallow
depth, the well could produce water quickly, and personal protection could beaccommodated. At some wells, the pitcher pump could be threaded on to the
top of the well. At others, decontaminated 1 1/4-Inch diameter galvanizedsteel pipe was threaded together and Inserted Into the well with the pitcher
pump attached. A small volume (about 1 liter) of twice distilled bottledwater was used to prime the pitcher pump. Purge water was discharged Into a
40-gallon wastewater receptacle for measuring the purged volume. The purge
water was transferred to a 300-gal Ion holding tank for disposal Into the
sanitary sewer. At the end of purging, the pitcher pump and galvanized
steel pipe were removed and placed 1n a clean area for later decontamination.
The well was then hand balled using a decontaminated stainless steel bailer
to remove the volume of water placed under suction 11ft by pitcher pumping
(about 3 gallons). Finally, the well was sampled using the same bailer.
0003081

May 17, 1985 -fa-
Hand bailing was used for collection of all groundwater samples and as a means
of purging where other methods were not practical. Two types of bailers were
used for purging and sampling: stainless steel bottom loading and stainless
steel top loading. The bailer was attached to a stainless steel cable for
raising and lowering. The stainless steel cable was pulled up onto clean
polyethylene sheeting. Care was taken during bailing to minimize aeration
of the groundwater sample.
B. Special Sampling Methods
At Well 8-18 a sample of an immiscible floating oily layer was obtained before
purging. This sample was collected using a top-loading stainless steel
bailer. The top of the bailer was lowered just below the fluid level, 1n
order to collect a sample of the oily layer. This sample is labeled as 8-18A
in Appendix A. The well was then purged and sampled as with any other well,
and labeled 8-18.
C. Decontamination Procedures
Before mobilizing to Battle Creek, all galvanized receptacles used for
washing and all galvanized steel pipe used with the pitcher pump were steam
cleaned. Each sampling crew was equipped with two clean decontamination
receptacles. One contained a tr1-sod1um phosphate (TSP) solution, the
other contained twice distilled bottled water. All water used for on-sita
decontamination came from twice distilled, glass bottled commercially
available water. All equipment and tools (measuring tapes, purge pipe,
bailers, stainless steel cable, retrieval tools, etc.) were washed in the
TSP solution utilizing stiff bristled brushes and/or clean disposable rags
attached to cleaning rods. The equipment was then doused 1n the clean water
0003082

May 17, 1985 -7-
receptacle and placed on clean polyethylene sheeting. Immediately prior to
introduction to the well, equipment was given a final rinse with clean water
directly from glass bottles. All wash water, rinse water, and purge water
was held in 300-gallon tanks for disposal at the end of the day. This water
was disposed into a sanitary sewer at the corner of Brlgden Drive and Darlene
Street.
D. Tracer Test
A tracer test was conducted between Municipal Wells v-31, and V-27 and v-28with the intent to aid in determination of the aquifer dlsperslvity between
these wells. A sodium bromide tracer was injected Into Mundpal Uell V-31
on August 11, 1984, then Municipal Wells V-27 and V-28 were monitored for
the breakthrough of bromide through time. Sampling 1s still being conducted.
A water truck, previously used for clean drilling water, was filled from
a hydrant outside of the Verona Well Field pumphouse. A 1-Hter sample was
collected from the tank to prepare a standard of 1.29 grams of sodium bromide
mixed with 1000 mllliliters of water. The specific conductivity of the
standard was measured as 1839 umhos at 25° C. A predetermined mass (11.4
pounds) of MalHnckodt analytical grade sodium bromide was slowly poured
into 1000 gallons of water while the water was being mixed with a centrifugalpump. The sodium bromide solution was mixed until specific conductlvy
measurements were observed to be within 10 percent of the standard. Results
of analysis of the tank samples showed the concentrations of the injected
water was 1002 mg/1 and 1028 mg/1 for Tanks 1 and 2, respectively.
0003033

May 17, 1985 -8-
The sodium bromide solution was then pumped into Municipal Well V-31 by way
of an Injection hose coupled to the 3/4-inch diameter airline hole in the
well head. The 1000-gallon solution was pumped at a rate of approximately
20 gallons per minute.
Before mixing a second tank load, the tank was rinsed with hydrant water to
flush out any residual sodium bromide solution. A second tank load was mixed
as before and Injected Into Well V-31. A total of 2000 gallons with an average
concentration of 1015 ppm sodium bromide salt was injected into Well v-31.
Concurrent with Injection into Well V-31, background sampling was performed
at Municipal Wells V-27 and V-28. The line of purge wells (V-20, Y-22, V-25,
V-27 and V-28) were pumped continuously throughout the duration of the test.
Municipal well sampling Is still being conducted (March, 1985) (see Appendix c
for results of this sampling).
Review of the data indicates that the bromide was not detected at the down-
gradient municipal wells. This could be due to any one or combination of
the following reasons:
• The dilution of the bromide *as larger than expected;
• Variations In background were too high to detect the bromide plumeat the downgradient municipal wells; or
• The plume migrated to other municipal wells, due to unknown localheterogeneities within the aquifer
The latter reason 1s not supported by the groundwater flow direction shown
by the August and November, 1984 water table maps.
0003084

May 17, 1985 -9-
E. Chain of Custody
All samples were subject to rigorous chain of custody procedures In the field.
In general, the procedures followed CHgM Hi l l 's Chain of Custody Procedures.
The specific details are as follows;
1. All sample bottles were labeled at the well using stick-on labels.Information provided on the label included the sample number, dateand time collected, and the samplers initials;
2. The sampler maintained custody of the sample by keeping it inhis/her possession or In a locked vehicle in an iced cooler;
3. The samples were returned to the field station (the Verona UellField Pumping Station) frequently, and there relinquished to thepreparation area technician (PAT). The PAT accepted sample custody;
4. Sample preparation Included the paperwork, affixing labels tosample jars, and packing them into coolers with vermiculite andice;
5. Samples were shipped on the same day they were collected to theappropriate laboratory via Federal Express for overnight delivery.
Documentation of the chain of custody 1s contained In the document titled
"Support Documentation, Phase II Investigation, Verona Well Field, Battle
Creek, Michigan".
F. Quality Assurance/Quality Control Review
The EPA's Quality Assurance/Quality Control (QA/QC) Review is contained in
the document titled "Support Documentation, Phase II Investigation". A
memorandum summarizing the data's quality control and how the data can be
used is contained in Appendix E. In general, the QA/QC for the volatile
organlcs analyses indicates the volatile compounds identified and reported
concentrations can be reliably used quantitatively.
0003085

May 17, 1985 -10-
RESULT5 OF INVESTIGATION
A. Grounowater Flow
The hydrogeology, including the direction of groundwater flow in the
vicinity of the Verona Well Field, is discussed in detail in previous
Technical Memorandums. However, a brief summary of the groundwater flow
system 1s necessary within this report to properly interpret the water
quality data.
Water level data were collected on August 11 and November 1, 1984. The
corresponding water table maps are presented on Figures and 5 and 6,
respectively, of the Phase II Drilling and Sampling Technical Memorandum.
The August water table map Indicates two cones of depression centered on
Municipal Wells B-14 through B-16, and on Wells V-20, V-22, V-25, V-27,
V-28, V-39 and V-40. These wells were being pumped during the period water
levels were obtained. No data was available in the vicinity of MunicipalWells V-51, V-52 and V-53 which were also pumping at this time. Locally,
the cones of depression cause groundwater flow within the aquifer to be
toward the pumping municipal wells.
The November water table map Indicates two cones of depression located southof the river and centered on Wells V-20, V-22, V-25, V-27, V-28, V-39 and
Wells V-51 and V-52. No cone of depression is shown by the selected contour
interval west of the river because of the low drawdown associated with low
pumpage rates in.that area (Well V-14 was the only pumping well).
000308G

May 17, 1985 -11-
The Thomas Solvent Annex facility is located above a broad groundwater divide.
The divide separates flow north, to the well field, and flow northwest toward
the Battle Creek River. Groundwater 1n the vicinity of the Thomas Solvent 's
Raymond Road facility Is primarily toward the northwest to the well field.
The GTWRR Marshaling Yard Is located on the southeastern flank of the well
field cone of depression. Flow is generally toward the northwest in the
direction of the well field.
3. General Water Quality Results
Groundwater samples were analyzed for volatile organic compounds ( V Q C ' s ) at
all sampled wells and all the following general water quality parameters
were analyzed on samples from the selected wells, as shown below:
Parameters Wells
pH T-lspecific conductivity T-9total alkalinity E-7chloride B-lni tri te-n1trogen B-17nitrate-nitrogen B-17Iammonia-nitrogen B-18total KJeldahl-nitrogen B-18Isulfate W-6Isulflde W-6Stotal organic carbon (TOO W-16I
Appendix B contains a summary of the general water quality parameters and
Appendix A contains a summary of the volatile organic analyses. The following
discussion covers the general water quality parameters.
Specific conductance and pH were analyzed shortly after sample collection, in
the field laboratory, at most existing and Phase II monitoring wells to:
000308

May 17, 1985 -12-
a) Determine if there are Impacts on water quality due to wellconstruction (for example, grout invasion which may result inhigh pH and high conductivity); and
b) Obtain an indication of general water chemistry in the area.
The pH of water samples ranged from 6.65 (Well W-16S) to 7.65 (Well W-8S).
Conductivity values ranged from 240 umhos/cm at Well W-8S to 2880 umhos/cm
at Well W-3S. Most samples had a conductivity of 1000 umhos/cm or less
(excluding W-3S, W-13S, W-16S, B-18 and B-21). This range of pH and
conductivity 1s within the normal range for this aquifer and does not
indicate a problem with grout Invasion. The source of the high conductivity
at Well W-3S Is unknown. The source of elevated conductivity at the other
locations 1s discussed below.
The results of pH, the nitrogen series, sulfate, sulflde and alkalinity are
within normal range for these parameters in sand and gravel and sandstone
aquifers. In addition, these parameters do not present a recognizable trend
within the area.
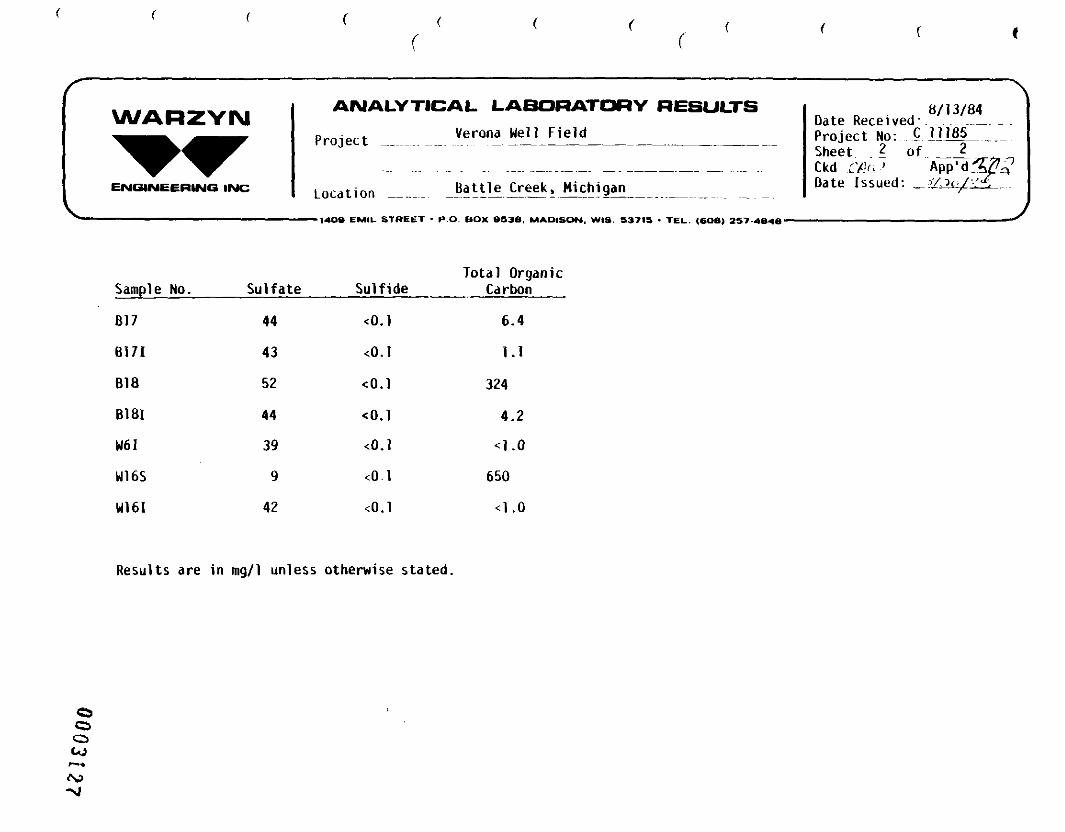
Conductivity, chloride and TOC present recognizable trends within the area.
In the vicnlty of Thomas Solvent's Raymond Road facility, Wells B-17, B-18
and W-16S indicate levels of all three parameters substantially over the
average of the remaining samples as shown 1n Table 2.
0003083
May 17, 1985 -13-
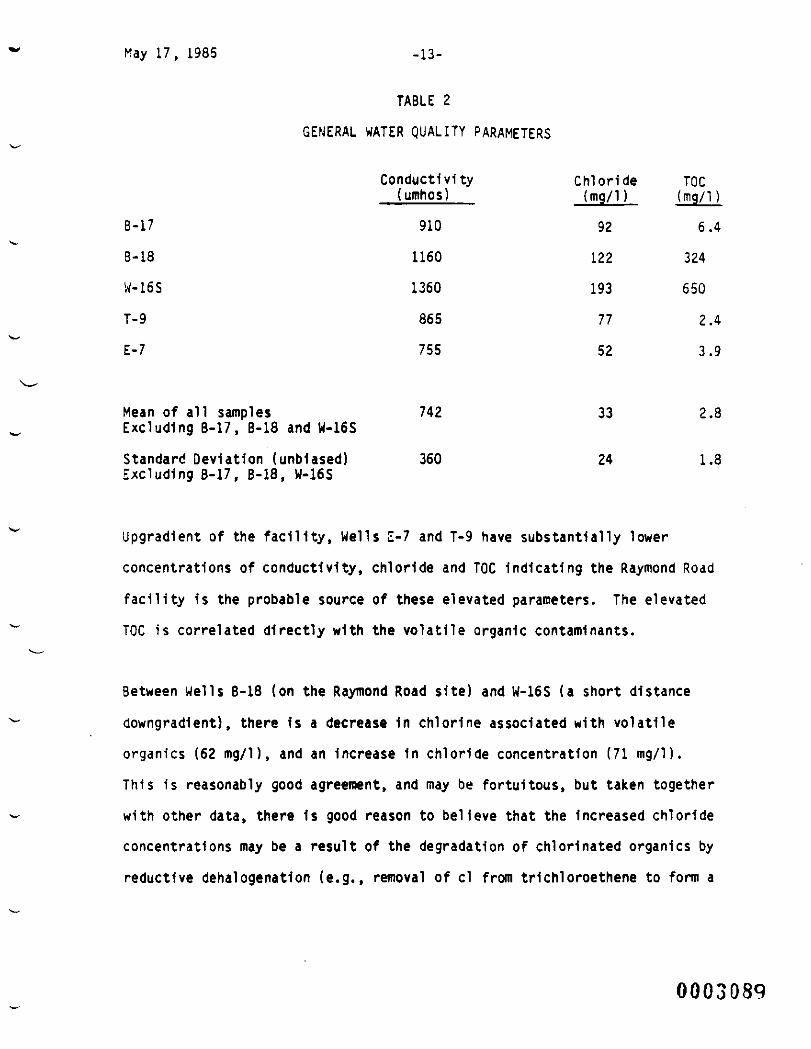
TABLE 2
GENERAL WATER QUALITY PARAMETERS
Conducti vi ty Chlorlde TOG(umhos) (mg/1) (mg/1)
B-17 910 92 6.4
B-18 1160 122 324
W-16S 1360 193 650
T-9 865 77 2.4
E-7 755 52 3.9
Mean of all samples 742 33 2.8Excluding B-17, B-18 and W-16S
Standard Deviation (unbiased) 360 24 1.3Excluding 8-17, B-18, W-16S
Upgradlent of the facility, Wells E-7 and T-9 have substantially lower
concentrations of conductivity, chloride and TOC Indicating the Raymond Road
facility Is the probable source of these elevated parameters. The elevated
TOC Is correlated directly with the volatile organic contaminants.
Between Wel ls B-18 (on the Raymond Road site) and W-16S (a short distance
downgradlent), there Is a decrease In chlorine associated with volatile
organlcs (62 mg/1), and an Increase In chloride concentration (71 mg/1).
This is reasonably good agreement, and may be fortuitous, but taken together
with other data, there Is good reason to believe that the Increased chloride
concentrations may be a result of the degradation of chlorinated organlcs by
reductive dehalogenatlon (e.g., removal of cl from trichloroethene to form a
0003089

May 17, 1985 -14-
cHchloroethene). Conductivity has a similar trend to chloride and appears
to be directly related to the source of chloride. Chlorinated compounds
which were handled on the site include tetrachloroethene, 1,1,1-trichloroethane,
trichloroethene and methylene chloride. Substantial decreases in concentration
for these substances (except methylene chloride) were observed between We l l s
B-18 and W-16S. (See the detailed description of the observed organic
compounds contained in subsequent sections.) Substantial increases in
probable degradation products, Including dlchloroethanes, dichloroethenes,
and vinyl chloride, were observed between these same two locations.
Degradation of organlcs by microorganisms is reported to take place in anoxic
or anaerobic environments, when there Is another more readily biodegradable
carbon source available. Some of the observed water quality data are consistent
with biological activity and development of anoxic conditions. Under these
conditions, one would expect lower concentrations of oxidized species of
nitrogen and sulfur. Between Wells 8-18 and W-16S, reductions 1n nitrate,
nitrite, and sulfate were observed. One would also expect a carbon source
attributable to non-halogenated organlcs. Among the volatiles, there are
several aromatics (benzene, toluene, xylenes, ethylbenzene) and ketones
(acetone, 2-butanone, 4-methy1-2-pentanone), present at B-18, which all show
lower concentrations at W-16S. In addition, there Is organic carbon, not
associated with the volatHes, at both locations. Analysis of the TOC data
shows an increase In TOC between Wells B-18 and W-16S, from 324 mg/1 to 650
rng/1. At these same locations, the organic carbon associated with the
volatiles was calculated to be 148 mg/1 and 60 mg/1, respectively, using
molecular formula stolchlometry and the data in Appendix A. The volatile
organlcs data therefore shows a decrease In total organic carbon between
0003090

May 17, 1985 -15-
Wells B-18 and W-16S, attributable 1n large part to the decrease in non-
halogenated volatile* (aromatlcs and ketones). At both locations there
appears to be a substantial carbon source in addition to the VOC's, to support
mlcrobial growth.
C. Off-Site Volatile Organic Results
The results of the volatile organic analyses indicate distinct contaminant
plumes within and upgradlent of the well field. The discussion In this
section describes the condition of the plumes in terms of the general source
areas and distribution downgradlent of the sources. Specific contaminant
distribution on the two Thomas Solvent facilities is discussed in the section
"Thomas Solvent Volatile Organic Water Quality Results".
The volatile organic analyses used to develop this groundwater quality
discussion Include:
a) Sampling performed at monitoring wells and selected private watersupply wells during August, 1984; and
b) Results from sampling of Municipal Wells by Michigan Department ofPublic Health (MDPH).
c) Results from groundwater sampling performed concurrent withwell drilling;
Isoconcentratlon maps of 1,2-DCC (Figure 2) tetrachloroethene (Figure 3} and
total chlorinated volatile* (Figure 4) were developed from samples collected
during August, 1984. The contours of these maps are based on the highest
concentration observed at each well nest or inferred to be 1n the aquifer.
The values for municipal wells represent samples collected at approximately
the same time as the monitoring well samples or represent a range from samples
collected before and after the monitoring well samples.
0003091

May 17, 1985 -16-
The results of the August, 1984 sampling confirm the general contaminant
distributions as shown by the Phase I {February, 1984} Investigation. AS
discussed In the Technical Memorandum, Phase I Water Quality Sampling, two
contaminant plumes are present, a southern plume and an eastern plume. These
two plumes were distinguished based on contaminant types and distribution.
Briefly, the southern plume originates south of the well field, extends
throughout the central and western portion of the well field and is dominated
by the compound 1,2-DCE. As pointed out in Phase I, the two Thomas Solvent
facilities are sources of the southern plume. The eastern plume was identified
in the eastern portion of the well field and 1s dominated by tetrachloroethene
and 1,1,1-trlchloroethane. The Phase I Technical Memorandum did not identify
a specific source of the eastern plume.
1. Southern Plume
The southern plume, as characterized by 1,2-DCE, 1s similar in areal extent
to the plume described in the Technical Memorandum, Phase I Water Quality
Sampling.
The contaminant distribution beneath the two Thomas Solvent facilities 1sdescribed in more detail 1n the section, "Thomas Solvent Facilities Ground-
water Quality". The following discussion of the southern plume focuses on
two areas where the Phase II data fills In areas where the Phase I data was
inconclusive.
0003092

May 17, 1985 -17-
As stated 1n the Phase I Water Quality Technical Memorandum, the water
quality between Well U-5S and Well Nest W-8 was inferred because Well W-5S
1s a shallow well and previous private well sampling in the area indicated
contamination. Phase II investigation sampled five functional private
wells within the residential area. No drilling logs were available for
these wells, however, they are assumed to be deeper than Monitoring Well
W-5S (40 feet deep). The 1,2-DCE concentration at Private Wel ls H-l (9.40
ug/1), H-2 (680 tig/1) and H-4 (570 ug/1) were relatively high compared to
Well W-5S (below detection) Indicating the plume is probably at a greater
depth than the 40-foot deep shallow monitoring well in the area. Therefore,
on Figure 2 the 10 ug/1 contour line extends beyond Well W-5S to account for
the plume which appears to be at a greater depth.
The Phase I data was also Insufficient to characterize the southern plume
between Well W-9S and Well Nest T-6/W-10I. Wells W-16S and W-16I were located
based on the soil gas sampling In this area and the flow system described
in Phase I. 1,2-DCE was not detected at Wells W-9S, T-6 and W-10I for both
the Phase I and Phase II samplings. However, Well W-16S has a 1,2-DCE
concentration of 40,000 ug/1. Figure 2 Indicates a high concentration
1,2-DCE plume leaving the Thomas Solvent's Raymond Road site and migrating
past W-16S, 1n « narrow width between Well W-9S and Well Nest T-6/W-10I.
The l,2-OCE'plw» exhibited a change from the Phase I sampling time (Feburary,
1984) to the Phase II period (August, 1984) in the area north of the purge
wells (Wells V-20, V-22, V-25, V-27 and V-28). After startup of the purge
wells, concentrations decreased north of the purge line. This change is
manifest when comparing the Phase II, 1,2-DCE isoconcentratlon map (Figure 2)
0003093

May 17, 1965 -18-
wlth the 1,2-OCE map from Phase I (see Figure 2 of the Phase I Water Quality
Sampling Technical Memorandum). The detection limit contour line has been
pulled back to the line of purge wells (Wel ls V-20, V-22, V-25, V-27 and
V-28) from Its position extending to the north end of the well field in
February, 1984 (Phase I). However, south of the purge line, the 100 ug/1
concentration contour line is In approximately the same location in both
Phase I and Phase II maps. Therefore, the purge system appears to be blocking
contaminant migration from the southern plume north of the purge well line,
while overall concentrations of 1,2-DCE south of the purge line are not
substantially different as shown In the monitoring wells.
The distribution of other volatile organic parameters 1n the southern plume
generally shows a similar but less extensive distribution than 1,2-DCE. These
parameters Include tetrachloroethene (Figure 3), trlchloroethene, and to a
lesser extent, I,l-d1chloroethane, 1,1,1-trlchloroethane, and l,2-d1chloroethane
The tetrachloroethene plume (Figure 3) 1s presented to Illustrate the similar,
but less extensive plume distribution, as well as to distinguish the southern
plume from the eastern plume.
An Isoconcentratlon map of total chlorinated volatlles (Figure 4) Is also
Included to present a composite view of the southern plume's components. The
southern plume, however, does overlay the eastern plume, as shown by this map
in the vicinity between Wells V-32 and V-25.
0003094
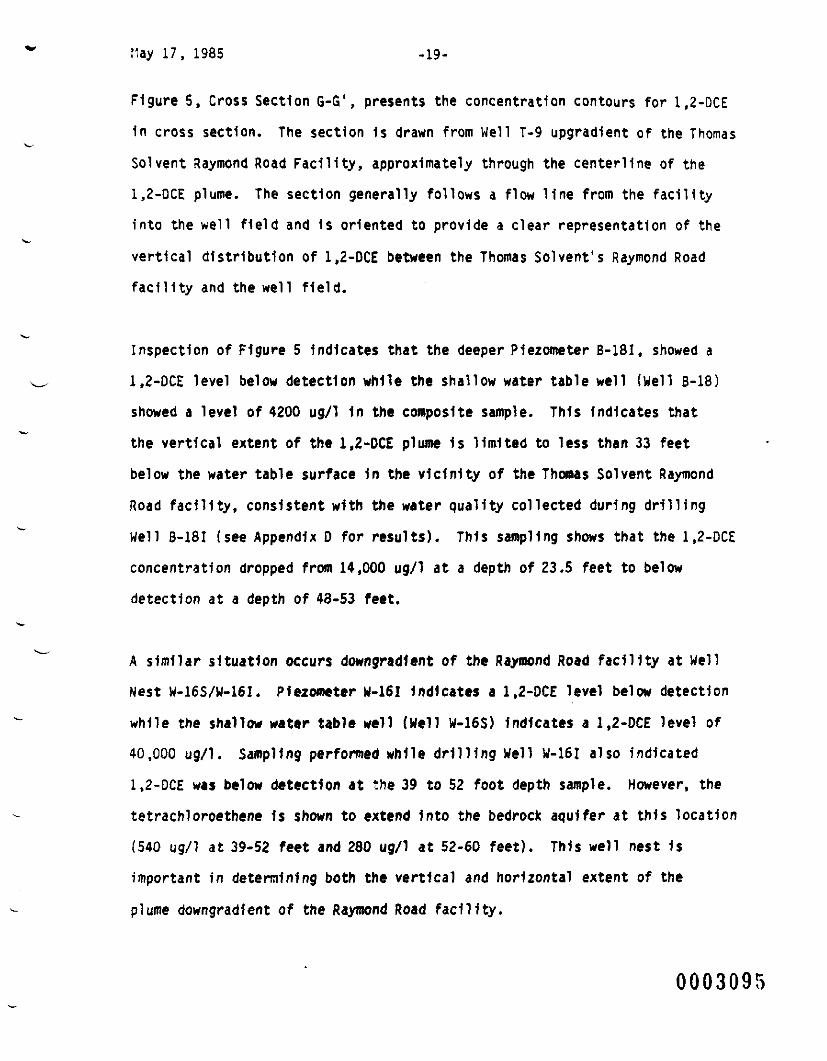
May 17, 1985 -19-
Flgure 5, Cross Section G-G', presents the concentration contours for 1,2-DCE
1n cross section. The section Is drawn from Well T-9 upgradlent of the Thomas
Solvent Raymond Road Facility, approximately through the centerllne of the
1,2-DCE plume. The section generally follows a flow line from the facility
Into the well field and Is oriented to provide a clear representation of the
vertical distribution of 1,2-DCE between the Thomas Solvent's Raymond Road
facility and the well field.
Inspection of Figure 5 Indicates that the deeper Piezometer B-18I, showed a
1,2-OCE level below detection while the shallow water table well (well B-18)
showed a level of 4200 ug/1 1n the composite sample. This indicates that
the vertical extent of the 1,2-DCE plume 1s limited to less than 33 feet
below the water table surface In the vicinity of the Thomas Solvent Raymond
Road facility, consistent with the water quality collected during drilling
Well B-18I (see Appendix D for results). This sampling shows that the 1,2-DCE
concentration dropped from 14,000 ug/1 at a depth of 23.5 feet to below
detection at a depth of 48-53 feet.
A similar situation occurs downgradient of the Raymond Road facility at Well
Nest W-16S/W-16I. Piezometer W-16I Indicates a 1,2-OCE level below detection
while the shallow water table well (Well W-16S) indicates a 1,2-DCE level of
40,000 ug/1. Sampling perforned while drilling Well W-16I also indicated
1,2-OCE was below detection at the 39 to 52 foot depth sample. However, the
tetrachloroethene 1s shown to extend Into the bedrock aquifer at this location
(540 ug/1 at 39-52 feet and 280 ug/1 at 52-60 feet). This well nest Is
important in determining both the vertical and horizontal extent of the
plume downgradient of the Raymond Road facility.
0003095

nay 17, 1985 -20-
Cross Section G-G (Figure 5) indicates that the deeper portions of the bedrock
aquifer are uncontamlnated directly below the Raymond Road facility, however,
downgradlent of the facility the plume deepens progressively so that at Well
Mest W-4, the center!ine of the plume is at least 45 to 50 feet beneath the
water table. Nearby Municipal Well V-35 1s similarly a- -:ted.
The 1,2-DCE, tetracnloroethene and total chlorinated volatile plumes are
inferred in the vicinity of Well Nest T-1/W-12D. As shown on Cross Section
G-G' (Figure 7), the wells are placed at the top and near the base of the
aquifer. As shown at Well Nests W-6 and W-4, on the same section, the center
line of the plume is 1n the middle of the aquifer. Therefore, the plume on
the isoconcentration maps (Figures 4, 5 and 6) and Cross Section G-G' (Figure
7), is shown to extend through this area.
2. Eastern Plume
Figure 3, the August, 1984 tetrachloroethene Isoconcentration map indicates
two separate plumes, an eastern and southern plume. The eastern tetrachloro-
ethene plume, as shown by this data, 1s centered 1n the eastern portion of
the well field and extends upgradient to Wells W-13S and W-14S. Results of
the August, 1984 sampling confirms results of the Phase I Investigation
which indicated that the eastern plume 1s characterized by tetrachloroethene,
1,1,1-trlchToroethane, I,l-d1chloroethane and I,l-d1chloroethene, 1n that
order of predominance. The eastern plume does not have trichloroethene,
1,2dlchloroethene, or l,2-d1chloroethane 1n significant concentrations.
000309G

May 17, 1985 -21-
The locations of W e l l s W-13S and W-14S were based on the soil gas investigation,
observations at the site and through information obtained from discussions
with GTWRR employees. Well W-14S is located adjacent to the highest soil gas
reading, and in the vicinity where GTWRR employees indicated waste liquids
had been disposed of. Wel l W-13S is located outside the "paint roon" of the
GTWRR Car Department Building.
Based on discussions with GTWRR employees, DOWCLENE* was used for at least 12
years in the area and stored in the Car Department Building's "paint room".
Its use was discontinued approximately 2 years ago (discussions held on July 19,
1984 with GTWRR employees by investigation team leader). DQWCLENE* consists
of 75* 1,1,1-trichloroethane and 25% tetrachloroethene (a product specification
sheet is included in Appendix F).
It appears the GTWRR Car Department Building Area is the source of the eastern
plume, based on:
1. The distribution of tetrachloroethene and 1,1,1-trichloroethane;
2. The use and probable disposal of these materials (DOWCLENE®) inthe area of Wells W-13S and W-14S;
3. The presence of these compounds in the soils above the water table(see Phase II, Drilling and Sampling Technical Memorandum); and
4. The apparent absence or low concentrations of these compoundsupgradlent of the GTWRR Car Department Building (at Well T-7).
Based on concentrations of tetrachloroethene, 1,1,1-trichloroethane, and
1,1-dichloroethane, it appears that the centerllne of the plume downgradient
of the GTWRR Car Department Building progressively deepens so that at Well Nest
W-2 it is at a depth of approximately 40 feet below the water table surface.
0003097

May 17, 1985 -22-
Analyses at shal low well W-2S did not detect these three parameters while
deeper Piezometer W-2I indicated significant concentrations (tetrachloroethene
81 ug/1, 1,1,1-trichloroethene 41 ug/1 and 1,l-d1chloroethene 41 ug/1). It
appears that the shallow sand deposit is relatively unaffected near Wel l
Nest W-2, while the deeper sandstone aquifer is impacted. Although the
vertical extent of the plume has not been defined at Well Nest W-2, results
of sampling performed while drilling (Table 3 and Appendix D) indicate lower
levels of V O C ' s at depth.
TABLE 3
RESULTS OF SAMPLING WHILE DRILLING AT WELL W-2I
Parameter/Sample Depth 46'-59' 57'-70' 73'-80'
Tetrachloroethene 110* 120 191,1,l-tr1ch1oroethene 210 68 101,1-dichloroethene 26 64 61,1-dlchloroethene 19 17 3Other VolatHes 10 8 _2
Total Volatiles 375 277 40
* All values in ug/1
0. Thomas Solvent Volatile Organic Water Quality Results
1. Thomas Solvent's Annex
The water quality at the Annex 1s characterized by a high concentration
of V O C ' s at Wells B-8, B-9, B-24 and B-25. Compounds with the highest
concentration at these wells are summarized 1n Table 4.
0003093

May 17, 1985 -23-
The highest concentration of tetrachloroethene and trichloroethene (TCE) is
found at Wells 3-24 and B-25 on the southern portion of the Annex. The
highest concentration is close to the southern end of the dock (previously a
waste liquid-drum storage area). Table 4 also shows a sum of the total
chlorinated ethenes and ethanes. The table indicates concentrations of the
chlorinated ethenes is approximately the same between Wells B-24 and 6-3.
This indicates the contaminants may have migrated from B-24 to 6-8, following
the flow system, but the solvents tetrachloroethene and trichloroethene have
probably partially degraded to dlchloroethene. Downgradient of Well 6-8,
at Wells 3-9 and T-5, the concentration of chlorinated ethenes is somewhat
less. This could be because the center of the plume may be below the
bottom of these monitoring wells (T-5 depth-39 feet, B-9 depth-24 feet).
This would be similar to the plume configuration downgradlent of the Thomas
Solvent Raymond Road site shown on Cross Section G-G (Figure 7). The
chlorinated ethanes do not show a similar continuity in concentration.
Upgradient Wells 3-1, W-11D and T-16 Indicated very low levels of volatile
organlcs (see Table 4 and Appendix A).
Deeper Piezometer 8-81 (54 feet deep) Indicated a very low level of VOC's,
in contrast to shallow Well B-8 (24 feet deep). Likewise, sampling while
drilling indicated a reduction 1n tetrachloroethene, trlchloroethene and1,2-OCE with depth as shown on Table 5.
0003099

TABLE 4
SELECTED VOLATILE ORGANICSTHOMAS SOLVENT'S ANNEX
(ug/1)
Parameter/Well
Tetrachloroethene
Trichloroethene
Oichloroethenes(1,1 and 1,2)
Total ChlorinatedEthenes
1,1,1-Trichloroethane
Dichloroethanes(1,1 and 1,2)
Total ChlorinatedEthanes
Ethyl Benzene
Toluene
Xylene
B-l
9
3
BDL (5)
12
BDL(5)
BDL(5)
BDL
BDL(5)
BDL(5)
BDL(5)
B-8
6,600
1,000
11,000
18 ,600
BOL (100)
150
150
1,900
750
4,900
B-9
1,700
660
4,500
6,860
BDL(IOO)
BDL (100)
BDL
BDL (100)
380
BDL(IOO)
B-24
5,300
9,000
4,040
18,300
2,300
110
2,410
50
2,700
760
B-25
4,000
6,300
1,300
11,600
530
750
1,280
1,500
3,900
4,800
T-5
40
40
5,000
5,080
BDL (50)
90
90
BDL (50)
BDL (50)
BDL (50)
T-16
2
27
BDL(S)
29
BDL(5)
Bl)L(5)
BDL
BUL(5)
BDL(5)
BDL(5)
W-11D
BDL(5)
Bl)L(5)
BDL(5)
BDL
BDL(5)
BDL(5)
BDL
BDL(5)
bDL(5)
BDL(5)
UDOOin
INJ-P-I
Otooo
BDL(IOO) - Below Detection Limit with Detection Limit shown in Parentheses
[blc-l

"ay 17, 1985 -25-
TABLE 5
RESULTS OF SAMPLING WHILE DRILLING AT WELL B-8I
_Sample Depth Selow Ground
Parameter 25'-40' 42 ' -50 ' 52 ' -60 ' 62 ' -70 '
Tetrachloroethene* 2,096 66 13 BDLTrichloroethene 270 12 4 BDL1,2-Dichloroethene 196 9 4 BDLTotal Chlorinated Ethenes 2,562 87 21 BDL
* All parameters in ug/1
BLD - Below Detection Limit of 1 ug/1
It appears that the affected groundwater 1s limited mainly to within 37-49
feet below the water table surface at this location (50 to 62 feet below
ground surface).
2. Thomas Solvent's Raymond Road Facility
As shown on the Total Chlorinated Volatile map (Figure 6), the Raymond Road
facility is a major source of contamination to the southern plume. The
contaminants on this site Include the same chlorinated ethenes and ethanes
(see Table 6) and the non-chlorinated solvents acetone, toluene and xylene
as at the Annex. The Raymond Road site also contains methylene chloride,
2-butanone (methyl-ethyl-ketone) and 4 methyl-2-pentanone (isopropylacetone
or methyl isobutylketone), not present at the Annex. Thomas Solvent handled,
by name, all tne compounds present in the groundwater at the facility except
the dichloroethenes, dichloroethanes, chloroform and 4 methyl-2-pentanone.
Benzene and ethyl benzene are both components of diesel fuel and are commonly
found as constituents of (e.g. VMP Naptha), or as impurities in the other
0003101

May 17, 1985 -26-
solvents handled on the property. The dichloroethenes and dichloroethanes
have been shown in recent studies to be degradation products of the higher
chlorinated compounds. (Cline and Viste, 1984, Parsons, et al. 1984).
iThe occurrence of organic compound degradation is supported by the following
observations:
1. The presence of "parent" compounds such as the products used on-site(tetrachloroethene, trlchloroethene, 1,1,1-trichloroethane) on theproperty and the virtual absence of the degradation products on thesite (dichloroethenes, vinyl chloride, and dichloroethanes);
2. The presence of the degradation products off site, downgradient ofthe facility; and
3. The presence of degradation by-product chlorine, 1n the presence ofchlorides, In approximately the mass predicted by the degradation ofparent compounds to daughter compounds (See discussion in 6. GeneralWater Quality Results).
The highest concentration on the property has been Identified at Well B-18,
both in the oil phase (NAPL - Non-Aqueous Phase Liquid) and water phase.
The NAPL layer contains high concentrations of compounds found in wells at
the facility with the addition of benzene and ethylbenzene. The analytical
results from sampling the NAPL are designated as B-18A and are contained in
Appendix A. The NAPL at Well B-18 was of similar thickness and concentration
as observed In the Phase I Investigation. Since the Phase I investigation,
Thomas Solvent's consultant has been monitoring wells in the vicinity and
removing the oil phase when it builds up in Well B-18. Records of thismonitoring and removal have been sent to EPA.
0003102
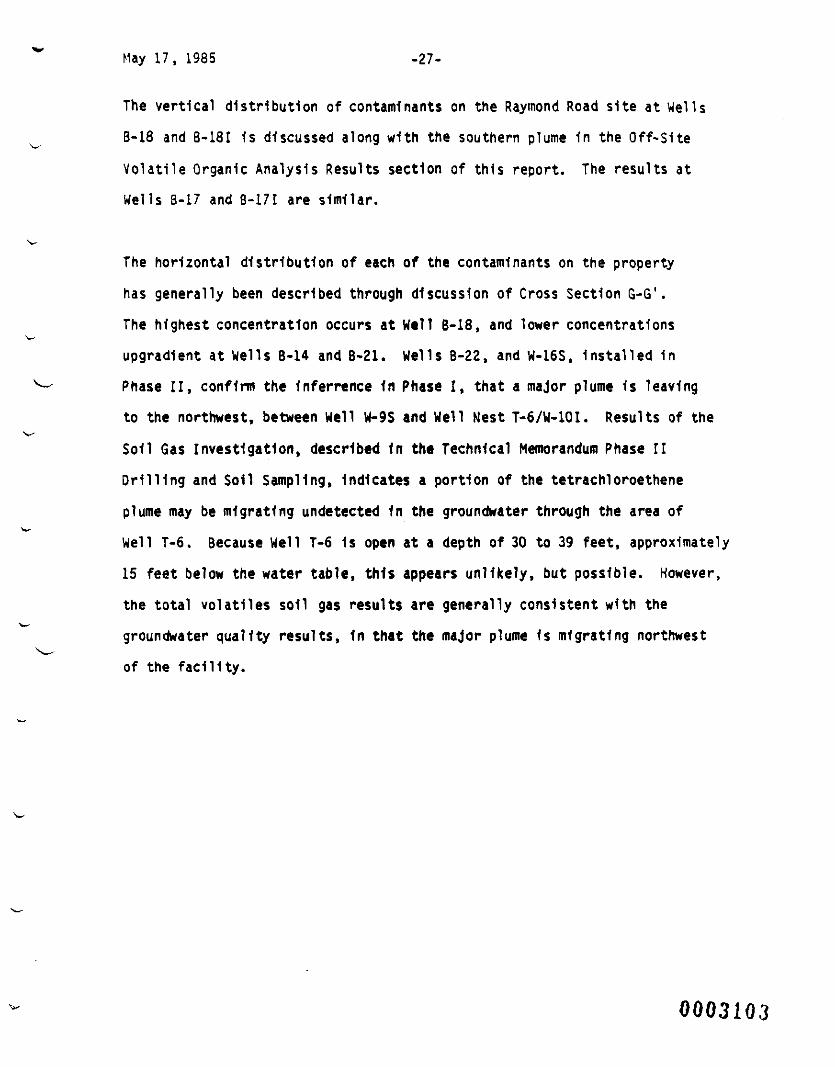
May 17, 1985 -27-
The vertical distribution of contaminants on the Raymond Road site at Wel ls
B-18 and B-18I 1s discussed along with the southern plume 1n the Off-Site
Volatile Organic Analysis Results section of this report. The results at
Wells B-17 and B-17I are similar.
The horizontal distribution of each of the contaminants on the property
has generally been described through discussion of Cross Section G-G' .
The highest concentration occurs at Well B-18, and lower concentrations
upgradient at Wells 6-14 and 8-21. Wells B-22, and W-16S. installed in
Phase II, confirm the inferrence In Phase I, that a major plume 1s leaving
to the northwest, between Well W-9S and Well Nest T-6/W-10I. Results of the
Soil Gas Investigation, described In the Technical Memorandum Phase II
Drilling and Soil Sampling, indicates a portion of the tetrachloroethene
plume may be migrating undetected in the groundwater through the area of
Well T-6. Because Well T-6 1s open at a depth of 30 to 39 feet, approximately
15 feet below the water table, this appears unlikely, but possible. However,
the total volatlles soil gas results are generally consistent with the
groundwater quality results, in that the major plume is migrating northwest
of the facility.
0003103

TABLE 6
Parameter/Wen
Tetrachloroethene
Trichloroethene
Dlchloroethene(1,1 and 1,2)
Total ChlorinatedEthenes
1,1,1-Trichloroethane
Dlchloroethane(1,1 and 1,2)
Total ChlorinatedEthanes
CHLORINATED ETHEMES AND ETHANESTHOMAS SOLVENT'S RAYMOND ROAD FACILITY
(ug/1)
B-14
1,300
BDL (50)
BDL(50)
1,300
BDL (50)
BDL(50)
B-17
75,000
710
BDL(500)
75,710
570
BDL (500)
B-171
BDL(l)
BDL(l)
BOL(l)
BDL
BDL( l )
BDL(l )
B-18
25,000
53,000
6,200
84,200
37 ,000
5,400
B-181
93
11
BDL(l)
104
BDL(l)
BOL(l)
B-18 A(Oil)
35X106
35xl06
BDLC(IxlO6)
70xl06
20X106
BDL(IxlO6)
B-19
210
190
6
416
220
B D L ( l )
B-20
510
400
15
925
350
BDL(5)
B-21
32,000
1,400
11,000
44,400
10,000
BDL (500)
B-22
170
110
65
345
270
8
BDL 570 BDL 42,400 BDL 20xl06 220 350 10,000 278
ooin
1IV)001
BDL - Below Detection Limit with Detection Limit Shown In Parentheses
ooCO
[blc-65-12]

May 17, 1985 -29-
SUMMARY
Based on this discussion of the Phase II Water Quality Sampling Results, the
following points can be made:
1. Results of this Investigation has further defined the extent of thesouthern and eastern contamination plumes.
2. The southern plume Is limited to within approximately 20 to 25 feetbelow the water table surface In the vicinity of the Thomas SolventRaymond Road facility and Annex. The plume deepens progressivelydowngradlent of these two facilities.
3. The eastern plume appears to originate near Wel ls W-13S and W-14S1n the vicinity of the car department building on the GTWRR MarshalingYard property. This plume also appears to be concentrated atthe water table at the source area and to deepen downgradlent.
CLOSING REMARKS
This Technical Memorandum has summarized the Phase II Water Quality Sampling
investigation conducted In August, 1984. Results of this Investigation will
be integrated Into the total site analysis in the Remedial Investigation Report.
Respectfully submitted,
UARZYN,ENGINEERING INC.
Kenneth J. Qufnn, CPGSProject Manager
AJS/KJQ/cac/DRVCblc-65-12]
0003105

May 17, 1985 -30-
REFERENCES
CHne, P.V.; and V1ste, D.R. 1984. Migration and Degradation Patterns ofVolatile Organic Compunds. In 5th National Conference on Managementof Uncontrolled Hazardous Waste Sites, HMCRI, November 1984.
Parsons, F., Wood, P.R., and OeMarco, J. Transformation of Tetrachloroetheneand Trlchloroethene 1n Microcosms and Groundwater, JAWWA, February1984, P. 56-59.
000310G

ICOCNO
-= ••— MltD KMB
=.--";=; HTMU V*0
————• IUI1
WILBIM
UILIMO
FENCC
MMOMI1
c^>WO WMJIMIHC tfu
NWICIMi Wll
NOTE*
MIWTE MIL LOUUtM
iU( NV MtMMB >T CHlOKO MERIM SUtttf fMM IIISliKMM M* All fMIO IfCNHMl IMt).
[UMIIM ««» OF « MO I lltKI Kill HOMHCI l¥ CHICMO MIM IMrtI IKMMWI 10M «• MOtflMOI).LOUIIOM OF * uiiu mis Mill m uiuiwi wr MOVIMB•t M cm 01 Mini OKU.I.E. Ml ( 1MKS Hill. MB MU* H MB Ml IOU!IO» MMU MU.S.fi.I. MUUHMIt MtUU MK MB "Mil* FiIOM.
SCALE200i 1600
800 2000
M/ARZYN
FIGURE 1STUDY AREAREMEDIAL INVESTIGA!1UNVERONA WELL FIELDBATTLE CREEK, MIGUbAHDRAWING NO. Cll lBb-ti lu
000310
r
*»-' MOM IN KMK Or JIM >.). Of • 10.KH "•/'
ODJWO MCM lIFttMO. <-l«CI«HS HLOM HlttTIQH)
> Mill lOWIIOH MO MMU H1IN COEWMIIOI !• .«/!
«IF(JI 10 FIBM I (OHHMC W. C111M -lit) f•ttli DM LKM.CUCUIMIIM OMIOMU «KIN MWKEI HUMMUS! « KM*
»l«€i! CWCMIMIKH
M ML MHIKWIM Kill W F«M *Hill* MMttl r , 1M4 TO WGHH IS . IM4.>*IH M •-!• ii ret cavosin iMvit.•ligtS AT »-!(«] (1 UtLll Mi KIMIS FKH TIC rUIODJULT 11 • MQKI ».1M4.«-S£llEi Will MMKIl It N.O.F.M. MO UUN. Mi OTHtKoi WSIM canMcr
t>SCALE
I6OO
800 200O
WARZYN
FIGURE 21.2 DICHLOftOCTHENEISOCONCENTRATION HAPAUGUST.1964REMEDIAL INVESTIGATIONVERONA WELL FIELDBATTLE CHEEK, MICHIGANDRAWING NO. C11185-826
0003103

t
j-JU
kCOCNO
liOOMCUIMIION COnOW (COIKM 1NIERM1 Li—10—" ym. IN KM is of iu •.«. W* • 10.000 »t/i
DAIHIB IMtt IMIMCB, <-IMIUKl KLOM HIU11MI
*2i> WU iOUII« «<• «•«• «"" »tt«Mlt» M .»/'*»
KF(I 10 FIUM I 1MUMIM, M. ClllK-Ut) 10* JWUIMIf I MO UCOB.
llSCALE
1600
800 2000
WARZYN
FIGURE 3TETRACHLOROETHENtISOCONCENTRATION HAPREHEDIAL INVEST IUU luNVEROMA HELL FILIDBATTLE CREEK, M lCn i t .ANDRAWING NO. CMlti'j ii./
0003109

liOOKIBTMIIH CMIOM |OMHU IMKIMl 11TIB •-«. It* • I0.0M ••"
UHMtt. <.|MIU!UHllWafl[tIIOi
LOUTIOI MB MMU HUH OW(«UU(M !• -ft/:
•**
1111)
-"N
1111Li
#•
ss''(/ \l>f
u*.
1. MFEI 10 HCM 1 (MUWUK tt.iMill MB UtfM.
SCALE200 1600
800 aooo
WARZYN
FIGURE 4TOTAL CHLORINATEDISOCONCENTRATION HAPAUGUST.1984REMEDIAL INVESTIGATIONVERONA HUL FIELDBATTLE CREEK, MICHIGANDRAWING NO. C11185-B32

tie HO.otic w«i uciioH ut UREMI. » MIWE MO u>«H rtMKM 10 M W EUC1 KnuUHHOl Of SU1UVKC
OETKU HUMS.1. MSTIM NMK$ MDCtH ««0tl( Win 1NBIUTEI WE MHKT
II MttMEI.}. *I (MM GMMUNMfl MNITMM UELl 01 ttVOCIC OM1NG IK
lOCATUM M OQHUt l« II MtUMIElt lOCAHl HITH MSMCI1» NMIIOI1M. IKJIIIOi MB (UIICM BETTM Of tfdOCIC Win.DC ««M!C Win NM KM OUEMllItl. KMIIEB KtCOir-T1«M Mi MIKKTU W M MM IOB II M KOWMfHCnn Mwsciin.
*. *U CHUKIC WIT CCHIICn MD DC MIEI IMU UWKt MEMOW to M cum or iw MM iac. M.I MIIWIM tisiMcnMf WtUOC* HIM KIKtl » M CUTE! Of E*U MIW tM.
*. MU KPTM M» ICMIOtO 01 OHN inEklKLI Mt MOW ffl*ItLWItallN fWMKt. MfEOUCE KN*T WHMICES fOk HEllCOniOKIMi KHIlt tm OWING IOSS rot KCUT H * ISEMItl KLII Km OOtlOBI. WHICINL «Ll IOB •!»!*» f««TIC CIK «F MHU COfU.
«. GMWOMKO «*UJ ( -2- ) Bf TEMMB (KM UMtt IC«EL•uoMfjon Munu M MGWI n.im.
i. MM ueu union ME (IMCMMIEB «taiic«.i 10 n«s
LCOEMD
—1OO— cona»i«*i
HORIZONTAL |QO SCALE800
LEGEND VERTICAL 10
400
SCALE
1000
40
TVPCAL weu. oeiAi,
D ma IM M •••! !•••)•(.VBI »^ " ^^——1 - -
II ••*• •* • MB MU MM UUttW* mm W11M UM1HHB.
80
100
WARZYN
FIGURE 6SECTION G-G'1,2 DICHLOROETHENEAUGUST.19B4REHEDIAL INVESTIGAIIUNVERONA U£LL FIELDBATTLE CfttEK, MICHIGANDRAWING NO. Clllbb-BJJ

APPENDIX A
SUMHARY OF WATER QUALITY ANALYSES VOLATILE ORGANICS
WAMBVN
0003112

PHASE IIHftTEfc QUALITY SAMPLING RESULTSVERONA WELL FIELDCASE 3070
VOLATILE OfcGANICS fll BlOUP
BB BBI B14 B17 B17I BIB B16DUP
AcroleinAcrylonitrilcBenzen*Carbon Tetrachlori.deChlorobenzen*1 . 2-Dichlorootbanel,l,l-Trlchloro«thaniI . l-Dichtor<Mtb*n*1.1,2-Trlchlorcwthan*1.1.2, 2-Tetrachloco«thaneChlorocchan*2-Chloro»thjrlvinyl EtherChloroform1 . 1-Dichlorootbcnc1 ,2-Dicbloro«tb«n«1 ,2-DichloropropancTrans-1 . 3-Oichloroprop«n«Cia . 1 , 3-Dictaoroprop«n*Ctbylb«nxancHetbyl«n* ChlorideChloroaethancBr omomc t ha.n«firovofor*
FluorotricblorovethaneCh lor odibroaoM thaneTetracblorocthen*TolueneTrichloroetheneVinyl ChlorideAcetone2*butanoneCarbondiaulf ide2 -Hexanone4-Methyl-2-PentanoneStyreneVinyl AcetateTotal XylenesTotal VolatilesTotal Chlorinated Volatile*
2420
150
150
11,000
1,900200
6,600750
1.000
1.600
4.90028,25016,950
570
2.300 2,BOO
5,400 6,80037,000 43,000
4,500
160
1,700380660
290
1.300
6904,800
75.0001.400
710
5,600
11
2.0004.200
3.40012,000
55.00015,000
4.700
2.5004,600
4,10013,000
25,000 22.00055.000 59.00U53,000 67,000
62,00016,000
4,900
7.4007,020
1,5901,590 Bl.OBO
15,000 IS.OOu11 289,000 322,70011 138,600 153,900
ooO

PHASE nHATER QUALITY SAMPLING RESULTSVEfeONA «3.L FIELDCASE 3070
VOLATILE ORCAMICS B18A B1BI BIS B20 B20 fi21 B22 B23 B24 B25(U9/1I OOP
AcrolelnAcrylonltrllefianzen* 1,400,000 1,000 92 90 20Carbon T*teachlorideChlorobcnsan*1.2-Dichloro«than* 21.1,1-TricblortMtban* 20,000.000 220 350 470 10,000 270 12 2,300 5301,1-Dtchloroathan* 4 B 120 110 7501.1,2-Trichloroethane1.1,2,2-T*tracblor<Mthan«Chloroethan*2-Cblorocthylvlnyl EtherChlorofom 9 10 720 4 21.1-Dichloro«tb*n* 13 2B 40 301.2-Dichloro«tbcn« e 15 21 11,000 . 52 820 4.000 1,3001,2-OichlOropropan«Tran»-1.3-Dichlorof>ropeneCi», 1,3-DicblorOf>rop*MEthylhcnzenc 6.400,000 « 1.600 So 1,500Hethylcm Chlorjda 2.700,000 13 13 18 4,200 37Chlorovethan*firomomttbaneBrcwofor*fir oaod i chlor ovethanePluorotrichloroncthane 20 20ChlorodibroBOMcthaneTetracbloroeth*nc 35,000,000 93 210 510 fibO 32,000 170 390 5,300 4,000Toluene 46.000.000 7 17,000 1 53 2.700 3,900Trichloroethene 35,000,000 11 190 400 400 14,000 110 720 9.000 6,300Vinyl ChlorideAcetone 27 6,000 902-butanoneCarbondisulfide2-Hexanone ^94-Hethyl-2-Pencanone ?StyreneVinyl AcetateTotal Xylenes 24,000.000 13 5>,buo 130 7bO 4,800Total VoUtlles 170,500,000 172 626 1,297 1,769 103,120 t>65 2.405 2 4 , 3 7 0 23,240Total Chlorinated Volatiles 92.700,000 121 626 1,297 1.769 71.920 bb4 2.094 20,770 12,930
oooCO

oooOJ
PHASE IIHATER QUALITY SAMPLING RESULTSVERONA HELL FIELDCASE 3070
VOLATILE ORGAN I CS Mil HIS H2I M2S H3S M4S H4I H4l H4D H5S U6Slug/It DUP
AcroleinAcrylonitriltBenx*ncCarbon TetrachlorideCblorobenzvn*1 . 2-Dicbloroctban*1,1,1-TricblorovthAiw 3 4 1 1 7 7 1 6l,l-Dichloro*tban* 41 14 141 . 1 , 2-Tricblorcttthani1.1.2. 2-T*tracbloro*thaneChl or o« than* 15 132 -Chl or «t by 1 vinyl EtherCbloroforB1 . 1-Dicbloroetfacnc 6 11.2-Oicbloroctbmc 210 220 51 .2-Dicbloroprof>*n*Truni- 1 . 3-DichloropropeneCi» , 1 , 3-OicbloropropcncEthylbenzcncM*tbyl«n* Cblorid* 1 24 11 IB 30Chl or o»e t h>nc
bromotonBr o»od i chl or o»et baneFluorotrichloroMethane 2 2 2 3 3 2Ch 1 or od i br omomf t haneTetrachloroecbcne 4 61 2 1 12 11 jTolueneTrichloroettiene S 2 9 1 9 1 i t > uVinyl Chloride 140 130 7Acetone 6 5 1 42-butanone 10Carbondi sulf ide2-Hexanone4 -Methyl - 2-pcntanoneStyreneVinyl AcetateTotal XylenesTotal Volatilea S 17 173 10 12 2 514 497 30 2 .',JTotal Chlorinated Volatile* 9 7 173 4 7 2 514 497 30 2 - tt>

PHASE IIHATEft QUALITY SAMPLING RESULTSVEkOMA HELL FIELDCASE 3070
VOLATILE ORGANICS H6I M6D H7S H6S HBI M80 H9S H9S N10I W11D H12Dlug/11 DUP
AcrolcinAcrylonitrlleB*nz*n« l 530 5bOCartoon TetrachlorideChlorob*nz*n«1 , 2-Dicbloroccbane 3 5l.l.l-Trichloro*tbane 2 3 41 , 1-Dicblorotthan* 12 4 1 . BOO 1 , BOO1.1, 2-Tri cbloroctfaan*1.1.2. 2-TctracbloroetbaneCbloroccbanc2-Cbloroctbylvinyl EtherChl or of or*1 .1-Oicfalorocthene 31.2-Dichloro*th«n« 130 91 67 51,2-DichloropropaneTrans-1 .3-Oichloroprop«neCii , 1 . 3-Dichloroprofwn*EthjLbcnzenettetbylenc Chloride 21 32 51 16 13 960 960Chl or OM than*
Broaof or»Br ovod i chl or o»e t banePluorotnchloroqethane 4 2ChlorodibroKOBe thaneTetrachloroethene 52 3 22 22 2 , 300 1 , 200Toluene 4 , 300 4 . 300Trichloroethene 1/0 6B 24Vinyl Chloride 25 2 610 530Acetone 12 12 6 5,600 5,1002-Butanone I ,100CarbondiauHide2-Hexanone4 -Het hy 1 - 2 -Fentanone 560 680StyreneVinyl AcetateTotal Xylenes 330Total Volatiles 431 44 13 235 144 13 17.010 16.230 2Total Chlorinated Volatiles 416 32 7 235 144 13 5,670 4,490 2
oo

oooCO
PHASE IIHATES QUALITY SAMPLING RESULTSVERONA WELL FIELDCASE 3070
OftGAMICS H13S H14S U14S H16S H16I Tl TS T6 T7 TS T10tug/ It OOP
AcroUiaAerylonitril*
«M 1 . 900 SOorotxnxtiM
1 , 2-Dlchloro» thane 11 . 0001 .1 .i-TrichlorocthaiM 1 .350 1 .050 1 ,300 4 .800 2 101 , 1-DichlorMthan* 40 1 ,630 2. 100 5 90 31.1, 2-Tr ichloro*tJ>*n* 401.1.2. 2-T«tr«cbloro«thaneChloroethane 14 202-Cbloroetbylvinyl EtherChlorofor*1.1-Dichlorocthcra 41 60 501 . 2-Dlchlorocthuie 10 6 40 , 000 IB 5 , 000 B1 ,2-DichloropropaneTrans-1 , 3-DicbloropropeneCi». 1 ,3-Dichloroprop«n«
H«tbyl«nc Cblorld* 16.000 S3CblorOMtbui*brovovethanc
broauii4chl oro»e LhtneFluorotricbloro«ethane 2 2 3 0 2 1 0 0 4 3Ch 1 or od i broKcmet h*neTetrachloroetttcne 3,070 10.500 9.700 3.200 170 40 3Toluene 26.000Trichloroechene 190 160 46 40 5 7Vinyl Chloride 2 2,300Acetone 26,000 92 72-butanoneCar bond i sulf ide2-hex*non*4-Methyl-2-Pentanone 3.200StyreneVinyl AcetateTotal XylenesTotal Volatile^ 4 .513 13.456 13,360 136,400 223 73 5 .452 0 4 29 l^Total Chlorinated Voiatiles 4,513 13,456 13,360 77,300 223 73 5,310 0 4 22 19

PHASE IIHATE* QUALITY SAMPLING RESULTSVERONA tCLL FIELD
3070 ORGAMICS T16 £7 Efl £14
AcrolM*AcrylenltrlU
HI H2 H3 H4 H570 PICKFORD 46 HAXftELL 72 PICKFORD 135 BRIGDCN QUAD L
Cartoon TetracfalorideChlorobenMM1 .2-Dlchloroa thane1 , 1 . 1 -Tricolor oethaoe1 . 1 -Oicbl or MtlutiM1.1. 2-Trlehloro«tbu»1,1.2. 2-TtttrAchloro«thuMChlorocthuw2-Chloro*tbylvliirl EtharChloroform1 ,1-DicbloroctlMM1.2-Dicbloro*tlMM1 . 2-DichloropropWMTrana-l . 3-DichloropropwwCi» , 1 . 3-CUchl.oropropwie
ttethylam Chlorid*ChlorcNHtbMW
10
40 13
SS43
980 12
36
27
680
ISO
hfomoiormfir oaod i chl orOPluorotricblorcNMtbancCblorodibroMMtbvttTetracbloroethMMTolueneTr i chl or octhciwVinyl Chlorid*Acetone2-ButanoneCftrbondi »ulf id*2-Hexanone4-Hechyl-2-Pcnt«noneStyreneVinyl AceteteTotal XylenecTotal VolatileaTotal Chlorinated Volatile*
27 370
632
260
107
3232
46846B
33876
290160320
300240
2.4641.784
12
570
120
4B2661
170130
2424
905905
1.125799
IBI B
ooCO

PHASE IIWATER QUALITY SAMPLING RESULTSVEfcOMA tCLL FIELD
nnriNrrn TANK i TANK 2 010 on FIELD BLANKS ——012 014 015
MrylcnftriJeItntMMCarbon Tvtracblorid*
1 ,2-DicblorMthaM1,1. 1-Tricfcloroetttao*1 . 1-DichlarMtbftM1 , 1 ,2-Trlchloro>tlMm1.1,2, 2-T*tr«chloro*tb*neChloroctbanc2-ChlorcMtbylTinrl EtterCblorofor*1 .l-Dichlorocthww1 ,2-DicblorovttwM1 , 2-DlchloropropwwTrans-1 . 3-Olchloropropane
Ethflb«nx«ncHethyltn* Cblorid*Chl oroMtban*
24
Broaofor*fir o«od i cb J oroM CbancFluorotrichloroMthancCh 1 or odlbroMwc thaneTetracbloroethuwTolueneTrichloroctbcn*Vinyl Chlorid*Acetone2-EtutanoneCarbond i a u if ide .2-Hexanonc4-MethyJ-2-PentanoneStyreneVinyl AcetateTotal XylenexTotal Volatile*Total Chlorinated Volatilea
23
19
17
15 1213
4424
4223
13B
316
1919
ooo00
APPENDIX B
SUMMARY OF GENERAL HATER QUALITY ANALYSES
WAftZVftl
0003120

WARZYPJ
ENGINEERING INC
_ ,*nm run
DATE SAMPLED: 8/7/84
Sample No.W7ST7T9E7
DATE SAMPLED: 8/8/84
W10IT6MUDTl 6-808W5S81TlW13S-808145-808
DATE SAMPLED: 8/9/84
W2IW2S824
825W1IW3S
B23T5
W12D
W1STil
APJAUYTICAU UABORATORY "NRESUUTS n ^ r o 5 p r p w p H . g /7 - 1 5 /34
» -M Verona Well Field ' Project NO: C 1 1185 . jbheet I i of 3 1
,___ Battle Creek, Michigan ^fL- -App d~ |
-TL ttr-i, -«- —— -^
FIELD ANALYSIS SUMMARY "NConductivity !
pH I? 258C Alkalinity(S.U.) (umhos/cm) (mg/1)6.90 5006.90 4906.90 870 . 3956.95 755 372
7.05 5357.20 6007.35 5057.30 8157.30 7557.35 510 2397.30 630 2447.00 11607.30 820
7.20 7607.40 5007.00 7607.05 5657.20 5056.95 28806.90 8757.10 8907.25 4957.20 7557.05 760
0003121

ANALYTICAL LABORATORYWARZYIM
ENGINEERING INC
i^HQ EMtL. 3T»B«T • P O. «OX «3». MADISON, WI3. 3J / . 3 "• •- •
RESULTS -a.a ?*r*, ,^.-'"~'~ "'Verona Well Field Pro je<- f Nn- C 1 1 1 3 5
Proiect ——— —————————— ————— ———— 5heet 2/ of 3
————— Battle Creek. Michigan —————— Cr"^d. ^'^L^^Bi1^" —————————— - — •• Date issued. _ ____ ___
«Tmm,T . P 0 BOX «3«. MAD.SON, w.a. 33713 • TSL. («O«I 337-18-8 ————————————————— */
DATE SAMPLED: 8/10/84 Conductivityu 3MMrLl- pH 0 25°C Alkal inity
Samole No. (S .U. ) (umhos/cm) (mg/1)T10W4D
W4SW4IB-8
B-8I8-9B-19
B-20
7.20 5907.20 4957.45 3607.30 3457.00 3007.35 6006.90 9757.15 6407.25 735
DATE SAMPLED: 8/13/84W6DW6IW6SB14B21B22E-8W8DW8Iwas
7.00 5507.30 540 2567.40 4607.10 7557.05 10707.25 6857.45 8557.00 5057 . 20 9057.65 240
DATE SAMPLED: 8/14/84W9SE14W16IW16SB17B17I818
B18I
7.05 8857.00 5707.20 755 3146.65 1360 324
7.10 910 364
7.15 555 2527.00 1160 3997.40 575 264
___ • —— —— •
0003122

WARZYN
ENGINEERING INC
ANALYTICAL. LABORATORYRESUUTS
Verona Well Field
Uocatton Battle Creek, Michigan
O d t e aprpi vo i - 3 / 7 - 1 5 / 3 4Project No: C 11185Sheet 3 ^f 3
Apo'Date Issued:
14O9 CMIL STHKET O. BOX 993%. MAOI9ON. wia. 33719 • TCL. (AOt) 337
DATE SAMPLED: 8/15/84
Sample No.HIH2H3H4H5
PH(S.U.)7.107.207.207.257.10
Conductivity(3 25°C(umhos/cm)8958659907101240
Alkalinity(mq/1)
0003123

\^
WARZYIM^^^^ ^^^_^^^^^^^^^^
^^^^r ^^^^r
ENGINEERING INC
Sample pHNo. (S.U.)
Tl
T9
E7
Bl
Bl
7.30
6.90
6.95
7.35
dup. 7.35
ANALYTICAL LABORATORY RESULTS
Projec t
1 nrat_ ion
- 14O» EMIL
Conductivity£ 25°C
(umhos/cm)
630
865
755
510
510
Verona
Battle
Alkalinity
244
395
372
237
240
Uell hie Id
Creek, Michigan
Chloride
-
77
52
5
8
53715 - TEL.
NitriteNitrogen
-
<0.005
<0.005
0.015
<0.005
NitrateNitrogen
-
<0.10
<0.10
0.95
0.98
Date Received- .Project No: CSheet 1 ofCkd Cfo>Date Issued: _4,
AmmoniaNitrogen
-
<0.10
<0.10
<0.10
<0.10
8/7,8/84
JUS5- — — -__j! __ jrr^j
\pp'd Vvt/*/.-i J___..._
TotalKjeldahlNitrogen
-
0.16
0.17
0.42
0.65
Results are in mg/1 unless otherwise stated.
Oc>OCJ

WARZYIM
ENGINEERING INC
^
SampleNo.
Tl
T9
E7
Bl
Bl dup.
Sulfate
•
63
8
50
48
AIMALYT
Project
Location
^^14O» EMIU STREET
Sulfide
-
0.20
0.60
<0.10
<0.10
ICAL. UAHtJHATDHY Ht=SUL_T5 8/7,8/84Date Received-
- --Verona Well Field Proiect Nn- C 11185Sheet 2 of _ . . . _ _ 2 _ ^Ckd .VIM App'd ffjc^'
Battle Creek. Michigan Oate issued: -l'^L/£^--
• P.O. BOX 0338. MADISON. WIS. 53713 • TEL. (6OB) 257-4846 —— •••• ••- ' ' —————— ———— ——————— — — .• *•
Total OrganicCarbon
-
2.4
3.9
2.5
3.0
Results are in mg/1 unless otherwise stated.
cr

WARZYIM
ENGINEERING INC
SamplNo.
B17
B17I
818
81 81
W6I
W16S
W16I
ANALYTICAL
Project _ ._ .....
Location .. . ....—— — 14O9 EMIU STREET - P.O. BC
GENERALConductivity
e pH ? 25°C(S.U.) (umhos/cm) Alkalinity
7.10 910
7.15 555
7.00 1160
7.40 575
7.30 540
6.65 1360
7.20 755
364
252
399
264
256
324
314
LABORATORY 1
Verona Well Field
Battle Creek, Michigan
>X »93B. MADISON, WIS. 93715 •
WATER QUALITY SUMMARY
NitriteChloride Nitrogen
92 0.032
23 0.006
122 0.028
24 0.017
25 <0.005
193 0.014
48 0.018
RESULTSDate Received" - - . - - ._ _ L_... .Project No: _C 111»5Sheet 1 of.. ._„__£Ckd tyii) App'd^ffiz?Date Issued: -;/.v/vs '
TEL. (6O8) 257-4046- —— ————————————————————————————————
TotalNitrate Ammonia KjeldahlNitrogen Nitrogen Nitrogen
0.28 0.13 0.24
<0.10 <0.10 0.18
0.30 0.24 0.78
0.13 <0.10 0.11
<0.10 <0.10 0.10
0.16 0.32 0.86
0.16 <0.10 0.16
Results are in mg/1 unless otherwise stated.
WARZYIM
ENGINEERING INC
ANALYTICAL
Project _ Verona Well Field
RESULTS
Location Battle Creek, Michigan
EMIU STREET • P.O. BOX OS3S. MADISO*4, WIS. 53715 • TEL, (6OB) 257-4848'
B/13/84Date Received- .Project No: C 11185_Sheet ? of 2Ckd .C&i,*Date Issued: _*£
Sample No. Sulfate SulfideTotal Organic
Carbon
B17
B171
B18
B18I
W6I
W16S
W16I
44
43
52
44
39
9
42
<0.1
<0.1
<0.1
<0.1
<0.1
<0 1
<0.1
6.4
1.1
324
4.2
<1.0
650
<1.0
Results are in mg/1 unless otherwise stated.

APPENDIX C
SUMMARY OF WATER QUALITY ANALYSES TRACER TEST
WAffZVN
0003125

DISPERSIVITY TEST kEiULTSVERONA WELL FIELD
DATES
OOoCO^*f^^4
f\3CD
ll-Aua-8413-Aug-8415-AUQ-6416-Aug-B4l7-Aua-8420-Aug-8422-Aug-8424-Aug-8427-Aug-8429-Aua-8431-Auq-8404-Sep-8405-Sep-B407-Sep-8410-Sep-8412-Sep-8414-Sep-B417-Sep-B419-Sep-8421-Sep-8424-Sep-8426-Sep-8428-Sep-84Ol-Oct-8403-Oct-8405-Oct-B4Oe-Oct-8410-Oct-8412-OCC-84lS-Oct-8417-Oct-8419-Oct-8422-Oct-8424-Oct-6426-Oct-8413-Nov-84lS-Nov-8403-Dec-8405-Dec-8407-Dec-B410-Dec-fl412-Dec-8414-Dec-8417 -Dec -8419-Dec-8421-Dec-842b-Dec-8428 Dec-8431 -Dec -8404-Jan-85U7 Jdn-85
64.6184.6284.6234.6384.6384.6484.6484.6584.6684.6684.6784.6884.6884.6984.7084.7034.7184.7184.7284.73B4.73B4.7484.7484.7584.7684.7684.7784.7884. 7B84.7984.8084.8084.8184.8284.8284.8784.8884.9384.9384.9484.9484.9584.9684.9684.9784.9784 .9984.9985.0085.0185.02
PLANT TAP
0.53
0.42
0.71
0.5
0.6
WELLSV 2 7
0.550.160.890.710.590.440.460.430.490.550.480.560.640.510.430.530.580.570.670.680.570.590.670.520.650.720.460.570.610.470.570.650.640.640.490.350.480.4
0.350.440.450.410.560.48i*. 550.620 . 4 70.450.460.520.55
V260.520.320.610.630.520.3
0.280.310.390.410.360.5
0.520.570.40.50.5
0.580.680.760.450.6
0.650.620.730.740.480.540.490.520.530.5
0.550.580.5
0.580.620.490.490.5
0.470.40.3
0.580.590.710.580.420 .460.450 .49
U22 V25 V39
0.25
V40
0.64
V41
0.6
V42
0.58
V43
0.69
0.380.3
0.520.49

DISPERSWITY TKST RESULTSVERONA WELL FIELD
DATES09-Jan-6511-Jan-aS
PLANT TAP85.03B5.03
WELLSV27 V280.52 0.530.52 0.55
V22 V25 V39 V40 V41 V42 V43
NOTES;1. ALL RESULTS IN MG/L21 AVERAGE INJECTION CONCENTRATION 1015 MG/L3. INJECTION VOLUME 2000 GALLONS4. ANALYSIS BY CH2M HILL
Ooo
to

APPENDIX D
SUMMARY OF WATER QUALITY ANALYSES - VOLATILE ORGANICSSAMPLES OBTAINED WHILE DRILLING
WAMZYN
0003131

WATER QUALITY SAMPLINGDUffING DRILLINGPHASE II DRILLINGVERONA HELL FIELDCASE 2938
VOLATILE OKCANICS<UC/L>
BAILER B6I fiBI BBI BBI B17IBLANK 25-40' 42-50' 52-60' 62-70' 51-59'(B9-726)
B17I B17I B1BI62-70' 62-70' 23.5'
filfil B16I23.5-26.5' 29-34'
ooo
COio
AcrolelnAcrylonitrileBenzeneCarbon Tetr*chlori<leChl or obenzene1.2-Dichloroe thane1 . 1 . 1-Trichloroethane1 . 1-Dichloroethan*1.1, 2-Trichloroetbane1.1.2. 2-TetrachloroetnaneChloroe thane2-Chloroethylvinyl EtherChl or of or*1 . 1-Dichloroethene1.2-Oichloroethene1 ,2-DichloropropaneTram- 1,3-Di color opropeneCi».l,3-DlchloropropeneEthylhenzeneHethylene ChlorideChloroMethaneBrOKOBC thane
broaodichloroaethanePI uor ot r i chl or ome thaneChlorodibroBoaethaneTetrachloroetheneTolueneTrichloroecheneVinyl ChlorideAcetone2-butanoneCar bondi suit" ide2-Hexanone< -Hethy J - 2-FentanoneStyreneVinyl AcetateTotal XyienesTotal VolatilesTotal Chlorinated VolatilesOTHEft COMPOUNDS (NO-TOTAL UG/L)
136
196
1269
2096
270
12
4000
1600068000
1500400014000
660043000
66
12
13
4
39B939B9
9999
2626
790009bOOO130000
JOOOOO32000
26000
300002 6720002 377500& 1-7000
L" HtlXANE 7000 UG/I,UU1- - KIUJi DUPLICATENUii - NOT DETECTED BECAUSE OF Ul.ANK CONTAMINATION
1500 1100
300022000 16000
780
1500
7200
190003000037000
2600012000
1000016696067460
560650
1500
690
13000210002900U
Ibuuu

WATEfc QUALITY SAMPLINGUUhJNG DfclLLJNUPHASE I] DRILLINGVEhONA HEI.l. FIELDCASE 2938
VOLATILE OKGAJUCSiUC/L)
HI HI34-39-
U1BI38-43'
fllBI43-48'
biei48-53'
Mil75-78'
Mil7B-BB-
Mil88-98- Mil
BB-98DUP
Mil100-110
H2146-59' 57-70
oooCJ(—*COCO
AcrolcinAcrylonitril«BenzeneCarbon TetrachlorideChlorobcnzcne1,2-Oichloroethuie1,1. 1-Trichloroethane1 ,1-Dichloroethane1 ,1 ,2-Trichloroeth*ne1.1,2, 2-TetrachloroetbaneChloroethone2-Chloroethylvinyl EtherChlorofor*1.1-Dichloroethene1.2-Oichloroethene1 ,2-Dichloropropan«Trans-1 , 3-DlchloropropeneCie.l ,3-DichloropropeneEthylbenzeneMethylene ChlorideChloro»ethane
520
150010000
2604602000
3BO5300
BroaofornBroaodi chl or omt thaneFluorotrichloroaettumeChl or odibroMOMe thaneTetr*chloroetheneTolueneTrichlorottheneVinyl ChlorideAcetone2-EiutanoneCarbondisulf ide2 -Hexanone4 -Methyl -2-f-entanoneStyreneVinyl AcetateTotal XylenesTotal VolatilesTotal Chlorinated VolatilesOTHER COMPOUNDS I NO-TOTAL UG/L1
61001 300019000
4100
J400
30006702044620
180
3903500
87150210
3501400
12
540 190
12
70
1100 240 15
21026
19
10
6B64
17
41004 1 005600
32001700
15002666715637
1000 2801000 2801200 340
110 120
1
49103910
14014941062
3030
1111
375375
tf HQ1AHE 7000 UC/LDUF - FIELD DUPLICATENDb - h('T DtTEXTTED BECAUSE Of BLANK CONTAMINATION

• \( (
MATE* QUALITV SAMPLINGDURING DRILLINGPHASE II HULLINGVEKONA WELL FIELDCASE 2a38
VOLATILE OBGAIIICS H2I H16I. Hlfcl Hlfcl(UG/Lt 73-BO 39-52' 52-60' 62-70'
AcroleinAcrylonitrileBenzeneCarbon Tetrachlorid*Chlorobenzene1.2-Dichloroetbane1.1.1-Trichloroethane 101,1-Dichloroethane 61.1,2-Trichloroethan*1,1.2.2-TetrachloroethaneChloro*thane2-Chloroetbylvinyl EtherCbloro/ora 111.1-Dichloroethenc 31.2-Dichloroethen* • 21,2-Dlchloropropan*Trana-l,3-DichloropropeneCis,1.3-01chloropropeneEthylbenzeneMethylene Chloride 2 140 25 SCh1or one t hanebro»o»ethaneBroBOfarmBroHodichloroBethaneFluorotr i chloro«ethaneChlorodibroHonethaneTetrachloroethene 19 S40 260 9TolueneTrichloroethene SVinyl ChlorideAcetone2-butnnoneC»rbondisulfide2-Heitanont•l-Methyl-2-FentanoneStyreneVinyl AcetateTotal XylenesTotal Vol»tiles 40 fc^l 312 14
_. Total Chlorinated Volatile* 40 691 312 14t~p OTHER COMPOUNOS(NO-TOTAL UC/LtOCSCO
& HO iNt 7000 UC/L•"" DUP - FIELD DUPLICATECO NDb - HOT DETECTED BECAUSE OF tJLANK CONTAMINATION

APPENDIX E
QA TECHNICAL MEMORANDUM
WAMEVM

March 14, 1985C 11185
TECHNICAL MEMORANDUM
To: Kenneth J. Quinn
From: ,'lichael J. Llnskens
Re: Phase II Battle Creek Results: QA Rev iew
All results of Phase II volatile testing for 122 soil and water samples areacceptable under the ERA QA/QC review process. All results are consideredQuantitative. A more in-depth discussion of QA/QC as it relates to each ofthe individual contract laboratories used during Phase II is provided in thefollowing paragraphs.
All 16 soil samples collected in Phase II were sent to EnvlroOyne Engineers(EE) for analysis. The EPA review process found surrogate and matrix spikerecoveries to be within the acceptable limits for all samples. An unusuallylarge number of volatile compounds were found at significant concentrationsin laboratory analysis blanks. Since the procedure for the volatile methodfor son analysis Involves subsampHng the soil and addition of 5 mis oflaboratory blank water, followed by the normal purge and trap procedure,these laboratory contaminants were found in all samples. The results of fourlaboratory analysis blanks were provided by EE and the following compoundswere found to be laboratory contaminants in the concentration range given.
Contaminant Range (ppb)
Methylene chloride 88-1214-Methyl-2 pentanone 38-1042-Hexanone 49-110Toluene 5-72-Butanone 26-77Senzene 2-4Styrene 10-35o-Xylene 17-49Ethylbenzene 9-27Acetone 32-51Acrylonitrile 18-73
Results reported within five times (EE used 1 gram sample size; normal 5 grans)of the highest contamination level shown for the above compounds may be dueto laboratory contamination. All 16 soil samples {listed below with theirOrganic Traffic Report (OTR) numbers) seem to be contaminated at significantlevels by at least one of the above compounds.
WAPZYN
0003136
TECHNICAL MEMORANDUM -2- "arch 14, 19S5Phase II Battle Creek Results: C 11185
QA Review
Sample I.D. OTR Number Sample I.D. QTR Number
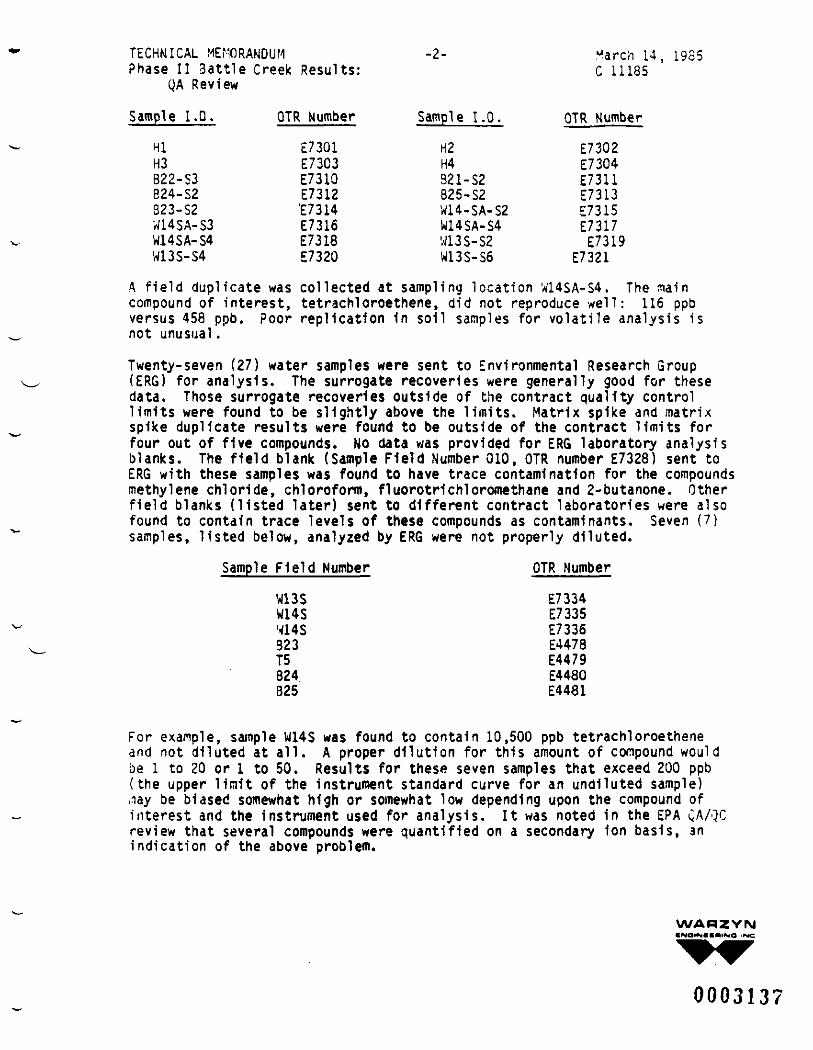
HI E7301 H2 E7302H3 E73C3 H4 £7304B22-S3 E7310 321-S2 £7311B24-S2 E7312 B25-S2 E7313323-S2 'E7314 W14-SA-S2 E7315W14SA-S3 E7316 W14SA-S4 E7317W14SA-S4 E7318 W13S-S2 E7319W13S-S4 £7320 W13S-S6 E7321
A field duplicate was collected at sampling location W14SA-S4. The naincompound of interest, tetrachloroethene, did not reproduce well : 116 ppbversus 458 ppb. Poor replication 1n soil samples for volatile analysis isnot unusual.
Twenty-seven (27) water samples were sent to Environmental Research Group(ERG) for analysis. The surrogate recoveries were generally good for thesedata. Those surrogate recoveries outside of the contract quality controllimits were found to be slightly above the limits. Matrix spike and matrixspike duplicate results were found to be outside of the contract limits forfour out of five compounds. No data was provided for ERG laboratory analysisblanks. The field blank (Sample Field Number 010, OTR number E7328) sent toERG with these samples was found to have trace contamination for the compoundsmethylene chloride, chloroform, fluorotrlchloromethane and 2-butanone. Otherfield blanks (listed later) sent to different contract laboratories were alsofound to contain trace levels of these compounds as contaminants. Seven (7)samples, listed below, analyzed by ERG were not properly diluted.
Sample Field Number OTR Number
W13S E7334W14S E7335W14S E7336323 E4478T5 E4479824 £4480B25 E4481
For exanple, sample WHS was found to contain 10,500 ppb tetrachloroetheneand not diluted at all. A proper dilution for this amount of compound wouldbe 1 to 20 or 1 to 50. Results for these seven samples that exceed 200 ppb(the upper limit of the instrument standard curve for an undiluted sample)nay be biased somewhat high or somewhat low depending upon the compound ofinterest and the instrument used for analysis. It was noted 1n the EPA CA/QCreview that several compounds were quantified on a secondary ion basis, anindication of the above problem.
WARZYN
0003137

TECHNICAL MEMORANDUM -3- Varch 14, 1965Phase II Battle Creek Results: C 11185
QA Review
The remaining 79 water samples were analyzed by IT Corporation. The data forthese samples appear to be excellent as far as precision ana accuracy. Allsurrogate and matrix spike duplicate recoveries *er« found to be within the£PA contract control limits. Results, for seven sets of field duplicates(W1I, B17I, B20, VJ4I, W9S, R18 and W7I) reinforce the excellent QA/QC reportgiven by the EPA review process. Results for each of the seven duplicatesets replicated well. Mine laboratory analysis blanks were provided by ITand only inethylene chloride was found (less than 10 ppb) as a contaminant.Field blanks (Sample Field Numbers Oil, 012, 014, 015 and 016) analyzed byIT again showed trace levels of chloroform, methylene chloride, acetone and2-butanone contamination.
MJL/cac[cwl-74-6]
WARZYN
000313

APPENDIX F
PRODUCT SPECIFICATION SHEETDOWCLENE*
WAffZYN
0003133

THE DOW CHEMICAL COMPANY QUALITY ASSURANCE 22697SALES SPECIFICATION
PAGE: 1PRODUCT CODE: 22697 EFFECTIVE: 9 JUL 34 SUPERSEDES: 24 MAY 34
NAME: DOWCLENE <R> EC SOLVENT
DESC: COLORLESS LIQUID, FREE OF SUSPENDED MATTER AND SEDIMENT.
TEST ITEM ' : UNIT : LIMITS
APPEARANCE
TEST METHODS
VISUAL
i6322A;ASTM E20316322A;ASTM D210316322A;ASTM D210?VISUAL
16320;ASTM D1073
16320;ASTM D21 1 1
FREE OFSEDIMENT ANDSUSPENDED MATTER1001010
74-122 (NOTE 1>
P (NOTE 1)
WATER CONTENT, MAX. PPMCOLOR, APHA, MAX. PT-CONON-VOLATILE RESIDUE, MAX, PPM——TYPICAL PROPERTIES——DISTILLATION RANGE @760MM, IBP-DP CRELATIVE DENSITY (SPECIFICGRAVITY) 8 25/25 C
PI: 1423409 SAMPLEPI: 1013218 55 GAL DRPI: 1015213 BULK
SALES NOTE:(1) IT HAS BEEN DETERMINED THAT MATERIAL MEETING THE LIMITS IMPOSED
UNDER 'TEST ITEMS' UILL FALL WITHIN THE LIMITS INDICATED. THESEARE NOT ROUTINE TEST ITEMS.
(2) OTHER,BLEND RATIOS CAN BE MADE AVAILABLE ON THE BASIS OF A CUSTOMERSPECIFICATION.
READ-PRECAUTIONARY INFORMATION AND MATERIAL SA.FETY DATASHEETS. THIS PRODUCT IS SHIPPED IN COMPLIANCE WITH AP-PLICABLE LAWS AND REGULATIONS REGARDING CLASSIFICATION,PACKAGING, SHIPPING, AND LABELING.
(R) INDICATES A TRADEMARK OF THE DOW CHEMICAL COMPANYLAST PAGE
0003140
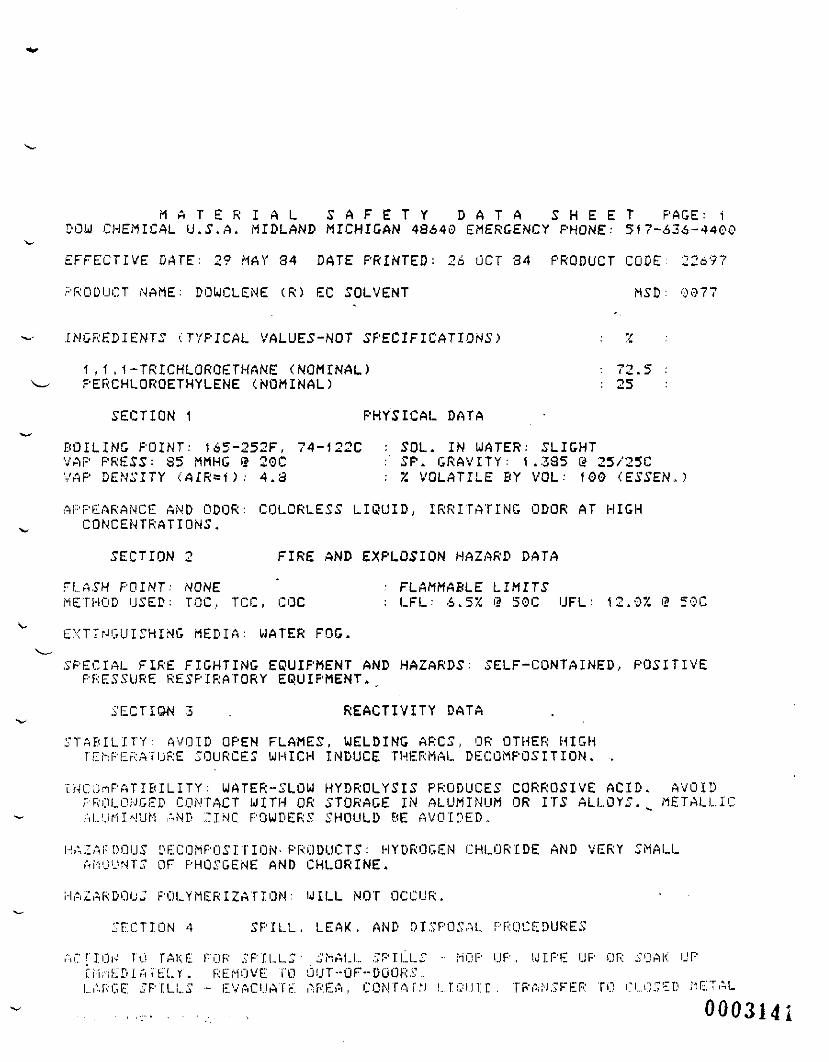
M A T E R I A L S A F E T Y D A T A S H E E T PAGE: iOQUI CHEMICAL U.S.A. MIDLAND MICHIGAN 48640 EMERGENCY PHONE: 517*636-4400
EFFECTIVE DATE: 2? MAY 34 DATE PRINTED: 26 OCT 34 PRODUCT CODE: 2269?
PRODUCT NAME: DOWCLENE (R) EC SOLVENT MSD: 0077f .
INGREDIENTS (TYPICAL VALUES-NOT SPECIFICATIONS) : 7. :
1.1.1-TRICHLORQETHANE (NOMINAL) : 72.5 :PERCHLOROETHYLENE (NOMINAL) : 25 :
SECTION 1 PHYSICAL DATA
BOILING POINT: 165-252F, 74-122C : SOL. IN WATER: SLIGHTVAP PRESS: 35 MMHG 8 20C :' SP. GRAVITY: 1.335 @ 25/25C'./AP DENSITY (AIR = 1): 4.3 : X. VOLATILE BY VOL: 100 (ESSEN,>
APPEARANCE AND ODOR: COLORLESS LIQUID, IRRITATING ODOR AT HIGHCONCENTRATIONS.
SECTION 2 FIRE AND EXPLOSION HAZARD DATA
FLASH POINT: NONE " : FLAMMABLE LIMITSMETHOD USED: TOC, TCC, COC : LFL: 6.5X @ 50C UFL: 12.0% @ 50C
EXTINGUISHING MEDIA: WATER FOG.
SPECIAL FIRE FIGHTING EQUIPMENT AND HAZARDS: SELF-CONTAINED, POSITIVEPRESSURE RESPIRATORY EQUIPMENT.,
i'ECTION 3 . REACTIVITY DATA
STAEHLITY' AVOID OPEN FLAMES, WELDING ARCS, OR OTHER HIGHfEhFERATIJRE SOURCES WHICH INDUCE THERMAL DECOMPOSITION. .
INCOnPATIBILITY: WATER-SLOW HYDROLYSIS PRODUCES CORROSIVE ACID. AVOIDPROLONGED CONTACT WITH OR STORAGE IN ALUMINUM OR ITS ALLOYS.^ METALLICALUMINUM AND ZINC POWDERS SHOULD BE AVOIDED.
HAZARDOUS DECOMPOSITION*PRODUCTS: HYDROGEN CHLORIDE AND VERY SMALLAMOUNTS OF PHOSGENE AND CHLORINE.
HAZARDOUS POLYMERIZATION: WILL NOT OCCUR.
SECTION 4 SPILL. LEAK, AND DISPOSAL PROCEDURES
.'-iCnuN JO fAKE FOR SPILLS' SMALL SPILLS - MOP UP. WIPE UP OR SOAK UPliiiMEDlAiELr. REMOVE TO OUT-OF-DOORS,LiUVG£ SPtLLS - EVACUATrT. AREA, CONTAiN LIQUID. TR'ftNSFEP TO CLOSED METAL
000314I

M A T E R I A L S A F E T Y D A T A S H E E T RAGE' "DOU CHEMICAL U.S.A. MIDLAND MICHIGAN 48640 EMERGENCY RHONE: 517-63-6-4400
EFFECTIVE DATE: 29 MA/ 34 DATE PRINTED: 26 OCT 34 PRODUCT CODE- 6?7PRODUCT (CONT'D): DOUCLENE (R> EC SOLVENT MSD: 0077
SECTION 4 SPILL, LEAK, AND DISPOSAL PROCEDURES (CONTINUED)
ACTION TO TAKE FOR SPILLS: (CONTINUED)CONTAINERS. KEEP OUT OF WATER SUPPLY.
DISPOSAL METHOD: WHEN DISPOSING OF THE UNUSED CONTENTS, THE PREFERREDOPTIONS ARE TO SEND TO LICENSED RECLAIMER, OR TO PERMITTED INCINERATORS,IN COMPLIANCE WITH LOCAL, STATE, AND FEDERAL REGULATIONS INCLUDINGSUBTITLE C OF THE RESOURCE CONSERVATION AND RECOVERY ACT. DUMPING INTOSEWERS, ON THE GROUND, .OR INTO ANY BODY OF WATER IS STRONGLY DISCOURAGEDAND MAY BE ILLEGAL. CONSULT THE DOU CHEMICAL COMPANY FOR FURTHERINFORMATION.
SECTION 5 HEALTH HAZARD DATA
EYE: MAY CAUSE PAIN, AND SLIGHT TRANSIENT IRRITATION. VAPORS MAYIRRITATE EYES.
SKIN CONTACT: PROLONGED OR REPEATED EXPOSURE MAY CAUSE SKIN IRRITATION.MAY CAUSE MORE SEVERE RESPONSE IF CONFINED OR SKIN IS ABRADED.REPEATED CONTACT MAY CAUSE DEFATTING OF SKIN.
SKIN ABSORPTION: A SINGLE PROLONGED SKIN EXPOSURE IS NOT LIKELY TORESULT IN ABSORPTION OF HARMFUL AMOUNTS. THE LD50 FOR RABBITS IS>30,000 MG/KG.
INGESTION: SINGLE DOSE ORAL TQXICITY IS LOW. THE LD50 FOR RATSIS 14.35 G/KG. IF ASPIRATED, MAY CAUSE RAPID ABSORPTION THROUGHTHE LUNGS WHICH MAY RESULT IN SYSTEMIC EFFECTS.
INHALATION: MINIMAL ANESTHETIC OR NARCOTIC EFFECTS MAY BE SEEN OVER 500 PPMPROGRESSIVELY HIGHER LEVELS OVER 800 PPM MAY CAUSE EYE OR NASAL IRRI-TATION;" DIZZINESS, DRUNKENNESS; CONCENTRATIONS IN EXCESS OF 3,000 PPMCAN CAUSE UNCONSCIOUSNESS AND DEATH. IN CONFINED OR POORLY VENTILATEDAREAS, VAPORS WHICH READILY ACCUMULATE CAN CAUSE UNCONSCIOUSNESS ANDDEATH. THESE HIGH LEVELS MAY. ALSO CAUSE CARDIAC ARRHYTHMIAS(IRREGULAR HEARTBEATS).
SYSTEMIC & OTHER EFFECTS: REPEATED EXPOSURES MAY CAUSE LIVER.ANDKIDNEY EFFECTS. ' THE PREPONDERANCE OF INFORMATION INDICATESPFRCHLQROETHYLENE IS NOT LIKELY TO BE A CARCINOGEN IN MAN ALTHOUGH ONELIFETIME STUDY WITH TOXIC DOSES OF PERCHLOROETHYLENE GIVEN BY STOMACHTUBE INDICATED A CARCINOGENIC RESPONSE IN LABORATORY MICE. BUrNOT INRATS EXPOSED BY INGESTION OR INHALATION.
SECTION 6 FIRST AID
EYES: IRRIGATE IMMEDIATELY WITH WATER FOR AT LEAST 5 MINUTES.
SKIN: WASH OFF IN FLOWING WATER OR SHOWER. WASH CONTAMINATEDCLOTHING BEFORE REUSE.
(CONTINUED ON PAGE 3 )(R) INDICATES A TRADEMARK OF THE DOW CHEMICAL COMPANY
000314

M A T E R I A L S A F E T Y D A T A S M E E T PAGE' 3DOU CHEMICAL U.S.A. MIDLAND MICHIGAN 43640 EMERGENCY PHONE- 517-436-4400
EFFECTIVE DATE: 29 MAY 84 DATE PRINTED- 26 GCT 84 PRODUCT CODE 697PRODUCT (CONT'D): DOWCLENE <R> EC SOLVENT rtSD: 0077
SECTION 6 FIRST AID (CONTINUED)
INGESTION: DO NOT INDUCE VOMITING- CALL A PHYSICIAN AND/OR TRANSPORT TOEMERGENCY FACILITY IMMEDIATELY.
INHALATION: REMOVE TO FRESH AIR. IF NOT BREATHING, GIVE MOUTH-TO-MOUTHRESUSCITATION. IF BREATHING IS DIFFICULT. GIVE OXYGEN. CALL APHYSICIAN.
NOTE TO PHYSICIAN: BECAUSE RAPID ABSORPTION MAY OCCUR THROUGH LUNGS IF ASPIRAAND CAUSE SYSTEMIC. EFFECTS, THE DECISION OF WHETHER TO INDUCE VOMITINGOR NOT SHOULD BE MADE BY AN ATTENDING PHYSICIAN. IF LAVAGE IS PERFORMED,SUGGEST ENDOTRACHEAL AND/OR ESOPHAGEAL CONTROL. DANGER FROM LUNG ASPIRA-TION MUST BE WEIGHED AGAINST TOXICITY WHEN CONSIDERING EMPTYING THESTOMACH. EXPOSURE MAY INCREASE 'MYOCARDIAL IRRITABILITY'. DO NOT ADMIN-ISTER SYMPATHOMIMETIC DRUGS UNLESS ABSOLUTELY NECESSARY. NO SPECIFICANTIDOTE. SUPPORTIVE CARE. TREATMENT BASED ON JUDGMENT OF THE PHYSICIANIN RESPONSE TO REACTIONS OF THE PATIENT.
SECTION 7 SPECIAL HANDLING INFORMATION
EXPOSURE GUIDELINE(S) : 1 , 1 , 1 -TRICHLOROETHANE - OSHA STANDARD IS 350 PPM ANDCURRENT ACGIH TLV IS 350 PPM (450 PPM STEL ) ; PERCHLOROETHYLENE - OSHASTANDARD IS 1 OO PPM AND CURRENT ACGIH TLV IS 50 PPM.
VENTILATION: PROVIDE GENERAL AND/OR LOCAL EXHAUST VENTILATION TO CONTROLAIRBORNE LEVELS BELOW THE EXPOSURE GUIDELINES.
RESPIRATORY PROTECTION: APPROVED ORGANIC VAPOR-TYPE RESPIRATOR REQUIRED INABSENCE OF PROPER ENVIRONMENTAL CONTROL. FOR EMERGENCIES, APOSITIVE-PRESSURE BREATHING APPARATUS OR A FULL-FACE RESPIRATOR WITHAN APPROVED ORGANIC VAPOR CANISTER IS RECOMMENDED.
PROTECTIVE CJ.OTHING: NO SPECIAL PROTECTIVE CLOTHING NEEDED. HOWEVER,FOR FREQUENT OR PROLONGED CONTACT, USE GLOVES MADE OF VITON,NEOPRENE, OR POLYVINYL ALCOHOL; BOOTS AND APRON DEPENDING UPONTME EXTENT jftND SEVERITY OF EXPOSURE. LIKELY.
EYE PROTECTION: SAFETY GLASSES. IT IS RECOMMENDED THAT AN EYE-WASHSTATION BE AVAILABLE.
SECTION 3 SPECIAL PRECAUTIONS AND ADDITIONAL INFORMATION
PRECAUTIONS TO BE TAKEN IN HANDLING AND STORAGE: AVOID PROLONGED ORFREQUENTLY REPEATED SKIN CONTACT. AVOID BREATHING VAPORS. STORE INA COOL PLACE. VAPORS OF- THIS PRODUCT ARE HEAVIER THAN AIR AND WILLCOLLECT IN LOW AREAS SUCH AS PITS, DEGREASERS, STORAGE TANKS, ANDOTHER CONFINED AREAS. DO NOT ENTER THESE AREAS WHERE VAPORS OF .THIS PRODUCT ARE SUSPECTED UNLESS SPECIAL BREATHING APPARATUS IS USEDAND AN OBSERVER IS PRESENT FOR ASSISTANCE.
1 ,1 , i --TRICHLOROETHANE PRODUCTS SHOULD NOT BE PACKAGED IN ALUMINUMAEROSOL CANS OR WITH FINELY DIVIDED ALUMINUM OR ITS ALLOYS IN ANAEROSOL CAN.
(CONTINUED ON PACE 4 0003143

M A T E R I A L S A F E T Y D A T A S H E E T PAGE 4-*OW CHEMICAL U.S.A. MIDLAND MICHIGAN 43640 EMERGENCY PHONE: 517-636-4400
EFFECTIVE DATE: 29 MAf 84 DATE PRINTED: 26 OCT 84 PRODUCT CODE; 22697PRODUCT (CONT'D): DOtdCLENE (R) EC SOLVENT MSD: 0077
SECTION 3 SPECIAL PRECAUTIONS AND ADDITIONAL INFORMATION (CONTINUED)
•RECAUTIONS TO BE TAKEN IN HANDLING AND STORAGE: (CONTINUED)
ALUMINUM IS NOT AN ACCEPTABLE MATERIAL OF CONSTRUCTION FOR PUMPS,MIXERS, FITTINGS, STORAGE TANKS FOR 1,1,1-TRICHLOROETHANE PRODUCTSOR FORMULATIONS. METALLIC ALUMINUM AND ZINC POWDERS SHOULD BEAVOIDED.
FOR ADDITIONAL INFORMATION ON TOXICITY, HANDLING PRECAUTIONS, ANDFIRST AID, REFER TO CHLORINATES SOLVENTS LITERATURE FORM NO. 100-5792.
ADDITIONAL INFORMATION: REVISED SECTIONS: 2 AND 4.
LAST PAGE(R) INDICATES A TRADEMARK OF THE DOU CHEMICAL COMPANY*HE INFORMATION HEREIN IS GIVEN IN GOOD FAITH, BUT NO WARRANTY,iXPRESSED OR IMPLIED, IS MADE. CONSULT THE DOU CHEMICAL COMPANYFOR FURTHER INFORMATION.
000314]

APPENDIX G
REVISED DRAWINGSFOR
TECHNICAL MEMORANDUMPHASE I DRILLING AND SOIL SAMPLING
WAftXYN
0003145
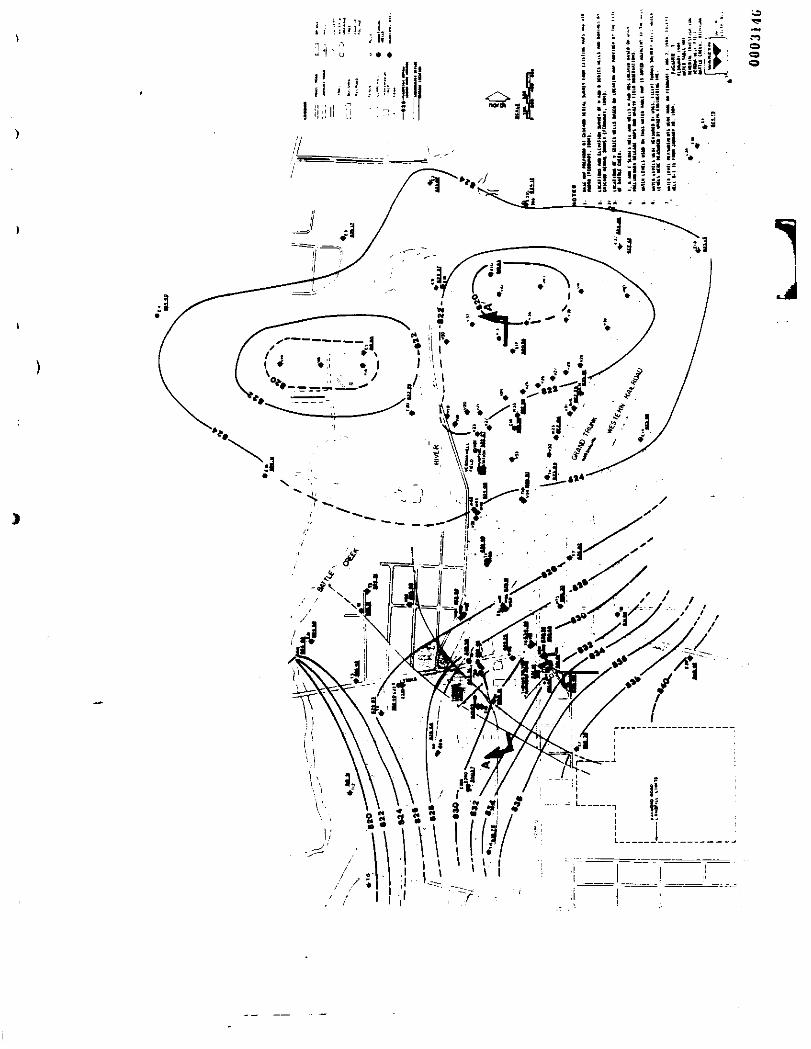
rl ^ ^I i - V- f.1

[Li VAT IMS
JOVTH DOCK
TANK TRUCK UNLOADING ARC*P———
tAST DOCK UNOERCKHMO TANK AREA
••11 I IB
1. Sit FIGURES ii 10 FOR GCNEML NOUSAND ltO.HO.
2. VAiUES INDICATE TOTAL CHLORINATED VOLA1ILEOfUWIC COMPOUNDS RESULTS FROM SOIL ANALYSIS(bG/KC). Stl APPENDICES FOR DETECTION LIMITSAND SPECIFIC RESULTS.
I. All SAMPLES COILtCUO DICfHRfR 19B3-
E1
FIGURE 11SECTION {-['IOTA1 CM.ORINAUU VULDATMOHD ROAD FACILITY
fttMfDIALVERONA UtLi Fl f lDtAIUt CRtfK. HJCH1U*
0003147

ELEVATIONS
TANK TRUCK LWLOA01HG AREA
SOUTH DOCK ' E«l HOCK UNDERGROUND I*"*. AM A
2 SEE f JUUtt 1 FOR C«OiS &ECT1GM lOLAHUN
[ L E V A T I O M L
•M
6*0
Bib
810
US
•20
eii
-
31
I
-
2
r"'"1
0 I* •»
o » 10
^
V
:
I i
SAND
SECTION E-E'
NOTES
—— ——————————
•
V
-
1. i£t H6U« i FOR UNERAi MIES AMD UUND
•u
MS
B40
U10
FIGURE 10StCMON l-f.'IHtWAi SOLVEN1RAtHUNO ROAD UULMi
820
HI HI DIM IHYliT ItAl ILViVINUNA HLU FlElDMITLl CREEK. MltHIW
^ MT W(, NI.
000314S

D
L Tl
J
D'
tu
no
HI
iii
•i*
r - mi* a IKK.« *iu«iiii lu iim<>i —— fLMfiwt/ X 1 i 1
i i—— WPKJ.IIHH (JUMU WtflCl -- — POCK ,,
—
<-
«,
1
:
i
^
SAND
2 ————————————————i <.-
1
a
ui-
110-
u
9
a,-
• — ~
nn-
L
•
] Ml 1 I«J«1 i UU b >«l UWM. 1.1111 MH1
P
§
IM-
,..-
k
2
M*-
«•--
^_^r-
~-~"~
|.)
H-
/I
/
i-
WEATHEREDSANDSTONE
1
=E
=
J10-
X.
L;!»-
I4J-
t •
...
11 -
J -
"'t
1*0-,
IIJ
|
•i
I -
' :
<1
LIUMI
j yfcWi INIUJIU IUIAI imumuilu mi.tlui * ttiwii mm BinijJ'- »-' f"*1 *•'!OMJUIC (OmuiUl USUlll HUB Mill MWl'l 1 tlBiUill". Mllllli IK , 111 Hit ll-M
\ _- - - - - ' r
" ' I
SAND' -
v
•~^--_
~ "—•—.-.'
1 * ———— * ________ .^
| , » m -
'" . —————— j———— - ,-. -_
.
.-,
'
lUb/IC) Ul WMUliUl', 10* MHC1 W UK I', '«• DlituiiH"
, „,,«,,,,«.. M.US „„. «,,«„„ SECTION D-D
IW
Hi
HO
tit
HI
0003140

DD
i~~ I Mini I* BX.a ax. WUUIHI IL, ,Ki
SAND
WEATHEREDSANDSTONE
,SECT,ON__ D-D ,
MOUi^
1 UI HUM •. F(W UMUi I*JH- ULi ilUHP
Ul MUM 2 'OK CH011 HillW LWJIIIUB
ar
O0031.rj(

1U7 // /
SHALE
.»**-
SAND/SAND &GHAVEL
SECTION A-A
-,-,
// >^
/ X' ^/ s.-'
•
i ii
SHAU
000315i


I 3
i §
! «!=-; * < S*. 5 i aI* ; S i - , -is ! I ii I :
=1 i ? *a s iI ! iM ! ill !
E3 3D a 9
ii
5 I3 l
iiii '-i
: 23- <!i|5 Mi j«i siPx iiB&ih:! H
Oii* i s

'•., v.^r-ti'!'i • t V" ; ' -f- -1 '.' ' • ' • * > ' : f,Mj
< • .)' : ) 5J-- "if,. '! '.}-'..-.»' : ' •!: . • '•i
f!
i1:
iSAND/ SAND •
—— — — _ ,_n _
.
• -S
:
"• b
!
~ ——— ~-——— mSAND/SAND & GRAVEL
* —————— =
"
SANDSTONE
QUOj |

RAYMOND P '3
T6
LEGEND
""."""" P*VED TOAD
WO I ~ ~ ~ UNWHfED «O»0
IN AIL
BUILDlNb
RAILROAD
—— j— '
WlOGE
WALL
CULVERTWATCH 01DRAINAGE
rn
21
FENCE
GUARD RAIL
0 UIDClUaOUWO TANK (3) MANHOLERISE-
O1 FlRE H1DHANT
75
SO IOO
CO
mm
•Hit
I. M( flMM I fOt CHUM. Mill.
i. I*M louiiMi iwiuii tin ut
ISO
>M WKHUUMlD
FIGURE 3THOMAS SOLVENTMrHONO ROAD FACILITY
REMEDIAL INVESTIGATIONVERONA WELL FIELDBATTLE CREEK. MICHIGAN
WARZYN
DUG. NO.i.-HJ00031,',,'

LEGEND
Do
FWVED KOAD
UNfWtD "O AD
eun DIN&
RAILROAD
FENCE
GUARD RAIL
TRANSMISSIONT OwC ft
TANK
n CULVER/— •—-y M>AI[R c
^- — CRAIMAGIHLt
. • t[)Gt OFFOLIAGE
O POLE
A" "tLL
©FIRE nlOhHf,
MOTIt
KU MT WM0 »T fMICte At UAL (F»UiMr. ifM). if. LCCAtW M fUMUM MtET tf -V Mi *•' Ullll WUS
IMllCt II OIICMO «««. M«l (fUMWI, IIM).
1. M*. *(* M* f If tUf lAU t«UT>« Mi (l(«* II (Hi MiU I•Ut NlilMNUII Mil Alt MM M» MUM flUI MlItlAIIM.
4. KM I Mi A -I IMIM4[fi il UCl taKlLtlM MK
FIGURE 2THOMAS SOLVENTANNEX FACILITY
REHEDIAl INVESTIGATIONVERONA WELL FIELDBATTLE CHEEK. MICHIGAN
DWG. NCllJdi,
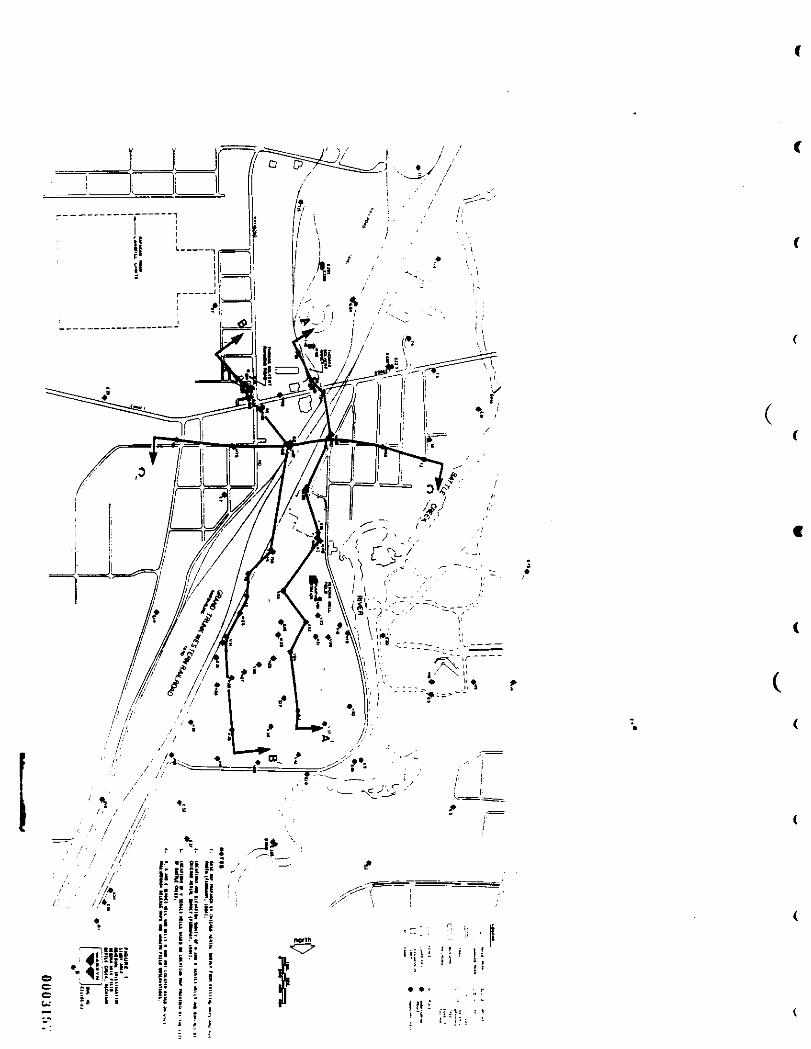
'</• ( ^•k, -, .*- t ^A

APPENDIX H
REVISED DRAWINGSFOR
TECHNICAL MEMORANDUMPHASE I WATER QUALITY SAMPLING
)
)
WAAZVN
000315o

] •,-.: '! 1 T*i ! - H - ^ . {, !*
1 i
oo
IN
1v«*•*
v ?
*v»
v* 1V*»
-V•*
J
* £>/V 'r<y ' */
i>3
a
I5
jj
IIi!i!ii
*MIf!ii!
if= *litj115ii?':1!>i
fni *! !«• I!5 *£* *ii if
3»J
1
t
ti
1i
s
«

LEGENOJ NTMIl
B "a
H*B IIM I* IUMI «•. IHtl 11 UIHI ULl. l««a ItIII* N OMM MINI (V. v-». U).
Jj] kM«*UMl (I | I HIIIlKtLl) taiLl HUI1PII*
[Jl HH (!• MB IB Ull UWM <». A. X)
r ||M U *(MI MM, »• III I.
WELL DETAL
L..-JI000316(1

I ' \ i\ =i *S i l! | l i
rL
tf A? 9 ,* r- tj? v \ * w **/ \*\'1/
V *».
;• A?
i*
Csoou;Ci
H1^i 4* ;*s ii?: if
'*