
Plan Nacional de Evaluación de Rendimientos _v1.0_
114
NATIONAL PERFORMANCE PLAN (PNER) FOR RP1 (2012-2014) DOAN-11-PLA-04-1.0 1.0 20/06/2011 SPANISH STATE AGENCY FOR AIR SAFETY Cualquier versión impresa o en soporte informático, total o parcial de este documento se considera como copia no controlada y siempre debe ser contrastada con su versión vigente Any version of this document either printed or put into in digital format, totally or partially, is considered a non-controlled copy and must always be checked against the latest version SPANISH NATIONAL PERFORMANCE PLAN (PNER) FOR REFERENCE PERIOD 1 (RP1: 2012-2014)
Transcript of Plan Nacional de Evaluación de Rendimientos _v1.0_

NATIONAL PERFORMANCE PLAN (PNER) FOR RP1 (2012-2014)
DOAN-11-PLA-04-1.0 1.0 20/06/2011
SPANISH STATE
AGENCY FOR AIR SAFETY
Cualquier versión impresa o en soporte informático, total o parcial de este documento se considera como copia no controlada y siempre debe ser contrastada con su versión vigente Any version of this document either printed or put into in digital format, totally or partially, is considered a non-controlled copy and must always be checked against the latest version
SPANISH NATIONAL PERFORMANCE PLAN (PNER) FOR REFERENCE PERIOD 1
(RP1: 2012-2014)
NATIONAL PERFORMANCE PLAN (PNER) FOR RP1 (2012-2014)
SPANISH STATE
AGENCY FOR AIR SAFETY
2/114
DOAN-11-PLA-04-1.0
APPROVALS RESPONSIBLE SIGNATURE POSITION DATE
Mª Victoria Arín Gutiérrez Jefa de División de Supervisión Económica y Navegación Aérea 20/06/2011
Leandro Calvo Lucas Supervisor Económico de Navegación Aérea 20/06/2011
Ana Gómez-Pineda Luna Responsable del Departamento
de Evaluación de Rendimientos 20/06/2011
Ángel Soret Lafraya Jefe de División de Inspección e Infraestructuras de Navegación Aérea CNS 20/06/2011
Elaboration
Pablo Ulíbarri Ramos Director de Programa de Cielo Único Europeo 20/06/2011
Juan Rosas Díaz Director de Seguridad de Aeropuertos y Navegación Aérea 20/06/2011
Revision Marta Lestau Sáenz Directora de Seguridad de
la Aviación Civil y Protección al Usuario 20/06/2011
Approval Isabel Maestre Moreno Directora de la Agencia Estatal de Seguridad Aérea 20/06/2011
REGISTER OF EDITIONS
EDITION/REVISION NUMBER DATE OF ISSUE AFFECTED PAGES REASONS FOR CHANGE
0.10 15/02/2011 All Initial Drafting Template
0.11 11/03/2011 All First Draft for distribution to stakeholders (“accountable entities”)
0.12 19/04/2011 All
Includes outcomes of R02 “accountable entities” meeting (14th March), bilateral PRU-AESA meeting (29th March), bilateral Aena-AESA working meeting (12th April), R03 Aena-AESA meeting (13th April) and H05 bilateral DGAC-AESA checkpoint meeting (18th April)
0.13 06/05/2011 All Includes the contribution of the accountable entities to the plan (DGAC, EA, MET, Aena) and the outcome of R04 and R05 Aena-AESA meetings (5th May)
0.14 10/05/2011 All Final Draft for distribution for the Stakeholder Consultation Meeting (31st May)
1.0 20/06/2011 All First Issue of the Plan Includes outcomes of the Stakeholder Consultation Meeting (31st May) and initial PRU’s health check on version 0.14 (e.g. new section 1.2.1.3. ),
ANNEXS Annex Code Title Page Ed./Rev.
Annex A Contribution of each accountable entity 61 Annex B Spanish State Safety Programme for Civil Aviation 111 Annex C Public Consultation material 113
TEMPLATES Template Code Title Page Ed./Rev.

NATIONAL PERFORMANCE PLAN (PNER) FOR RP1 (2012-2014)
SPANISH STATE
AGENCY FOR AIR SAFETY
3/114
DOAN-11-PLA-04-1.0
CONTROL OF HARDCOPIES OF THE DOCUMENTATION
EDITION RESPONSIBLE FOR PRINTING DATE OF PRINTING PRINTED PAGES SIGNATURE
DISTRIBUTION LIST
EDITION DISTRIBUTE TO DATE OF DISTRIBUTION
RESPONSIBLE FOR THE DISTRIBUTION SIGNATURE

NATIONAL PERFORMANCE PLAN (PNER) FOR RP1 (2012-2014)
SPANISH STATE
AGENCY FOR AIR SAFETY
4/114
DOAN-11-PLA-04-1.0
Page intentionally left blank

NATIONAL PERFORMANCE PLAN (PNER) FOR RP1 (2012-2014)
SPANISH STATE
AGENCY FOR AIR SAFETY
5/114
DOAN-11-PLA-04-1.0
INDEX
1. INTRODUCTION .......................................................................................................6
1. INTRODUCTION .......................................................................................................7
1.1. The situation ..........................................................................................................................7
1.2. Macroeconomic scenario for RP1 including overa ll assumptions ..................................8
1.3. Stakeholder consultation .....................................................................................................8
2. PERFORMANCE TARGETS AT NATIONAL LEVEL........... ....................................8
2.1. Performance targets (and alert thresholds) for RP1 .........................................................8
2.2. Consistency with EU-wide performance targets ( and thresholds) ..................................8
2.3. Carry-overs from the years before RP1 ..............................................................................8
2.4. Parameters for risk-sharing and incentives .......................................................................8
3. CONTRIBUTION OF EACH ACCOUNTABLE ENTITY......... ...................................8
3.1. Aena ........................................................................................................................................8
3.2. AEMET ....................................................................................................................................8
3.3. EA-ANSP & EA-NSA ..............................................................................................................8
3.4. ANSMET .................................................................................................................................8
3.5. AESA ......................................................................................................................................8
4. CIVIL-MILITARY DIMENSION OF THE PERFORMANCE PLAN ............................8
4.1 Performance of the FUA application ....................................................................................8
4.2 Additional KPIs .......................................................................................................................8
5. ANALYSIS OF SENSITIVITY......................... ...........................................................8
5.1. Sensitivity to external assumptions ....................................................................................8
5.2. Comparison with the previous performance plan .............................................................8
6. IMPLEMENTATION OF THE PERFORMANCE PLAN.......... ...................................8
6.1. Safety ......................................................................................................................................8
6.2. Capacity .................................................................................................................................8
6.3. Environment ..........................................................................................................................8
6.4. Cost-efficiency .......................................................................................................................8
Reference Documentation ............................ ..............................................................8
List of Tables ..................................... ..........................................................................8
List of Figures.................................... ..........................................................................8

NATIONAL PERFORMANCE PLAN (PNER) FOR RP1 (2012-2014)
SPANISH STATE
AGENCY FOR AIR SAFETY
6/114
DOAN-11-PLA-04-1.0
Page intentionally left blank

NATIONAL PERFORMANCE PLAN (PNER) FOR RP1 (2012-2014)
SPANISH STATE
AGENCY FOR AIR SAFETY
7/114
DOAN-11-PLA-04-1.0
1. INTRODUCTION 1.1. The situation This document develops the national performance plan of Spain as established in Article 4.1 of Commission Regulation (EU) No 691/2010 of 29 July 2010 laying down a performance scheme (the Performance Regulation). In accordance with Article 1.1 of the Performance Regulation, this performance plan entails the whole territory of Spain including the Canaries FIR/UIR (Canary Islands) which is part of the ICAO AFI region. This national performance plan, called in Spanish Plan Nacional de Evaluación de Rendimientos (PNER), addresses the timeframe established in the Performance Regulation for the 1st Reference Period. It therefore encompasses the dates between January 1st, 2012 and December 31st, 2014 and will be produced at national level . Notwithstanding this and following Article 5.3 of the Performance Regulation, aggregated performance targets highlighting the consistency at FAB level with the European Union-wide (EU-wide) performance targets will be communicated for information to the Commission. The National Supervisory Authority (NSA) responsible for drawing up the performance plan is the Agencia Estatal de Seguridad Aérea (AESA1). Further to this, as there are three NSAs in Spain , AESA is also the NSA in charge of the coordination as set out under Article 4.3 of the Performance Regulation. This has been communicated to the European Commission by letter to the Director for Air Transportation of 29 September 2010. The accountable entities covered by the performance plan are the following, grouped by stakeholder nature: A) Service Providers
- Aeropuertos Españoles y Navegación Aérea (Aena S.A. ) (Aena2), air navigation service provider certified for both Air Traffic Services (ATS) and Communication, Navigation and Surveillance (CNS) provision and designated for Air Traffic Services provision;
- Agencia Estatal de Meteorología (AEMET3), (air navigation) service provider certified and designated for aeronautical meteorological (MET) services;
- Ejército del Aire (EA-ANSP4), non certified air navigation service provider which contributes to ATS provision to General Air Traffic (GAT);
B) NSAs - Agencia Estatal de Seguridad Aérea (AESA), Spanish Civil NSA except for MET services,
within the Ministerio de Fomento (Ministry of Transportation); - Secretaría de Estado para el Cambio Climático (SECC or ANS-MET), Spanish NSA for MET
services, within the Ministerio de Medio Ambiente y Medio Rural y Marino (Ministry of Environment);
- Segundo Jefe del Estado Mayor (SEJEMA or EA-NSA), Spanish Military NSA, within the Ministerio de Defensa (Ministry of Defence);
C) Governmental Body - Dirección General de Aviación Civil (DGAC5), within the Ministerio de Fomento (Ministry of
Transportation); NOTE: included for completeness’ sake but with marginal contribution to targets
1 http://www.seguridadaerea.es/ 2 http://www.aena.es/ 3 http://www.aemet.es/ 4 http://www.ejercitodelaire.mde.es/ 5 http://www.fomento.gob.es/mfom/lang_castellano/

NATIONAL PERFORMANCE PLAN (PNER) FOR RP1 (2012-2014)
SPANISH STATE
AGENCY FOR AIR SAFETY
8/114
DOAN-11-PLA-04-1.0
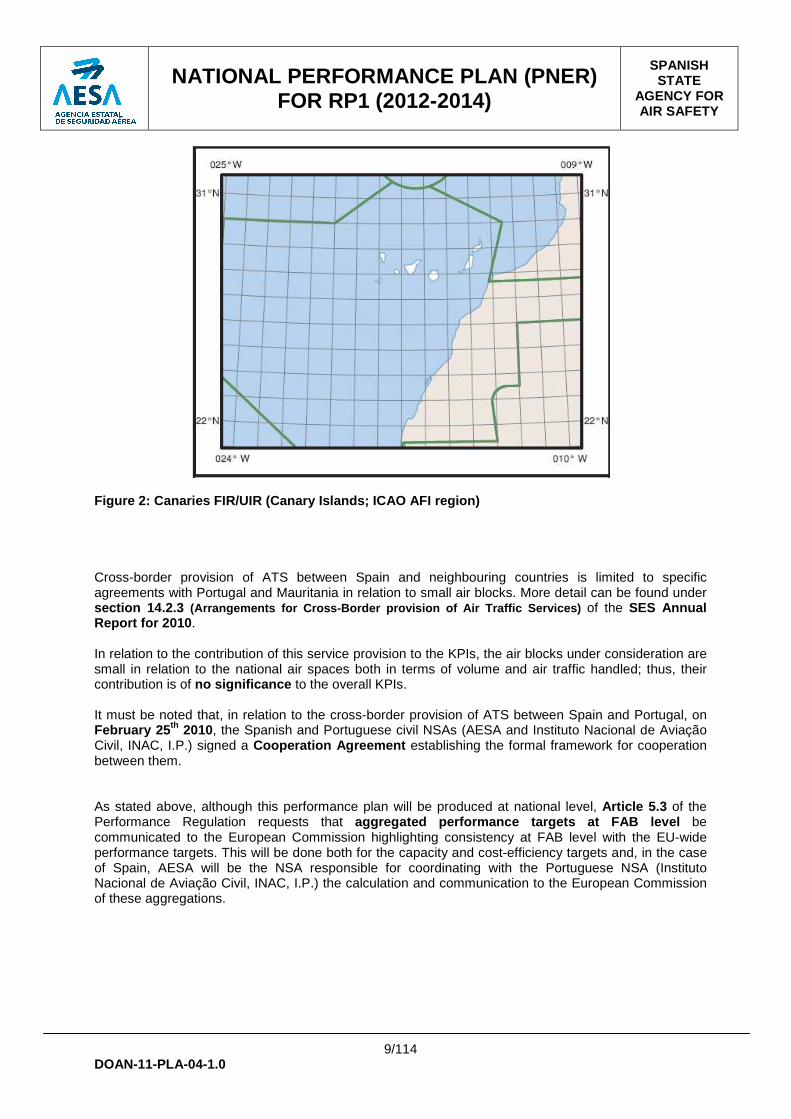
The scope of certification and designation of each air navigation service provider can be deduced from the Single European Sky (SES) Annual Report for 2010 6. In reading this document, it must be borne in mind that Spain is fully involved in the process of liberalizing the service provision at aerodromes. To that end, Spanish Law 9/2010 determines that Aena shall be responsible for the provision of area and approach control services whilst aerodrome traffic services (either AFIS or ATC) are being open to other service providers, with Spanish certified and designated provider Ineco already servicing three aerodromes and the tower control service at 13 aerodromes now being subject to a public competition. This is further developed under section 1.2 . As already stated at the beginning of this document and in accordance with Article 1.1 of the Performance Regulation, the performance plan will address the whole territory of Spain, i.e. both Continental Spain FIR/UIR (ICAO EUR region) and Canaries FIR/UIR (Canary Islands; ICAO AFI region).
Figure 1: Continental Spain FIR/UIR (ICAO EUR regio n)
6 http://www.eurocontrol.int/lssip/gallery/content/public/SES2010/LSSIP%202011-2015%20ES%20SES.pdf
NATIONAL PERFORMANCE PLAN (PNER) FOR RP1 (2012-2014)
SPANISH STATE
AGENCY FOR AIR SAFETY
9/114
DOAN-11-PLA-04-1.0
Figure 2: Canaries FIR/UIR (Canary Islands; ICAO AF I region) Cross-border provision of ATS between Spain and neighbouring countries is limited to specific agreements with Portugal and Mauritania in relation to small air blocks. More detail can be found under section 14.2.3 (Arrangements for Cross-Border provision of Air Tra ffic Services) of the SES Annual Report for 2010 . In relation to the contribution of this service provision to the KPIs, the air blocks under consideration are small in relation to the national air spaces both in terms of volume and air traffic handled; thus, their contribution is of no significance to the overall KPIs. It must be noted that, in relation to the cross-border provision of ATS between Spain and Portugal, on February 25 th 2010, the Spanish and Portuguese civil NSAs (AESA and Instituto Nacional de Aviação Civil, INAC, I.P.) signed a Cooperation Agreement establishing the formal framework for cooperation between them. As stated above, although this performance plan will be produced at national level, Article 5.3 of the Performance Regulation requests that aggregated performance targets at FAB level be communicated to the European Commission highlighting consistency at FAB level with the EU-wide performance targets. This will be done both for the capacity and cost-efficiency targets and, in the case of Spain, AESA will be the NSA responsible for coordinating with the Portuguese NSA (Instituto Nacional de Aviação Civil, INAC, I.P.) the calculation and communication to the European Commission of these aggregations.
NATIONAL PERFORMANCE PLAN (PNER) FOR RP1 (2012-2014)
SPANISH STATE
AGENCY FOR AIR SAFETY
10/114
DOAN-11-PLA-04-1.0
1.2. Macroeconomic scenario for RP1 including overa ll assumptions Spain has been concerned for a long time with the evolution of the costs of its air navigation services. Prior to 2009 the cost base trend did not evolve as desired. In that same year, the unit costs for provision of air navigation services showed a significant difference between Aena and the average value for the four largest air navigation service providers (ANSPs) (viz. NATS, DSNA, DFS GmbH and ENAV S.p.A.). This situation led to the adoption in 2010 of a specific law (Spanish Law 9/2010 7) that aimed at addressing fundamental performance issues within Aena, with particular focus in the high level of air traffic control officers’ (ATCOs) employment costs and their lower productivity when compared to other European Union air traffic control (ATC) service providers. In essence, this law adapts the Spanish air navigation system to the new European framework and aims at ensuring continuity in the provision of ATS services in a safe, sustainable and cost-effective manner. One of the most demanding requirements established by this law is that the Spanish Continental unit rate converges towards the average unit rate of the five largest European Union States by 2013 . Identical measures were also set in order to reduce en route costs to achieve a similar impact on the unit rate for the Canary Islands en route charging zone. With a view to gaining cost-efficiency and reducing the structural deficit caused by air navigation costs the law introduces a set of liberalizing measures by opening the provision of ATC and AFIS services at some Spanish towers to certified providers whilst establishing that Aena shall still be responsible for the provision of area and approach control services in Spanish airspace. At this moment in time, Spanish certified and designated provider Ineco is already providing service at three aerodromes and the tower control service at 13 aerodromes is being subject to a public competition. Finally, ATS training activities are also subject to similar liberalizing measures. As a result of all these efforts, the Spanish air navigation cost base has experienced a substantial reduction . Therefore, when evaluating the cost-efficiency KPI, as per Regulation (EU) No 691/2010 (18) , and COMMISSION DECISION of 21 February 2011 (11) , the financial situation of the Spanish ANSPs, and Aena in particular, should be taken into account given the tremendous effort already made by Spain to reduce costs. The law also foresees the publication of Law 1/2011 8, which establishes the framework for the development of the Spanish State Safety Programme (PESO, Programa Estatal de Seguridad Operacional). Law 1/2011 encapsulates a preventive and proactive approach to safety and the application of “just culture” principles into the Spanish legal framework. More detail about this law and the Spanish State Safety Programme (SSP) can be found in section 1.2.3. and Annex B . The institutional arrangement derived from the Spanish Law 9/2010 establishes the following roles: � The Spanish Department of Transportation (Ministerio de Fomento) will be responsible for the
designation of the certified air traffic service providers in charge of providing services at the Spanish aerodromes. The designation of the tower ATS provider will depend on the proposal of the airport operator who will specify the services required (AFIS, ATC or both). In this respect the Law establishes the integration of the ATS tower service charges in the costs of the aerodrome operator, who will take care of adapting these services to the characteristics of each airport.
7 Ley 9/2010, de 14 de abril, por la que se regula la prestación de servicios de tránsito aéreo, se establecen las obligaciones de los proveedores civiles de dichos servicios y se fijan determinadas condiciones laborales para los controladores civiles de tránsito aéreo (http://www.boe.es/boe/dias/2010/04/15/pdfs/BOE-A-2010-5983.pdf)
8 Ley 1/2011, de 4 de marzo, por la que se establece el Programa Estatal de Seguridad Operacional para la Aviación Civil y se modifica la Ley 21/2003, de 7 de julio, de Seguridad Aérea (http://www.boe.es/boe/dias/2011/03/05/pdfs/BOE-A-2011-4116.pdf)
NATIONAL PERFORMANCE PLAN (PNER) FOR RP1 (2012-2014)
SPANISH STATE
AGENCY FOR AIR SAFETY
11/114
DOAN-11-PLA-04-1.0
� AESA , as the Spanish Civil NSA , is entitled to certify both new air navigation service civil providers (excluding meteorological service providers) by an urgency procedure and the current ATC training entities as AFIS training entities. AESA is also entitled to expedite the approval of training plans based on validated previous experience and knowledge in order to train and license new ATCOs in a shorter time.
� AESA is also responsible for the effective economic supervision of civil air navigation providers
(excluding meteorological service providers) and for the preparation of the PNER in order to achieve the Spanish performance targets that derive from the application of Law 9/2010.
1.2.1. Overall assumptions for RP1 and institutiona l context 1.2.1.1. Economic assumptions
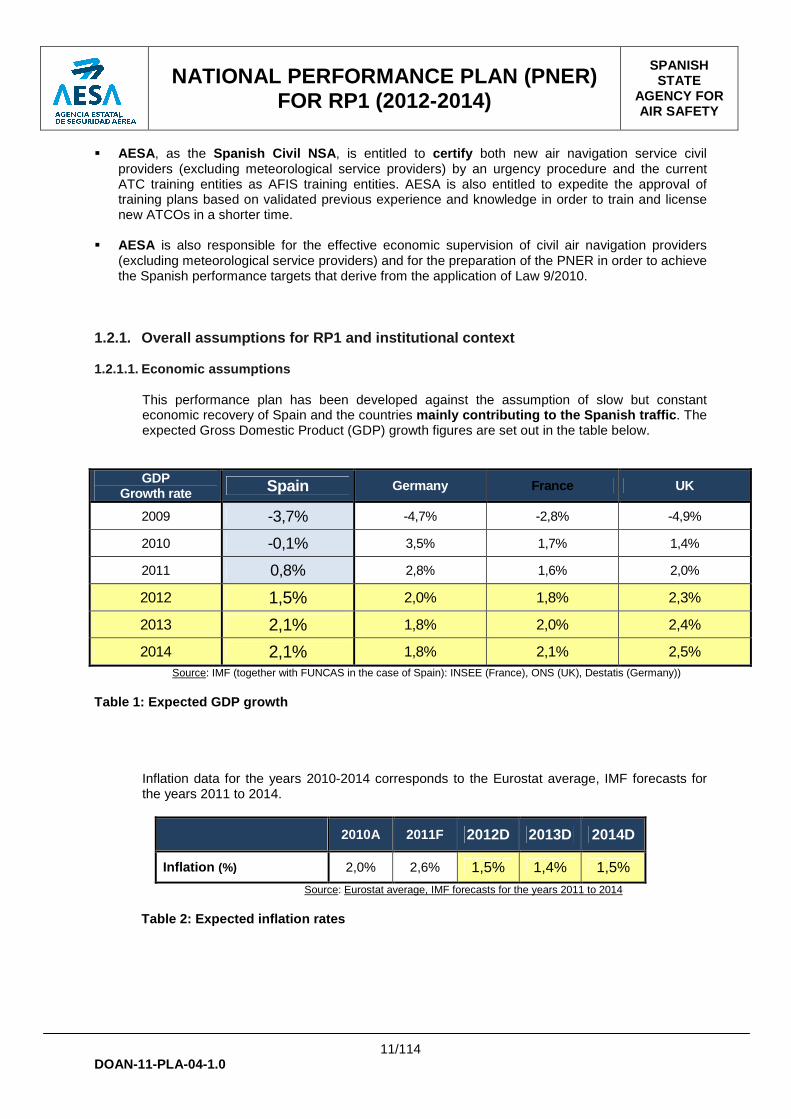
This performance plan has been developed against the assumption of slow but constant economic recovery of Spain and the countries mainly contributing to the Spanish traffic . The expected Gross Domestic Product (GDP) growth figures are set out in the table below. GDP
Growth rate Spain Germany France UK
2009 -3,7% -4,7% -2,8% -4,9%
2010 -0,1% 3,5% 1,7% 1,4%
2011 0,8% 2,8% 1,6% 2,0%
2012 1,5% 2,0% 1,8% 2,3%
2013 2,1% 1,8% 2,0% 2,4%
2014 2,1% 1,8% 2,1% 2,5% Source: IMF (together with FUNCAS in the case of Spain): INSEE (France), ONS (UK), Destatis (Germany))
Table 1: Expected GDP growth
Inflation data for the years 2010-2014 corresponds to the Eurostat average, IMF forecasts for the years 2011 to 2014.
2010A 2011F 2012D 2013D 2014D
Inflation (%) 2,0% 2,6% 1,5% 1,4% 1,5% Source: Eurostat average, IMF forecasts for the years 2011 to 2014
Table 2: Expected inflation rates

NATIONAL PERFORMANCE PLAN (PNER) FOR RP1 (2012-2014)
SPANISH STATE
AGENCY FOR AIR SAFETY
12/114
DOAN-11-PLA-04-1.0
1.2.1.2. Traffic assumptions The traffic forecast used in this performance plan was developed by Aena in April 2011 making use of the methodology usually employed by this organisation in the elaboration of its mid-term traffic forecasts. The statistical methodology employed uses an extrapolation of past data based on a study of trend and seasonal behaviour, and corrected with the Spanish GDP forecast specified in Table 1 (section 1.2.1.1.1. ). The GDP past trend and forecast of some other countries relevant for the Spanish air traffic has also been considered in Table 1 . Other elements such as the competition with alternative means of transport, in particular high-speed trains (whose development has been very significant in Spain for the last years and is planned to increase in the near future), and the presence of low-cost operators in some Spanish airports, have been considered as well. Finally, the forecast is consolidated contrasting internal information from Aena’s units managing slots and airport movement statistics and STATFOR long-term forecasts. The forecasts used in the elaboration of this performance plan can be seen in sections 2.2.2. for traffic and 2.2.4.1. and 2.2.4.2. for the Service Units.
1.2.1.3. Institutional context
The basic roles of the different accountable entities that configure the institutional context for the provision or air navigation services in Spain has already been set in section 1.1. . Further to this, the main responsibilities, duties and relations between the different entities in the context of the Spanish air navigation are established as follows: � The Spanish Ministry of Transportation (Ministerio de Fomento) is responsible for the
setting up of air navigation policy and the designation of the certified ATS providers.
o The DGAC is part of this Ministry through the Secretary of State for Transportation and is the responsible for discharging the duties assigned to the Ministry of Transportation in matters related to Civil Aviation;
o AESA is the Spanish Civil NSA except for MET services and is directly dependent on the DGAC , whose Director General is also President of AESA;
o Aena is Spain’s main air navigation service provider certified for both ATS and CNS provision and designated for ATS provision by the DGAC; it is attached to the Ministry of Transportation through the Secretary of State for Transportation , to whom the top management of Aena is accountable.
� The Spanish Ministry of Environment (Ministerio de Medio Ambiente y Medio Rural y
Marino) is responsible for the setting up of aeronautical MET services and the designation of the certified MET service provider.
o AEMET is the MET service provider certified and designated for aeronautical meteorological (MET) services and is directly dependent on the Secretary of State for Climatic Change ;
o The Secretary of State for Climatic Change is the Spanish NSA for MET services and is directly dependent in the Minister of Environment;
NATIONAL PERFORMANCE PLAN (PNER) FOR RP1 (2012-2014)
SPANISH STATE
AGENCY FOR AIR SAFETY
13/114
DOAN-11-PLA-04-1.0
� The Spanish Ministry of Defence (Ministerio de Defensa) is responsible for all the matters related to Operational Air Traffic (OAT) and airspace defence though it also contributes to ATS provision to GAT as a non certified and non designated ATS service provider through the services provided by the Air Force (Ejército del Aire) and supervised by the Deputy Chief Air Force Staff who is the Spanish Military NSA.
In relation to the interdependencies and interactions between the Ministries, both the representatives of the Ministries of Defence and Transportation meet regularly through a dedicated interministerial commission (CIDEFO, Comisión Interministerial entre Defensa y Fomento) that undertakes the co-ordination and advises both Ministries and the Government in matters pertaining to airspace policy, the flexible use of national airspace, regulation of ANS/ATM and CNS, air bases open to civil use and effective safeguarding of aerodromes and navigation aids easements (“servidumbres aeronáuticas”). Finally, all three ministries interact through the Cabinet meetings which are held regularly (every Friday). More detail on these arrangements and the different entities involved in them can be found in the Single European Sky (SES) Annual Report for 2010 . It must be noted that Spanish Law 9/2010 has introduced some changes in the institutional arrangements within the entities related to the Ministry of Transportation. These changes have already been detailed at the beginning of this same section 1.2. .
1.2.2. General economic situation
Spanish economy continues growing at a weak pace, in an environment characterized by progressive recovery of the global economy, but with lots of uncertainties. The contextual information available suggests that, in the first quarter of 2011, GDP recorded a quarterly increase of 0.3%, equal to the last few months of last year. This slow recovery was the result of a positive contribution of the internal demand and the increase in the positive contribution of net external demand of 0.3%, which returned to be the main source of spending boom. The principal component of internal demand comes from public consumption with a contribution of 1.4 %. In domestic demand, the consumption of households and the investment in equipment stand still for the first quarter. On the other hand construction moderate its way down. In line with this scenario, all productive sectors showed no rhythms of growth. The unemployment rate experienced a rebound of a percentage point, to 21.3% in the first quarter, in an environment of slight moderation in the pace of expansion of the active population. Despite the cyclical weakness that still shows the Spanish economy, inflation continued its upward trajectory, driven, as had already happened in the last months of last year, so in principle transitory factors, which include mainly, the cost of energy. The rate of annual change in the Consumer Price Index rallied to 3.6% in March (3% in December of last year). However, it is expected that the pressure on costs and prices will intensify (the indicator ahead of the CPI for April increased to 3.8%), with the consequent increase in the risk of deterioration of inflation expectations.
NATIONAL PERFORMANCE PLAN (PNER) FOR RP1 (2012-2014)
SPANISH STATE
AGENCY FOR AIR SAFETY
14/114
DOAN-11-PLA-04-1.0
In the International Economic Outlook, the recovery tended to generalize, but the aggravation of geopolitical tensions has caused the increase in the prices of energy in the international markets and the maintenance of the sovereign debt in the euro zone crisis introduced new elements of uncertainty. The prices of raw materials increases, given the persistence of strong demand pressures, aggravated by the supply side, by the political tensions in the oil-producing countries. The price of oil reached a new high in the last days of April (127 dollars per barrel) and the prices of precious metals and food also extended its upward though of more moderate path. Accordingly, global inflation experienced a further increase, and there is a perspective of future deterioration.
1.2.3. Overall status of aviation safety
After performing a robust ICAO gap analysis as indicated in ICAO’s Safety Management Manual (SMM) (Doc 9859) , the Spanish Government decided to amend the legislative framework in order to regulate the Spanish Safety Programme for Civil Aviation (called PESO, Programa Estatal de Seguridad Operacional). Currently, Law 1/2011, published in March 4th 2011, introduces through its Article 11 the Spanish State Safety Programme and deals in Articles 12 and 18 with safety information protection. The Law is currently being developed by a Royal Decree that will deal with: � Aviation organizations involved in the PESO: their responsibilities and accountabilities and
the coordination between them; � Service and product providers subject to the PESO. In addition, the national enforcement
policy will follow the recommendations of ICAO’s Safety Management Manual (Doc 9859) ; � AESA’s role in the PESO; � Accountable executive role who will be appointed by the Council of Ministers (cabinet); � Procedure for preparing, processing, approving, promoting and reviewing the PESO. An Agreement of the Council of Ministers is also planned to complete the Law and the Royal Decree. This Agreement will contain the Spanish safety policy and State safety objectives as well as the PESO. As a product of the Spanish SSP for the Civil Aviation, AESA will produce the Spanish Aviation Safety Plan that will document the top safety concerns in Spain, based on AESA’s (mandatory and voluntary) Occurrence Reporting System Annual Report. The Spanish Aviation Safety Plan will also take into account the European safety concerns identified in the European Aviation Safety Plan document 9. In addition AESA envisages the elaboration of ad-hoc safety plans for those safety concerns that could not have been identified in the Occurrence Reporting System Annual Report but could constitute a top safety concern at national level. The Spanish State safety objectives -or key safety performance indicators and targets using the Performance Regulation terminology- will depend on Spain’s safety concerns and will be defined in order to measure the Spanish Aviation Safety Plan and also the forecasted ad-hoc safety plans effectiveness. The navigation service providers will agree with AESA their key performance indicators and targets. The navigation service providers’ key performance indicators and targets will be based on their operational context and will be coherent with the Spanish State key performance indicators and targets.
9 https://easa.europa.eu/sms/docs/European%20Aviation%20Safety%20Plan%20%20(EASp)%202011-2014%20v1.2.pdf
NATIONAL PERFORMANCE PLAN (PNER) FOR RP1 (2012-2014)
SPANISH STATE
AGENCY FOR AIR SAFETY
15/114
DOAN-11-PLA-04-1.0
1.3. Stakeholder consultation Since the inception of this performance plan, periodic rounds of consultation have been taking place with the accountable entities detailed under section 1.1 , through which the initial performance plan has been refined. A Draft for Stakeholder Consultation was issued on the 10th May and sent to all the stakeholders invited to the Stakeholder Consultation Meeting (SCM) with due advance, as requested by Article 10.2.(b) of the Performance Regulation. Attending the requests made by the airspace users and the derived recommendations expressed by the European Commission during the 40th session of the Single Sky Committee (SSC/11/40/4), the Stakeholder (formal) consultation was held at FAB level between Portugal and Spain, founding members of the SW FAB . However, taking into consideration what has been indicated under section 1.1 on the establishment of a national performance plan for RP1, the consultation was organized as two back-to-back bilateral consultations within the same day involving successively Spain and Portugal. Thus, both consultations took place on May 31st at the Tryp Oriente hotel in Lisbon. The format of the consultation was as detailed below and further detailed in section C.1 of Annex C . Invitations were sent to the participants listed in section C.2 of Annex C , of which the following finally attended the consultation meeting: IATA (8 people) and ELFAA (1 person). The main issues raised during the meeting are detailed in the section below in the order they were dealt with during the meeting, together with the responses given by the NSA, including where applicable compromises reached, amendments made and actions agreed. 1.3.1. FUA and Environment
The users brought the attention to the statement made by Spain of an overall reduction in the length of routes of 250 NM and requested a detailed breakdown of this achievement. Spain has included the detail requested in section 4.1.1. of this performance plan.
1.3.2. Traffic forecasts
The users requested robust justification to support the use of national forecasts as compared to the last STATFOR Medium-Term Forecast and in particular reasons for the former being lower than the latter, together with record of accuracy of Aena’s previous predictions. However, they clearly expressed their preference for the use of STATFOR forecast with the performance plan. A formal analysis on the previous points is currently being undertaken.
1.3.3. Capacity
The users remarked that Spain’s national capacity target is lower (less ambitious) than the reference value provided by Eurocontrol for 2014 (i.e. 0,31 minutes per flight). They expressed the lack of justification within the performance plan for Spain’s inability to achieve that reference value. Finally, they highlighted the significance of delay and fuel costs for the airlines and requested more ambition in the setting of the national capacity target.
NATIONAL PERFORMANCE PLAN (PNER) FOR RP1 (2012-2014)
SPANISH STATE
AGENCY FOR AIR SAFETY
16/114
DOAN-11-PLA-04-1.0
Spain replied by stressing that the justification already given within the plan is a good and realistic assessment of the challenges ahead in the building up of capacity. However, AESA has already requested further details of the reasons that prevent Aena to achieve Eurocontrol capacity reference value for Spain.
1.3.4. Cost-effectiveness
The users acknowledged Spain’s efforts to reduce its costs but noticed that while the reduction has been significant, DUR values are still higher than similar European States. It was pointed out that there is a slight increase in total costs for 2012 (Spain Continental) while the opposite evolution was expected. It was also noted that there is a significant increase in the Weighted Average Cost of Capital (WACC) that was difficult to understand given that the ANSPs are State owned and therefore not so exposed to risks. Spain replied that currently the context in which the different entities are operating is extremely complex, and it has to be taken into account Spain’s starting point in 2009 in order to evaluate it’s efforts as it is expressed in the Performance Regulation and Decision of 21 February 2011. This effort can be seen in Spain Continental unit rate reductions of around 7,5% in 2011 and 2012. With regard to the WACC, it was also explained that the new Regulation (EU) nº 1191/2010 currently in place adds a significant amount of risk to the ANSP (Aena) and that the effect of the increase in interest rate of bonds has to be factored in as well.

NATIONAL PERFORMANCE PLAN (PNER) FOR RP1 (2012-2014)
SPANISH STATE
AGENCY FOR AIR SAFETY
17/114
DOAN-11-PLA-04-1.0
2. PERFORMANCE TARGETS AT NATIONAL LEVEL The performance targets will be set at national level and will only relate to the mandatory national KPIs established under Section 2 of Annex I to the Performance Regulation, i.e. capacity (CAP) and cost-efficiency (CEF). These are labelled adding KPI to the area tag and the number of the KPI within that KPA. Thus, CEFKPI-01 is the first KPI for the KPA of cost-efficiency. Further to this, the three safety performance indicators presented under Annex I of the Performance Regulation will be monitored throughout RP1. These are labelled adding PI to the area tag of safety (SAF) and the number of the PI within that KPA. Thus, SAFPI-01 is the first PI for the KPA of safety. 2.1. Performance targets (and alert thresholds) for RP1 The following table summarises the key performance and performance indicators that will be subject to the performance scheme in Spain, along with the national targets and thresholds, if applicable.
National targets KPA KPI / PI
2012 2013 2014
National thresholds
SAFPI-01 Effectiveness of Safety Management (EoSM) (Safety Maturity Index (%))
n/a n/a n/a n/a
SAFPI-02 Application of the severity classification of the RAT (y/n)
n/a n/a n/a n/a (a) Safety*
SAFPI-03 Reporting of just culture (y/n)
n/a n/a n/a n/a
(b) Capacity CAPKPI-01 En route ATFM delay (minutes per flight)
0,8* 0,75* 0,5
Deviation over a calendar year by at least 10% of the actual traffic recorded by the PRB versus the traffic
forecasts
(c) Environment none n/a n/a n/a n/a
CEFKPI-01 Determined en route unit rate - Continental (2009 prices in €)
71,37 € 70,64 € 68,16 €
(d) Cost-efficiency CEFKPI-02
Determined en route unit rate - Canary Islands (2009 prices in €)
62,36 € 60,40 € 57,73 €
Deviation over a calendar year by at least 10% of the actual traffic recorded by the PRB versus the traffic
forecasts
* for monitoring purposes only, not binding
Table 3: National targets and thresholds for RP1 These key performance and performance indicators will be further explained in the following sections.
NATIONAL PERFORMANCE PLAN (PNER) FOR RP1 (2012-2014)
SPANISH STATE
AGENCY FOR AIR SAFETY
18/114
DOAN-11-PLA-04-1.0
2.1.1. Safety targets As indicated in section 1.2.3. , the key safety performance indicators and targets at national level will be mainly based on the Spanish Aviation Safety Plan. AESA has started producing its Spanish Aviation Safety Plan taking into account the Occurrence Reporting System Annual Reports. As an example, last year EASA requested AESA the top five safety concerns in Spain. In that moment, Spain’s safety concerns included minimum separation infringement in TMA and CTR, runway incursions and TCAS alerts in TMA. AESA has to update Spain’s top safety concerns taking into account the last Occurrence Reporting System Annual Report for 2009, but it can be anticipated that similar safety concerns are expected in the Spanish Aviation Safety Plan document. The key safety performance indicators and targets at navigation service providers level will be based on the key safety performance indicators and targets at national level and on the providers’ particular operational context. AESA has started to coordinate with Aena, Spain’s principal navigation service provider, in order to identify its top safety concerns and the most suitable key performance indicators and targets taking into account its operational context. No target will be set for the safety performance indicators and none are mandated by the Performance Regulation for RP1.
As stated in the introduction to this section, the three safety key performance indicators presented under Annex I of the Performance Regulation will be monitored during this first period, once these have been defined by E3 and E3+ and the regulation amended accordingly. At the time of the drafting of this performance plan this process is ongoing with an expected conclusion in the second half of 2011. These safety key performance indicators have already been stated in Table 3 above and are the following: � SAFPI-01, Effectivity of Safety Management (EoSM)
This is a Safety Maturity Index expressed as a percentage through the evaluation of the answers given to two separate questionnaires addressed to the service providers and the NSAs, respectively.
� SAFPI-02, Application of the severity classification of the RAT
It is envisaged as a Yes/no question per occurrence and is proposed to be measured by means of Eurocontrol’s Annual Summary Template (AST) form, after due modification.
� SAFPI-03, Reporting of just culture
It is envisaged as Yes/no questions that would make up a dedicated questionnaire accompanying the questionnaires on EoSM.
However, once the PESO is developed, it will include specific national indicators along with the ones mandated by the European Commission in the ATM domain.

NATIONAL PERFORMANCE PLAN (PNER) FOR RP1 (2012-2014)
SPANISH STATE
AGENCY FOR AIR SAFETY
19/114
DOAN-11-PLA-04-1.0
2.1.2. Capacity target The capacity KPI mandated by the Performance Regulation both at national and EU-wide level for RP1 is the “en route ATFM delay per flight” measured in minutes, which is the difference between the take-off time requested by the aircraft operator in the last submitted flight plan and the calculated take-off time (CTOT) allocated by the central unit of ATFM. This KPI is measured taking into account all ATFM delay causes or reasons for regulation indicated in Annex 6 of EUROCONTROL’s ATFCM Users Manual. For this indicator the following EU-wide performance target has been established:
“an improvement of the average en route Air Traffic Flow Management (ATFM) delay so as to reach a maximum of 0,5 minute per flight in 2014”.
The target for capacity is laid out in the following table:
2012 2013 2014
Capacity KPI Intermediate Value
Intermediate Value Target
Minutes of en route ATFM delay per flight 0,8* 0,75* 0,5 * for monitoring purposes only, not binding
Table 4: En route capacity target (CAPKPI-01) for R P1
The alert threshold associated with this target is a deviation over a calendar year by at least 10% of the actual traffic recorded by the PRB versus the traffic forecasts. This is in line with the EU-wide alert threshold.
2.1.3. Environment target No environment KPI is mandated by the Performance Regulation for RP1 at national level but only an EU-wide performance indicator has been established as the “the average horizontal en route flight efficiency”, which is the difference between the length of the en route part of the actual trajectory and the optimum trajectory which, in average, is the great circle. For this indicator the following EU-wide performance target has been established:
“an improvement by 0,75 of a percentage point of the average horizontal en route flight efficiency indicator in 2014 as compared to the situation in 2009”.
The Network Manager will be the main accountable entity for the achievement of this target.
NATIONAL PERFORMANCE PLAN (PNER) FOR RP1 (2012-2014)
SPANISH STATE
AGENCY FOR AIR SAFETY
20/114
DOAN-11-PLA-04-1.0
2.1.4. Cost-efficiency target (and thresholds)
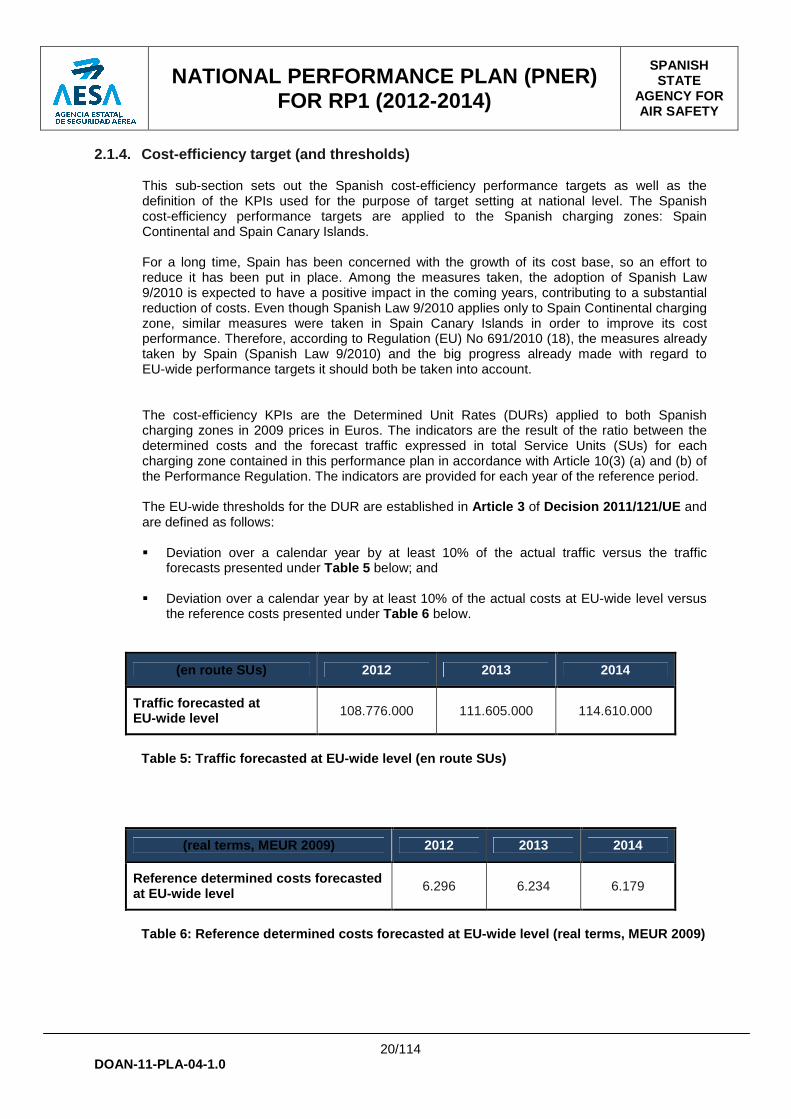
This sub-section sets out the Spanish cost-efficiency performance targets as well as the definition of the KPIs used for the purpose of target setting at national level. The Spanish cost-efficiency performance targets are applied to the Spanish charging zones: Spain Continental and Spain Canary Islands. For a long time, Spain has been concerned with the growth of its cost base, so an effort to reduce it has been put in place. Among the measures taken, the adoption of Spanish Law 9/2010 is expected to have a positive impact in the coming years, contributing to a substantial reduction of costs. Even though Spanish Law 9/2010 applies only to Spain Continental charging zone, similar measures were taken in Spain Canary Islands in order to improve its cost performance. Therefore, according to Regulation (EU) No 691/2010 (18), the measures already taken by Spain (Spanish Law 9/2010) and the big progress already made with regard to EU-wide performance targets it should both be taken into account. The cost-efficiency KPIs are the Determined Unit Rates (DURs) applied to both Spanish charging zones in 2009 prices in Euros. The indicators are the result of the ratio between the determined costs and the forecast traffic expressed in total Service Units (SUs) for each charging zone contained in this performance plan in accordance with Article 10(3) (a) and (b) of the Performance Regulation. The indicators are provided for each year of the reference period. The EU-wide thresholds for the DUR are established in Article 3 of Decision 2011/121/UE and are defined as follows: � Deviation over a calendar year by at least 10% of the actual traffic versus the traffic
forecasts presented under Table 5 below; and � Deviation over a calendar year by at least 10% of the actual costs at EU-wide level versus
the reference costs presented under Table 6 below.
(en route SUs) 2012 2013 2014
Traffic forecasted at EU-wide level 108.776.000 111.605.000 114.610.000
Table 5: Traffic forecasted at EU-wide level (en ro ute SUs)
(real terms, MEUR 2009) 2012 2013 2014
Reference determined costs forecasted at EU-wide level 6.296 6.234 6.179
Table 6: Reference determined costs forecasted at E U-wide level (real terms, MEUR 2009)

NATIONAL PERFORMANCE PLAN (PNER) FOR RP1 (2012-2014)
SPANISH STATE
AGENCY FOR AIR SAFETY
21/114
DOAN-11-PLA-04-1.0
2.1.4.1. Spain Continental The cost-efficiency KPI is the determined unit rate in 2009 prices in Euros. The indicator is the result of the ratio between the determined costs and the forecast traffic expressed in total service units contained in this performance plan in accordance with Article 10(3) (a) and (b) of the Performance Regulation. The indicator is expressed in Euros and in 2009 prices and is provided for each year of the reference period. The target for the DUR in Continental Spain is laid out in the following table:
Cost-efficiency KPI 2009 2010 2011 2012 2013 2014
Spain Continental Target Target Target
Determined unit rate (DUR) (2009 prices in €)
94,45 75,99 71,01 71,37 70,64 68,16
% -19,5% -6,5% 0,5% -1,0% -3,5%
Table 7: En route cost-efficiency Spain Continental target (CEFKPI-01) for RP1
2.1.4.2. Canary Islands
As in section 2.1.4.1. above, the cost-efficiency KPI is the determined unit rate in 2009 prices in Euros. The indicator is the result of the ratio between the determined costs and the forecast traffic expressed in total service units contained in this performance plan in accordance with Article 10(3) (a) and (b) of the Performance Regulation. The indicator is expressed in Euros and in 2009 prices and is provided for each year of the reference period. The target for the DUR in the Canary Islands is laid out in the following table:
Cost-efficiency KPI 2009 2010 2011 2012 2013 2014
Spain Canary Islands Target Target Target
Determined unit rate (DUR) (2009 prices in €)
80,62 70,07 64,51 62,36 60,40 57,73
% -13,1% -7,9% -3,3% -3,1% -4,4%
Table 8: En route cost-efficiency Spain Canary Isla nds target (CEFKPI-02) for RP1

NATIONAL PERFORMANCE PLAN (PNER) FOR RP1 (2012-2014)
SPANISH STATE
AGENCY FOR AIR SAFETY
22/114
DOAN-11-PLA-04-1.0
2.2. Consistency with EU-wide performance targets ( and thresholds) 2.2.1. Safety targets
As stated under section 2.1.1. , no targets will be set for the safety key performance indicators as none are mandated by the Performance Regulation for RP1.
2.2.2. Capacity target
The national target in 2014 will be a challenging 0,5 minutes per flight, the lowest since the launch of the Single European Sky initiative and four times less than the actual value for year 2010. In order to establish this target it has been taken into account that, since 2005, en route ATFM delays have been above 0,6 minutes per flight regardless of the variation of the number of flights and a traffic surge of 30% is forecasted in Spain for 2014.
Spain – IFR Flights 2009A 2010A 2011F 2012D 2013D 2014D
Spain Continental IFR Flights (‘000) 1.574 1.603 1.679 1.726 1.759 1.794
% 1,8% 4,7% 2,8% 1,9% 2,0%
Spain Canary Islands IFR Flights (‘000) 267 275 293 302 308 314
% 2,9% 6,7% 3,1% 1,9% 2,0%
Total Spain IFR Flights (‘000) 1.682 1.712 1.788 1.838 1.873 1.911
% -9,43% 1,78% 4,4% 2,8% 1,9% 2,0%
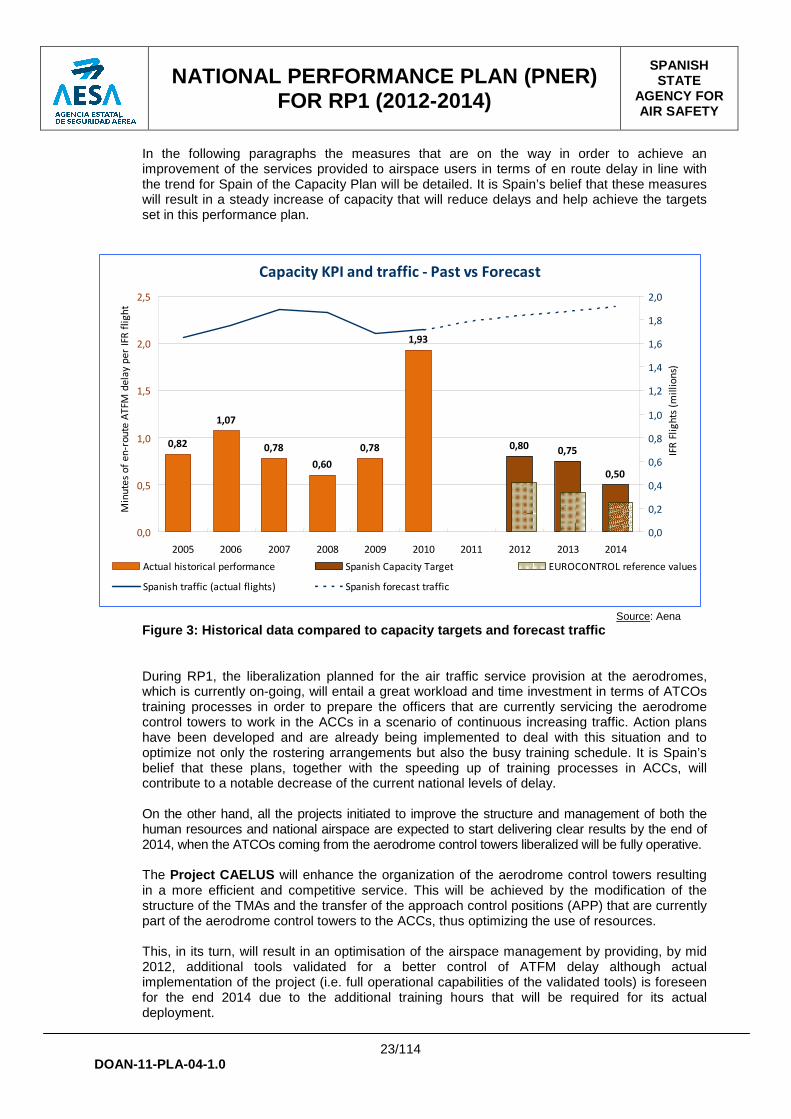
Table 9: EU-wide and national capacity (CAPKPI-01) targets for RP1 The reference value for Spain that results from the capacity planning process and is deemed indicative of Spain’s contribution to the EU-wide capacity target is expected to be achieved once the different projects now on-going bear tangible fruit. This is expected to happen at the beginning of the second reference period (RP2: 2015-2019), following a clear and determined trend of increasing capacity and reducing delays within RP1 as can be seen in Figure 3 .
Minutes of en route ATFM delay per IFR flight 2012 2013 2014
EU-wide capacity target - - 0,5
EUROCONTROL indicative reference values for Spain 0,52 0,42 0,31
National capacity target (CAPKPI-01 ) 0,8* 0,75* 0,5
* for monitoring purposes only, not binding
Table 10: EU-wide and national capacity (CAPKPI-01) targets for RP1
NATIONAL PERFORMANCE PLAN (PNER) FOR RP1 (2012-2014)
SPANISH STATE
AGENCY FOR AIR SAFETY
23/114
DOAN-11-PLA-04-1.0
In the following paragraphs the measures that are on the way in order to achieve an improvement of the services provided to airspace users in terms of en route delay in line with the trend for Spain of the Capacity Plan will be detailed. It is Spain’s belief that these measures will result in a steady increase of capacity that will reduce delays and help achieve the targets set in this performance plan.
Capacity KPI and traffic - Past vs Forecast
0,82
1,07
0,78
0,60
0,78
1,93
0,800,75
0,50
0,0
0,5
1,0
1,5
2,0
2,5
2005 2006 2007 2008 2009 2010 2011 2012 2013 2014
Min
ute
s o
f e
n-r
ou
te A
TFM
de
lay p
er
IFR
fli
gh
t
0,0
0,2
0,4
0,6
0,8
1,0
1,2
1,4
1,6
1,8
2,0
IFR
Fli
gh
ts (
mil
lio
ns)
Actual historical performance Spanish Capacity Target EUROCONTROL reference values
Spanish traffic (actual flights) Spanish forecast traffic
Source: Aena
Figure 3: Historical data compared to capacity targ ets and forecast traffic During RP1, the liberalization planned for the air traffic service provision at the aerodromes, which is currently on-going, will entail a great workload and time investment in terms of ATCOs training processes in order to prepare the officers that are currently servicing the aerodrome control towers to work in the ACCs in a scenario of continuous increasing traffic. Action plans have been developed and are already being implemented to deal with this situation and to optimize not only the rostering arrangements but also the busy training schedule. It is Spain’s belief that these plans, together with the speeding up of training processes in ACCs, will contribute to a notable decrease of the current national levels of delay. On the other hand, all the projects initiated to improve the structure and management of both the human resources and national airspace are expected to start delivering clear results by the end of 2014, when the ATCOs coming from the aerodrome control towers liberalized will be fully operative. The Project CAELUS will enhance the organization of the aerodrome control towers resulting in a more efficient and competitive service. This will be achieved by the modification of the structure of the TMAs and the transfer of the approach control positions (APP) that are currently part of the aerodrome control towers to the ACCs, thus optimizing the use of resources. This, in its turn, will result in an optimisation of the airspace management by providing, by mid 2012, additional tools validated for a better control of ATFM delay although actual implementation of the project (i.e. full operational capabilities of the validated tools) is foreseen for the end 2014 due to the additional training hours that will be required for its actual deployment.

NATIONAL PERFORMANCE PLAN (PNER) FOR RP1 (2012-2014)
SPANISH STATE
AGENCY FOR AIR SAFETY
24/114
DOAN-11-PLA-04-1.0
In summary, the national capacity target of 0,5 minutes per flight in 2014 has been established after careful consideration and taking into account the following aspects: � the historical figures of delays which have been over 0,6 minutes per flight since the launch
of the Single European Sky initiative; � the major restructuring of the business of the air navigation service providers in Spain in the
next few years; and � the number of projects, measures and processes that are planned to be finished and
operative by 2014.
2.2.3. Environment target As stated before, no environment KPI is mandated by the Performance Regulation for RP1 at national level but only an EU-wide performance indicator has been established as the “the average horizontal en route flight efficiency”, which is the difference between the length of the en route part of the actual trajectory and the optimum trajectory which, in average, is the great circle. For this indicator the following EU-wide performance target has been established:
“an improvement by 0,75 of a percentage point of the average horizontal en route flight efficiency indicator in 2014 as compared to the situation in 2009”.
The Network Manager will be the main accountable entity for the achievement of this target as well as the main responsible for ensuring consistency of its target with the EU-wide environment capacity target.
2.2.4. Cost-efficiency target (and thresholds) This section sets out the Spanish cost-efficiency targets for both Spain Continental and Spain Canary Islands, as well as the determined costs for RP1. The EU-wide target for cost-efficiency is:
“a reduction of the average European Union-wide determined unit rate for en route air navigation services from 59.97 Euros in 2011 to 53.92 Euros in 2014 (expressed in real terms, Euros 2009), with intermediate annual values of 57.88 Euros in 2012 and 55.87 Euros in 2013.”
This target represents a reduction of the average determined unit rate by 3,5% per annum. It should be taken into account the effort already made to reduce costs when evaluating the convergence with the EU-wide cost-efficiency targets as per Regulation 691/2010 (18) , and COMMISSION DECISION of 21 February 2011 (11) , both in Spain Continental and Spain Canary Islands, with a reduction of around 27% from 2009 to 2014 for Spain Continental, which implies an average reduction of 5,5% per annu m and a reduction of around 28% for Spain Canary Islands, that is to say an average red uction of 5,6% per annum. (See section 2.2.4.5 ). The following sections aim to justify the consistency of the national cost-efficiency targets CEFKPI-01 and CEFKPI-02 with the EU-wide target.

NATIONAL PERFORMANCE PLAN (PNER) FOR RP1 (2012-2014)
SPANISH STATE
AGENCY FOR AIR SAFETY
25/114
DOAN-11-PLA-04-1.0
2.2.4.1. En route SU Forecast – Spain Continental (SUs in millions)
Spain Continental 2009 A 2010 A 2011 F 2012 D 2013 D 2014 D
En route total service units prior to RP1 (Source: AENA) 8,37 8,64 9,07
Forecast of total service units used for the DUR (Source: AENA) 9,40 9,63 9,86
% 3,27% 5,00% 3,60% 2,40% 2,40%
STATFOR service units forecast (Baseline Scenario) 8,35 8,64 9,05 9,38 9,61 9,84
% 3,47% 4,75% 3,66% 2,41% 2,44%
Table 11: En route SU Forecast - Spain Continental
2.2.4.2. En route SU Forecast - Spain Canary Island s
(SUs in millions)
Spain Canary Islands 2009 A 2010 A 2011 F 2012 D 2013 D 2014 D
En route total service units prior to RP1 (Source: AENA) 1,49 1,54 1,64
Forecast of total service units used for the DUR (Source: AENA) 1,71 1,75 1,80
% 3,03% 6,19% 4,29% 2,40% 2,80%
STATFOR service units forecast (Baseline Scenario) 1,49 1,54 1,61 1,68 1,72 1,77
% 3,22% 4,81% 4,34% 2,38% 2,84%
Table 12: En route SU Forecast - Spain Canary Islands
NATIONAL PERFORMANCE PLAN (PNER) FOR RP1 (2012-2014)
SPANISH STATE
AGENCY FOR AIR SAFETY
26/114
DOAN-11-PLA-04-1.0
2.2.4.3. Determined en route ANS costs in nominal t erms
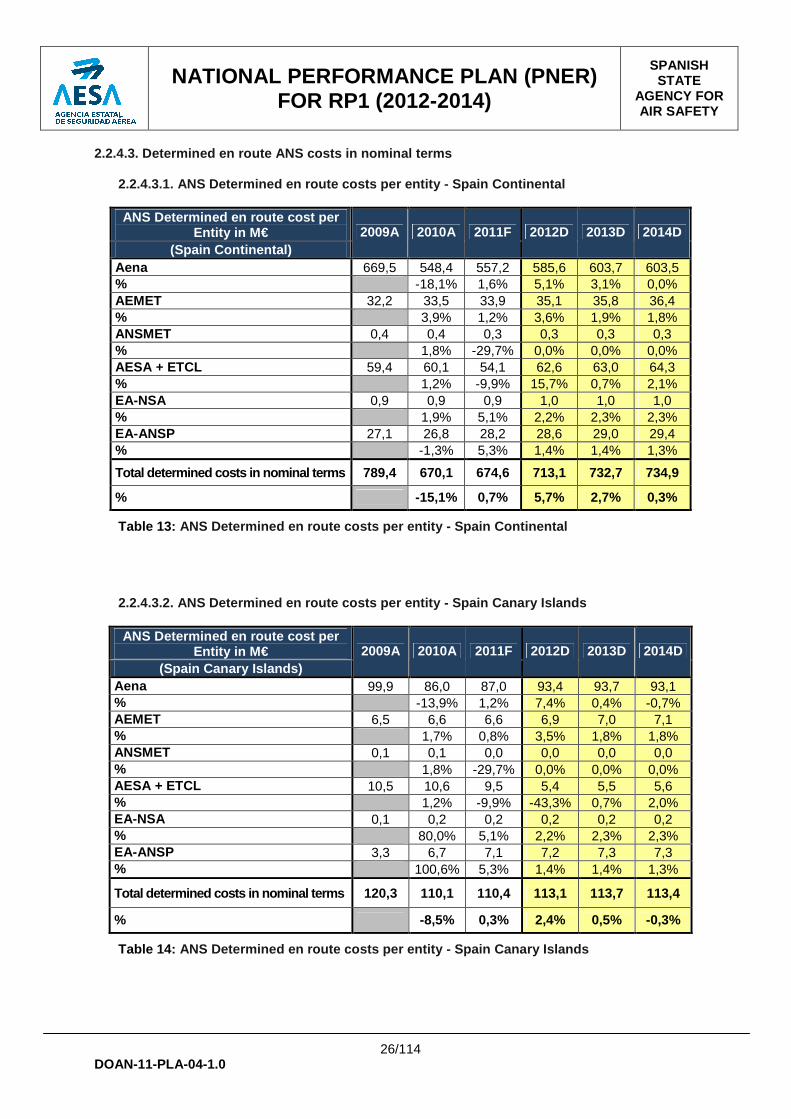
2.2.4.3.1. ANS Determined en route costs per entity - Spain Continental
ANS Determined en route cost per Entity in M€
(Spain Continental) 2009A 2010A 2011F 2012D 2013D 2014D
Aena 669,5 548,4 557,2 585,6 603,7 603,5 % -18,1% 1,6% 5,1% 3,1% 0,0% AEMET 32,2 33,5 33,9 35,1 35,8 36,4 % 3,9% 1,2% 3,6% 1,9% 1,8% ANSMET 0,4 0,4 0,3 0,3 0,3 0,3 % 1,8% -29,7% 0,0% 0,0% 0,0% AESA + ETCL 59,4 60,1 54,1 62,6 63,0 64,3 % 1,2% -9,9% 15,7% 0,7% 2,1% EA-NSA 0,9 0,9 0,9 1,0 1,0 1,0 % 1,9% 5,1% 2,2% 2,3% 2,3% EA-ANSP 27,1 26,8 28,2 28,6 29,0 29,4 % -1,3% 5,3% 1,4% 1,4% 1,3%
Total determined costs in nominal terms 789,4 670,1 674,6 713,1 732,7 734,9
% -15,1% 0,7% 5,7% 2,7% 0,3%
Table 13: ANS Determined en route costs per entity - Spain Co ntinental
2.2.4.3.2. ANS Determined en route costs per entity - Spain Canary Islands
ANS Determined en route cost per Entity in M€
(Spain Canary Islands) 2009A 2010A 2011F 2012D 2013D 2014D
Aena 99,9 86,0 87,0 93,4 93,7 93,1 % -13,9% 1,2% 7,4% 0,4% -0,7% AEMET 6,5 6,6 6,6 6,9 7,0 7,1 % 1,7% 0,8% 3,5% 1,8% 1,8% ANSMET 0,1 0,1 0,0 0,0 0,0 0,0 % 1,8% -29,7% 0,0% 0,0% 0,0% AESA + ETCL 10,5 10,6 9,5 5,4 5,5 5,6 % 1,2% -9,9% -43,3% 0,7% 2,0% EA-NSA 0,1 0,2 0,2 0,2 0,2 0,2 % 80,0% 5,1% 2,2% 2,3% 2,3% EA-ANSP 3,3 6,7 7,1 7,2 7,3 7,3 % 100,6% 5,3% 1,4% 1,4% 1,3%
Total determined costs in nominal terms 120,3 110,1 110,4 113,1 113,7 113,4
% -8,5% 0,3% 2,4% 0,5% -0,3%
Table 14: ANS Determined en route costs per entity - Spain Ca nary Islands

NATIONAL PERFORMANCE PLAN (PNER) FOR RP1 (2012-2014)
SPANISH STATE
AGENCY FOR AIR SAFETY
27/114
DOAN-11-PLA-04-1.0
2.2.4.3.3. ANS Determined en route cost per nature - Spain Continental
ANS Determined en route cost per nature in M€
(Spain Continental) 2009A 2010A 2011F 2012D 2013D 2014D
Staff 503,9 380,9 380,5 387,3 403,9 401,3 % -24,4% -0,1% 1,8% 4,3% -0,6% Other operating costs 149,0 145,7 138,8 148,2 147,1 150,2 % -2,2% -4,7% 6,7% -0,8% 2,2% Depreciation 87,5 92,9 100,9 106,1 108,7 108,4 % 6,2% 8,6% 5,1% 2,5% -0,3% Cost of capital 33,1 36,1 39,9 57,1 58,7 60,6 % 9,2% 10,5% 43,1% 2,7% 3,3% Exceptional items 15,9 14,4 14,4 14,4 14,4 14,4 % -9,5% 0,0% 0,0% 0,0% 0,0%
Total determined costs in nominal terms 789,4 670,1 674,6 713,1 732,7 734,9
% -15,1% 0,7% 5,7% 2,7% 0,3%
Table 15: ANS Determined en route cost per nature - Spain Con tinental
2.2.4.3.4. ANS Determined en route cost per nature - Spain Canary Islands
ANS Determined en route cost per nature in M€
(Spain Canary Islands) 2009A 2010A 2011F 2012D 2013D 2014D
Staff 70,7 60,0 59,6 62,1 62,2 61,2 % -15,1% -0,7% 4,2% 0,2% -1,7% Other operating costs 25,8 26,5 25,3 21,4 21,1 21,6 % 3,1% -4,5% -15,7% -1,1% 2,1% Depreciation 17,0 15,8 17,1 17,9 18,4 18,3 % -7,0% 8,2% 5,0% 2,4% -0,3% Cost of capital 5,7 6,6 7,3 10,5 10,8 11,2 % 15,4% 10,7% 44,0% 2,9% 3,5% Exceptional items 1,2 1,1 1,1 1,1 1,1 1,1 % -3,3% 0,0% 0,0% 0,0% 0,0%
Total determined costs in nominal terms 120,3 110,1 110,4 113,1 113,7 113,4
% -8,5% 0,3% 2,4% 0,5% -0,3%
Table 16: ANS Determined en route cost per nature - Spain Can ary Islands
NATIONAL PERFORMANCE PLAN (PNER) FOR RP1 (2012-2014)
SPANISH STATE
AGENCY FOR AIR SAFETY
28/114
DOAN-11-PLA-04-1.0
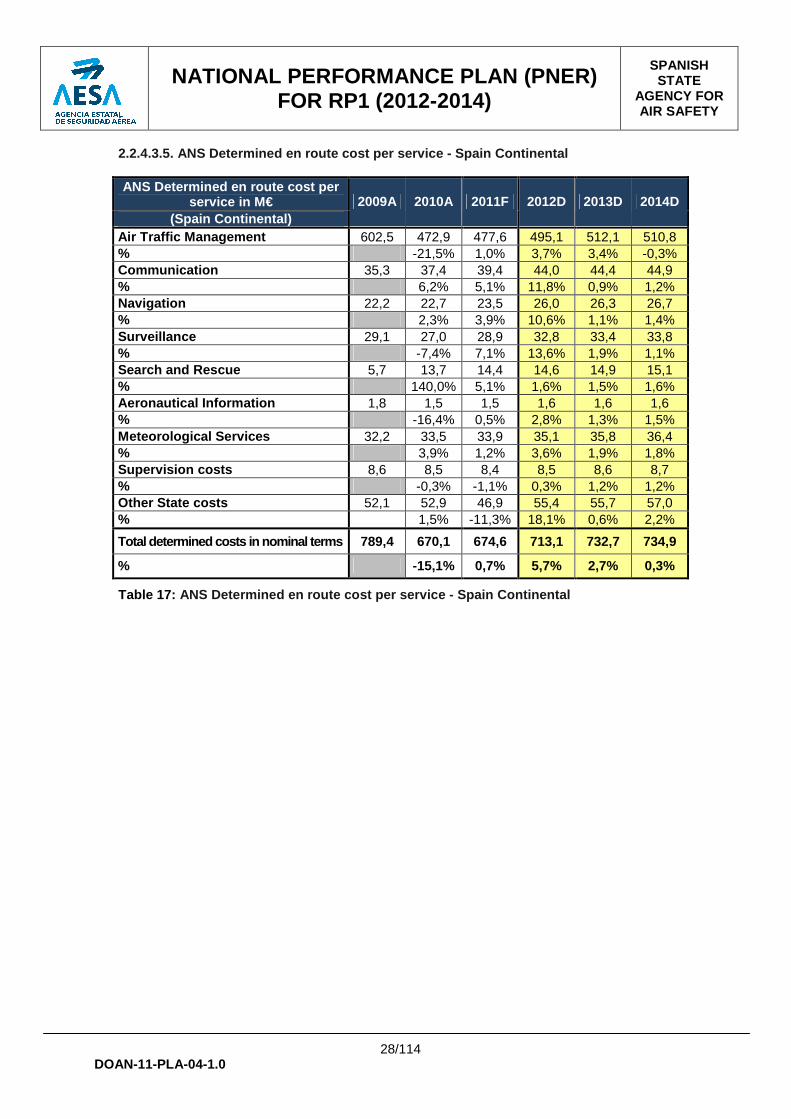
2.2.4.3.5. ANS Determined en route cost per service - Spain Continental
ANS Determined en route cost per service in M€
(Spain Continental) 2009A 2010A 2011F 2012D 2013D 2014D
Air Traffic Management 602,5 472,9 477,6 495,1 512,1 510,8 % -21,5% 1,0% 3,7% 3,4% -0,3% Communication 35,3 37,4 39,4 44,0 44,4 44,9 % 6,2% 5,1% 11,8% 0,9% 1,2% Navigation 22,2 22,7 23,5 26,0 26,3 26,7 % 2,3% 3,9% 10,6% 1,1% 1,4% Surveillance 29,1 27,0 28,9 32,8 33,4 33,8 % -7,4% 7,1% 13,6% 1,9% 1,1% Search and Rescue 5,7 13,7 14,4 14,6 14,9 15,1 % 140,0% 5,1% 1,6% 1,5% 1,6% Aeronautical Information 1,8 1,5 1,5 1,6 1,6 1,6 % -16,4% 0,5% 2,8% 1,3% 1,5% Meteorological Services 32,2 33,5 33,9 35,1 35,8 36,4 % 3,9% 1,2% 3,6% 1,9% 1,8% Supervision costs 8,6 8,5 8,4 8,5 8,6 8,7 % -0,3% -1,1% 0,3% 1,2% 1,2% Other State costs 52,1 52,9 46,9 55,4 55,7 57,0 % 1,5% -11,3% 18,1% 0,6% 2,2%
Total determined costs in nominal terms 789,4 670,1 674,6 713,1 732,7 734,9
% -15,1% 0,7% 5,7% 2,7% 0,3%
Table 17: ANS Determined en route cost per service - Spain Co ntinental
NATIONAL PERFORMANCE PLAN (PNER) FOR RP1 (2012-2014)
SPANISH STATE
AGENCY FOR AIR SAFETY
29/114
DOAN-11-PLA-04-1.0
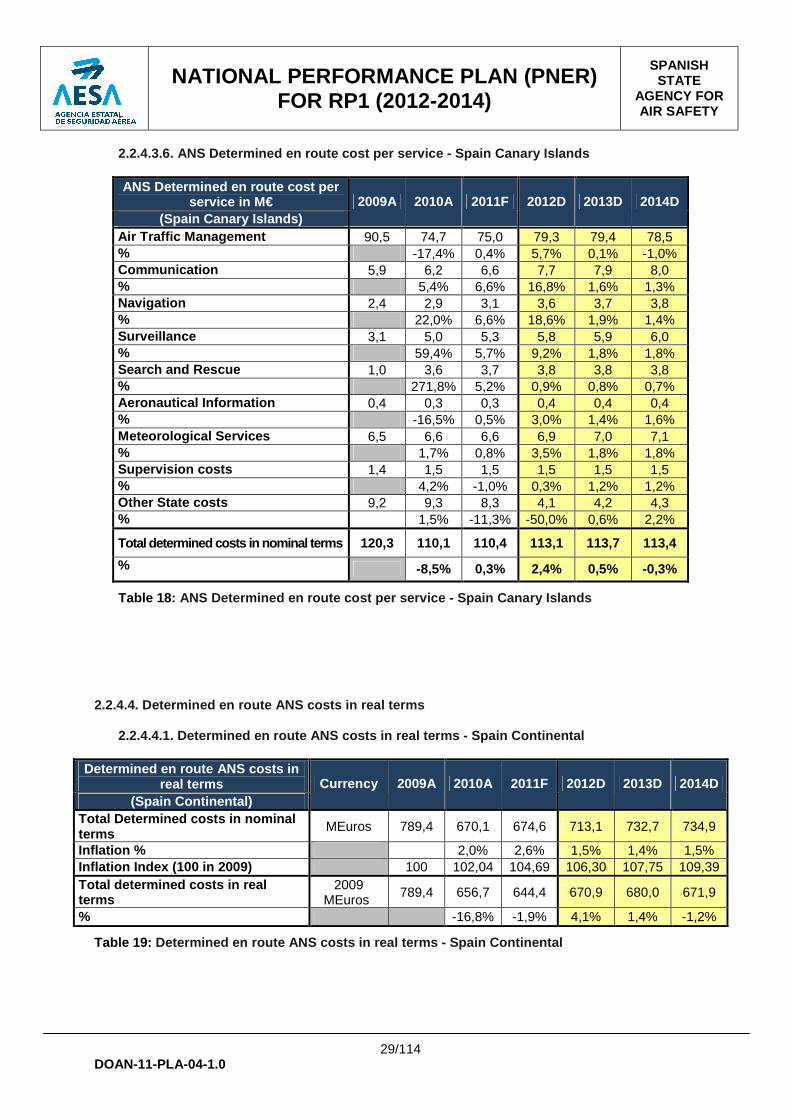
2.2.4.3.6. ANS Determined en route cost per service - Spain Canary Islands
ANS Determined en route cost per service in M€
(Spain Canary Islands) 2009A 2010A 2011F 2012D 2013D 2014D
Air Traffic Management 90,5 74,7 75,0 79,3 79,4 78,5 % -17,4% 0,4% 5,7% 0,1% -1,0% Communication 5,9 6,2 6,6 7,7 7,9 8,0 % 5,4% 6,6% 16,8% 1,6% 1,3% Navigation 2,4 2,9 3,1 3,6 3,7 3,8 % 22,0% 6,6% 18,6% 1,9% 1,4% Surveillance 3,1 5,0 5,3 5,8 5,9 6,0 % 59,4% 5,7% 9,2% 1,8% 1,8% Search and Rescue 1,0 3,6 3,7 3,8 3,8 3,8 % 271,8% 5,2% 0,9% 0,8% 0,7% Aeronautical Information 0,4 0,3 0,3 0,4 0,4 0,4 % -16,5% 0,5% 3,0% 1,4% 1,6% Meteorological Services 6,5 6,6 6,6 6,9 7,0 7,1 % 1,7% 0,8% 3,5% 1,8% 1,8% Supervision costs 1,4 1,5 1,5 1,5 1,5 1,5 % 4,2% -1,0% 0,3% 1,2% 1,2% Other State costs 9,2 9,3 8,3 4,1 4,2 4,3 % 1,5% -11,3% -50,0% 0,6% 2,2%
Total determined costs in nominal terms 120,3 110,1 110,4 113,1 113,7 113,4
% -8,5% 0,3% 2,4% 0,5% -0,3%
Table 18: ANS Determined en route cost per service - Spain Ca nary Islands 2.2.4.4. Determined en route ANS costs in real term s
2.2.4.4.1. Determined en route ANS costs in real te rms - Spain Continental
Determined en route ANS costs in
real terms (Spain Continental)
Currency 2009A 2010A 2011F 2012D 2013D 2014D
Total Determined costs in nominal terms MEuros 789,4 670,1 674,6 713,1 732,7 734,9
Inflation % 2,0% 2,6% 1,5% 1,4% 1,5% Inflation Index (100 in 2009) 100 102,04 104,69 106,30 107,75 109,39 Total determined costs in real terms
2009 MEuros
789,4 656,7 644,4 670,9 680,0 671,9
% -16,8% -1,9% 4,1% 1,4% -1,2%
Table 19: Determined en route ANS costs in real terms - Spain Continental
NATIONAL PERFORMANCE PLAN (PNER) FOR RP1 (2012-2014)
SPANISH STATE
AGENCY FOR AIR SAFETY
30/114
DOAN-11-PLA-04-1.0
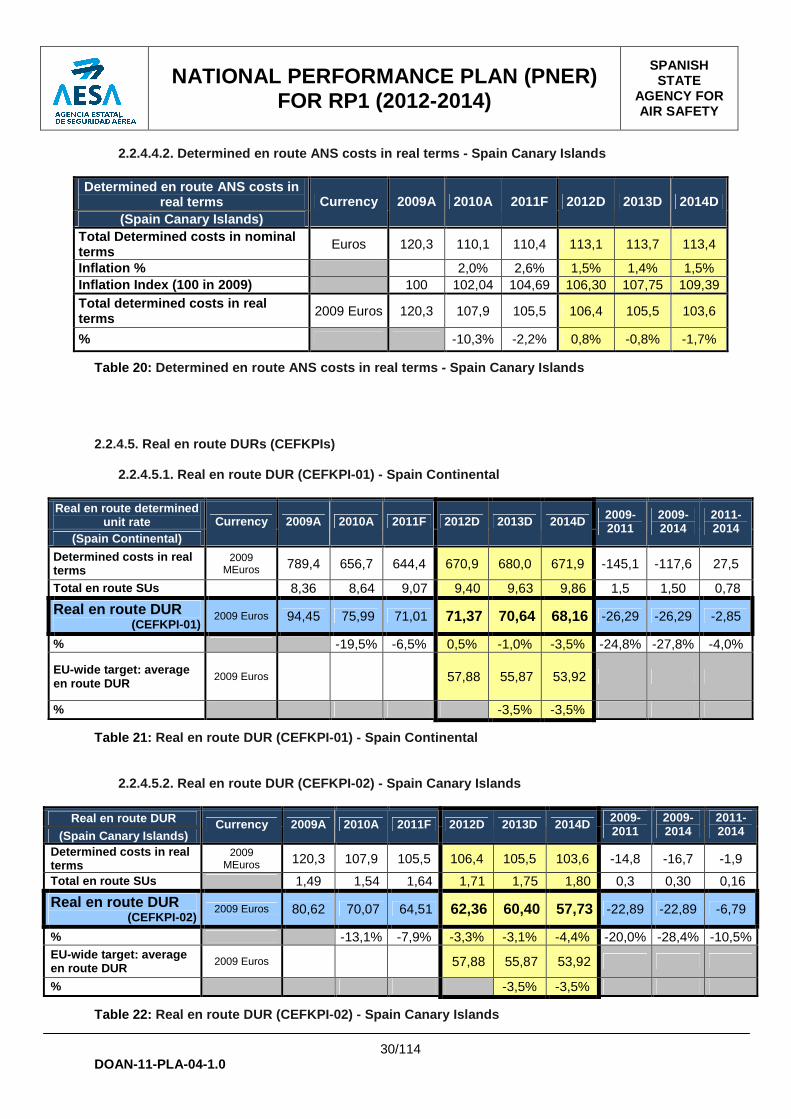
2.2.4.4.2. Determined en route ANS costs in real te rms - Spain Canary Islands
Determined en route ANS costs in real terms
(Spain Canary Islands) Currency 2009A 2010A 2011F 2012D 2013D 2014D
Total Determined costs in nominal terms Euros 120,3 110,1 110,4 113,1 113,7 113,4
Inflation % 2,0% 2,6% 1,5% 1,4% 1,5% Inflation Index (100 in 2009) 100 102,04 104,69 106,30 107,75 109,39 Total determined costs in real terms 2009 Euros 120,3 107,9 105,5 106,4 105,5 103,6
% -10,3% -2,2% 0,8% -0,8% -1,7%
Table 20: Determined en route ANS costs in real terms - Spain Canary Islands 2.2.4.5. Real en route DURs (CEFKPIs)
2.2.4.5.1. Real en route DUR (CEFKPI-01) - Spain Co ntinental
Real en route determined
unit rate (Spain Continental)
Currency 2009A 2010A 2011F 2012D 2013D 2014D 2009-2011
2009-2014
2011-2014
Determined costs in real terms
2009 MEuros 789,4 656,7 644,4 670,9 680,0 671,9 -145,1 -117,6 27,5
Total en route SUs 8,36 8,64 9,07 9,40 9,63 9,86 1,5 1,50 0,78
Real en route DUR (CEFKPI-01)
2009 Euros 94,45 75,99 71,01 71,37 70,64 68,16 -26,29 -26,29 -2,85
% -19,5% -6,5% 0,5% -1,0% -3,5% -24,8% -27,8% -4,0%
EU-wide target: average en route DUR
2009 Euros 57,88 55,87 53,92
% -3,5% -3,5%
Table 21: Real en route DUR (CEFKPI-01) - Spain Continental
2.2.4.5.2. Real en route DUR (CEFKPI-02) - Spain Ca nary Islands
Real en route DUR (Spain Canary Islands)
Currency 2009A 2010A 2011F 2012D 2013D 2014D 2009-2011
2009-2014
2011-2014
Determined costs in real terms
2009 MEuros 120,3 107,9 105,5 106,4 105,5 103,6 -14,8 -16,7 -1,9
Total en route SUs 1,49 1,54 1,64 1,71 1,75 1,80 0,3 0,30 0,16
Real en route DUR (CEFKPI-02)
2009 Euros 80,62 70,07 64,51 62,36 60,40 57,73 -22,89 -22,89 -6,79
% -13,1% -7,9% -3,3% -3,1% -4,4% -20,0% -28,4% -10,5% EU-wide target: average en route DUR
2009 Euros 57,88 55,87 53,92
% -3,5% -3,5%
Table 22: Real en route DUR (CEFKPI-02) - Spain Canary Island s

NATIONAL PERFORMANCE PLAN (PNER) FOR RP1 (2012-2014)
SPANISH STATE
AGENCY FOR AIR SAFETY
31/114
DOAN-11-PLA-04-1.0
2.2.4.6. Terminal ANS Costs
This section describes the Terminal ANS costs for Spain. Spain is currently immersed in a process of liberalization of aerodrome control service and set up of a new organizational model in Aena. This has resulted in the creation of “Aena Aeropuertos S.A.” as the new airport operator. It has to be pointed out that according to Spanish Law 1/2011, the terminal charges applied will be reduced by 90%, when the new society “Aena Aeropuertos, S.A.” starts exercising its effective functions and duties. This has already happened as of June, 8th by means of the agreement published in the Spanish Official Journal through Ministerial Order FOM/1525/2011.
2.2.4.6.1. Terminal ANS Costs per entity
Terminal ANS cost per Entity in M€ 2009 A 2010 A 2011 F 2012 F 2013 F 2014 F
AENA 288,9 197,7 188,6 179,3 167,7 166,6 % -31,6% -4,6% -4,9% -6,5% -0,6% AEMET 5,3 5,0 5,1 5,3 5,4 5,4 % -5,9% 1,3% 3,6% 1,9% 1,6% ANSMET 0,0 0,0 0,0 0,0 0,0 0,0 % -3,6% -25,8% 0,0% 0,0% 0,0% AESA 2,5 2,5 2,5 2,5 2,6 2,6 % 2,0% -0,1% 0,0% 1,5% 1,5%
Total costs in nominal terms 296,7 205,3 196,2 187,1 175,6 174,7
% -30,8% -4,4% -4,7% -6,1% -0,5% Table 23: Terminal ANS Costs per entity
2.2.4.6.2. Terminal ANS Costs per nature
Terminal ANS cost per nature in M€ 2009 A 2010 A 2011 F 2012 F 2013 F 2014 F
Staff 232,0 141,2 141,3 137,1 125,2 123,6 % -39,1% 0,0% -3,0% -8,7% -1,3% Other operating costs 20,3 20,3 21,3 22,4 22,0 22,4 % 0,0% 5,1% 5,1% -1,7% 1,8% Depreciation 25,3 25,1 18,8 13,5 13,9 13,6 % -0,8% -25,2% -27,8% 2,3% -1,8% Cost of capital 14,1 15,0 12,1 11,3 11,7 12,4 % 6,3% -19,5% -7,0% 4,3% 5,3% Exceptional items 5,1 3,7 2,8 2,8 2,8 2,8 % -27,0% -25,3% 0,0% 0,0% 0,0%
Total costs in nominal terms 296,7 205,3 196,2 187,1 175,6 174,7
% -30,8% -4,4% -4,7% -6,1% -0,5%
Table 24: Terminal ANS Costs per nature

NATIONAL PERFORMANCE PLAN (PNER) FOR RP1 (2012-2014)
SPANISH STATE
AGENCY FOR AIR SAFETY
32/114
DOAN-11-PLA-04-1.0
2.2.4.6.3. Terminal ANS Costs per service
Terminal ANS cost per service in M€ 2009 A 2010 A 2011 F 2012 F 2013 F 2014 F
Air Traffic Management 259,9 169,8 164,7 157,8 145,9 144,4 % -34,7% -3,0% -4,2% -7,6% -1,0% Communication 12,2 11,9 10,2 9,0 9,2 9,3 % -1,8% -14,8% -11,0% 1,2% 1,0% Navigation 12,4 11,7 10,1 9,1 9,2 9,5 % -5,6% -14,2% -9,8% 1,7% 2,4% Surveillance 3,7 3,7 3,1 2,8 2,8 2,9 % -1,7% -15,8% -10,6% 1,4% 2,3% Search and Rescue 0,0 0,0 0,0 0,0 0,0 0,0 % Aeronautical Information 0,6 0,6 0,6 0,6 0,6 0,6 % -6,0% -0,8% 0,9% 1,4% 1,6% Meteorological Services 5,3 5,0 5,1 5,3 5,4 5,4 % -5,9% 1,3% 3,6% 1,9% 1,6% Supervision costs 2,5 2,6 2,5 2,5 2,6 2,6 % 1,9% -0,6% 0,0% 1,5% 1,5% Other State costs 0,0 0,0 0,0 0,0 0,0 0,0 %
Total costs in nominal terms 296,7 205,3 196,2 187,1 175,6 174,7
% -30,8% -4,4% -4,7% -6,1% -0,5%
Table 25: Terminal ANS Costs per service
NATIONAL PERFORMANCE PLAN (PNER) FOR RP1 (2012-2014)
SPANISH STATE
AGENCY FOR AIR SAFETY
33/114
DOAN-11-PLA-04-1.0
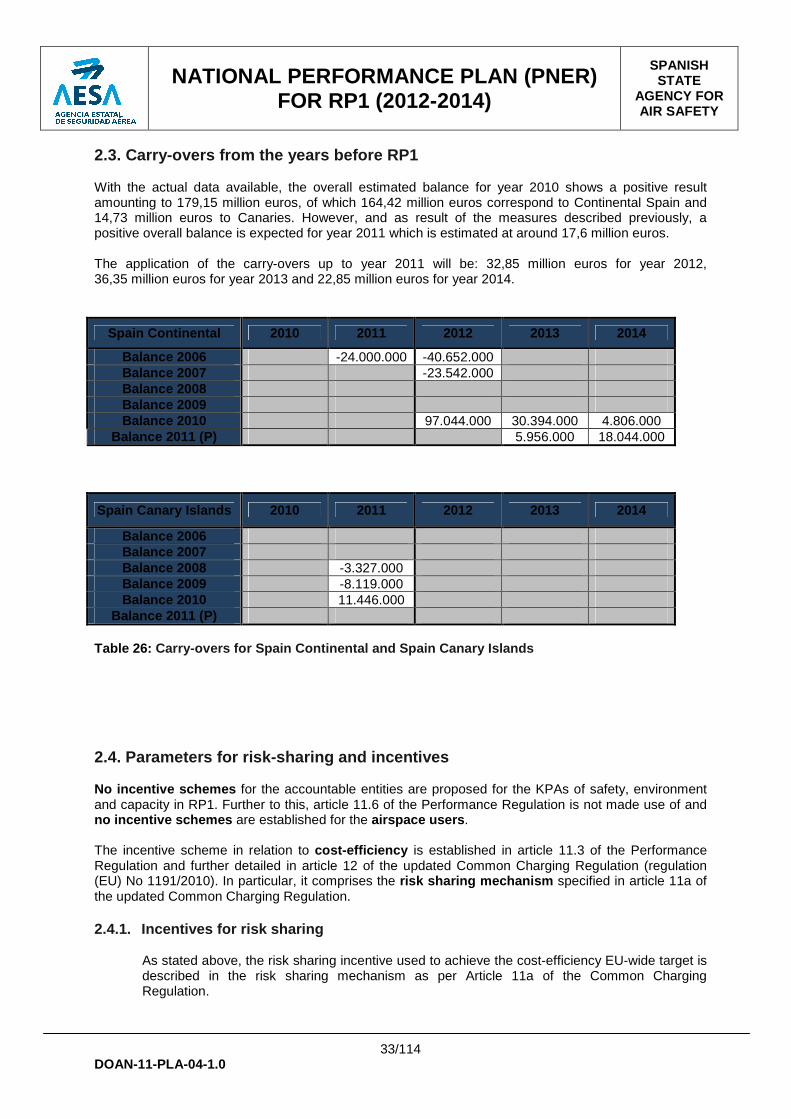
2.3. Carry-overs from the years before RP1 With the actual data available, the overall estimated balance for year 2010 shows a positive result amounting to 179,15 million euros, of which 164,42 million euros correspond to Continental Spain and 14,73 million euros to Canaries. However, and as result of the measures described previously, a positive overall balance is expected for year 2011 which is estimated at around 17,6 million euros. The application of the carry-overs up to year 2011 will be: 32,85 million euros for year 2012, 36,35 million euros for year 2013 and 22,85 million euros for year 2014.
Spain Continental 2010 2011 2012 2013 2014
Balance 2006 -24.000.000 -40.652.000 Balance 2007 -23.542.000 Balance 2008 Balance 2009 Balance 2010 97.044.000 30.394.000 4.806.000
Balance 2011 (P) 5.956.000 18.044.000
Spain Canary Islands 2010 2011 2012 2013 2014
Balance 2006 Balance 2007 Balance 2008 -3.327.000 Balance 2009 -8.119.000 Balance 2010 11.446.000
Balance 2011 (P) Table 26: Carry-overs for Spain Continental and Spain Canary Islands 2.4. Parameters for risk-sharing and incentives No incentive schemes for the accountable entities are proposed for the KPAs of safety, environment and capacity in RP1. Further to this, article 11.6 of the Performance Regulation is not made use of and no incentive schemes are established for the airspace users . The incentive scheme in relation to cost-efficiency is established in article 11.3 of the Performance Regulation and further detailed in article 12 of the updated Common Charging Regulation (regulation (EU) No 1191/2010). In particular, it comprises the risk sharing mechanism specified in article 11a of the updated Common Charging Regulation. 2.4.1. Incentives for risk sharing
As stated above, the risk sharing incentive used to achieve the cost-efficiency EU-wide target is described in the risk sharing mechanism as per Article 11a of the Common Charging Regulation.

NATIONAL PERFORMANCE PLAN (PNER) FOR RP1 (2012-2014)
SPANISH STATE
AGENCY FOR AIR SAFETY
34/114
DOAN-11-PLA-04-1.0
2.4.1.1. Traffic risk sharing scope and parameters As far as the traffic risk sharing is concerned, as per article 2 (Transitional provisions) of Regulation (EU) No 1191/2010, given that a specific law is in place in Spain that targets reductions in the unit rate, an exemption from Article 11a (3) of Regulation (EC) 1794/2006 10 could be considered for Aena . On the basis of the Article 11a of the Common Charging Scheme Regulation, the following ANSP(s) are exempted from traffic risk sharing : AEMET and EA-ANSP . The parameters for risk-sharing are: Regulation states that there are minimum and maximum sharing limits when the actual SUs exceed or are lower than the forecasts. - The percentage of additional revenue to be returned to the airspace users is when the
actual service units exceed the forecast by more than 2%, as defined in Article 11a.1(c) of the Common Charging Scheme Regulation is: 70%; and
- The percentage of loss of revenue to be borne by airspace users when the actual service
units is lower than the forecast by more than 2%, as defined in Article 11a.1(d) of the Common Charging Scheme Regulation is: 70%.
2.4.1.2. Cost risk sharing scope and parameters
It has to be highlighted that the costs data considered in this document do not take into account all the amounts related to the full process of liberalization of the aerodrome ATC service, but only those with regard to the first batch currently on-going (13 control towers). The mentioned possible economic effects associated to this new process of liberalization will need to be considered as non controllable costs .
10 Regulation (EU) No 1191/2010 Article 2 Transitional provisions “Those Member States with national regulations which existed prior to 8 July 2010 that establish a reduction on the unit rate beyond the Union-wide targets established in accordance with Regulation (EU) No 691/2010 may exempt their air navigation service providers from Article 11a (3) of Regulation (EC) No 1794/2006. That exemption shall apply for the period where the national regulations reduce the unit rate, but shall not extend beyond the end of the first reference period in 2014. Member States shall inform the Commission and Eurocontrol of such exemptions.” Regulation (EC) No 1794/2006 Article 11a (3) Where, over a given year, the actual number of service units does not exceed or fall below the forecast established at the beginning of the reference period by more than 2 %, the additional revenue or loss in revenue of the air navigation service provider with regard to determined costs shall not be carried over.
NATIONAL PERFORMANCE PLAN (PNER) FOR RP1 (2012-2014)
SPANISH STATE
AGENCY FOR AIR SAFETY
35/114
DOAN-11-PLA-04-1.0
3. CONTRIBUTION OF EACH ACCOUNTABLE ENTITY As already stated in section 1, the accountable entities covered by this performance plan grouped by stakeholder nature are the following: A) Service Providers
- Aena S.A. (Aena), air navigation service provider certified and designated for (en route) ATS provision;
- Agencia Estatal de Meteorología (AEMET), (air navigation) service provider certified and designated for aeronautical meteorological (MET) services;
- Ejército del Aire (EA-ANSP), non certified air navigation service provider which contributes to (en route) ATS provision to the GAT;
B) NSAs - Agencia Estatal de Seguridad Aérea (AESA), Spanish Civil NSA except for MET services,
within the Ministerio de Fomento (Ministry of Transportation); - Secretaría de Estado para el Cambio Climático (SECC or ANS-MET), Spanish NSA for MET
services, within the Ministerio de Medio Ambiente y Medio Rural y Marino (Ministry of Environment)
- Segundo Jefe del Estado Mayor (SEJEMA or EA-NSA), Spanish Military NSA, within the Ministerio de Defensa (Ministry of Defence).
C) Governmental Body - Dirección General de Aviación Civil (DGAC), within the Ministerio de Fomento;
NOTE: included for completeness’ sake but with marginal contribution to targets 3.1. Aena 3.1.1. Share in the national targets and individual binding performance targets
3.1.1.1. Capacity
Aena will be the only entity accountable for meeting the capacity target.
3.1.1.2. Cost-efficiency Determined en route ANS costs Details of Aena’s determined en route costs are provided in the Reporting Tables included in Annex A of this document. 2010 en route costs show a decrease above 17% (around 135 million Euros) compared with 2009 en route costs. The reduction in costs results mainly from a lower staff cost of around 25% together with an 8% reduction in other operating costs. The cost of capital has been calculated with a WACC of 4,96%. Compared with November 2010 data submission, the 2010 figures show a reduction of 3,6%, with similar percentages for the main cost categories, and a reduction exceeding 16% when compared with November 2009 data.

NATIONAL PERFORMANCE PLAN (PNER) FOR RP1 (2012-2014)
SPANISH STATE
AGENCY FOR AIR SAFETY
36/114
DOAN-11-PLA-04-1.0
The category of exceptional costs includes the amount derived from the impact of the adaptation to the International Accounting Standards (IAS). As reported in previous submissions, the IAS impact has been allocated to the cost bases in 15 years, from year 2008. In 2010, after the new agreement with ATC staff and the actuarial assessment, an excess in the provision has been estimated (42 million €) and therefore the annual pending amounts have been reduced for 2010 and the remaining years. Total 2011 en route costs are slightly higher, around 1,5%, compared to 2010. With regard to the concepts of personal and operating expenses, the amounts are lower than those of 2010, while some increases are estimated in depreciation and cost of capital. The WACC used to calculate the cost of capital is 5,49%, and the increase compared to 2010 is mainly due to the estimated increase in the weight of the average equity in the funding structure. Compared to the last estimate available (November 2010 data submission), the new data show a reduction of 2,3%. The decrease in staff costs, around -4% (17 €million), can be highlighted, while the rest of changes in data more or less compensate one another. As already mentioned, in April 2010 the Spanish Government approved, with immediate application and effects, Law 9/2010 containing measures of great significance for the achievement of the targets adopted by Aena related to costs reduction and charges, as well as productivity and management improvements. The main issues addressed by the law relate to the determination of ATCOs’ contractual working hours as well as ATCOs’ overtime hours, with a view to achieve a better adjustment to demand and significantly reduce ATCOs’ employment costs and increase their productivity. In February 2011 the arbitration with regard to the negotiation of the Second ATCOs Collective Labor Agreement was finally resolved establishing the labor conditions of this collective for a period of three years (until 2013). With regard to determined costs for years 2012 to 2014, first of all, it has to be pointed out that the changes started in 2010 relating to the liberalization of aerodrome control service and the new organizational model in Aena (with the creation in February, 25th and effective entry into service in June, 8th of Aena Aeropuertos SA as the airport operator) that has just started in the first months of 2011, add significant complexity to the planning process which has to support and strengthen the fulfilling of the objectives minimizing the risk to the organization. Therefore, the data include the estimated impact of the reorganization process and the liberalization of aerodrome control service. It has to be highlighted that the costs data considered in this document do not take into account all the amounts related to the full process of liberalization of the aerodrome ATC service, but only those with regard to the first batch currently on-going (13 control towers). The mentioned possible economic effects associated to this new process of liberalization will need to be considered as non controllable costs. The evolution of en route costs in the first reference period (RP1) present moderate annual variations which, in average, slightly exceed 2,5%. Operating costs The figures correspond to the latest Air Navigation Long Term Plan, which includes the implementation of an austerity policy, the amount in 2014 being similar to 2010.
NATIONAL PERFORMANCE PLAN (PNER) FOR RP1 (2012-2014)
SPANISH STATE
AGENCY FOR AIR SAFETY
37/114
DOAN-11-PLA-04-1.0
Staff Costs Concerning the ATC staff, the data respond to the estimates derived from the measures taken by the Government through the Law 9/2010 and the new Collective Labor agreement with effects until year 2013. The evolution takes into account the liberalization of aerodrome control service in 13 control towers, initiated in 2011. It must be emphasized that the data do not contain elements relating to other possible processes of liberalization that the State/Government could decide in the future and will need to be considered as non controllable costs. For the rest of personnel, the figures respond to the planned staff evolution and the adoption of the present collective agreement considering the minimum approved wage increases for the Public Sector. The overall increase between 2014 and 2010 is only 4% in nominal terms. Depreciation Costs The forecasts reflect the expected assets evolution, as well as the future Investment Plan that considers the effects of the new organizational model. The regular practice is the implementation of measures on costs containment and the prioritization of investments through the analysis and selection of projects. Cost of Capital The figures respond to the assets and middle and long term funding forecasts. The WACC applied trough the period is around 7,8%. The higher average rate is caused by the increased risk derived from the change to a system of risk sharing (business risk) but also from the increase in the 10-year bonds, currently around 5,3% (country risk, financial risk). It is very important to highlight that from 2008, and due to the process of adaptation to the IAS, the recognition of the global amounts related to the pending adjustment mechanisms as contingent assets and its disappearance from the Balance sheet implied that no cost of capital has been applied to those amounts. The funding structure is expected to evolve from a proportion equity/debt of 29/71 in 2010 to a growing weight of equity. To establish the return on equity (ROE) Aena uses the CAPM (Capital Asset Pricing Model) and the economic theory generally recommended by experts, consultants and the most highly regarded business schools. In this model, government bonds are used as a point of reference in the calculations.

NATIONAL PERFORMANCE PLAN (PNER) FOR RP1 (2012-2014)
SPANISH STATE
AGENCY FOR AIR SAFETY
38/114
DOAN-11-PLA-04-1.0
The risk assessment carried out considers the increased risk derived from the change to a system of risk sharing as well as the process of aerodrome control service liberalization initiated in 2010 (business risk) but also from the increase in the 10-year bonds, currently around 5,3% (country risk, financial risk).
• The risk-free rate for the period 2010-2014 considered is 5%, close to the mentioned 10-year bonds.
• The market risk premium is 4,21% throughout the period, the same as in Law 1/2011, a regulation that describes a CAPM process applicable to airport charges.
Factors of possible business and financial risks considered:
• risks arising from market pressures on the bond rates (country risk, financial risk); • risk due to the change to a system of risk sharing; • risks derived from the process of aerodrome control service liberalization; • high operational risks (for example, the consequences of faults are catastrophic); • high operating leverage, with a high proportion of fixed costs; • intensive business in human resources, with a high profile in terms of claims; • high demands on safety requirements; and • operating risks derived from decreases in air traffic.
Concerning the comparison with the long term State bond rate, the 10-year bonds, considering monthly evolution (Banco de España data) evolved from 3.8% in December 2009 to 5,25% in March 2011. As mentioned in previous sections, the risk-free rate considered for the period 2010-2014 considered is 5%, close to the mentioned 10-year bonds and additional risk premium was based on business and financial risks analysis. With regard to the return on equity for en route and terminal for years 2010 and 2011, different rates are established based on different estimated risks. However, the introduction of the performance scheme in application of SES second package involves a reassessment of the risks and the consideration of the same average rate in both en route and terminal costs (7,8% in the period 2012 - 2014). Investments Major investments will be undertaken in order to achieve the performance targets. A qualitative description of their relevance in relation with the European ATM Master Plan and their coherence with the main areas and directions of progress and change is set out below. Aena’s investments plan is aligned with its strategic programmes and projects and foresees a total investment of around 486 million Euros in RP1.
Aena 2010 2011 2012 2013 2014
Annual investments (M€) 159 160 162 162 162
Table 27: Aena’s planned annual investments
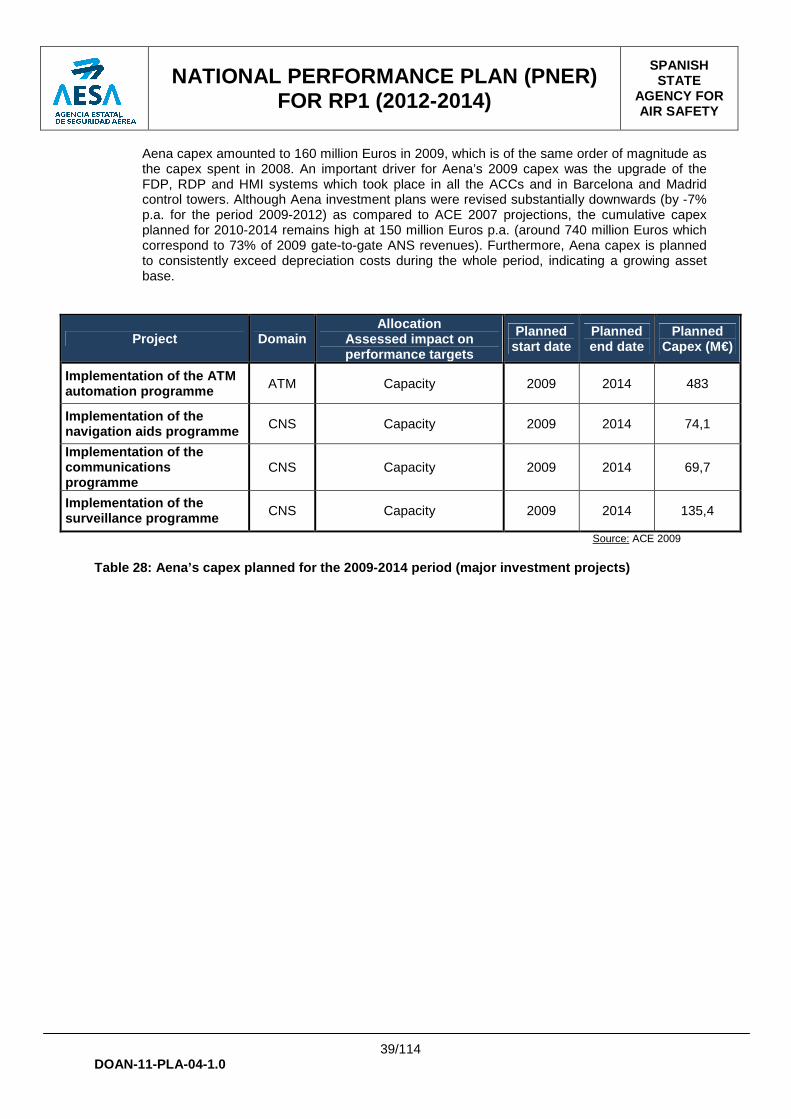
NATIONAL PERFORMANCE PLAN (PNER) FOR RP1 (2012-2014)
SPANISH STATE
AGENCY FOR AIR SAFETY
39/114
DOAN-11-PLA-04-1.0
Aena capex amounted to 160 million Euros in 2009, which is of the same order of magnitude as the capex spent in 2008. An important driver for Aena’s 2009 capex was the upgrade of the FDP, RDP and HMI systems which took place in all the ACCs and in Barcelona and Madrid control towers. Although Aena investment plans were revised substantially downwards (by -7% p.a. for the period 2009-2012) as compared to ACE 2007 projections, the cumulative capex planned for 2010-2014 remains high at 150 million Euros p.a. (around 740 million Euros which correspond to 73% of 2009 gate-to-gate ANS revenues). Furthermore, Aena capex is planned to consistently exceed depreciation costs during the whole period, indicating a growing asset base.
Project Domain Allocation
Assessed impact on performance targets
Planned start date
Planned end date
Planned Capex (M€)
Implementation of the ATM automation programme ATM Capacity 2009 2014 483
Implementation of the navigation aids programme CNS Capacity 2009 2014 74,1
Implementation of the communications programme
CNS Capacity 2009 2014 69,7
Implementation of the surveillance programme CNS Capacity 2009 2014 135,4
Source: ACE 2009 Table 28: Aena’s capex planned for the 2009-2014 pe riod (major investment projects)

NATIONAL PERFORMANCE PLAN (PNER) FOR RP1 (2012-2014)
SPANISH STATE
AGENCY FOR AIR SAFETY
40/114
DOAN-11-PLA-04-1.0
Aena’s Business Plan describes the strategic ATM/CNS projects developed and deployed by the organization with the aim of keeping its air navigation system in constant evolution. These projects are aligned with the main areas of the SESAR Operational Concept, such as SWIM, trajectory management, use of satellite applications in the scope of communications and surveillance, ATC systems interoperability, data link services (DLS) and new modes of dependent cooperative surveillance (ADS).
Working areas Strategic projects Airspace management optimization
Route network optimization Sectors dynamic and flexible management PRNAV – Introduction of precision navigation in terminal areas FUA – Civil-military coordination management of reserved airspace CDA – Continuous descendent approach procedures PBN – Performance based navigation implementation GBAS – GBAS based approach procedures
Integration of the airport node in the ATM net
CDM – Collaborative decision processes in airports Runway usage optimization DMAN – Departure managers implementation A-SMGCS – Improvement of surface movements management
Evolution of CNS infrastructures Implementation of services based on data link (DLS) Reduction of voice communications bandwidth to 8.33 kHz Evolution of REDAN Air navigation aids Evolution of voice communication system with VoIP Evolution of en route, TMA and airports surveillance system
Evolution of automated ATC system
Evolution of flight plans processing system (FPS) Evolution of ATM information system Evolution of ATC strategic planning aids Evolution of ATC tactical management aids Safety nets Evolution of controller working position
Integrated aeronautical information management
Improvement of the information management and exchange services Interconnection of ANSPs networks through PENS
Table 29: Aena’s ATM/CNS strategic projects structu re During RP1 a strong evolution of the management model of Aena will take place, once the new organizational structure which separates the management of Airports and Air Navigation and liberalizes the provision of ATS in aerodromes established through 2011. In this context, the organization of the strategic projects will be adapted and some impact can be foreseen.

NATIONAL PERFORMANCE PLAN (PNER) FOR RP1 (2012-2014)
SPANISH STATE
AGENCY FOR AIR SAFETY
41/114
DOAN-11-PLA-04-1.0
The following table shows the main ATM/CNS projects that will be deployed during RP1 in terms of investments, along with their estimated contribution to Aena’s performance targets, to the operational improvements as set out within European ATM Master Plan and to the ESSIP objectives.
Project Domain Allocation
Assessed impact on
performance targets
Planned start date
Planned end date
European ATM Master
Plan IR/CS ref.
Air Navigation Aids CNS All Cost-
efficiency 2010 2015 AO-0503 AO-0504 NAV06
N/A
iTEC ATM All Capacity 2011 2015
DCB-0302 IS-0101 IS-0102
AUO-0201 FCM03
Procedures for flight plans in the pre-flight phase
(Regs. 1033/2006 and 929/2010)
VoIP CNS All Cost-
efficiency 2010 2015 COMd3
Required communication performance
Evolution of REDAN
CNS All Flexibility 2010 2015 COM09 COM10
FMTP (Reg. 633/2007) Data Link
Services (Reg. 29/2009)
Coordination and transfer (Reg.
30/2009) Evolution of en route and TMA
surveillance system
CNS All Safety 2010 2014
SUR02 SUR04 SUR05 SURd1
Surveillance Performance and
Interoperability (SPI)
Evolution of controller working
position ATM All Productivity 2011 2015 N/A N/A
Table 30: Aena’s main investments in ATM/CNS strate gic deployment projects during RP1
Contribution of these projects to the accomplishment of Aena’s strategic performance targets has been qualitatively evaluated and a internal performance scheme is being developed in order to support the monitoring process of their implementation.

NATIONAL PERFORMANCE PLAN (PNER) FOR RP1 (2012-2014)
SPANISH STATE
AGENCY FOR AIR SAFETY
42/114
DOAN-11-PLA-04-1.0
In particular, the strategic ATM/CNS projects considered within the Air Navigation Business Plan which are detailed in the figure below cover the 29 Operational Improvements selected from the ATM Master Plan which are recognised by the Single Sky Committee as the critical for IP1.
Figure 4: IP1 OIs covered by Aena’s strategic proje cts
3.1.2. Incentive mechanisms to be applied on Aena t o encourage the targets being met over RP1
No incentive mechanisms will be applied to Aena in relation to safety and environment as no targets have been established for neither of these key performance areas. As for the key performance area of capacity, no specific incentives will be applied. In the key performance area of cost-efficiency, the incentive mechanism applied to Aena will be the one defined in the updated Common Charging Regulation and described in section 2.4.1. . No additional incentive scheme will be proposed for this area. No additional incentive scheme will be proposed for Aena.

NATIONAL PERFORMANCE PLAN (PNER) FOR RP1 (2012-2014)
SPANISH STATE
AGENCY FOR AIR SAFETY
43/114
DOAN-11-PLA-04-1.0
3.2. AEMET 3.2.1. Share in the national targets and individual binding performance targets
In spite of the Spanish Government having approved some measures for the cost reduction that imply the reduction of meteorological costs, this cost reduction has had no effect in 2010 aeronautical service cost due to: - The increase of the personnel working at the airport offices in order to get the staff
demanded by the Single European Sky Requirements; - The putting in operation of new airports or the actions on existing airports imply that the
operating costs and investments have increased (Asturias, Málaga, Barajas, Pamplona, Tenerife Norte, Tenerife Sur);
- The maintenance cost of the aeronautical stations; and - The investment on satellites.
In 2011 a general decrease in AEMET global budget is foreseen, except regarding the investment for the METEOSAT Third Generation Program, for which an increase of 55% is foreseen. However it is not expected that this decrease affects the aeronautical cost once again, as the fulfilment of the commitments of the Single European Sky implies that the investments, operation and staff costs cannot be reduced: - Staff cost - Operative cost and investments:
• Improvement in the office of the airports of Alicante and La Palma; • Supply of new equipment in Córdoba, La Palma and Logroño; and • Adaptation of equipment and bases in Gran Canaria, Melilla, Menorca, Pamplona,
Santiago and Tenerife Norte. In RP1, the main variations having a significant impact on the overall costs are: - Staff cost - Operative cost and investments
• Improvement in the office of the airports of Almería and Vigo; • Supply of new equipment in Ibiza, Menorca and Zaragoza; • Adaptation of equipment and bases in La Palma, Pamplona and Valencia; and • Evolution in the infrastructures of spatial observation.
Staff Costs The staff cost (en route costs) has increased a 3% in 2010 in relation to 2009 due to the increase of the personal working at the airport offices in order to get the staff demanded by the Single European Sky Requirements. In 2011 and 2012 an increase of 4% is estimated because of the planned incorporation of new personal for aeronautical services for the same reason. In 2013 and 2104 a light increase of 2% is envisaged. Operating costs The operating cost has suffered a big increased in 2010 as compared to 2009. This rise is due to the new maintenance contract of meteorological aeronautical stations, which has supposed more than 2 millions of Euros. From this year onwards a stabilization of the cost with an increase between the 1 and 2% is expected.

NATIONAL PERFORMANCE PLAN (PNER) FOR RP1 (2012-2014)
SPANISH STATE
AGENCY FOR AIR SAFETY
44/114
DOAN-11-PLA-04-1.0
Depreciation costs The depreciation cost has increased in 2010 as compared to 2009 due to the fact that the investment affecting the aeronautic service has increased more than expected. From 2010 onwards a light increase is expected according to the investment. Capital costs The interest rate applied to the cost of capital is expected to rise from 4% in 2011 to 4,5% in 2014 due to the trend of the slight increase in the interest of the money.
The proportion of fixed assets net book value (NBV) which relates to assets in operation is 0,84 in 2010 and 0,87 is foreseen for the rest of the years.
2009(A) 2010(F) 2011(p) 2012(p) 2013(p) 2014(p)
23.769 23.113 34.941 35.420 37.548 40.946
-16% -3% 51% 1% 6% 9%
Table 31: AEMET’s investment expenditure (total amo unt in ‘000 Euros)
2009(A) 2010(F) 2011(p) 2012(p) 2013(p) 2014(p)
7.286 8.371 10.727 10.968 11.012 12.238
-13% 15% 28% 2% 0% 11%
Table 32: AEMET’s investment expenditure (en route in ‘000 Euros) In spite of the general decrease in the overall investment, the investment in aeronautical service has increased due to the commitment acquired with the plans of action of Aena. The increase in the year 2011 is due to the above mentioned investment on satellites. Only the amount pending for repayment has been taking into account for each asset. The interest rate applied to the cost of capital is the legal rate published by the Government.
3.2.2. Incentive mechanisms to be applied on AEMET to encourage the targets being met over RP1
The only incentive mechanism applied to AEMET will be the one related to the key performance area of cost-efficiency, i.e. the incentive mechanism defined in the updated Common Charging Regulation and described in section 2.4.1. . No additional incentive scheme will be proposed for AEMET.

NATIONAL PERFORMANCE PLAN (PNER) FOR RP1 (2012-2014)
SPANISH STATE
AGENCY FOR AIR SAFETY
45/114
DOAN-11-PLA-04-1.0
3.3. EA-ANSP & EA-NSA 3.3.1. Share in the national targets and individual binding performance targets
Determined en route ANS costs Due to the results of the Compliance Review exposed by Eurocontrol in December 2008, which requested more detailed information of the figures, the Spanish Air Force has done a great effort to review its en-route cost model integrated in the analytical cost accounting model of the Spanish Air Force. The figures presented in May 2011, are the result of this new model, which has the following points to be highlighted: • The cost drivers agreed to by consensus in 2004 with the Ministry of Transport and AENA,
have been revised and developed in much greater detail to reflect the real effort made by the Spanish Air Force for Civil Aviation. Costs per service and FIR have undergone a considerable variation.
• In addition other costs susceptible to be charged, which were not included in the previous model, are incorporated. These new costs, focus on expanding the calculation of capital cost of all services and incorporating in 2010 formation costs and in 2011 employers’ contributions to social security.
On the other hand, the costs submitted in November 2010, present the following characteristics: • They are not incurred costs, because they present a reduction in 2009 (Charged costs:
31.426.450,00 € ; Incurred costs: 33,548,642.89 € ) in order to reach the en-route unit rate target of Spain.
• For the year 2010 onwards, The Spanish Air Force forecasted the costs based on the reduced figures of 2009.
• In the development of costs to be presented in May 2011, the Ministry of Transport, has confirmed that the rest of Spanish accountable entities charged the 100% of the incurred cost, adjusting a possible deduction in the item “Incomes from other sources”.
Due to all abovementioned, to analyze the cost variations, it has to be done with incurred costs. As a result of such analysis following results are obtained: • In 2010, the Spanish Air Force costs increase 2,1 % in real terms, with respect to 2009
figures. (If the new cost concepts are discounted, there is a decrease of 1,7%). • In 2011, the Spanish Air Force costs increase 2,2 % in real terms, with respect to 2010
figures. (If the new cost concepts are discounted, there is an increase of 0,8% caused by the investments for modernization of the fleet for SAR).
• For the period 2012-2014, the Spanish Air Force presents an annual reduction in real terms of 0,9%.
Annual variations from 2009 to 2014 for Spain Continental and Canary Islands are as follows:
2009 2010 2011 2012 2013 2014
31,4 34,5 36,3 36,9 37,4 37,9
9,83% 5,31% 1,46% 1,41% 1,35%
Table 33: Total Spanish en route costs (in M€) and annual variation

NATIONAL PERFORMANCE PLAN (PNER) FOR RP1 (2012-2014)
SPANISH STATE
AGENCY FOR AIR SAFETY
46/114
DOAN-11-PLA-04-1.0
In 2010, the cost increase is due to the following reasons: � Full costs of Search and Rescue (SAR) are charged. � Investment is made and maintenance contracts are executed to extend the life of the
current fleet of SAR. � Training of pilots and air traffic controllers is incorporated. � Capital costs are included for all services in contrast with previous years, in which only
Surveillance and ATM services costs were allocated. In 2011 the cost increase is caused by the new investments (mainly in SAR), the inflation and the incorporation of employers’ contributions to social security. From 2012 onwards the cost increase is due to the inflation. Staff costs Includes staff salaries and specific training of pilots and air traffic controllers. From the year 2011 onwards employers’ contributions to social security are incorporated. Other operating costs Includes maintenance costs and contracts. Depreciation Consists on equipments and spare parts acquisition depreciation in the services. Cost of capital Description of elements of the cost of capital for en route, including: � Average asset base (lines 3.1 to 3.4 of RT1): � Fixed assets variation:
2010 2011 2012 2013 2014
-4,15% -5,95% -6,74% -7,61% Table 34: Fixed assets annual variation As investment decreases in the first reference period compared to previous years, the net book value decreases. No asset adjustments have been made. The Spanish Air Force, being part of the Spanish Public Administration, does not consider current assets. Interest rate applied to the cost of capital (lines 3.5 to 3.7 of the RT1): The Spanish Air Force, being part of the Spanish Public Administration, does not consider: � Debt, and therefore interest on debts is not considered either. � Current assets. Due to this, it is confirmed that: � Average interest on debts has null value every year. � The asset base is the estimate net book value of the capital employed. � Cost of capital before tax is equal to return on equity � The EA uses as return on equity, the long-term interest rate published by the European
Central Bank for Spain.
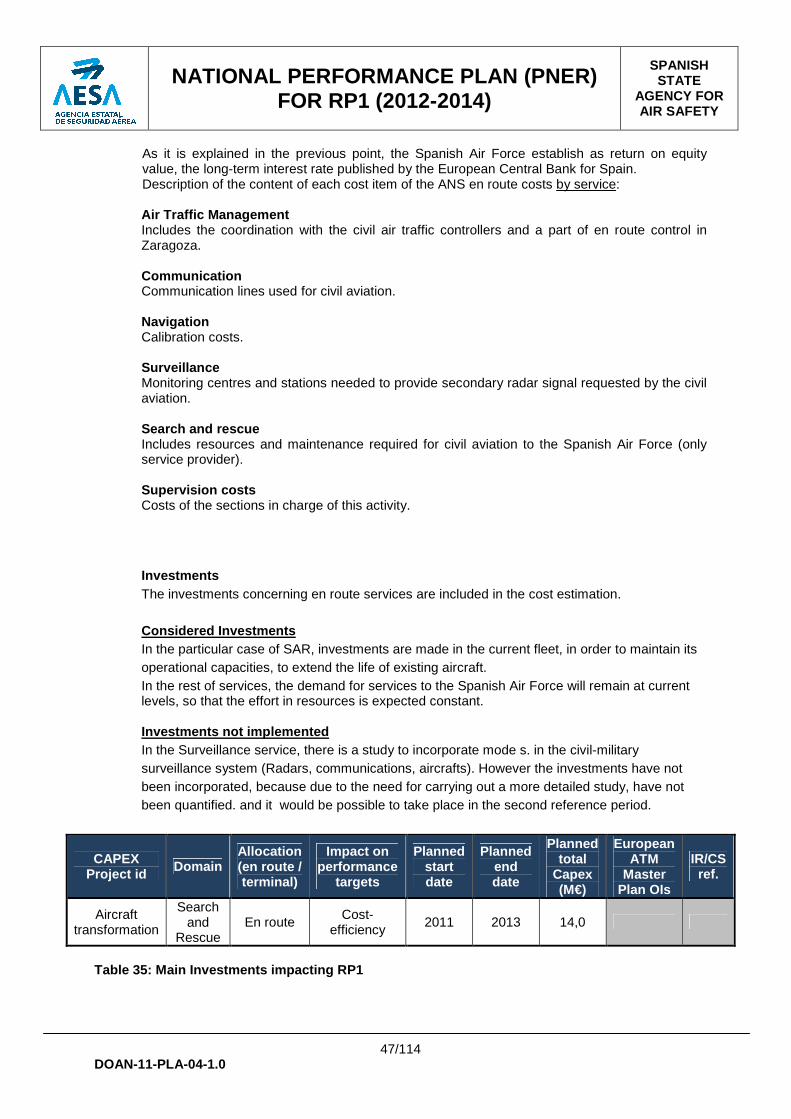
NATIONAL PERFORMANCE PLAN (PNER) FOR RP1 (2012-2014)
SPANISH STATE
AGENCY FOR AIR SAFETY
47/114
DOAN-11-PLA-04-1.0
As it is explained in the previous point, the Spanish Air Force establish as return on equity value, the long-term interest rate published by the European Central Bank for Spain. Description of the content of each cost item of the ANS en route costs by service: Air Traffic Management Includes the coordination with the civil air traffic controllers and a part of en route control in Zaragoza. Communication Communication lines used for civil aviation. Navigation Calibration costs. Surveillance Monitoring centres and stations needed to provide secondary radar signal requested by the civil aviation. Search and rescue Includes resources and maintenance required for civil aviation to the Spanish Air Force (only service provider). Supervision costs Costs of the sections in charge of this activity. Investments The investments concerning en route services are included in the cost estimation. Considered Investments In the particular case of SAR, investments are made in the current fleet, in order to maintain its operational capacities, to extend the life of existing aircraft. In the rest of services, the demand for services to the Spanish Air Force will remain at current levels, so that the effort in resources is expected constant. Investments not implemented In the Surveillance service, there is a study to incorporate mode s. in the civil-military surveillance system (Radars, communications, aircrafts). However the investments have not been incorporated, because due to the need for carrying out a more detailed study, have not been quantified. and it would be possible to take place in the second reference period.
CAPEX Project id Domain
Allocation (en route / terminal)
Impact on performance
targets
Planned start date
Planned end date
Planned total
Capex (M€)
European ATM
Master Plan OIs
IR/CS ref.
Aircraft transformation
Search and
Rescue En route
Cost-efficiency
2011 2013 14,0
Table 35: Main Investments impacting RP1

NATIONAL PERFORMANCE PLAN (PNER) FOR RP1 (2012-2014)
SPANISH STATE
AGENCY FOR AIR SAFETY
48/114
DOAN-11-PLA-04-1.0
ANSP Investments 2009A 2010 2011 2012 2013 2014 2015 2016 EA-
ANSP Aircraft
transformation 11,5 2,5
Table 36: Annual investments (in M€) 3.3.2. Incentive mechanisms to be applied on EA-ANS P to encourage the targets being met over RP1
The only incentive mechanism applied to EA-ANSP will be the one related to the key performance area of cost-efficiency, i.e. the incentive mechanism defined in the updated Common Charging Regulation and described in section 2.4.1. . These costs will not be subject to the traffic risk sharing though, as EA-ANSP is a provider of air navigation services with permission to provide air navigation services without certification and falls within the exemption allowed for in article 11a.2 of the updated Common Charging Regulation. No additional incentive scheme will be proposed for EA-ANSP.
3.4. ANSMET 3.4.1. Share in the national targets and individual binding performance targets
Determined en route ANS costs Details of ANSMET determined en route costs are provided in the Reporting Tables included in Annex A of this document. Staff cost The actual staff costs have decreased in 2010 both with respect to the actual costs in 2009 and to the planned figures for 2010, for external reasons: a 2010 mid-year salaries reduction for the whole Civil Service following the economic crisis in Spain, This reduction is foreseen to be continued by a small decrease in 2011 and by an stable situation for the rest of the reference period. The main cost-containment measure implemented is to keep the actual permanent staff numbers frozen for the whole reference period in spite of the increases foreseen in the NSA responsibilities. Operation cost The actual operating costs have decreased in 2010 both with respect to the actual costs in 2009 and to the planned figures for 2010 due to efficiency adjustments in the external services contracted. In 2011 a dramatic reduction in the costs of external services is planned, due to mandatory cost-containment measures for the public expenditures. This reduction is foreseen to be maintained for the rest of the reference period, with zero nominal growth in the external services budget and with the foreseen workload increases being absorbed by productivity increases.
NATIONAL PERFORMANCE PLAN (PNER) FOR RP1 (2012-2014)
SPANISH STATE
AGENCY FOR AIR SAFETY
49/114
DOAN-11-PLA-04-1.0
Depreciation cost No significant changes. Capital cost Not applicable.
3.4.2. Incentive mechanisms to be applied on ANSMET to encourage the targets being met over RP1
The only incentive mechanism applied to ANSMET will be the one related to the key performance area of cost-efficiency, i.e. the incentive mechanism defined in the updated Common Charging Regulation and described in section 2.4.1. . These costs will not be subject to the traffic risk sharing. No additional incentive scheme will be proposed for ANSMET.
3.5. AESA 3.5.1. Share in the national targets and individual binding performance targets
Determined en route ANS costs Details of AESA determined en route costs are provided in the Reporting Tables included in Annex A of this document. Determined costs have been reduced from 2009 and are expected to remain constant for 2011. From 2012 onwards there will be a slight increase of around 1,1% in total costs due to an increased level of operating costs. Staff Costs Staff costs are expected to remain constant during RP1 and the initial years of RP2. This is a result of the cost containment measures already put in place.

NATIONAL PERFORMANCE PLAN (PNER) FOR RP1 (2012-2014)
SPANISH STATE
AGENCY FOR AIR SAFETY
50/114
DOAN-11-PLA-04-1.0
Operating costs Operating costs have been reduced in 2009 and 2010. However this trend will not continue from 2012 onwards, experiencing an increase of 2%. Depreciation Depreciation costs are expected to remain stable, showing no significant alterations. Cost of capital Even though interest rates are expected to increase in Spain, it is believed that the cost containment measures in AESA will balance this trend resulting in a stabilization of the cost of capital.
3.5.2. Incentive mechanisms to be applied on AESA t o encourage the targets being met over RP1
The only incentive mechanism applied to AESA will be the one related to the key performance area of cost-efficiency, i.e. the incentive mechanism defined in the updated Common Charging Regulation and described in section 2.4.1. . These costs will not be subject to the traffic risk sharing. No additional incentive scheme will be proposed for AESA.
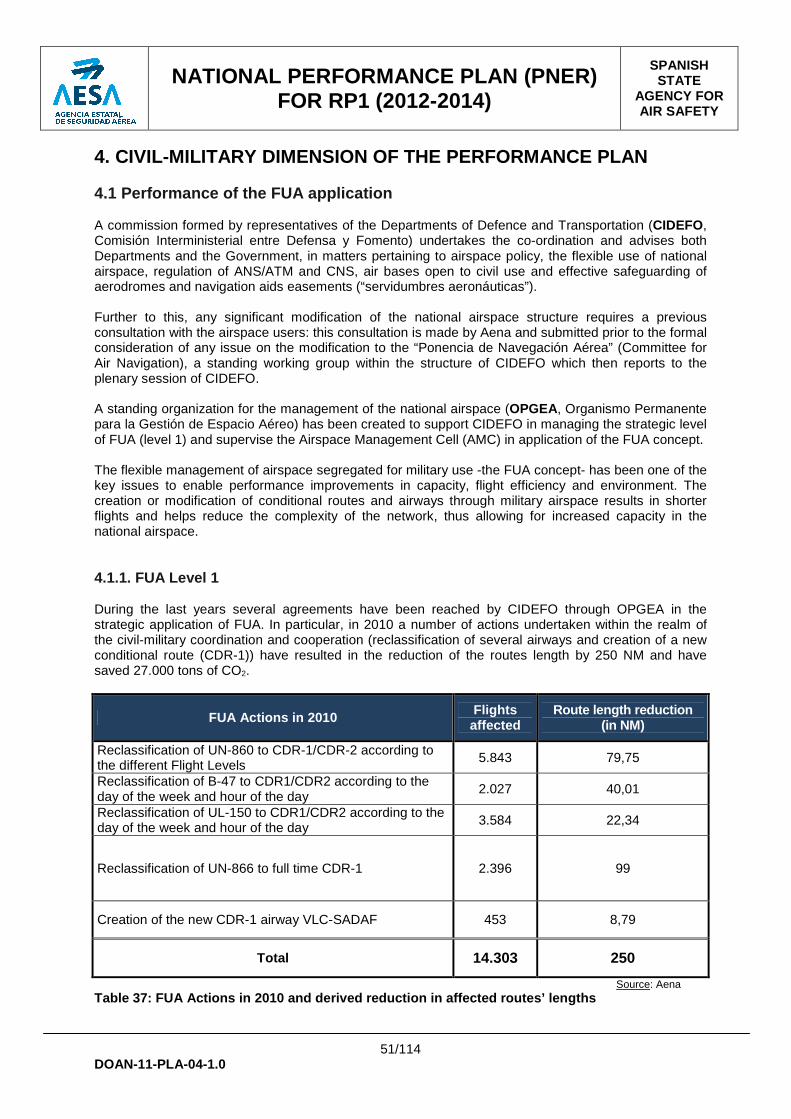
NATIONAL PERFORMANCE PLAN (PNER) FOR RP1 (2012-2014)
SPANISH STATE
AGENCY FOR AIR SAFETY
51/114
DOAN-11-PLA-04-1.0
4. CIVIL-MILITARY DIMENSION OF THE PERFORMANCE PLAN 4.1 Performance of the FUA application A commission formed by representatives of the Departments of Defence and Transportation (CIDEFO, Comisión Interministerial entre Defensa y Fomento) undertakes the co-ordination and advises both Departments and the Government, in matters pertaining to airspace policy, the flexible use of national airspace, regulation of ANS/ATM and CNS, air bases open to civil use and effective safeguarding of aerodromes and navigation aids easements (“servidumbres aeronáuticas”). Further to this, any significant modification of the national airspace structure requires a previous consultation with the airspace users: this consultation is made by Aena and submitted prior to the formal consideration of any issue on the modification to the “Ponencia de Navegación Aérea” (Committee for Air Navigation), a standing working group within the structure of CIDEFO which then reports to the plenary session of CIDEFO. A standing organization for the management of the national airspace (OPGEA, Organismo Permanente para la Gestión de Espacio Aéreo) has been created to support CIDEFO in managing the strategic level of FUA (level 1) and supervise the Airspace Management Cell (AMC) in application of the FUA concept. The flexible management of airspace segregated for military use -the FUA concept- has been one of the key issues to enable performance improvements in capacity, flight efficiency and environment. The creation or modification of conditional routes and airways through military airspace results in shorter flights and helps reduce the complexity of the network, thus allowing for increased capacity in the national airspace. 4.1.1. FUA Level 1 During the last years several agreements have been reached by CIDEFO through OPGEA in the strategic application of FUA. In particular, in 2010 a number of actions undertaken within the realm of the civil-military coordination and cooperation (reclassification of several airways and creation of a new conditional route (CDR-1)) have resulted in the reduction of the routes length by 250 NM and have saved 27.000 tons of CO2.
FUA Actions in 2010 Flights affected
Route length reduction (in NM)
Reclassification of UN-860 to CDR-1/CDR-2 according to the different Flight Levels
5.843 79,75
Reclassification of B-47 to CDR1/CDR2 according to the day of the week and hour of the day
2.027 40,01
Reclassification of UL-150 to CDR1/CDR2 according to the day of the week and hour of the day 3.584 22,34
Reclassification of UN-866 to full time CDR-1 2.396 99
Creation of the new CDR-1 airway VLC-SADAF 453 8,79
Total 14.303 250
Source: Aena Table 37: FUA Actions in 2010 and derived reduction in affected routes’ lengths

NATIONAL PERFORMANCE PLAN (PNER) FOR RP1 (2012-2014)
SPANISH STATE
AGENCY FOR AIR SAFETY
52/114
DOAN-11-PLA-04-1.0
Source: Aena
Figure 5: Reclassification of UN-866 to full time C DR-1 In addition, all through RP1 the Spanish Air Force will assess the key enablers to establish a mechanism to archive data on the requests, allocation and actual use of airspace structures for further analysis and planning activities including, in particular, the Local And sub-Regional Airspace Management support system (the LARA tool)11. Further to this, a number of initiatives are either currently under analysis or in preparation with a view to their short-term implementation in order to reorganise the airspace segregated for military use, which include: - Reorganization of the airspace affected by military activities within Sevilla TMA, initiative which
includes, amongst others, the creation of more flexible SIDs and STARs for Malaga, Sevilla and Jerez airports or the creation of new airways and reclassification of current ones in the South area of the TMA.
- Reorganization of the airspace affected by military activities within Madrid TMA by extending the
TMA, splitting the UN733 airway and resizing the dangerous areas in the North part of the TMA. - Establishment of an agreement for a more flexible use of civil airports within military airspace (e.g.
LEHC and LERJ).
11 http://www.eurocontrol.int/mil/public/standard_page/LARA.html

NATIONAL PERFORMANCE PLAN (PNER) FOR RP1 (2012-2014)
SPANISH STATE
AGENCY FOR AIR SAFETY
53/114
DOAN-11-PLA-04-1.0
4.1.2. FUA Level 2 The Airspace Management Cell (AMC) (national joint civil-military cell) is responsible for the day-to-day management of airspace (in pre-tactical phase) under the supervision and direction of OPGEA and the establishment of civil-military coordination procedures in the scope of the pre-tactical phase. In January 2010 this cell has been placed in a single location (Madrid ACC) where both civil and military parts are co-located in order to be provided with adequate and dedicated airspace management (ASM) support systems to perform and communicate the pre-tactical airspace management tasks in an optimal manner. This system rationalisation enables a closer and swifter civil-military cooperation in the pre-tactical phase. Every day, and with an advance of a full day, the AMC sends to the CFMU the "Airspace Utilization Plan" message containing information about daily availability of Conditional Routes (CDRs), Dangerous Manned Areas (DMAs) and Temporarily Segregated Areas (TSAs). The airspace is then allocated by the establishment of the Forecast Airspace Use Plan (FAUP) in accordance with the conditions and procedures previously set. In the case of a number of CDRs that are of great relevance to the civil airspace users, a particular procedure has been established within the Air Force for the publication of their availability with 30 days of advance as this time was considered enough from the airspace users to plan and reschedule their flights in order to take full advantage of the availability of these CDRs. 4.1.3. FUA Level 3 Civil ATS units and military control units are responsible of level 3 activities. Coordination procedures and communication channels have been established to allow actual real-time activation, deactivation or reallocation of airspace allocated at pre-tactical level by generic regulations on civil-military coordination and also dedicated local procedures where needed. Finally, civil and military ATCOs are working physically together in all the ACCs. As stated above, coordination procedures have been developed to ensure the timely and effective exchange of any modification of the planned airspace reservations and the adequate notification of any modification to all affected users in order to ensure a safe management of the interactions between civil and military flights. These procedures have been set by means of Operational Letters of Agreement between civil ATS units and military control units and by direct communication between civil military and ATCOs. 4.2 Additional KPIs Neither additional KPAs nor KPIs will be set during RP1 to monitor the effectiveness of utilisation.

NATIONAL PERFORMANCE PLAN (PNER) FOR RP1 (2012-2014)
SPANISH STATE
AGENCY FOR AIR SAFETY
54/114
DOAN-11-PLA-04-1.0
5. ANALYSIS OF SENSITIVITY 5.1. Sensitivity to external assumptions The sensitivity of performance targets against external variations has been taken into account to assess the values set for the performance targets. 5.2. Comparison with the previous performance plan This is the first performance plan to be produced under the Performance Regulation and no other plans of this nature have previously been produced in Spain. Thus, no possible comparison with previous plans can be made. This very plan, however, will be the baseline against which the performance plan for RP2 will be compared.
NATIONAL PERFORMANCE PLAN (PNER) FOR RP1 (2012-2014)
SPANISH STATE
AGENCY FOR AIR SAFETY
55/114
DOAN-11-PLA-04-1.0
6. IMPLEMENTATION OF THE PERFORMANCE PLAN Once adopted, this performance plan will enter into force and be applicable throughout the first reference period, i.e. 1st January 2012 to 31st December 2014. The evolution of the key performance indicators of the different key performance areas will be monitored by the NSAs as detailed in the sections below. 6.1. Safety No target will be set for the safety performance indicators and none are mandated by the Performance Regulation. As stated in the introduction to section 2. , the three safety key performance indicators presented under Annex I of the Performance Regulation will be monitored during this first period, once these have been defined by E3 and E3+ and the regulation amended accordingly. At the time of the drafting of this performance plan this process is ongoing with an expected conclusion in the second half of 2011. Presently a set of questionnaires is being considered within the report drafted by E3 for the definition of the metrics for these indicators. These questionnaires would be addressed both to the State and to the service provider(s) and would measure both SAFPI-01 (EoSM) and SAFPI-03 (just culture). Further to this, it is proposed within that report that SAFPI-02 (severity classification of RAT) would be measured by means of EUROCONTROL’s Annual Summary Template (AST) form. This form would of course need a modification to allow for the indication of the actual application of the RAT severity classification methodology has been applied for the severity assessment of each occurrence. 6.2. Capacity The Capacity KPI will be monitored by AESA in a three-monthly basis, through a report developed by Aena in which the actual figures of the KPI will also be broken down per ACC. Aena will provide an estimation of the total en route ATFM delay minutes foreseen to be accumulated during the year on the basis of the yearly reference value or target and the traffic forecast in terms of IFR flights, as well as an analysis providing a clear view of the situation with respect to the achievement of the target. A -10% monitoring threshold is set on the national capacity target so that whenever the actual value of CAPKPI-01 surpasses it, the situation is analysed in order to identify the ACC(s) which are the major contributors to the deviation. The monitoring threshold will allow an early detection of any issue that could put the achievement of the target in jeopardy. This, in its turn, will allow for a timely redressing of the situation through the application of the appropriate measures.
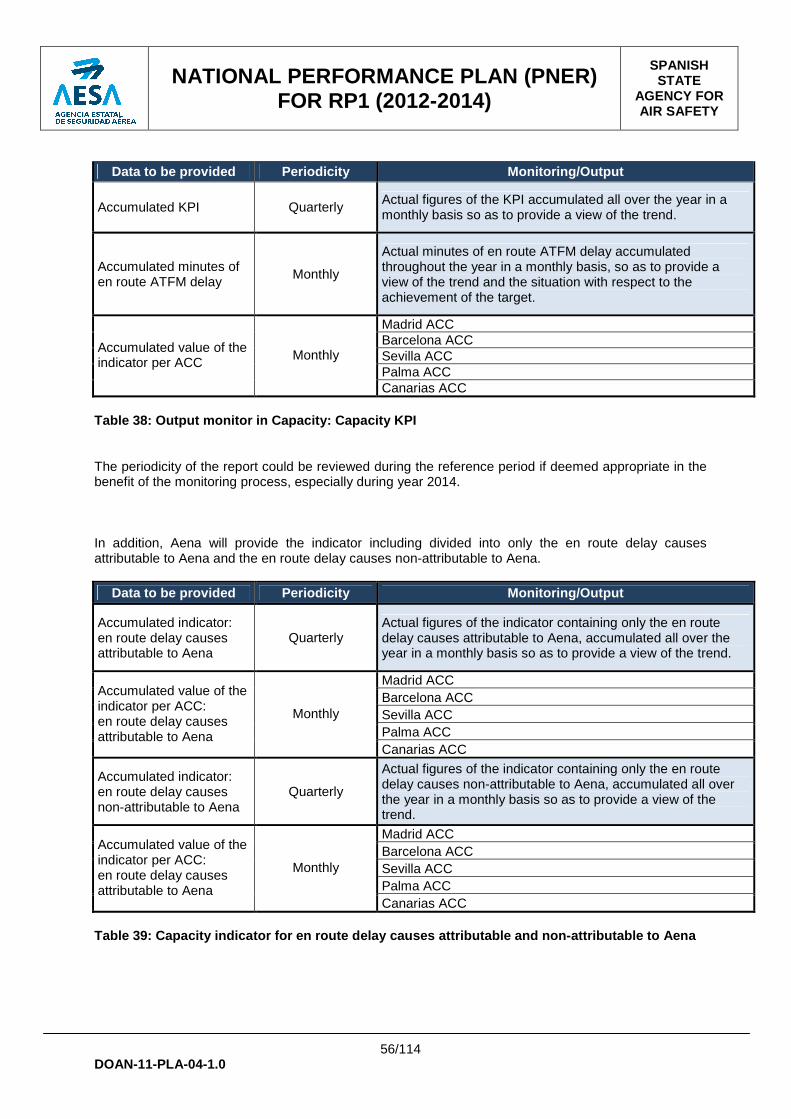
NATIONAL PERFORMANCE PLAN (PNER) FOR RP1 (2012-2014)
SPANISH STATE
AGENCY FOR AIR SAFETY
56/114
DOAN-11-PLA-04-1.0
Data to be provided Periodicity Monitoring/Output
Accumulated KPI Quarterly Actual figures of the KPI accumulated all over the year in a monthly basis so as to provide a view of the trend.
Accumulated minutes of en route ATFM delay
Monthly
Actual minutes of en route ATFM delay accumulated throughout the year in a monthly basis, so as to provide a view of the trend and the situation with respect to the achievement of the target.
Madrid ACC Barcelona ACC Sevilla ACC Palma ACC
Accumulated value of the indicator per ACC Monthly
Canarias ACC Table 38: Output monitor in Capacity: Capacity KPI The periodicity of the report could be reviewed during the reference period if deemed appropriate in the benefit of the monitoring process, especially during year 2014. In addition, Aena will provide the indicator including divided into only the en route delay causes attributable to Aena and the en route delay causes non-attributable to Aena.
Data to be provided Periodicity Monitoring/Output
Accumulated indicator: en route delay causes attributable to Aena
Quarterly Actual figures of the indicator containing only the en route delay causes attributable to Aena, accumulated all over the year in a monthly basis so as to provide a view of the trend.
Madrid ACC Barcelona ACC Sevilla ACC Palma ACC
Accumulated value of the indicator per ACC: en route delay causes attributable to Aena
Monthly
Canarias ACC
Accumulated indicator: en route delay causes non-attributable to Aena
Quarterly
Actual figures of the indicator containing only the en route delay causes non-attributable to Aena, accumulated all over the year in a monthly basis so as to provide a view of the trend.
Madrid ACC Barcelona ACC Sevilla ACC Palma ACC
Accumulated value of the indicator per ACC: en route delay causes attributable to Aena
Monthly
Canarias ACC Table 39: Capacity indicator for en route delay cau ses attributable and non-attributable to Aena

NATIONAL PERFORMANCE PLAN (PNER) FOR RP1 (2012-2014)
SPANISH STATE
AGENCY FOR AIR SAFETY
57/114
DOAN-11-PLA-04-1.0
6.3. Environment No target will be set for the safety performance indicators and none are mandated by the Performance Regulation. No environment KPI is mandated by the Performance Regulation for RP1 at national level but only an EU-wide performance indicator has been established as the “the average horizontal en route flight efficiency”, which is the difference between the length of the en route part of the actual trajectory and the optimum trajectory which, in average, is the great circle. 6.4. Cost-efficiency The determined costs will be monitored at least twice within the process set out by the EUROCONTROL Enlarged Committee for route charges. The forecast service units will be provided by Aena at least twice a year for this process and the actual number of total en-route service units (SU) is known on a monthly basis through the data provided by EUROCONTROL and consolidated by Aena.

NATIONAL PERFORMANCE PLAN (PNER) FOR RP1 (2012-2014)
SPANISH STATE
AGENCY FOR AIR SAFETY
58/114
DOAN-11-PLA-04-1.0
Reference Documentation
REGULATION (EC) No 549/2004 , Framework for the creation of the Single European Sky (SES)
REGULATION (EC) No 1070/2009 , amending SES Regulations in order to improve the performance and sustainability of the European aviation system
REGULATION (EU) No 691/2010 , laying down a performance scheme
REGULATION (EC) No 1794/2006 on common charging scheme for air navigation services (ANS)
REGULATION (EU) No 1191/2010 , amending REGULATION (EC) No 1794/2006 on common charging scheme for air navigation services (ANS)
COMISSION DECISION of 21 of February of 2011 setting EU-wide performance targets (2011/121/EU)
Ley 1/2011 , de 4 de marzo, por la que se establece el Programa Estatal de Seguridad Operacional para la Aviación Civil y se modifica la Ley 21/2003, de 7 de julio, de Seguridad Aérea Ley 7/2011 , de 11 de abril, por la que se modifican la Ley 41/1999, de 12 de noviembre, sobre sistemas de pagos y de liquidación de valores y el Real Decreto-ley 5/2005, de 11 de marzo, de reformas urgentes para el impulso a la productividad y para la mejora de la contratación pública
Plan Empresarial de Navegación Aérea 2011-2015 de Aena (G1-11-PLA-001-1.0; Dic'10)
Guidance Material for national/FAB Performance Plans (v1.0; Draft template)
E3 Task Force’s Metrics for Safety Key Performance Indicators for th e Performance Scheme (v1.0; 29.04.2011)
EUROCONTROL Medium-term Forecast - SU (Doc406 v1.0) (2010-2016)
EUROCONTROL Medium-term Forecast - Flights (Doc418 v1.0) (2011-2017)
EUROCONTROL Short- and Medium-term Forecast - SU (Doc434 v1.0) (2011-2017)
ACE 2009 Benchmark Report - Focus on individual ANSPs performance (Draft extract; 28.01.2011)
Final Minutes of the SSC Ad hoc Meeting held in Bruss els, Eurocontrol Headquarters, Europa Conference Room on October 25 th, 2010 (SSC/10/38/2/FIN)
EU-wide targets ACC Breakdown (Attachment; 31.01.2011)
EUROCONTROL’s ATFCM Users Manual (Edition. 15.0, Amendment date 15.03.2011)
AOB - State of affairs of the performance scheme (SSC/11/40/4)
LSSIP 2011-2015 Spain - Part III Chapter 14 - Single Europ ean Sky Annual Plan for 2010
LSSIP 2011-2015 Spain - Part III Chapter 15 - 2010 Annua l Plan on the Application of FUA
CARTA del DGAC a Daniel Calleja comunicando la NSA C oordinadora dentro del Performance Scheme (47/1098-132ENA, 29.10.2010) Metrics for Safety Key Performance Indicators for th e Performance Scheme (E3 Task Force) (proposed issue, version 2.0; 01.06.2011)

NATIONAL PERFORMANCE PLAN (PNER) FOR RP1 (2012-2014)
SPANISH STATE
AGENCY FOR AIR SAFETY
59/114
DOAN-11-PLA-04-1.0
List of Tables Table 1: Expected GDP growth 8 Table 2: Expected inflation rates 8 Table 3: National targets and thresholds for RP1 8 Table 4: En route capacity target (CAPKPI-01) for RP1 8 Table 5: Traffic forecasted at EU-wide level (en rou te SUs) 8 Table 6: Reference determined costs forecasted at EU -wide level (real terms, MEUR 2009) 8 Table 7: En route cost-efficiency Spain Continental t arget (CEFKPI-01) for RP1 8 Table 8: En route cost-efficiency Spain Canary Island s target (CEFKPI-02) for RP1 8 Table 9: EU-wide and national capacity (CAPKPI-01) tar gets for RP1 8 Table 10: EU-wide and national capacity (CAPKPI-01) ta rgets for RP1 8 Table 11: En route SU Forecast - Spain Continental 8 Table 12: En route SU Forecast - Spain Canary Islands 8 Table 13: ANS Determined en route costs per entity - Spain Cont inental 8 Table 14: ANS Determined en route costs per entity - Spain Cana ry Islands 8 Table 15: ANS Determined en route cost per nature - Spain Cont inental 8 Table 16: ANS Determined en route cost per nature - Spain Cana ry Islands 8 Table 17: ANS Determined en route cost per service - Spain Cont inental 8 Table 18: ANS Determined en route cost per service - Spain Cana ry Islands 8 Table 19: Determined en route ANS costs in real terms - Spain C ontinental 8 Table 20: Determined en route ANS costs in real terms - Spain C anary Islands 8 Table 21: Real en route DUR (CEFKPI-01) - Spain Continental 8 Table 22: Real en route DUR (CEFKPI-02) - Spain Canary Islands 8 Table 23: Terminal ANS Costs per entity 8 Table 24: Terminal ANS Costs per nature 8 Table 25: Terminal ANS Costs per service 8 Table 26: Carry-overs for Spain Continental and Spain Canary Is lands 8 Table 27: Aena’s planned annual investments 8 Table 28: Aena’s capex planned for the 2009-2014 pe riod (major investment projects) 8 Table 29: Aena’s ATM/CNS strategic projects structur e 8 Table 30: Aena’s main investments in ATM/CNS strateg ic deployment projects during RP1 8 Table 31: AEMET’s investment expenditure (total amoun t in ‘000 Euros) 8 Table 32: AEMET’s investment expenditure (en route in ‘000 Euros) 8 Table 33: Total Spanish en route costs and annual va riation 8 Table 34: Fixed assets annual variation 8 Table 35: Main Investments impacting RP1 8 Table 36: Annual investments 8 Table 37: FUA Actions in 2010 and derived reduction in affected routes’ lengths 8 Table 38: Output monitor in Capacity: Capacity KPI 8 Table 39: Capacity indicator for en route delay cau ses attributable and non-attributable to Aena 8

NATIONAL PERFORMANCE PLAN (PNER) FOR RP1 (2012-2014)
SPANISH STATE
AGENCY FOR AIR SAFETY
60/114
DOAN-11-PLA-04-1.0
List of Figures
Figure 1: Continental Spain FIR/UIR (ICAO EUR region) 8 Figure 2: Canaries FIR/UIR (Canary Islands; ICAO AF I region) 8 Figure 3: Historical data compared to capacity targ ets and forecast traffic 8 Figure 4: IP1 OIs covered by Aena’s strategic projec ts 8 Figure 5: Reclassification of UN-866 to full time C DR-1 8

NATIONAL PERFORMANCE PLAN (PNER) FOR RP1 (2012-2014)
SPANISH STATE
AGENCY FOR AIR SAFETY
61/114
DOAN-11-PLA-04-1.0
ANNEX A REPORTING TABLES
AND ADDITIONAL INFORMATION
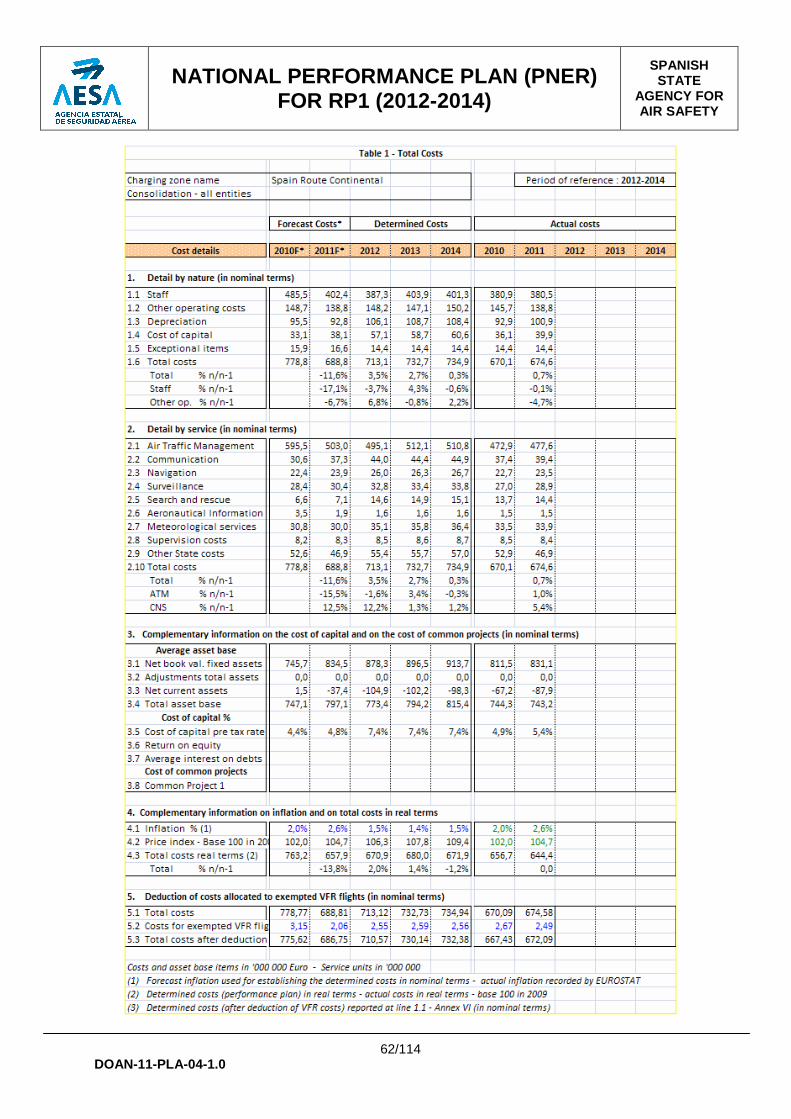
NATIONAL PERFORMANCE PLAN (PNER) FOR RP1 (2012-2014)
SPANISH STATE
AGENCY FOR AIR SAFETY
62/114
DOAN-11-PLA-04-1.0

NATIONAL PERFORMANCE PLAN (PNER) FOR RP1 (2012-2014)
SPANISH STATE
AGENCY FOR AIR SAFETY
63/114
DOAN-11-PLA-04-1.0

NATIONAL PERFORMANCE PLAN (PNER) FOR RP1 (2012-2014)
SPANISH STATE
AGENCY FOR AIR SAFETY
64/114
DOAN-11-PLA-04-1.0

NATIONAL PERFORMANCE PLAN (PNER) FOR RP1 (2012-2014)
SPANISH STATE
AGENCY FOR AIR SAFETY
65/114
DOAN-11-PLA-04-1.0

NATIONAL PERFORMANCE PLAN (PNER) FOR RP1 (2012-2014)
SPANISH STATE
AGENCY FOR AIR SAFETY
66/114
DOAN-11-PLA-04-1.0
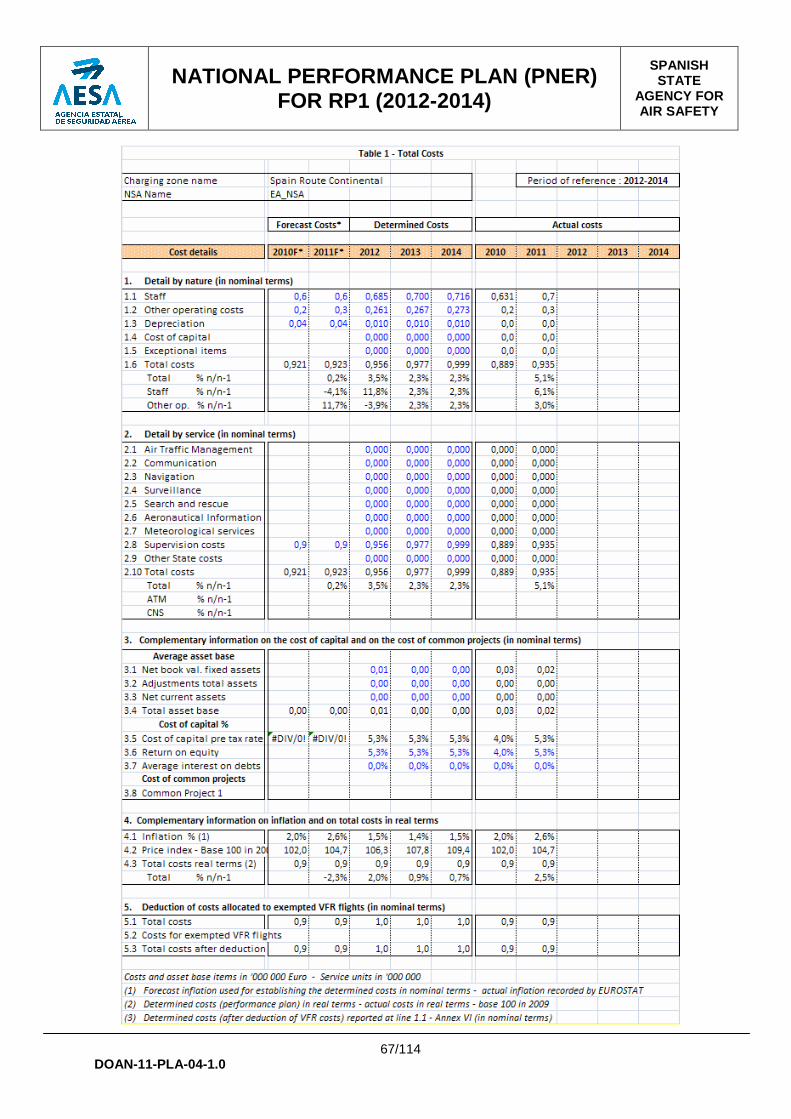
NATIONAL PERFORMANCE PLAN (PNER) FOR RP1 (2012-2014)
SPANISH STATE
AGENCY FOR AIR SAFETY
67/114
DOAN-11-PLA-04-1.0

NATIONAL PERFORMANCE PLAN (PNER) FOR RP1 (2012-2014)
SPANISH STATE
AGENCY FOR AIR SAFETY
68/114
DOAN-11-PLA-04-1.0
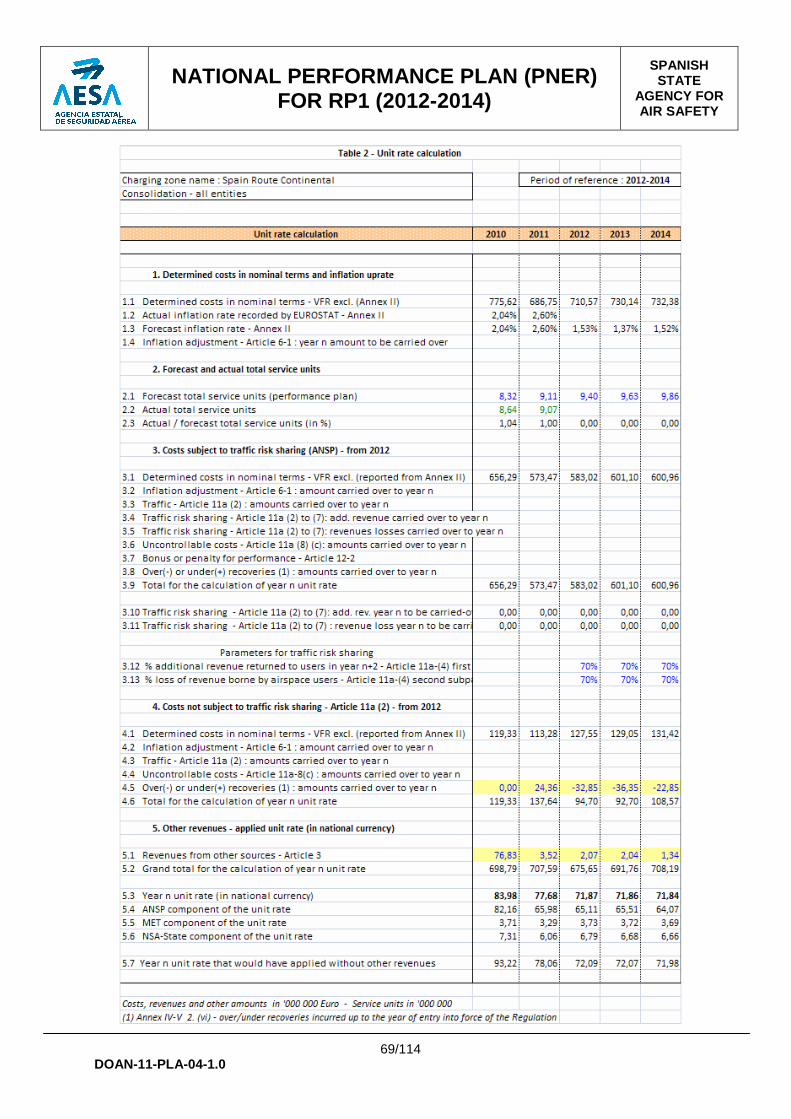
NATIONAL PERFORMANCE PLAN (PNER) FOR RP1 (2012-2014)
SPANISH STATE
AGENCY FOR AIR SAFETY
69/114
DOAN-11-PLA-04-1.0

NATIONAL PERFORMANCE PLAN (PNER) FOR RP1 (2012-2014)
SPANISH STATE
AGENCY FOR AIR SAFETY
70/114
DOAN-11-PLA-04-1.0

NATIONAL PERFORMANCE PLAN (PNER) FOR RP1 (2012-2014)
SPANISH STATE
AGENCY FOR AIR SAFETY
71/114
DOAN-11-PLA-04-1.0
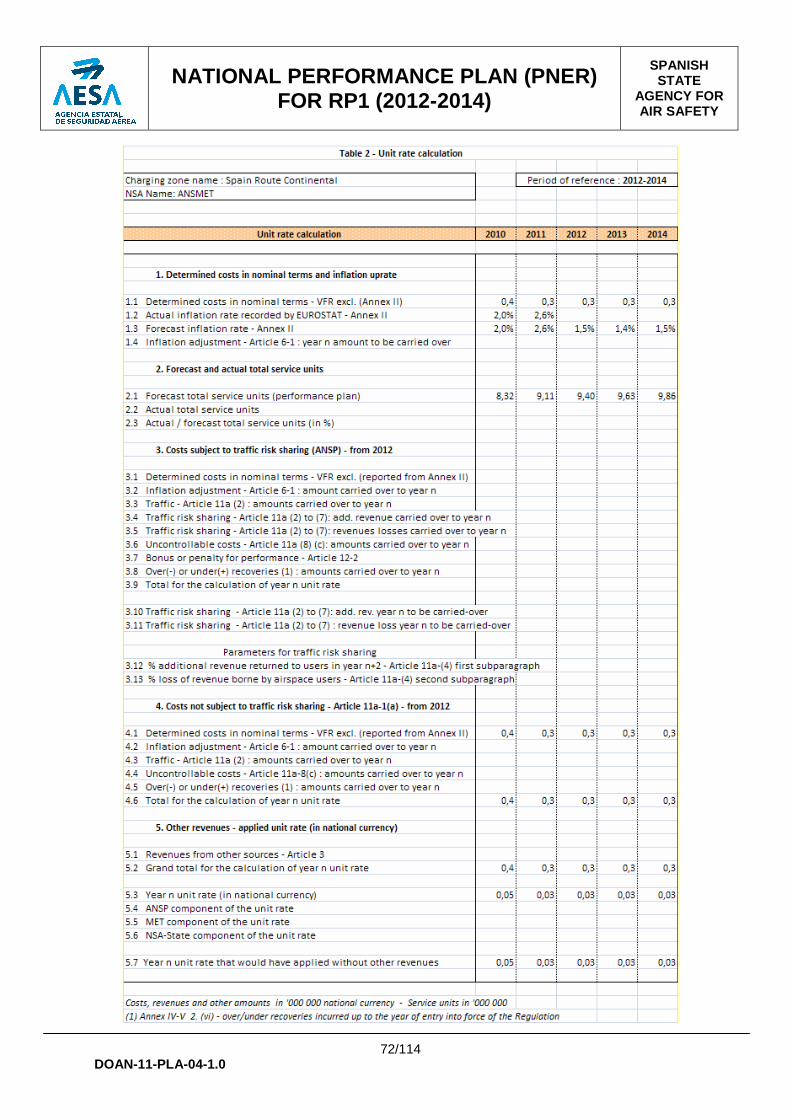
NATIONAL PERFORMANCE PLAN (PNER) FOR RP1 (2012-2014)
SPANISH STATE
AGENCY FOR AIR SAFETY
72/114
DOAN-11-PLA-04-1.0
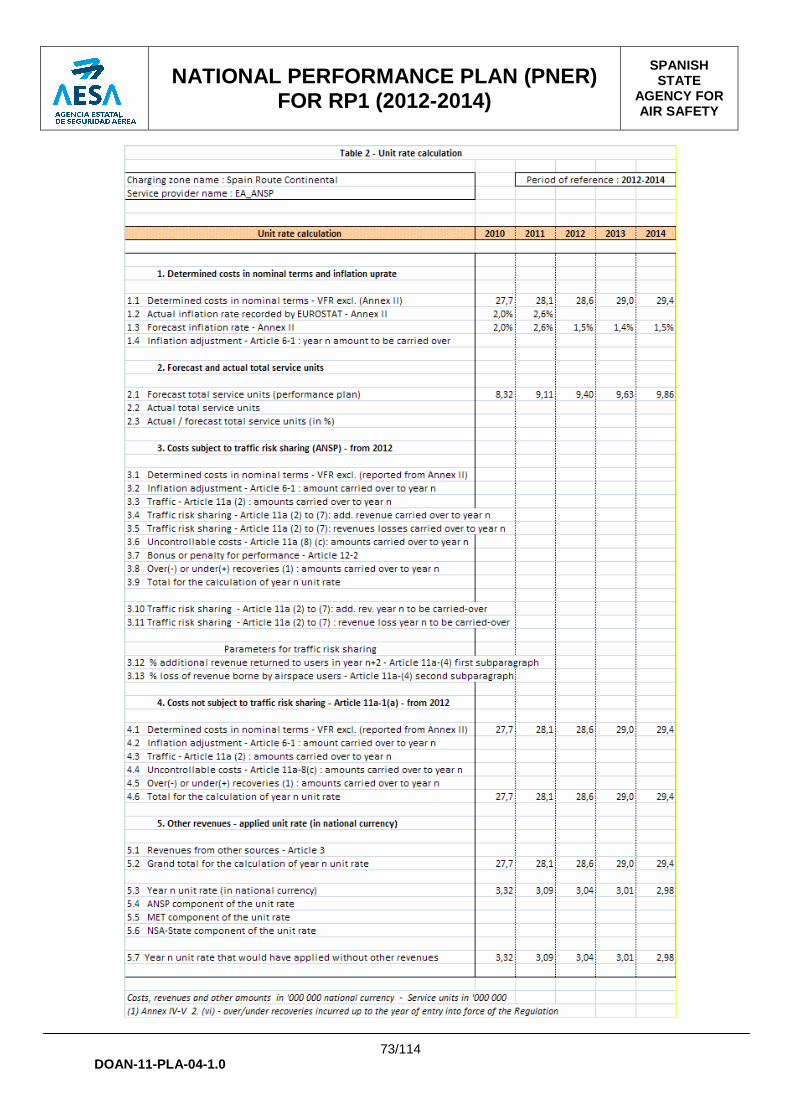
NATIONAL PERFORMANCE PLAN (PNER) FOR RP1 (2012-2014)
SPANISH STATE
AGENCY FOR AIR SAFETY
73/114
DOAN-11-PLA-04-1.0
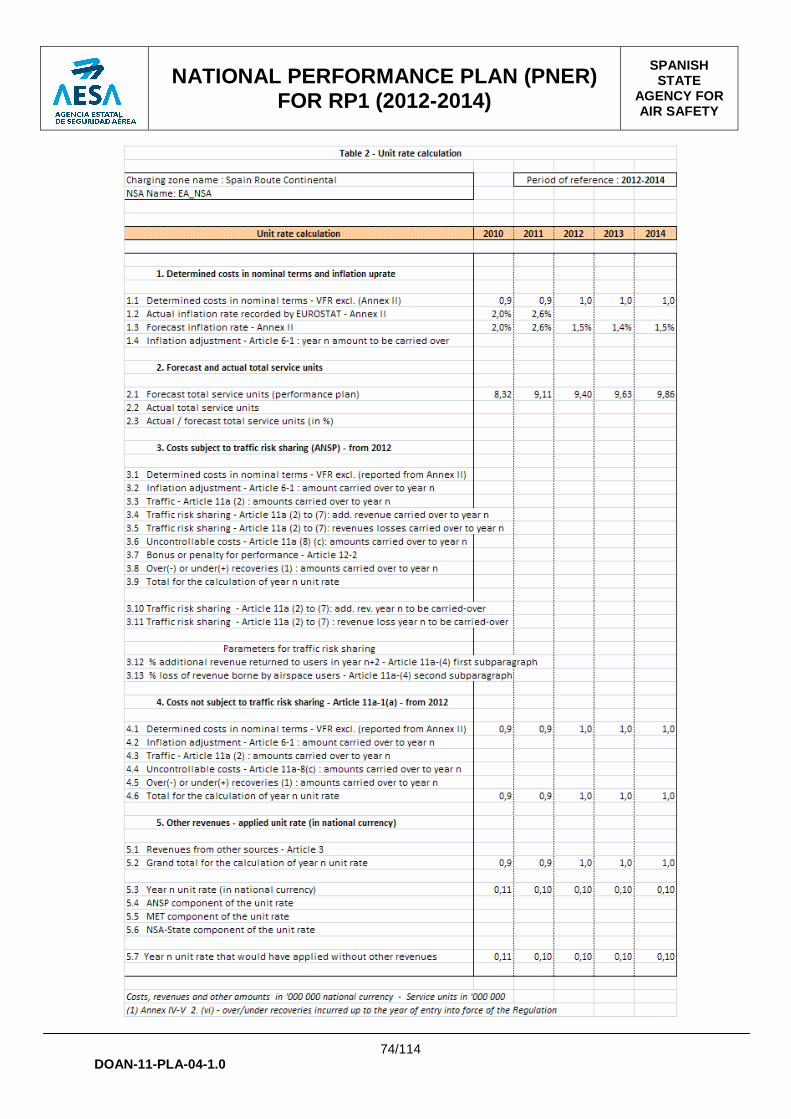
NATIONAL PERFORMANCE PLAN (PNER) FOR RP1 (2012-2014)
SPANISH STATE
AGENCY FOR AIR SAFETY
74/114
DOAN-11-PLA-04-1.0

NATIONAL PERFORMANCE PLAN (PNER) FOR RP1 (2012-2014)
SPANISH STATE
AGENCY FOR AIR SAFETY
75/114
DOAN-11-PLA-04-1.0
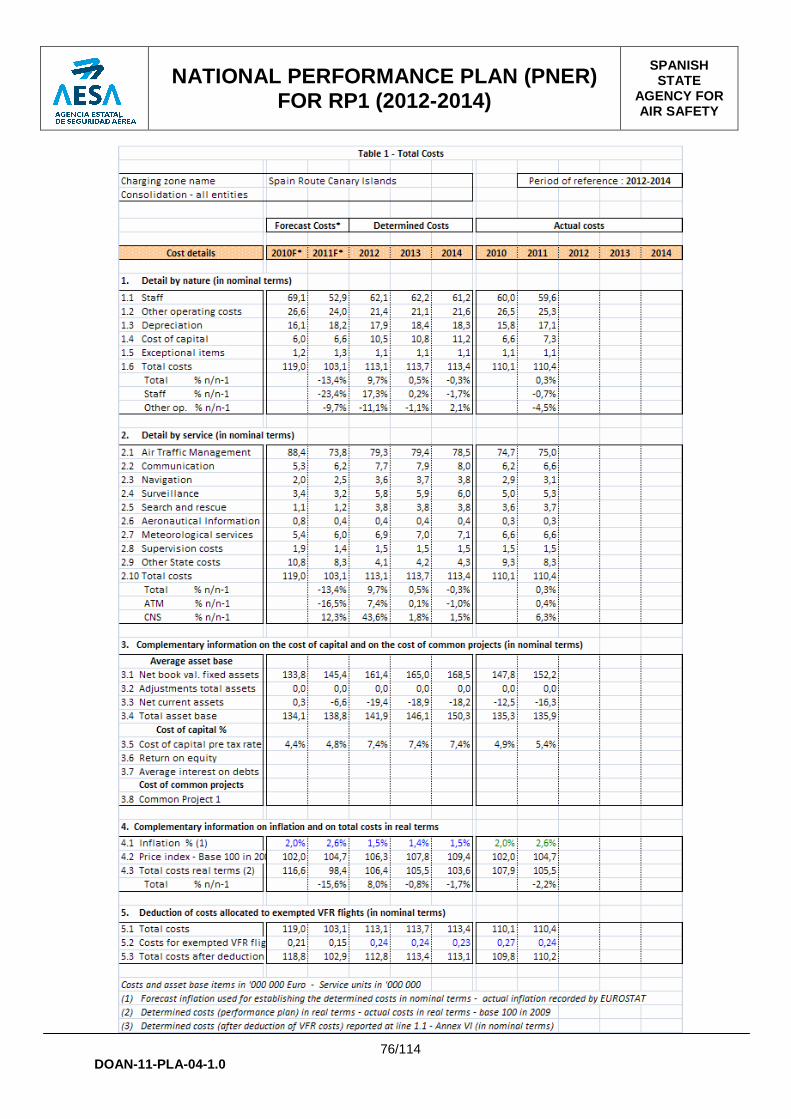
NATIONAL PERFORMANCE PLAN (PNER) FOR RP1 (2012-2014)
SPANISH STATE
AGENCY FOR AIR SAFETY
76/114
DOAN-11-PLA-04-1.0
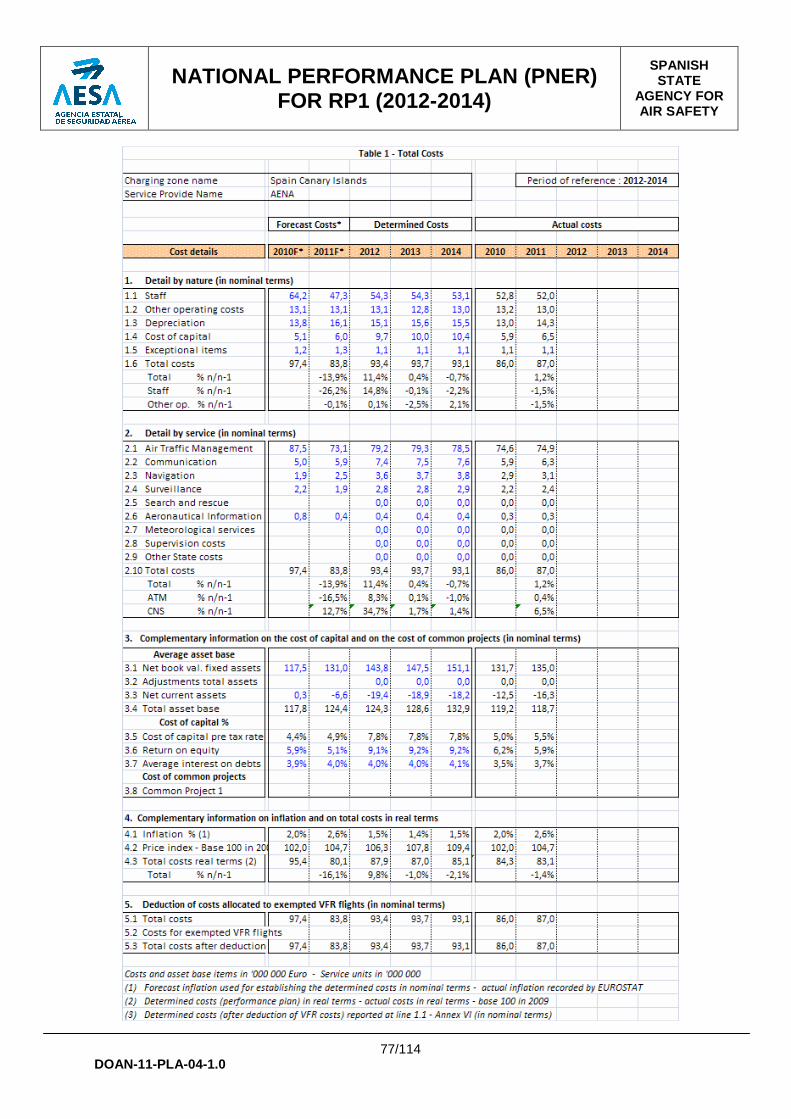
NATIONAL PERFORMANCE PLAN (PNER) FOR RP1 (2012-2014)
SPANISH STATE
AGENCY FOR AIR SAFETY
77/114
DOAN-11-PLA-04-1.0
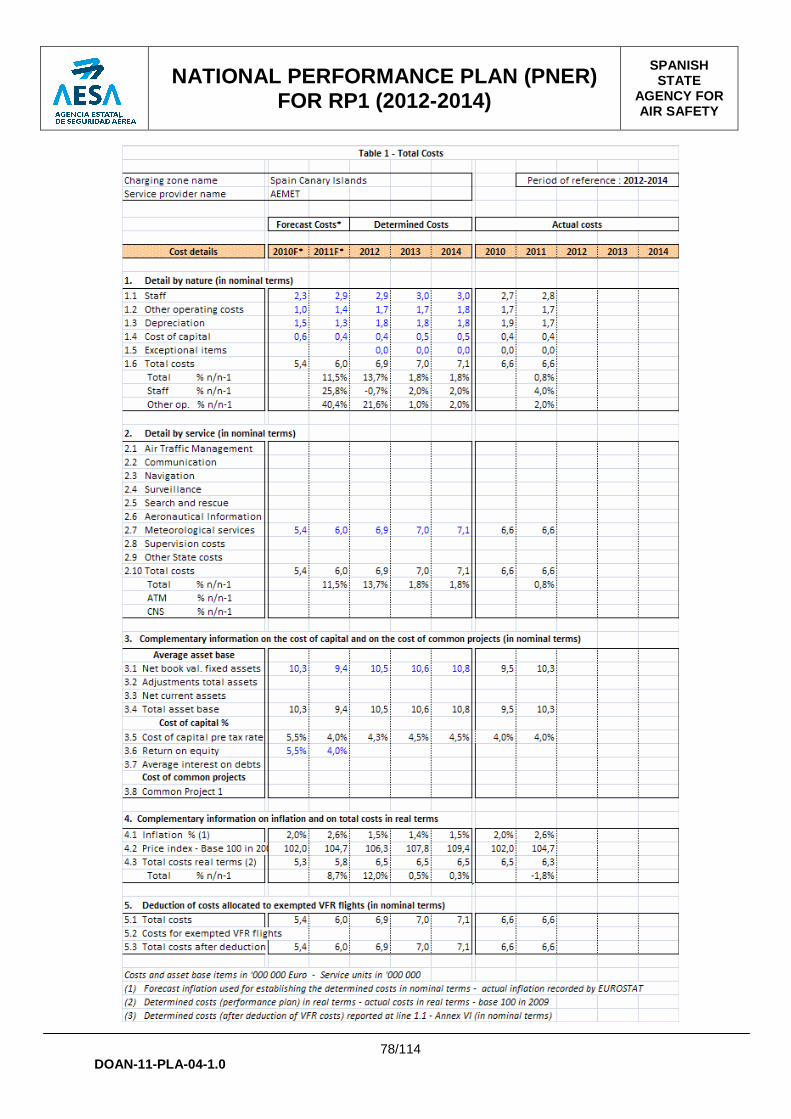
NATIONAL PERFORMANCE PLAN (PNER) FOR RP1 (2012-2014)
SPANISH STATE
AGENCY FOR AIR SAFETY
78/114
DOAN-11-PLA-04-1.0
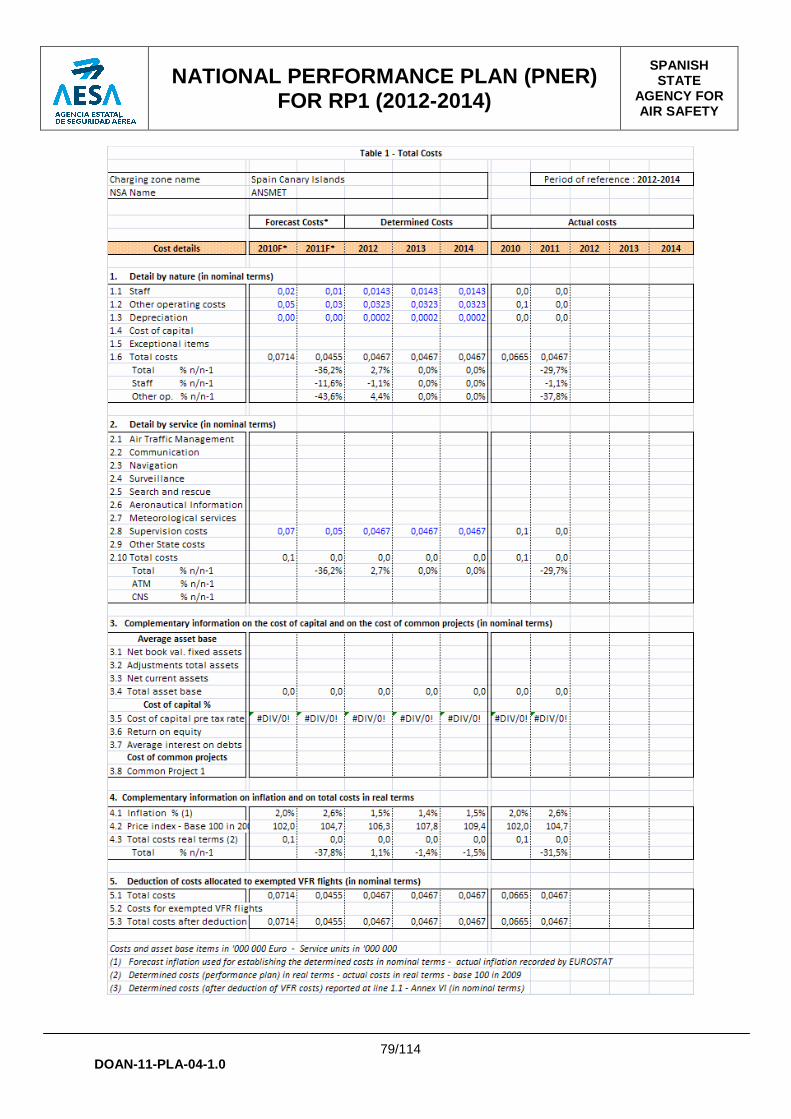
NATIONAL PERFORMANCE PLAN (PNER) FOR RP1 (2012-2014)
SPANISH STATE
AGENCY FOR AIR SAFETY
79/114
DOAN-11-PLA-04-1.0

NATIONAL PERFORMANCE PLAN (PNER) FOR RP1 (2012-2014)
SPANISH STATE
AGENCY FOR AIR SAFETY
80/114
DOAN-11-PLA-04-1.0

NATIONAL PERFORMANCE PLAN (PNER) FOR RP1 (2012-2014)
SPANISH STATE
AGENCY FOR AIR SAFETY
81/114
DOAN-11-PLA-04-1.0

NATIONAL PERFORMANCE PLAN (PNER) FOR RP1 (2012-2014)
SPANISH STATE
AGENCY FOR AIR SAFETY
82/114
DOAN-11-PLA-04-1.0
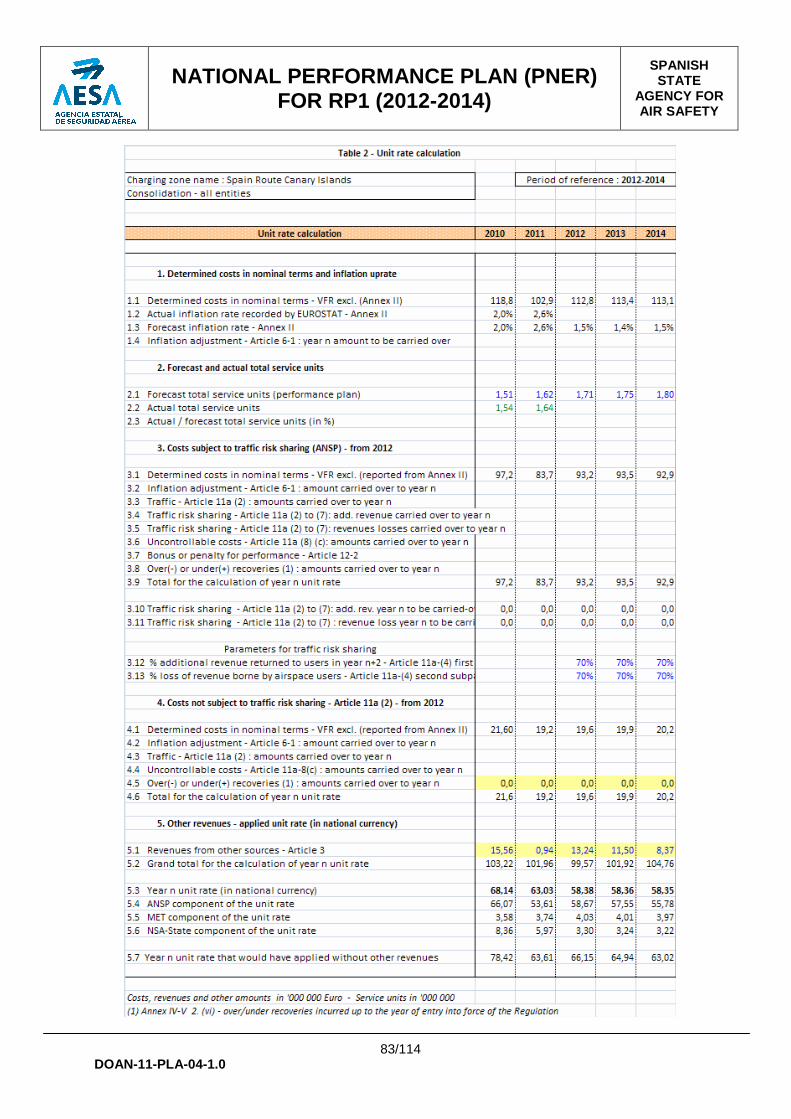
NATIONAL PERFORMANCE PLAN (PNER) FOR RP1 (2012-2014)
SPANISH STATE
AGENCY FOR AIR SAFETY
83/114
DOAN-11-PLA-04-1.0
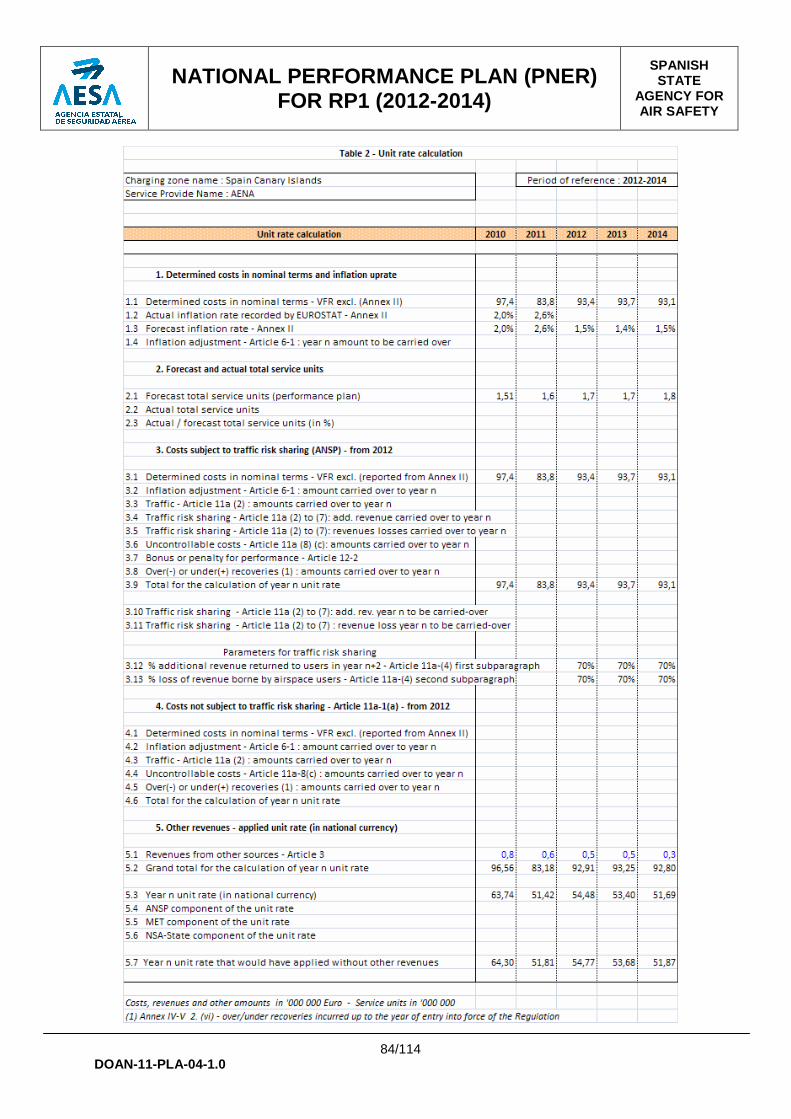
NATIONAL PERFORMANCE PLAN (PNER) FOR RP1 (2012-2014)
SPANISH STATE
AGENCY FOR AIR SAFETY
84/114
DOAN-11-PLA-04-1.0
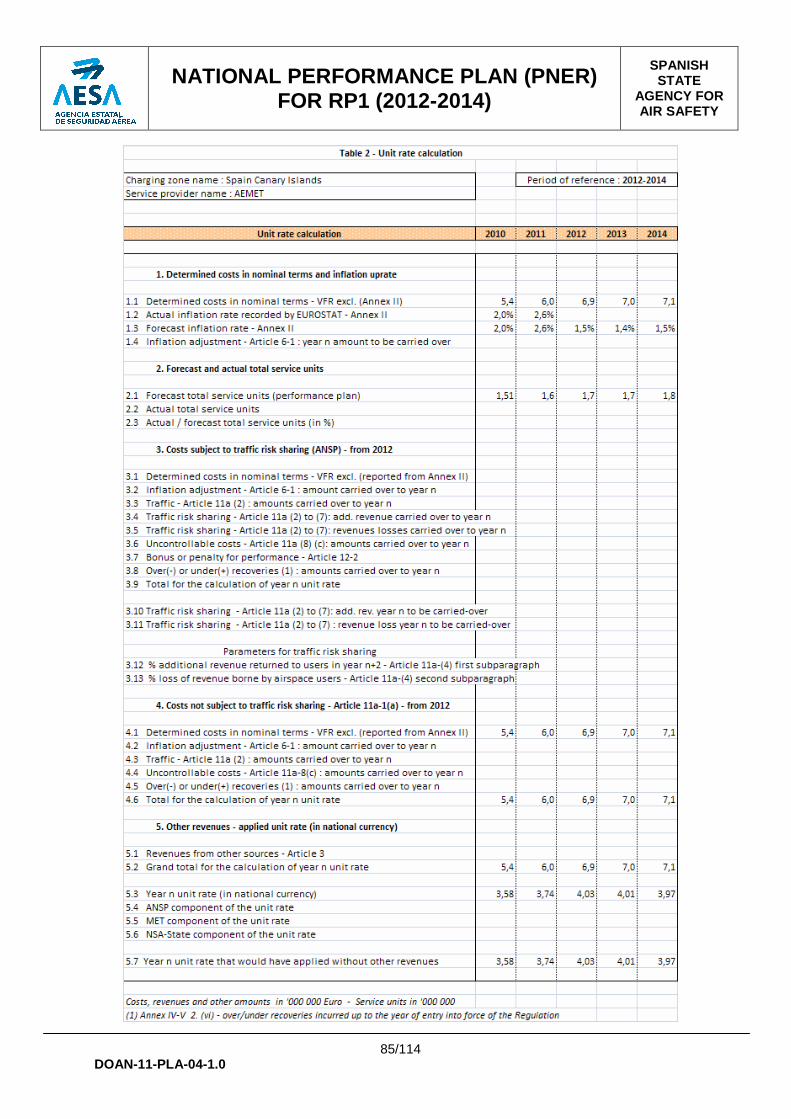
NATIONAL PERFORMANCE PLAN (PNER) FOR RP1 (2012-2014)
SPANISH STATE
AGENCY FOR AIR SAFETY
85/114
DOAN-11-PLA-04-1.0

NATIONAL PERFORMANCE PLAN (PNER) FOR RP1 (2012-2014)
SPANISH STATE
AGENCY FOR AIR SAFETY
86/114
DOAN-11-PLA-04-1.0

NATIONAL PERFORMANCE PLAN (PNER) FOR RP1 (2012-2014)
SPANISH STATE
AGENCY FOR AIR SAFETY
87/114
DOAN-11-PLA-04-1.0

NATIONAL PERFORMANCE PLAN (PNER) FOR RP1 (2012-2014)
SPANISH STATE
AGENCY FOR AIR SAFETY
88/114
DOAN-11-PLA-04-1.0

NATIONAL PERFORMANCE PLAN (PNER) FOR RP1 (2012-2014)
SPANISH STATE
AGENCY FOR AIR SAFETY
89/114
DOAN-11-PLA-04-1.0

NATIONAL PERFORMANCE PLAN (PNER) FOR RP1 (2012-2014)
SPANISH STATE
AGENCY FOR AIR SAFETY
90/114
DOAN-11-PLA-04-1.0
ADDITIONAL INFORMATION
Additional Information Table-1* State: Spain Continental and Canary Island-Route Year: 2011
1.Description of the methodology used for allocatin g costs of facilities or services between different air navigation services based on the list of facilities and services listed in the relevant ICAO Regional A ir Navigation Plan, (Doc 7754) and a description of the methodology used for allocating those costs between different en route charging zones
AENA
Costing Method
• Activity Based Costing Method (ABC methodology)
• Revised model / audited by IGAE (General Comptroller of the State Administration) / Deloitte in 2006.
The Activity Based Costing Method permits the allocation of the accounted resources, which enter directly from our financial accounting, to the cost centres and defined activities. That is, each resource / cost is assigned to its centre and activity.
In the specific case of Canary Islands, it is a differentiated accounting unit.
Phases of the Model
� Allocation of resources to activities
• Staff: ATC Staff cost driver is based on time employed and number of operative sectors in each centre; the cost of other staff is allocated according to the specific occupation of each worker.
• Operation expenses: Allocation to activities through an account-based driver.
• Depreciation: Cost driver based on the activity assigned to each fixed asset according to technical and operative criteria.
• Capital Cost: Assignment applying criteria similar to that of depreciation.
� Allocation of activities to services
The model is composed of primary activities, allocated entirely to one service, and secondary activities allocated to each service according to the proportion of services defined by the primary activities in each cost centre.
� Allocation of air navigation central services (SS.CC) costs
SS.CC. costs are allocated to Spain Continental and Canaries on the basis of their respective services units.
� Cost allocation to services and charges
• Area control service: costs entirely allocated to the en-route charging cost base.

NATIONAL PERFORMANCE PLAN (PNER) FOR RP1 (2012-2014)
SPANISH STATE
AGENCY FOR AIR SAFETY
91/114
DOAN-11-PLA-04-1.0
• Tower aerodrome service: costs entirely allocated to the terminal charging cost base.
• Approach sectors control service: the costs of the final approach phase provided to a specific airport are assigned to the en-route and terminal cost-bases for charges based on a technical-operative criterion of the service provision, based on the average of distances of service provision.
Cost allocation is, therefore, not based on percentages defined a priori, but the result of the assignments and criteria applied in the cost model described above. It has to be highlighted that the major changes initiated in 2010, mainly the process of aerodrome control service liberalization and the new organizational model, lead to changes in the resulting allocation of costs between route and approach, with growing weight on route costs fundamentally from 2012.
AEMET
The analytical accounting software (CANOA) used by AEMET has been developed by the IGAE (Intervención General de la Administración del Estado – the General State Controller). The model uses historical costs. Cost centres and activities have been identified. Cost centres are the administrative units of AEMET. Activities are divided into three groups, namely final activities, support activities and DAG activities (Direction, Administration and General). Costs are distributed on the basis of criteria (cost drivers), i.e. staff complement, square metres, time of dedication to each activity carried out by each cost centre (obtained by means of surveys) and the use of technology.
For the calculation of the aeronautic activity costs, direct costs taken into account are those from cost centres contributing exclusively to aeronautical activities, e.g. offices and meteorological facilities at airports. Cost centres are identified geographically thus allowing for the calculation of aeronautic costs per areas.
Core costs include the aeronautical contribution of the cost centres that perform different final activities such as the forecast offices and the technological cost centres (radar, satellite, lightning, observation networks, communications systems and process systems).
Indirect costs include the contribution to the aeronautical activity of the cost centres that perform supporting activities such as administration, management, maintenance, calibration and training.
AEMET is part of the Spanish Public Administration and does not consider:
• Debt, and therefore interest on debts is not considered either.
• Current assets.
Due to this it is confirmed that:
• Average interest on debts has null value every year.
• Cost of capital before tax is equal to the Return on equity (ROE).

NATIONAL PERFORMANCE PLAN (PNER) FOR RP1 (2012-2014)
SPANISH STATE
AGENCY FOR AIR SAFETY
92/114
DOAN-11-PLA-04-1.0
ANSMET
Due to the fact of their specific creation mandate, 100% of NSA MET costs are allocated to supervision of MET services.
As for the allocation of costs between the two en route charging zones (Continental Spain and Canary Islands) the percentages obtained by the MET provider when computing their own costs are used as a reference.
This seems to be the more practical and efficient rule to allocate supervision costs, mainly produced by staff salaries and external services costs.
EA (ANSP & NSA)
For calculating and allocating costs it has been used the following criteria:
• The regulation (CE Nº 1794/2006 and CE Nº 1191/2010) and the document on compensation cost (Compensación de Costes de Navegación Aérea de Ruta en base a los Servicios prestados por el E.A. a la Aviación Civil) have been taken as a guide
• It is used the analytical accounting of the EA (Air Force) for costs calculation
The EA, being part of the Spanish Public Administration, does not consider:
• Debt, and therefore interest on debts is not considered either.
• Current assets.
Due to this, it is confirmed that:
• Average interest on debts has null value every year.
Cost of capital before tax is equal to Return on equity.
AESA
The analytical accounting has been reviewed by the Tribunal de Cuentas (the Spanish Court of Audit). This model defines the next costs concepts applied to air navigation (AN):
• Operating Costs:
o Staff Costs. Total cost of personnel dedicated to air navigation activities, are obtained via the number of "Full Time Equivalent persons” (AN FTE persons) from the different departments, from both AESA and other support departments inside the Ministerio de Fomento (Department of Transport, DoT). Calculations take into account the DoT organization, as well as the differentiation between "Direct" and "Indirect" services, in relation with AN. The remuneration is allocated by AN FTE (direct costs) or by indirect methods for the personnel (both AESA and DoT) who carry out

NATIONAL PERFORMANCE PLAN (PNER) FOR RP1 (2012-2014)
SPANISH STATE
AGENCY FOR AIR SAFETY
93/114
DOAN-11-PLA-04-1.0
support activities to AN FTE person. Social security increases the remuneration cost due to pensions and sanitary assistance. Other staff costs include training, travel and transport and payment in kind.
o Maintenance Costs. in this paragraph are considered the maintenance costs, such us: electronics equipment, furniture, informatics equipment and automobiles
o Energy /Communications Costs: in this paragraph are considered the costs derived from the DoT total consumption, such us: electric energy, fuel for heating, petrol for automobiles and communications.
o Other Operating Costs: in this paragraph are considered the costs derived from the DoT total consumption, such us: supplies (water), office material and external services (security, cleanliness, gardening, ...)
• Depreciation costs. Amortization of Investments such us: equipments, properties and other assets.
2.Description of the costs incurred by the Contract ing States (“Other States costs”)
No other State costs
3. Description and explanation of the method adopte d for the calculation of depreciation costs: historic costs or current costs . When current cost accounting is adopted, provision of comparable hist oric cost data
AENA
Calculation of depreciation costs is based on historic costs of the assets.
AEMET
The analytical cost system used by the AEMET is based on historical costs. The calculation of depreciation is calculated from an inventory database where there are registered about 60,000 assets that make up the patrimony of AEMET. Each has an individual calculation of depreciation in terms of its nature, purchase price and period of depreciation. Depreciation for all assets is linear.
ANSMET
Historic costs and linear depreciation with individual calculations according to the type of equipment (only NSA MET office equipment, such as computers, printers and furniture are considered).
NATIONAL PERFORMANCE PLAN (PNER) FOR RP1 (2012-2014)
SPANISH STATE
AGENCY FOR AIR SAFETY
94/114
DOAN-11-PLA-04-1.0
EA (ANSP & NSA)
Calculation of depreciation costs is based on historic costs of the assets and it is obtained by straight-line depreciation method.
AESA
It has been estimated that costs remain constant for years 2011 and 2012. For years 2013 to 2016 costs are expected to increase at a linear 1,10% per year.
4. Justification for the cost of capital, including the components of the asset base, the possible adjustments to total assets and the return on equity
AENA
The estimate of the cost of capital average rate has been determined by Aena as the weighted average (WACC), using the Capital Asset Pricing Model (CAPM).
The capital cost base is estimated for AENA - Airports and Air Navigation- as a whole taking into account the average net book value of the capital employed. Different rates by business are calculated based on estimated risk and the resulting rate is applied on the average capital employed.
In this sense, starting in year 2007, a lower rate than the one established for the rest of AENA activities has been applied to the costs allocated to en route charges. However, the introduction of the Performance Scheme, in accordance with SES second package, involves a new assessment of the risks and the application of the average rate in both en route and approach service (7.8% in the period 2012 - 2014).
It has to be pointed out that, as already explained above, an effect derived from the New Accounting Plan and its adaptation to IAS, is related to the recognition of the global amount of the pending adjustment mechanisms as contingent assets, being, therefore, outside the Balance sheet, and then those amounts have not been considered in the determination of capital employed.
AEMET
The cost of capital is taken into account based on the inventory database which is calculated for each asset the amount pending to repayment, taken as a guide the legal rate published by the government.
EA (ANSP & NSA)
Cost of capital before tax is equal to return on equity. The asset base is the estimate net book value of the capital employed. Average interest on debts has null value every year.
NATIONAL PERFORMANCE PLAN (PNER) FOR RP1 (2012-2014)
SPANISH STATE
AGENCY FOR AIR SAFETY
95/114
DOAN-11-PLA-04-1.0
The EA uses as return on equity, the long-term interest rate published by the European Central Bank for Spain.
AESA
The cost of capital is estimated upon the multiplication of the legal interest of money, which is 4%, by the capital employed by AESA.
5. Definition of the criteria used to allocate cost s between terminal and en route services
AENA
As explained in the section on methodology and cost model, the distribution of costs by service is done through criteria and allocations of the cost model (see section 1).
AEMET
The criteria used to allocate costs between terminal and en route services are based in the criteria those described in the OACI Doc.9161, Appendix 3: “Guidance for determining the costs of aeronautical meteorological services”. In this Appendix the allocation between en route and airport is described for the services intended exclusively to serve aeronautical requirements. It is bearing in mind also the number of operations in each airport in order to calculate the impact of the information for terminal services. In the case of the forecasting offices, each one fills monthly a survey indicating the time of dedication terminal and en route services.
ANSMET
As for the allocation of costs between en route and TNC costs the percentages obtained by the MET provider when computing their own costs are used as a reference.
This seems to be the more practical and efficient rule to allocate supervision costs, mainly produced by staff salaries and external services costs.
EA (ANSP & NSA)
The Air Force cost model for cost accounting only charged costs for services provided en route.
AESA
The distribution of costs between terminal and en route is done through the criteria and allocations of the cost model.
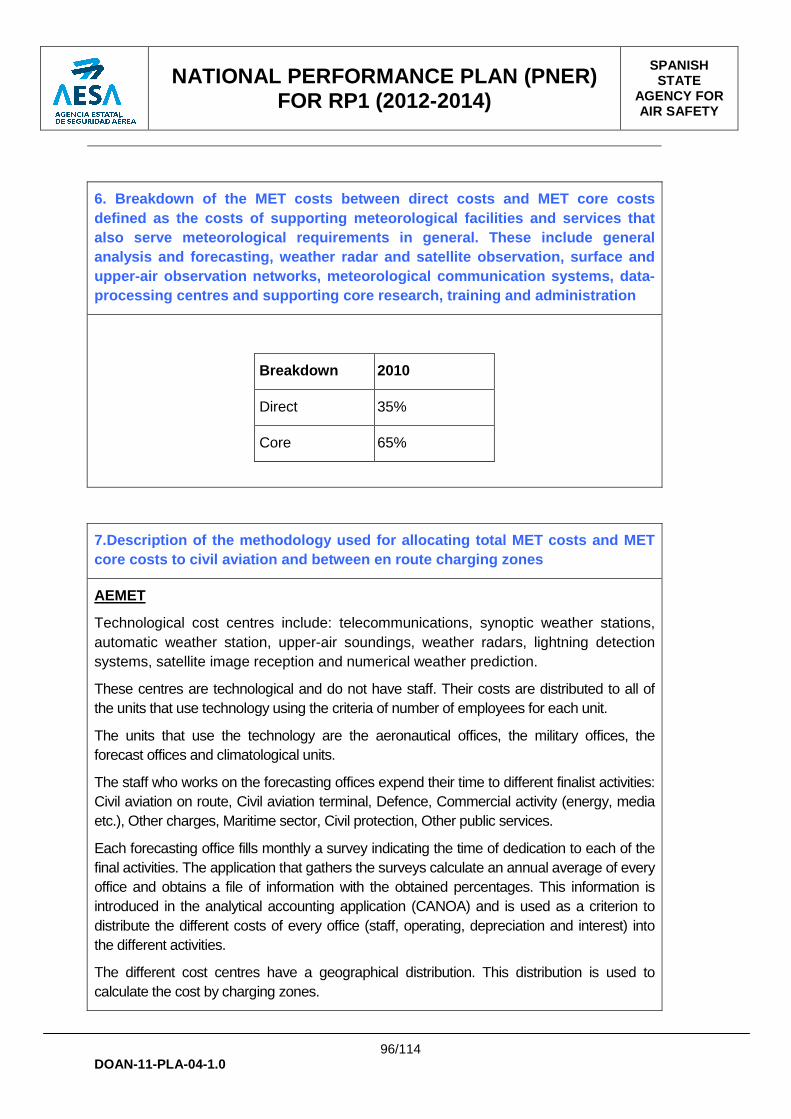
NATIONAL PERFORMANCE PLAN (PNER) FOR RP1 (2012-2014)
SPANISH STATE
AGENCY FOR AIR SAFETY
96/114
DOAN-11-PLA-04-1.0
6. Breakdown of the MET costs between direct costs and MET core costs defined as the costs of supporting meteorological f acilities and services that also serve meteorological requirements in general. These include general analysis and forecasting, weather radar and satelli te observation, surface and upper-air observation networks, meteorological comm unication systems, data-processing centres and supporting core research, tr aining and administration
Breakdown 2010
Direct 35%
Core 65%
7.Description of the methodology used for allocatin g total MET costs and MET core costs to civil aviation and between en route c harging zones
AEMET
Technological cost centres include: telecommunications, synoptic weather stations, automatic weather station, upper-air soundings, weather radars, lightning detection systems, satellite image reception and numerical weather prediction.
These centres are technological and do not have staff. Their costs are distributed to all of the units that use technology using the criteria of number of employees for each unit.
The units that use the technology are the aeronautical offices, the military offices, the forecast offices and climatological units.
The staff who works on the forecasting offices expend their time to different finalist activities: Civil aviation on route, Civil aviation terminal, Defence, Commercial activity (energy, media etc.), Other charges, Maritime sector, Civil protection, Other public services.
Each forecasting office fills monthly a survey indicating the time of dedication to each of the final activities. The application that gathers the surveys calculate an annual average of every office and obtains a file of information with the obtained percentages. This information is introduced in the analytical accounting application (CANOA) and is used as a criterion to distribute the different costs of every office (staff, operating, depreciation and interest) into the different activities.
The different cost centres have a geographical distribution. This distribution is used to calculate the cost by charging zones.

NATIONAL PERFORMANCE PLAN (PNER) FOR RP1 (2012-2014)
SPANISH STATE
AGENCY FOR AIR SAFETY
97/114
DOAN-11-PLA-04-1.0
ANSMET
Not applicable (first part of the question).
As for the allocation of costs between the two en route charging zones (Continental Spain and Canary Islands) the percentages obtained by the MET provider when computing their own costs are used as a reference.
This seems to be the more practical and efficient rule to allocate supervision costs, mainly produced by staff salaries and external services costs.
8. Eighteen months before the start of a reference period, description of the reported forecast costs and traffic
AENA
2010 en-route costs show a decrease above 17% (around 135 million Euros) compared with 2009 en-route costs. The reduction in costs results principally from a lower staff cost of around 25% together with an 8% reduction on other operating costs. The cost of capital has been calculated with a WACC of 4.96%.
Compared with November 2010 data submission, the 2010 figures show a reduction of 3.6%, with similar percentages for the main cost categories, and a reduction exceeding 16% when compared with November 2009 data.
The category of exceptional costs includes the amount derived from the impact of the adaptation to the IAS. As reported in previous submissions, the IAS impact has been allocated to the cost bases in 15 years, from year 2008. In 2010, after the new agreement with ATC staff and the actuarial assessment, an excess in the provision has been estimated (42 million €) then, the annual pending amounts have been reduced for 2010 and the remaining years.
Total 2011 en- route costs are slightly higher, around 1.5%, compared to 2010. With regard to the concepts of personal and operating expenses, the amounts are lower than those of 2010, while some increases are estimated in depreciation and cost of capital.
The WACC used to calculate the cost of capital is 5.49%, and the increase compared to 2010 is mainly due to the estimated increase in the weight of the average equity in the funding structure.
Compared to the last estimate available, November 2010 data submission, show a reduction of 2.3%. The decrease in staff costs, around -4% (17 €million), can be highlighted, while the rest of changes in data, more or less, compensate one another.
NATIONAL PERFORMANCE PLAN (PNER) FOR RP1 (2012-2014)
SPANISH STATE
AGENCY FOR AIR SAFETY
98/114
DOAN-11-PLA-04-1.0
The determined costs for years 2012 to 2014 reflect the available estimates with regard to the changes relating to the process of liberalization of aerodrome control service and the new organizational model in Aena, with the creation of Aena Aeropuertos SA as the airport operator.
It has to be highlighted that the costs data do not take into account the possible economic effects related to future process of aerodrome control liberalization, but just those with regard to the one currently ongoing (13 control towers). The mentioned economic effects associated to new process of liberalization will need to be considered as non controllable costs.
The evolution of en route costs in the first reference period (RP1) present, moderate annual variations which, in average, slightly exceed 2.5%.
- Operating costs
The figures correspond to the latest Air Navigation Long Term Plan, which includes the implementation of an austerity policy, being the amount in 2014 similar to 2010.
- Staff costs
Concerning the ATC staff collective, the data respond to the estimates derived from the measures taken by the Government through the law 9/2010 and the new Collective agreement with effects until year 2013.
The evolution takes into account the liberalization of aerodrome control service in 13 control towers, initiated in 2011. We emphasize that the data do not contain elements relating to other possible processes of liberalization that the State / Government could decide in the future and will need to be considered as non controllable costs.
For the rest of personnel, the figures respond to the planned staff evolution and the adoption of the present collective agreement considering the minimum approved wage increases for the Public Sector.
The overall increase in 2014/2010, in nominal terms, is only 4%. - Depreciation Costs
The forecasts reflect the expected assets evolution, as well as the future Investment Plan that consider the effects of the new organizational model.
The regular practice is the implementation of measures on costs containment and the prioritization of investments through the analysis and selection of projects.
- Cost of Capital
The figures respond to the assets and middle and long term funding forecasts. The WACC applied through the period is around 7.8%.
The higher average rate is caused by the increased risk derived from the change to a system of risk sharing (business risk) but also from the increase in the 10-year bonds, currently around 5.3% (country risk, financial risk).
It is very important to highlight that from 2008, and due to the process of adaptation to the IAS, the recognition of the global amounts related to the pending adjustment mechanisms as contingent assets and its disappearance from the Balance sheet implied that no cost of capital has been applied to those amounts.
NATIONAL PERFORMANCE PLAN (PNER) FOR RP1 (2012-2014)
SPANISH STATE
AGENCY FOR AIR SAFETY
99/114
DOAN-11-PLA-04-1.0
Concerning the service units estimate , the forecast made by Aena for management purposes, is carried out based on analysis of temporary series, using models and ARIMA techniques.
The Eurocontrol estimates as well as other economic variables and factors, that affect the air transport sector, are also taken into consideration.
AEMET
Staff cost : The staff cost has increased in 2010 the 3% from 2009 due to the increase of the personal working at the airport offices in order to get the staff demanded by the Single European Sky Requirements. In 2011 and 2012 it is supposed and increased of 4% because it is planned the incorporation of new personal for aeronautical services for the same reason. In 2013 and 2104 it is supposed a light increase of 2%.
Operation cost : The operating cost has suffered a big increased in 2010 from 2009. This rise is due to the new maintenance contract of meteorological aeronautical stations, which has supposed more than 2 millions of Euros. From this year it is expected a stabilization with an increase between the 1 and 2%.
Depreciation cost : The Depreciation cost has increased in 2010 from 2009 due to the investment affecting to aeronautic service has increased more than expected. From 2010 a light increase is expected according to the investment.
Capital cost : The interest rate applied to the cost of capital is expected to rise from 2011 to 2014 from 4% to 4,5%, due to the tendency to the slight increase of the interest of the money.
ANSMET
Staff cost: The staff costs have decreased in 2010 with respect to 2009, due to a general salaries reduction for the whole Civil Service following the economic crisis, This reduction is foreseen to be continued by a small decrease in 2011 and by an stable situation for the rest of the reference period. No increase in staff numbers is foreseen for the period.
Operation cost: The operating costs decreased slightly in 2010 with respect to 2009 due to efficiency adjustments in the external services contracted. In 2011 a dramatic reduction in the costs of external services is planned, due to mandatory cost-containment measures for the public expenditures. This reduction is foreseen to be maintained for the rest of the reference period
Depreciation cost: No significant changes in the depreciation costs for the current office equipments and furniture foreseen for the reference period.
Capital cost: Not applicable
NATIONAL PERFORMANCE PLAN (PNER) FOR RP1 (2012-2014)
SPANISH STATE
AGENCY FOR AIR SAFETY
100/114
DOAN-11-PLA-04-1.0
EA (ANSP & NSA)
The estimated costs are based on data from the analytical accounting of the EA for 2010, as well as on specific actions planned for the reference period.
The variation in the estimation of costs for the reference period remains in similar terms to the expected development of the inflation.
AESA
Staff cost: The staff cost are expected to remain constant for period 2012 to 2014.
Operation cost: The staff cost are expected to remain constant for year 2012 and increase a 2% for year 2013 and another 2% for year 2014.
Depreciation cost: Depreciation costs are expected to remain constant for period 2012 to 2014.
Capital cost: Capital costs are expected to remain constant for period 2012 to 2014.
9. Every year of the reference period, description of the reported actual costs and their difference against the determined costs.
Not applicable

NATIONAL PERFORMANCE PLAN (PNER) FOR RP1 (2012-2014)
SPANISH STATE
AGENCY FOR AIR SAFETY
101/114
DOAN-11-PLA-04-1.0
Additional Information Table-2*
State: Spain Continental and Canary Island-Route Year: 2011
1.Description and rationale for the establishment o f the different en route charging zones
Spain en route charging zones correspond to the FIRs in the Multilateral Agreement and the Eurocontrol Conditions of Application:
• Continental Spain (Madrid and Barcelona Upper Flight Information Regions and Madrid and Barcelona Flight Information Regions) and
• Canaries (Islas Canarias Upper Flight Information Region and Islas Canarias Flight Information Region).
2.Description and explanation on the calculation of the forecast chargeable service units
The forecasts of service units’ evolution are carried out by Spain, through time series analysis and using ARIMA models and techniques.
Forecasts developed by Eurocontrol and other economic variables as well as different elements of the situation that may affect the transport sector are taken into account likewise.
3.Description of the policy on exemptions and a des cription of the financing means to cover the related costs
Not applicable.
4.Description of the income from other sources when they exist
It is expected to received income from other sources of 3,28 € million for 2011; 15,33 € million for 2012; 13,54 € million for 2013 and 9,73 € million for 2014.
5. Description and explanation of incentives applie d on air navigation service providers and, in particular, the modalities to be applied in setting regulatory conditions on the level of unit rates. Description and explanation of the

NATIONAL PERFORMANCE PLAN (PNER) FOR RP1 (2012-2014)
SPANISH STATE
AGENCY FOR AIR SAFETY
102/114
DOAN-11-PLA-04-1.0
objectives in terms of performance and on the modal ities to take them into account in the setting of maximum unit rates
Not applicable.
6. Description of the plans of air navigation servi ce providers in order to meet projected demand and performance objectives
AENA
AENA elaborates a Long Term Plan that includes all the aspects with a view to fulfil the anticipated demand and the strategic targets of the Organization. Among the diverse considered variables the following ones could be pointed out:
- Capacity
- Demand
- Traffic forecasts
- Economic variables
- Investment and project plans
- Projection of costs and revenues
AENA - Air navigation has developed a Business Plan for the period 2011-2015. This Business Plan defines the organizational objectives and performance indicators. We may highlight the objectives related to costs reduction, adaptation of capacity to demand and productivity improvements.
EA (ANSP & NSA)
In the particular case of SAR, investments are performed in the current fleet, in order to maintain its operational capacities, to extend the life of existing aircraft.
In the rest of services, the demand for services to the Spanish Air Force will remain at current levels, so that the effort in resources is expected constant.
7.Description and explanation of incentives applied on users of en air navigation services
No incentives applied on users of en route services.

NATIONAL PERFORMANCE PLAN (PNER) FOR RP1 (2012-2014)
SPANISH STATE
AGENCY FOR AIR SAFETY
103/114
DOAN-11-PLA-04-1.0
8. Description of the carry-overs of over or under recoveries incurred by Member States up to the year 2011
With the actual data available, the overall estimate balance for year 2010 shows a positive result amounting to 179,15 € million, of which 164,42 € million corresponds to Continental Spain and 14,73 € million to Canaries.
However, and as result of the above described measures, a positive overall balance is expected for year 2011 estimated around 17,6€ million.
Te application of the carry-overs up to year 2011, will be applied: 32,9€ million for year 2012, 36,3 € million for year 2013 and 22,8 € million for year 2014.
9. Description of the under recoveries carried over of art. 11a (4) second subparagraph
Not applicable.
10. Description by factors of the amounts carried o ver from the previous reference period
Not applicable.
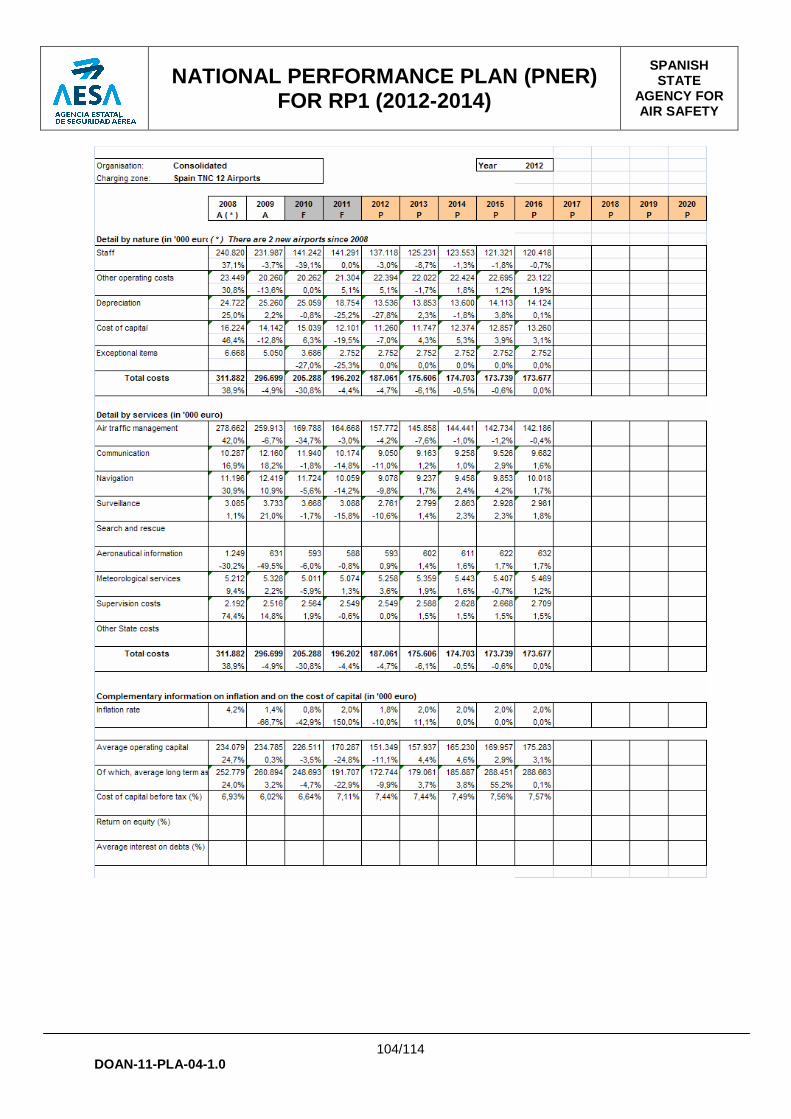
NATIONAL PERFORMANCE PLAN (PNER) FOR RP1 (2012-2014)
SPANISH STATE
AGENCY FOR AIR SAFETY
104/114
DOAN-11-PLA-04-1.0

NATIONAL PERFORMANCE PLAN (PNER) FOR RP1 (2012-2014)
SPANISH STATE
AGENCY FOR AIR SAFETY
105/114
DOAN-11-PLA-04-1.0

NATIONAL PERFORMANCE PLAN (PNER) FOR RP1 (2012-2014)
SPANISH STATE
AGENCY FOR AIR SAFETY
106/114
DOAN-11-PLA-04-1.0
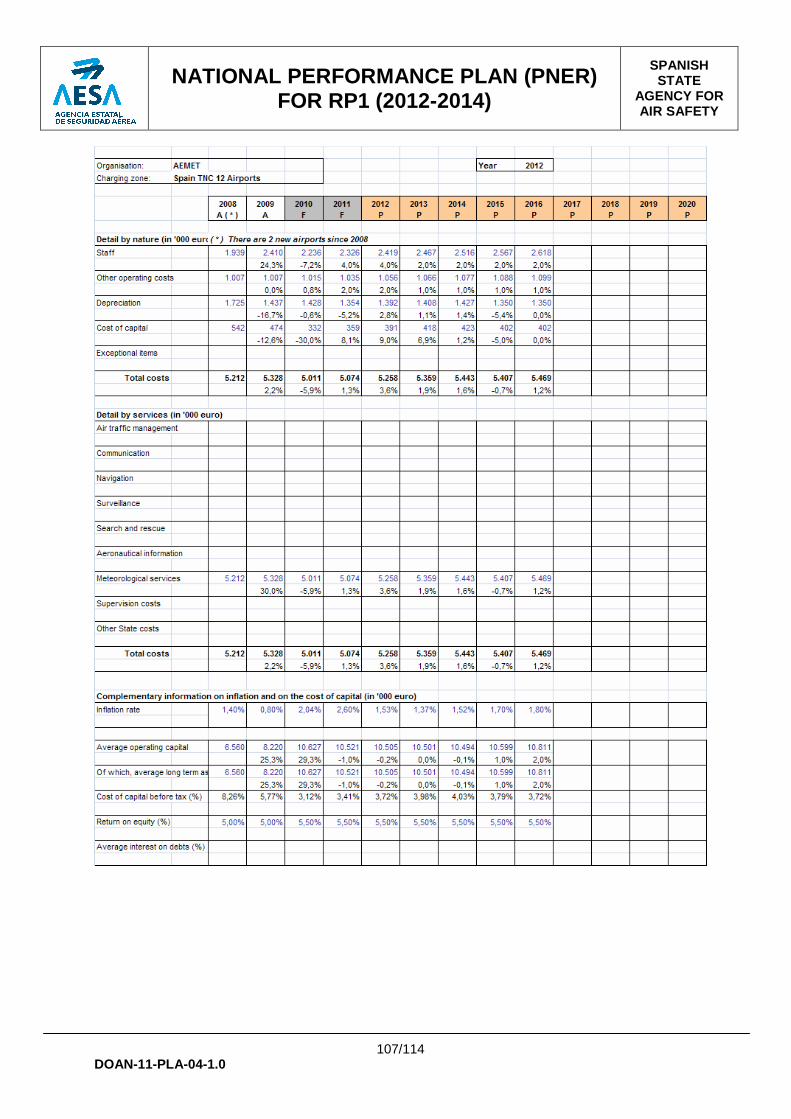
NATIONAL PERFORMANCE PLAN (PNER) FOR RP1 (2012-2014)
SPANISH STATE
AGENCY FOR AIR SAFETY
107/114
DOAN-11-PLA-04-1.0
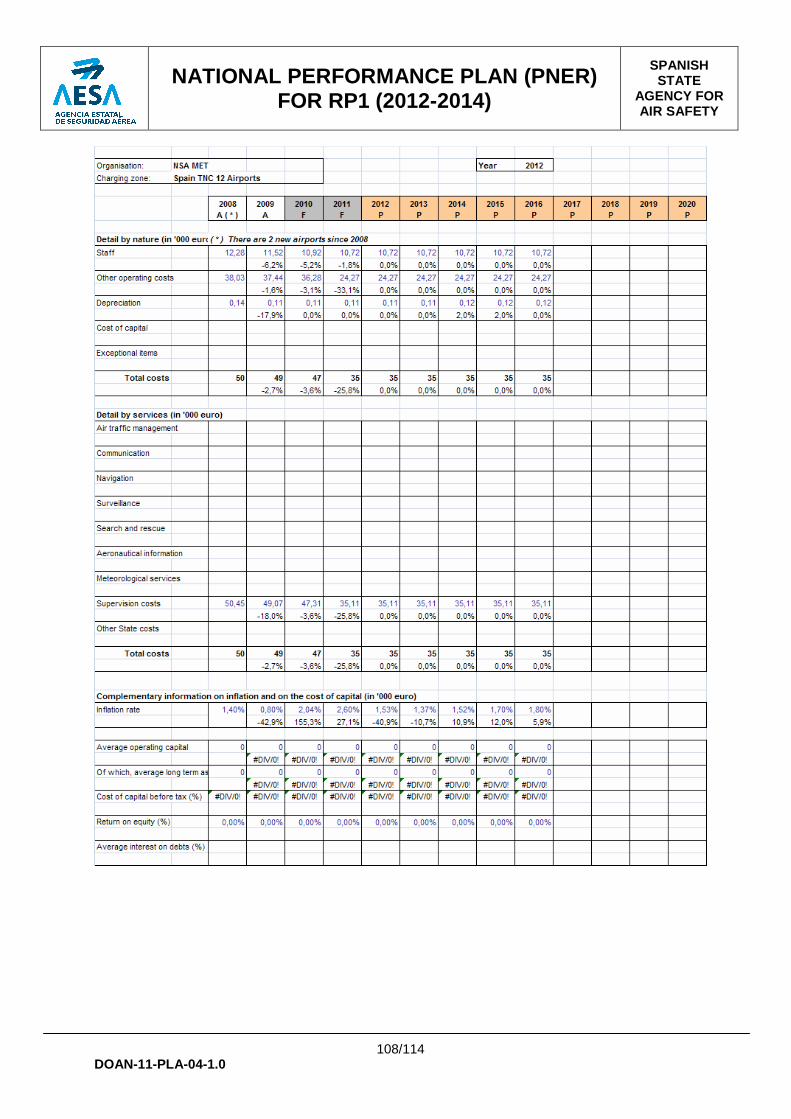
NATIONAL PERFORMANCE PLAN (PNER) FOR RP1 (2012-2014)
SPANISH STATE
AGENCY FOR AIR SAFETY
108/114
DOAN-11-PLA-04-1.0

NATIONAL PERFORMANCE PLAN (PNER) FOR RP1 (2012-2014)
SPANISH STATE
AGENCY FOR AIR SAFETY
109/114
DOAN-11-PLA-04-1.0

NATIONAL PERFORMANCE PLAN (PNER) FOR RP1 (2012-2014)
SPANISH STATE
AGENCY FOR AIR SAFETY
110/114
DOAN-11-PLA-04-1.0
Page intentionally left blank
NATIONAL PERFORMANCE PLAN (PNER) FOR RP1 (2012-2014)
SPANISH STATE
AGENCY FOR AIR SAFETY
111/114
DOAN-11-PLA-04-1.0
ANNEX B SPANISH STATE SAFETY PROGRAMME
FOR CIVIL AVIATION
NATIONAL PERFORMANCE PLAN (PNER) FOR RP1 (2012-2014)
SPANISH STATE
AGENCY FOR AIR SAFETY
112/114
DOAN-11-PLA-04-1.0
Spanish Law 1/2011, for the establishment of the Ci vil Aviation State Safety Programme Ley 1/2011, de 4 de marzo, por la que se establece el Programa Estatal de Seguridad Operacional para la Aviación Civil y se modifica la Ley 21/2003, de 7 de julio, de Seguridad Aérea
http://www.boe.es/boe/dias/2011/03/05/pdfs/BOE-A-2011-4116.pdf
The article 11 of this law actually gives birth to the Spanish State Safety Programme for Civil
Aviation under the name of PESO (Plan Estatal de Seguridad Operacional [para la Aviación Civil]), which is part of a new preventive approach in safety oversight, The PESO will allow the establishment of a State safety management system integrated by objectives, rules and activities to improve safety.. The framework for the development of the PESO is set fully in accordance with ICAO requirements and the European Union guidelines and embraces the new preventive approach to safety. In addition to article 11, articles 12 and 18 are devoted to safety information protection. Safety data flow is key to building the PESO, so the safety data and the whistleblower have to be conveniently protected by the law.
The law will be complemented by a Royal Decree that will regulate the following PESO aspects: � Aviation organizations involved in the PESO: their responsibilities, their accountabilities and the
coordination between them; � Service and product providers obliged by the PESO; � AESA’s role in the PESO; � Accountable executive role who will be appointed by Council of Ministers; � Procedure for preparing, processing, approving, promoting and reviewing the Programme AESA is the competent authority to coordinate the implementation and the execution of the PESO. Moreover, an Agreement of the Council of Ministers will complete the act and the planned Royal
Decree. This Agreement will establish: � Safety policy and objectives and � State Safety Programme Manual
In addition to the State Safety Programme Manual, AESA plans to elaborate a State Safety Plan for
Civil Aviation under the name of PASO (Plan de Acción de Seguridad Operacional [para la Aviación Civil]) that will identify at national level the critical safety areas. For these critical safety areas, State safety performance indicators and targets will be defined. The PASO will be complemented by the European Aviation Safety Plan elaborated by EASA that identifies at European level the critical safety areas.
Further to this, AESA, as National Supervisory Authority, will agree with the service providers their
safety performance indicators and their targets. As part of the continuous monitoring of the safety performance of the national industry, AESA will periodically supervise and assess the rate of achievement of the service providers against the safety performance targets to which they have committed within the framework of their safety management systems.
Finally, in order to reinforce and give a broad and encompassing initial momentum to the integration
of the “just culture” principles into the Spanish legal framework, the article of Spanish Law 1/2011 delving with the confidential nature of the information has under gone a modification (Spanish Law 7/2011)12 with the purpose of including the human factor (professional staff) into the stakeholders whose information is of a restricted nature and for technical investigation purposes only.
12 Ley 7/2011, de 11 de abril, por la que se modifican la Ley 41/1999, de 12 de noviembre, sobre sistemas de pagos y de liquidación de valores y el Real Decreto-ley 5/2005, de 11 de marzo, de reformas urgentes para el impulso a la productividad y para la mejora de la contratación pública (http://www.boe.es/boe/dias/2011/04/12/pdfs/BOE-A-2011-6549.pdf)
NATIONAL PERFORMANCE PLAN (PNER) FOR RP1 (2012-2014)
SPANISH STATE
AGENCY FOR AIR SAFETY
113/114
DOAN-11-PLA-04-1.0
ANNEX C PUBLIC CONSULTATION MATERIAL

NATIONAL PERFORMANCE PLAN (PNER) FOR RP1 (2012-2014)
SPANISH STATE
AGENCY FOR AIR SAFETY
114/114
DOAN-11-PLA-04-1.0
C.1. Format of the consultation A Draft for Stakeholder Consultation was issued on the 10th May and sent to all the stakeholders invited to the meeting honouring the request stated in Article 10.2.(b) of the Performance Regulation. Incidentally, this draft was also made available to the PRU for an initial health check for which AESA is very grateful. Also paying heed to the requests expressed by the airspace users and the derived recommendations issued by the European Commission during the 40th session of the Single Sky Committee (SSC/11/40/4), the meeting was held at Lisbon on May 31st and at FAB level between Portugal and Spain, founding members of the SW FAB as two back-to-back bilateral consultations involving successively Spain and Portugal. Therefore, invitations were sent on May 11 th by INAC to the stakeholders detailed in section C.2 on behalf of both NSAs. The invitation also indicated that AESA did foresee a written consultation period that would be starting on May 11 th and would end on the June 3 rd. To that end, AESA created dedicated comment sheet and an electronic mailbox ([email protected]) to which all comments that might arise during the consultation phase should be directed. A presentation was prepared by AESA to carry out a clear and thorough session, presentation which can be found in here: http://www.seguridadaerea.es/AESA/LANG_CASTELLANO/NAVEGACION/. It must be noted that the opportunity of this written consultation was not seized by the stakeholders but they did send their written comments on June 15 th in the form of a letter . C.2. List of stakeholders invited The list of stakeholders was directly derived from the suggestion made by the PRU13. Thus, the associations invited were: IACA , IATA , AEA , ERAA , ELFAA , EBAA and IAOPA .
13 http://www.eurocontrol.int/prc/gallery/content/public/Docs/List_%20airspace_users_consultations_16_March.pdf