PLAN FOR 100% RENEWABLE ENERGY SCENARIO IN KENYA BY …
98
EAST AFRICAN CIVIL SOCIETY FOR SUSTAINABLE ENERGY AND CLIMATE ACTION (EASE&CA) PLAN FOR 100% RENEWABLE ENERGY SCENARIO IN KENYA BY 2050 AUGUST 2020 Project Partners Prepared by: SusWATCH Kenya P.O.Box 7659- 40100. Kisumu, Kenya Tel: +254202584757 Website: suswatchkenya.org Supported by CISU
Transcript of PLAN FOR 100% RENEWABLE ENERGY SCENARIO IN KENYA BY …
EAST AFRICAN CIVIL SOCIETY FOR
SUSTAINABLE ENERGY AND CLIMATE
ACTION (EASE&CA)
PLAN FOR 100%
RENEWABLE ENERGY
SCENARIO IN KENYA BY
2050
AUGUST 2020
Project Partners
Prepared by: SusWATCH Kenya P.O.Box 7659- 40100. Kisumu, Kenya Tel: +254202584757 Website:
suswatchkenya.org
Supported by
CISU

Kenya’s 100% Renewable Energy Plan-2020 East African CSOs for Sustainable Energy and Climate Action (EASE-CA) Project Page 1
Table of Contents
ABBREVIATIONS AND ACRONYMS ........................................................... 4
EXECUTIVE SUMMARY ........................................................................ 5
1.0 INTRODUCTION .......................................................................... 6
1.1 Objective of the Study ................................................................. 7
1.2 Methodology of the study .............................................................. 8
2.0 ENERGY STATUS IN KENYA ............................................................. 9
2.1 ESTIMATED RENEWABLE ENERGY POTENTIAL ..................................... 12
2.1.1 Biogas ................................................................................. 12
2.1.2 Biomass ............................................................................... 12
2.1.3 Wind Power .......................................................................... 13
2.1.4 Solar Energy ......................................................................... 14
2.1.5 Geothermal energy potential ..................................................... 15
2.1.6 Hydroelectricity ..................................................................... 16
2.2 FUTURE ENERGY EFFICIENCY AND ENERGY DEMANDS............................ 16
2.2.1 Household cooking demands ...................................................... 17
2.2.2 Household light and electricity ................................................... 23
2.2.3 Service sector, cooking demand .................................................. 24
2.2.4 Service sector, light and electricity demand ................................... 25
2.2.5 Industry, fuel demand.............................................................. 26
2.2.6 Industry, electricity demand ...................................................... 26
2.2.7 Transport demands ................................................................. 27
2.2.8 Other demands ...................................................................... 30
2.2.9 Total Final Energy demand ........................................................ 31
3.0 THE SCENARIOS AND THE RENEWABLE ENERGY USE ............................. 34
3.1 Large-Scale Power Supply Options ................................................. 35
3.2 Development of wind power ......................................................... 40
3.3 Development of solar power ........................................................ 41
3.4 Development of geothermal power ................................................ 41
4.0 ENERGY BALANCES, CO2 EMISSIONS AND ECONOMY .............................. 43
4. 1 Electricity Sector ..................................................................... 43
4.2 Total, primary energy demand ...................................................... 44
Kenya’s 100% Renewable Energy Plan-2020 East African CSOs for Sustainable Energy and Climate Action (EASE-CA) Project Page 2
4.3. Biomass sustainability ............................................................... 45
4.4 CO2 emissions from Energy .......................................................... 46
4.5 Scenario Economies ................................................................... 47
5.0 ACTORS and RECOMMENDATIONS ................................................... 50
5.1 The Scenario actors ................................................................... 50
5.1.1 The working terrain ................................................................ 51
5.2 Policy Recommendations ............................................................. 52
REFERENCES ................................................................................. 55
Annex 1. Assumptions for the calculation of demands ............................... 57
A1.1 Demands for Cooking ................................................................ 57
A1.2. Biomass Demand Distribution on Sectors ....................................... 59
A1.3 Development of Final Energy Demand ........................................... 60
Annex 2.1 Development forecasts for Kenya .......................................... 61
Annex 3.1 Technology and energy cost forecasts ..................................... 64
Annex 4: Kenya Policy Frameworks ..................................................... 69
Annex 5 Official plans for Kenya ........................................................ 71
A5.1 Power development plans .......................................................... 71
A5.2 Actions in energy demand .......................................................... 76
ENERGY ACCESS IN KENYA ................................................................ 84
A6.1 Status summary ...................................................................... 84
A6.2 Gender and Energy……………………………………………………………………………………….….83
A6.3 Existing Plans/Strategies ........................................................... 87
A6.4 Clean Cooking ........................................................................ 90
A6.4.1 existing plans/strategies for clean cooking ................................... 90
A6.5 Existing Gaps ......................................................................... 90
A6.5.1 Universal Access - Electricity .................................................... 90
A6.5.2 Universal Access – Clean Cooking ................................................ 93
A6.6 High Impact Initiatives for Energy Access ....................................... 94
A6.6.1 Increasing Access to Modern Clean Cooking .................................. 94
A6.6.2 Increasing Access to Modern Electricity ....................................... 95
A6.7 Relevant High-Impact Opportunities ............................................. 96
Kenya’s 100% Renewable Energy Plan-2020 East African CSOs for Sustainable Energy and Climate Action (EASE-CA) Project Page 3
ACKNOWLEDGEMENT
Sustainable Environmental Development Watch (Suswatch) Kenya would like to thank its
fellow partners to the Project: The East African Civil Society for Sustainable Energy &
Climate Action - EASE &CA PROJECT namely: INFORSE, JEEP, Nordic Folkecenter for
Renewable Energy (NFRE), TaTEDO and Uganda Coalition for Sustainable Development
(UCSD) for the valuable comments and inputs to the draft report.
We are equally indebted to all the CSOs, Local and the National Government of Kenya
especially the Ministry of Energy, and Ministry of Environment and Forestry for actively participating in
providing us with the relevant information that informed the development of this report.
Finally, we thank the Danish Ministry of Foreign Affairs through CISU’s Civil Society Fund
that provided support that has enabled this report to be done as part of the EASE & CA
project.
August 2020
Authors:
Justus M. Munyoki,
Sustainable Environmental Development Watch Kenya
P.O. Box 7659- 40100.
Kisumu, Kenya
Tel: +254202584757
Gunnar Boye Olesen
INFORSE Secretariat
www.inforse.org
EASE-CA Project Partners are: UCSD, JEEP, SusWatch Kenya, TaTEDO, INFORSE &
INFORSE-East Africa, and Nordic Folkecenter for Renewable Energy.
The EASE-CA Project is supported by CISU’s Civil Society Fund, Denmark.
More on the EASE-CA Project: www.inforse.org/africa/EASE.htm

Kenya’s 100% Renewable Energy Plan-2020 East African CSOs for Sustainable Energy and Climate Action (EASE-CA) Project Page 4
ABBREVIATIONS AND ACRONYMS
BAU Business-As-Usual
CO2e Carbon Dioxide Equivalent
INFORSE International Network For Sustainable Renewable Energy
GESIP Green Economy Strategy and Implementation Plan
GHG Green House Gas
CCAK Clean Cook stove Alliance of Kenya
GW Gigawatt
MtCO2e Metric tons of Carbon dioxide equivalent
ME&F Ministry of Environment and Forestry
MEP Ministry of Energy and Petroleum
MW Megawatt
MRV Measuring, Reporting and Verification
NCCAP National Climate Change Action Plan
NDC Nationally Determined Contribution
PA Paris Agreement
SDGs Sustainable Development Goals
KOSAP Kenya off-Grid Solar Access Project
UNDP United Nations Development Programme
GPOBA Global Partnership of Output Based Aid
LMCP Last Mile Connectivity Programme
NES National Electrification Strategy
KenGen Kenya Electricity Generation Company

Kenya’s 100% Renewable Energy Plan-2020 East African CSOs for Sustainable Energy and Climate Action (EASE-CA) Project Page 5
EXECUTIVE SUMMARY
This report gives an overview of the Kenyan situation regarding energy supply and
demand , and presents a scenario for how Kenya can move into a 100% renewable energy
economy until 2050 and at the same time move from a lower middle income country into
an upper middle income country as well as reduce biomass use for energy to sustainable
levels. Kenya has vast potentials for renewable energy and has been ranked fifth globally
in an annual Bloomberg index measuring investments and opportunities in clean energy,
two facts that together give a good basis for realizing a development as described in the
100% renewable energy scenario in this report.
The report focuses on how to supply the energy for Kenya’s development with renewable
energy and how to Increase energy use with modern, energy efficient technologies. In
addition to the scenario for transition to 100% renewable energy, the report also includes
a business as usual scenario for how Kenya might develop without focus on renewable
energy. A comparison of the cost of energy supply of the two scenarios shows an
economic benefit of the renewable energy scenario.
The report explains specific proposals that lead to 100% renewable energy development.
The results include strongly increased electricity production from renewables, the change
of the total primary energy demand to 100% renewables, reduction of biomass use to be
within sustainable levels of biomass production in Kenya, reduced emissions of CO2, and
estimates of costs of energy supply in the scenarios in 2030 and 2050. The most important
specific proposals are:-
Change to more efficient cooking, including efficient electric cooking and new
highly efficient wood and charcoal stoves
Change of transport gradually to electricity, hydrogen and new fuels (electrofuels)
Make charcoal production much more efficient, increase conversion efficiency
from wood to charcoal from around 10% today to 25%
Expand windpower to 9,000 MWe
Expand solar power to 17,000 MWe
Expand geothermal power to 5,600 MWe
Expand electric international interconnectors to 3,000 MWe capacity
Use biomass power plants to balance demand and supply, in addition to existing
hydro power
Further, the report presents the current situation and current official plans, including
energy-related parts of Kenya’s climate plans and NDC.

Kenya’s 100% Renewable Energy Plan-2020 East African CSOs for Sustainable Energy and Climate Action (EASE-CA) Project Page 6
CHAPTER ONE
1.0 INTRODUCTION
Throughout the industrial era, mankind has used fossil fuels to meet his energy
requirements. Coal, oil and natural gas have lit homes and powered machinery for more
than two centuries, driving civilization forward. But as human development accelerated,
the unsustainability of energy became apparent. Global fuel supplies deteriorated, the
atmosphere became more polluted, and climate started to change. The search for
renewable sources of energy began, to ensure a sustainable future.
Today, our civilization stands at a critical juncture. We are on the cusp of adopting clean
energy at a scale never seen before. But for renewable power to continue its rapid
advancement, the right decisions need to be taken.
When clean energy first made headway in the global scenario, questions were raised
about how stable and scalable it was. At a macro level, unstable policies for powering
future growth compromised development while costs for some renewable energy
technologies, as solar power, were very high. Nevertheless, clean energy installations
continued to grow, albeit slowly, until a dramatic leap a few years ago.
Today, a fifth of the world’s electricity is produced by renewable energy. In 2016, there
were 160 GW of clean energy installations globally. This is 10% more than in 2015, but
they cost almost a quarter less. New solar power gave the biggest boost, providing half of
all new capacity, followed by wind power, which provided a third, and hydropower,
which gave 15%. It was the first year in history that added solar capacity outstripped any
other electricity-producing technology. Several countries have set steep capacity
installation targets over the next 10 to 15 years, following the climate COP21.
Energy is the lifeblood of all societies. But the production of energy from the burning of
fossil fuels produces carbon dioxide emissions that are released into the atmosphere on a
grand scale. The energy sector accounts for more than 70% of these emissions, which are
driving climate change worldwide. Reducing CO2 emissions from the energy sector has a
direct and positive impact on climate protection. So there needs to be a transition from
the current energy system that relies heavily on fossil fuels to a system that uses
renewable energy sources that do not emit carbon, such as wind and solar. Also the use
of biomass must be limited to be within the sustainable limits.

Kenya’s 100% Renewable Energy Plan-2020 East African CSOs for Sustainable Energy and Climate Action (EASE-CA) Project Page 7
Provision of clean and sustainable energy is essential for the realization of Kenya’s Vision
2030 and the Big Four and is considered as one of the infrastructure enablers of the socio-
economic pillar of the Vision. The 2015 Energy and Petroleum Policy indicate that rapid
growth in Kenya’s economy over the past decade is partly attributed to increased
investment in the energy sector, particularly in the electricity sub-sector. The
government’s four key pillars of economic growth and the Big Four manufacturing priority
are energy-driven. Further, the development of renewable energy technologies
represents a major opportunity for “Growth of green industry in manufacturing” in
Kenya.
Kenya has been ranked fifth globally in an annual Bloomberg index measuring investments
and opportunities in clean energy, underlining the country’s position as the Centre of
renewable energy in Africa. The Bloomberg NEF (BNEF) latest Climate scope report says
that Kenya’s rise for the first time in the global top five has been backed by the higher
contribution of solar, wind and geothermal capacity into the energy mix. These three
now account for up to 65 percent of the country’s energy sources. This can be a major
sector of industrial growth in Kenya if it can position itself to be a regional technology
hub, whilst in the same regard, it can also be a significant missed opportunity, if not
pursued.
1.1 Objective of the Study
The overall objectives of this study is to formulate a 100% renewable energy scenario and
plan until 2050 for Kenya and analyse the cost of the plan in comparison with a
development with less focus on renewable energy, a business as usual scenario. In order
to realise that in a comprehensive manner, the report shall also
Assess the current national energy situation,
Assess the renewable energy and energy efficiency potentials,
Assess the future demands with a continued economic growth in Kenya
Compare renewable energy power solutions with non-renewable power solutions, including coal power and nuclear power
Kenya’s 100% Renewable Energy Plan-2020 East African CSOs for Sustainable Energy and Climate Action (EASE-CA) Project Page 8
1.2 Methodology of the study
The study was conducted via literature review, data collection and energy modeling. The
literature review involved available written national information such as reports, policy,
strategies, plans, papers and others. As well as the incorporation of the key informants
Interviews with government ministries, agencies, academia, private sectors and CSOs.
The energy modeling included the use of INFORSE’s spreadsheet model for development
of energy balances 2000 – 2050 and the Energy Plan model with analysis of variations hour
by hour of energy flows and of costs for the years 2030 and 2050.
Kenya’s 100% Renewable Energy Plan-2020 East African CSOs for Sustainable Energy and Climate Action (EASE-CA) Project Page 9
CHAPTER TWO
2.0 ENERGY STATUS IN KENYA
The energy sector in Kenya is largely dominated by biomass (68% of the national energy
consumption), electricity (9%) and imported petroleum (21%), with biomass (wood fuel,
charcoal, and agricultural waste) providing the basic cooking and heating energy needs of
the rural communities, urban poor and the informal sector. Indigenous energy production
in Kenya is biomass (wood and agricultural waste), and electricity produced from
hydropower, geothermal and other renewables (wind, biomass and solar). This is
complemented by imported electricity, coal, crude oil and oil products.
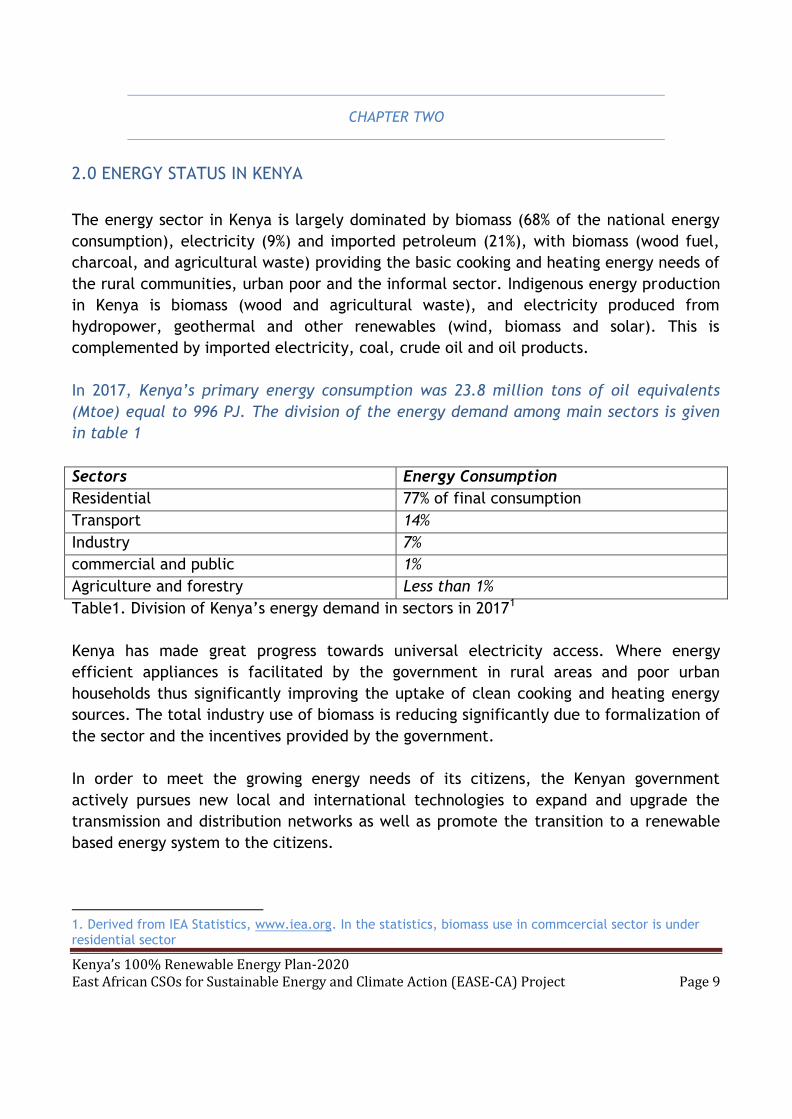
In 2017, Kenya’s primary energy consumption was 23.8 million tons of oil equivalents
(Mtoe) equal to 996 PJ. The division of the energy demand among main sectors is given
in table 1
Sectors Energy Consumption
Residential 77% of final consumption
Transport 14%
Industry 7%
commercial and public 1%
Agriculture and forestry Less than 1%
Table1. Division of Kenya’s energy demand in sectors in 20171
Kenya has made great progress towards universal electricity access. Where energy
efficient appliances is facilitated by the government in rural areas and poor urban
households thus significantly improving the uptake of clean cooking and heating energy
sources. The total industry use of biomass is reducing significantly due to formalization of
the sector and the incentives provided by the government.
In order to meet the growing energy needs of its citizens, the Kenyan government
actively pursues new local and international technologies to expand and upgrade the
transmission and distribution networks as well as promote the transition to a renewable
based energy system to the citizens.
1. Derived from IEA Statistics, www.iea.org. In the statistics, biomass use in commcercial sector is under residential sector

Kenya’s 100% Renewable Energy Plan-2020 East African CSOs for Sustainable Energy and Climate Action (EASE-CA) Project Page 10
The deliberate policies and government’s massive investment in the development of
renewable sources of energy, such as geothermal, solar and wind among others, ensure
the greening of Kenya’s energy significantly, decreasing greenhouse gas emissions by
2030, compared with a business as usual (BAU) development.
The Government of Kenya is focused on sustaining a stable investment climate for
private-sector expanding transmission and distribution networks to deliver power to
customers, maintaining a creditworthy off-taker, maintaining cost-reflective tariffs, and
reducing inefficiency in the sector to support more affordable end-user tariffs.
Status 2019
Electrification
In 2019, 75% of Kenyans had access to electricity (according to Eng. Stephen Nzioka;
Directorate of Renewable Energy, Ministry of Energy of Kenya, 2019). The number of
connected households tripled from 2.3 million in 2013 to 6.9 million in 2018. This has
been achieved through a range of interventions by the government in collaboration with
development partners.
These interventions include:-
• Last Mile Connectivity Programme (LMCP)
• Electrification of all public primary schools
• Global Partnership of Output Based Aid (GPOBA)
• Rural Electrification Programme (REP)
• Kenya off-Grid Solar Access (KOSAP)
Kenya is poised to attain universal access to electricity by 2022. In December 2018, the
National Electrification Strategy (NES) was launched to drive the country towards
universal access by 2022, using both grid and off-grid solutions.
The NES envisages that:-
• 2.7 million Grid connections will be made through grid densification and
intensification.
• Further 270,000 connections will be made through grid expansion within 15 km of
the KPLC distribution system.
• Some 34,000 connections will be made through 121 new solar mini-grids to serve
housing clusters too far away from the network or too small to be connected to the
national grid; and
• About 1.9 million connections will be made through standalone solar systems.

Kenya’s 100% Renewable Energy Plan-2020 East African CSOs for Sustainable Energy and Climate Action (EASE-CA) Project Page 11
The government has initiated the Kenya Off-grid Solar Access Project (KOSAP) for
electrification of institutions far from grid using solar PV systems. An estimated 200,000
rural households in Kenya have solar home systems and annual PV sales in Kenya are
between 25,000-30,000 PV modules. In comparison, the Kenya’s Rural Electrification
Fund, which costs all electricity consumers 5% of the value of their monthly electricity
consumption (currently an estimated 16 million US$ annually), is responsible for 70,000
connections. With access to loans and fee-for-service arrangements, estimates suggest
that the Solar Housing Systems (SHS) market could reach up to 50% or more of un-
electrified rural homes. There are about 4 million households in rural Kenya alone which
present a vast potential for this virtually untapped technology.
Cleaner cooking
Kenya has an ambitious target of achieving 100% access to modern cooking services
by 2030, including efficient cook stoves for wood and charcoal, household biogas,
LPG stoves, and others.
Government is running the development and promotion of efficient cook stoves for
households and institutions.
Government is collaborating with Clean Cook stove Alliance of Kenya (CCAK) to
promote the development and dissemination of efficient cook stoves.
A clean cooking component of the Kenya off-grid Solar Access project (KOSAP)
seeks to disseminate 150,000 efficient cook stoves for households in selected 14
under-served counties.
Cleaner cooking is an important parts of Kenya’s climate plans and is included in
the Kenya’s National Determined Contributions (NDC) to the UNFCCC Paris
Agreement (see details in Annex 5.2).
Renewables
Renewable energy currently accounts for 70% of the installed power capacity
including large hydro-power. It accounts for more than 70% of the power
generation, but production varies from year to year with hydropower production
that is low in dry years.
Government is supporting a Solar PV electrification of public institutions, including
health facilities. So far, 1,500 institutions have been electrified.
Under the Feed-in-Tariff (FiT) policy, 278 renewable energy projects with a
combined capacity of over 4.7 Gigawatts have been approved and are at various
stages of implementation. This includes wind power, geothermal power, and solar
PV power projects.
Kenya’s 100% Renewable Energy Plan-2020 East African CSOs for Sustainable Energy and Climate Action (EASE-CA) Project Page 12
Kenya recently commissioned three renewable power projects: 310 MW wind (Lake Turkana wind power project), 100 MW Kipeto (Kajiado) and 51 MW solar (Garissa).
Kenya with support from the World Bank is implementing the above-mentioned KOSAP
project which targets to provide clean energy access to 14 under-served counties with
renewable energy (solar home systems and clean biomass-based cooking solutions).
2.1 ESTIMATED RENEWABLE ENERGY POTENTIAL
Kenya has promising potential for power generation from renewable energy sources.
Abundant solar, hydro, wind, biomass and geothermal resources which has led the
government to seek the expansion of renewable energy generation to both urban and
rural areas. Currently, the government has prioritized the development of geothermal
and wind energy plants as well as solar-fed mini-grids for rural electrification.
2.1.1 Biogas
Biogas potential in Kenya has been identified in municipal waste, sisal and coffee
production. The total electric capacity potential of all sources ranges from 29 to-131MW,
generating 202 to 1,045GWh, which is about 1.3% to 5.9% of the total electricity
purchased from the system. Biogas can also replace firewood and charcoal for cooking,
which is mostly done with small-scale biogas plants. Biogas plants, including small plants
for cooking, are included in Kenyan climate plans with up to 500,000 biogas stoves in
operation by 20302. Based on this, a conservative estimate of the biogas potential from
wet biomass /as manure, wet organic waste) that has little value as direct fuel, is 16-20
PJ.
2.1.2 Biomass
Biomass fuels are the predominant source of primary energy in Kenya with wood-fuel
(firewood and charcoal) and agricultural residues accounting for about 68% of the total
primary energy consumption. About 55% of this is derived from farmlands in the form of
woody biomass as well as crop residue and animal waste and the remaining 45% is derived
from forests. In 2017 the consumption was 724 PJ. The sustainable potential of solid
biomass has been estimated to 15 million tons per year, equal to 243 PJ with an expected
energy content of 4.5 kWh/ton. With current official plans for energy forest plantations
of 4.1 million ha (41,000 km2), the potential will be increased. We conservatively
2 As part of plans for development and distribution of 1.5 million clean energy stoves in Kenya’s National Climate Change Action Plan 2018 - 2020, Vol 3: Mitigation Technical Analysis Report see http://www.lse.ac.uk/GranthamInstitute/wp-content/uploads/2018/10/8737_vol3.pdf

Kenya’s 100% Renewable Energy Plan-2020 East African CSOs for Sustainable Energy and Climate Action (EASE-CA) Project Page 13
estimate the increase to be at least 35 PJ, giving a total sustainable potential of 278 PJ.
If the liquid biofuels and biogas is added, the total, sustainable potential is around 300
PJ, with a conservative estimate of the biogas potential. 2010
2.1.3 Wind Power
Kenya has promising wind power potential. In the windiest areas, where the annual
capacity factor (CF) for wind turbines will be above 40%, the potential wind power
production is estimated to 1,739 TWh/year. In areas with CF> 30%, the potential
production is estimated to 4,446 TWh/year while if all areas with CF > 20% are included,
the potential production is estimated to an impressive 22,476 TWh/year3.
Presently, the Lake Turkana Wind Power Project (LTWP) and the Ngong Hills Wind Power
Project are the only wind farms that are connected to the national grid, with capacities
of 310 MW and 25.5 MW respectively. The LTWP is the largest wind power plant in Africa
having achieved full commercial operation in March 2019. Kipeto project (Kajiado) will be
second largest wind power project in Kenya. The project will supply 100MW of clean
energy to the national grid as a significant contribution to Kenya's Vision 2030 and Big
Four Agenda. The government of Kenya has estimated that 2 GW of wind capacity will be
installed in Kenya by 2030.
Rift Valley has the two large windiest areas (average wind speeds above 9 m/s at 50 m
high). The coast is also a place of interest though the wind resource is lower (average
wind speeds about 5-7 m/s at 50 m high). About 25% of the country is compatible with
current wind technology.
Some 80-100 small wind turbines (0.4 – 6 kW) have been installed to date, often as part
of a Photovoltaic (PV)-Wind hybrid system with battery storage.
For this scenario, we will consider a potential of 500 GW wind power with an average
capacity factor of 40%, equal to 3500 full load hours (with 3500 full load hours, each kW
of wind power will produce 3500 kWh electricity /year). The 500 GW can then produce
1740 TWh electricity/year (6300 PJ/year).
3 Wind data from JRC Technical Report “Energy projections for African countries”, Publications Office of the European Union, Luxembourg, 2019, ISBN 978-92-76-12391-0, https://publications.jrc.ec.europa.eu/repository/bitstream/JRC118432/jrc118432_jrc118432_reviewed_by_ipo.pdf

Kenya’s 100% Renewable Energy Plan-2020 East African CSOs for Sustainable Energy and Climate Action (EASE-CA) Project Page 14
Source:
UNEP:
Kenya
Country
Report
2.1.4 Solar Energy
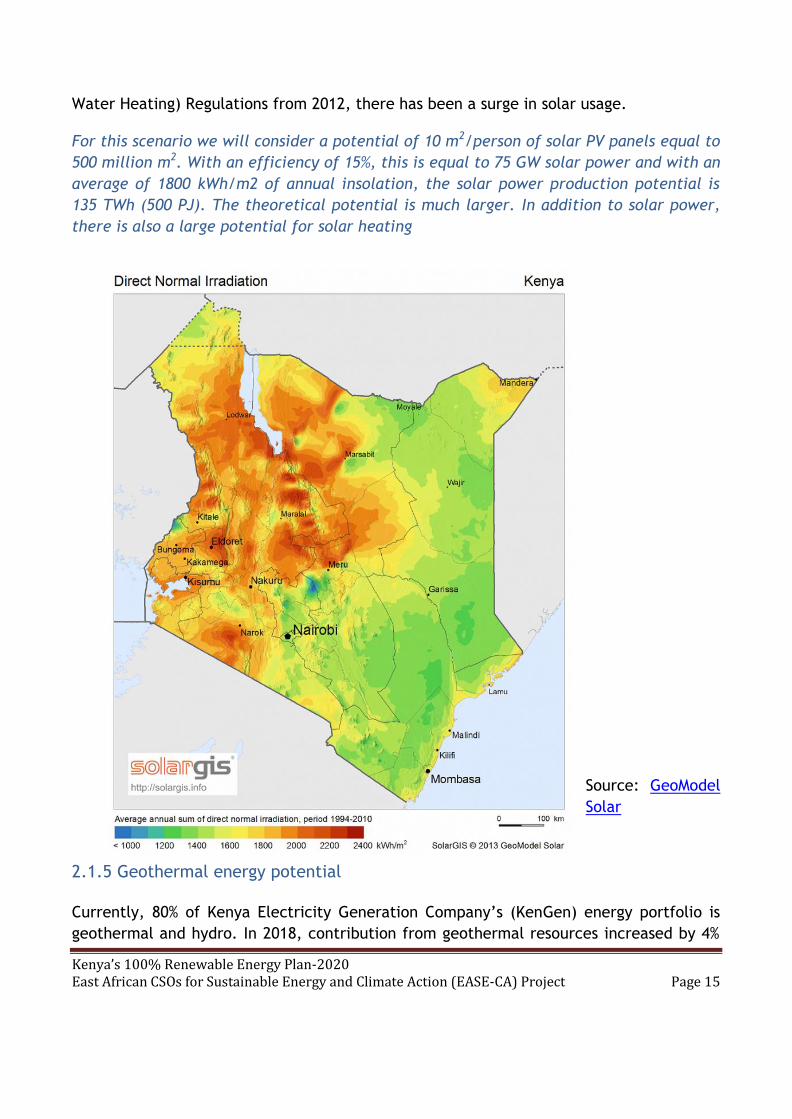
Kenya has great potential for the use of solar energy throughout the year because of its
location near the equator with 4-6kWh/m2/day of insolation. Following the Energy (Solar
Kenya’s 100% Renewable Energy Plan-2020 East African CSOs for Sustainable Energy and Climate Action (EASE-CA) Project Page 15
Water Heating) Regulations from 2012, there has been a surge in solar usage.
For this scenario we will consider a potential of 10 m2/person of solar PV panels equal to
500 million m2. With an efficiency of 15%, this is equal to 75 GW solar power and with an
average of 1800 kWh/m2 of annual insolation, the solar power production potential is
135 TWh (500 PJ). The theoretical potential is much larger. In addition to solar power,
there is also a large potential for solar heating
Source: GeoModel
Solar
2.1.5 Geothermal energy potential
Currently, 80% of Kenya Electricity Generation Company’s (KenGen) energy portfolio is
geothermal and hydro. In 2018, contribution from geothermal resources increased by 4%

Kenya’s 100% Renewable Energy Plan-2020 East African CSOs for Sustainable Energy and Climate Action (EASE-CA) Project Page 16
to 47% of the total energy purchased byKP , easing overreliance on hydropower
generation and mitigating increase in electricity costs by minimizing dispatch of
expensive thermal power.
Kenya is endowed with geothermal resources, mainly in the Rift Valley. Geothermal and
wind energy have comparably low electricity production costs. Conservative estimates
suggest geothermal potential in the Kenyan Rift Valley at 2,000 MW, whereas the total
national potential is put at between 7,000 and 10,000 MW.
For this scenario, we will use a potential of 8500 MW, which with 95% capacity factor4
gives a production potential of 66 TWh.
2.1.6 Hydroelectricity
Kenya has a well-developed hydro power sector with installed capacity of 823 MW and a
capacity in the dams of 730 GWh. In 2017 the hydro power production was 4.45 TWh
Plans for expansion of hydropower until 2030 are 300 MW of small hydro.
The Kenyan Government is strongly pushing for a shift to other alternative resources of
electricity generation because of the unforeseeable variations of hydro-power between
wet and dry years.
Kenya has an estimated hydropower potential of up to 6,000 MW comprising large hydro
(sites with capacity of more than 10MW)5 and also a potential of small hydro, but several
of the potential some sites are expensive to develop and/or development of hydro power
at the sites have considerable environmental issues.
For this scenario we include the existing hydro power capacity and 300 MW planned
expansion of small hydro.
2.2 FUTURE ENERGY EFFICIENCY AND ENERGY DEMANDS
4 According to Energypedia fossil fuel power generation capacity (oil-fired) was 32.5% of total capacity,
cited in 2018 in https://www.standardmedia.co.ke/article/2001290115/fact-checker-just-how-much-is-
kenya-s-electricity-capacity.
5 National Energy Policy October 2018.pdf
https://kplc.co.ke/img/full/BL4PdOqKtxFT_National%20Energy%20Policy%20October%20%202018.pdf
Kenya’s 100% Renewable Energy Plan-2020 East African CSOs for Sustainable Energy and Climate Action (EASE-CA) Project Page 17
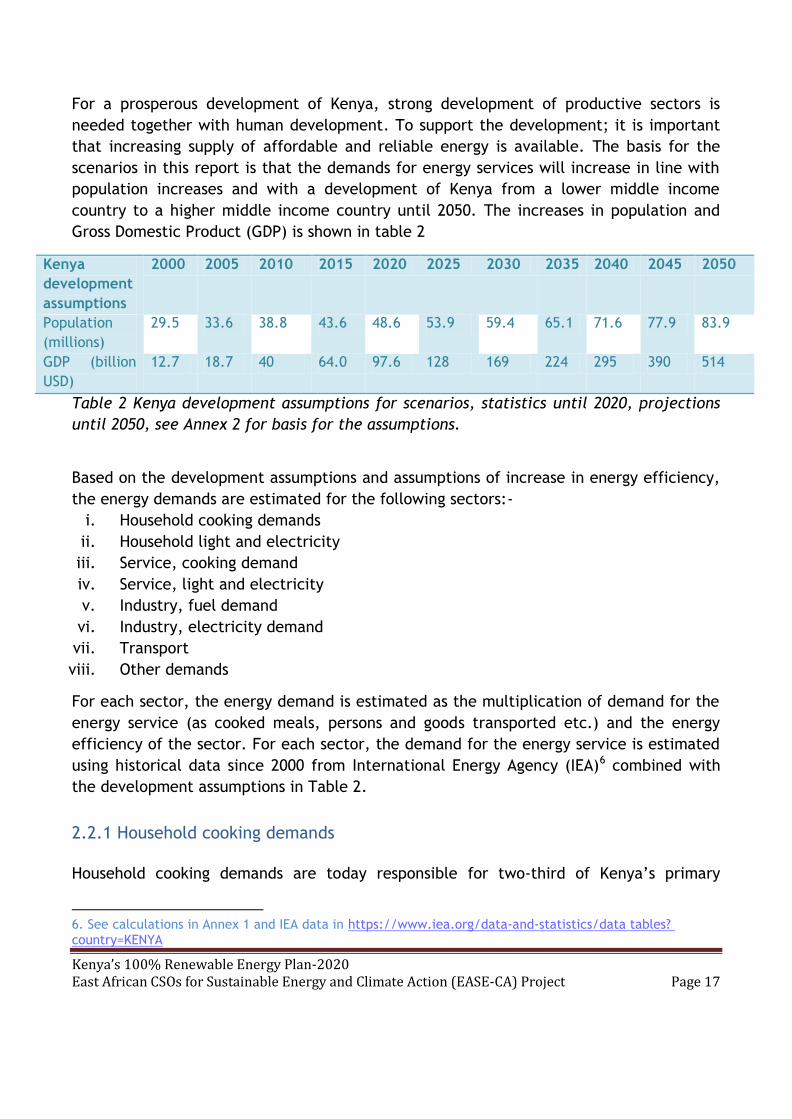
For a prosperous development of Kenya, strong development of productive sectors is
needed together with human development. To support the development; it is important
that increasing supply of affordable and reliable energy is available. The basis for the
scenarios in this report is that the demands for energy services will increase in line with
population increases and with a development of Kenya from a lower middle income
country to a higher middle income country until 2050. The increases in population and
Gross Domestic Product (GDP) is shown in table 2
Kenya
development
assumptions
2000 2005 2010 2015 2020 2025 2030 2035 2040 2045 2050
Population
(millions)
29.5 33.6 38.8 43.6 48.6 53.9 59.4 65.1 71.6 77.9 83.9
GDP (billion
USD)
12.7 18.7 40 64.0 97.6 128 169 224 295 390 514
Table 2 Kenya development assumptions for scenarios, statistics until 2020, projections
until 2050, see Annex 2 for basis for the assumptions.
Based on the development assumptions and assumptions of increase in energy efficiency,
the energy demands are estimated for the following sectors:-
i. Household cooking demands
ii. Household light and electricity
iii. Service, cooking demand
iv. Service, light and electricity
v. Industry, fuel demand
vi. Industry, electricity demand
vii. Transport
viii. Other demands
For each sector, the energy demand is estimated as the multiplication of demand for the
energy service (as cooked meals, persons and goods transported etc.) and the energy
efficiency of the sector. For each sector, the demand for the energy service is estimated
using historical data since 2000 from International Energy Agency (IEA)6 combined with
the development assumptions in Table 2.
2.2.1 Household cooking demands
Household cooking demands are today responsible for two-third of Kenya’s primary
6. See calculations in Annex 1 and IEA data in https://www.iea.org/data-and-statistics/data tables?
country=KENYA
Kenya’s 100% Renewable Energy Plan-2020 East African CSOs for Sustainable Energy and Climate Action (EASE-CA) Project Page 18
energy supply, including direct use of wood and other biomass, as well as charcoal
production for cooking. Of the biomass demand, households are responsible for 90% of the
demand for wood and residues, and also for two-thirds of the charcoal demands, see
Annex 1. While the cooking will increase with increasing population, there are large
potentials to increase efficiency of cooking, thereby lowering the energy demand for
cooking.
The improvement of efficiency has already started with improved cook stoves, where
Kenya have been in front for decades, but there are still large potentials for increasing
the efficiency with massive dissemination of improved cook stoves, new, high-efficient
cook stoves, super-efficient electric cooking, biogas, and more efficient charcoal
production. These five solutions are all included in this scenario. Some other solutions
are not included, as wood briquettes (that are not well known in East Africa), LPG gas
(that perpetuate the reliance in fossil fuels and are hard to afford for most of the
population), and ethanol (that has low energy efficiency in production).
The efficiency assumptions of the five prioritized solutions are:-
Efficient cook stoves with efficiencies around 25%, which is twice as good as
traditional fires and “jikos”,
High-efficient cook stoves for wood and charcoal with efficiencies of 50%. This is a
new technology, which is now produced and available in a few places in East Africa7
Super-efficient electric cooking with insulated, computer-controlled pressure cookers
that can cook with only 10% of the energy needed from traditional fires, partly
because the cooking time can be reduced with the pressure cookers. They are now
promoted in Tanzania8, as well as in countries in Europe, including Denmark and in
Asia. They need electricity, however.
Biogas that can replace cooking with wood and charcoal with cleaner, sustainable
options, where dung and other feedstock for the biogas are abundant.
Efficient charcoal production. The efficiency of traditional charcoal production is very
low, 8-12%9. We use 10% as basis for the years 2000 – 2020 as improved charcoal
production is not widespread in Kenya. With new, high-yield, low-emission systems,
conversion efficiencies can be increased to 25-33%. We assume that charcoal
7. According to Biogas Energy Status in Kenya, Samuel Matoke, State Department of Lifestock, Kenya http://www.fao.org/fileadmin/user_upload/energy/investa/presentations/PPT_Matoke.pdf D7 See IEA statistics for Kenya, https://www.iea.org/countries/kenya 8 See model available in Tanzania at https://sescom.co.tz/about-us/14-electric-pressure-cooker
8Biogas-Ministry of Energy https://www.google.com/url?sa=t&rct=j&q=&esrc=s&source=web&cd=2&cad=rja&uact=8&ved=2ahUKEwjIncrhwvnoAhUJ3hoKHWAuDzUQFjABegQIARAB&url=http%3A%2F%2Fenergy.go.ke%2F%3Fp%3D912&usg=AOvVaw2Xg9CCQgGrfcWEQfVdGk58
Kenya’s 100% Renewable Energy Plan-2020 East African CSOs for Sustainable Energy and Climate Action (EASE-CA) Project Page 19
production will gradually be changed to these new technologies until 2050, increasing
average efficiency to 25% in 2050.
There were 22,000 biogas plants in Kenya around 2015 of which 90% (20,000) were
domestic10. The sector is developing and according to IEA statistics, the Kenyan biogas
production increased 20% 2015-2017. Thus we expect that both number of household
biogas plants and biogas use has increased 50% in the period 2015-2020.
Kenyan LPG use for cooking is increasing, but according to IEA statistics the LPG demand
was only 0.7% of cooking energy demand at the latest year with available data (2017),
and thus we have not included it.
With the Kenyan Climate Action Plan and NDC, introduction of improved cook stoves and
biogas is already included. We assume that these parts of the NDC are realized, that the
development is continued in the following NDCs, and that it will also include high -
efficiency cook stoves and super-efficient electric cooking.
The Kenya Climate Action Plan 2018-2022 includes distribution of 4 million improved cook
stoves. This is equal to 1 million stoves per year. We assume that 80% are replacing
inefficient stoves while 20% are replacing worn out improved cook stoves, giving a net
increase of 800.000 efficient stoves per year, a large increase from historical figures of
124,000 stoves/year11, as we estimate above.
We assume that the distribution takes effect from 2020, and that the rate of 1 million
improved stoves is maintained after 2022 (800,000 net increase) until the use of
traditional, fires and jikos is not more than 5%. We assume that after 2022, an increasing
fraction will be the high-efficient stoves; leading to almost all cook stoves will be high-
efficiency in 2050.
The Kenya’s Climate Action Plan 2018-2022 and the Kenya’s first NDC (2016) includes that
biogas stoves are increased from around 30,000 today to 250,000 in 2022 and 500,000 in
2030. We assume that this is realized and that the level of 500,000 stoves is maintained.
As a new measure, we propose super- efficient electric cooking, starting with 700.000 of
these pressure cookers until 2025 and gradually increasing to cover 25% of household
10 Kenya’s National Climate Change Action Plan 2018 - 2020, Vol 3: Mitigation Technical Analysis Report, note 68, see http://www.lse.ac.uk/GranthamInstitute/wp-content/uploads/2018/10/8737_vol3.pdf 10 Winrock International, E+Co, and Practical Action. 2011. The Kenyan Household Cookstoves Sector:
Current State and Future Opportunities.
Kenya’s 100% Renewable Energy Plan-2020 East African CSOs for Sustainable Energy and Climate Action (EASE-CA) Project Page 20
cooking needs in 2050. They will replace most of charcoal use, LPG, and gradually also
partly wood and other biomass.
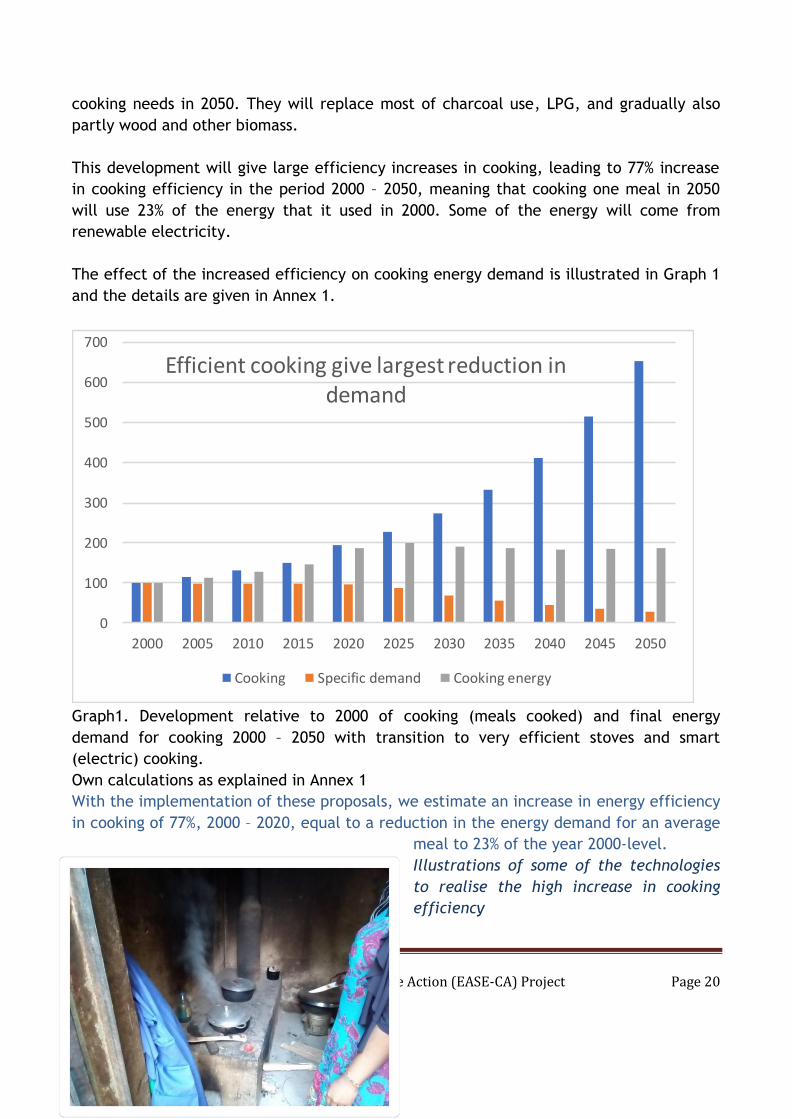
This development will give large efficiency increases in cooking, leading to 77% increase
in cooking efficiency in the period 2000 – 2050, meaning that cooking one meal in 2050
will use 23% of the energy that it used in 2000. Some of the energy will come from
renewable electricity.
The effect of the increased efficiency on cooking energy demand is illustrated in Graph 1
and the details are given in Annex 1.
Graph1. Development relative to 2000 of cooking (meals cooked) and final energy
demand for cooking 2000 – 2050 with transition to very efficient stoves and smart
(electric) cooking.
Own calculations as explained in Annex 1
With the implementation of these proposals, we estimate an increase in energy efficiency
in cooking of 77%, 2000 – 2020, equal to a reduction in the energy demand for an average
meal to 23% of the year 2000-level.
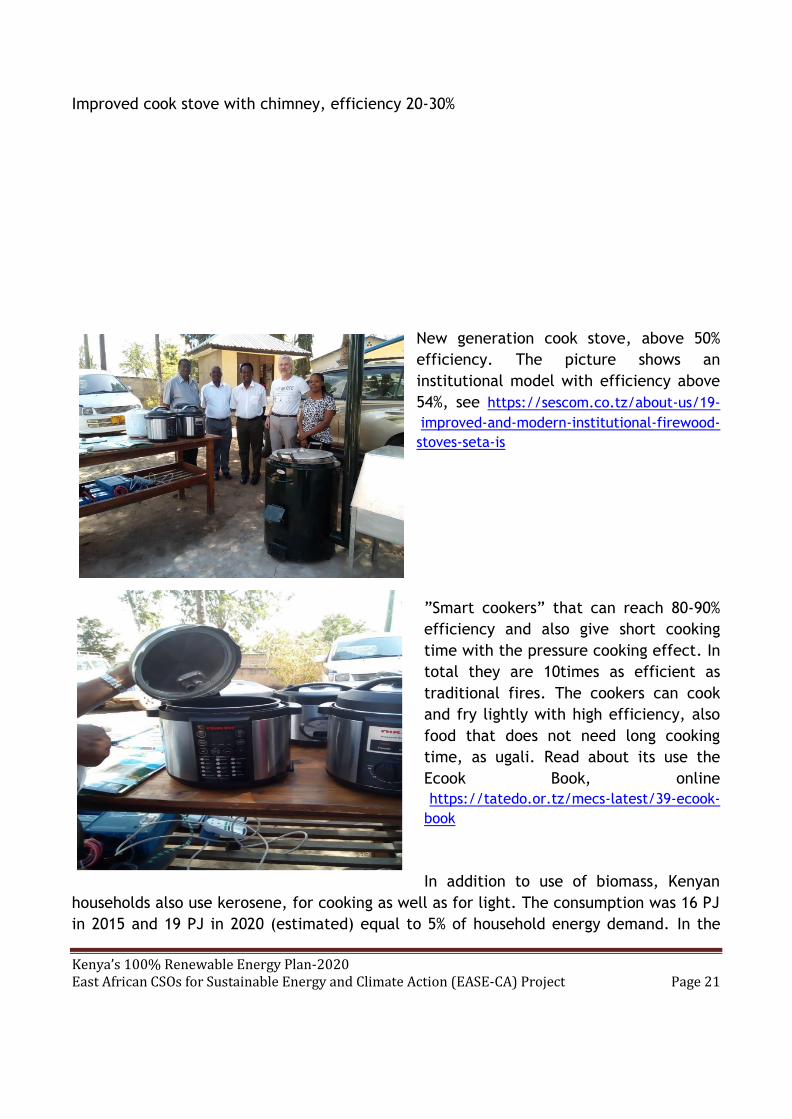
Illustrations of some of the technologies
to realise the high increase in cooking
efficiency
0
100
200
300
400
500
600
700
2000 2005 2010 2015 2020 2025 2030 2035 2040 2045 2050
Efficient cooking give largest reduction in demand
Cooking Specific demand Cooking energy
Kenya’s 100% Renewable Energy Plan-2020 East African CSOs for Sustainable Energy and Climate Action (EASE-CA) Project Page 21
Improved cook stove with chimney, efficiency 20-30%
New generation cook stove, above 50%
efficiency. The picture shows an
institutional model with efficiency above
54%, see https://sescom.co.tz/about-us/19-
improved-and-modern-institutional-firewood-
stoves-seta-is
”Smart cookers” that can reach 80-90%
efficiency and also give short cooking
time with the pressure cooking effect. In
total they are 10times as efficient as
traditional fires. The cookers can cook
and fry lightly with high efficiency, also
food that does not need long cooking
time, as ugali. Read about its use the
Ecook Book, online
https://tatedo.or.tz/mecs-latest/39-ecook-
book
In addition to use of biomass, Kenyan
households also use kerosene, for cooking as well as for light. The consumption was 16 PJ
in 2015 and 19 PJ in 2020 (estimated) equal to 5% of household energy demand. In the
Kenya’s 100% Renewable Energy Plan-2020 East African CSOs for Sustainable Energy and Climate Action (EASE-CA) Project Page 22
100% renewable energy scenario, we assume the kerosene consumption to be reduced to
9 PJ in 2030 and 0 in 2050. The kerosene will be replaced by electricity, primarily.
For the BAU scenario, we assume the same development of improved cook stoves as in
the renewable energy scenario, but not the introduction of super-efficient electric
cooking, which is not part of the current plans in Kenya. Instead we assume that use of
charcoal will continue with the same fraction of household fuel use as today and the use
of fossil fuel, kerosene and LPG, will also continue with the same fraction as today.
Probably LPG would then replace kerosene.
We will use the fractions in Annex 1; table A3 to divide biomass use between sectors,
while the total biomass use will be according to IEA data for 2000 – 2015 and for 2020
using the trend 2015-2017 of IEA data.
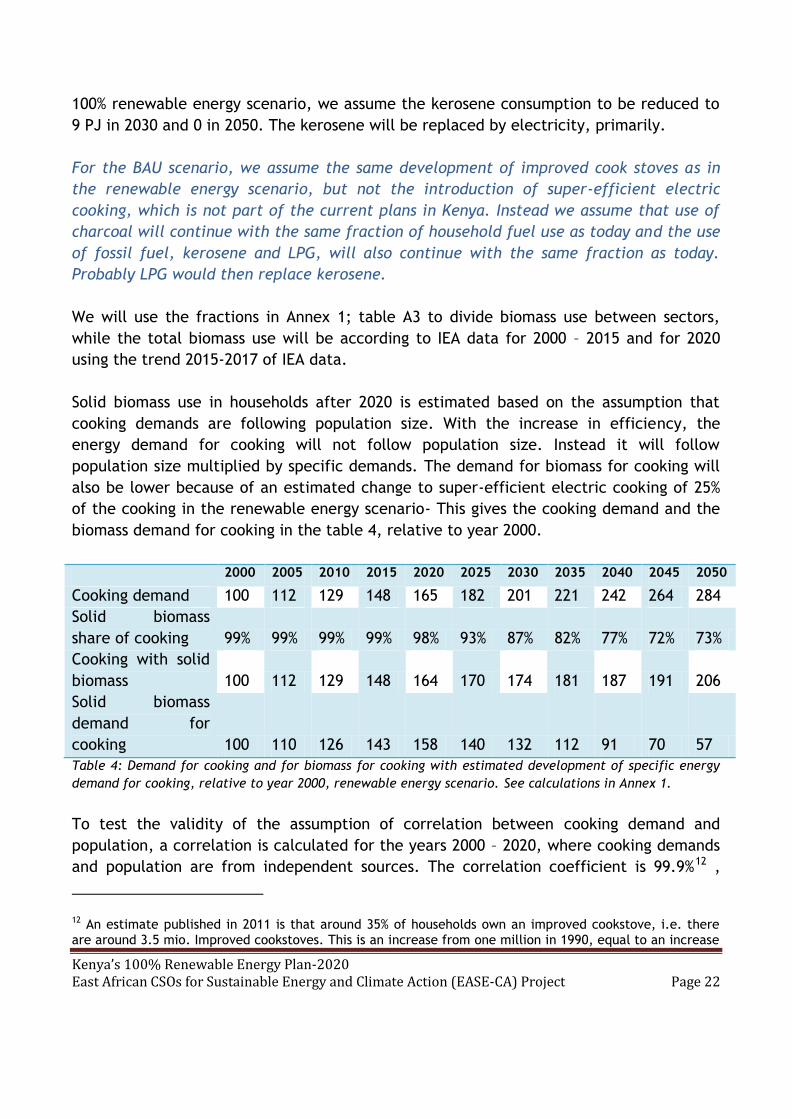
Solid biomass use in households after 2020 is estimated based on the assumption that
cooking demands are following population size. With the increase in efficiency, the
energy demand for cooking will not follow population size. Instead it will follow
population size multiplied by specific demands. The demand for biomass for cooking will
also be lower because of an estimated change to super-efficient electric cooking of 25%
of the cooking in the renewable energy scenario- This gives the cooking demand and the
biomass demand for cooking in the table 4, relative to year 2000.
2000 2005 2010 2015 2020 2025 2030 2035 2040 2045 2050
Cooking demand 100 112 129 148 165 182 201 221 242 264 284
Solid biomass
share of cooking 99% 99% 99% 99% 98% 93% 87% 82% 77% 72% 73%
Cooking with solid
biomass 100 112 129 148 164 170 174 181 187 191 206
Solid biomass
demand for
cooking 100 110 126 143 158 140 132 112 91 70 57
Table 4: Demand for cooking and for biomass for cooking with estimated development of specific energy
demand for cooking, relative to year 2000, renewable energy scenario. See calculations in Annex 1.
To test the validity of the assumption of correlation between cooking demand and
population, a correlation is calculated for the years 2000 – 2020, where cooking demands
and population are from independent sources. The correlation coefficient is 99.9%12 ,
12 An estimate published in 2011 is that around 35% of households own an improved cookstove, i.e. there are around 3.5 mio. Improved cookstoves. This is an increase from one million in 1990, equal to an increase

Kenya’s 100% Renewable Energy Plan-2020 East African CSOs for Sustainable Energy and Climate Action (EASE-CA) Project Page 23
which shows a very high degree of correlation. An important result shown in table 4 is
that the biomass demand for cooking is lower in 2050 than in previous years, in spite of
higher cooking demands.
In addition to the efficiency of cooking, also the efficiency of charcoal production is
increased in the scenario, from present 10%, to 15% in 2030 and to 25% in 2050. This
requires a transformation of the charcoal sector to advanced charcoal production. This
can be done on larger plants, but it is also possible to increase efficiency to above 25%
with mobile units that can be carried on standard trailers13.
We assume the same energy efficiency increase in charcoal production in the renewable
energy scenario and in the BAU scenario.
With the combination of efficient cooking, efficient charcoal production and shift to
super-efficient electric cooking (primarily replacing charcoal with super-efficient electric
cooking), biomass consumption for cooking can be reduced from 570 PJ today, inclusive
wood for charcoal to 152 PJ by 2050.
2.2.2 Household light and electricity
Electricity use is rapidly increasing in Kenya, mainly with increasing wealth. With
efficient lamps (as LED), electric light is possible with affordable levels of energy
consumption for many Kenyans. In addition to increased wealth, electricity is also
replacing kerosene for light. The household electricity demand has increased from 3 PJ
in 2000 to 12 PJ in 2020 (estimate based on development until 2017), an increase well
above the population growth. At the same time, the efficiency of electricity use has
increased with efficient lamps and efficient equipment. While the average efficiency
increase is not fully documented, we assume for this scenario that the efficiency has
increased 42% from 2000 to 2020 and that efficiency will continue to increase with 15%
each 5 year.
With these assumptions, end-use efficiency of electricity will be 5 times higher in 2050
than in 2000. This is equivalent to the efficiency increase from traditional, incandescent
lamps to the modern LED lamps available today.
The demand for electricity in households has increased 6-fold in the period 2000 – 2020.
With the assumption of 41% efficiency increase, this is equal to a 10-fold increase in the
demand for light electricity services in the period. Based in these trends, we assume that
of 124,000 per year. The estimate is in the publication “The Kenyan Household Cookstoves Sector: Current State and Future Opportunities” by Winrock International, E+Co, and Practical Action. 2011. 12. Correlation coefficient, calculated with excel ”correlation” function

Kenya’s 100% Renewable Energy Plan-2020 East African CSOs for Sustainable Energy and Climate Action (EASE-CA) Project Page 24
demand for light and electricity services in households will increase with population
growth and in addition with 84% of GDP growth. With this assumption, we get the
developments of light and electricity service demands, of specific electricity use, and of
electricity demands in households relative to year 2000, shown in table 5
Households 2000 2005 2010 2015 2020 2025 2030 2035 2040 2045 2050
Light, other
electricity
service
demand
100 155 312 490 729 950 1240 1619 2114 2760 3604
Electricity,
specific
demand
100 92 73 61 58 49 42 36 30 26 20
Electricity
demand
100 142 228 299 423 468 520 577 640 710 721
Table 5, light and other electricity service demand in households, specific demand and electricity demand
in households relative to the year 2000
To test the correlation between population growth, 84% of GDP growth, and the demand
increase for light and electricity services for the years 2000 – 2020, we calculate the
correlation. The correlation coefficient is 99.9%14, showing a very high correlation.
The development of electricity service demand, efficiency, and basic electricity demand
are the same for the renewable energy scenario and the BAU scenario.
In the renewable energy scenario is in addition electricity demand for cooking, which is in
addition to the demand shown in table 8.This gives a total annual electricity demand in
the households of 10.6 TWh (38 PJ) in the renewable scenario.
2.2.3 Service sector, cooking demand
The development of the service sector has been faster than the development of the
population and more linked to GDP than to the population. We estimate that the growth
in the service sector cooking demand increases with around 14% of the GDP increase. For
the efficiency and the change to super-efficient electric cooking, we assume the same
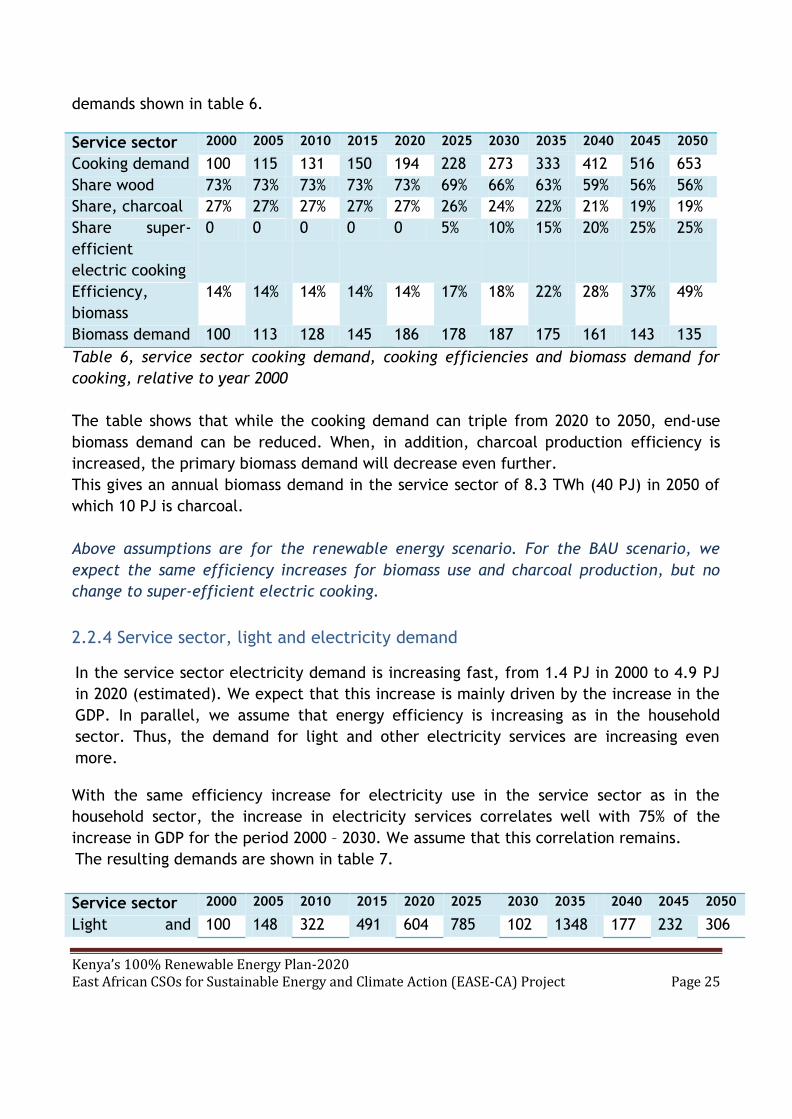
development as for the household sector. This gives a development of cooking and fuel
14 The Energy Plan model is a software to calculate the energy balance of a country hour by hour during a year. It is developed by Aalborg University, Denmark and comes with libraries of examples, technology catalogue and others, It is available from www-energyplan.eu
Kenya’s 100% Renewable Energy Plan-2020 East African CSOs for Sustainable Energy and Climate Action (EASE-CA) Project Page 25
demands shown in table 6.
Service sector 2000 2005 2010 2015 2020 2025 2030 2035 2040 2045 2050
Cooking demand 100 115 131 150 194 228 273 333 412 516 653
Share wood 73% 73% 73% 73% 73% 69% 66% 63% 59% 56% 56%
Share, charcoal 27% 27% 27% 27% 27% 26% 24% 22% 21% 19% 19%
Share super-
efficient
electric cooking
0 0 0 0 0 5% 10% 15% 20% 25% 25%
Efficiency,
biomass
14% 14% 14% 14% 14% 17% 18% 22% 28% 37% 49%
Biomass demand 100 113 128 145 186 178 187 175 161 143 135
Table 6, service sector cooking demand, cooking efficiencies and biomass demand for
cooking, relative to year 2000
The table shows that while the cooking demand can triple from 2020 to 2050, end-use
biomass demand can be reduced. When, in addition, charcoal production efficiency is
increased, the primary biomass demand will decrease even further.
This gives an annual biomass demand in the service sector of 8.3 TWh (40 PJ) in 2050 of
which 10 PJ is charcoal.
Above assumptions are for the renewable energy scenario. For the BAU scenario, we
expect the same efficiency increases for biomass use and charcoal production, but no
change to super-efficient electric cooking.
2.2.4 Service sector, light and electricity demand
In the service sector electricity demand is increasing fast, from 1.4 PJ in 2000 to 4.9 PJ
in 2020 (estimated). We expect that this increase is mainly driven by the increase in the
GDP. In parallel, we assume that energy efficiency is increasing as in the household
sector. Thus, the demand for light and other electricity services are increasing even
more.
With the same efficiency increase for electricity use in the service sector as in the
household sector, the increase in electricity services correlates well with 75% of the
increase in GDP for the period 2000 – 2030. We assume that this correlation remains.
The resulting demands are shown in table 7.
Service sector 2000 2005 2010 2015 2020 2025 2030 2035 2040 2045 2050
Light and 100 148 322 491 604 785 102 1348 177 232 306

Kenya’s 100% Renewable Energy Plan-2020 East African CSOs for Sustainable Energy and Climate Action (EASE-CA) Project Page 26
electricity
service demand
8 1 8 4
Electricity,
specific demand
100 92 73 61 58 49 42 36 30 26 20
Electricity
demand
100 136 235 299 350 387 431 480 536 599 613
Table 7 Service sector demands for electricity services and for electricity, relative to
year 2000
A test of the correlation between development of the electricity service demand in the
service sector and 75% of the GDP shows a correlation coefficient of 98.4%, showing a
high correlation. This gives an annual electricity demand in the service sector of 3.6 TWh
(10 PJ) in 2050 without electricity for cooking. When electricity for cooking is added, the
demand is 13 PJ.
The assumed development of electricity is the same for the renewable energy scenario
and the BAU scenario with the exception that electric cooking is not included in the BAU
scenario.
2.2.5 Industry, fuel demand
The use of industrial fuel (coal, oil, and biomass) in industry has increased from 20 PJ in
2000 to 43 PJ in 2020 (estimated). In parallel, there has been an increase in energy
efficiency, which we estimate to 28% in the period, equal to an annual increase of 1.6%.
After 2020, we assume a higher efficiency increase of 2%/year equal to 10% per 5 year,
because of actions to increase energy efficiency. In addition, it is assumed that industrial
fuel use is gradually replaced with heat pumps and direct electric heating with an
average coefficient of performance of 3 (heat pumps and electric heating combined). It is
assumed that remaining fossil fuel use is replaced with biomass and solar heating.
With the assumption of 28% increase in energy efficiency 2000 - 2020, the increase of
fuel-based energy service demand correlates relatively well with 30% of the increase in
GDP for the period 2000 - 2020. The correlation coefficient is 94.3%, which is a
reasonably good correlation. This gives an annual biomass demand in the industrial sector
0.65 TWh (2.4 PJ) in 2050.
The assumed development of fuel use in the BAU scenario is with same efficiency
increase as in the renewable energy scenario, but with no change to heat pumps and
with no conversion from fossil fuels to biomass.
2.2.6 Industry, electricity demand
The use of electricity in industry has increased from 7.5 PJ in 2000 to 17 PJ in 2020

Kenya’s 100% Renewable Energy Plan-2020 East African CSOs for Sustainable Energy and Climate Action (EASE-CA) Project Page 27
(estimated). In parallel, the end-use efficiency has increased, but not as much as in the
household sector, where the LED lamps have revolutionized energy use for light. Instead
we assume a 32% efficiency increase, equal to 2%/year. After 2020, we assume a higher
efficiency increase of 2.5% per year equal to 12% per 5 year because of actions to
increase efficiency.
With the assumption of 32% efficiency increase, the increase of electric energy service
demand correlates well with 35% of the increase in GDP for the period 2000 – 2020. The
correlation coefficient is 98.4%, which is a good correlation.
This gives an annual electricity demand in the industrial sector 19.6 TWh (70 PJ) in 2050,
including electricity use for heat pumps and direct electric heating to replace most
heating with fossil fuels.
The assumed development of electricity use in the BAU scenario is the same as in the
renewable energy scenario, except that there is no change from fuels for heating to
heat pumps and electricity.
2.2.7 Transport demands
The energy demand for transport has increased strongly from 40 PJ in 2000 to 177 PJ in
2020 (estimated). The technology has not changed much since the year 2000 and
therefore we assume that efficiency has not changed much. Thus, the transport demand
has increased as much as the transport energy use. Increase in transport demand
correlates well with the population increase combined with 43% of the GDP increase
2000-2020.
Today the transport energy is fossil fuels in the form of diesel and petrol. In the
renewable energy scenario this will gradually be replaced with electricity and hydrogen
(H2) and hydrogen-based alternative fuels. In the renewable energy scenario, all hydrogen
is produced from renewable electricity while no hydrogen is included in the BAU scenario.
The alternative fuels, called “electro fuels”, are fuels made from electricity via the
production of Hydrogen. The simplest of these are methanol that can be produced from
hydrogen and CO2.
With the shift to electric vehicles, efficiency will be around 5 times higher than for petrol
and diesel cars. For hydrogen and electro-fuels, where traditional combustion engines

Kenya’s 100% Renewable Energy Plan-2020 East African CSOs for Sustainable Energy and Climate Action (EASE-CA) Project Page 28
can be replaced by fuel cells and electric motors, efficiency is around 2.5 times higher
than for petrol and diesel cars. With ¾ of the transport changed to electricity and ¼ to
fuel cell vehicles, and in parallel the general efficiency increase is 15% 2020 - 2050, the
energy to move one passenger or one ton of goods one km can be reduced to 22% in 2050
of what it is in the year 2000. The development is shown in table 8
Transport 2000 2005 2010 2015 2020 2025 2030 2035 2040 2045 2050
Transport
demand
100 106 185 300 457 575 733 936 1200 1541 1983
Fossil transport
share
100
%
100
%
100
%
100
%
100
%
100
%
89% 69% 42% 18% 0%
Bio. transport
share
0% 0% 0% 0% 0.2% 0.4% 0.6% 0.7% 0.8% 0.7% 0.6%
El.transport
share
0% 0% 0% 0% 0% 0% 10% 25% 45% 57% 75%
H2 transport
share
0% 0% 0% 0% 0% 0% 0% 5% 12% 24% 24%
Transport,
specific demand
100 100 100 100 99 94 82 66 48 34 22
Fossil fuel for
transport
100 106 185 300 449 536 538 429 243 94 0
Electricity for
transport
0 0 0 0 0 0 10 32 61 90 108
Table 8, Transport demands (movement of persons and goods) and energy demands for the renewable
energy scenario, relative to the year 2000. The electricity use includes electricity to produce H2 for
transport with an efficiency of 73%. For electricity for transport, the basis (100) is the fossil energy
consumption in the year 2000
The correlation between increase in transport demand and increase in population + 43%
of increase in GDP is 99.3%, which shows a very good correlation. In the renewable energy
scenario in 2050, the annual electricity use for transport is 43 TWh (157 PJ) and the
hydrogen + electrofuels demand is 13.7 TWh (49 PJ).
For the BAU scenario, there is not included introduction of electric or hydrogen vehicles
for road transport while it is included that rail transport will be electrified. In this way
2% of the transport energy will be changed to electricity and 98% will remain fossil fuel.
The efficiency of transport is assumed to increase 30% with more efficient vehicles.
To illustrate the strong increase in energy use for transport and how the change to

Kenya’s 100% Renewable Energy Plan-2020 East African CSOs for Sustainable Energy and Climate Action (EASE-CA) Project Page 29
electricity can mitigate that, graph 1 shows increase in energy for transport in the BAU
scenario while graph 2 shows increase in energy for road transport in the renewable
energy scenario. Road transport consumes 96% of the energy for inland transport in 2050,
even with an assumption of increased use of railways.
Graph 1: Road transport energy demand in BAU scenario
0
100
200
300
400
500
600
2000 2005 2010 2015 2020 2025 2030 2035 2040 2045 2050
Road transport fuels, Kenya, BAU(PJ) Petrol+diesel
Electricity
H2+new fuels

Kenya’s 100% Renewable Energy Plan-2020 East African CSOs for Sustainable Energy and Climate Action (EASE-CA) Project Page 30
Graph:2: Road transport energy demand in renewable energy scenario
2.2.8 Other demands
The scenarios include other, smaller demands:
Energy consumption in oil supply including what refineries consume themselves is 1.6
PJ in 2020, which is expected to reduce in 0 in 2050 in the renewable energy scenario
and increase to 4 PJ in 2050 in the BAU sector with the increased oil use
Electric grid losses are 6.7 PJ in 2020 and they are expected to increase to 50 PJ in
2050 with the increased electricity supply in the renewable energy scenario and to 14
PJ in the BAU scenario
Agricultural energy use of 1.26 PJ in 2020 is included in the scenarios, and its energy
efficiency is expected to increase similar to the industrial sector. Its influence of
total consumption is minimal.
Solar heating is included for household and service sector demands other than
cooking, increasing from 1.4 PJ in 2020 to 5 PJ in both scenarios. It is also included in
the industrial sector with 2 PJ in 2050 in both scenarios.
There is a production of 0.3 PJ of liquid biofuels in 2020 which is expected to increase
to 1.5 PJ in 2030 and 3 PJ in 2050 in the renewable energy scenario, while it is
0
100
200
300
400
500
600
2000 2005 2010 2015 2020 2025 2030 2035 2040 2045 2050
Road transport fuels, Kenya, 100 Renewables(PJ) Petrol+diesel
Electricity
H2+new fuels
Kenya’s 100% Renewable Energy Plan-2020 East African CSOs for Sustainable Energy and Climate Action (EASE-CA) Project Page 31
expected to increase to only 1.5 PJ in the BAU scenario in 2050. It is all used in the
road transport.
Use of oil for non-energy purposes was 6 PJ in 2017. This is not included in the
scenarios
Aviation fuel consumption is not included in the scenarios. It was 30 PJ in 2017.
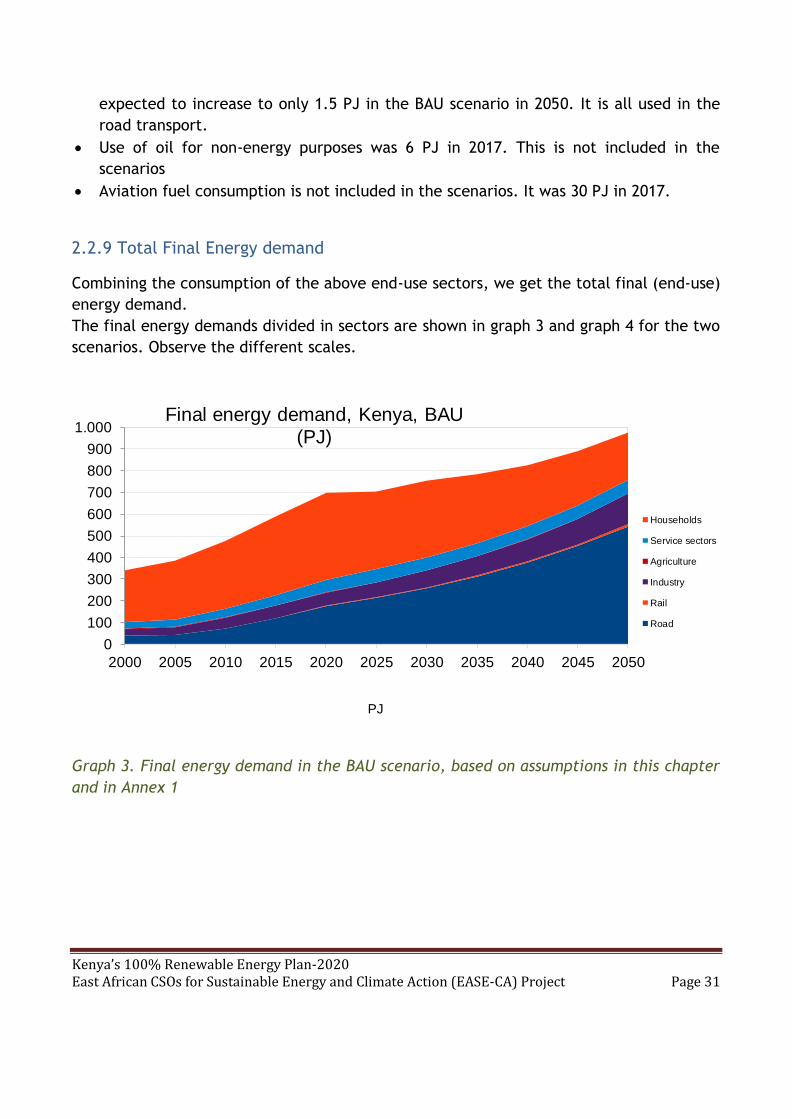
2.2.9 Total Final Energy demand
Combining the consumption of the above end-use sectors, we get the total final (end-use)
energy demand.
The final energy demands divided in sectors are shown in graph 3 and graph 4 for the two
scenarios. Observe the different scales.
Graph 3. Final energy demand in the BAU scenario, based on assumptions in this chapter
and in Annex 1
0
100
200
300
400
500
600
700
800
900
1.000
2000 2005 2010 2015 2020 2025 2030 2035 2040 2045 2050
PJ
Final energy demand, Kenya, BAU (PJ)
Households
Service sectors
Agriculture
Industry
Rail
Road

Kenya’s 100% Renewable Energy Plan-2020 East African CSOs for Sustainable Energy and Climate Action (EASE-CA) Project Page 32
Graph:4: Final energy demand in the renewable energy scenario, based on assumptions in
this chapter and in Annex 1
Comparing the graph 3 and graph 4, it is very visible how transport is gradually becoming
more important in the energy balance, in particular in the BAU scenario. In the BAU
scenario this implies a strong reliance on fossil fuels.
It is also visible how the strong actions to increase energy efficiency in cooking are
expected to limit final energy already from 2025, specifically the use of biomass.
The figures behind graph 3 and graph 4 are given in Annex 1.
For the planning of the energy supply system, it is important to divide the final energy
demand in energy forms. This division is shown for the renewable energy scenario in
graph 5, while the figures behind are given in Annex 1.
0
100
200
300
400
500
600
700
800
2000 2005 2010 2015 2020 2025 2030 2035 2040 2045 2050PJ
Final energy demand, Kenya, 100% Renewables(PJ)
Households
Service sectors
Agriculture
Industry
Rail
Road

Kenya’s 100% Renewable Energy Plan-2020 East African CSOs for Sustainable Energy and Climate Action (EASE-CA) Project Page 33
Graph 5: Development of final (end-use) energy demand in the renewable energy
scenario. Hydrogen also includes electro fuels. The graph 5 clearly shows how the strong
energy efficiency in cooking drives down biomass use while the change to efficient use of
electricity replaces both biomass and fossil fuels in ways that reduce the total end-use
energy consumption.
In the BAU scenario, there is no conversion to electric cooking and very limited
conversion to electric transport. Also the use of hydrogen is not included in the BAU.
The main differences are then for end-use consumption in the BAU scenario:
Electricity use is only increasing to 76 PJ in 2050 (278 PJ in renewable energy
scenario).
Charcoal use is decreasing to 27 PJ in 2050 (13 PJ in renewable energy scenario).
Wood and biomass use is decreasing to 194 PJ in 2050 (166 PJ in renewable energy
scenario).
Biogas is 16 PJ in 2050, similar to the renewable energy scenario
Oil use is increasing to 600 PJ in 2050, from 210 PJ in 2020 (it is 0 in 2050 in the
renewable energy scenario
Coal use is increasing to 32 PJ in 2050 from 13.5 PJ in 2020 (it is 0 in 2050 in the
renewable energy scenario).
0
100
200
300
400
500
600
700
800
2000 2005 2010 2015 2020 2025 2030 2035 2040 2045 2050
End-use energy use, Kenya Renewable Energy Scenario (PJ)
Electricity Hydrogen Charcoal Wood, oth.bio Biogas Oil Coal

Kenya’s 100% Renewable Energy Plan-2020 East African CSOs for Sustainable Energy and Climate Action (EASE-CA) Project Page 34
CHAPTER THREE
3.0 THE SCENARIOS AND THE RENEWABLE ENERGY USE
With above scenarios for final energy use, energy demands for all can be met,
increasingly with domestic supplies. There will also be a diversified energy mix to reduce
over-reliance on hydro and petroleum sources of energy.
We expect a development with increase in wind power, solar power, and geothermal
power as well as a reduction in biomass use to reach sustainable levels, and a stable
hydro-power production, but with reduced contribution to total supply. Power production
is increased to meet power demands while biomass production is reduced with reducing
demands because of high efficiency.
In the following, we explain how we constructed scenarios to meet the final energy
demands, and the developments of renewable energy needed to meet the demands. The
main elements in the modelling process are:
The modelling is made with INFORSE’s spread sheet model with energy balances for each
5 year until 2050 and with the Energy Plan model for the years 2030 and 2050. The
method for development of the scenarios is:
The spread sheet models are first developed for the two scenarios,
Then energy demand and supply data from the spread sheets are used to
generate the Energy Plan models,
With the Energy Plan models it is ensured that there is hourly balance of
demand and supply in every hour of the year.
Then the spread sheets are adjusted to follow the annual energy balances from
Energy Plan.
The hourly distributions of solar and wind are from the Energy Plan 14.2
library, see energyplan.eu
The hourly distribution of electricity demands is from a study at Lappeenranta
University of Technology15
The economic parameters for technologies and fuels were developed from the
Energy Plan technology Catalogue and other sources, see data and calculations
in Annex 3
The economic calculations are made with an interest rate of 10%.
The electric interconnector capacity with neighbouring countries is expected to be
15 Abdulganiyu, I. O. (2017). Possibilities and barriers for increasing renewable power generation in kenya and tanzania. Technical report, Lappeenranta University of Technology., Finland

Kenya’s 100% Renewable Energy Plan-2020 East African CSOs for Sustainable Energy and Climate Action (EASE-CA) Project Page 35
increased to 1000 MW in 2030 and 3000 MW in 2050.
Because of the variations in solar and wind power production, hydro power and biomass
power is used to make demand and supply meet on an hourly basis together with use of
interconnectors.
The scenarios are using a combination of renewable energy for large – scale power
production, as the least cost option. Since other options are also considered in Kenya, we
have compared six different options for large-scale power supply in 3.1
Following the comparison in 3.1, is the renewable energy demands needed shown in
graph 6 and detailed in 3.2 – 3.4. Other scenario results are in chapter 4.
Energy Type Existing capacity
(2019)
Capacity 2030 Capacity 2050
Solar
400 MW PV incl small
solar +2500 m2 solar
heaters
3330 MW PV incl.
small, 2 mill. m2
solar heaters
17330 MW PV incl.
small, 2 mill. m2
solar heaters
Biogas/biomass
30,000 bio digesters
for cooking
4.7 mill improved
stoves
250,000 bio
digesters for
cooking, 12.6 mill.
improved
cookstoves*
500,000 bio
digester for
cooking, 15.6 mill.
improved
cookstoves*
Geothermal
Energy
801 MW 2931 MW 5566 MW
Hydro power
+823 MW
1123 MW 1123 MW
Wind power
+350 MW 1500 MW 9000 MW
Graph 6 Renewable Energy in 100% renewable energy scenario * Of the improved cookstoves, 0.5 million shall be high-efficient cookstoves in 2030 and 15.5 million in
2050. In addition, the scenario includes 1.5 million super-efficient electric cookers in 2030 and 5.4 million
in 2050 (Need more clarification)
3.1 Large-Scale Power Supply Options
In this report, we compare two scenarios that both have renewable energies as the main
power supply options. Given the increasing power demand in Kenya, also other options

Kenya’s 100% Renewable Energy Plan-2020 East African CSOs for Sustainable Energy and Climate Action (EASE-CA) Project Page 36
are available, primarily for centralized power supply. Therefore, in this chapter we
compare the main options for supplying centralized “bulk” power from large-scale power
supply- The main options are:
Wind power that Kenya has very good conditions for, as described in 2.1.3. In the
scenarios, we take into account the variations in wind power in Kenya, modeling of
power system, where wind power production is combined with other power
supplies to ensure uninterrupted supply. In this comparison is used wind power
with 3500 full load hours, which is also used in the scenarios
Solar power that Kenya also has very good conditions for, as described in 2.1.4. In
the scenarios, we take into account the variations of solar power in the modeling,
as we do for wind power. In this comparison is used 1800 full load hours, which is
also used in the scenarios.
Geothermal power, where Kenya has a large and unique potential, as described in
2.1.5
Hydro power, where the theoretical potential is large, but costs and sustainability
issues limit the potential severely, as described in 2.1.6. In addition, Kenya already
has substantial development of hydro power and given the fluctuations of rivers
from year to year, the current strategy is to rely less on hydro power in the future.
Therefore, we will not include large-scale hydro power in the comparison in this
chapter, and major expansion of hydro power is not included in the scenarios
Biomass power including solid biomass and biogas has some potential in Kenya; but
given that a large part of current biomass use in Kenya is unsustainable, it is not
likely to be covering a large part of the power demand in Kenya. It is, however,
included to cover peak power demand in the renewable energy scenario. Given
that this peak power is not comparable with the large-scale electricity supply on
from the other supply options, it is not included in this comparison. in the
renewable energy scenario (see chapter 4), the biomass electricity production is
increased to 0.8 TWh (2.8 PJ) in 2045 and 2.3 TWh (8 PJ) in 2050, but this is only
2% of power demand and therefore it is not comparable to the other power supply
options in this comparison. The increase of biomass use for power from 2045 in the
scenario is within the sustainable limits of biomass use, given the reduction in
biomass use for cooking in the scenario.
Coal power has been suggested for Kenya and is included in this comparison with a
large-scale plant, 400 MW or larger. Smaller coal power plants will be more
expensive. The very central character of coal power makes it difficult to include
coal power without risk of expensive over capacity that will make the economic
case less favorable for coal relative to this comparison. Also the environmental
problems with coal power make them less favorable, which is not shown in the
comparison below.
Kenya’s 100% Renewable Energy Plan-2020 East African CSOs for Sustainable Energy and Climate Action (EASE-CA) Project Page 37
Oil power, a fuel oil power plant is included for comparison as such plants have
been used in Kenya for large-scale power supply in years with low rainfall. In this
comparison is used a plant with an internal combustions engine of 10 MW that can
burn fuel oil that is considerably cheaper than diesel oil used for the more
efficient combined cycle gas turbines. The heavy fuel oil plants are more polluting
and are as such not recommended.
Nuclear power has been suggested for Kenya and is included in this comparison
with a large plant, 1000 MW or larger. Smaller nuclear power plants, included
suggestions of small modular reactors, will be producing more expensive power.
Since very few new nuclear power plants are under construction and since they
typically are troubled by delays and cost overruns, the costs of a nuclear power
plant have considerable uncertainties. Therefore, we include two cost
alternatives:
o The costs of a realized power plant, the Olkilutoto Power Plant in Finland
that is planned to open in 2021
o Costs according to the EU Joint Research Center Technology Catalogue
201416.
With the technology costs and fuel costs in Annex 3, the power costs from the six large-
scale power options described above (not including hydro power and biomass power as
indicated above) are given in graph 7 and 8. Graph 7 shows results with an interest rate
of 10% and graph 8 with 5%. Both are made with present (year 2020) costs of technologies
and fuel.
16
See https://publications.jrc.ec.europa.eu/repository/bitstream/JRC92496/ldna26950enn.pdf

Kenya’s 100% Renewable Energy Plan-2020 East African CSOs for Sustainable Energy and Climate Action (EASE-CA) Project Page 38
Graph 7. Power costs of six large-scale power supply options for Kenya with high (10%)
interest rate and current costs of fuels and technologies
Graph 8 Power costs of six large-scale power supply options for Kenya with low (5%
interest rate and current costs of fuels and technologies.
The graphs clearly show that nuclear power is much more expensive than other power
options. Only with a low interest rate, it can compete with oil power. This is in line with
0
20
40
60
80
100
120
Geothermalpower
Windpower Solar power Coal power Nuclearrealised
Nuclear low Oil powerICE
Bulk power costs, 2020, 10% interest rate, USD/MWh
Investment O&M Fuel
0
10
20
30
40
50
60
70
80
90
100
Geothermalpower
Windpower Solar power Coal power Nuclearrealised
Nuclear low Oil powerICE
Bulk power, 2020, 5% interest rate, USD/MWh
Investment O&M Fuel

Kenya’s 100% Renewable Energy Plan-2020 East African CSOs for Sustainable Energy and Climate Action (EASE-CA) Project Page 39
other studies, including a study on the least cost power options for Kenya17. Since this
study on Kenya least cost power options was published, costs of solar power and wind
power has decreased considerably.
While the graphs 7 and 8 give an overview with current costs of technologies, forecasts
are that solar power will reduce at least 25% in investment costs over the coming 20 years
while other technology costs will reduce maybe 10%. This is likely to make solar power
the cheapest form of power in Kenya.
There are always some uncertainties of costs. For this comparison, it is important to note
that the solar and wind conditions chosen are averages of good conditions. In the best
local conditions in Kenya, the economy is better, both of wind power and solar power.
The comparison of graphs 7 and 8 show that with low interest rates, all the renewables
options are cheaper than even coal power that is the cheapest of the non-renewable
alternatives (when the problems of the large-scale is not taken into account). Comparing
the graphs also show how important the interest rate is for the power production costs,
with for instance solar power reducing from 60 US$/MWh to below 40 USD/MWh with the
reduction from 10% interest to 5% interest. This shows how important it is that power
investments are made with low interest financing. Thus, the use of climate financing with
low interest for renewable power should be used as much as possible.
The graph 9 shows the difference in costs of wind power with respectively 10% and 5%
interest rate.
17
Kenya Least Cost Power Development Plan 2011-2031 identifies nuclear together with coal power as the more expensive than other power options, being windpower, geothermal power and a large hydro-power project. Assuming the large increase in demand for power, the plan includes, however, nuclear power at a later stage when the cheaper options have been exhausted. Sine this study was made in particular solar power and also windpower have reduced in price, making other alternatives, as nuclear power less competitive. See plan at https://www.renewableenergy.go.ke/downloads/studies/LCPDP-2011-2030-Study.pdf
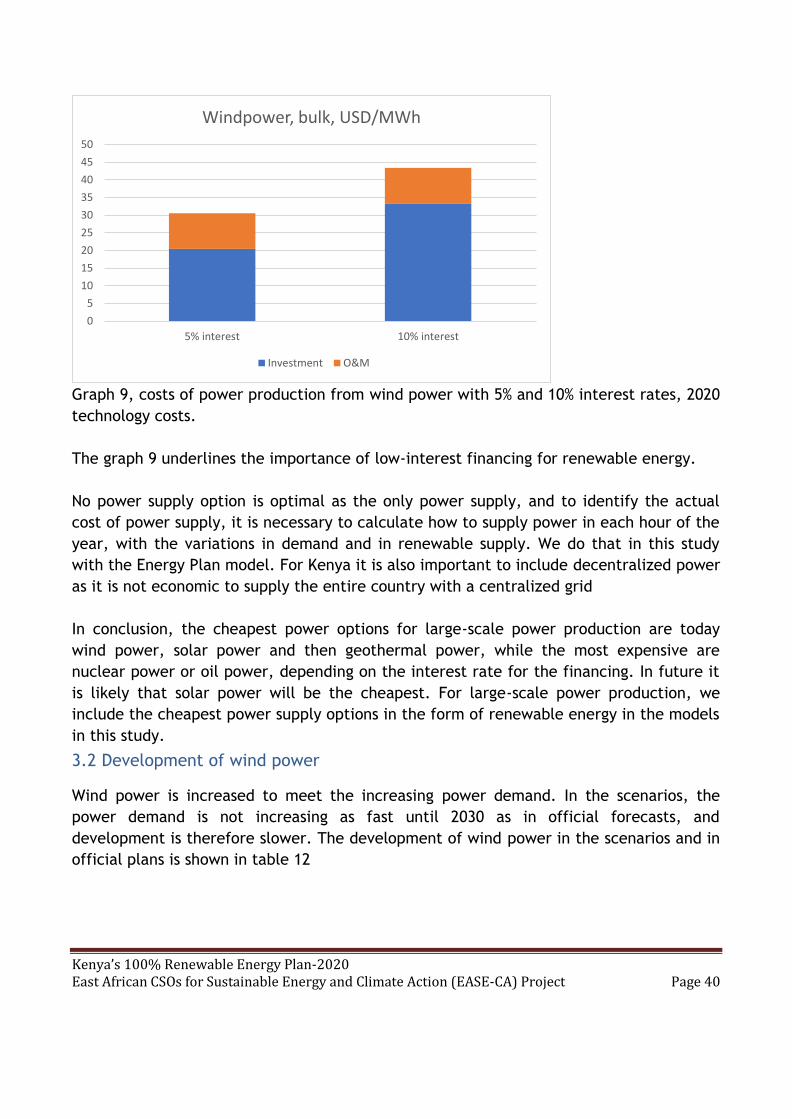
Kenya’s 100% Renewable Energy Plan-2020 East African CSOs for Sustainable Energy and Climate Action (EASE-CA) Project Page 40
Graph 9, costs of power production from wind power with 5% and 10% interest rates, 2020
technology costs.
The graph 9 underlines the importance of low-interest financing for renewable energy.
No power supply option is optimal as the only power supply, and to identify the actual
cost of power supply, it is necessary to calculate how to supply power in each hour of the
year, with the variations in demand and in renewable supply. We do that in this study
with the Energy Plan model. For Kenya it is also important to include decentralized power
as it is not economic to supply the entire country with a centralized grid
In conclusion, the cheapest power options for large-scale power production are today
wind power, solar power and then geothermal power, while the most expensive are
nuclear power or oil power, depending on the interest rate for the financing. In future it
is likely that solar power will be the cheapest. For large-scale power production, we
include the cheapest power supply options in the form of renewable energy in the models
in this study.
3.2 Development of wind power
Wind power is increased to meet the increasing power demand. In the scenarios, the
power demand is not increasing as fast until 2030 as in official forecasts, and
development is therefore slower. The development of wind power in the scenarios and in
official plans is shown in table 12
0
5
10
15
20
25
30
35
40
45
50
5% interest 10% interest
Windpower, bulk, USD/MWh
Investment O&M

Kenya’s 100% Renewable Energy Plan-2020 East African CSOs for Sustainable Energy and Climate Action (EASE-CA) Project Page 41
Wind power (MW) 2020 2025 2030 2035 2040 2045 2050
Renewable
scenario
350 550 1500 3000 5000 8000 9000
BAU scenario 350 450 800 9500 1150 1500 1850
National strategies 350 800 2000-
3000
Table 9. Wind power development in Kenya in the renewable energy scenario, in the BAU scenario, and in
the proposed Renewables Additions 2018- 2022 (for 2025), and 2014 Draft National Strategy, renewable
energy expansion plans until 2030.
With this expansion and with 3500 full load hours, wind energy production will reach
23.3. TWh = 85 PJ in 2050 in the renewable energy scenario. This is less than 2% of the
potential of 1740 TWh identified in chapter 2.1.
3.3 Development of solar power
Solar is increased to meet the increasing power demand. In the scenarios, the
development is faster than in the official forecasts from 2025 to 2030 because we
estimated that a higher development of solar has a better economy. The development of
solar power in the scenarios and in official strategies is shown in table 13.
Solar power (MW) 2020 2025 2030 2035 2040 2045 2050
Renewable
scenario
400 430 3330 5330 9330 14330 17330
BAU scenario 400 430 990 4030 5830 10230 14930
National strategies 400 430 500
Table10. Solar power development in Kenya in the renewable energy scenario, in the BAU scenario, and in
the 10 Year Power Sector Expansion Plan, 2014- 2024 (for 2025), and 2014 Draft National Strategy,
renewable energy expansion plans until 2030.
With the expansion to 17,330 MW solar power in 2050 in the renewable energy scenario
and with 1800 full load hours, the solar power production will be 31 TWh equal to 112 PJ.
This is just ¼ of the potential identified in chapter 2.1
3.4 Development of geothermal power
Geothermal power is increased to meet the increasing power demand. In the scenarios,
the demand of power is not increasing as fast as in official forecasts, and development is
therefore slower. The development of geothermal power in the scenarios and in official
strategies is shown in table 14
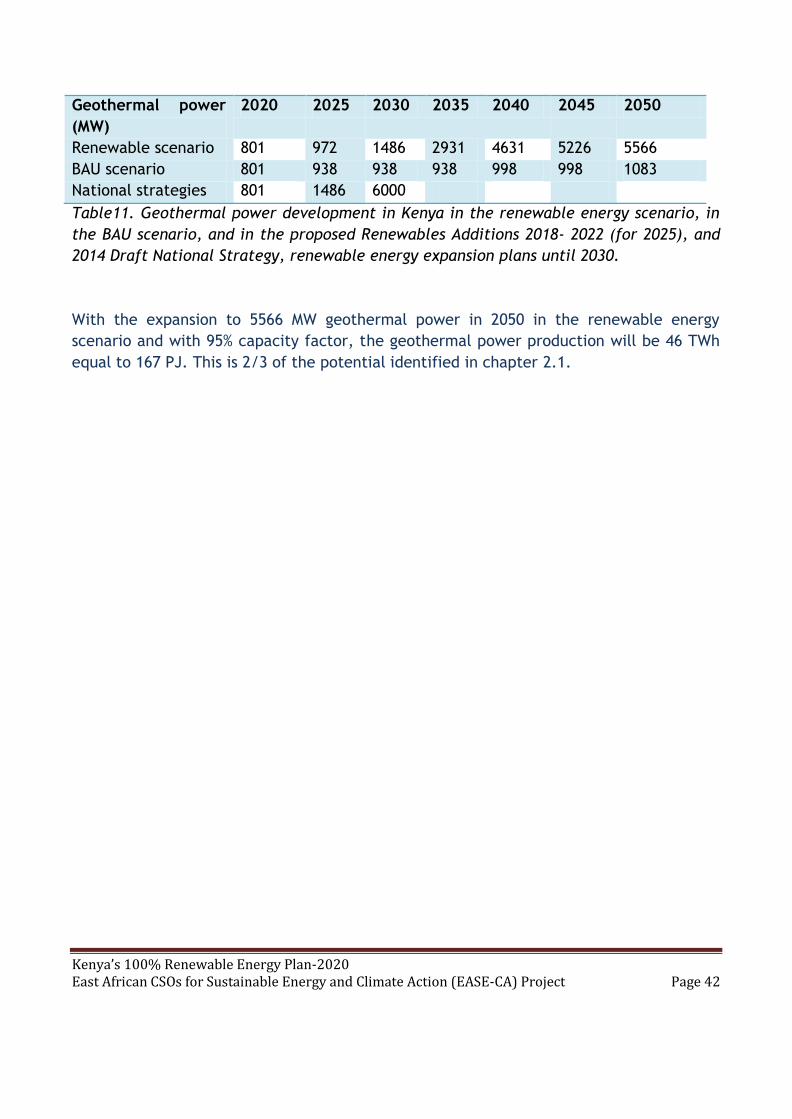
Kenya’s 100% Renewable Energy Plan-2020 East African CSOs for Sustainable Energy and Climate Action (EASE-CA) Project Page 42
Geothermal power
(MW)
2020 2025 2030 2035 2040 2045 2050
Renewable scenario 801 972 1486 2931 4631 5226 5566
BAU scenario 801 938 938 938 998 998 1083
National strategies 801 1486 6000
Table11. Geothermal power development in Kenya in the renewable energy scenario, in
the BAU scenario, and in the proposed Renewables Additions 2018- 2022 (for 2025), and
2014 Draft National Strategy, renewable energy expansion plans until 2030.
With the expansion to 5566 MW geothermal power in 2050 in the renewable energy
scenario and with 95% capacity factor, the geothermal power production will be 46 TWh
equal to 167 PJ. This is 2/3 of the potential identified in chapter 2.1.

Kenya’s 100% Renewable Energy Plan-2020 East African CSOs for Sustainable Energy and Climate Action (EASE-CA) Project Page 43
CHAPTER FOUR
4.0 ENERGY BALANCES, CO2 EMISSIONS AND ECONOMY
4. 1 Electricity Sector
The scenario results for the electricity sector shows that in the BAU scenario there is
steady growth in the electricity use that easily can be met with renewable energy while
in the renewable energy scenario there is a strong increase in electricity use, which can
also be met without problems with the large potentials for wind, solar and geothermal
power in Kenya. See graph 10 and graph 11
Graph 10 Electricity productions in the BAU scenario
0
50
100
150
200
250
300
350
400
450
2000 2005 2010 2015 2020 2025 2030 2035 2040 2045 2050
PJ
Electricity production, Kenya, BAU (PJ)
Geothermal
SolarPV
Wind
Biomass
Hydropower
Fossilfuels
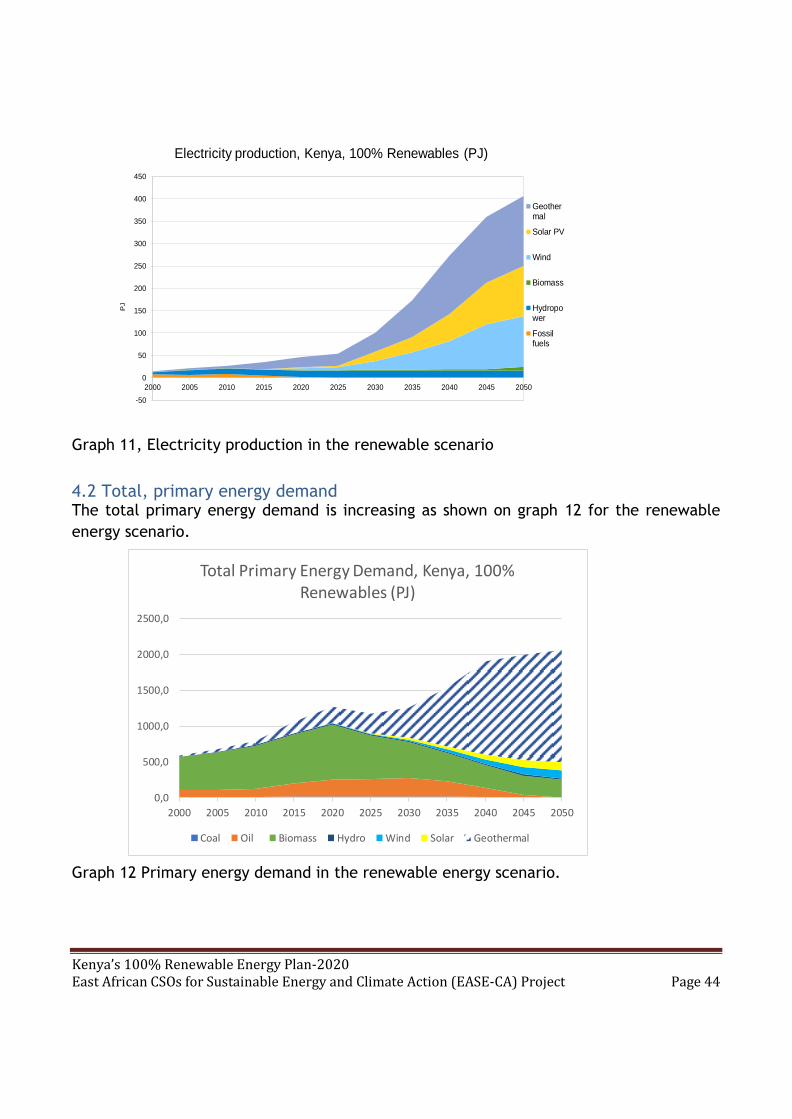
Kenya’s 100% Renewable Energy Plan-2020 East African CSOs for Sustainable Energy and Climate Action (EASE-CA) Project Page 44
Graph 11, Electricity production in the renewable scenario
4.2 Total, primary energy demand The total primary energy demand is increasing as shown on graph 12 for the renewable
energy scenario.
Graph 12 Primary energy demand in the renewable energy scenario.
-50
0
50
100
150
200
250
300
350
400
450
2000 2005 2010 2015 2020 2025 2030 2035 2040 2045 2050
PJ
Electricity production, Kenya, 100% Renewables (PJ)
Geothermal
Solar PV
Wind
Biomass
Hydropower
Fossilfuels
0,0
500,0
1000,0
1500,0
2000,0
2500,0
2000 2005 2010 2015 2020 2025 2030 2035 2040 2045 2050
Total Primary Energy Demand, Kenya, 100% Renewables (PJ)
Coal Oil Biomass Hydro Wind Solar Geothermal
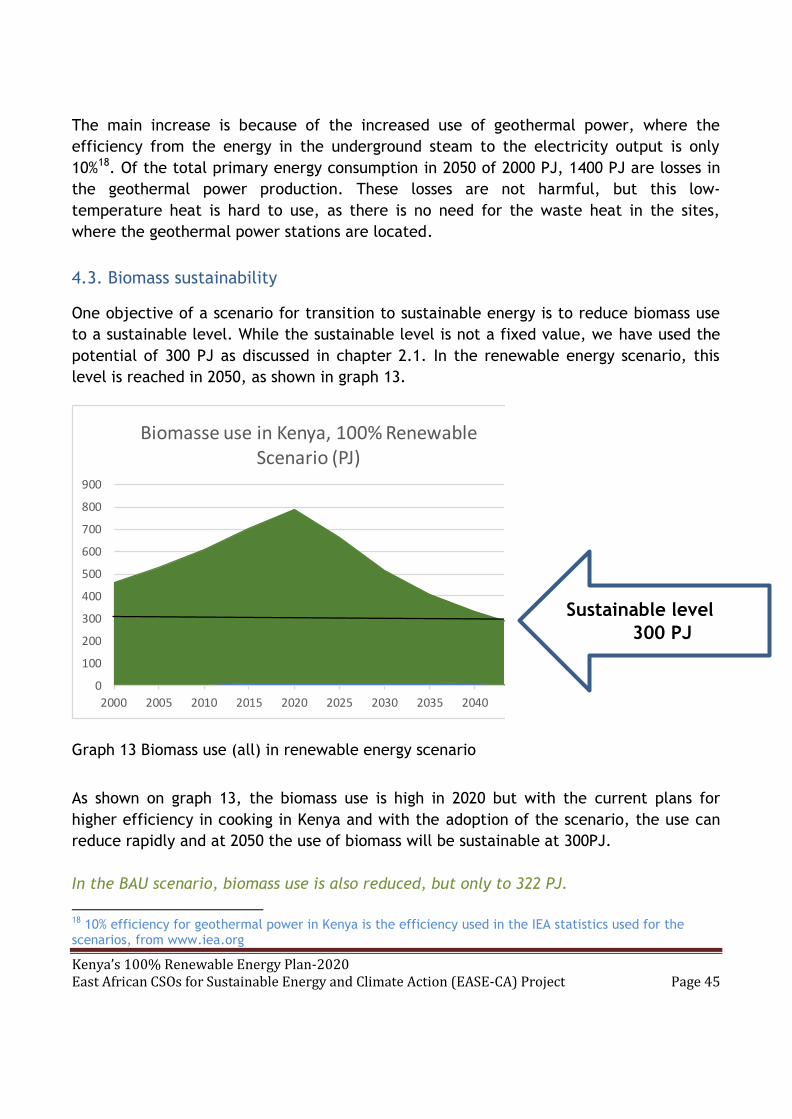
Kenya’s 100% Renewable Energy Plan-2020 East African CSOs for Sustainable Energy and Climate Action (EASE-CA) Project Page 45
The main increase is because of the increased use of geothermal power, where the
efficiency from the energy in the underground steam to the electricity output is only
10%18. Of the total primary energy consumption in 2050 of 2000 PJ, 1400 PJ are losses in
the geothermal power production. These losses are not harmful, but this low-
temperature heat is hard to use, as there is no need for the waste heat in the sites,
where the geothermal power stations are located.
4.3. Biomass sustainability
One objective of a scenario for transition to sustainable energy is to reduce biomass use
to a sustainable level. While the sustainable level is not a fixed value, we have used the
potential of 300 PJ as discussed in chapter 2.1. In the renewable energy scenario, this
level is reached in 2050, as shown in graph 13.
Graph 13 Biomass use (all) in renewable energy scenario
As shown on graph 13, the biomass use is high in 2020 but with the current plans for
higher efficiency in cooking in Kenya and with the adoption of the scenario, the use can
reduce rapidly and at 2050 the use of biomass will be sustainable at 300PJ.
In the BAU scenario, biomass use is also reduced, but only to 322 PJ.
18 10% efficiency for geothermal power in Kenya is the efficiency used in the IEA statistics used for the scenarios, from www.iea.org
0
100
200
300
400
500
600
700
800
900
2000 2005 2010 2015 2020 2025 2030 2035 2040 2045 2050
Biomasse use in Kenya, 100% Renewable Scenario (PJ)
Sustainable level
300 PJ

Kenya’s 100% Renewable Energy Plan-2020 East African CSOs for Sustainable Energy and Climate Action (EASE-CA) Project Page 46
4.4 CO2 emissions from Energy
With the phase out of fossil fuel use, the CO2 emissions from fossil fuel use will also be
phased out. In the renewable energy scenario, also the CO2 emissions from unsustainable
biomass use can be phased out. In the BAU scenario, the CO2 emissions from fossil use will
increase, but the CO2 emissions from unsustainable biomass use will be reduced.
The development of CO2 emissions from fossil fuel use is shown in graph 14 and graph 15
for the two scenarios.
Graph 14 CO2 emissions from fossil fuel use, BAU scenario
0
5
10
15
20
25
30
35
40
45
50
2000 2005 2010 2015 2020 2025 2030 2035 2040 2045 2050
Emissions from energy, Kenya, BAU million tons CO2/år
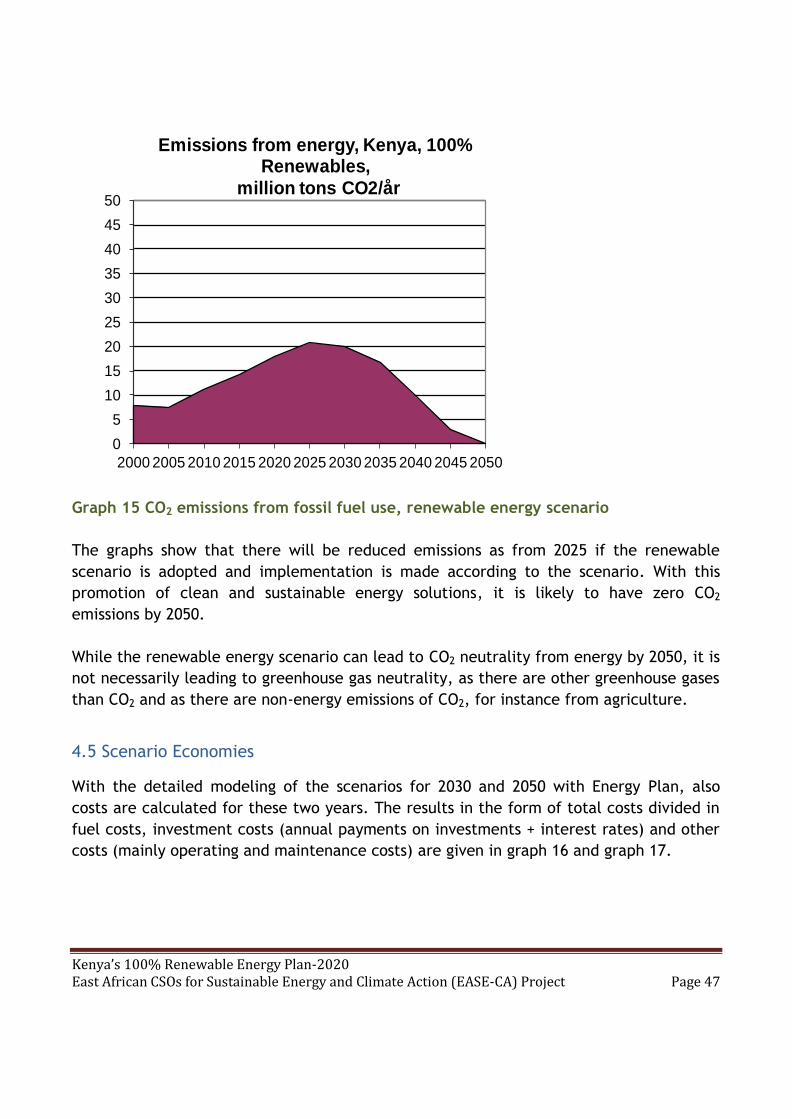
Kenya’s 100% Renewable Energy Plan-2020 East African CSOs for Sustainable Energy and Climate Action (EASE-CA) Project Page 47
Graph 15 CO2 emissions from fossil fuel use, renewable energy scenario
The graphs show that there will be reduced emissions as from 2025 if the renewable
scenario is adopted and implementation is made according to the scenario. With this
promotion of clean and sustainable energy solutions, it is likely to have zero CO2
emissions by 2050.
While the renewable energy scenario can lead to CO2 neutrality from energy by 2050, it is
not necessarily leading to greenhouse gas neutrality, as there are other greenhouse gases
than CO2 and as there are non-energy emissions of CO2, for instance from agriculture.
4.5 Scenario Economies
With the detailed modeling of the scenarios for 2030 and 2050 with Energy Plan, also
costs are calculated for these two years. The results in the form of total costs divided in
fuel costs, investment costs (annual payments on investments + interest rates) and other
costs (mainly operating and maintenance costs) are given in graph 16 and graph 17.
0
5
10
15
20
25
30
35
40
45
50
2000 2005 2010 2015 2020 2025 2030 2035 2040 2045 2050
Emissions from energy, Kenya, 100% Renewables,
million tons CO2/år
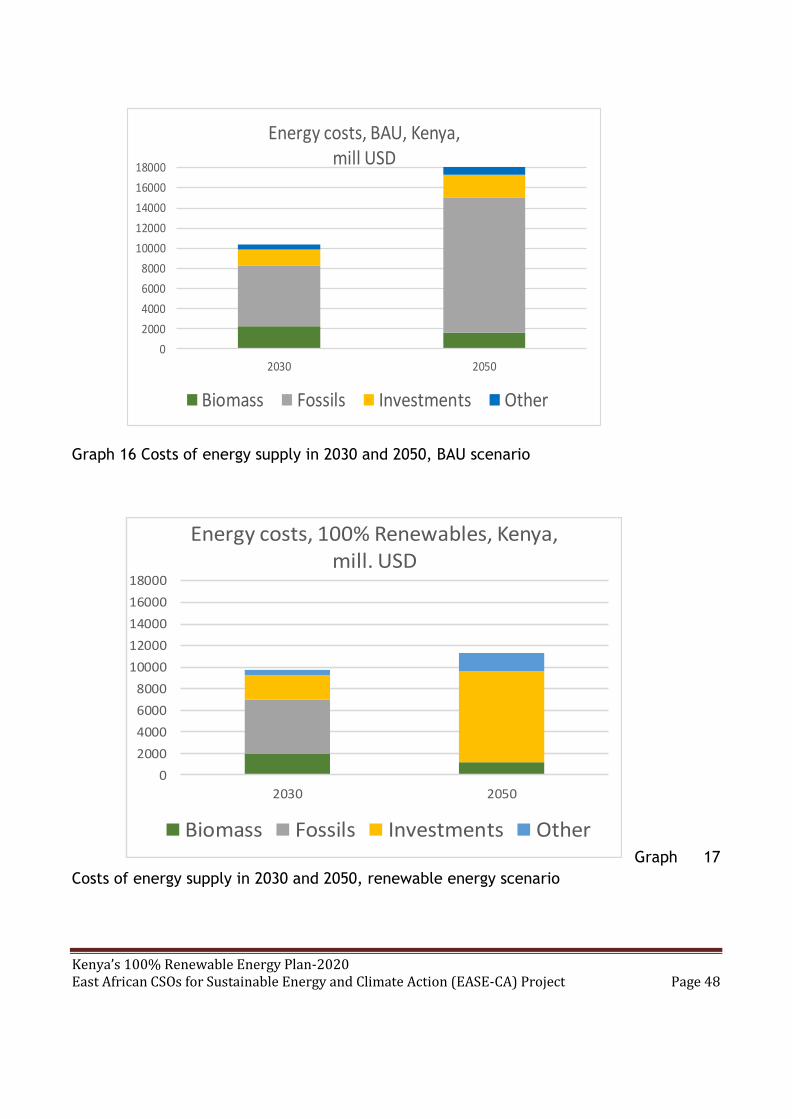
Kenya’s 100% Renewable Energy Plan-2020 East African CSOs for Sustainable Energy and Climate Action (EASE-CA) Project Page 48
Graph 16 Costs of energy supply in 2030 and 2050, BAU scenario
Graph 17
Costs of energy supply in 2030 and 2050, renewable energy scenario
0
2000
4000
6000
8000
10000
12000
14000
16000
18000
2030 2050
Energy costs, 100% Renewables, Kenya, mill. USD
Biomass Fossils Investments Other
0
2000
4000
6000
8000
10000
12000
14000
16000
18000
2030 2050
Energy costs, BAU, Kenya, mill USD
Biomass Fossils Investments Other

Kenya’s 100% Renewable Energy Plan-2020 East African CSOs for Sustainable Energy and Climate Action (EASE-CA) Project Page 49
The graphs show that energy supply is cheaper in the renewable energy scenario
compared with the BAU (Business As Usual) scenario. The difference is particular high for
2050, where energy supply costs in the renewable energy scenario are only 2/3 of the
costs of the BAU scenario.
The costs only include energy supply costs, but not end-use equipments as efficient
stoves and electric vehicles. Many experts estimate that electric vehicles will have same
costs as fossil fuel vehicles within a decade, but today they are more expensive.
The costs also does not include costs of electric networks, except for costs of electricity
losses and of investments in electric interconnectors.
Costs estimates are sensitive to all inputs. One important input is the interest rate, and
as most costs of the renewable energy scenario in 2050 are investment costs, the interest
rate of 10% is important for the costs of the investments. If interest fall, as they have
done in Europe and USA, the renewable energy scenario will be considerably cheaper.
Another important input is the fuel costs. The fuel costs are given in Annex 3. Some costs
in 2050 are:
Diesel oil 17.7 USD/GJ at refinery and 19.8 USD/GJ at gas stations, equal to a
crude oil price around 54 USD/barrel19
Wood for energy 3 USD/GJ at source and 6 USD/GJ at household user, equal to
around 35 K.Sh/kg at source and 70 KSh/kg at household
Given the large economic benefits of the renewable energy scenario, smaller variations in
the fuel prices will not change the conclusion that the renewable energy scenario will be
the cheapest, in particular after 2030.
19
Calculated with the assumption that diesel prices are twice the price of crude oil, and with the conversion of 1 barrel of oil = 6.12 GJ

Kenya’s 100% Renewable Energy Plan-2020 East African CSOs for Sustainable Energy and Climate Action (EASE-CA) Project Page 50
CHAPTER FIVE
5.0 ACTORS and RECOMMENDATIONS
5.1 The Scenario actors In both scenarios, key individuals, groups, and/or institutions play different roles. The
choices they make or the decisions they take often determine the kind of future we are
likely to face.
These actors include:-
Government – is a critical in player policy formulation and implementation as well as
ownership and service provision of energy sector. The future outcomes are fundamentally
based on the policy decisions made, the regulatory framework set, the management of
ownership and service provision in the energy sector. The level of government financing
of projects will also determine the future.
The private sector – plays the crucial role of providing independent energy supply,
equipment, and others. Their role could grow overtime in power generation, distribution
and supply, but if the business environment is not conducive, they could slow down their
investments or relocate to more business friendly environments. They also determine
levels of energy cost based on level of competition. It can also be a conservative factor,
clinging to fossil fuels in spite of better alternatives.
Ordinary citizens –form part of the end users of the energy supply. They are important
players in increasing or reducing CO2 emissions based on their cultural habits, choice of
energy and spending patterns on energy.
Development partners – are critical in financing energy projects. The outcome is based
on whether they give the resources or not as well as the conditionality attached to their
resources.
Technical experts – will determine research and innovation as well as transfer of
technologies. They also give guidance to the governments.
Foreign investors – provide capital, but also repatriation of resources. They can provide
competition, which can help in regulation of market prices, but they can also monopolize
sectors.
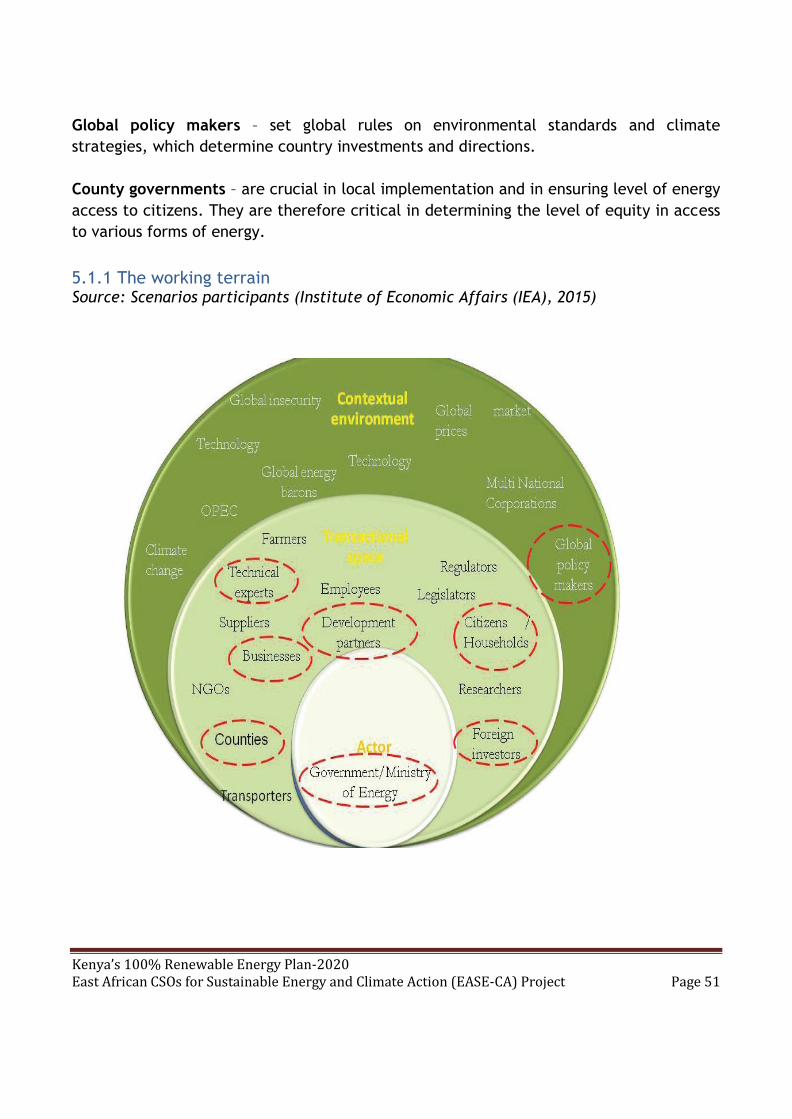
Kenya’s 100% Renewable Energy Plan-2020 East African CSOs for Sustainable Energy and Climate Action (EASE-CA) Project Page 51
Global policy makers – set global rules on environmental standards and climate
strategies, which determine country investments and directions.
County governments – are crucial in local implementation and in ensuring level of energy
access to citizens. They are therefore critical in determining the level of equity in access
to various forms of energy.
5.1.1 The working terrain Source: Scenarios participants (Institute of Economic Affairs (IEA), 2015)

Kenya’s 100% Renewable Energy Plan-2020 East African CSOs for Sustainable Energy and Climate Action (EASE-CA) Project Page 52
5.2 Policy Recommendations
Policies and strategic choices are crucial, if Kenya is to realize the renewable energy
scenario in accordance, following from the vision 2030, the constitution, and the greening
policy framework. Following are the recommendations:-
1) Energy expansion is crucial if the country is to provide all with energy access and
provide energy for developments that can improve the country’s economic
performance.
2) Investing in modern energy solutions with energy efficiency and cleaner,
renewable energy should be priorities. There should be high priority on efficient
cooking, but all sectors must be in the scope for increased energy efficiency.
3) Diversifying the energy mix into different renewables to reduce over-reliance on
finite resources like hydro-generation and petroleum sources of energy without
creating new dependencies on energy imports.
4) Fully exploiting clean and renewable energy sources that are locally available like
geothermal, wind and solar.
5) Fully exploit energy efficiency potentials in all sectors with capacity building on
energy efficiency, regulation, and energy audits in domestic, service, and
industrial sectors.
6) Managing the cost of energy through optimal combination of energy efficiency and
affordable renewable energy should be a priority. Expensive energy solutions as
nuclear power should be avoided.
7) Make biomass use for energy sustainable with a combination of efficient biomass
use, efficient charcoal production, increased supply with plantations etc. and
change to affordable alternatives based on renewable energy as they become
available. This shall include better enforcement of the legal and regulatory
framework for sustainable production, distribution and marketing of biomass as
well as stronger promotion of sustainable afforestation programmes.
8) Make transport energy sustainable with use of electric transport, based on
renewable electricity.
9) Raising public awareness of more efficient energy use, including energy efficiency
measures, local use of renewable energy, and new technology developments.
There is a need to raise awareness of the potentials and benefits of renewable
energy, including biogas and solar energy for electricity and heat.

Kenya’s 100% Renewable Energy Plan-2020 East African CSOs for Sustainable Energy and Climate Action (EASE-CA) Project Page 53
10) Reducing the geo-political tensions with regional neighbors and
carefully/transparently negotiating bilateral and multi-lateral agreements with
them to ensure mutual benefit and successful regional integration and
cooperation, also on sustainable energy, allowing a larger market for renewable
energy and energy efficiency.
11) Involving local communities and county governments along the entire energy chain
as well as transparent and accountable management of resources for the mutual
benefit of all to reduce tensions and enhance ownership of projects. Local
communities must be included in decisions on siting of renewable energy
installations (solar, wind, geothermal, hydro), and have benefits that at least
compensate for the change in land-use that affects them. The benefits should be
long-lasting and can include job opportunities, affordable power supply, and
infrastructure as better water supply. Renewable energy installations shall create
local development.
12) Gender mainstreaming in the implementation of energy projects and programs.
13) Deliberately creating local capacity on all levels in the new energy areas to create
employment and reduce foreign domination of labor in the sector. This shall
include increasing the expertise in Kenya in geothermal energy, windpower, and
biogas.
14) Develop Investment cost Frameworks to guide private sector investment in DREs;
especially for high capital intensive like mini-grids and grid extension for rural
electrification. There is also need to review the existing policies and provisions to
protect the private sectors in energy sector from exploitation in energy research,
innovations, production and benefits by the government as a way to facilitate
sustainable partnerships.
15) Improving regulatory compliance of existing provisions as well as formulation of
legal and regulatory framework of energy technologies and resources. This include
regulatory compliance of natural gas and oil resources to be able to effectively
manage extraction and exploitation, have clear revenue distribution, eradicate
corruption, and set sunset dates in line with the Paris Agreement and the
renewable energy scenario. It also includes enforcement of standards and
regulations for renewable energy, in particular solar technologies, to avoid sub-
standard equipment.
16) Fiscal investment in greening of the economy to reduce the impact of climate
change and environmental degradation.
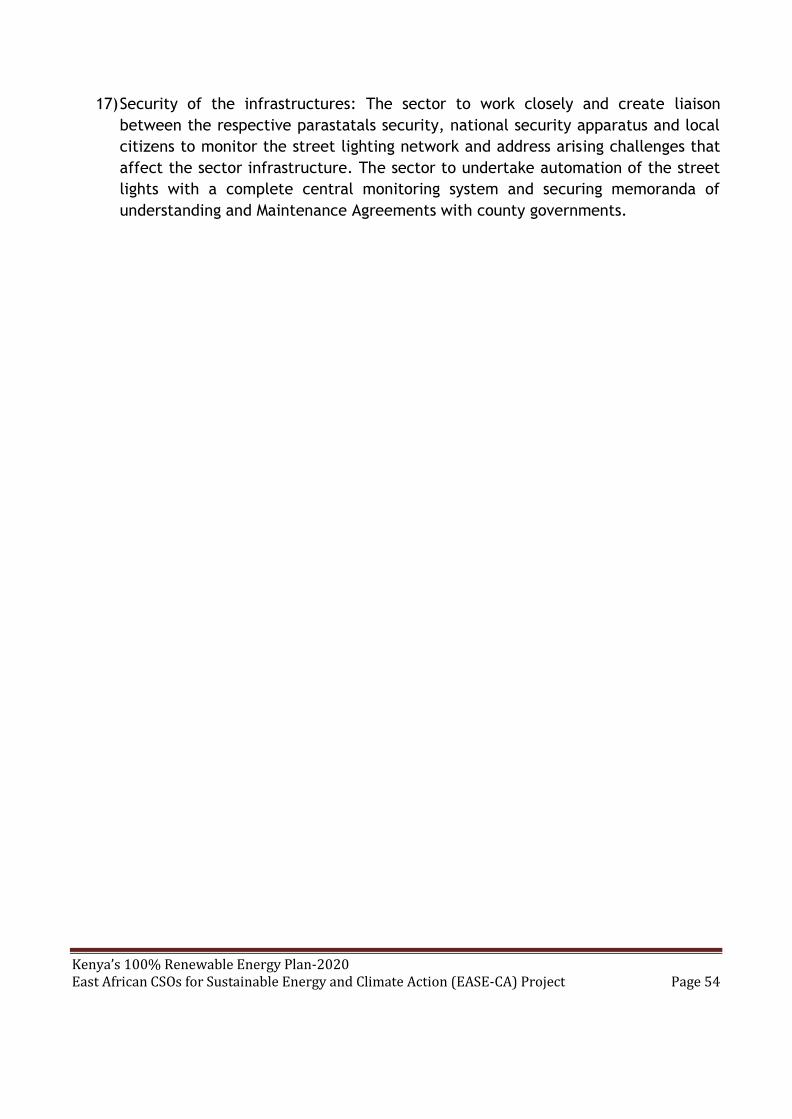
Kenya’s 100% Renewable Energy Plan-2020 East African CSOs for Sustainable Energy and Climate Action (EASE-CA) Project Page 54
17) Security of the infrastructures: The sector to work closely and create liaison
between the respective parastatals security, national security apparatus and local
citizens to monitor the street lighting network and address arising challenges that
affect the sector infrastructure. The sector to undertake automation of the street
lights with a complete central monitoring system and securing memoranda of
understanding and Maintenance Agreements with county governments.
Kenya’s 100% Renewable Energy Plan-2020 East African CSOs for Sustainable Energy and Climate Action (EASE-CA) Project Page 55
REFERENCES
Energy for Sustainable Development Africa (2005) National Charcoal Survey:
Exploring potential for sustainable charcoal industry in Kenya.
Republic of Kenya (2002) Study on Kenya’s Energy Demand, Supply and Policy
Strategy for Households, Small Scale Industries and Service Establishments.
Ministry of Energy, Nairobi, Kenya.
Republic of Kenya (2004) Sessional Paper No. 4 of 2004 on Energy. Government
Printers. Nairobi, Kenya.
Republic of Kenya (2019) the Energy Act 2019. Government Printers. Nairobi,
Kenya.
“Energy Performance Baselines and Benchmarks and the Designation of Industrial,
Commercial and Institutional Energy Users in Kenya”, Energy Regulatory
Commission, Feb. 2013
Government of Kenya 2011. Updated Least Cost Power Development Plan 2011 –
2030. Vision 2030. Government printer, Nairobi
Government of Kenya. Vision 2030 Document. Government Printers, Nairobi.
African Development Bank. Energy Sector Policy of the AfDB Group.
Africa Oil, “Annual Information Form”, 2012
“Available charcoal production technologies in Kenya (Draft Copy)”, UNDP, Kenya
Forest Service,
“Biogas Systems in Kenya: A Feasibility Study”, Biogas for Better Life An African
Initiative, 2007
Biomass Energy Use in Kenya, International Institute for Environment and
Development, 2010
Global Alliance for Clean Cookstoves - Kenya National Action Plan (2013)
GoK & SE4ALL. (2013). Rapid Assessment and Gap Analysis (RAGA).
SE4ALL. (2016, January). Sustainable Energy for All - Global Action Agenda.
Retrieved
"GDC - Geothermal Development Company". Gdc.co.ke. Retrieved 13 April 2018.
"Kenya on the cusp of a geothermal energy boom". theeastafrican.co.ke. Retrieved
13 April 2018.
Gachenge, Beatrice. "Kenya opens Africa's first carbon exchange". reuters.com.
Retrieved 13 April 2018.
Kenya’s 100% Renewable Energy Plan-2020 East African CSOs for Sustainable Energy and Climate Action (EASE-CA) Project Page 56
Kenya’s National Climate Change Action Plan (2018-2022)
"INSIDE STORY: Nationally Appropriate Mitigation Action (NAMA) to accelerate
geothermal power: Lessons from Kenya - Climate and Development Knowledge
Network". cdkn.org. Retrieved 13 April 2018.
https://www.worldbank.org/en/news/press-release/2018/12/06/kenya-launches-
ambitious-plan-to-provide-electricity-to-all-citizens-by-2022
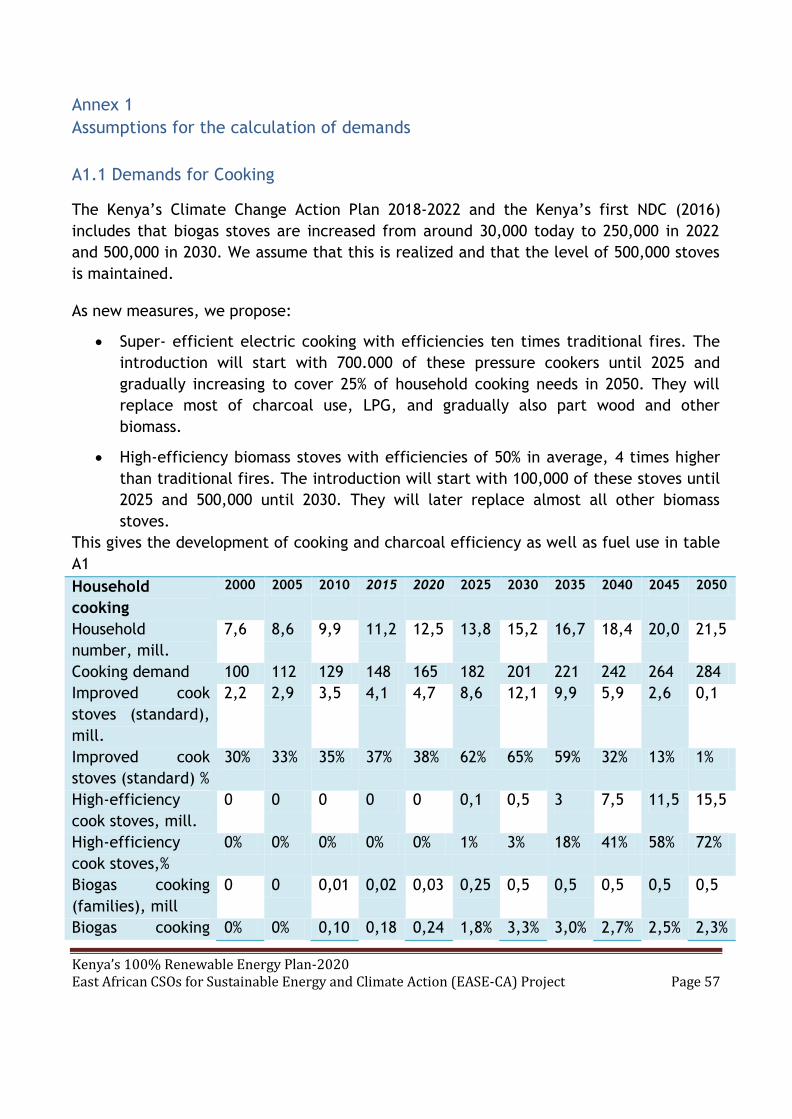
Kenya’s 100% Renewable Energy Plan-2020 East African CSOs for Sustainable Energy and Climate Action (EASE-CA) Project Page 57
Annex 1
Assumptions for the calculation of demands
A1.1 Demands for Cooking
The Kenya’s Climate Change Action Plan 2018-2022 and the Kenya’s first NDC (2016)
includes that biogas stoves are increased from around 30,000 today to 250,000 in 2022
and 500,000 in 2030. We assume that this is realized and that the level of 500,000 stoves
is maintained.
As new measures, we propose:
Super- efficient electric cooking with efficiencies ten times traditional fires. The
introduction will start with 700.000 of these pressure cookers until 2025 and
gradually increasing to cover 25% of household cooking needs in 2050. They will
replace most of charcoal use, LPG, and gradually also part wood and other
biomass.
High-efficiency biomass stoves with efficiencies of 50% in average, 4 times higher
than traditional fires. The introduction will start with 100,000 of these stoves until
2025 and 500,000 until 2030. They will later replace almost all other biomass
stoves.
This gives the development of cooking and charcoal efficiency as well as fuel use in table
A1
Household
cooking
2000 2005 2010 2015 2020 2025 2030 2035 2040 2045 2050
Household
number, mill.
7,6 8,6 9,9 11,2 12,5 13,8 15,2 16,7 18,4 20,0 21,5
Cooking demand 100 112 129 148 165 182 201 221 242 264 284
Improved cook
stoves (standard),
mill.
2,2 2,9 3,5 4,1 4,7 8,6 12,1 9,9 5,9 2,6 0,1
Improved cook
stoves (standard) %
30% 33% 35% 37% 38% 62% 65% 59% 32% 13% 1%
High-efficiency
cook stoves, mill.
0 0 0 0 0 0,1 0,5 3 7,5 11,5 15,5
High-efficiency
cook stoves,%
0% 0% 0% 0% 0% 1% 3% 18% 41% 58% 72%
Biogas cooking
(families), mill
0 0 0,01 0,02 0,03 0,25 0,5 0,5 0,5 0,5 0,5
Biogas cooking 0% 0% 0,10 0,18 0,24 1,8% 3,3% 3,0% 2,7% 2,5% 2,3%

Kenya’s 100% Renewable Energy Plan-2020 East African CSOs for Sustainable Energy and Climate Action (EASE-CA) Project Page 58
(families), % % % %
Super-efficient
electric cooking,
number
0 0 0 0 0 0,7 1,5 2,5 3,7 5,0 5,4
Super-efficient
electric cooking, %
0% 0% 0% 0% 0% 5% 10% 15% 20% 25% 25%
Traditional
cooking, %
70% 67% 65% 63% 62% 30% 18% 5% 4% 2% 0%
Average
efficiency, all
14% 14% 14% 14% 14% 17% 20% 26% 33% 45% 58%
Specific demand,
2000 basis
100
%
98% 97% 97% 96% 78% 68% 53% 41% 30% 23%
Average,
efficiency, solid
biomass
14% 14% 14% 14% 14% 17% 18% 22% 28% 37% 49%
Specific demand,
2000 basis, solid
biomass
100
%
98% 98% 97% 96% 82% 76% 62% 49% 37% 28%
Table A1, development of main cooking types and cooking efficiency with above
assumptions for the 100% renewable energy scenario
From table A1 can be calculated share of cooking with solid biomass as the development
of the volume of cooking with biomass relative to year 2000 multiplied with the specific
efficiency of biomass. In this way is calculated the biomass demand for household cooking
relative to the year 2000. See results in table A2.
200
0
200
5
201
0
201
5
202
0
202
5
203
0
203
5
204
0
204
5
205
0
Solid biomass
share of cooking 99% 99% 99% 99% 98% 93% 87% 82% 77% 72% 73%
Cooking with solid
biomass 100 112 129 148 164 170 174 181 187 191 206
Solid biomass
demand for
cooking 100 110 126 143 158 140 132 112 91 70 57
Table A2: demand for cooking and for biomass for cooking with estimated development
of specific energy demand for

Kenya’s 100% Renewable Energy Plan-2020 East African CSOs for Sustainable Energy and Climate Action (EASE-CA) Project Page 59
A1.2. Biomass Demand Distribution on Sectors
Annual statistics from IEA give the total end-use of biomass, but not the division between
sectors: households, service sector, and industry. This division is derived from a specific
study on this, based in data from the year 2000.
In table A3, the division is given between households and cottage industries for the year
2000
Firewoo
d
(Tons/yr)
Wood for
Charcoal
(tons/yr)
Wood
Waste
(tonne
s/yr)
Farm
Residue
(tonnes/
yr)
Kerosene
(litres/yr)
LPG
(kg/yr)
Electricity
(Kwh/yr)
Rural
Househol
d
14,065,004 7,624,935 136,459 2,649,981 172,761,463 1,406,270 93,376,810
Urban
Househol
d
358,709 6,020,663 83,863 12,832 150,707,171 16,883,884 723,013,990
Cottage
Industry
467,145 2,860,900 2,142,950 7,021,875 353,558,397
TOTAL 14,890,858 16,506,498 220,321 2,662,813 325,611,584 25,312,028 1,169,949,197
Table A3 Annual consumption of various energy types in households and cottage
industries (2000)20
To this should be added consumption in industry and commercial sectors given in table A2
below, data from the same study;
Annual fuel wood and
charcoal consumption by
cottage industries Industry
Quantity of fuel
wood in
tonnes/year
Quantity of charcoal in
tonnes/year
Brick making 55,772 -
Tobacco 78,365 -
Milk processing 4,900 540
Fishing and fish smoking 17,960 -
Jaggary 180,000 -
Bakeries 20,665 622
Restaurants/kiosks 1,276,155 428,025
Tea Industry 155,000 -
Total 1,788,817 429,187
20 Source: Republic of Kenya (2002) Study on Kenya’s Energy Demand, Supply and Policy Strategy for Households, Small Scale Industries and Service Establishments. Ministry of Energy, Nairobi, Kenya.

Kenya’s 100% Renewable Energy Plan-2020 East African CSOs for Sustainable Energy and Climate Action (EASE-CA) Project Page 60
Table A4, Annual fuel wood and charcoal consumption by cottage industries and
industries21
Based on these data, we calculate the division of biomass use in industry, service sector
and households. The results for charcoal and for other biomass are given in table A3
(table A3 is also in the main report). For the calculation for the figures in table A3, the
following conversion factors are used:-
Between wood for charcoal and charcoal, the factor is 10%, i.e. only 10% of the
energy and the mass of wood for charcoal are becoming mass and energy in the
charcoal, the rest is lost in the process.22
Between residues and wood, the factor is 75%, i.e. the energy content per ton of
residues is 75% of the energy content of wood.
Division of
biomass
Wood, wood waste
and agriculture
residues
Charcoal Sector composition
in
tons/year
in
percen
tage
In tons/year In per-
Centage
Industry 136.082 0,7% 540 0,03% Brick making
Service sector 1.763.965 9,5% 714.737 34% Bakeries, restaurants and
kiosks, cottage industry
Households 16.641.145 89,8% 1.364.560 66% Rural and urban
households
Total 18.541.192 100,0% 2.079.837 100%
Table A5, division of solid biomass use across end-use sectors
We will use the fractions in table A5 to divide biomass use between sectors, while the
total biomass use will be according to IEA data for 2000 – 2015 and for 2020 using the
trend 2015-2017 of IEA data. The IEA divides solid biomass use in end-use of solid biomass
and solid biomass for “Other transformation”, which is charcoal production. In addition, a
small fraction (0.2%) is used for electricity production according to IEA.
A1.3 Development of Final Energy Demand
Based on assumptions in this annex and in chapter 2, the final energy demand is
calculated for the scenarios. The results are given in table A6 and A7 divided in sectors
21 Source: Republic of Kenya (2002), op.cit. 22 Charcoal data are from energypedia, see https://energypedia.info/wiki/Charcoal_Production

Kenya’s 100% Renewable Energy Plan-2020 East African CSOs for Sustainable Energy and Climate Action (EASE-CA) Project Page 61
for the two scenarios. For the renewable energy scenario, final energy demand is also
divided in energy carriers, in table A8
Consumption' 2000 2005 2010 2015 2020 2025 2030 2035 2040 2045 2050
Road 39 42 73 119 175 213 237 248 237 224 202
Rail 1 0 0 0 3 4 4 5 5 6 7
Industry 28 36 49 59 61 68 74 75 71 62 75
Construction 0 0 0 0 0 0 0 0 0 0 0
Agriculture 3 1 1 1 1 1 1 1 1 1 1
Service
sectors
30 34 41 47 58 54 55 53 52 51 53
Households 242 272 313 362 402 340 321 280 241 209 186
Total 342 386 477 589 699 677 694 662 608 553 523
Table A6, final energy demand divided in sectors, renewable energy scenario
Consumption' 2000 2005 2010 2015 2020 2025 2030 2035 2040 2045 2050
Road 39 42 73 119 175 213 258 312 376 453 543
Rail 1 0 0 0 3 4 5 6 7 8 10
Industry 28 36 49 59 61 68 77 88 101 117 142
Agriculture 3 1 1 1 1 1 1 1 1 1 1
Service
sectors
30 34 41 47 58 62 60 59 60 61 62
Households 242 272 313 362 402 355 353 317 282 250 219
Sum 342 386 477 589 699 703 754 783 827 889 976
Table A7, final energy demand divided in sectors, BAU scenario
End-use,
PJ
2000 2005 2010 2015 2020 2025 2030 2035 2040 2045 2050
Electricit
y
12 17 22 29 37 44 79 130 194 240 278
Hydrogen 0 0 0 0 0 0 0 12 28 54 49
Charcoal 23 26 30 34 39 31 28 22 17 13 13
Wood,
bio
202 242 272 329 376 339 300 256 220 190 166
Biogas 0 0 0 0 0.9 8 16 16 16 16 16
Oil 103 99 148 184 232 240 257 211 124 40 0
Coal 2 2 4 13 13 15 14 15 8 0 0
Table A8: Development of end-use energy demand in the renewable energy scenario, divided in energy carriers
Annex 2
A2.1 Development forecasts for Kenya
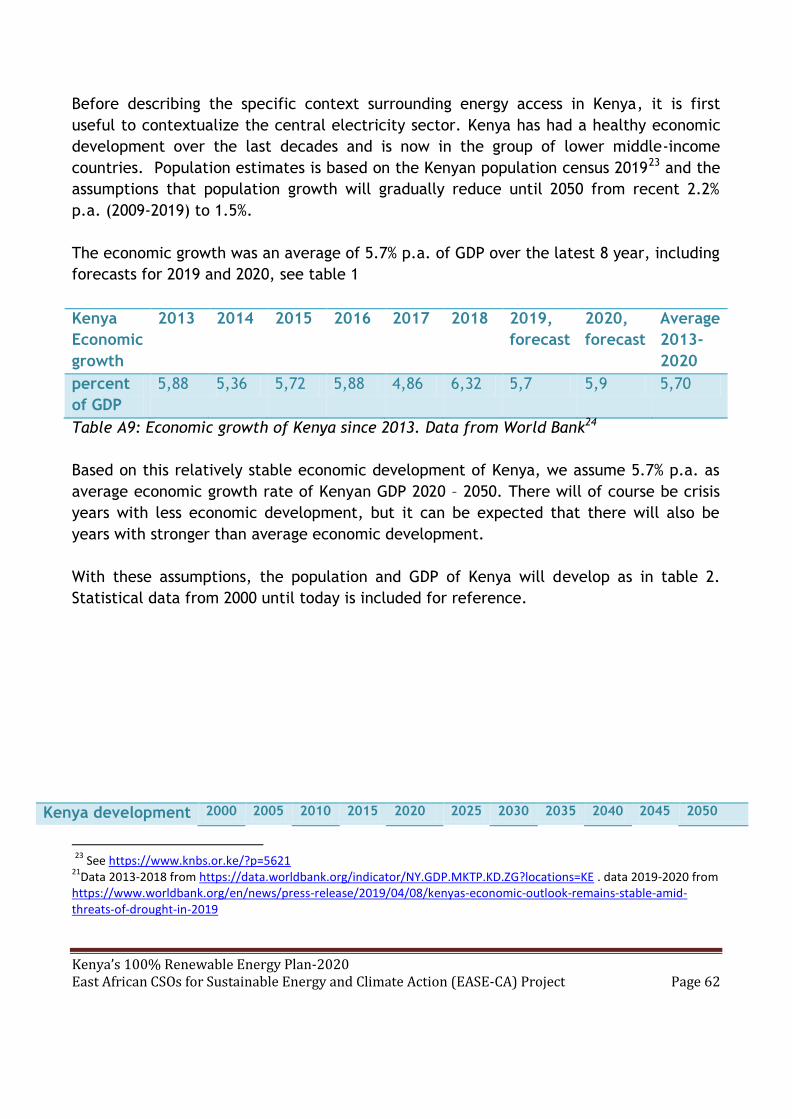
Kenya’s 100% Renewable Energy Plan-2020 East African CSOs for Sustainable Energy and Climate Action (EASE-CA) Project Page 62
Before describing the specific context surrounding energy access in Kenya, it is first
useful to contextualize the central electricity sector. Kenya has had a healthy economic
development over the last decades and is now in the group of lower middle-income
countries. Population estimates is based on the Kenyan population census 201923 and the
assumptions that population growth will gradually reduce until 2050 from recent 2.2%
p.a. (2009-2019) to 1.5%.
The economic growth was an average of 5.7% p.a. of GDP over the latest 8 year, including
forecasts for 2019 and 2020, see table 1
Kenya
Economic
growth
2013 2014 2015 2016 2017 2018 2019,
forecast
2020,
forecast
Average
2013-
2020
percent
of GDP
5,88 5,36 5,72 5,88 4,86 6,32 5,7 5,9 5,70
Table A9: Economic growth of Kenya since 2013. Data from World Bank24
Based on this relatively stable economic development of Kenya, we assume 5.7% p.a. as
average economic growth rate of Kenyan GDP 2020 – 2050. There will of course be crisis
years with less economic development, but it can be expected that there will also be
years with stronger than average economic development.
With these assumptions, the population and GDP of Kenya will develop as in table 2.
Statistical data from 2000 until today is included for reference.
Kenya development 2000 2005 2010 2015 2020 2025 2030 2035 2040 2045 2050
23
See https://www.knbs.or.ke/?p=5621 21
Data 2013-2018 from https://data.worldbank.org/indicator/NY.GDP.MKTP.KD.ZG?locations=KE . data 2019-2020 from https://www.worldbank.org/en/news/press-release/2019/04/08/kenyas-economic-outlook-remains-stable-amid-threats-of-drought-in-2019
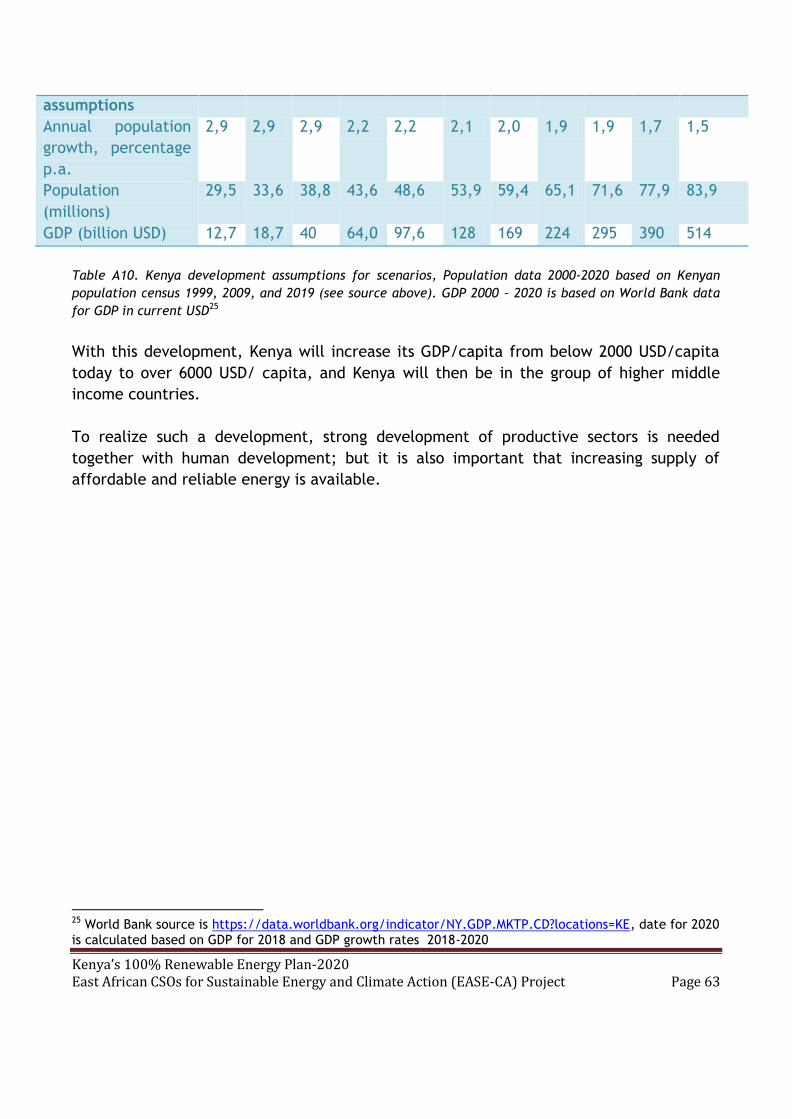
Kenya’s 100% Renewable Energy Plan-2020 East African CSOs for Sustainable Energy and Climate Action (EASE-CA) Project Page 63
assumptions
Annual population
growth, percentage
p.a.
2,9 2,9 2,9 2,2 2,2 2,1 2,0 1,9 1,9 1,7 1,5
Population
(millions)
29,5 33,6 38,8 43,6 48,6 53,9 59,4 65,1 71,6 77,9 83,9
GDP (billion USD) 12,7 18,7 40 64,0 97,6 128 169 224 295 390 514
Table A10. Kenya development assumptions for scenarios, Population data 2000-2020 based on Kenyan
population census 1999, 2009, and 2019 (see source above). GDP 2000 – 2020 is based on World Bank data
for GDP in current USD25
With this development, Kenya will increase its GDP/capita from below 2000 USD/capita
today to over 6000 USD/ capita, and Kenya will then be in the group of higher middle
income countries.
To realize such a development, strong development of productive sectors is needed
together with human development; but it is also important that increasing supply of
affordable and reliable energy is available.
25 World Bank source is https://data.worldbank.org/indicator/NY.GDP.MKTP.CD?locations=KE, date for 2020 is calculated based on GDP for 2018 and GDP growth rates 2018-2020
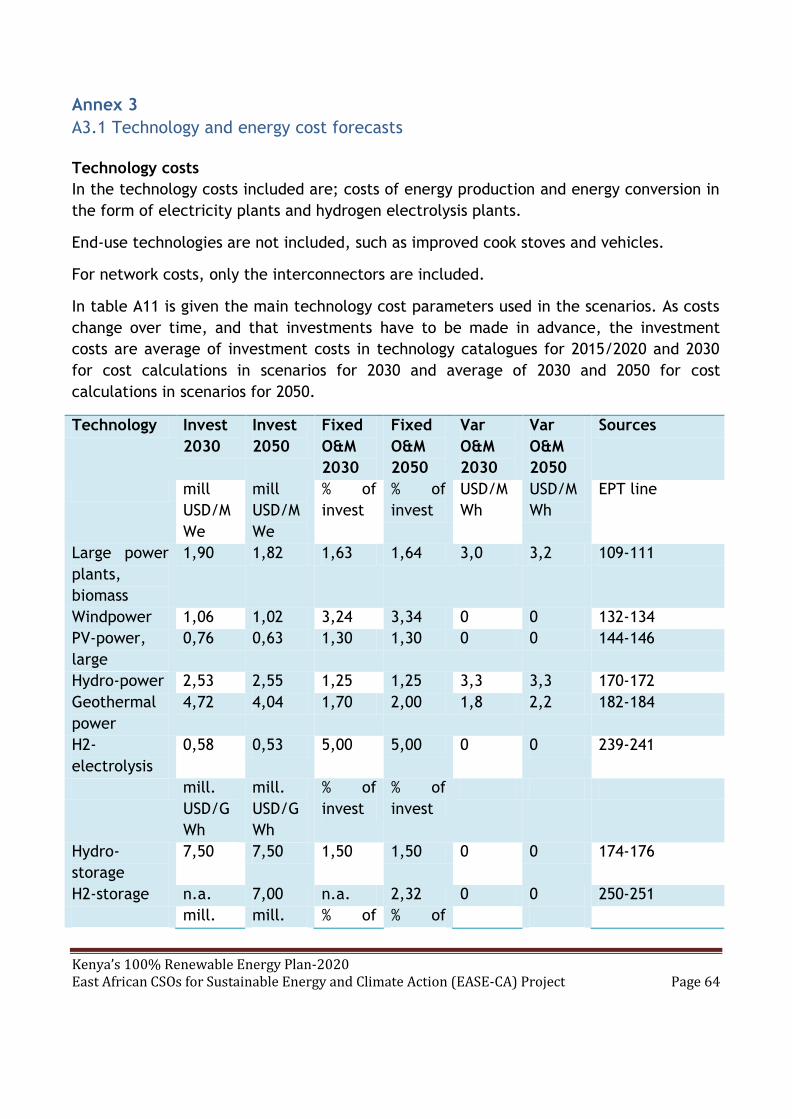
Kenya’s 100% Renewable Energy Plan-2020 East African CSOs for Sustainable Energy and Climate Action (EASE-CA) Project Page 64
Annex 3
A3.1 Technology and energy cost forecasts
Technology costs
In the technology costs included are; costs of energy production and energy conversion in
the form of electricity plants and hydrogen electrolysis plants.
End-use technologies are not included, such as improved cook stoves and vehicles.
For network costs, only the interconnectors are included.
In table A11 is given the main technology cost parameters used in the scenarios. As costs
change over time, and that investments have to be made in advance, the investment
costs are average of investment costs in technology catalogues for 2015/2020 and 2030
for cost calculations in scenarios for 2030 and average of 2030 and 2050 for cost
calculations in scenarios for 2050.
Technology Invest
2030
Invest
2050
Fixed
O&M
2030
Fixed
O&M
2050
Var
O&M
2030
Var
O&M
2050
Sources
mill
USD/M
We
mill
USD/M
We
% of
invest
% of
invest
USD/M
Wh
USD/M
Wh
EPT line
Large power
plants,
biomass
1,90 1,82 1,63 1,64 3,0 3,2 109-111
Windpower 1,06 1,02 3,24 3,34 0 0 132-134
PV-power,
large
0,76 0,63 1,30 1,30 0 0 144-146
Hydro-power 2,53 2,55 1,25 1,25 3,3 3,3 170-172
Geothermal
power
4,72 4,04 1,70 2,00 1,8 2,2 182-184
H2-
electrolysis
0,58 0,53 5,00 5,00 0 0 239-241
mill.
USD/G
Wh
mill.
USD/G
Wh
% of
invest
% of
invest
Hydro-
storage
7,50 7,50 1,50 1,50 0 0 174-176
H2-storage n.a. 7,00 n.a. 2,32 0 0 250-251
mill. mill. % of % of

Kenya’s 100% Renewable Energy Plan-2020 East African CSOs for Sustainable Energy and Climate Action (EASE-CA) Project Page 65
USD/T
Wh
gas/ye
ar
USD/T
Wh
gas/ye
ar
invest invest
Biogas plant 185,92 167,61 11,00 11,50 0 0 202-204
mill.
USD/M
W-bio
mill.
USD/M
W-bio
% of
invest
% of
invest
Biodiesel 3,24 2,89 3,77 5,27 0 0 218-220
USD/M
Wh
USD/M
Wh
% of
invest
% of
invest
Interconnect
ors, 1000 km
1,19 1,07 1,50 1,50 0 0 EU JRC
Table A11 Main technology costs for power system 2030 and 2040. Sources are Energy Plan Technology
Catalogue 4.0 (EPT, the numbers in right table column indicate the lines with the technology in the excel
version), and EU Joint Research Center’s (JRC) technology catalogue26
For comparison is current costs of large-scale power supply options today, including non-
renewable options in Table A12
Investment, Fixed O&M
Var.O&M Lifetime Sources Capac. factor
Efficiency
mill. $/MWe % $/MWh Years % %
Geothermal power
4,97 1,6 1,56 30 27 0,95 n.a.
Windpower
1,1 3,2 0 30 28 0,40 n.a.
Solar power
0,92 1,31 0 35 As above
0,21 n.a.
Coal 2,11 1,63 2,61 25 As 0,95 0,46
26
See https://www.energyplan.eu/useful_resources/costdatabase/ and for EU JRC https://publications.jrc.ec.europa.eu/repository/handle/JRC92496 24
See study at https://ens.dk/sites/ens.dk/files/Globalcooperation/fuel_price_projections.pdf. The cost of 0,35 USD/kg equals 36 Kenay Shillings 27
EU Joint Research Center, JRC, Energy Technology Reference Indicator Projections for 2010-2050, currency exchange rate: 1 USD = 0.9 EUR 28
Danish Energy Agency, Technology catalogue 2017, updated 2019, currency exchange rate 1 USD = 0.9 EUR
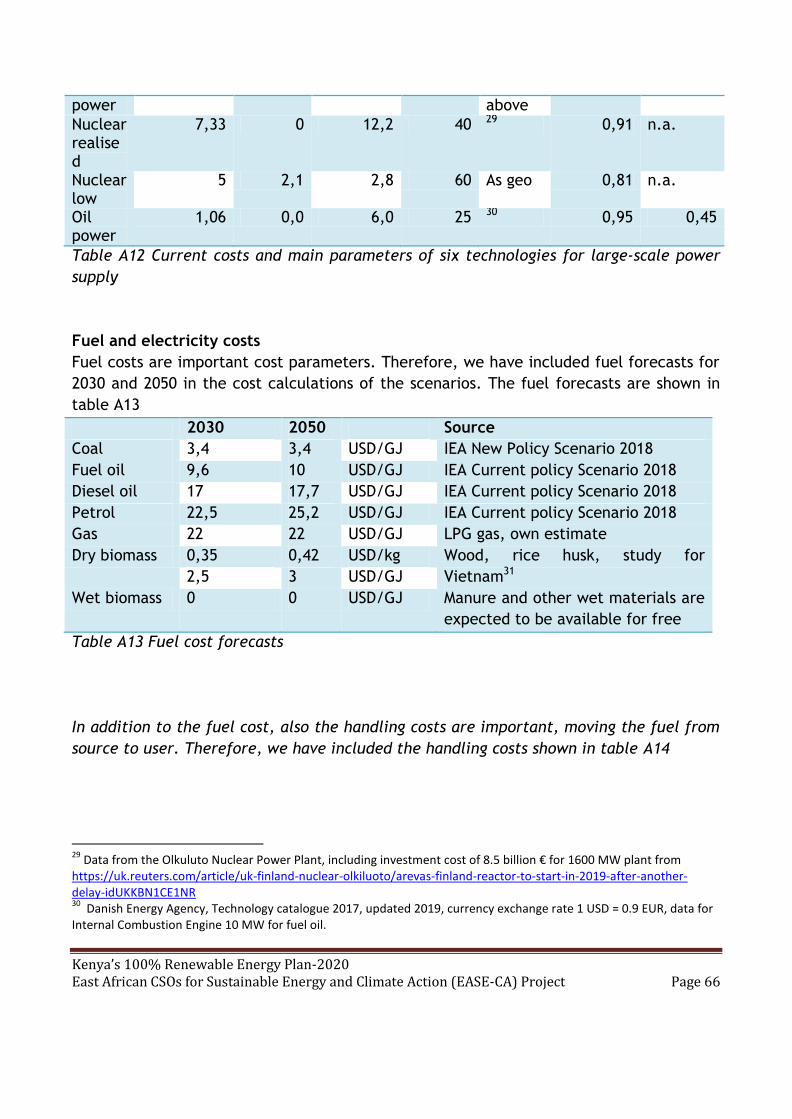
Kenya’s 100% Renewable Energy Plan-2020 East African CSOs for Sustainable Energy and Climate Action (EASE-CA) Project Page 66
power above
Nuclear realised
7,33 0 12,2 40 29 0,91 n.a.
Nuclear low
5 2,1 2,8 60 As geo 0,81 n.a.
Oil power
1,06 0,0 6,0 25 30 0,95 0,45
Table A12 Current costs and main parameters of six technologies for large-scale power
supply
Fuel and electricity costs
Fuel costs are important cost parameters. Therefore, we have included fuel forecasts for
2030 and 2050 in the cost calculations of the scenarios. The fuel forecasts are shown in
table A13
2030 2050 Source
Coal 3,4 3,4 USD/GJ IEA New Policy Scenario 2018
Fuel oil 9,6 10 USD/GJ IEA Current policy Scenario 2018
Diesel oil 17 17,7 USD/GJ IEA Current policy Scenario 2018
Petrol 22,5 25,2 USD/GJ IEA Current policy Scenario 2018
Gas 22 22 USD/GJ LPG gas, own estimate
Dry biomass 0,35 0,42 USD/kg Wood, rice husk, study for
Vietnam31 2,5 3 USD/GJ
Wet biomass 0 0 USD/GJ Manure and other wet materials are
expected to be available for free
Table A13 Fuel cost forecasts
In addition to the fuel cost, also the handling costs are important, moving the fuel from
source to user. Therefore, we have included the handling costs shown in table A14
29
Data from the Olkuluto Nuclear Power Plant, including investment cost of 8.5 billion € for 1600 MW plant from https://uk.reuters.com/article/uk-finland-nuclear-olkiluoto/arevas-finland-reactor-to-start-in-2019-after-another-delay-idUKKBN1CE1NR 30
Danish Energy Agency, Technology catalogue 2017, updated 2019, currency exchange rate 1 USD = 0.9 EUR, data for Internal Combustion Engine 10 MW for fuel oil.

Kenya’s 100% Renewable Energy Plan-2020 East African CSOs for Sustainable Energy and Climate Action (EASE-CA) Project Page 67
Handling costs 2030-2050
Oil to power plant 0,262 USD/GJ
Coal to industry 1,9 USD/GJ
Biomass to industry 1,2 USD/GJ
Diesel to transport 2,1 USD/GJ
Petrol to transport 2,1 USD/GJ
Gas to households, LPG 3,15 USD/GJ
Dry bio to convers. 0,54 USD/GJ
Wet bio. to biogas 1,49 USD/GJ
Dry bio to power plant 0,54 USD/GJ
Dry bio to households 3 USD/GJ
Table A14 Handling costs of fuel, own estimates based on Danish Energy Agency,
socioeconomic assumptions, price forecasts of fuels
For comparison, the current fuel costs are for large-scale power production:
coal 3.45 USD/GJ including handling costs of 0.05 USD/GJ
Fuel oil 8.96 USD/GJ including handling costs of 0.26 USD/GJ
Nuclear 1.5 (low) – 2.5 (realized)) USD/GJ
The cost of nuclear fuel includes handling and management of the spent fuel (nuclear
waste). Given the worldwide problems with nuclear waste, this cost is particular
uncertain and can be much higher than estimated.
With above costs of technologies and fuel, the current costs of power from large scale
power production is given in table A15 for financing with 5% interest and A16 for
financing with 10% interest.
USD/MWh Investment O&M Fuel Total
Geothermal power 39 11 0 50
Windpower 20 10 0 31
Solar power 31 7 0 38
Coal power 18 7 27 52
Nuclear realised 54 12 8 74
Nuclear low 37 18 5 60
Oil power ICE 9 6 72 87
Table A15 power cost of large-scale power production, 5% interest, investment in 2020

Kenya’s 100% Renewable Energy Plan-2020 East African CSOs for Sustainable Energy and Climate Action (EASE-CA) Project Page 68
USD/MWh Investment O&M Fuel Total
Geothermal power 63 11 0 74
Windpower 33 10 0 43
Solar power 53 7 0 60
Coal power 28 7 27 62
Nuclear realised 94 12 8 114
Nuclear low 71 18 5 94
Oil power ICE 14 6 72 92
Table A16 power cost of large-scale power production, 5% interest, investment in 2020
Electricity costs for import/export use of interconnectors
The interconnectors are expected to connect to a market with electricity costs of 113
USD/MWh, and with a market response of 5 US-cent/MWh for each MW. This mean that if
Kenya will sell 1000 MW, the price is lowered from 113 USD/MWh to 113-1000*0.05 = 63
USD/MWh while if Kenya want to buy 1000 MW, the price is increased to 113 +1000*0,05 =
163 USD/MWh.

Kenya’s 100% Renewable Energy Plan-2020 East African CSOs for Sustainable Energy and Climate Action (EASE-CA) Project Page 69
Annex 4: Kenya Policy Frameworks
o Ministry of energy gender policy, 2019
o Sessional Paper No. 4 of 2004 and governed by a number of statutes
o The Energy Act, 2019
o Geothermal Resources Act No. 12, of revised 2012
o Feed-in tariff s for Renewable Energy 2012
o Standardized PPA for Large Scale Generators More than 10MW
o Guidelines for Grid Connection of Small Scale Renewables
o Petroleum (Exploration and Production) Act, Cap 308.
o Energy Solar Photovoltaic Systems Regulations 2012
o Electricity Licensing Regulations 2010
Government driven strategies and plans:
o Kenya Vision 2030
o Kenya’s National Climate Change Action Plan (208-2022)
o Kenya’s 5,000+ MW Power Plan (2013-2016)
o Kenya’s Last Mile Connectivity Project (2015-2017)
o Least Cost Power Development Plan (2013-2033)
o Scaling-up Renewable Energy Programme (SREP) – Investment Plan for Kenya
o Rural Electrification Master Plan
o Kenya National Climate Change Response Strategy
o National Electrification Program Prospectus (herein referred to as REA Prospectus)
developed by REA with support from NORAD (July 2014)
o Private Sector Strategies: Kenya National Domestic Biogas Programme (KEDBIP)

Kenya’s 100% Renewable Energy Plan-2020 East African CSOs for Sustainable Energy and Climate Action (EASE-CA) Project Page 70
o Kenya Country Action Plan – Cook stoves
Renewable Energy Regulations
o Renewable scenario is cheaper Regulatory Impact Statement - Draft The Energy
(Appliances' Energy Performance And Labeling) (Amendment) Regulations, 2018
o Designation of Energy Users Gazettement
o The Draft Energy (Improved Biomass Cook stoves) Regulations
o The Energy (Solar Photovoltaic Systems) Regulations, 2012
o The Energy (Energy Management) Regulations, 2012
o The Energy (Solar Water Heating) Regulations, 2012.
Electricity regulations
o The Electric Power (Electrical Installation
o Work) Rules, 2006,
o The Energy (Complaints and Dispute Resolution) Regulations, 2012,
o The Energy (Electricity Licensing)
o Regulations, 2012
o The National Energy and Petroleum Policy
o The Petroleum (Exploration, Development and Production) Bill, 2015
o Petroleum Exploration, Development and Production (Local Content) Regulations
2014
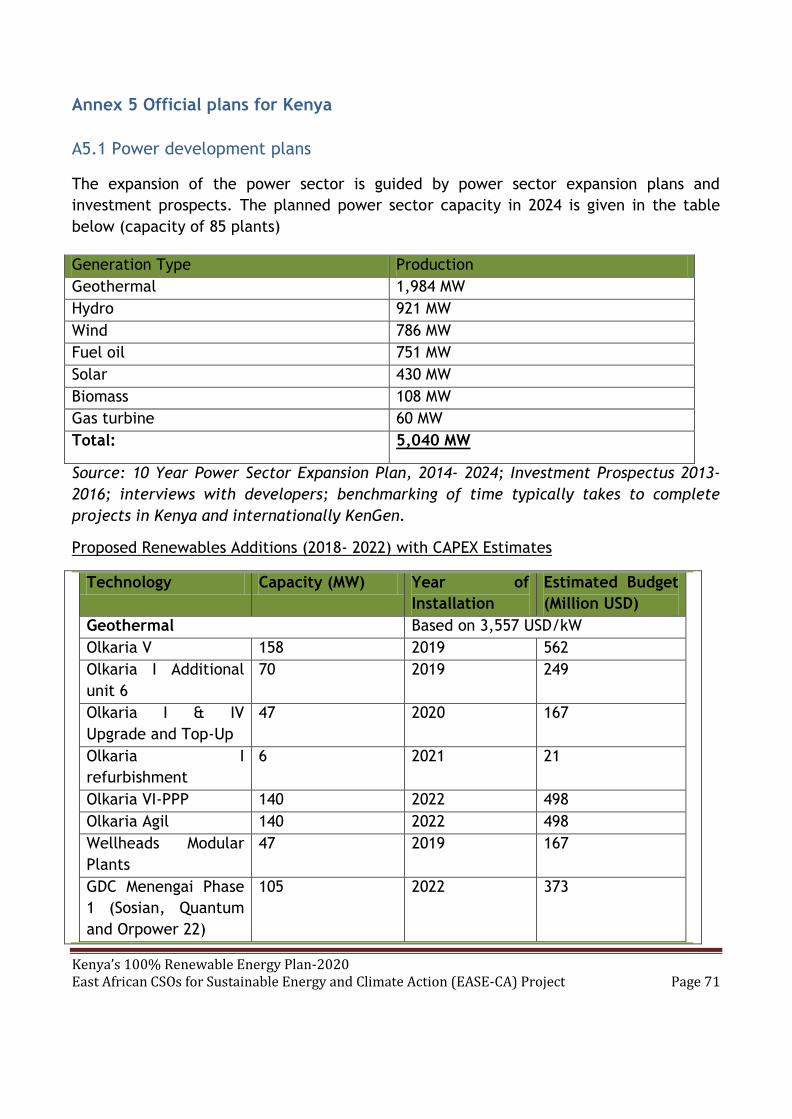
Kenya’s 100% Renewable Energy Plan-2020 East African CSOs for Sustainable Energy and Climate Action (EASE-CA) Project Page 71
Annex 5 Official plans for Kenya
A5.1 Power development plans
The expansion of the power sector is guided by power sector expansion plans and
investment prospects. The planned power sector capacity in 2024 is given in the table
below (capacity of 85 plants)
Generation Type Production
Geothermal 1,984 MW
Hydro 921 MW
Wind 786 MW
Fuel oil 751 MW
Solar 430 MW
Biomass 108 MW
Gas turbine 60 MW
Total: 5,040 MW
Source: 10 Year Power Sector Expansion Plan, 2014- 2024; Investment Prospectus 2013-
2016; interviews with developers; benchmarking of time typically takes to complete
projects in Kenya and internationally KenGen.
Proposed Renewables Additions (2018- 2022) with CAPEX Estimates
Technology Capacity (MW) Year of
Installation
Estimated Budget
(Million USD)
Geothermal Based on 3,557 USD/kW
Olkaria V 158 2019 562
Olkaria I Additional
unit 6
70 2019 249
Olkaria I & IV
Upgrade and Top-Up
47 2020 167
Olkaria I
refurbishment
6 2021 21
Olkaria VI-PPP 140 2022 498
Olkaria Agil 140 2022 498
Wellheads Modular
Plants
47 2019 167
GDC Menengai Phase
1 (Sosian, Quantum
and Orpower 22)
105 2022 373

Kenya’s 100% Renewable Energy Plan-2020 East African CSOs for Sustainable Energy and Climate Action (EASE-CA) Project Page 72
GDC Menengai Phase
II
60 2021 213
Orpower 4 60 2021 213
Orpower 4 10 2021 36
Marine Power Akiira 70 2022 249
Total 913 3,247
Technology Capacity (MW) Year of
Installation
Estimated Budget
(USD)
Biomass Based on 3,045 USD/kW
Kwale Sugar 10 2020 30
Cummins 10 2020 30
Roadtech (Kisaju) 10 2019 30
Biogas Holdings 0.25 2022 1
Rea Vipingo DWA 1.44 2020 4
Thika way Investment 10 2020 30
Crystal Energy 40 2021 122
Sukari 35 2021 107
Sustainable Energy
Management
40 2022 122
Sub Total 157 477
Technology Capacity (MW) Year of
Installation
Estimated Budget
(USD)
Wind Based on 2,030 USD/kW
Ngong Wind Farm III 10 2020 20
Meru (Isiolo) Wind
Farm I
80 2021 162
Turkana Wind 300 2018 609
Oldanyat 10 2021 20
Kipeto Wind 100 2020 203
Prunus 50 2021 102
Electrawinds Kenya
(Bahari) Phase I
90 2022 183
Chagem/Chania
Green
50 2020 102
Kinangop/Aeolus 60 2022 122
Aperture Green 50 2022 102
Total 800 1,624

Kenya’s 100% Renewable Energy Plan-2020 East African CSOs for Sustainable Energy and Climate Action (EASE-CA) Project Page 73
Source: Ministry of Energy (2018).
Proposed Priority Mitigation Actions in the Energy Supply Sub-Sector for the Period
2018-2022
Strategic Objective 3.2.1: Ensure an electricity supply mix based mainly on renewable
energy that is resilient to climate change, and promote energy efficiency
Issue/Problem: Renewable (and affordable) electricity supply with low GHG emissions
needs to increase to meet the demands of a growing population and industrializing
nation.
Opportunity Actions Sector Mitigation SDG
Target
Availability
of
renewable
energy
resources
Develop 2,405 MW of new
renewables (Geothermal: 913
MW, Solar: 442 MW, Hydro: 93
MW, Wind: 800 MW,
Biomass/Biogas: 157 MW and
Distributed solar and mini-grids:
30 MW) and retire 300 MW of
thermal plants (Kipevu: 120 MW,
IberAfrica: 108.5 MM and Tsavo:
74 MW) by 2022
MoE, ERC,
KenGen, KP,
County
Governments,
Local NGOs,
Private sector,
GDC
Adaptatio
n and
Mitigation
1,7,8,9,
11, 2,
13
Captive
renewable
generation
potential
Increase captive renewable
energy generation capacity by
250 MW by 2022 (at least 50 MW
of solar, wind, hydro and 200 MW
of cogeneration)
Industry, KAM,
KIRDI, MoE,
ERC
Adaptatio
n and
mitigation
7,9,12,
13
Significant
proportion
of the
population
are either
not
connected
to the grid
or have
unreliable
electricity
supply
Expand, refurbish, and modernize
electricity infrastructure with
Unspecified Kilometers of new
lines and new or upgraded
transformers by 2022.
MoE, KP,
Ketraco, ERC
Mitigation
and
adaptatio
n
1,2,
3,7,13,
15

Kenya’s 100% Renewable Energy Plan-2020 East African CSOs for Sustainable Energy and Climate Action (EASE-CA) Project Page 74
Available
renewable
energy
resources
Increase the use of green energy
along agricultural value chains by
5 MW by 2022
MoE, Ministry
of Agriculture
and Irrigation,
Ministry of
Industrializatio
n and
Enterprise
Development,
KIRDI, GDC,
ERC
Mitigation
and
adaptatio
n
1,2,7,9,
13
Opportunity Actions Sector Mitigation SDG
Target
Available
renewable
energy
resources
Promote the increased use of
renewable energy resources
(small hydros, solar, biogas,
biomass, wind and hybrid
systems)
Carry out research on possible
application and extent of use of
renewable energy resources
MoE, County
Governments,
ERC
Enabling 1,2,7,9,
13
Inefficiencie
s in
electricity
generation,
supply and
use
Improvement of operational
efficiency in generation and
reduction of transmission and
distribution losses
Reduce the distribution and
transmission losses from current
18% to 14% by 2020
Improve electricity system
utilization and efficiency
through demand
management
Optimize the operations of the
Seven Forks Dams
Promote efficient lighting
technologies such as LED and CFL
bulbs (Distribution to households)
MoE, ERC,
KenGen, KP,
KAM, KEPSA,
Ministry of
Transport,
Infrastructure,
Housing and
Urban
Development
(MTIHUD),
KIRDI
Mitigation
and
adaptatio
n

Kenya’s 100% Renewable Energy Plan-2020 East African CSOs for Sustainable Energy and Climate Action (EASE-CA) Project Page 75
Building efficiencies through
codes and standards
Energy efficiency programmes for
users (industries, national and
county governments, households)
Awareness, training, skills,
incentives for energy efficiency
programmes (Enabling activities)
Establish Standards and labeling
for at least 5 additional products
Opportunity Actions Sector Mitigation SDG
Target
Biennial
updates of
the power
developme
nt plans
Mainstreaming climate
change in electricity
planning process
Develop and apply of
tools to integrate
climate change
considerations and
broader development
impacts into electricity
sector master planning
processes - Develop draft
prototype of assessment
tools, including
methodology
development workshops
with relevant
stakeholders, by fourth
quarter 2018
Development of concept
and workshop series on
how to integrate the
MoE, ERC, KP Enabling
activity
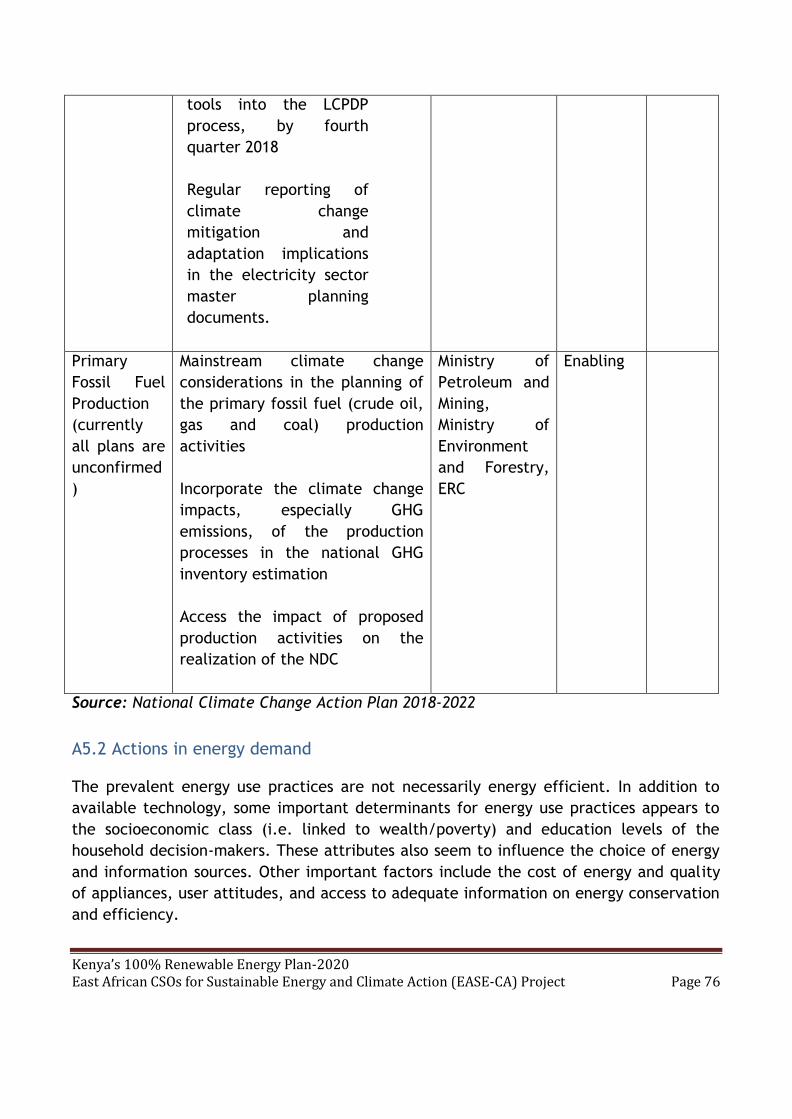
Kenya’s 100% Renewable Energy Plan-2020 East African CSOs for Sustainable Energy and Climate Action (EASE-CA) Project Page 76
tools into the LCPDP
process, by fourth
quarter 2018
Regular reporting of
climate change
mitigation and
adaptation implications
in the electricity sector
master planning
documents.
Primary
Fossil Fuel
Production
(currently
all plans are
unconfirmed
)
Mainstream climate change
considerations in the planning of
the primary fossil fuel (crude oil,
gas and coal) production
activities
Incorporate the climate change
impacts, especially GHG
emissions, of the production
processes in the national GHG
inventory estimation
Access the impact of proposed
production activities on the
realization of the NDC
Ministry of
Petroleum and
Mining,
Ministry of
Environment
and Forestry,
ERC
Enabling
Source: National Climate Change Action Plan 2018-2022
A5.2 Actions in energy demand
The prevalent energy use practices are not necessarily energy efficient. In addition to
available technology, some important determinants for energy use practices appears to
the socioeconomic class (i.e. linked to wealth/poverty) and education levels of the
household decision-makers. These attributes also seem to influence the choice of energy
and information sources. Other important factors include the cost of energy and quality
of appliances, user attitudes, and access to adequate information on energy conservation
and efficiency.

Kenya’s 100% Renewable Energy Plan-2020 East African CSOs for Sustainable Energy and Climate Action (EASE-CA) Project Page 77
We find that there have been and are several Energy Efficiency policies/regulations and
initiatives in the country. However, their implementation and effectiveness face (or
faced) a myriad of challenges including lack of support from the regulators, the regulated
and the political leadership. Most Kenyans also are oblivious of these regulations or
policies and the specific Energy Efficiency initiatives in their localities.
Proposed Priority Mitigation Actions in the Energy Demand Sub-Sector for the Period
2018-2022
Enhancing energy security and reducing dependence on unsustainable energy
resources
Issue/Problem: 80% of Kenyans depend on biomass for primary energy most of which is
non-renewable. This leads to indoor air pollution and deforestation
Kenyans
depend on
biomass for
primary energy.
Develop and distribute
4 million improved
biomass stoves by 2022
-Charcoal (2 million)
-Biomass (2million)
MoE, KFS,
ERC, County
Governments,
Local NGOs,
Private sector
Mitigation and
adaptation
1,2,3,
7,13,15
Existing
technology,
resources, and
potential
market for LPG,
ethanol, and
biogas
Develop and distribute
1 million clean energy
stoves by 2022
Develop LPG, biogas,
and ethanol stoves and
related supply chains
Ministry of
Petroleum
and Mining
(MPM), MoE,
KFS, ERC,
County
Governments,
Local NGOs,
Private sector
Mitigation and
adaptation
1,2,3,
7,
13,15
Strengthen the
institutional
frameworks that
oversee household
energy services and
provide an adequate
policy framework for
the promotion of
sustainable wood fuel
MPM, MoE,
MEF, KFS,
ERC, County
Governments,
Local NGOs,
Private sector
enabler

Kenya’s 100% Renewable Energy Plan-2020 East African CSOs for Sustainable Energy and Climate Action (EASE-CA) Project Page 78
production and
plantations (See
Agriculture sector)
Strengthen
supervision and law
enforcement with
regard to sustainable
wood fuel supply
strategies
Source: NCCAP 2018-2022
Emission Reductions through Development and Distribution of 4 million Improved
Biomass Stoves by 2022
tCO
2e
per
stov
e
per
year
201
8
2019 2020 2021 2022 2030
Number of
Charcoal
Stoves
200,
000
600,0
00
1,200,
000
1,600,
000
2,000,
000
2,000,
000
Number of
Biomass Stoves
200,
000
600,0
00
1,200,
000
1,600,
000
2,000,
000
2,000,
000
Emission Reductions from Charcoal
Stoves
2.00 400,
000
1,200,
000
2,400,
000
3,200,
000
4,000,
000
4,000,
000
Emission Reductions from wood fuel
Stoves
2.50 500,
000
1,500,
000
3,000,
000
4,000,
000
5,000,
000
5,000,
000
Total Annual ER from Improved
Stoves (MtCO2e)
0.9
0
2.70 5.40 7.20 9.00 9.00
Total Annual ER from Improved
Stoves -Adjusted for 70%
Implementation Rate (MtCO2e
0.6
3
1.89 3.78 5.04 6.30 6.30
Source: NCCAP 2018-2022

Kenya’s 100% Renewable Energy Plan-2020 East African CSOs for Sustainable Energy and Climate Action (EASE-CA) Project Page 79
Emission Reductions through Development and Distribution 1.5 Million Clean Energy
Stoves by 2022
tCO2
per
stove
per
year
2018 2019 2020 2021 2022 2030
Number of LPG
Stoves
100,000 200,000 300,000 400,000 500,000 500,000
Number of Biogas
Stoves
50,000 100,000 150,000 200,000 250,000 500,000
Number of Ethanol
Stoves
50,000 100,000 150,000 200,000 250,000 500,000
Emission Reductions
from LPG Stoves/HH
per year
1.19 119,000 238,000 357,000 476,000 595,000 595,000
Emission Reductions
from Biogas
Stoves/HH/year
1.19 59,500 119,000 178,500 238,000 297,500 297,500
Emission Reductions
from Ethanol
Stoves/HH/year
1.19 59,500 119,000 178,500 238,000 297,500 297,500
Total Annual ER
from Clean Fuel
Stoves (MtCO2e)
0.238 0.476 0.714 0.952 1.190 1.190
Total Annual ER from
Clean Fuel Stoves -
Adjusted for 70%
Implementation rate
(MtCO2e)
0.167 0.333 0.500 0.666 0.833 0.833
Source: Adapted from Government of Kenya (2017), NDC Sector Analysis

Kenya’s 100% Renewable Energy Plan-2020 East African CSOs for Sustainable Energy and Climate Action (EASE-CA) Project Page 80
Emission Reductions through Energy Demand Actions by 2022
Emission Reduction (tCO2e)
Stove Types
2018 2019 2020 2021 2022 2030
Charcoal Stoves
280,000
840,000
1,680,000
2,240,000
2,800,000
2,800,000
Biomass/firewood
Stoves
350,000
1,050,000
2,100,000
2,800,000
3,500,000
3,500,000
LPG Stoves
83,300
66,600
249,900
333,200
416,500
416,500
Biogas Stoves
41,650
83,300
124,950
166,600
208,250
208,250
Ethanol Stoves
41,650
83,300
124,950
166,600
208,250
208,250
Total Annual ER
(tCO2e)
796,600
2,223,200
4,279,800
5,706,400
7,133,000
7,133,000
Total Annual ER
(MtCO2e)
0.8 2.2 4.3 5.7 7.1 7.1
Source: Adapted from Government of Kenya (2017), NDC Sector Analysis
Proposed Mitigation Actions in the Agriculture Sector for the Period 2018-2022
Reducing GHG emissions from agricultural systems without compromising productivity
Issue/Problem: Climate change is negatively impacting agricultural productivity and
resilience of value chain actors, including households (farmers, pastoralists and fisher
folks)
Opportunity Actions Sector Mitigation/
Adaptation/
SDG
Target
Agroforestry Increase the total area, under
agroforestry at farm level by
200,000 acres (81,000 Ha) by
2022.
Ministry of
Agriculture
and
Irrigation
(MoAI), KFS,
County
Governments
Adaptation
and
mitigation
1, 2,
13, 15

Kenya’s 100% Renewable Energy Plan-2020 East African CSOs for Sustainable Energy and Climate Action (EASE-CA) Project Page 81
Sustainable
Land
Management
Increase farm area under
sustainable land management by
250,000 acres (101,000 Ha) by
2022.
Ministry of
Agriculture
and
Irrigation,
County
Governments
Adaptation
and
Mitigation
1, 2,
13, 15
Efficient
livestock
management
systems that
enhance
productivity.
Implement the Dairy Nationally
Appropriate Mitigation Action
(NAMA)
267,000 households involved in
the programme leading to
Greenhouse Gas emissions
reductions.
Ministry of
Agriculture
and
Irrigation
(MoAI),
County
Governments
Adaptation
and
mitigation
2, 1,15
Manure
management
Increase adoption of biogas
technology use by 80,000
households leading to abatement
of 1.2 million tCO2e by 2022
(Linked to biogas cooking in the
energy sector)
Increase adoption of biogas
technology use by at least 200
abattoirs leading to abatement
of 0.8 million tCO2e by 2022
Ministry of
Agriculture
and
Irrigation
(MoAI),
County
Governments
Adaptation
and
mitigation
2, 1,15
Overcapacity
of artisanal
fishing vessels
Increase deep/offshore fishing
fleet from 9 to 68 by 2022
Ministry of
Agriculture
and
Irrigation
Adaptation/
mitigation
1,2,14
and 15
Aquaculture
production
Increase the number of farmers
using low-carbon (Recirculating)
aquaculture systems from 20 to
180 by 2022
Ministry of
Agriculture
and
Irrigation
Mitigation
and
Adaptation
1,2, 14
and 15
Increased rice
production
Put 50% of 30,000 hectares under
rice production into efficient
production technologies by 2022.
Increase area under rain fed rice
production from 400 hectares to
600 hectares by 2022
Ministry of
Agriculture
and
Irrigation,
County
Governments
Adaptation
and
mitigation
1,2,
3,12,
13, 15
Source: Adapted from Government of Kenya (2017), NDC Sector Analysis
Under the Bonn Challenge, Kenya has established a restoration target of 4,210,000

Kenya’s 100% Renewable Energy Plan-2020 East African CSOs for Sustainable Energy and Climate Action (EASE-CA) Project Page 82
hectares by 2030, described in Table 3.3.1. The Bonn Challenge is a global effort to
restore 150 million hectares of the world's degraded and deforested lands by 2020 and
350 million hectares by 2030.
Kenya: Existing Forest Restoration Targets
Category
Description
Existing
Restoration
Target
Forest Land without
Trees - Planted
Forests and
Woodlots
Planting of trees on formerly forested land. Native
species or exotics and for various purposes, fuel-
wood, timber, building, poles, fruit production, etc.
4,100,000
Ha
Degraded Forest
Land - Silviculture
Enhancement of existing forests and woodland of
diminished quality and stocking, e.g., by reducing
fires and grazing and by liberation thinning,
enrichment planting, etc.
10,000 Ha
Agricultural Land -
Agroforestry
Establishment and management of trees on active
agricultural land (under shifting agriculture), either
through planting or regeneration, to improve crop
productivity, provide dry season fodder, increase soil
fertility, enhance water retention, etc.
100,000
Source: Bonn Challenge (2016). Kenya. Accessed at: http://www.bonnchallenge.org/flr-
desk/kenya

Kenya’s 100% Renewable Energy Plan-2020 East African CSOs for Sustainable Energy and Climate Action (EASE-CA) Project Page 83
2014 Draft National Strategy, renewable energy expansion plans until 2030
Energy Type Expansion Plans
Solar
+500 MW
+300,000 solar home systems
+700,000 solar water heating units
Biogas/biomass
+10,000 bio digesters
+1,200 MW of biomass co-generation
Geothermal
Energy
+5,500 MW
Small hydro generation
+300 MW
Wind Energy
+3,000 MW
Kenya’s 100% Renewable Energy Plan-2020 East African CSOs for Sustainable Energy and Climate Action (EASE-CA) Project Page 84
Annex 6
ENERGY ACCESS IN KENYA
A6.1 Status summary
Kenya has seen one of the fastest increases in electrification rates within sub-Saharan
Africa since 2013, 75% of the population had access (Kenya Energy Outlook (IEA’s),
2019). Kenya aims to reach full access by 2022; the grid would be the principal least-cost
solution for the majority of the population (mainly in the south) still lacking access
Currently in Kenya, 99% of the existing off-grid electrification is provided by small-scale
stand-alone PV systems. Future plans include mini-grids powered by solar and diesel.
However, the available funds can only mobilize projects at a limited number of areas,
making even more important to prioritize least-cost solutions that are sustainable at long-
term (Moner-Girona, Szabó, & Bhattacharyya, 2016). Each candidate solution has its own
advantages and needs to be assessed in a comprehensive framework dealing with the
several aspects of the issue, including resource availability, economic feasibility and
technological reliability and robustness. Accordingly, it employs a least-cost electricity
analysis that spatially compares the costs of several decentralized options and grid
extension across the country. Identifying locations with advantageous off-grid options can
support a better planning of capacity needs, divert grid extension towards areas with
higher yields, and avoid fragmentation of energy investments.
Access to energy is as a Continuum of service levels; Multi-Tier Framework (Measuring
Energy Access, Introduction to the Multi-Tier Framework by the World Bank Group)
measures not only whether users receive energy services, but also whether these services
are of adequate quality, reliable, affordable, safe and available when needed. MTF
provides a path towards universal access that can be customized for each country
circumstance; acknowledging progress as households move from lower to higher tiers.
Among the decentralized power options, decentralized renewable energy options such as
mini-hydro, PV stand-alone and mini-grid systems with the option of complementing with
wind turbines, and clean technologies will enhance the access. The model output is
placed side by side with Kenya’s national Rural Electrification Master (REM) Plan.
In 2018, the energy mix remained relatively stable with the contribution of geothermal
sources increasing to 47% up from 43.6% in 2017. Hydro and conventional thermal plants

Kenya’s 100% Renewable Energy Plan-2020 East African CSOs for Sustainable Energy and Climate Action (EASE-CA) Project Page 85
contributed 30.1% and 20.6% of the total energy produced in 2018, respectively (The
Kenya Power and Lighting Company Limited-KPLC, 2018). In 2017, wind power in Kenya
contributed only a small amount of the country’s electrical power. However, its share
increased dramatically in 2018 with the addition of the 310 MW Turkana wind farm,
increasing the share of wind to 13% in the total capacity. Hydroelectric generation
fluctuates due to the year-to-year hydrologic conditions (±20% compared with average
values) making the electricity generation portfolio susceptible to changing weather and
climate patterns. Solar energy accounted for <1% of the power generation capacity in
2018; yet the recently installed 55 MW PV facility in Garissa will slightly increase the
share of solar.
Source: The Kenya Power and Lighting Company Limited-KPLC, 2018)
As of 30th June 2014, the distribution system comprised of 1,212 km of 66 kV lines,
20,778 km of 33kV lines, 30,860 km of 11 kV lines and low voltage lines, primary
distribution substations with transformation capacity of 3,311 MVA and distribution
transformers with total capacity of 6,317MVA. It is projected that by 2020, capacities of
primary and distribution substations will be 11,888 MVA, 190,204 MVA, while the lengths
of HV lines and MV lines will be 7,925 km and 118,875 km respectively. In the year 2030
capacities of primary distribution substations and distribution transformers will be 37,565
MVA and 60,104 MVA, while lengths of HV and MV lines will be 25,043km and 187,825 km,
respectively.
The government also plans to develop new transmission lines comprising of about 5,438
km in the short term and 18,173 km by 203382. Through the LCPDP process and feasibility

Kenya’s 100% Renewable Energy Plan-2020 East African CSOs for Sustainable Energy and Climate Action (EASE-CA) Project Page 86
studies, KETRACO has identified priority projects for implementation totaling about 6,270
km of transmission lines comprising 2,081 km of 132 kV, 1,278 km of 220 kV and 2,299 km
of 400 kV AC lines as well as 612km of 500 kV High Voltage Direct Current (HVDC) line
between 2011 and 2017. It is projected that by 2033 KETRACO will have constructed over
18,000 km of transmission lines.
A6.2 Gender and Energy
Access to sustainable energy by all is a key global development target under the
Sustainable Development Goals (SDGs). Goal 7 on access to affordable, reliable,
sustainable and modern energy for all; and goal 13 on climate change and its impacts
recognize energy as a key driver to achieving Goal 1, which aims to end poverty and
hunger. Sustainable energy resources enhance the quality of life and wellbeing of the
population by enabling the production of goods, access to and provision of services
related to water through water pumping; agriculture through food processing and
irrigation; health, education, industrial productions and environmental conservation.
Provision of modern energy services is therefore critical for social- economic
development and environmental sustainability.
Mainstreaming gender perspectives in Kenya’s national energy policy, budgeting, planning
and project management is critical in ensuring the effectiveness of not only the energy
programs, but also all development activities that involve energy use. Studies show that
energy affects men and women differently. While the degree of gender implications may
differ from one energy project to another, projects that deal with people should not be
gender-neutral. A gender-neutral project assumes that women and men have the same
needs, priorities, opportunities and expectations. Such approaches reinforce existing
gender-based discrimination. This effectively makes some marginalized communities to
remain underserved by energy policies, appropriate technologies and delivery models.
(Poor Peoples Outlook; 2018). Basic services such as electricity for lighting and cleaner
cooking technologies are still a luxury for many rural women and men hence the need to
improve access to modern energy services.
The Sustainable Development Goal No.5 specifically addresses gender equality in all
forms of development. The goal aims at building more environmentally sustainable and
climate-resilient societies, whereby both women and men have equal opportunities to
access and control available resources within their environment. Access to modern energy
is a key enabler for women’s empowerment as it plays a key role in meeting practical
gender needs of women such as cooking, food processing and water hauling as well as
strategic gender needs like street lighting for safety and power for enterprise

Kenya’s 100% Renewable Energy Plan-2020 East African CSOs for Sustainable Energy and Climate Action (EASE-CA) Project Page 87
development. While access to energy services would not necessarily guarantee gender
equality, it helps in relieving women and girls of the drudgery associated with their daily
tasks and provides them time for income-generating opportunities and education (UNDP;
2015).
A6.3 Existing Plans/Strategies GoK has embarked to increase connectivity per year to one million starting in the
2014/2015 financial year to reach 100% connectivity by 2022. To achieve these targets,
the following strategies are being employed;
Rural Electrification Master Plan: The GoK is implementing initiatives to make electricity
more accessible to the population especially in rural areas. Among the consumers were
some 382,630 rural households electrified through the Rural Electrification Programme
under REA. In addition, REA connected more than 23,000 public facilities in the last five
years constituting 89% of the main public institutions that were to be electrified in REA’s
first strategic plan (2008/09-81 Updated LCPDP 2011-2031, GoK 82 Updated LCPD 2011-
2031, GoK 31 2012/13). The focus on electrification of primary schools started in 2013, as
one of the priority projects by the new government, which was elected in March 2013. By
June 2013, out of the overall 21,222 primary schools in the country, 10,157 had been
electrified. To complete the electrification of all primary schools by June 2015, the
Authority put in place a programme aimed at completing electrification of the remaining
11,062 primary schools in two years with 5,000 primary schools planned for electrification
in the 2013/14 financial year and 6,065 in the 2014/15 financial year.
The 5,000+MW Project: A roadmap to increase the installed generation capacity from
1664 MW as at October 2013 by at least 5000 MW to 6,762 MW by 2017. Through the plan
the generation cost is projected to reduce from US¢ 11.30 to 7.41, while indicative end-
user tariffs are projected to reduce from US¢ 14.14 to 9 for commercial/industrial
customers and from US¢19.78 to 10.45 for domestic customers
Scaling Up Renewable Energy Programme (SREP). The decentralized segment, mini-
grids development has been getting the most attention, especially from the Government,
development partners, and programs such as SREP. It is also an area of growing interest
from the private sector. Private sector approaches to mini and micro-grid development
are being developed, though there is still no formal regulatory framework for this. Donors
such as DfID, working with GIZ, have recently introduced innovative mini-grid
development financing, with the introduction of Results Based Financing, targeting 20
private-sector-operated mini-grids and working with locally based financial institutions.
Conventional solar, wind, diesel or hybrid plants exist, with 22 mini-grids developed by
Kenya Power and Lighting Company (KPLC), with a reach of over 20,000 customers,

Kenya’s 100% Renewable Energy Plan-2020 East African CSOs for Sustainable Energy and Climate Action (EASE-CA) Project Page 88
mainly installed in remote areas. The private sector and civil society have installed at
least a dozen wind/solar/micro hydro/hybrid mini-grids. Isolated solar/diesel mini-grids
managed by KPLC contribute almost 1 MW, while wind mini-grids produce 550 kW. Efforts
are underway by the Ministry of Energy and Petroleum, working with Kenya Power and
REA to scale this up under hybrid mini-grid initiatives. At least 68 new sites are in
development under Kenya’s Scaling up Renewable Energy Programme (SREP) Investment
Plan, 2011.
Last Mile Connectivity Project- The project involves extension of the Low Voltage
network (415 and 240 volts) around existing distribution transformers within the
transformer protection distance, currently caped at a radius of 600 Metres.
The Project aims to offer connections to up to 1,416,000 connectable households in a
period of 3 years (2015-2017).
Provision of Stima loan: Stima Loan is a Kenya Power initiative in partnership with the
French Development Agency (AFD) through the Government of Kenya. It aims at
connecting low income families that cannot afford the connection fees upfront by
providing loans at 5% administration fee (one-off payment) and 20% upfront payment. The
balance is payable over a period of 24 months. As at May 2014, more than 49,000 Kenyans
have benefitted from the loan scheme.
Least Cost Power Development Plan (LCPDP): A long-term commitment (2013-2033) to
electrification plan that provide a framework for institutional, technical, economic and
financial design and implementation of specific programs.
National Electrification Strategy that is expected to provide a framework for
electrification, encompassing technical, financial, and institutional planning.
Distribution Expansion Plan 2014-2018. The medium term distribution expenditure plan
was projected to cost KSHS 35,067 million equivalents to US$433.45million. Besides the
distribution master plan, Kenya Power through their Distribution Division has developed
strategies geared towards absorbing the additional generation capacity totaling to about
KSHS 5 Billion. Funding the electrification of informal settlements. Informal settlements
are a reality of Kenya’s urban areas. Millions of Kenyans live in informal settlements with
unsafe electrical installations and limited access to legal connections, while power theft
in the informal settlements results in high commercial and technical losses for the
Company. However, electrification of informal settlements is often uneconomic for
power utilities as returns are too low to recover the cost of investment, operations and
service.
Kenya’s 100% Renewable Energy Plan-2020 East African CSOs for Sustainable Energy and Climate Action (EASE-CA) Project Page 89
The Company, therefore, has been exploring sustainable ways to provide electricity to
the settlements in partnership with the Government and development partners. Towards
this, in February 2012, the Company obtained a grant from the International Development
Association (IDA), acting as administrator of the Global Partnership on Output-Based Aid
(GPOBA), for electrification of informal settlements in the country. The programme
entails the Company pre-investing in the electrification of informal settlements, after
which GPOBA will reimburse the Company US$75 per meter connected up to a total of
US$5million; while the World Bank will reimburse US$150 per meter connected up to a
total of US$10 million. About 66,000 customers are expected to benefit from this
initiative.
The Kenya Joint Assistance Strategy (KJAS) presents a core strategy of 17 development
partners for 2007–12. The KJAS partners aimed to aid the government program in several
ways. They will continue to support implementation of substantial changes in the
organization and structure of the electricity market (including agreement on a
management contract for the Kenya Power and Lighting Corporation), and institutional
reforms of the rural electrification program. They will finance investments to expand
generation capacity (including through geothermal and hydro); improve efficiency of
power production, transmission, and distribution; and increase access to modern energy
services in rural areas. They will support cross-border projects, including the Kenya–
Ethiopia, and the Kenya–Tanzania–Zambia power interconnection projects.
Kenya Joint Assistance Strategy 2007-2012 capacity of the regulatory bodies and of the
Ministry of Energy, improves energy management and governance, and promotes cross-
border cooperation in the energy sector.
They will facilitate access to environmentally friendly technology, including solar and
wind power. Finally, they will support Kenya’s efforts to regularize, improve efficiencies,
and reduce the environmental impact of the charcoal industry, on which 75% of Kenyans
depend for domestic energy.
M-KOPA business models for solar- raising US$ 20 million (KSHS 1.72 billion) to fund
expansion of their customer base from 50,000 homes to one million homes by 2018. M-
KOPA provides affordable solar-powered lighting and mobile charging to rural Kenyans on
a pay-as-you-go basis, with payments conveniently sent via M-PESA (Kenya’s leading
mobile money service). When customers have fully paid for the value of the solar
product, they own the product and can continue to use it freely.
According to International Finance Corporation 2012 report, the private sector is vibrant
in the solar sector, with 21 distributors/importers, and over 1500 SMEs selling solar
lanterns in Kenya. There are currently with 29 quality verified solar lighting products,
from 17 manufacturers, currently on sale in the country. The solar lantern market grown

Kenya’s 100% Renewable Energy Plan-2020 East African CSOs for Sustainable Energy and Climate Action (EASE-CA) Project Page 90
by more than 200% in the last 3 years with about 700,000 solar lanterns sold to off-grid
families in rural Kenya by end of 2014.
In light of the overarching objectives, these plans are ambitious enough to meet the
challenge, and have targets that aim to achieve the energy access objective sooner than
2030. The activation of these plans, are not fully operationalized, and their funding, will
be necessary to make them effective.
A6.4 Clean Cooking
While universal access to modern cooking services by 2030 refers to both use of non-solid fuels and improved (efficient) cook stoves, clean cooking refers to use of non-solids fuels for cooking. Hence, According to 2009 census report over 80% of rural and 10% of urban households regularly use firewood, while about 7% of rural households, and over 30% of urban, use charcoal. The rate of use of biomass has outstripped the rate of supply thus rendering biomass non-renewable sources of energy. In Kenya, use of improved (efficient) cook stoves is being taken as a stopgap measure as efforts are being made to transit to clean cooking fuels and sustainable bioenergy strategies being put in place.
A6.4.1 existing plans/strategies for clean cooking
o The Government has prioritized clean cooking in its climate change action plan
2018-2022 and recognizes its impacts on climate change; therefore, it is at the
forefront in advocating for improved cooking technologies and alternative clean
cooking fuels.
o The Kenya National Action Plan (NAP) for Clean Cook stoves and fuels, which has a
target of 5 million households by 2020.
A6.5 Existing Gaps
A6.5.1 Universal Access - Electricity
The main challenges/gaps that Kenya faces to reach SE4ALL universal access to electricity
by 2030 are as follows:
Affordability of electricity:
Although connection fees were significantly lowered in May 2015, their cost is still a
deterrent for rural households and the poor especially female -headed households. The
same is true for off-grid solutions such as solar home systems and mini-grids, although
these can be scaled down to an appropriate cost for consumers.
Although universal access makes sense from economic and equity perspectives, its
financial viability is often uncertain. The financial viability of electrification for those
Kenya’s 100% Renewable Energy Plan-2020 East African CSOs for Sustainable Energy and Climate Action (EASE-CA) Project Page 91
without access usually requires subsidies to cover part of its capital and/or operating
costs, as many unconnected households cannot pay fully for the cost of electricity
service.
The upfront cost of connection is a more serious barrier to extending access than the
monthly payments for consumption and only 35−40% of household in electrified areas are
usually ready to connect.
Fragmented energy access market:
Most population lacking access to modern energy services are dispersed and not properly
mapped which is a challenge for companies providing services to this market resulting in
uncoordinated, immature and not widely known services to stakeholders.
Need to develop mini grid policy
Although there are strategies and plans to address access above 1 MW, there is no
comprehensive strategy for mini-grids and stand-alone systems for access below 1 MW.
Such a strategy will boost the development of micro-decentralized systems that may be a
cost effective solution to small settlements in remote areas of Kenya.
o Lack of regulations to a policy for mini grids
o Lack of net metering regulations
Infrastructure
Primary substations (and BSPs) are equipped with just a single transformer and even
those with two or three transformers are often loaded such that no spare capacity exists
to cater for a transformer failure. This is a particular issue for parts of the network with
no alternative means of supply.
Much of the distribution network does not have adequate capacity to effectively manage
the present demand; the distribution network suffers from poor reliability and quality of
supply, which is generally due to underinvestment. Many parts of the distribution network
are supplied over extremely long, radial 33 kV and 11 kV feeders, with no alternative
source of supply.
In some cases, 33 kV feeders may be hundreds of km long, with many spurs, resulting in a
total length (in extreme cases) in excess of 1000 km supplied from a single source. A fault
on such a long feeder will have widespread impact, be difficult to locate and therefore
will result in a long restoration time.
Due to excessive feeder lengths and use of undersized conductors, voltage levels on
feeders, particularly outside of the urban areas are typically poor and significantly under
Kenya’s 100% Renewable Energy Plan-2020 East African CSOs for Sustainable Energy and Climate Action (EASE-CA) Project Page 92
the required standard. Automatic voltage regulators (AVRs) have been installed on
feeders in the past, however many of these have failed and have subsequently been
bypassed.
Excessively long, undersized feeders also result in high losses.
Electricity generation shortage: An obstacle to rural electrification in many countries
with low access rates is insufficient generation capacity of the main electricity system. It
is unrealistic to expect these countries to make more than modest gains in increasing
electricity access by means of grid extension until the capacity constraint is eased.
Costs and financial considerations:
Lack of appropriate incentives. The high costs of electricity supply in rural areas and the
limited capacity of households to pay for the service make it difficult to attract
investment in rural electrification. To do so, it requires a system of tariffs and subsidies
that ensures sustainable cost recovery while minimizing price distortions. However, such
a revenue generation scheme is absent.
High costs of supplying rural and peri-urban households. Low population density and a
very high percentage of poor households characterize most rural communities, as well as
many peri-urban areas. Demand for electricity is usually limited to residential and some
agricultural consumers, and many households consume less than 30 kilowatt-hours (kWh)
per month. The combination of these factors results in high costs of supply for each unit
of electricity consumed.
Financial and Operational Sustainability. Making service sustainable is one of the main
challenges in extending access, both in rural electrification and in low-income urban
areas.
While a large portion of capital costs is usually subsidized through specially designated
funds (frequently supported by donors), more financial assistance is often needed
because many households cannot pay the full cost of operation.
Rural Electrification Strategy:
Adequate design and effective implementation of a rural electrification program requires
technical and managerial skills that are not always available. This process may entail new
or amended legislation, institutional strengthening, planning, and establishing technical
standards and regulatory procedures tailored to the nature of rural electrification.
Under these circumstances, extending access in rural areas requires a system of subsidies
that recognizes the lower income levels of rural households and higher costs of supply.
Kenya’s 100% Renewable Energy Plan-2020 East African CSOs for Sustainable Energy and Climate Action (EASE-CA) Project Page 93
A6.5.2 Universal Access – Clean Cooking
For Kenya to achieve universal access to clean cooking by 2030 the following gaps, need
to be addressed:
Regulatory issues:
Policy, strategy and regulations related with biomass use are still insufficient to ensure
the sustainable use of biomass in the cooking sector despite being the major energy
consumer in the country.
Charcoal production sector is largely unregulated and, therefore, informal with low
efficiency in transforming biomass into charcoal.
Limited availability of performance or other standards for energy products and where
they exist, lack of implementation and enforcement. Consumers are therefore
unprotected against substandard equipment and services.
Awareness and knowledge issues:
Lack of awareness of indoor pollution and its impact on health within the general
population limits the rate of adoption of efficient cooking stoves, especially by the rural
population.
People tend to prefer traditional cooking solutions because of cultural heritage. In order
to increase the use of modern cooking solutions it would be necessary to raise awareness
about its benefits so people will start to shift to cleaner or improved cooking.
Need to mainstream gender, cultural practices and the nexus of energy, especially with
the sectors of health, cooking and water.
Information and sector analysis:
There are no gender-disaggregated data on the status of the clean cooking appliances and
fuels adoption. Statistics used are estimates. This needs a comprehensive study to inform
the sector.
No impact study of the ongoing clean cooking appliances and fuels adoption.
Cook stove quality and performance:
The number of improved cook stove models and fuel production solutions customized for
local environments is still low, there is evidence that many basic ICS perform poorly in
the field at least in part due to the difficulty of accessing high quality materials, and
systemic support for innovation

Kenya’s 100% Renewable Energy Plan-2020 East African CSOs for Sustainable Energy and Climate Action (EASE-CA) Project Page 94
R&D on breakthrough solutions that can offer higher performance (e.g., fan gasifiers)
and, even more important, more attractive and functional end-user focused designs, is
still limited.
For clean cooking and improved solutions that do reach the market, access to
standardized testing is limited or unaffordable for many, and does not increase end user
understanding of their likely performance so they are able to make informed purchasing
decisions.
Last-mile distribution and producer finance:
Distribution of clean cooking products is costly, with no easy answers to the challenge of
reaching rural consumers; progress will require both experimentation with new
institutional and retail approaches and significant investment into channel development.
In the immediate term, commercially oriented ventures likely need to focus on more
profitable urban and charcoal user consumer segments, reaching the rural consumer
requires cross-subsidization from more profitable urban market segments or less
commercially driven business models.
Building successful last mile clean cooking businesses in Africa is a costly endeavor, due to product importation hurdles, logistic and transport challenges, the need for intensive consumer marketing, and the importance of extending credit to both last mile retailers and end-users (i.e., via pay as you go schemes). Global Village Energy Partnership, Kenya Market Assessment, 2012.
A6.6 High Impact Initiatives for Energy Access
A6.6.1 Increasing Access to Modern Clean Cooking
MoE to lead on the creation of a cross-sectoral initiative to bring together different on-
going efforts, like Global Alliance Clean Cookstove (GACC), and improve coordination
across agencies, private sector, CSOs and NGOs. This initiative aims to; Foster an
enabling environment by engaging national and local stakeholders, building the evidence
base for the benefits of stoves, promoting standards and rigorous testing protocols and
enhancing monitoring and evaluation.
o Promote industry standards for efficiency, safety, and emission reduction, based
on testing and certification for clean cooking appliances, such as ICS. Support
development and implementation of large national programme on scaling up ICS.
o Contribute to improving the policy framework, train entrepreneurs and develop sustainable value chains and robust infrastructure for clean and efficient cooking stoves and fuels.

Kenya’s 100% Renewable Energy Plan-2020 East African CSOs for Sustainable Energy and Climate Action (EASE-CA) Project Page 95
o Support continuous research on consumer use and demand for efficient stoves and on the design of products that meet user needs.
o Universal Adoption of Clean Cooking Solutions, objective that can be pursued
under the umbrella of the GACC;
o Human and Institutional capacity development - cook stoves;
o Support the use of improved cooking appliances by engaging youth organizations
and women SMEs in the production, dissemination and distribution of these
technologies.
o Conduct awareness campaigns on the benefits of clean cooking appliances and
fuels for remote/isolated populations. These awareness campaigns should
additionally inform consumers on how to purchase quality ICS.
o Raise general awareness to the public about the available clean cooking
technologies.
o Innovative Finance, to support financial closure and financing access to energy
services and clean cook stoves.
o Develop financing schemes to provide credit to households that cannot afford the
upfront costs of access to modern energy services.
o Provide regulatory support for scalable and sustainable business and financial
models.
A6.6.2 Increasing Access to Modern Electricity
Rural Electrification and Renewable Energy Corporation (REREC) formerly REA (Rural
Electrification Authority: is tasked with the development and implementation of a clean
energy mini-grid programme as a means to accelerate clean off-grid access, including: To
Provide distributed electricity solutions that support productive use and economic
development , Create more favorable business environments with appropriately refreshed
(or new) policies, regulations, and energy plans to incentivize commercial investments
(small, medium and large scale) and develop markets (power hive concept). Facilitating
financing for mini-grid and stand-alone energy access projects.
Formulation of mini- grid regulation: - effectiveness of enforcement of the liberalized
regulatory environment by Energy and Petroleum Regulatory Authority: the ease of
obtaining generation and distribution licenses by independent power producers, as well
as Power Purchase Agreements in the event of the grid coming to the locality of the mini
grid project.

Kenya’s 100% Renewable Energy Plan-2020 East African CSOs for Sustainable Energy and Climate Action (EASE-CA) Project Page 96
Distributed electricity solutions:-Distributed electricity solutions i.e. mini-grids or
individual systems are deployed to the underserved community too distant from the
existing grid and/or that their demand is too small to justify the high fixed cost of
extending the grid.
The regulatory environment for Pico solar and solar home systems for lighting and
productive use is already being developed; REREC has published regulations for
installation of solar systems, and Lighting Africa (IFC/World Bank) has made major strides
in helping the market to improve product standards. Kenya Renewable Energy
Associations (KEREA) is currently implementing a voluntary quality accreditation
programme for solar vendors and integrators.
Strategy is to increase competition and flexibility in mini-grid provision through measures
to simplify licensing: development of an off-grid strategy, a conducive, legal, and
regulatory environment must be developed to support the private sector and avoid direct
subsidization as much as possible.
Create a clear timetable for grid rollout to avoid unexpected duplication of
infrastructure. It should be very clear to installers of off-grid equipment what time they
have before the grid arrives at the locality, as this will affect the payback periods that
they need to work with when considering their investments.
Improve smart grid technology solutions, grid-scale storage and interaction between renewables and fossil fuels.
A6.7 Relevant High-Impact Opportunities
o Clean Energy Mini-Grids, to accelerate clean off-grid access.
o Develop and implement small-scale renewable energy solutions.
o Provide distributed electricity solutions that support productive use and economic
development.
o Study on decentralized system. Mapping out of regions/populations for
decentralized energy systems.
o Invest in disaggregated data to reveal gender disparities in relation to energy
poverty to achieve effective gender mainstreaming in decentralized energy
solutions. This is crucial in informing relevant policy interventions.
o Mini-Grid /micro-grid Development strategy. Development of mini grid and micro
grids policy. Develop framework for implementation of mini-grids.
Kenya’s 100% Renewable Energy Plan-2020 East African CSOs for Sustainable Energy and Climate Action (EASE-CA) Project Page 97
o Scaling Up of Renewable Energy Programme (SREP).
o Setting up of commercial renewable energy micro grid in rural areas without
access to national grid.
This is based on the list of HIOs identified by the Global Action Agenda
o DfiD in partnership with AfD solar PV mini-grids: € 30 million available for funding
mini-grid projects (Solar PV mini-grids).
o Kfw Solar PV mini-grids High-Impact Initiatives Targeting 3 pilot projects. Result
based financing.
o DfiD Hydroelectric initiative, Kfw Solar PV minigrids: Financing electricity access
o Joint Import up to 50 kW, Joint credit Mechanisms (JCM)-Japanese government.
o Local manufacture of small wind turbines supporting electricity access.
o Universal Adoption of Clean Cooking Solutions, objective that can be pursued
under the umbrella of the GACC
o Improve smart grid technology solutions, grid-scale storage and interaction
between renewables and fossil fuels.
o Innovative Finance, to support financial closure and financing access to energy
services and clean cookstoves:
o Develop financing schemes to provide credit to households that cannot afford the
upfront costs of access to modern energy services;
o Provide regulatory support for scalable and sustainable business and financial
models.
o M-Kopa Solar Initiative. Offering solar Pico and solar Home Systems at a credit with
a repayment of over 12 months.