PJM Renewable Integration - NCSL
21
PJM©2014 www.pjm.com PJM Renewable Integration National Conference of State Legislatures May 29, 2014
Transcript of PJM Renewable Integration - NCSL

PJM©2014 www.pjm.com
PJM Renewable Integration
National Conference of State Legislatures
May 29, 2014
PJM©2014 2 www.pjm.com
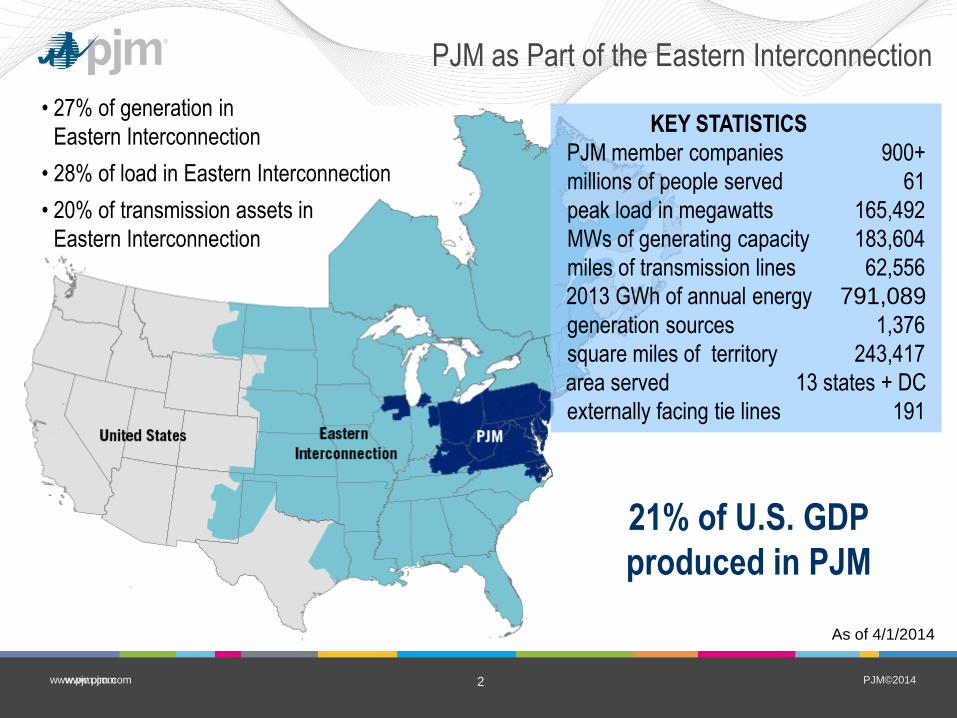
PJM as Part of the Eastern Interconnection
KEY STATISTICS
PJM member companies 900+
millions of people served 61
peak load in megawatts 165,492
MWs of generating capacity 183,604
miles of transmission lines 62,556
2013 GWh of annual energy 791,089
generation sources 1,376
square miles of territory 243,417
area served 13 states + DC
externally facing tie lines 191
• 27% of generation in
Eastern Interconnection
• 28% of load in Eastern Interconnection
• 20% of transmission assets in
Eastern Interconnection
21% of U.S. GDP
produced in PJM
www.pjm.com
As of 4/1/2014
PJM©2014 3 www.pjm.com
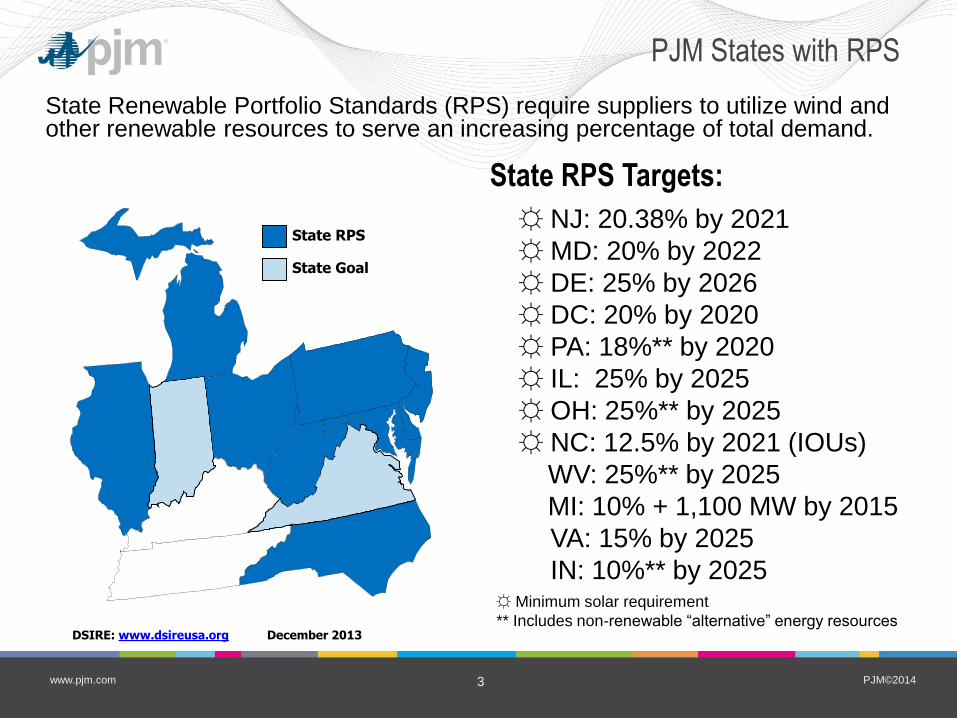
☼ NJ: 20.38% by 2021
☼ MD: 20% by 2022
☼ DE: 25% by 2026
☼ DC: 20% by 2020
☼ PA: 18%** by 2020
☼ IL: 25% by 2025
☼ OH: 25%** by 2025
☼ NC: 12.5% by 2021 (IOUs)
WV: 25%** by 2025
MI: 10% + 1,100 MW by 2015
☼ VA: 15% by 2025
☼ IN: 10%** by 2025 ☼ Minimum solar requirement
** Includes non-renewable “alternative” energy resources DSIRE: www.dsireusa.org December 2013
State RPS Targets:
State Renewable Portfolio Standards (RPS) require suppliers to utilize wind and other renewable resources to serve an increasing percentage of total demand.
State Goal
State RPS
PJM States with RPS
PJM©2014 4 www.pjm.com
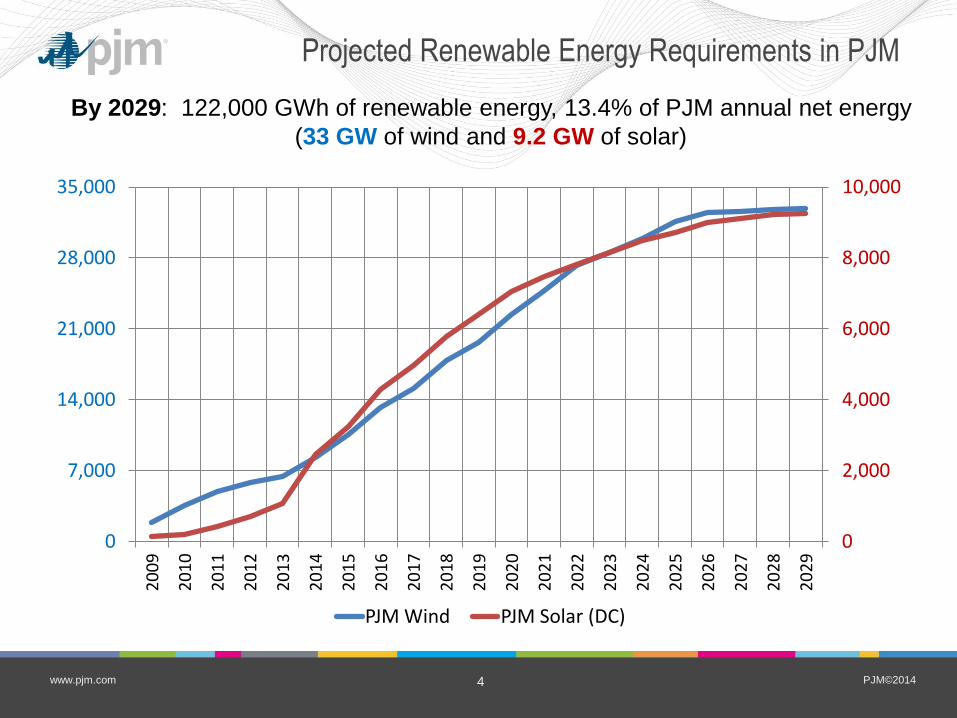
Projected Renewable Energy Requirements in PJM
By 2029: 122,000 GWh of renewable energy, 13.4% of PJM annual net energy
(33 GW of wind and 9.2 GW of solar)
0
2,000
4,000
6,000
8,000
10,000
0
7,000
14,000
21,000
28,000
35,000
20
09
20
10
20
11
20
12
20
13
20
14
20
15
20
16
20
17
20
18
20
19
20
20
20
21
20
22
20
23
20
24
20
25
20
26
20
27
20
28
20
29
PJM Wind PJM Solar (DC)
PJM©2014 5 www.pjm.com
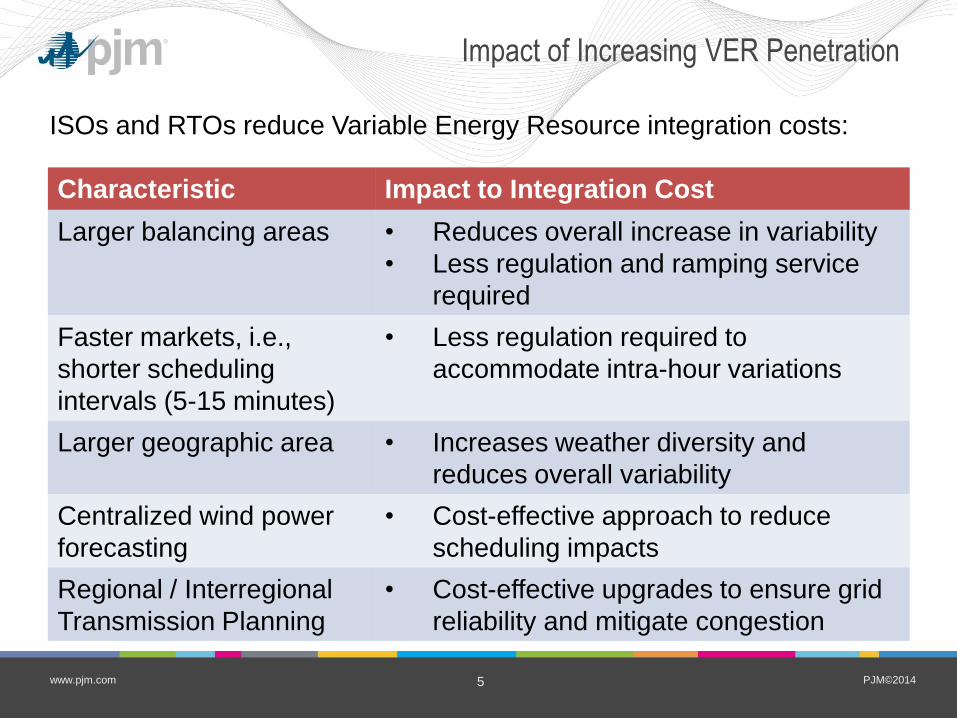
Impact of Increasing VER Penetration
Characteristic Impact to Integration Cost
Larger balancing areas • Reduces overall increase in variability
• Less regulation and ramping service
required
Faster markets, i.e.,
shorter scheduling
intervals (5-15 minutes)
• Less regulation required to
accommodate intra-hour variations
Larger geographic area • Increases weather diversity and
reduces overall variability
Centralized wind power
forecasting
• Cost-effective approach to reduce
scheduling impacts
Regional / Interregional
Transmission Planning
• Cost-effective upgrades to ensure grid
reliability and mitigate congestion
ISOs and RTOs reduce Variable Energy Resource integration costs:
PJM©2014 6 www.pjm.com
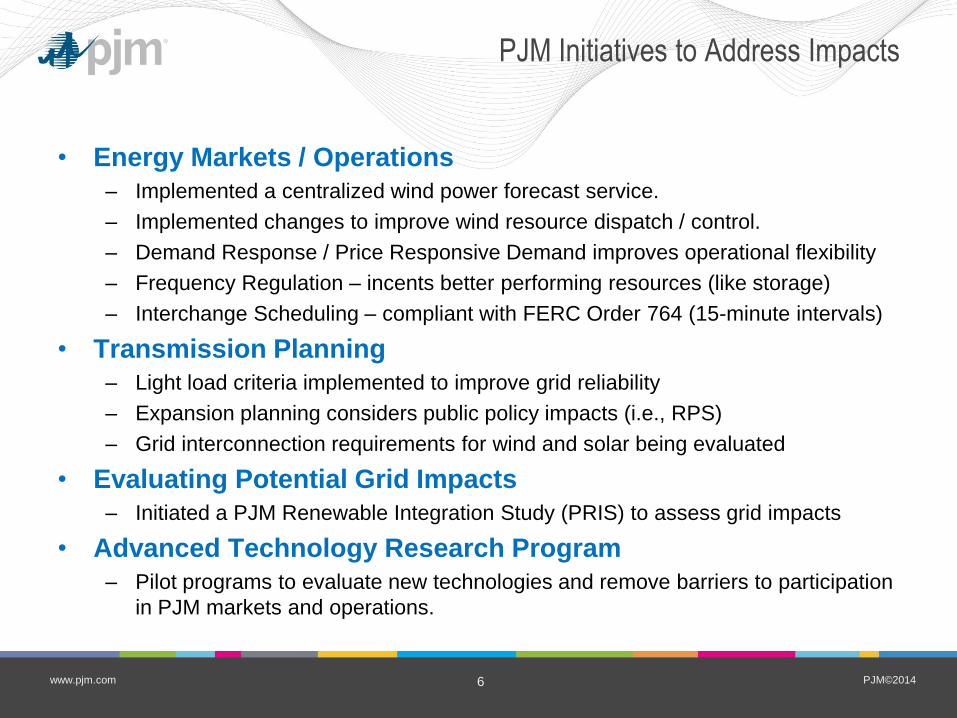
PJM Initiatives to Address Impacts
• Energy Markets / Operations
– Implemented a centralized wind power forecast service.
– Implemented changes to improve wind resource dispatch / control.
– Demand Response / Price Responsive Demand improves operational flexibility
– Frequency Regulation – incents better performing resources (like storage)
– Interchange Scheduling – compliant with FERC Order 764 (15-minute intervals)
• Transmission Planning
– Light load criteria implemented to improve grid reliability
– Expansion planning considers public policy impacts (i.e., RPS)
– Grid interconnection requirements for wind and solar being evaluated
• Evaluating Potential Grid Impacts
– Initiated a PJM Renewable Integration Study (PRIS) to assess grid impacts
• Advanced Technology Research Program
– Pilot programs to evaluate new technologies and remove barriers to participation
in PJM markets and operations.

PJM©2014 7 www.pjm.com
Study Objective
• This study was initiated at the request of PJM stakeholders.
• Study Objective:
– Determine, for the PJM balancing area, the operational, planning, and
market effects of large-scale integration of wind power as well as
mitigation/facilitation measures available to PJM.
– Make recommendations for the implementation of such
mitigation/facilitation measures.
• Disclaimer: The purpose of the study is to assess impacts to the
grid if additional wind and solar are connected. It is not an analysis
of the economics of those resources, therefore quantifying the
capital investment required to construct additional wind and solar is
beyond the scope of this study.
8 © 2014 GE Energy Consulting
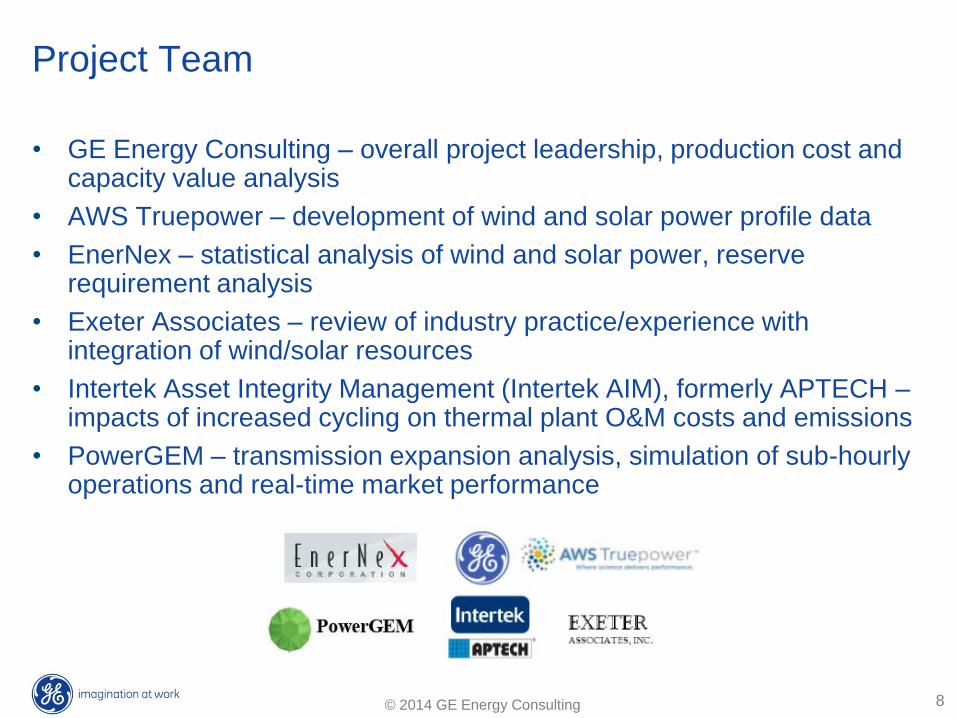
Project Team
• GE Energy Consulting – overall project leadership, production cost and capacity value analysis
• AWS Truepower – development of wind and solar power profile data
• EnerNex – statistical analysis of wind and solar power, reserve requirement analysis
• Exeter Associates – review of industry practice/experience with integration of wind/solar resources
• Intertek Asset Integrity Management (Intertek AIM), formerly APTECH – impacts of increased cycling on thermal plant O&M costs and emissions
• PowerGEM – transmission expansion analysis, simulation of sub-hourly operations and real-time market performance
PJM©2014 9 www.pjm.com
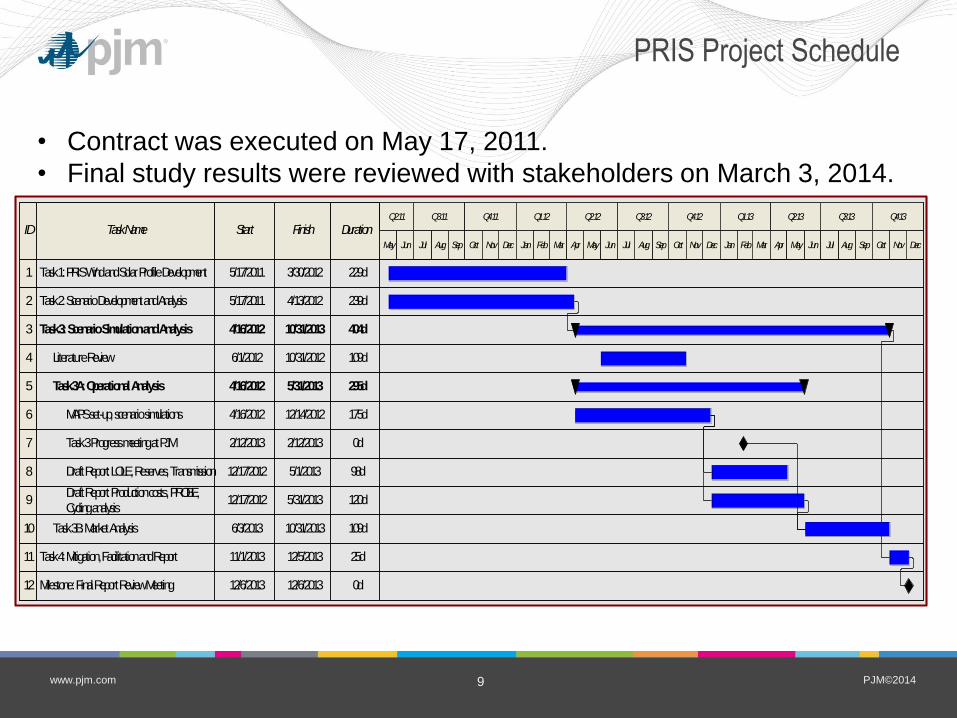
PRIS Project Schedule
ID Task Name Start Finish DurationQ2 12 Q3 13Q4 12 Q2 13Q3 11 Q1 13Q4 11
Aug DecSep JunMay SepDec Mar May Jun JanJanOct Oct OctSep
1 229d3/30/20125/17/2011Task 1: PRIS Wind and Solar Profile Development
239d4/13/20125/17/2011Task 2: Scenario Development and Analysis
3 404d10/31/20134/16/2012Task 3: Scenario Simulation and Analysis
11 25d12/5/201311/1/2013Task 4: Mitigation, Facilitation and Report
12 0d12/6/201312/6/2013Milestone: Final Report Review Meeting
Q1 12
AugNov AugApr Mar Apr
Q4 13
Jul
2
10
5 295d5/31/20134/16/2012Task 3A: Operational Analysis
109d10/31/20136/3/2013Task 3B: Market Analysis
4 109d10/31/20126/1/2012Literature Review
9
8 98d5/1/201312/17/2012Draft Report: LOLE, Reserves, Transmission
120d5/31/201312/17/2012Draft Report: Production costs, PROBE, Cycling analysis
6 175d12/14/20124/16/2012MAPS set-up, scenario simulations
7 0d2/12/20132/12/2013Task 3 Progress meeting at PJM
Q2 11 Q3 12
MayJulJun NovFeb JulFeb Nov Dec
• Contract was executed on May 17, 2011.
• Final study results were reviewed with stakeholders on March 3, 2014.
PJM©2014 10 www.pjm.com
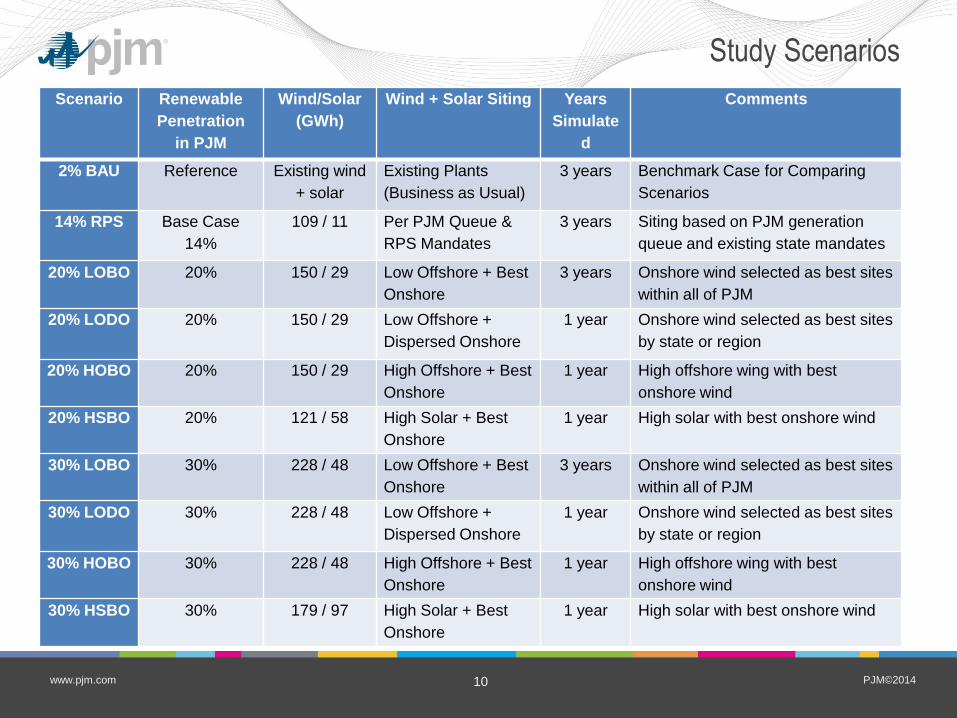
Scenario Renewable
Penetration
in PJM
Wind/Solar
(GWh)
Wind + Solar Siting Years
Simulate
d
Comments
2% BAU Reference Existing wind
+ solar
Existing Plants
(Business as Usual)
3 years Benchmark Case for Comparing
Scenarios
14% RPS Base Case
14%
109 / 11 Per PJM Queue &
RPS Mandates
3 years Siting based on PJM generation
queue and existing state mandates
20% LOBO 20% 150 / 29 Low Offshore + Best
Onshore
3 years Onshore wind selected as best sites
within all of PJM
20% LODO 20% 150 / 29 Low Offshore +
Dispersed Onshore
1 year Onshore wind selected as best sites
by state or region
20% HOBO 20% 150 / 29 High Offshore + Best
Onshore
1 year High offshore wing with best
onshore wind
20% HSBO 20% 121 / 58 High Solar + Best
Onshore
1 year High solar with best onshore wind
30% LOBO 30% 228 / 48 Low Offshore + Best
Onshore
3 years Onshore wind selected as best sites
within all of PJM
30% LODO 30% 228 / 48 Low Offshore +
Dispersed Onshore
1 year Onshore wind selected as best sites
by state or region
30% HOBO 30% 228 / 48 High Offshore + Best
Onshore
1 year High offshore wing with best
onshore wind
30% HSBO 30% 179 / 97 High Solar + Best
Onshore
1 year High solar with best onshore wind
Study Scenarios
PJM©2014 11 www.pjm.com
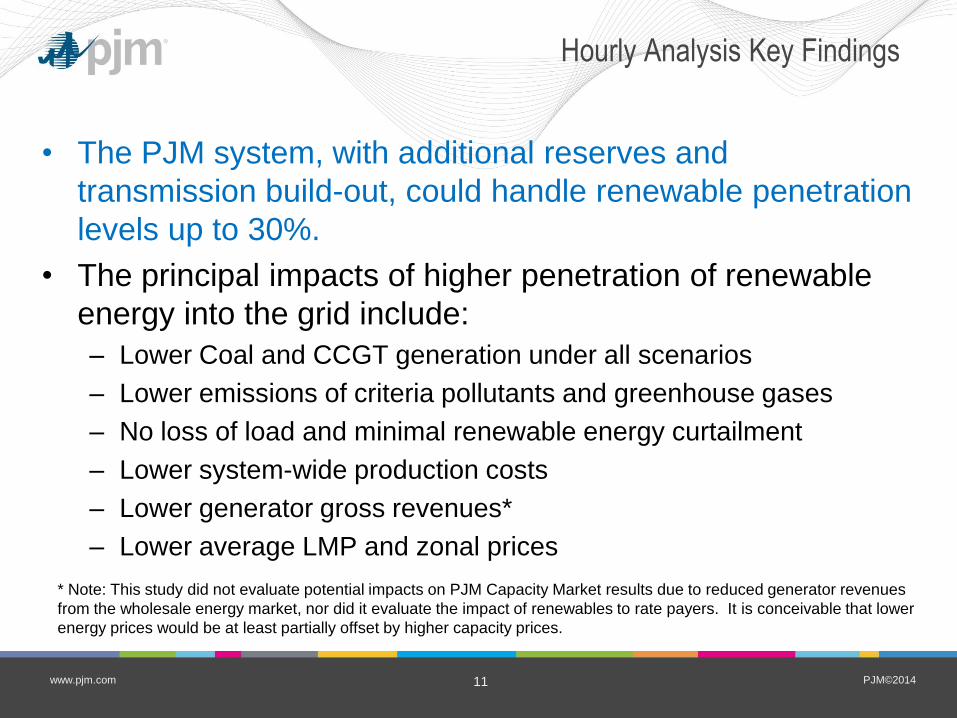
Hourly Analysis Key Findings
• The PJM system, with additional reserves and
transmission build-out, could handle renewable penetration
levels up to 30%.
• The principal impacts of higher penetration of renewable
energy into the grid include:
– Lower Coal and CCGT generation under all scenarios
– Lower emissions of criteria pollutants and greenhouse gases
– No loss of load and minimal renewable energy curtailment
– Lower system-wide production costs
– Lower generator gross revenues*
– Lower average LMP and zonal prices
* Note: This study did not evaluate potential impacts on PJM Capacity Market results due to reduced generator revenues
from the wholesale energy market, nor did it evaluate the impact of renewables to rate payers. It is conceivable that lower
energy prices would be at least partially offset by higher capacity prices.
PJM©2014 12 www.pjm.com
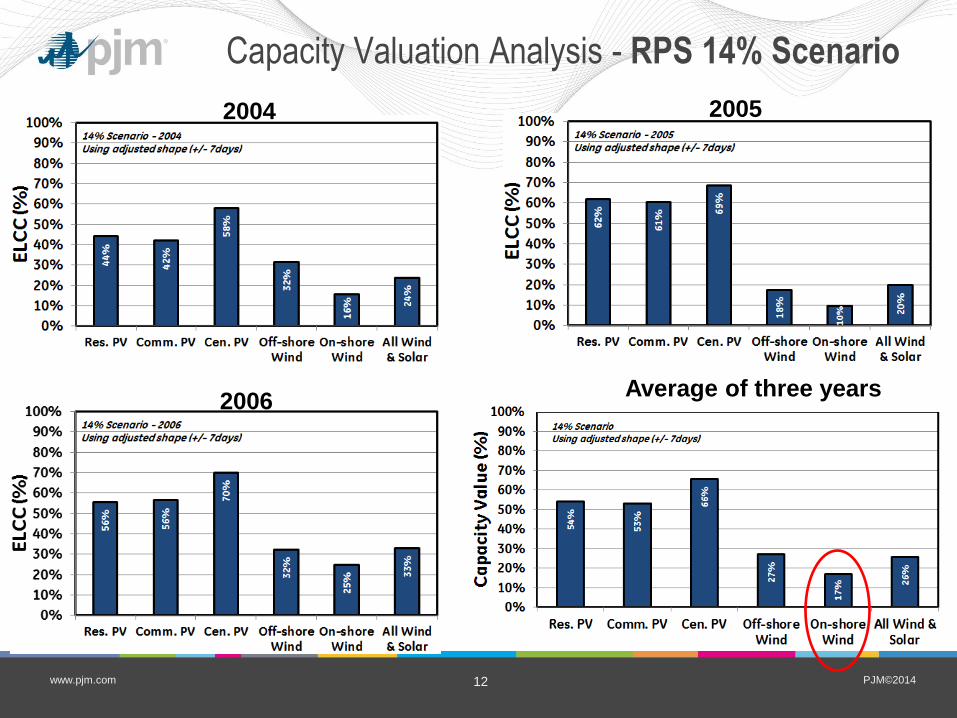
Capacity Valuation Analysis - RPS 14% Scenario
2004 2005
2006 Average of three years
PJM©2014 13 www.pjm.com
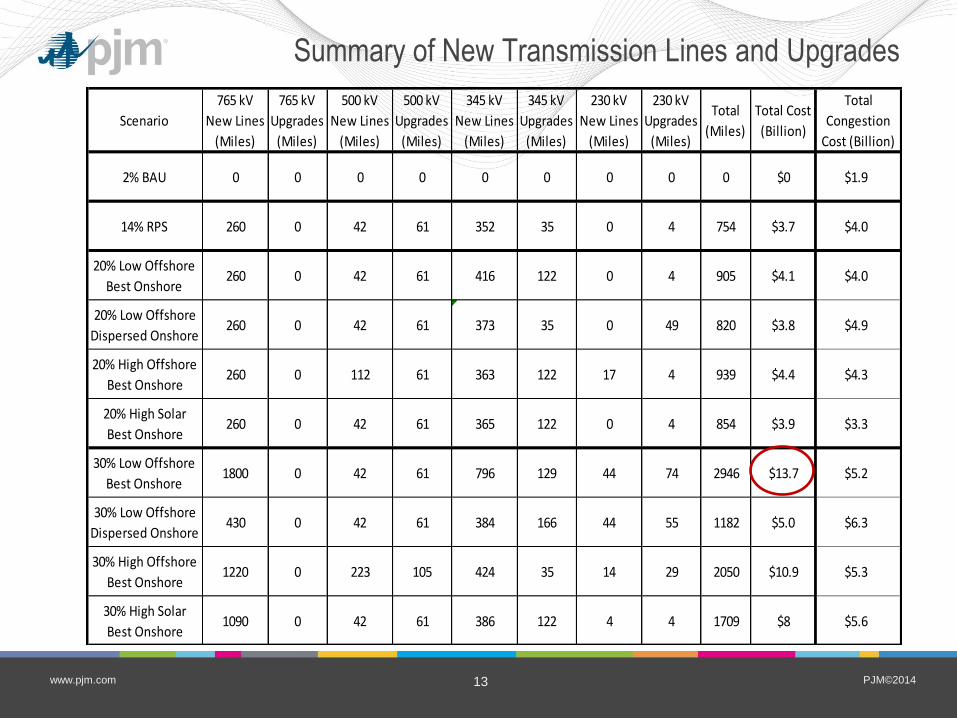
Summary of New Transmission Lines and Upgrades
Scenario
765 kV
New Lines
(Miles)
765 kV
Upgrades
(Miles)
500 kV
New Lines
(Miles)
500 kV
Upgrades
(Miles)
345 kV
New Lines
(Miles)
345 kV
Upgrades
(Miles)
230 kV
New Lines
(Miles)
230 kV
Upgrades
(Miles)
Total
(Miles)
Total Cost
(Billion)
Total
Congestion
Cost (Billion)
2% BAU 0 0 0 0 0 0 0 0 0 $0 $1.9
14% RPS 260 0 42 61 352 35 0 4 754 $3.7 $4.0
20% Low Offshore
Best Onshore260 0 42 61 416 122 0 4 905 $4.1 $4.0
20% Low Offshore
Dispersed Onshore260 0 42 61 373 35 0 49 820 $3.8 $4.9
20% High Offshore
Best Onshore260 0 112 61 363 122 17 4 939 $4.4 $4.3
20% High Solar
Best Onshore260 0 42 61 365 122 0 4 854 $3.9 $3.3
30% Low Offshore
Best Onshore1800 0 42 61 796 129 44 74 2946 $13.7 $5.2
30% Low Offshore
Dispersed Onshore430 0 42 61 384 166 44 55 1182 $5.0 $6.3
30% High Offshore
Best Onshore1220 0 223 105 424 35 14 29 2050 $10.9 $5.3
30% High Solar
Best Onshore1090 0 42 61 386 122 4 4 1709 $8 $5.6
PJM©2014 14 www.pjm.com
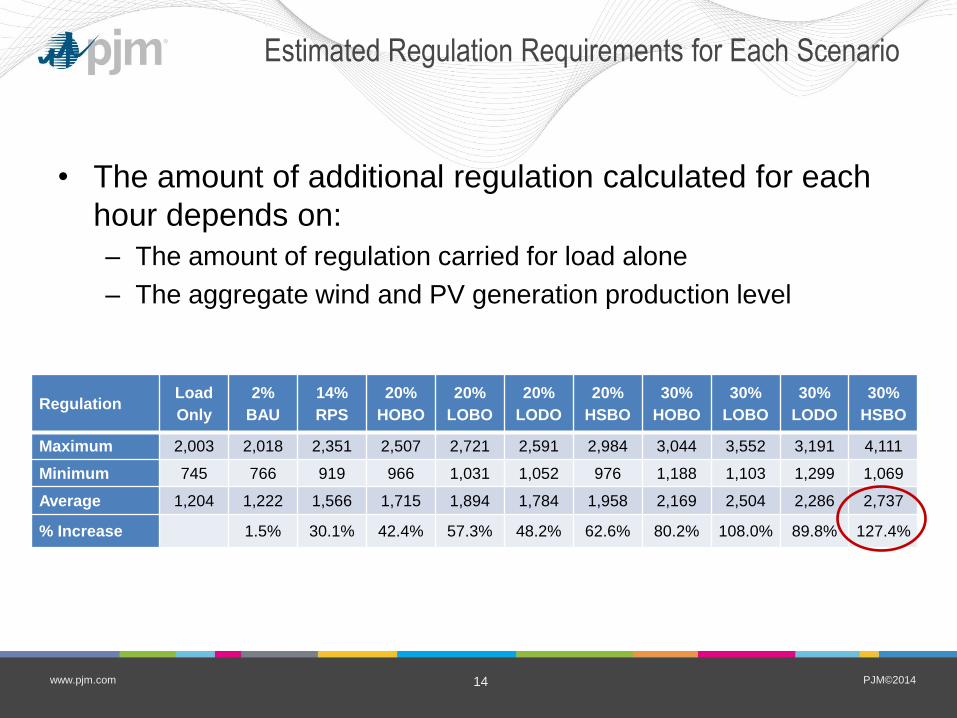
Estimated Regulation Requirements for Each Scenario
• The amount of additional regulation calculated for each
hour depends on:
– The amount of regulation carried for load alone
– The aggregate wind and PV generation production level
Regulation Load
Only
2%
BAU
14%
RPS
20%
HOBO
20%
LOBO
20%
LODO
20%
HSBO
30%
HOBO
30%
LOBO
30%
LODO
30%
HSBO
Maximum 2,003 2,018 2,351 2,507 2,721 2,591 2,984 3,044 3,552 3,191 4,111
Minimum 745 766 919 966 1,031 1,052 976 1,188 1,103 1,299 1,069
Average 1,204 1,222 1,566 1,715 1,894 1,784 1,958 2,169 2,504 2,286 2,737
% Increase 1.5% 30.1% 42.4% 57.3% 48.2% 62.6% 80.2% 108.0% 89.8% 127.4%
PJM©2014 15 www.pjm.com
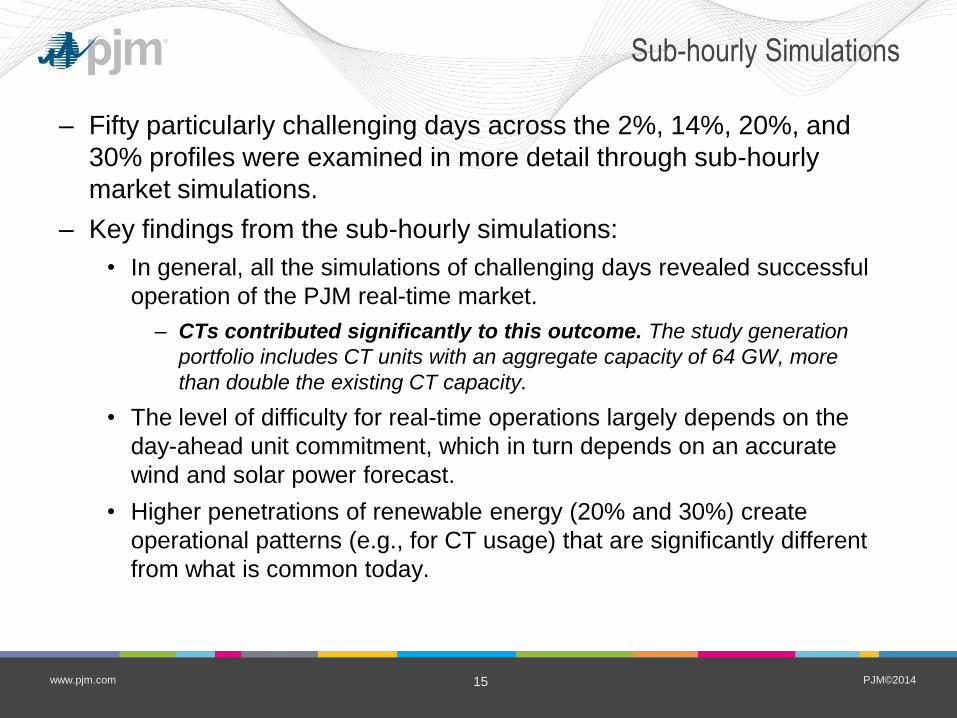
Sub-hourly Simulations
– Fifty particularly challenging days across the 2%, 14%, 20%, and
30% profiles were examined in more detail through sub-hourly
market simulations.
– Key findings from the sub-hourly simulations:
• In general, all the simulations of challenging days revealed successful
operation of the PJM real-time market.
– CTs contributed significantly to this outcome. The study generation
portfolio includes CT units with an aggregate capacity of 64 GW, more
than double the existing CT capacity.
• The level of difficulty for real-time operations largely depends on the
day-ahead unit commitment, which in turn depends on an accurate
wind and solar power forecast.
• Higher penetrations of renewable energy (20% and 30%) create
operational patterns (e.g., for CT usage) that are significantly different
from what is common today.
PJM©2014 16 www.pjm.com
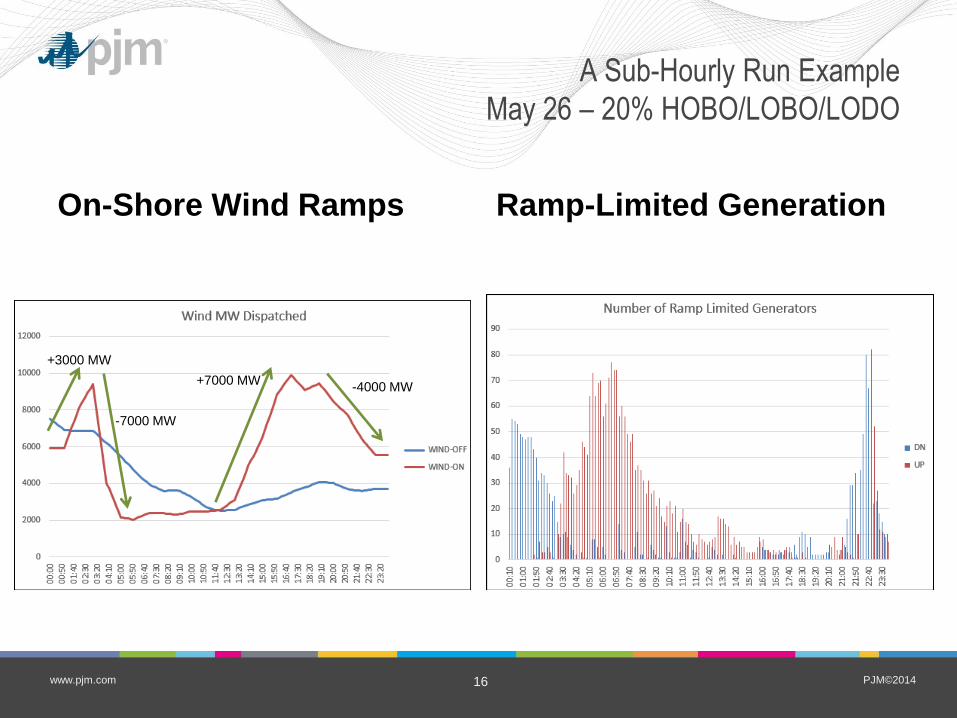
On-Shore Wind Ramps Ramp-Limited Generation
A Sub-Hourly Run Example
May 26 – 20% HOBO/LOBO/LODO
+3000 MW
-7000 MW
-4000 MW +7000 MW
PJM©2014 17 www.pjm.com
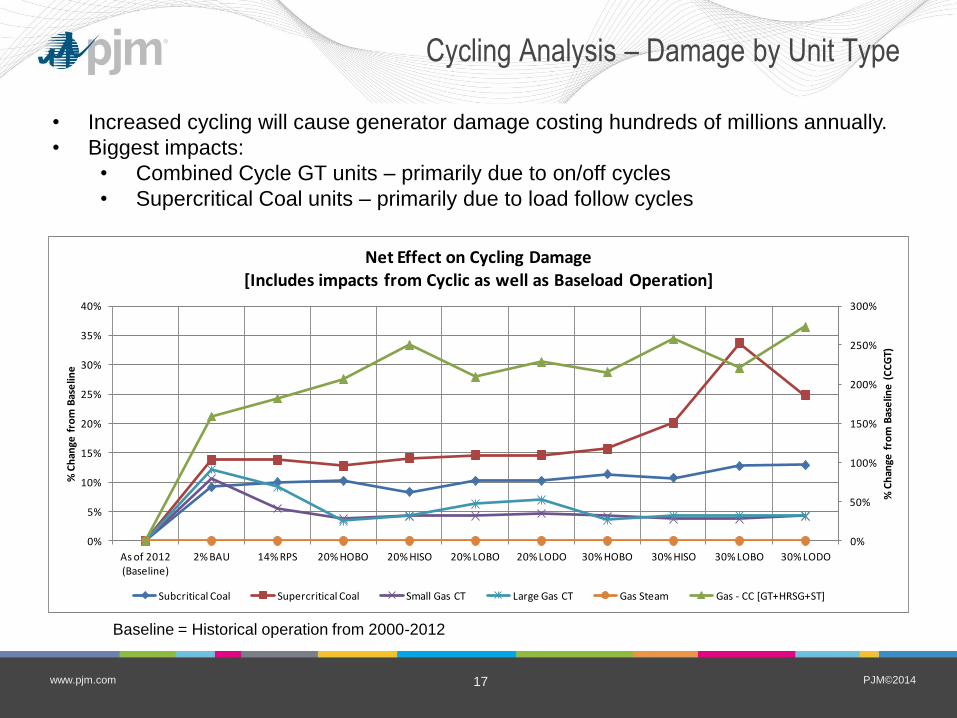
Cycling Analysis – Damage by Unit Type
0%
50%
100%
150%
200%
250%
300%
0%
5%
10%
15%
20%
25%
30%
35%
40%
As of 2012 (Baseline)
2% BAU 14% RPS 20% HOBO 20% HISO 20% LOBO 20% LODO 30% HOBO 30% HISO 30% LOBO 30% LODO
% C
han
ge f
rom
Bas
elin
e (
CC
GT)
% C
han
ge f
rom
Bas
elin
e
Net Effect on Cycling Damage[Includes impacts from Cyclic as well as Baseload Operation]
Subcritical Coal Supercritical Coal Small Gas CT Large Gas CT Gas Steam Gas - CC [GT+HRSG+ST]
• Increased cycling will cause generator damage costing hundreds of millions annually.
• Biggest impacts:
• Combined Cycle GT units – primarily due to on/off cycles
• Supercritical Coal units – primarily due to load follow cycles
Baseline = Historical operation from 2000-2012

PJM©2014 18 www.pjm.com
Cycling Costs Small in Comparison to Fuel Costs
• Taking into consideration the
“extra” wear-and-tear duty
imposed by increased unit
cycling, for the 30% LOBO
scenario production costs
increase from $25.71B to
$26.21B, i.e., $0.50B
($500M) annually.
• These increased cycling
costs are about 3.3% of
production cost savings
($15.13B)

PJM©2014 19 www.pjm.com
SOx Emissions for Study Scenarios
With and Without Cycling Effects Included
On/off cycling and load-following increases emissions compared to steady state levels, but not dramatically.
PJM©2014 20 www.pjm.com
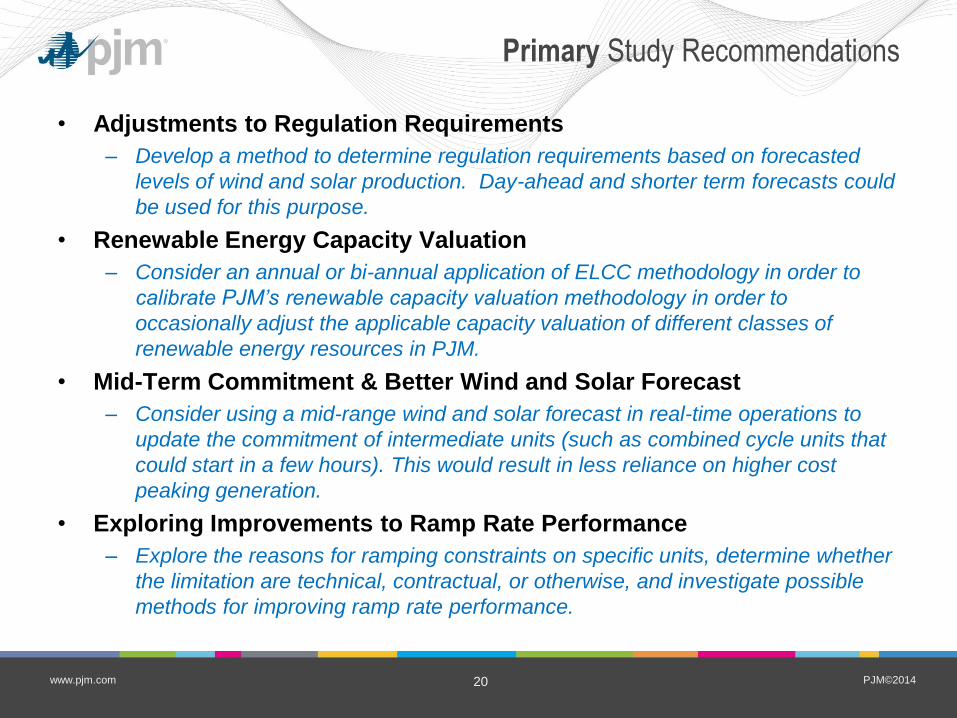
Primary Study Recommendations
• Adjustments to Regulation Requirements
– Develop a method to determine regulation requirements based on forecasted
levels of wind and solar production. Day-ahead and shorter term forecasts could
be used for this purpose.
• Renewable Energy Capacity Valuation
– Consider an annual or bi-annual application of ELCC methodology in order to
calibrate PJM’s renewable capacity valuation methodology in order to
occasionally adjust the applicable capacity valuation of different classes of
renewable energy resources in PJM.
• Mid-Term Commitment & Better Wind and Solar Forecast
– Consider using a mid-range wind and solar forecast in real-time operations to
update the commitment of intermediate units (such as combined cycle units that
could start in a few hours). This would result in less reliance on higher cost
peaking generation.
• Exploring Improvements to Ramp Rate Performance
– Explore the reasons for ramping constraints on specific units, determine whether
the limitation are technical, contractual, or otherwise, and investigate possible
methods for improving ramp rate performance.
PJM©2014 21 www.pjm.com
Next Steps
• PJM’s Intermittent Resources Task Force (IRTF)
will review recommendations from the
Renewable Integration Study and present to the
Market Implementation Committee (MIC) a plan
for how the recommendations ought to be
addressed.
• Proposed approach presented to MIC by August
2014.