Renewable Energy in PJM - PMEA · Proprietary & Confidential Information Renewable Energy in PJM...
32
Proprietary & Confidential Information Renewable Energy in PJM John DiDonato VP, Wind Development
Transcript of Renewable Energy in PJM - PMEA · Proprietary & Confidential Information Renewable Energy in PJM...

Proprietary & Confidential Information
Renewable Energy in PJM
John DiDonato
VP, Wind Development

2 Proprietary & Confidential InformationProprietary & Confidential Information
• Corporate Overview
• Executive Summary
• PJM Overview
• RPS
• EPA Regulation
• Trends in Wind
• Pennsylvania Wind
• Questions
Agenda
3 Proprietary & Confidential InformationProprietary & Confidential Information
• Corporate Overview
• Executive Summary
• PJM Overview
• RPS
• EPA Regulation
• Trends in Wind
• Pennsylvania Wind
• Questions
Agenda
4 Proprietary & Confidential Information
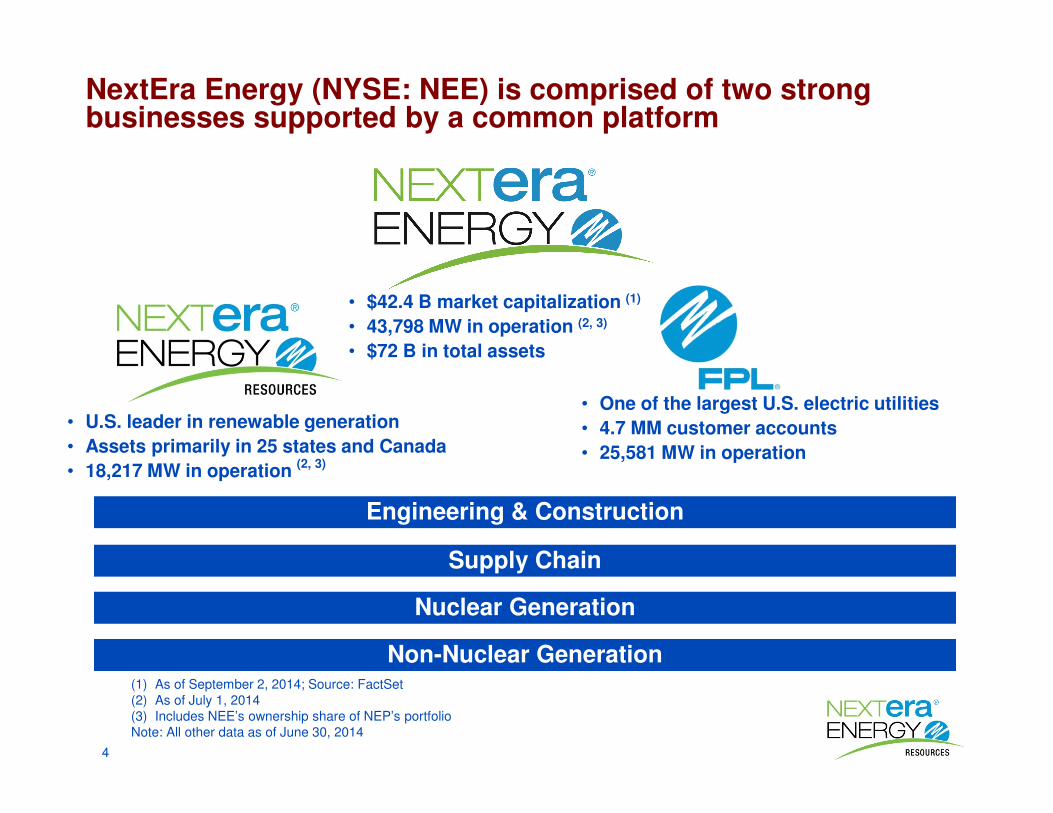
• $42.4 B market capitalization (1)
• 43,798 MW in operation (2, 3)
• $72 B in total assets
• One of the largest U.S. electric utilities
• 4.7 MM customer accounts
• 25,581 MW in operation
NextEra Energy (NYSE: NEE) is comprised of two strong businesses supported by a common platform
• U.S. leader in renewable generation
• Assets primarily in 25 states and Canada
• 18,217 MW in operation (2, 3)
Engineering & Construction
Supply Chain
Nuclear Generation
Non-Nuclear Generation(1) As of September 2, 2014; Source: FactSet(2) As of July 1, 2014(3) Includes NEE’s ownership share of NEP’s portfolioNote: All other data as of June 30, 2014

5 Proprietary & Confidential Information
Nat Gas3,990 MW
Wind10,210 MW
NextEra Energy Resources’ generation portfolio consists of a diverse set of technologies positioned in a number of regions…
NextEra Energy Resources’ Generation Portfolio(1)
(1) As of December 31, 2013; excludes Spain solar project
Nuclear2,721 MW
Oil - 796 MWSolar - 477 MW
Coal 9 MW
Contracted63%
Not Contracted
37%
6 Proprietary & Confidential Information
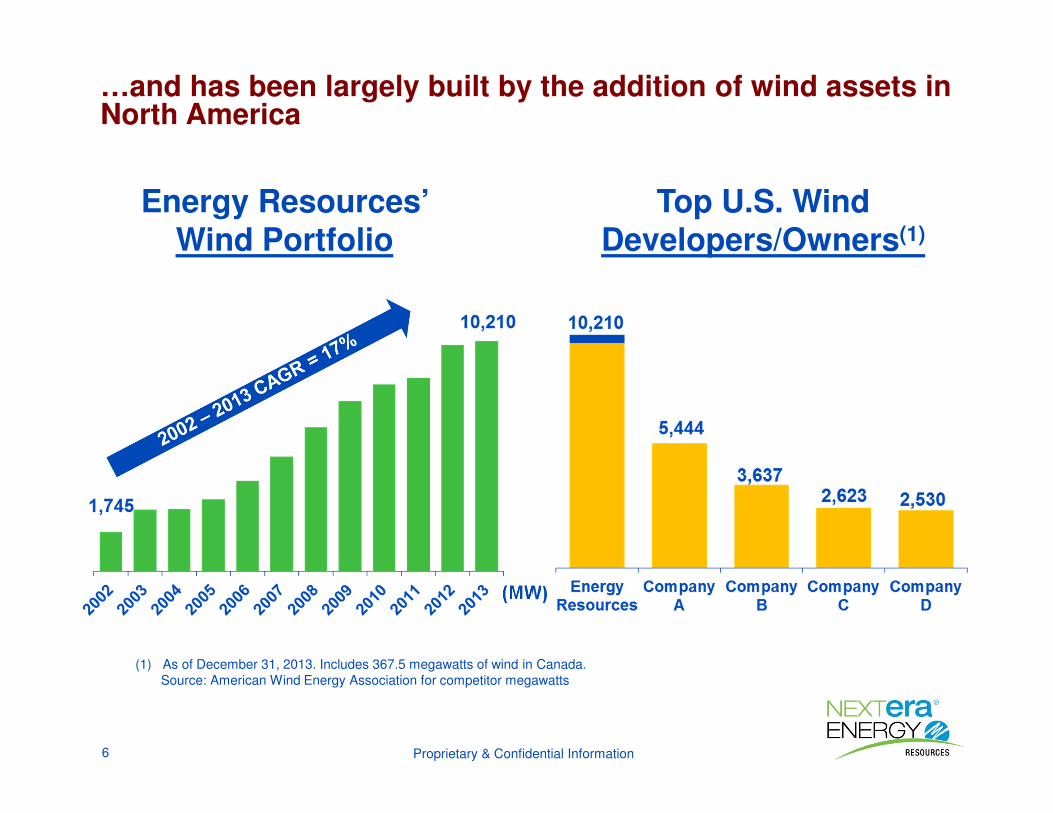
(1) As of December 31, 2013. Includes 367.5 megawatts of wind in Canada.Source: American Wind Energy Association for competitor megawatts
Energy Resources’ Wind Portfolio
…and has been largely built by the addition of wind assets in North America
Top U.S. Wind Developers/Owners(1)
(MW)
7
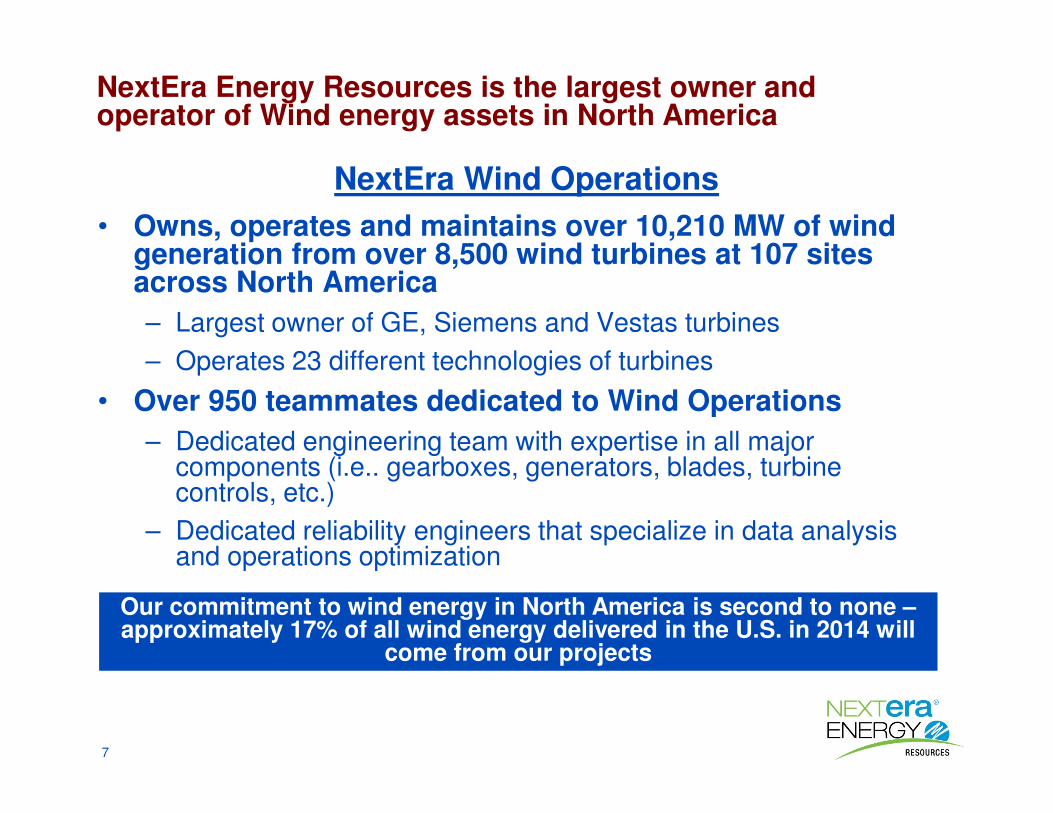
• Owns, operates and maintains over 10,210 MW of wind generation from over 8,500 wind turbines at 107 sites across North America
– Largest owner of GE, Siemens and Vestas turbines
– Operates 23 different technologies of turbines
• Over 950 teammates dedicated to Wind Operations
– Dedicated engineering team with expertise in all major components (i.e.. gearboxes, generators, blades, turbine controls, etc.)
– Dedicated reliability engineers that specialize in data analysis and operations optimization
NextEra Energy Resources is the largest owner and operator of Wind energy assets in North America
NextEra Wind Operations
Our commitment to wind energy in North America is second to none –approximately 17% of all wind energy delivered in the U.S. in 2014 will
come from our projects

8
• Corporate Overview
• Executive Summary
• PJM Overview
• RPS
• EPA Regulation
• Trends in Wind
• Pennsylvania Wind
• Questions
Agenda
9
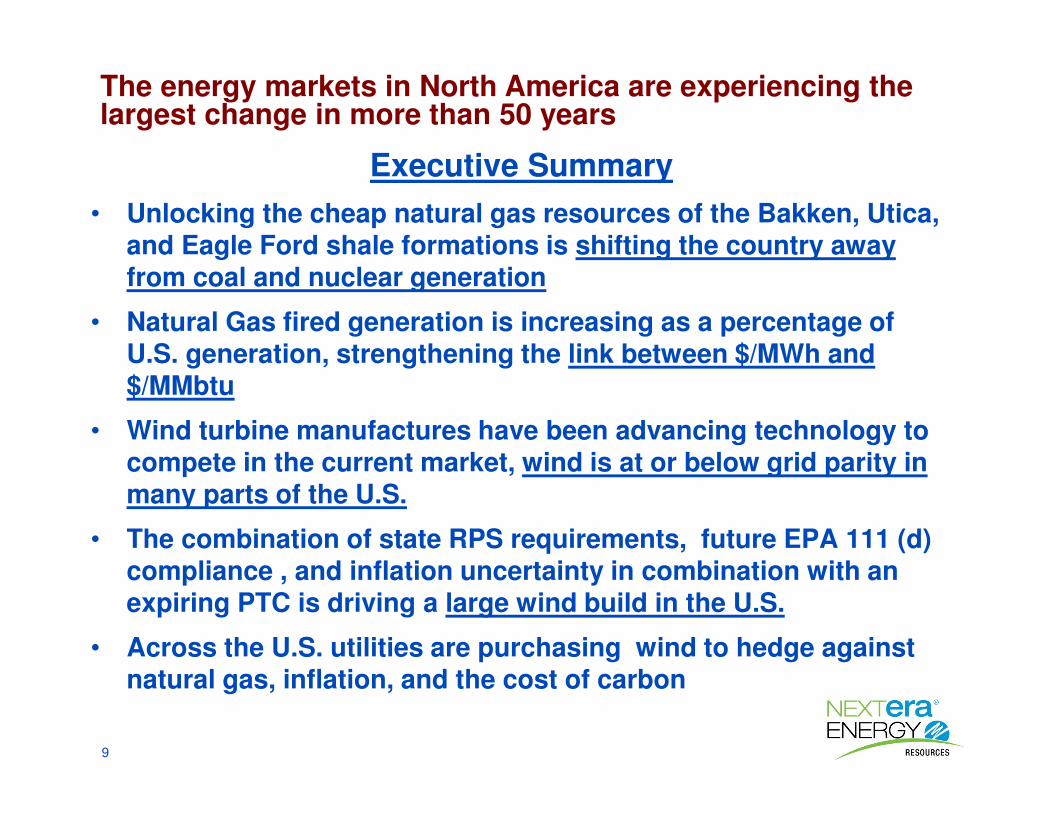
Executive Summary
• Unlocking the cheap natural gas resources of the Bakken, Utica, and Eagle Ford shale formations is shifting the country away from coal and nuclear generation
• Natural Gas fired generation is increasing as a percentage of U.S. generation, strengthening the link between $/MWh and $/MMbtu
• Wind turbine manufactures have been advancing technology to compete in the current market, wind is at or below grid parity in many parts of the U.S.
• The combination of state RPS requirements, future EPA 111 (d) compliance , and inflation uncertainty in combination with an expiring PTC is driving a large wind build in the U.S.
• Across the U.S. utilities are purchasing wind to hedge against natural gas, inflation, and the cost of carbon
The energy markets in North America are experiencing the largest change in more than 50 years

10
• Corporate Overview
• Executive Summary
• PJM Overview
• RPS
• EPA Regulation
• Trends in Wind
• Pennsylvania Wind
• Questions
Agenda

11
Retirements by Fuel
49
28
4043 •56
77
8882
94
2010-2017 CumulativeRetirements
(GW)
New supply to offset retirements
56
Retirements by Region
82 GW Total by 2017
Low natural gas prices and tightening environmental regulations will drive 82 to 94 GW of generation retirements across the U.S. by 2017
PJM (14 GW), MISO (12 GW), and SERC (23 GW) account for the majority of expected coal retirements
1) Source: Ventyx

12
New Entrants(1) by Type
2010-2017 CumulativeNew Supply
(GW)
1) Wind and solar derated to 15% and 50% of nameplate respectively
2) Source: Ventyx
13
26
44
55
65
78
88 91
New Entrants by Region
61 GW of new gas supply combined with 49 GW (11 GW derated) of solar/wind generation will largely offset expected retirements
91 GW Total by 2017
MISO8.2 NY/NE
4.4
PJM16
SERC24.9
SPP5.9
WECC 19.5
ERCOT 12.3
PJM (14 GW), ERCOT (8 GW), and SERC (19 GW), account for the majority of new gas-fired generation
13
2010-2017 Cumulative
(GW)
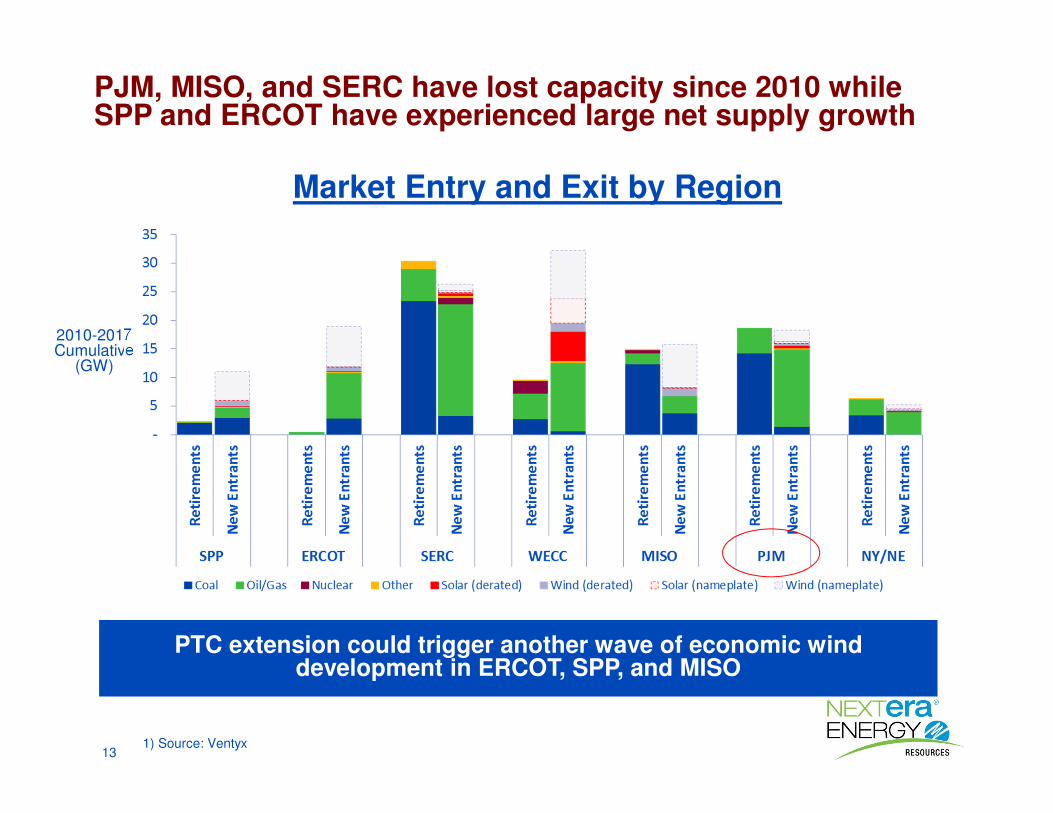
PJM, MISO, and SERC have lost capacity since 2010 whileSPP and ERCOT have experienced large net supply growth
Market Entry and Exit by Region
PTC extension could trigger another wave of economic wind development in ERCOT, SPP, and MISO
1) Source: Ventyx

14
PJM Mid-Atlantic Retirements (GW; 2010-2017)
Retirements in PJM have been concentrated in NJ and MD; driven by low gas prices, NJ HEDD regulations, and MATS emissions requirements
Retired ExpectedAdd’l
At-RiskTotal
Coal 2.1 2.1 1.1 5.2
Oil 1.3 0.6 1.5 2.2
Gas 0.8 1.4 0.1 3.3
Total 4.2 4.0 2.6 10.8
Additional 10 GW of coal retirements expected in ATSI and APS in this timeframe, limiting future energy imports
Actual and Forecast Retirements
Not shown – Oyster Creek (637 MW Nuclear unit in NJ) retires 12/31/2019

15
• Corporate Overview
• Executive Summary
• PJM Overview
• RPS
• EPA Regulation
• Trends in Wind
• Pennsylvania Wind
• Questions
Agenda

16
Renewable builds in the U.S. continue to be focused primarily in areas of strong wind resource rather than areas with net RPS demand
GW
0
5
10
15
20
25
30
35
2010 2011 2012 2013 2014 2015 2016 2017 2018 2019 2020
Cumulative New Supply Cumulative New RPS Demand
RPS Supply and Demand(PJM, NYISO, ISO-NE)
0
5
10
15
20
25
30
35
2010 2011 2012 2013 2014 2015 2016 2017 2018 2019 2020
Cumulative New Supply Cumulative New RPS Demand
RPS Supply and Demand(MISO, SPP, ERCOT)
GW
Assumes 40% wind NCF
Flood of economic wind suppressing spark spreads throughout MISO, SPP, and ERCOT
Contracts or high REC price needed to encourage builds
Economic wind exceeding RPS requirements
17
• Corporate Overview
• Executive Summary
• PJM Overview
• RPS
• EPA Regulation
• Trends in Wind
• Pennsylvania Wind
• Questions
Agenda

18
Proposed Section 111(d) Rule to Regulate CO2 from Existing Generating Units (EGUs)
• Published in Federal Register on June 18, 2013
• Proposes state-by-state CO2 emission targets -- CO2 per megawatt hour (lbs/MWh)
• Based on four building blocks:
1) coal units efficiency improvements,
2) natural gas re-dispatch
3) renewable and nuclear energy
4) energy efficiency
The prospect of EPA Section 111(d) compliance is creating uncertainty in the market, but will ultimately set the price of CO2

19
Timing of 111(b) and 111(d) Rules (Option 1)
Final Rule, as announced
2012 2013 2014 2015 2016 2017 2018 2020 2030
GHG NSPS for new sources (with a separate proposal for modified and reconstructed sources)
Initial State Plans Due
GHG NSPS regulations for existing sources
Final Rule, estimated
Last Year of Obama AdministrationMid-term elections
Proposed Rule Option 1, as announced
Re-ProposalProposal
State Plans Due to EPA
Proposal
Final
Final Multi-State Plans Due
States must achieve interim emission goals
States must achieve final emission goals
•∕∕
•∕∕1-yr Extension Available for Individual State Plans
Under Alternate Option 2 (not shown above), states would be required to achieve an interim emission target in 2020 and a final
target in 2025
Section 111(b) and 111(d), unless litigated against, will be decided under the current administration

20
Regional Compliance Zones
Every major market will see the expansion of renewables based on the average of what states in each region have already committed to
For example, in the Southeast region, only North Carolina has adopted an RPS (10% in 2020), thus, all of the states in the region (including Florida) are expected to be able to meet a 10% renewable target in 2030
10%
16%
25%
20%
15%
21%
Renewable Market
21
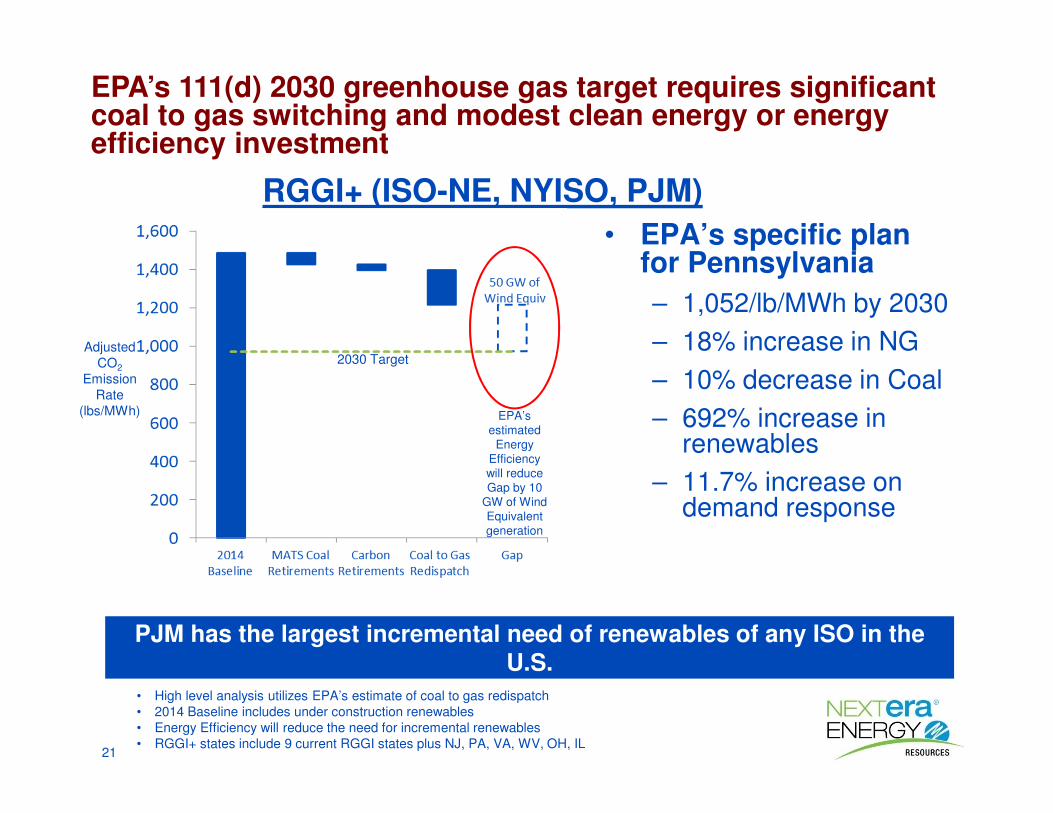
EPA’s 111(d) 2030 greenhouse gas target requires significant coal to gas switching and modest clean energy or energy efficiency investment
RGGI+ (ISO-NE, NYISO, PJM)
AdjustedCO2
Emission Rate
(lbs/MWh)
PJM has the largest incremental need of renewables of any ISO in the U.S.
• High level analysis utilizes EPA’s estimate of coal to gas redispatch• 2014 Baseline includes under construction renewables• Energy Efficiency will reduce the need for incremental renewables• RGGI+ states include 9 current RGGI states plus NJ, PA, VA, WV, OH, IL
2030 Target
EPA’s estimated
Energy Efficiency will reduce Gap by 10
GW of Wind Equivalent generation
• EPA’s specific plan for Pennsylvania
– 1,052/lb/MWh by 2030
– 18% increase in NG
– 10% decrease in Coal
– 692% increase in renewables
– 11.7% increase on demand response

22
• Corporate Overview
• Executive Summary
• PJM Overview
• RPS
• EPA Regulation
• Trends in Wind
• Pennsylvania Wind
• Questions
Agenda

23
U.S. Wind Delivered Cost of Electricity(1)
Renewable projects are increasingly price competitive with conventional generation
(1) Source: 2005-2011 Lawrence Berkeley National Laboratory - March 2013 Report; 2012-2015 NEER estimates based on a typical 100 MW Midwest US project in Oklahoma, Colorado, Texas, or North Dakota; includes federal tax incentives.
Levelized cost to wholesale customer ($/MWh)
• Declining PPA price since 2009
– Increasing NCF
– Turbine pricing
– YieldCo equity
– Maturing market

24
Turbine technology advancements from 2003 to 2014 at NEER’s Waymart Wind Project in Wayne County Pennsylvania would potentially increase the NCF by 71%
Technology Advancement (1)
NCF(%)
Increasing turbine efficiency is expected to continue for the next 3-4 years further increasing project’s NCFs
Hour
(1) Based on NextEra Energy estimates

25
$0
$10
$20
$30
$40
$50
$60
$70
$80
+2.5% NG +3.5% NG Energy PPA PJM REC Value PPA
The value of a bundled product starting in 2016 with PTCs will provide value on day one to the off taker while hedging against energy and carbon
Wind as a Natural Gas (NG) Hedge
($/MWh)
(1) (1) (2)
(1) Assumes 2014 NG at $3.50 MMbtu and an average 10 heat rate
(2) Pace Global PJM Tier I/ Class I REC Pricing Outlook

26
• Corporate Overview
• Executive Summary
• PJM Overview
• RPS
• EPA Regulation
• Trends in Wind
• Pennsylvania Wind
• Questions
Agenda

27
PJM Wind (1)
(1) http://www.pjm.com/planning/generation-interconnection/generation-queue-active.aspx
PA Queue Positions
PJM Queue Positions (Less PA)
PJM Active Queue Positions
9,1174,670
2,896
1,583
270
718
In-Service Under Construction Active Interconnection
2,832
2,277
718
349
330
300 250 200
IL
OH
PA
MD
VA
NC
WN
MI

28
Siting in Pennsylvania

29
Permitting in Pennsylvania
The process to gain entitlements for a wind project in Pennsylvania is expensive and long with little certainty of completion
1 2 3 4 5

30
Environmental Challenges
Endangered bats are the largest environmental concern for the development of wind projects in Pennsylvania
• Bats– White-nose syndrome has decimated population
– Federally Endangered Indiana and Virginia Big-Eared bats
– Candidate Northern Long-Eared Bat
USFWS listing anticipated April 2015
– USFWS request for large buffers from hibernacula

31
Environmental Challenges (continued)
To understand and mitigate avian impacts several years studies are required prior to starting the permitting process
• Avian– Raptor migration corridors (Allegheny Front)
Bald and Golden Eagles

32 Proprietary & Confidential InformationProprietary & Confidential Information
Questions?