Pittsburgh, PA 15213-3890 Examining the Test Process ... · Examining the Test Process: Predicting...
21
1 Examining the Test Process: Predicting the Return on Investment of a Process Change November 15, 2004 © 2004 by David M. Raffo page 1 Pittsburgh, PA 15213-3890 Portland State University Examining the Test Process: Predicting the Return on Investment of a Process Change David M. Raffo, Ph.D. Associate Professor, Portland State University Visiting Scientist, Software Engineering Institute Sponsored by IBM Centre for Advanced Studies page 2 Portland State University Agenda 1. Motivation 2. What are Process Simulation Models 3. Benefits of Process Simulation 4. Examining the Testing Process 5. Goals, Questions, Performance Measures and Data 6. Model Results 7. Conclusion
Transcript of Pittsburgh, PA 15213-3890 Examining the Test Process ... · Examining the Test Process: Predicting...

1Examining the Test Process: Predicting the Return on Investment of a Process ChangeNovember 15, 2004
© 2004 by David M. Raffo
page 1
Pittsburgh, PA 15213-3890
Portland StateUniversity
Examining the Test Process: Predicting the Return on Investment of a Process Change
David M. Raffo, Ph.D.Associate Professor, Portland State UniversityVisiting Scientist, Software Engineering Institute
Sponsored by IBM Centre for Advanced Studies
page 2
Portland StateUniversity
Agenda1. Motivation
2. What are Process Simulation Models
3. Benefits of Process Simulation
4. Examining the Testing Process
5. Goals, Questions, Performance Measures and Data
6. Model Results
7. Conclusion

2Examining the Test Process: Predicting the Return on Investment of a Process ChangeNovember 15, 2004
© 2004 by David M. Raffo
page 3
Portland StateUniversity
MotivationCompetition within the U.S. and abroad is putting pressure on software firms to improve performance in terms of:
• Reducing costs
• Reducing cycle time
• Reducing defects
In order to compete, organizations need to incorporate new methods and tools into their development operations quickly
page 4
Portland StateUniversity
Introducing - Process Simulation
One area that can help companies improve their processes is Process Simulation.
Process Simulation supports organizations at alllevels of the CMMI• Designing and defining processes• Quantitative process management • Continuous process improvement
3Examining the Test Process: Predicting the Return on Investment of a Process ChangeNovember 15, 2004
© 2004 by David M. Raffo
page 5
Portland StateUniversity
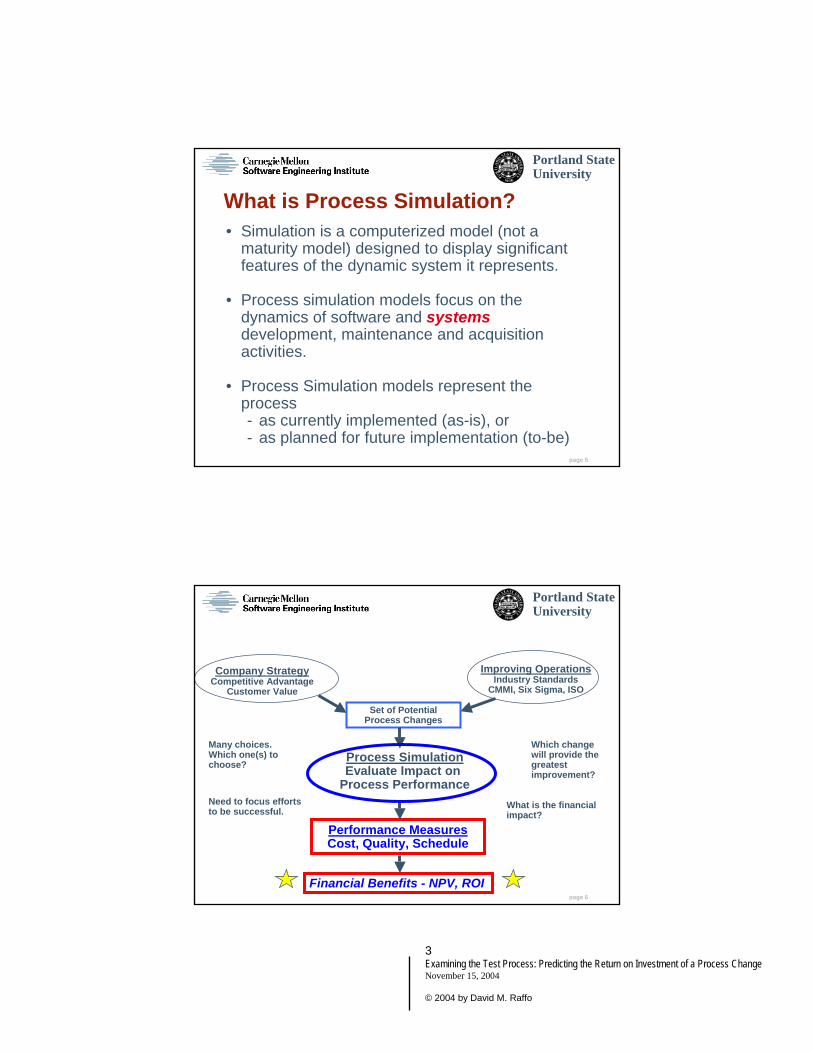
What is Process Simulation?• Simulation is a computerized model (not a
maturity model) designed to display significant features of the dynamic system it represents.
• Process simulation models focus on the dynamics of software and systemsdevelopment, maintenance and acquisition activities.
• Process Simulation models represent the process- as currently implemented (as-is), or- as planned for future implementation (to-be)
page 6
Portland StateUniversity
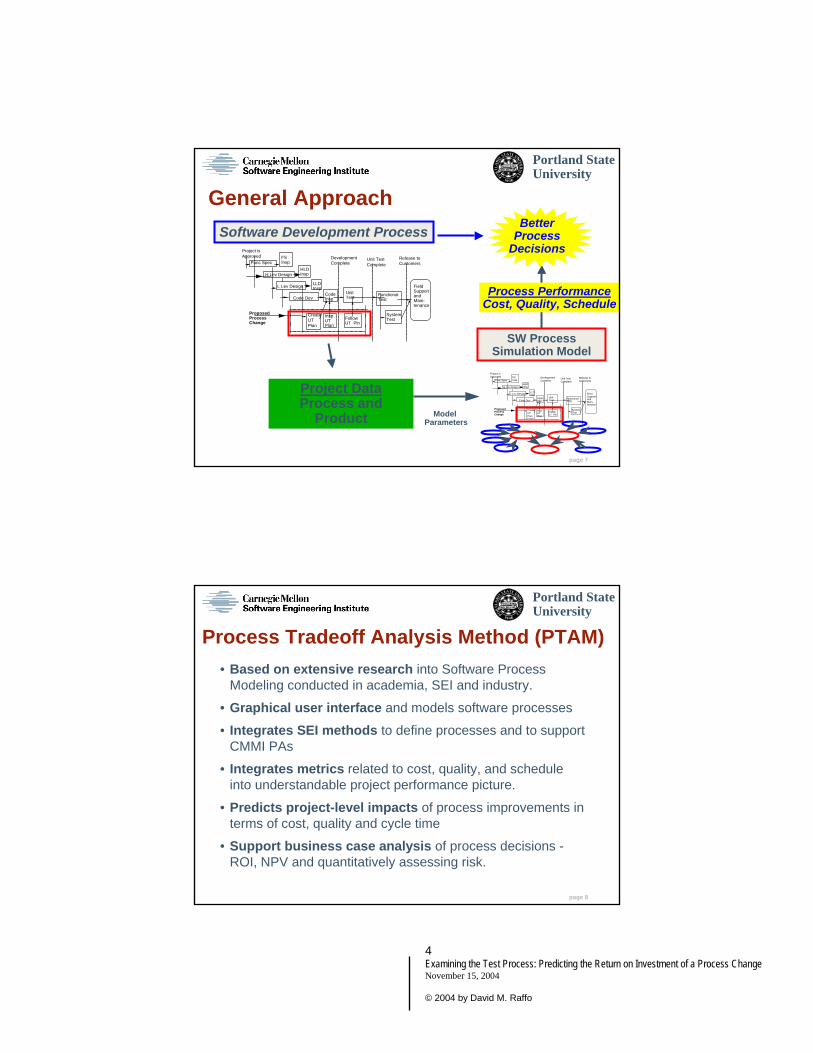
Company StrategyCompetitive Advantage
Customer Value
Improving OperationsIndustry Standards
CMMI, Six Sigma, ISO
Process SimulationEvaluate Impact on
Process Performance
Performance MeasuresCost, Quality, Schedule
Financial Benefits - NPV, ROI
Many choices.Which one(s) to choose?
Which change will provide the greatest improvement?
Need to focus effortsto be successful. What is the financial
impact?
Set of Potential Process Changes
4Examining the Test Process: Predicting the Return on Investment of a Process ChangeNovember 15, 2004
© 2004 by David M. Raffo
page 7
Portland StateUniversity
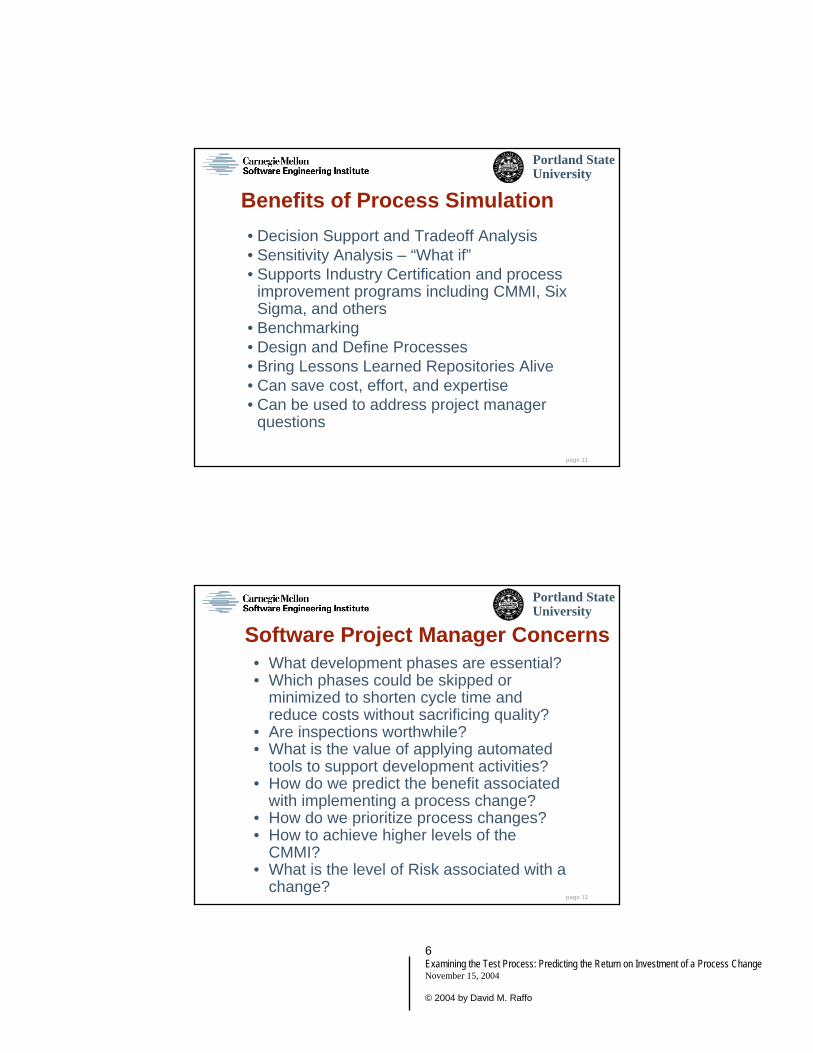
General Approach
Process PerformanceCost, Quality, Schedule
Code DevCodeInsp
Unit Test Functional
Test
System Test
FieldSupportandMain-tenance
H Lev DesignHLD Insp
L Lev Design LLDInsp
Func SpecFSInsp
Project is Approved Development
CompleteUnit Test Complete
Release to Customers
InspUTPlan
Follow UT Pln
ProposedProcessChange
CreateUTPlan
Project DataProcess and
Product
BetterProcess
DecisionsSoftware Development Process
SW Process Simulation Model
Code DevCodeInsp
Unit Test Functional
Test
System Test
FieldSupportandMain-tenance
H Lev DesignHLD Insp
L Lev Design LLDInsp
Func SpecFSInsp
Project is Approved Development
CompleteUnit Test Complete
Release to Customers
InspUTPlan
Follow UT Pln
ProposedProcessChange
CreateUTPlanModel
Parameters
page 8
Portland StateUniversity
Process Tradeoff Analysis Method (PTAM)• Based on extensive research into Software Process
Modeling conducted in academia, SEI and industry.
• Graphical user interface and models software processes
• Integrates SEI methods to define processes and to support CMMI PAs
• Integrates metrics related to cost, quality, and schedule into understandable project performance picture.
• Predicts project-level impacts of process improvements in terms of cost, quality and cycle time
• Support business case analysis of process decisions -ROI, NPV and quantitatively assessing risk.

5Examining the Test Process: Predicting the Return on Investment of a Process ChangeNovember 15, 2004
© 2004 by David M. Raffo
page 9
Portland StateUniversity
Process Tradeoff Analysis Method (PTAM)
• Reduces risk associated with process changes by predicting the probability of improvement
• Saves time, effort and expertise over other methods
page 10
Portland StateUniversity
What are the Benefits of Process Simulation?
Option
Total Effort
(PM) Dev Eff + Dev
Rwk
Rework Effort Devel
Defects (PM)
Project Duration (Calendar Months)
Projected Cost or
Revenue delta due
to Duration Change
Total Injected Defects
Corrected Defects
Escapted Defects
Rework Effort for
Field Defects
(PM)
Implementation
Costs ($) NPV ROI0
200 90 18 $0.00 1150 990 160 40 $0.00 n.a. n.a.
1 190 75 17.5 $0.00 1150 1020 130 30 $100,000 $165,145 15%
2 185 75 17 $ 100,000 1150 1050 100 20 $120,000 $185,231 29%
3 175 65 16 $ 300,000 1150 1090 60 10 $ 80,000 $289,674 88%
4 230 130 22 $(400,000) 1150 900 250 80 $0.00 -$378,043 -129%
5
Add QuARS Tool
Eliminate
Additional Process
Project
Base Case
Implement QFD
Implement VOC
6Examining the Test Process: Predicting the Return on Investment of a Process ChangeNovember 15, 2004
© 2004 by David M. Raffo
page 11
Portland StateUniversity
Benefits of Process Simulation• Decision Support and Tradeoff Analysis• Sensitivity Analysis – “What if”• Supports Industry Certification and process
improvement programs including CMMI, Six Sigma, and others
• Benchmarking• Design and Define Processes• Bring Lessons Learned Repositories Alive• Can save cost, effort, and expertise• Can be used to address project manager
questions
page 12
Portland StateUniversity
Software Project Manager Concerns• What development phases are essential? • Which phases could be skipped or
minimized to shorten cycle time and reduce costs without sacrificing quality?
• Are inspections worthwhile?• What is the value of applying automated
tools to support development activities? • How do we predict the benefit associated
with implementing a process change?• How do we prioritize process changes?• How to achieve higher levels of the
CMMI?• What is the level of Risk associated with a
change?

7Examining the Test Process: Predicting the Return on Investment of a Process ChangeNovember 15, 2004
© 2004 by David M. Raffo
page 13
Portland StateUniversity
NASA IV&V Questions• What is the optimal IV&V strategy for a given NASA project
or NASA project type?• What combination(s) of IV&V techniques enable us to meet
or exceed the quality assurance goals for the system? Which alternative is best?
• Given a budget of “X” dollars, what IV&V activities should be conducted?
• What if the complexity or defect profiles for a particular project were different than expected?
• How is the duration of the IV&V effort impacted by the overall staffing level for the project? How will this affect the total project duration?
• What would be the impact if selected V&V techniques are handled as IV&V services?
page 14
Portland StateUniversity
Potential Questions• What would be the costs and benefits associated with
implementing an IV&V technique on a selected software project?
• How would the IV&V technique contribute to the development process and quality assurance?
• How would IV&V activity “X” work in conjunction with other V&V or IV&V techniques?
• At what point in the process does this technique provide the greatest benefit (e.g. before or after testing)?
• What would be the impact if a IV&V technique “X” is applied at different portions of the process or applied multiple times?

8Examining the Test Process: Predicting the Return on Investment of a Process ChangeNovember 15, 2004
© 2004 by David M. Raffo
page 15
Portland StateUniversity
Supports CMMI Based Process Improvement
CMMI Levels 4 and 5• Process simulation helps to fulfill PAs (OID, CAR, OPP
and QPM - Sub Goals and Generic Goals)
CMMI Levels 2 and 3• Process simulation can be used to evaluate alternative
process choices (RD, TS, PI, V&V, RM, SAM, PPQA, and CM)
• Process simulation helps to fulfill PAs (OPF, OPD, OT, IPM, Risk, DAR, PP, PMA, MA, PPQA – Multiple Sub Goals and Generic Goals )
page 16
Portland StateUniversity
Examining the Test Process: Organizational Setting• Leading software development firm• Peak staffing of 60 developers on project• Assessed at strong Level 2 of CMM/CMMI• Experienced development staff• 5th release of commercial project• Data available in electronic and paper form:
quantitative and qualitative; professional estimates used to fill in gaps
• Active SEPG

9Examining the Test Process: Predicting the Return on Investment of a Process ChangeNovember 15, 2004
© 2004 by David M. Raffo
page 17
Portland StateUniversity
CMMI Level 3 PAs: Validation and Verification• Problem: Releasing defective products,
had high schedule variance.• Why? Unit Test was main defect removal
stage. They did it unreliably.• Built a model of Large-Scale commercial
development process• Based on actual project data • Predicted project performance in terms of
effort, task duration and delivered defects. • Part of a full business case analysis -
determined financial performance of the process change
page 18
Portland StateUniversity
Process Overview - 1
Func SpecFS Insp
1
HL DesignHLD Insp
LL DesignLLD Insp
Code Code Insp
Unit Test Execution
Functional Test
1 Test PlanTP Insp
Test Case TC Insp
System Test
Field Support and Main-tenance
Project is Approved Development
Complete Unit Test Complete
Release to Customers
Change
Diagram of the Field Study Life Cycle AS-IS Process
Tasks AffectedBy ProcessChange

10Examining the Test Process: Predicting the Return on Investment of a Process ChangeNovember 15, 2004
© 2004 by David M. Raffo
page 19
Portland StateUniversity
Process Overview - 2
Code DevCode Insp
Unit Test Execution
Begin Code Development
Conducted during Code Development
Create Unit Test Plans
Prep, Insp, and RWK UT Plans
Follow UT Plan
Conducted as part of regular Code Inspection
Followed while conducting Unit
Test
Unit Test Complete; Begin Functional Testing
Code Development is Complete
Code Inspection is Complete
page 20
Portland StateUniversity
Questions Investigated• Will the process change improve project
performance?• What is the cost the firm is currently paying by
conducting Unit Tests incorrectly? • Is partial implementation of the proposed
process change possible? • How would potential learning curve effects
affect the performance of the process change?• Would alternative process changes offer a
greater improvement?• Can the project benefit from reusing process
artifacts?
11Examining the Test Process: Predicting the Return on Investment of a Process ChangeNovember 15, 2004
© 2004 by David M. Raffo
page 21
Portland StateUniversity
Performance MeasuresCost• Person-Months of Development, Inspection,
Testing and Rework effort• Equivalent Manpower (Staffing levels)• Implementation costs
Quality• Number of delivered defects by type
Schedule• Months of Effort
page 22
Portland StateUniversity
Input Data• CMM/CMMI Level 2+ organization• Process documents and assessments• Project Size• Productivity• Earned Value by phase• Total number of defects injected• Defect injection, detection and correction rates• Effort and schedule data• Defect detection and rework costs

12Examining the Test Process: Predicting the Return on Investment of a Process ChangeNovember 15, 2004
© 2004 by David M. Raffo
page 23
Portland StateUniversity
Graphical Model
Func SpecFS Insp
1
HL DesignHLD Insp
LL DesignLLD Insp
Code Code Insp
Unit Test Execution
Functional Test
1 Test PlanTP Insp
Test Case TC Insp
System Test
Field Support and Main-tenance
Project is Approved Development
Complete Unit Test Complete
Release to Customers
Change
Diagram of the Field Study Life Cycle AS-IS Process
Tasks AffectedBy ProcessChange
page 24
Portland StateUniversity
Simplified Error ModelErrors
injectedin thisphase
Errors detected(and removed)
PerformWork
VerifyWork
ReworkDetected
Errors
Undetectederrors from
previous phase
Undetectederrors to
next phaseVerificationEfficiency
Errors DetectedTotal Errors Present=

13Examining the Test Process: Predicting the Return on Investment of a Process ChangeNovember 15, 2004
© 2004 by David M. Raffo
page 25
Portland StateUniversity
More Detailed Error Model
PreliminaryDesign
DevTA
TARev
Rwk
DevUA
UARev Rwk
Code CodeRev Rwk
RwkUT
RwkPT
RwkInt
Test
Errors injected
Errors detected
Errorsundetected
Errors injected
Errors injected
Errors detected
Errors detected
Errorsundetected
Errorsundetected
Errorsundetected
Errorsundetected
Errors detected
Errors detected
Errorsdetected
SW Req. Analysis& Preliminary Dsn SW Detailed Design Coding
UnitTest
ProcessTest
Integration& Formal Test
page 26
Portland StateUniversity
Unit Test Planning Process ChangeEstimate Localized Impacts
• Effort and schedule to develop test plans• Early detection and removal of defects while
creating test plans• Inspection effort for inspecting and reworking test
plans• Improved efficiency during Unit Test due to
following the plans

14Examining the Test Process: Predicting the Return on Investment of a Process ChangeNovember 15, 2004
© 2004 by David M. Raffo
page 27
Portland StateUniversity
Key Parameters for the Process ChangeModel Parameters AS-IS
ObservedT O-BEEstimated
T O-BE(Observed)Pilot StudyValue
Create Unit T est Plan Effort (Hoursper KLOC)
0.0 Min=47.6Mode= 72.2Max = 144.3
Min=83.3Mode= 110.1Max = 200.0
Percentage of Current ErrorsRemoved before Code Inspectionswhile creating the Unit Test Plans
0.0% Min = 9.0%Mode=15.7%Max = 22.5%
Min = 0.0%Mode=6.4%Max = 28.6%
Percent Unit Test Effort Decreasedue to following the plan
0.0% Min = 5%Mode=10%Max = 15%
Min = 15%Mode=30%Max = 40%
Percent Increase in Unit Test ErrorDetection Capability
0.0% Min = 10%Mode=15%Max = 20%
Min = 8%Mode=10%Max = 15%
Effort to Prepare for the Inspectionof the Unit Test Plan
0.0 added 10% tothe time of theCodeInspection
Min=11.4Mode= 17.5Max = 25.0
Effort to Inspect the Unit Test Plan(hours per meeting)
0.0 Min=0.25Mode= 0.25Max = 0.25
Min=0Mode= 0.25Max = 0.40
Effort to Rework the Unit Test Plan(hours per plan error)
0.0 0.0 Min=0.0Mode= 2.0Max = 3.0
page 28
Portland StateUniversity
Unit Test Planning Process ChangeModel Predicts Project Level Impacts
• Cost, quality, and schedule impacts by phase for all phases of development
• Overall cost, quality, and schedule impacts for the project
• Implementation costs• Post deployment quality

15Examining the Test Process: Predicting the Return on Investment of a Process ChangeNovember 15, 2004
© 2004 by David M. Raffo
page 29
Portland StateUniversity
Baseline Results• The process change offered significant
reductions in remaining defects, staff effort to correct field detected defects, and project duration. The expected ROI was 56% for a typical 30 KLOC release.
• Pilot implementations indicated that the process change provided a 37% ROI even under worst case conditions.
page 30
Portland StateUniversity
Model Results
PERFORMANCE AS-IS TO-BE MEAN PCT CHG P-VAL PROBMEASURE DIFF CHG STD IMPR
REMAINING 10.21 8.51 1.70 16.65% 0.93 0.000 97%ERRORS
LIFE CYCLE 52.42 52.49 -0.07 -0.12% 1.02 0.446 49%EFFORT (PM)
TOTAL 62.00 60.47 1.53 2.47% 1.43 0.000 85%EFFORT(PM)
LIFE CYCLE 18.05 16.44 1.61 8.92% 1.75 0.000 79%DURATION (Mo)
16Examining the Test Process: Predicting the Return on Investment of a Process ChangeNovember 15, 2004
© 2004 by David M. Raffo
page 31
Portland StateUniversity
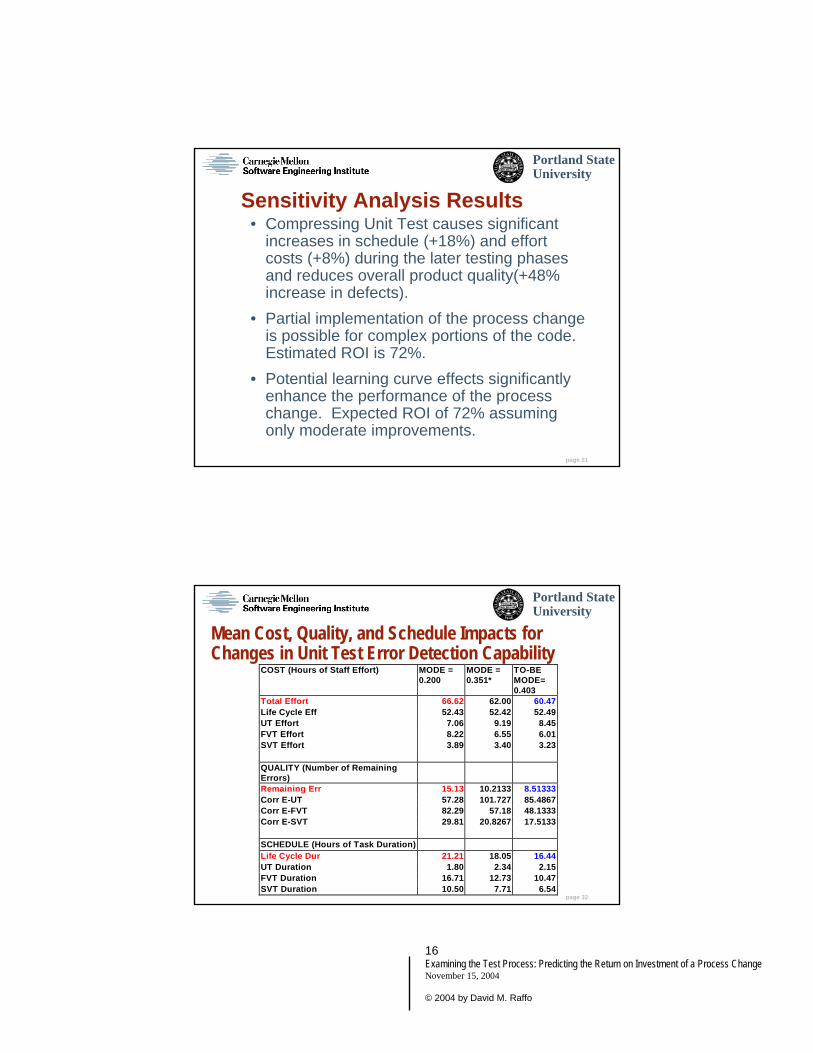
Sensitivity Analysis Results• Compressing Unit Test causes significant
increases in schedule (+18%) and effort costs (+8%) during the later testing phases and reduces overall product quality(+48% increase in defects).
• Partial implementation of the process change is possible for complex portions of the code. Estimated ROI is 72%.
• Potential learning curve effects significantly enhance the performance of the process change. Expected ROI of 72% assuming only moderate improvements.
page 32
Portland StateUniversity
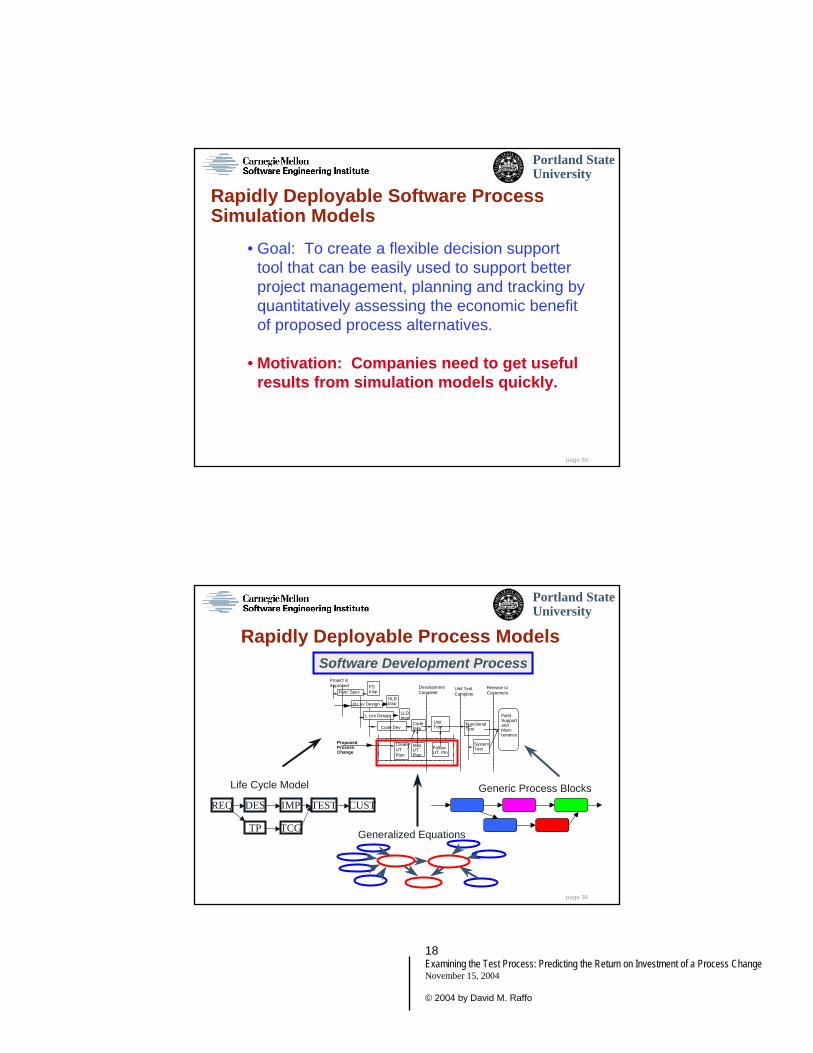
Mean Cost, Quality, and Schedule Impacts for Changes in Unit Test Error Detection Capability
COST (Hours of Staff Effort) MODE =0.200
MODE =0.351*
TO-BEMODE=0.403
Total Effort 66.62 62.00 60.47Life Cycle Eff 52.43 52.42 52.49UT Effort 7.06 9.19 8.45FVT Effort 8.22 6.55 6.01SVT Effort 3.89 3.40 3.23
QUALITY (Number of RemainingErrors)Remaining Err 15.13 10.2133 8.51333Corr E-UT 57.28 101.727 85.4867Corr E-FVT 82.29 57.18 48.1333Corr E-SVT 29.81 20.8267 17.5133
SCHEDULE (Hours of Task Duration)Life Cycle Dur 21.21 18.05 16.44UT Duration 1.80 2.34 2.15FVT Duration 16.71 12.73 10.47SVT Duration 10.50 7.71 6.54

17Examining the Test Process: Predicting the Return on Investment of a Process ChangeNovember 15, 2004
© 2004 by David M. Raffo
page 33
Portland StateUniversity
Sensitivity Analysis Results• Improving inspections would be a more effective
process improvement than the Creating Unit Test Plans process change.
• Reusing the Unit Test Plans on the next development cycle provided an overall ROI of 73% (compared to 56% expected improvement without reuse)
page 34
Portland StateUniversity
Impact on the Company• Supports strategic process improvement
goals of for higher CMMI levels • Provides a framework and direction for
metrics program (made improvements)• Supports business case analysis of
process changes• Provides quantitative risk assessment prior
to the introduction of process changes• Obtains Management buy-in for process
change and collection of further metrics
18Examining the Test Process: Predicting the Return on Investment of a Process ChangeNovember 15, 2004
© 2004 by David M. Raffo
page 35
Portland StateUniversity
Rapidly Deployable Software Process Simulation Models
• Goal: To create a flexible decision support tool that can be easily used to support better project management, planning and tracking by quantitatively assessing the economic benefit of proposed process alternatives.
• Motivation: Companies need to get useful results from simulation models quickly.
page 36
Portland StateUniversity
Rapidly Deployable Process Models
REQ DES IMP TEST CUST
TP TCG
Life Cycle Model Generic Process Blocks
Generalized Equations
Code DevCodeInsp
Unit Test Functional
Test
System Test
FieldSupportandMain-tenance
H Lev DesignHLD Insp
L Lev Design LLDInsp
Func SpecFSInsp
Project is Approved Development
CompleteUnit Test Complete
Release to Customers
InspUTPlan
Follow UT Pln
ProposedProcessChange
CreateUTPlan
Software Development Process

19Examining the Test Process: Predicting the Return on Investment of a Process ChangeNovember 15, 2004
© 2004 by David M. Raffo
page 37
Portland StateUniversity
ConclusionsProcess simulation modeling has been used successfully to quantitatively address a variety of issues from strategic management to process understanding.
Key benefits include:• Decision Support and Tradeoff Analysis• Sensitivity Analysis – “What if”• Supports Industry Certification and process improvement
programs including CMMI, Six Sigma, and others• Supports CMMI at all levels 2 through 5• Design and Define Processes• Benchmarking• Can address project manager concerns• Supports project management and control
page 38
Portland StateUniversity
ConclusionsThis study provided turnkey analysis and recommendations for making a Go/No go decision on the process change• Expected benefit• Partial Implementation• Learning curve impacts• Impact of bad behavior• Alternative process changes• Re-estimate based upon pilot study results
Not a silver bulletFocus on RAPID DEPLOYMENT• Reducing costs and making models easier to use –
No simulation expert needed

20Examining the Test Process: Predicting the Return on Investment of a Process ChangeNovember 15, 2004
© 2004 by David M. Raffo
page 39
Portland StateUniversity
The EndQuestions?
page 40
Portland StateUniversity
Contact InformationDavid M. Raffo, Ph.D.Associate ProfessorCollege of Engineering and Computer ScienceSchool of Business AdministrationPortland State University
Visiting ScientistSoftware Engineering InstituteCarnegie Mellon University

21Examining the Test Process: Predicting the Return on Investment of a Process ChangeNovember 15, 2004
© 2004 by David M. Raffo
page 41
Portland StateUniversity
6th International Workshop on Software Process Simulation and Modeling (ProSim 2005)
• May 14 and 15, 2005• Held in conjunction with ICSE 2005 in St. Louis,
Missouri, USA• Sponsors: Portland State University, International
Software Process Association, andFraunhofer Institute
• E-mail: [email protected]• Web: http://www.prosim.pdx.edu/


![Examining the accuracy of trackways for predicting gait ......and can affect the energetic cost [46, 47] and the speed [48] of locomotion. Furthermore, despite the obvious links between](https://static.fdocuments.in/doc/165x107/60e9e49f4d5c2939d70c80a2/examining-the-accuracy-of-trackways-for-predicting-gait-and-can-affect-the.jpg)