
Pipeline Failure Probability from Geohazard Loading -...
8
1 IPG2017‐2531 Matthew Laing Penspen Ltd. Pipeline Failure Probability from Geohazard Loading Pipeline Failure Probability from Geohazard Loading Introduction Establishingpipeline failure frequencies enables designers and operators to make informed decisions on the allocation of resources to address different threats. Typically, failure frequencies are defined based on the collection of historical statistics. This is difficult for geohazards due to the comparatively lowincident rate compared to other hazards however the consequences tend to be catastrophic. Estimates of the probability of failure may be used to compare the exposure to geohazards on alternative routes, or to demonstrate the selection of an acceptable route Image from Reuters
Transcript of Pipeline Failure Probability from Geohazard Loading -...

1
IPG2017‐2531Matthew LaingPenspen Ltd.
Pipeline Failure Probability from Geohazard Loading
Pipeline Failure Probability from Geohazard Loading
Introduction
Establishing pipeline failure frequencies enables designers and operators to make informed decisions on the allocation of resources to address different threats.
Typically, failure frequencies are defined based on the collection of historical statistics. This is difficult for geohazards due to the comparatively low incident rate compared to other hazards however the consequences tend to be catastrophic.
Estimates of the probability of failure may be used to compare the exposure to geohazards on alternative routes, or to demonstrate the selection of an acceptable route
Image from Reuters
2
Probabilistic Assessment Tool
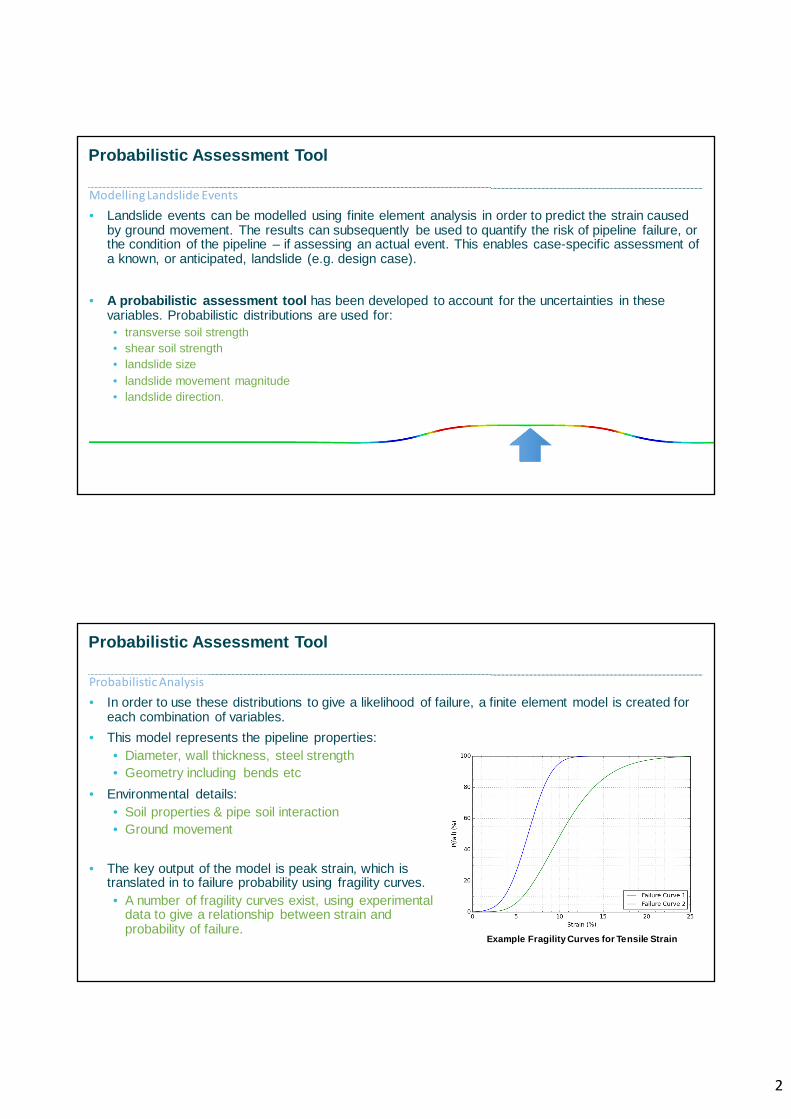
Modelling Landslide Events• Landslide events can be modelled using finite element analysis in order to predict the strain caused
by ground movement. The results can subsequently be used to quantify the risk of pipeline failure, or the condition of the pipeline – if assessing an actual event. This enables case-specific assessment of a known, or anticipated, landslide (e.g. design case).
• A probabilistic assessment tool has been developed to account for the uncertainties in these variables. Probabilistic distributions are used for:• transverse soil strength• shear soil strength• landslide size• landslide movement magnitude• landslide direction.
Probabilistic Assessment Tool
Probabilistic Analysis• In order to use these distributions to give a likelihood of failure, a finite element model is created for
each combination of variables.• This model represents the pipeline properties:
• Diameter, wall thickness, steel strength• Geometry including bends etc
• Environmental details:• Soil properties & pipe soil interaction• Ground movement
Example Fragility Curves for Tensile Strain
• The key output of the model is peak strain, which is translated in to failure probability using fragility curves.• A number of fragility curves exist, using experimental
data to give a relationship between strain and probability of failure.
3
Probabilistic Analysis
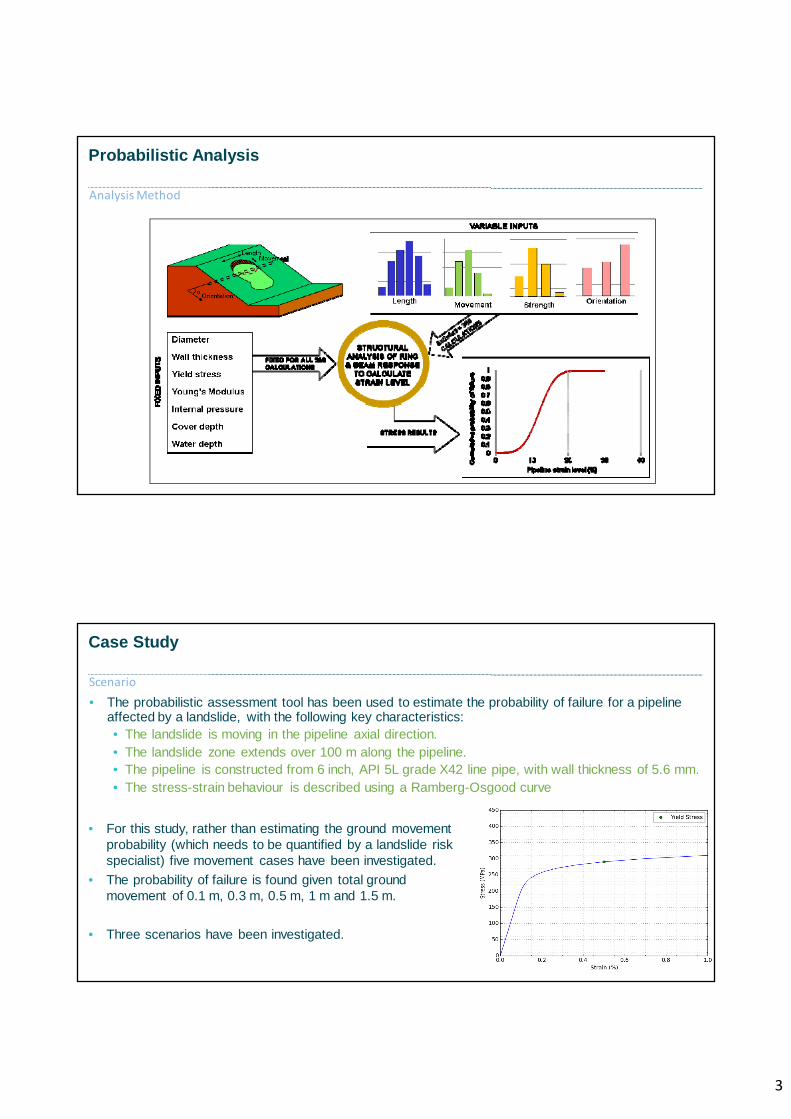
Analysis Method
Case Study
Scenario• The probabilistic assessment tool has been used to estimate the probability of failure for a pipeline
affected by a landslide, with the following key characteristics:• The landslide is moving in the pipeline axial direction.• The landslide zone extends over 100 m along the pipeline.• The pipeline is constructed from 6 inch, API 5L grade X42 line pipe, with wall thickness of 5.6 mm.• The stress-strain behaviour is described using a Ramberg-Osgood curve
• For this study, rather than estimating the ground movement probability (which needs to be quantified by a landslide risk specialist) five movement cases have been investigated.
• The probability of failure is found given total ground movement of 0.1 m, 0.3 m, 0.5 m, 1 m and 1.5 m.
• Three scenarios have been investigated.
4
Case Study
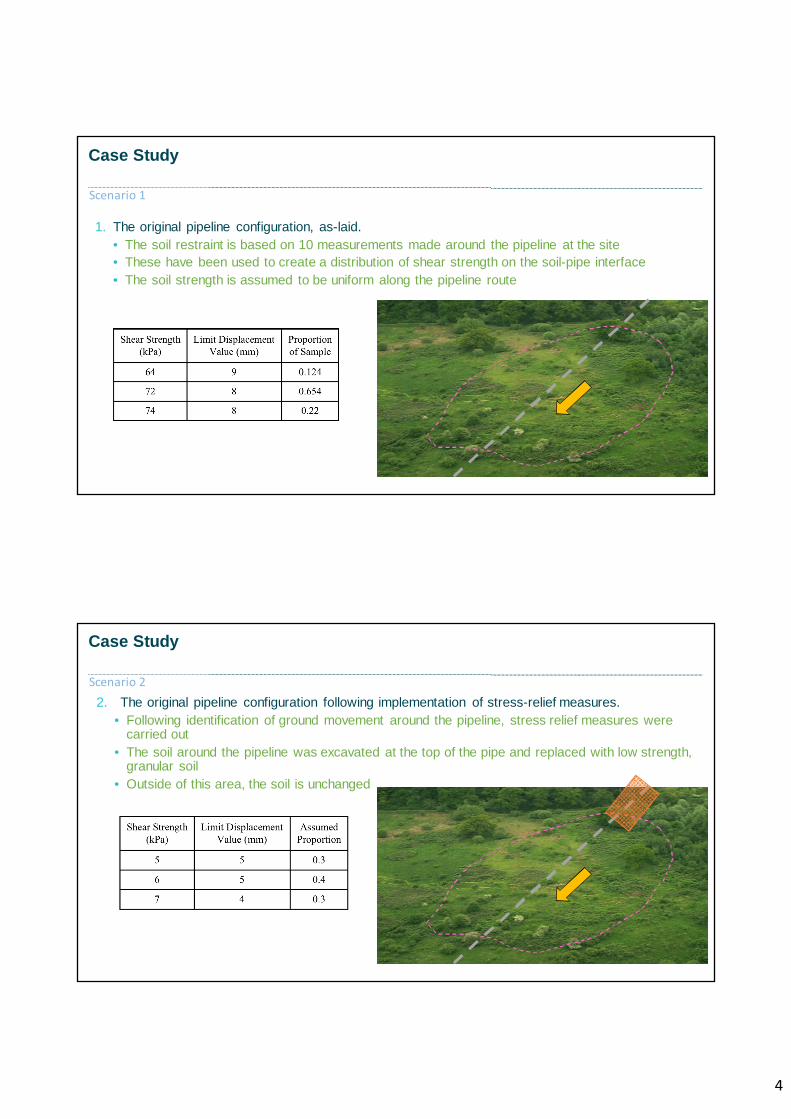
Scenario 1
1. The original pipeline configuration, as-laid.• The soil restraint is based on 10 measurements made around the pipeline at the site• These have been used to create a distribution of shear strength on the soil-pipe interface• The soil strength is assumed to be uniform along the pipeline route
Case Study
Scenario 22. The original pipeline configuration following implementation of stress-relief measures.
• Following identification of ground movement around the pipeline, stress relief measures were carried out
• The soil around the pipeline was excavated at the top of the pipe and replaced with low strength, granular soil
• Outside of this area, the soil is unchanged
5
Case Study
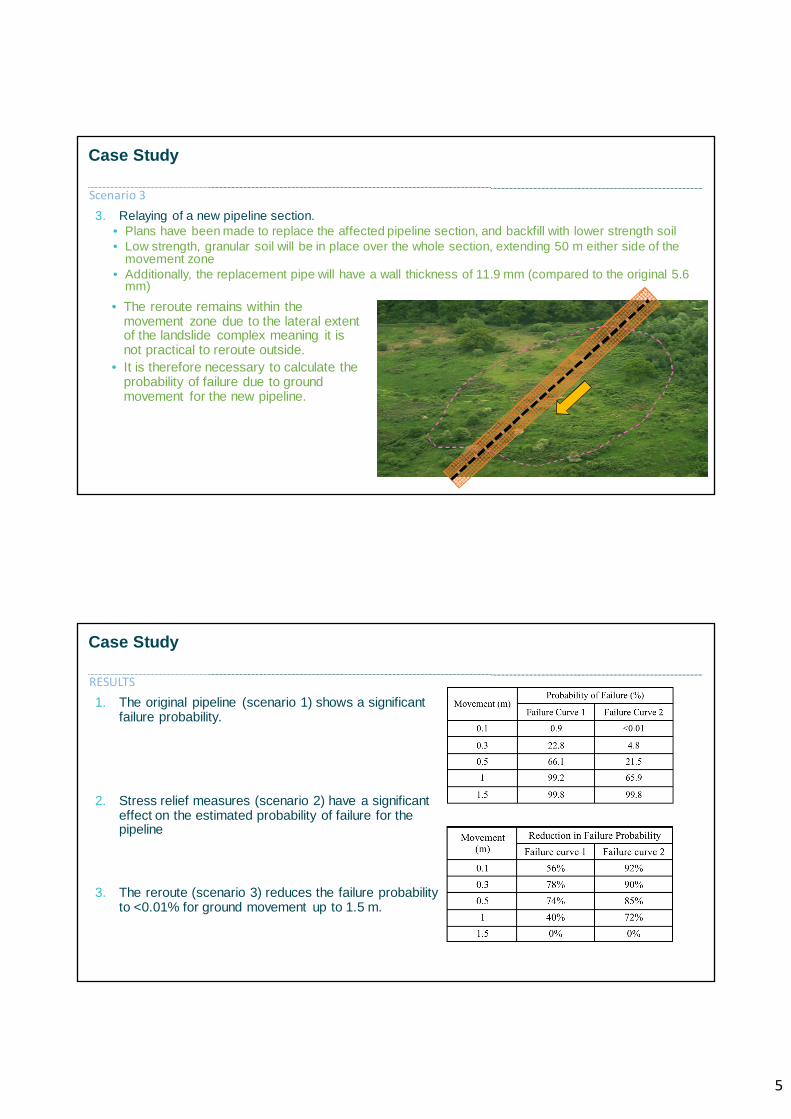
Scenario 33. Relaying of a new pipeline section.
• Plans have been made to replace the affected pipeline section, and backfill with lower strength soil • Low strength, granular soil will be in place over the whole section, extending 50 m either side of the
movement zone• Additionally, the replacement pipe will have a wall thickness of 11.9 mm (compared to the original 5.6
mm)• The reroute remains within the
movement zone due to the lateral extent of the landslide complex meaning it is not practical to reroute outside.
• It is therefore necessary to calculate the probability of failure due to ground movement for the new pipeline.
Case Study
RESULTS1. The original pipeline (scenario 1) shows a significant
failure probability.
2. Stress relief measures (scenario 2) have a significant effect on the estimated probability of failure for the pipeline
3. The reroute (scenario 3) reduces the failure probability to <0.01% for ground movement up to 1.5 m.
6
Case Study
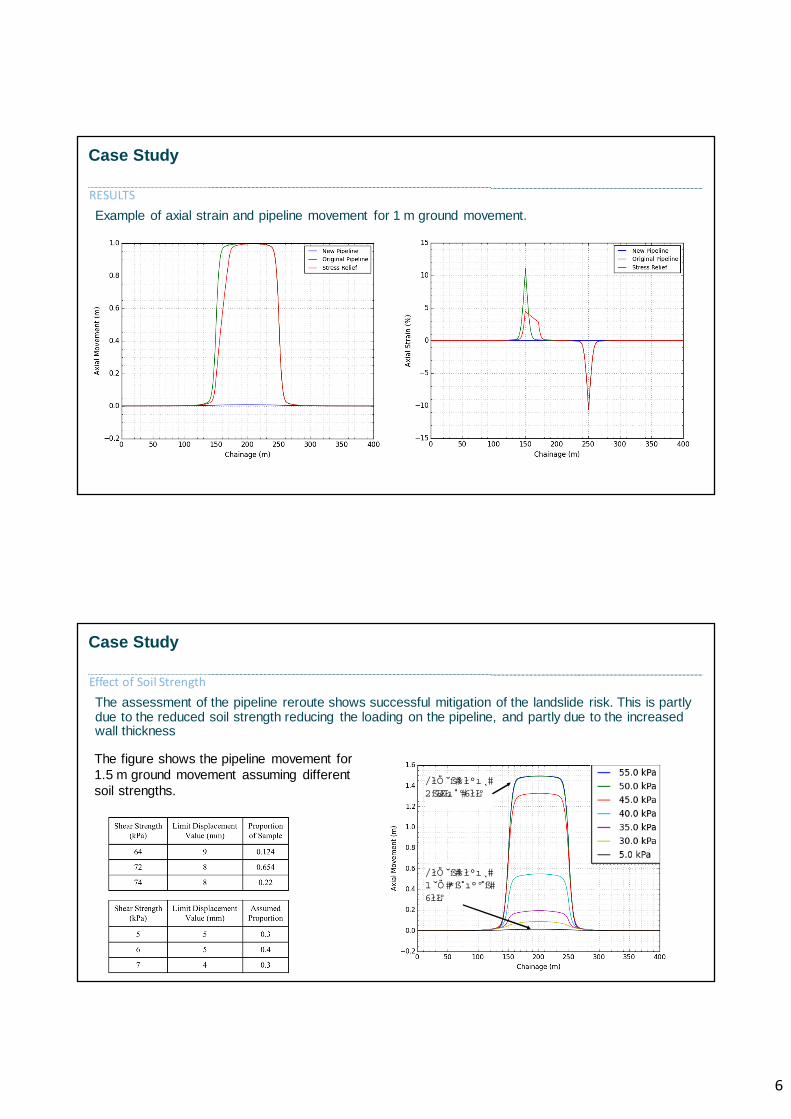
RESULTSExample of axial strain and pipeline movement for 1 m ground movement.
Case Study
Effect of Soil StrengthThe assessment of the pipeline reroute shows successful mitigation of the landslide risk. This is partly due to the reduced soil strength reducing the loading on the pipeline, and partly due to the increased wall thickness
The figure shows the pipeline movement for 1.5 m ground movement assuming different soil strengths.
������������ � ����� �
����������������������� �
7
Key Development
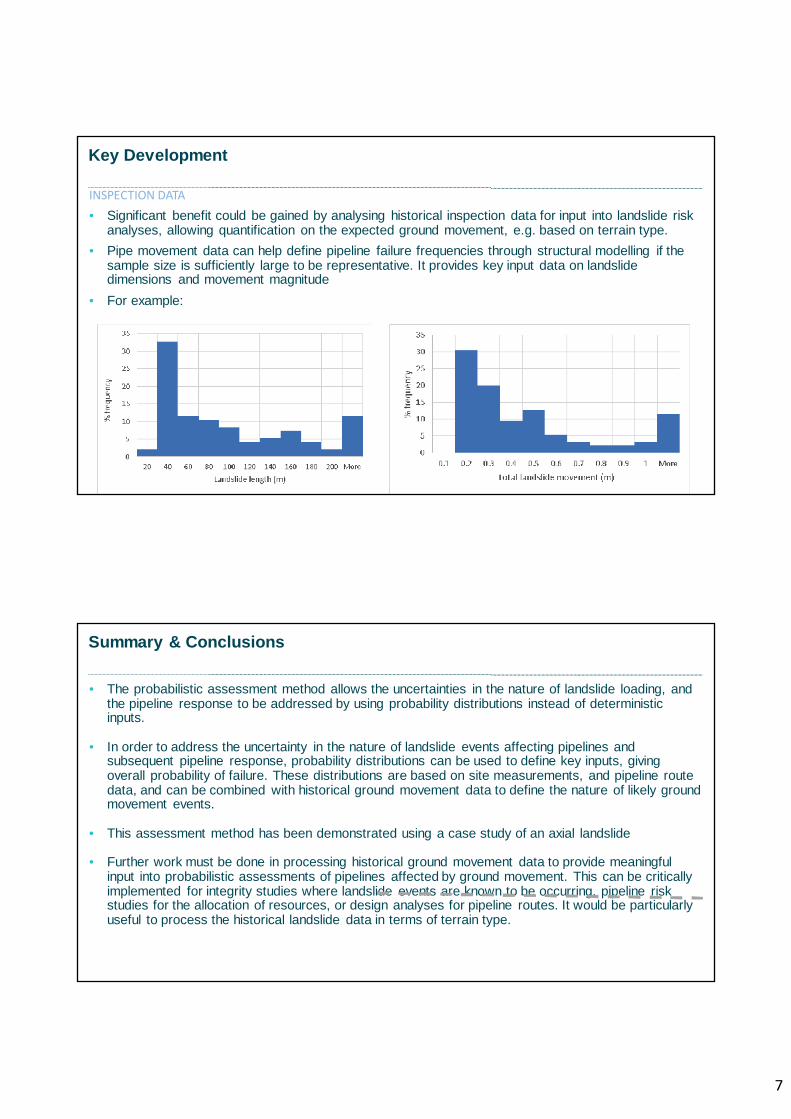
INSPECTION DATA• Significant benefit could be gained by analysing historical inspection data for input into landslide risk
analyses, allowing quantification on the expected ground movement, e.g. based on terrain type.• Pipe movement data can help define pipeline failure frequencies through structural modelling if the
sample size is sufficiently large to be representative. It provides key input data on landslide dimensions and movement magnitude
• For example:
Summary & Conclusions
• The probabilistic assessment method allows the uncertainties in the nature of landslide loading, and the pipeline response to be addressed by using probability distributions instead of deterministic inputs.
• In order to address the uncertainty in the nature of landslide events affecting pipelines and subsequent pipeline response, probability distributions can be used to define key inputs, giving overall probability of failure. These distributions are based on site measurements, and pipeline route data, and can be combined with historical ground movement data to define the nature of likely ground movement events.
• This assessment method has been demonstrated using a case study of an axial landslide
• Further work must be done in processing historical ground movement data to provide meaningful input into probabilistic assessments of pipelines affected by ground movement. This can be critically implemented for integrity studies where landslide events are known to be occurring, pipeline risk studies for the allocation of resources, or design analyses for pipeline routes. It would be particularly useful to process the historical landslide data in terms of terrain type.

8


![Tacloban geohazard assessment report [12.05.13]](https://static.fdocuments.in/doc/165x107/5551c368b4c905922b8b475b/tacloban-geohazard-assessment-report-120513.jpg)


