Pinal County Citizen Satisfaction Survey Pinal County Citizen Satisfaction Survey 2014-2015...
35
Pinal County Citizen Satisfaction Survey 2014-2015
Transcript of Pinal County Citizen Satisfaction Survey Pinal County Citizen Satisfaction Survey 2014-2015...

Pinal County Citizen Satisfaction Survey
2014-2015

1 Pinal County Citizen Satisfaction Survey 2014-2015
Table of Contents Executive Summary……………………………………………………………………………………………………… 2 Survey Background and Methodology…………………………………..………………………………………….…. 4 Survey Findings…………………………………….………………………………………………….………………… 6 Pinal County Strategic Plan……………………………………………………………………………………6 Use and Awareness of County Services…………………………………….……………………………... 7
Quality of Services…………………………………………………………………………………….………. 11
Accountability and Preferences for County Priorities……………………………………………………… 16
Financial Responsibility………………………………..………………………………..……………………..19
Use of Information Sources…………………………………………………….…………………………….. 21
Community Characteristics…………………………………………………………………………………… 23 Public Safety…………………………………………………………………………………………………… 26
Employment Opportunities…………………………………………………………………………………… 27
Resident Living and Retirement……………………………………………………………………………… 29 Additional Demographics of Participants………………………..………………………………………….. 31
Appendices A-C………………………………………………………..………………………………………………….32

2 Pinal County Citizen Satisfaction Survey 2014-2015
Executive Summary
Background and Methodology The 2014-2015 Citizen Satisfaction Survey was available online in English and Spanish languages for 15 weeks total to Pinal County residents’ age 18 years or older. The SurveyMonkey link was advertised via multiple media outlets, sent to Pinal County email list subscribers, as well as the PinalCountyAZ.gov website, Library District homepage, and kiosks throughout Pinal County. Survey questions included opinions about use and awareness of Pinal County services, government performance and preferences for priorities, as well as demographic questions to determine if the survey sample was representative of the Pinal County population demographics per the U.S. Census. 1,036 residents completed the entire 40-question survey and are included in the analysis unless otherwise noted. Survey participants included an even distribution of men and women; however, due to the age of participants being left skewed as older compared to the actual demographics of the Pinal County population, survey responses were weighted by age in order to account for differences in age distribution. It is noteworthy that 92% of survey participants were registered voters. Survey responses were stratified by geographic location, based on whether or not the participant reported living in an incorporated municipality or unincorporated area of Pinal County, when differences were noted in response patterns; 2010 results from the last survey were included for comparison when applicable.
Survey Results
Pinal County Strategic Plan Overall, 40% of survey participants were aware that Pinal County had a Countywide Strategic Plan. The survey asks several direct questions regarding the Strategic Plan and the identified strategic priorities. The survey responses are also used as performance indicators to assist in assessing the effectiveness of implementation of the Strategic Plan objectives. In 2015, there was a 9% increase in respondents reporting an “opinion” (those that gave a rating of excellent, good, fair or poor) of County services (2015=69% vs. 2010=60%). Respondents were also asked to rate “the value of County provided services for the taxes paid to Pinal County”. In 2014 38% of respondents rated Pinal County performance as “excellent or good” while in 2010 those rating Pinal County as “excellent or good” was 37%.
Use and Awareness of Pinal County Services Survey participants were asked if they had recent contact with a Pinal County employee in the last 12 months, and were asked which office(s) or department(s) they interacted with as well as if they had an opinion about the service they received. 68% of participants reported interaction with a Pinal County employee in the last year, compared to 37% for survey respondents in 2010. 32% of participants reported interacting with the Pinal County Sheriff Office in the last year, while other offices and departments had significantly fewer responses. Pinal County services where more than half of respondents did not report an opinion included County Attorney (50%), Services for low-income families (51%), Citizen Contact Center (58%), Housing assistance (60%), and Public Defender (62%).
Quality of Pinal County Services Overall, nearly half (49%) of respondents rated the overall quality of Pinal County services as “good” or “excellent”, which is a 6% increase since 2010. The highest rated services, with “good” or “excellent” ratings, included the Sheriff (70%), voter experience during the last election (76%), and condition of County buildings (68%); while the lowest rated services included code enforcement (36%), road maintenance (30%), and economic development (28%). There were no significant differences noted when compared to 2010 survey results for these services. Ratings were favorable when participants were asked about Pinal County customer service, as 76% of respondents rated their overall impression as “good” or “excellent”. A majority of participants also rated employee respectfulness (83%), knowledge (77%), responsiveness (76%), and ability to resolve issue (68%) positively as “good” or “excellent”.
Accountability and Preferences for County Priorities When asked to rate government performance related to the job Pinal County does listening and responding to residents, there was almost equal distribution between excellent/good (33%), fair (34%), and poor (32%) responses by participants. Participants rated the overall direction Pinal County is taking more favorably (44% excellent/good, 35% fair, and 22% poor), as well as the value of services for the taxes paid to Pinal County (38% excellent/good, 38% fair, and 24% poor). Participants were each asked to assign 100 “importance” points six different service categories, and the average number of responses were calculated for each service. The top services that received
3 Pinal County Citizen Satisfaction Survey 2014-2015
the highest number of importance points on average included law enforcement and transportation infrastructure; Community services and economic development received less points on average, and the services that were rated the lowest on average were public services and human services. However, it is noteworthy that more than 80% of participants “somewhat support” or “strongly support” expending resources to improve local services, including economic development (93%), service levels/quality of service (88%), vibrant, safe, sustainable communities (88%), transportation (87%), employee morale, retention, and recruitment (84%), and financial stability and health (81%).
Financial Responsibility Participants were asked their opinion about Pinal County taxes provided quality of service, and 48% reported the taxes as “about right”, followed by 29% reporting “somewhat too much”, 14% “way too much”, and 9% reporting “somewhat too little” or “way too little”. Participants were then asked their level of support for increasing Pinal County taxes or reducing service levels, and 41% responded with “prefer no changes to current County or services”; 23% “somewhat support higher taxes and maintaining current service levels”, while 10% “strongly support higher taxes and maintaining current service levels or expanding services”, 9% “somewhat support lower taxes and reducing services levels”, 8% “strongly support lower taxes and reducing service levels”, and 9% “don’t know”.
Use of Information Sources When asked what sources participants use to receive information about Pinal County government, most participants indicated word-of-mouth (83%), County website (81%), local newspapers (76%), mailings, publications, press releases, and online newsletters (65%), social networking (52%), and civic association/HOA newsletters or community listservs (50%). Furthermore, a majority of respondents stated they used the County website to lookup property information such as taxes, values, and maps (73%), obtain information about services (52%), and look up voter information (51%).
Community Characteristics Overall, 59% of participants rated the quality of life in Pinal County as “good” or “excellent”. A majority of participants rated Pinal County favorably as a place to retire (60%), and place to live (64%), as well as their neighborhood as a place to live (75%). Fewer participants rated Pinal County favorably as a place to raise children (44%) and a place to work (31%). Consistent with responses on other questions, 63% of participants reported they were “very likely” or “somewhat likely” to retire in Pinal County. Furthermore, a majority of residents stated they would remain in Pinal County for the next five years (80%) and recommend living in Pinal County (79%). The highest rated community characteristics, with responses of “good” or “excellent”, include availability of affordable housing (53%), variety of housing options (50%), and ease of car travel (49%). The lowest rated characteristics include recreation opportunities (38%), employment opportunities (31%), and educational opportunities (26%). There were no significant differences observed when responses were compared to 2010 survey results.
Health and Public Safety When asked about feelings of safety in their communities, a majority of participants responded as feeling “somewhat safe” or “very safe” in their neighborhood during the day (87%) and in their neighborhood after dark (62%). When asked about crimes, most respondents stated they felt safe when asked about violent crimes (68%) and property crimes (54%).Respondents rated the quality of public safety services as favorable, with more than half of participants responding as “good” or “excellent” when asked about the Pinal County Sheriff services (70%), law enforcement response (65%), Courts (60%), Emergency Management (58%), Animal Control (58%), and traffic enforcement (50%). Participant interaction with Pinal County Public Health services were lower (9%); however, 58% of respondents still rated health services as “good” or “excellent”, which is a 19% increase since the 2010 survey. Only 25% of respondents rated mental health services as favorable, which is a 10% decrease since the 2010 survey. It is noteworthy that 32% of participants overall has recent interaction with the Pinal County Sheriff Office, which includes the largest subset of respondents; the body of the report includes the breakdown of responses by geographic location when differences in responses were observed between residents living in incorporated versus unincorporated areas.
Employment Opportunities and Transportation At the time of the survey, more than half of participants were employed, including full time (49%) or part time (4%) jobs. It is significant that 81% of residents reported current employment inside Pinal County. Participants were asked about travel in Pinal County, and 49% rated ease of car travel as favorable, while fewer participants rated ease of bicycle travel as favorable (19%). A 73% majority of participants reported their typical work commute mode was a motorized vehicle by themselves; only 9% reported commuting to work in a motorized vehicle with others, and mass transit, bicycle, and walking were reported infrequently. Nearly a third of participants reported it take 1-15 minutes to commute to work (34%), 16-30 minutes (32%), or 31 minutes or more (33%). Remarkable environmental characteristics that affect transportation include air quality, which 37% of respondents rated favorably, and availability of walking paths and trails, which only 28% rated favorably.

4 Pinal County Citizen Satisfaction Survey 2014-2015
Survey Background and Methodology Survey Design The Pinal County Citizen Satisfaction Survey 2014-2015 was based on the 2010 survey format and benchmark questions initially provided from National Resource Center, recommended by the Pinal County Citizen Satisfaction Survey Committee and approved by Board of Supervisors. Citizen satisfaction questions include quality of life, safety, use and awareness of government services, quality of services, government performance, customer service, financial responsibility regarding taxes and service levels, use of information services, and preferences for Pinal County priorities and focus. Demographic information was collected as secondary information to collect information about employment and transportation, as well as compare the survey sample to U.S. Census estimates and determine whether or not the sample was truly representative of the Pinal County population.
Data Collection The Pinal County Citizen Satisfaction Survey 2014-2015 was available online in both English and Spanish languages via SurveyMonkey for 15 weeks total, from November 18, 2014-January 25, 2015 and March 9, 2015-April 12, 2015. During this time, the survey link was available to Pinal County residents ages 18 years and older on the County homepage (www.PinalCountyAZ.gov), Library District homepage as a web banner available on all library computers, and 21 public computer “kiosks” including Apache Junction Recorder, Casa Grande Recorder, Coolidge Conciliation Court, Maricopa and San Tan Valley Public Health Clinics, Eleven Mile Animal Care and Control Lobby, and Building F Lobby and Voter Registration areas.
Marketing and Outreach Major survey marketing and outreach included three separate email invitations to participate in the survey to all 2,404 Pinal County email subscribers in November 2014, January 2015, and March 2015 and concurrent press releases to 17 local media outlets. Pinal County employees also added a survey link to their email signature for all reply emails. Additional marketing and outreach efforts to increase survey participation in 2015 included print ads in Copper Basin News, Apache Junction News, and a web banner on TriValleyCentral.com, and email advertising to Central Arizona College students and all school districts in Pinal County to increase participation among young adults.
Sample Size The survey sample is an online, convenience sample. 1,827 (out of 1,889 total) participants began the online survey and certified that they were Pinal County residents and adults age 18 years or older, including 5 participants who attempted the Spanish language version. 1,036 out of 1,827 eligible adult residents completed the entire 40-question survey (57% completion rate), including all demographic questions, with a median time of 16 minutes. 28 additional participants, for a total of 1,064 out of 1,827 eligible adult residents, participated in half the survey but did not complete the demographic information (58% participation rate), including only the first 19-questions regarding citizen satisfaction. Due to non response and selection bias, not all demographics of the survey sample are representative of the Pinal County population. The final sample size includes n=1,036 participants who completed all survey questions.
Participation/Response Rates Although the 58% participation rate and 57% completion rate listed above are not true survey “response rates”, since formal invitations were not required to participate in the online survey, a response rate above 30% is considered exceptional for a solely web-based survey. There was no requirement to be a Pinal County email subscriber to participate in the survey, and since a single SurveyMonkey web collector was used participation by email invitation cannot be distinguished from other outreach/referral methods. However, considering that the survey was marketed to 2,404 Pinal County email subscribers, if 1,036 completed surveys were returned from 2,404 email recipients, then the survey response rate could be considered 43%. It is also noteworthy that 302 participants attempted the survey inside the Pinal County network or State AOC network according to their IP addresses, suggesting 16% of survey attempts originated from kiosks, including customers or employees inside the Pinal County network. The 16% inside the County network does not include library computers.
Survey Demographics Among participants who completed the entire 40-question survey including demographic questions (n=1,036), gender was evenly distributed with equal proportions of males and females represented. A majority of respondents were either under age 65 years or had no other members in their household aged 65 years or older, and both mean and median age of the sample was estimated around ~55 years. Most respondents reported they were not a paid employee at the time of the survey (60%) and had no children age 17 years or under were living in their household

5 Pinal County Citizen Satisfaction Survey 2014-2015
(69%). However, considering the 40% of respondents who reported employment, 3 out of 4 employed residents reported their place of employment was within Pinal County. Additionally, a large majority of survey participants reported their race/ethnicity as “White, non-Hispanic or Latino” compared to U.S. Census estimates of Pinal County population by race/ethnicity (84% vs. 58%, respectively), although 60 participants overall refused to report their race/ethnicity. A majority of participants reported their annual household income within the current year was under $99,999, including 44% who reported $50,000-$99,999 per year, 22% reported $25,000-$49,999 per year, and 9% reported less than $24,999 per year; this distribution suggests that income of the sample is representative of the median income $50,000 per household U.S. Census data for Pinal County. It is notable that 92% of respondents reported they were registered to vote and 84% voted in the last general election at the time of the survey. Additionally, 54% reported living in an unincorporated area of Pinal County based on the town or city of their address, while 46% reported living in an incorporated town or city.
Presentation of Survey Findings All survey responses were anonymous and reported in group form only, stratified by geographic location based on whether or not participants reported living inside city or town limits of an incorporated municipality or unincorporated area of Pinal County. The final analysis includes survey participants who completed the entire 40-question survey (n=1,036), unless otherwise noted. Results for each question are displayed in tables and figures, using weighting technique to account for uneven distribution by age with methodology included in Appendix A. No other adjustments were made to raw data or aggregate survey responses; a complete set of unweighted results are available for comparison in Appendix B, as well as margin of error estimates (Appendix A). Furthermore, for comparison to 2010 Pinal County Citizen Satisfaction Survey results, responses for each question are stratified based on participants who reported an incorporated vs. unincorporated address when differences were noted. Figures and tables of survey results include a sample size of n=1,036 unless otherwise noted.

6 Pinal County Citizen Satisfaction Survey 2014-2015
Survey Findings
PINAL COUNTY STRATEGIC PLAN The Pinal County Board of Supervisors approved an updated Countywide Strategic Plan in August 2014. The Strategic Plan is intended to be used as a roadmap for continuous improvement and accountability. The Pinal County Citizen Satisfaction Survey asks several direct questions regarding the Strategic Plan. These questions assist the Board of Supervisors in gauging the public’s awareness of the Strategic Plan and their opinion of the identified priorities. Additionally, the survey uses select responses as performance measures to gauge improvement and success in implementation of the Strategic Plan objectives. Among survey participants who completed the entire survey, 40% reported they were aware that Pinal County has a strategic plan (Figure 1).
Specific questions within the survey which are based on Strategic Plan performance measures are:
Objective 5.1: 5% increase in survey respondents knowing what services Pinal County offers
Consistent with the methodology used in 2010, to gauge awareness of residents knowledge of County services provided, an analysis of those reporting an “opinion” (i.e., they gave a rating of excellent, good, fair or poor) of county services versus those who reported “don’t know” was completed. In 2015, there was a 9% increase in respondents reporting an “opinion of County services (2015=69% vs. 2010=60%)
A more complete set of responses and analysis of the use and awareness of County provided service begins on page 7.
Objective 5.2: 5% increase in residents saying they value the services they receive from Pinal County in return for the taxes they pay.
Respondents were also asked to rate “the value of County provided services for the taxes paid to Pinal County”. In 2014 38% of respondents rated Pinal County performance as “excellent or good” while in 2010 those rating Pinal County as “excellent or good” was 37%.
A more complete set of responses and analysis of accountability and county priorities begin on page 16.
No60%
Yes40%
Figure 1: Are you aware that Pinal County has a Strategic Plan?

7 Pinal County Citizen Satisfaction Survey 2014-2015
Use and Awareness of County Services As noted previously, among survey participants who completed the entire survey, 40% reported they were aware that Pinal County has a strategic plan (Figure 1). More than two-thirds of respondents (68%) reported having contact in-person, via phone, or email with a Pinal County employee in the last 12 months, while one in three (32%) did not have any contact with a County employee (Figure 2). Thus, Figure 3 includes responses from participants who reported having recent interaction with a Pinal County employee, but the percent for each category was calculated using the entire sample size of n=1,036. It is noteworthy that in the 2010 Citizen Satisfaction Survey only 37% of respondents reported interaction with a Pinal County employee in the last year, compared to 68% during the 2014-2015 survey.
In Figure 3 below, nearly a third of survey participants reported no interaction with a Pinal County department or office in the last year and another third or participants reported interaction with the Pinal County Sheriff’s Office (32%). In ascending order, the next most utilized departments or offices among survey participants in the last year include Animal Care and Control (18%), Public Works (15%), Human Resources (14%), Board of Supervisors (13%), Recorder/Elections (11%), and Clerk of the Superior Court (11%); all other departments/offices had less than 10% of participants report interaction with an employee in the last 12 months. Overall, 2% of participants reported “don’t know” when asked which Pinal County department/office they had recent interaction. The 2014-2015 survey did not assess whether or not the participant was a Pinal County employee to determine internal vs. external usage of departments/offices. Table 1 includes a breakdown of participant interaction with Pinal County departments and offices in the last year by geographic location.
No32%
Yes68%
Figure 2: Have you had contact with a Pinal County employee in the last year?

8 Pinal County Citizen Satisfaction Survey 2014-2015
7%6%
18%9%
13%8%
0%4%
11%4%
8%2%
2%9%
5%1%
4%4%
6%7%
3%14%
6%1%
6%5%
8%1%1%
3%4%
9%15%
11%4%
32%8%
7%2%
32%
0% 5% 10% 15% 20% 25% 30% 35%
Adult ProbationAir Quality
Animal Care and ControlAssessor
Board of SupervisorsCitizen Contact Center
Civil Hearing OfficeClerk of the Board
Clerk of the Superior CourtCommunications and Public Affairs
Community DevelopmentConciliation Court
Correctional HealthCounty AttorneyCounty Manager
Division of Behavioral Health and …Economic Development
Facilities ManagementFinance
Fleet ServicesHousing and Community …
Human ResourcesInformation Technology
Internal AuditJustice of the Peace
Juvenile Court ServicesLibrary District
Medical ExaminerOffice of Management and Budget
Open Space and TrailsPublic Defender
Public HealthPublic Works
Recorder/ElectionsSchool Superintendent
SheriffSuperior Court
TreasurerDon't know
No recent interaction with Pinal County employees
Figure 3: Participant interaction with Pinal County departments/offices in last 12 months

9 Pinal County Citizen Satisfaction Survey 2014-2015
Table 1: Participant interaction with Pinal County Offices or Departments
Which Pinal County Office(s) or Department(s) did you have contact with in the last 12 months?
Incorporated, %
Unincorporated, %
Total, %
Adult Probation 10% 4% 7% Air Quality 6% 5% 6% Animal Care and Control 21% 16% 18% Assessor 8% 10% 9% Board of Supervisors 12% 15% 13% Citizen Contact Center 9% 6% 8% Civil Hearing Office 0% 1% 0% Clerk of the Board 5% 3% 4% Clerk of the Superior Court 13% 8% 11% Communications and Public Affairs 6% 3% 4% Community Development 6% 11% 8% Conciliation Court 4% 1% 2% Correctional Health 2% 1% 2% County Attorney 11% 6% 9% County Manager 7% 3% 5% Division of Behavioral Health and Public Fiduciary 1% 2% 1% Economic Development 5% 3% 4% Facilities Management 6% 3% 4% Finance 10% 2% 6% Fleet Services 10% 3% 7% Housing and Community Development 3% 3% 3% Human Resources 19% 9% 14% Information Technology 9% 4% 6% Internal Audit 1% 1% 1% Justice of the Peace 6% 7% 6% Juvenile Court Services 7% 2% 5% Library District 8% 8% 8% Medical Examiner 1% 1% 1% Office of Management and Budget 1% 1% 1% Open Space and Trails 2% 4% 3% Public Defender 6% 2% 4% Public Health 12% 6% 9% Public Works 18% 12% 15% Recorder/Elections 13% 9% 11% School Superintendent 3% 4% 4% Sheriff 27% 37% 32% Superior Court 11% 6% 8% Treasurer 9% 4% 7% Don't know 2% 3% 2% No recent interaction with Pinal County employee 30% 35% 32% Total, n 540 496 1036

10 Pinal County Citizen Satisfaction Survey 2014-2015
Based on participant opinions about the quality of County services, residents who reported living in an unincorporated area were more likely to report “don’t know” when asked about the quality of services, with the exception of Pinal County Sheriff services, traffic control and roadway maintenance in unincorporated areas (see Table 2).
Table 2: Participant awareness of Pinal County Services by Geographic Location
Percent reporting an opinion Incorporated, % Unincorporated, % Total, % Pinal County Sheriff services 88% 91% 89%
Pinal County Sheriff response time 75% 79% 77%
County Courts 71% 52% 62%
Animal shelter/Adoption Center 75% 54% 65%
Emergency Management 65% 52% 59%
Traffic enforcement 96% 95% 96%
Traffic control in unincorporated areas 95% 98% 97% Roadway maintenance in unincorporated areas 96% 97% 96%
Condition of County buildings 89% 76% 83%
Long range planning 67% 60% 64% Preservation of natural areas such as open space and farmland 81% 80% 80%
Enforcement of County codes, ordinances, and regulation 83% 79% 81%
Health services 72% 59% 66%
Mental health services 58% 42% 51%
Public records and document services 65% 59% 62% Customer service from Citizen Contact Center 48% 36% 42%
Voter registration/experience during last election 87% 83% 85%
Finding information on County website 88% 81% 85%
Services provided to low-income families 60% 36% 49%
Online property information 78% 78% 78%
Housing assistance services 49% 30% 40%
Economic development 76% 66% 71%
Development standards and regulations 66% 62% 64%
Building permits and inspections 58% 52% 55%
County libraries 82% 74% 78%
County Attorney 59% 40% 50%
Public Defender 48% 27% 38%
Environmental Health 72% 59% 66%
Average, % 73% 64% 69%
Total, n 540 496 1036

11 Pinal County Citizen Satisfaction Survey 2014-2015
QUALITY OF SERVICES Nearly half of participants reported overall quality of services as “excellent” or “good” (49%), a 6% increase since the 2010 survey. More than a third reported overall quality of services as “fair”, 11% rated services “poor”, and 5% reported “don’t know”. On average, residents who reported living in an incorporated area tended to also report the quality of services as more favorable, that is “excellent” or “good”. The figure and table below display a summary of quality of services, and provide the 2010 survey results when available.
1 - Excellent5%
2 - Good44%3- Fair
36%
4 - Poor11%
5 - Don't know4%
Figure 4: Overall Quality of Services

12 Pinal County Citizen Satisfaction Survey 2014-2015
Table 3: Summary of Quality of Service by Geographic Location
Percent reporting "excellent" or "good" Incorporated, %
Unincorporated, %
Total, %
2010 comparison, %
Pinal County sheriff service (n=925) 72% 68% 70% 75% Pinal County sheriff response time (n=793)
65% 64% 65% 64%
County Courts (n=640) 63% 55% 60% 56% Animal shelter/Adoption Center (n=673) 62% 52% 58% 45% Emergency Management (n=608) 67% 46% 58% 47% Traffic enforcement on County roads and highways (n=992)
52% 48% 50% 58%
Traffic control in unincorporated Pinal County (n=994)
50% 40% 45%
Roadway maintenance in unincorporated (n=995)
32% 28% 30% 29%
Condition of Pinal County buildings (n=841)
72% 62% 68% 59%
Long range planning (n=661) 49% 39% 44% 33% Preservation of natural areas such as open space and farmland (n=831)
49% 48% 49% 43%
Enforcement of county codes, ordinances and regulations (n=841)
41%
31%
36%
25%
Health services (n=684) 59% 57% 58% 38% Mental health services (n=523) 29% 18% 25% 35% Public records and document services (n=639)
61% 57% 59%
Customer service from the Citizen Contact Center (n=432)
59% 52% 56% 46%
Voter registration/experience during last election (n=874)
72% 80% 76% 67%
Finding information on the County website (n=783)
70% 68% 69%
Services for low income families (n=502) 46% 38% 44% 38% Online property information (n=803) 70% 65% 67% Housing assistance services (n=409) 43% 30% 39% Economic development (n=733) 35% 20% 28% Development standards and regulations for unincorporated (n=658)
41% 29% 36%
Building permits and inspections (n=571) 53% 43% 49% County libraries (n=811) 61% 40% 51% County Attorney (n=512) 53% 44% 50% Public Defender Services (n=387) 59% 37% 52% Environmental Health (food inspections, mosquito control) (n=678)
52% 31% 43%
Total, n 540 496 1036 963

13 Pinal County Citizen Satisfaction Survey 2014-2015
Figure 5 below shows a Summary of Quality of Services, including 2010 survey results for comparison when applicable. There were little to no significant differences noted between the recent survey results and 2010 when compared after “don’t know” responses were removed from the analysis to include only participants that had an opinion about services. It is noteworthly that the highest rated services in ascending order were voter registration and experience during the last election (76%), Pinal County sheriff services (70%), finding information on the County website (69%), condition of Pinal County buildings (68%), and online propery information (67%), Pinal County sheriff response time (65%), County Courts (60%), Public records and document services (59%), Health services (58%), Emergency Management (58%), Animal Shelter/Adoption Center (58%), Citizen Contact Center (56%), Public Defender Services (52%), County libraries (51%), and County Attorney (50%). All other services received less than a 50% approval rating, including a majority of “fair” or “poor” responses from survey participants, after “don’t know” responses were removed from the analysis.

14 Pinal County Citizen Satisfaction Survey 2014-2015
70%
65%
60%
58%
58%
50%
45%
30%
68%
44%
49%
36%
58%
25%
59%
56%
76%
69%
44%
67%
39%
28%
36%
49%
51%
50%
52%
43%
75%
64%
56%
45%
47%
58%
29%
59%
33%
43%
25%
38%
35%
46%
67%
38%
0% 20% 40% 60% 80%
Pinal County sheriff service (n=925)
Pinal County sheriff response time (n=793)
County Courts (n=640)
Animal shelter/Adoption Center (n=673)
Emergency Management (n=608)
Traffic enforcement on County roads and …
Traffic control in unincorporated Pinal County …
Roadway maintenance in unincorporated (n=995)
Condition of Pinal County buildings (n=841)
Long range planning (n=661)
Preservation of natural areas such as open …
Enforcement of county codes, ordinances and …
Health services (n=684)
Mental health services (n=523)
Public records and document services (n=639)
Customer service from the Citizen Contact …
Voter registration/experience during last …
Finding information on the County website …
Services for low income families (n=502)
Online property information (n=803)
Housing assistance services (n=409)
Economic development (n=733)
Development standards and regulations for …
Building permits and inspections (n=571)
County libraries (n=811)
County Attorney (n=512)
Public Defender Services (n=387)
Environmental Health (food inspections, …
Figure 5: Summary of Quality of Service,percent reporting "good" or "excellent"
2010 comparison, % Total, %

15 Pinal County Citizen Satisfaction Survey 2014-2015
Overall respondents who reported recent contact with a Pinal County employee also reported customer service as favorable, as 76% rated their overall impression of customer service as “excellent” or “good”. A majority of participants also rated respectfulness/courtesy (83%), ability to resolve issue (68%), responsiveness (76%) and knowledge (77%) of County employees as “excellent” or “good”. Ratings were slightly higher when compared to 2010 survey responses.
Table 4: Summary of Customer Service Satisfaction by Geographic Location
Percent reporting "good" or "excellent" Incorporated, %
Unincorporated, %
Total, %
2010 comparison, %
Knowledge (n=686) 80% 73% 77% 74% Responsiveness (n=686) 78% 73% 76% 73% Ability to Resolve Issue (n=658) 74% 61% 68% N/A Respectfulness (n=688) 85% 80% 83% 77% Overall impression of customer service (n=685) 80% 72% 76% 73%
77%
76%
68%
83%
76%
0% 10% 20% 30% 40% 50% 60% 70% 80% 90%
Knowledge (n=686)
Responsiveness (n=686)
Ability to Resolve Issue (n=658)
Respectfulness (n=688)
Overall impression of customer service (n=685)
Figure 6: Summary of Customer Service Satisfaction
Percent reporting "good" or "excellent"

16 Pinal County Citizen Satisfaction Survey 2014-2015
ACCOUNTABILITY AND PREFERENCES FOR COUNTY PRIORITIES When respondents were asked how they rated Pinal County government performance, about one in three reported “excellent” or “good”; another third reported “fair”. No significant differences between this survey and the 2010 survey results were noted after removing “don’t know” responses to include only respondents who had an opinion about government performance. A complete set of results responses are available in Appendix B.
Table 5: Summary of Opinions about Government Performance by Geographic Location
Percent reporting "good" or "excellent" Incorporated, % Unincorporated, %
Total, % 2010 comparison, %
The value of County-provided services for the taxes paid to Pinal County (n=922)
39% 36% 37% 37%
The overall direction that Pinal County is taking (n=918)
44% 42% 43% 40%
The job Pinal County is doing listening to residents (n=847)
33% 31% 32% 31%
The job Pinal County government does responding to residents (n=830)
36% 30% 33%
6%
10%
7%
7%
32%
33%
24%
26%
0% 20% 40% 60% 80% 100% 120%
The value of County-provided services for the taxes paid to Pinal County
The overall direction that Pinal County is taking
The job Pinal County does listening to residents
The job Pinal County does responding to residents
Figure 7: Summary of Opinions about Government Performance
Excellent Good Fair Poor

17 Pinal County Citizen Satisfaction Survey 2014-2015
Respondents were asked if they were aware that Pinal County has a Strategic Plan, and the 60% majority were not aware that Pinal County has a Strategic Plan. The Pinal County Strategic Plan 2014-2017 is a roadmap for continuous improvement and accountability. Participants were then asked to what extent they supported or opposed Pinal County elected officials or staff expending local resources towards these priorities, and it appears that a vast majority (81% or more) of residents are in favor of all the priorities listed above. No significant differences in support or opposition of the priorities were observed by geographic location, although the most favored priority was economic development with 93% of residents overall indicating they “strongly” or “somewhat support” this priority.
88%
93%
87%
81%
88%
84%
74% 76% 78% 80% 82% 84% 86% 88% 90% 92% 94%
Vibrant, Safe, Sustainable Communities
Economic Development
Transportation
Financial Stability and Health
Service Levels/Quality of Service
Employee Morale, Retention and Recruitment
Figure 8: Preference for Pinal County Priorities
Percent reporting "strongly" or "somewhat support"
18 Pinal County Citizen Satisfaction Survey 2014-2015
Table 6: Preference for Pinal County Priorities by Geographic Location
Percent reporting "strongly" or "somewhat support"
Incorporated, %
Unincorporated, %
Total, %
2010 comparison, %
Vibrant, Safe, Sustainable Communities 86% 91% 88% N/A
Economic Development 92% 93% 93% 93%
Transportation 87% 87% 87% 92%
Financial Stability and Health 79% 82% 81% N/A
Service Levels/Quality of Service 87% 90% 88% N/A
Employee Morale, Retention and Recruitment
84% 83% 84% N/A
Total 540 496 1036 963
Participants were asked to pretend they were responsible for making decisions about service provisions in Pinal County that require difficult trade-offs. Out of a total 100 “importance” points, participants were required to distribute points among six service categories based on how important the service is to quality of community life in Pinal County. The definitions for the six service categories are included below, with the response average and totals listed; results for this question were not weighted. Respondents were allowed to assign all or no points to any service category, but were required to use all 100 points and no more than 100 points. Law enforcement received the highest “importance” rating based on the point system, followed by transportation and economic development, which is consistent with 2010 survey responses although the same question format was not used in the past survey. There was no significant difference observed in average responses by geographic location.
Table 7: Average “Importance” Rating based on Provision Point System for Services
Answer Options Response Average Points
Community Services (includes development review, including long-range planning, fostering public / private partnerships, code enforcement, sustainability efforts to save taxpayer dollars and reduce the county's impact on the environment, funds to help rehab a home or business, public services including immunization clinics, mosquito control, open space, parks, trails, etc.)
17.41
Economic Development (includes attracting and retaining businesses and jobs) 20.29
Human Services (includes unemployment assistance, workforce training, child protection, adult protection, services for financially challenged families, etc.)
13.98
Law Enforcement (includes Sheriff patrol, crime prevention, jail, County Attorney, prosecution, courts, etc.)
25.75
Public Services (includes maintaining official public records, Clerk of the Court and Recorder functions such as marriage licenses, elections, Assessor’s valuation of property, Treasurer, etc.)
11.24
Transportation Infrastructure (includes maintenance and construction of roads, bridges, drainage systems; sidewalk construction, etc)
21.44

19 Pinal County Citizen Satisfaction Survey 2014-2015
FINANCIAL RESPONSIBILITY When respondents were asked about their opinions of Pinal County taxes provided the current quality of services, nearly half (48%) rated current taxes as “about right” and nearly a third (29%) rated current taxes as “somewhat too much”. Respondents did not have the option to select “don’t know”. Participants favored “no changes to current County taxes or services” (41%) or “somewhat support paying higher County taxes and maintaining or expanding services” (23%); other responses were minimal in comparison.
About right48%
Somewhat too little7%
Somewhat too much29%
Way to much14%
Way too little2%
Figure 9: Opinion of Pinal County taxes provided quality of service

20 Pinal County Citizen Satisfaction Survey 2014-2015
Table 8: Support of Pinal County Taxes and Services by Geographic Location
How do you rate your support of Pinal County taxes and services?
Incorporated, % Unincorporated, %
Total, %
Don't know 10% 9% 9% Prefer no changes to current County taxes or services 45% 38% 41% Somewhat support higher County taxes and maintaining current service levels
20% 26% 23%
Somewhat support lower County taxes and reducing service levels
9% 9% 9%
Strongly support higher County taxes and maintaining current service levels or expanding services
9% 10% 10%
Strongly support lower County taxes and reducing service levels
7% 8% 8%
Total 540 496 1036
Don't know9%
Prefer no changes to current County taxes
or services41%
Somewhat support higher County taxes
and maintaining current service levels
23%
Somewhat support lower County taxes
and reducing service levels
9%
Strongly support higher County taxes
and maintaining current service levels or expanding services
10%
Strongly support lower County taxes
and reducing service levels
8%
Figure 10: Support of Pinal County Taxes and Services

21 Pinal County Citizen Satisfaction Survey 2014-2015
Use of Information Sources The most popular Pinal County government information sources reported by participants were word-of-mouth (83%), followed by the County website (81%) and local newspapers (76%). The most common use of the County website (www.PinalCountyAZ.gov) were looking up property information such as taxes, values, and maps (73%), obtaining information about services provided by Pinal County (52%), and looking up voter information (51%).
81%
76%
24%
41%
50%
52%
65%
41%
83%
46%
26%
0% 10% 20% 30% 40% 50% 60% 70% 80% 90%100%
County Website (www.PinalCountyAZ.gov)
Local newspapers
Radio
Local television stations
Civic association/homeowner association newsletters or community listservs
Social networking (i.e., Facebook, Twitter, etc.) and blog Web sites
Mailings, publications, press releases, and online newsletters
Town Hall meetings and other public meetings
Word-of-mouth
Attending a local government meeting open to the public
Watching live or recorded Board of Supervisors meetings
Figure 11: How much information is received about Pinal County government from the following sources?
Most, a lot or some None
22 Pinal County Citizen Satisfaction Survey 2014-2015
73%
42%
51%
34%
10%
6%
16%
43%
52%
36%
32%
21%
19%
0% 10% 20% 30% 40% 50% 60% 70% 80% 90%100%
Looked up property information, such as taxes, values, and maps
Checked to see what Supervisor’s district your home is located in
Looked up Pinal County voter information
Paid your property taxes
Applied for County Permits
Submitted questions about the permit process or requirements for home additions
Accessed County financial and performance information
Accessed a County form (e.g., employment application, public document)
Obtained information about services provided by Pinal County
Searched for or applied for County employment
Searched for tourism information or local attractions
Searched for economic development information
Watching live or recorded Board of Supervisors meetings
Figure 12: Use of Pinal County Website
1 - Have done 2 - Heard of but never done 3 - Never heard of

23 Pinal County Citizen Satisfaction Survey 2014-2015
COMMUNITY CHARACTERISTICS Survey respondents were asked to rate their overall quality of life in the County, as well as to rate various aspects of Pinal County quality of life. 75% reported that the quality of life in their neighborhood was “good” or “excellent.” Overall, 59% of respondents rated the quality of life in Pinal County as “good” or better. When asked to rate Pinal County as a place to raise children and as a place to work, less than half of participants responded positively. Quality of life ratings related to Pinal County as a place to raise children and a place to work appear to differ by geographic location, with incorporated residents reporting the quality of life as slightly more favorable in these two facets. Only 21% responded positively to the question about Pinal County being a good place to start or operate a business, which is a new question that was not included in the 2010 survey. However, residents living in unincorporated areas of the County vs. incorporated municipalities rated the overall quality of life in Pinal County the same (59%) and overall results were similar to the 2010 survey (see Table 9). Additional responses are not shown in the body of this report; the full set of responses can be found in Appendix B: Complete Set of Responses to Survey Questions.
Table 9: Summary of Quality of Life by Geographic Location
Percent reporting "good" or "excellent"
Incorporated, %
Unincorporated, %
Total, %
2010 comparison, %
The overall quality of life in Pinal County
59% 59% 59% 58%
Pinal County as a place to live 66% 63% 64% 65%
Your neighborhood as a place to live 76% 74% 75% 71%
Pinal County as a place to raise children
51% 36% 44% 51%
Pinal County as a place to work 39% 22% 31% 32%
Pinal County as a place to retire 60% 61% 60% 66%
Pinal County as a place to start and/or operate a business
24% 18% 21% N/A
Total, n 540 496 1036 963
1 - Excellent11%
2 - Good48%
3 - Fair32%
4 - Poor9%
5 - Don't know0%
Figure 13: Overall Quality of Life

24 Pinal County Citizen Satisfaction Survey 2014-2015
When asked to rate various community characteristics as they related to the County as a whole, about half of respondents gave positive marks to the ease of car travel in Pinal County (49%), variety of housing options (50%) and availability of affordable housing (55%) in Pinal County. Ease of bicycle travel (19%), availability of walking paths and trails (28%), and educational opportunities (26%) were rated the least positively of all community characteristics. About 1 of 3 participants responded as “good” or better to recreational opportunities (38%), employment opportunities (31%), accessibility of Public Health Clinics (38%), and air quality (37%). Pinal residents living in incorporated municipalities were more likely to rate the community characteristics more positively compared to residents living in unincorporated areas of Pinal County, with the exception of variety of housing options, availability of affordable housing, and air quality. Overall results were similar to the 2010 survey; although positive ratings of “good” or “excellent” were lower for recreational opportunities, educational opportunities, ease of bicycle travel, and availability of paths and walking trails, and air quality.
59%
64%
75%
44%
31%
60%
21%
0% 10% 20% 30% 40% 50% 60% 70% 80%
The overall quality of life in Pinal County
Pinal County as a place to live
Your neighborhood as a place to live
Pinal County as a place to raise children
Pinal County as a place to work
Pinal County as a place to retire
Pinal County as a place to start and/or operate a business
Figure 14: Summary of Quality of Life
Percent reporting "good" or "excellent"

25 Pinal County Citizen Satisfaction Survey 2014-2015
Table 10: Summary of Community Characteristics by Geographic Location
Percent reporting "good" or "excellent"
Incorporated, % Unincorporated, %
Total, %
2010 comparison, %
Recreational opportunities 40% 36% 38% 42%
Employment opportunities 24% 39% 31% 16%
Educational opportunities 30% 22% 26% 35%
Ease of car travel in Pinal County 57% 39% 49% 44%
Ease of bicycle travel in Pinal County
23% 15% 19% 26%
Availability of paths and walking trails
31% 25% 28% 34%
Variety of housing options 47% 52% 50% 51%
Availability of affordable housing 47% 60% 53% 58%
Accessibility of Pinal County Health Clinics
40% 36% 38% 38%
Air quality 14% 61% 37% 54%
Total, n 540 496 1036 963
38%
31%
26%
49%
19%
28%
50%
53%
38%
37%
52%
0% 10% 20% 30% 40% 50% 60%
Recreational opportunities
Employment opportunities
Educational opportunities
Ease of car travel in Pinal County
Ease of bicycle travel in Pinal County
Availability of paths and walking trails
Variety of housing options
Availability of affordable housing
Accessibility of Pinal County Health Clinics
Air quality
Availability of information on the County website
Figure 15: Summary of Community Characteristics
Percent reporting "good" or "excellent"

26 Pinal County Citizen Satisfaction Survey 2014-2015
PUBLIC SAFETY The survey included a series of questions about feelings of safety from crime and in their neighborhood. About two in three Pinal County residents reported feeling “somewhat” or “very safe” from violent crimes, while about half reported feeling safe from property crimes in the County, similar to 2010 survey results. Significantly more residents reported feeling safe in their neighborhood during the day than those who reported feeling safe in their neighborhood at night (87% vs. 62%). Slightly more residents living in incorporated municipalities reported feeling safer from crimes and in their neighborhood during the day compared to residents living in unincorporated areas of Pinal County, although these differences are not significant.
Table 11: Summary of Feelings of Safety by Geographic Location
Percent reporting "somewhat safe" or "very safe"
Incorporated, % Unincorporated, %
Total, %
2010 comparison, %
Violent crime (e.g., rape, assault, robbery)
69% 67% 68% 64%
Property crimes (e.g., burglary, theft) 56% 51% 54% 48%
In your neighborhood during the day 88% 86% 87% 87%
In your neighborhood after dark 62% 62% 62% 64%
Total, n 540 496 1036 963
68%
54%
87%
62%
0% 10% 20% 30% 40% 50% 60% 70% 80% 90% 100%
Violent crime (e.g., rape, assault, robbery)
Property crimes (e.g., burglary, theft)
In your neighborhood during the day
In your neighborhood after dark
Figure 16: Summary of Feelings of Safety
Percent reporting "very safe" or "somewhat safe"

27 Pinal County Citizen Satisfaction Survey 2014-2015
EMPLOYMENT OPPORTUNITIES When asked if participants were currently a paid employee, 53% reported employment at the time of the survey, while 47% were unemployed. Under the Community Characteristics section of the survey, only 31% of participants rated employment opportunities as favorable (“good” or “excellent”). There is a significant difference in full-time employment status (62% vs. 34%) and employment outside Pinal County (89% vs. 67%) between residents who live in an incorporated municipality compared to residents who live in an unincorporated area. Thus, respondents who live in an incorporated municipality are more likely to be employed.
Table 12: Employment Status by Geographic Location
Are you currently a paid employee?
Incorporated, % Unincorporated, % Total, % 2010 comparison, %
No 35% 60% 47% 41% Yes, full time 62% 34% 49% 51% Yes, part time 3% 5% 4% 8% Total 540 496 1036 963
No47%
Yes, full time49%
Yes, part time4%
Figure 17: Employment Status

28 Pinal County Citizen Satisfaction Survey 2014-2015
The majority of employed respondents work outside of Pinal County. A third of employed participants commute to work in 15 minutes or less, a third commute from 16-30 minutes, and a third commute 31 or more minutes. It is also noteworthy that 83% of employed respondents commute to work alone in a motorized vehicle, while 11% commute with at least one other person in a motorized vehicle, and 2% commute using mass transit like a bus or subsidized van pool.
Table 13: Outside Employment by Geographic Location (n=547)
Is your place of employment within Pinal County?
Incorporated, % Unincorporated, %
Total, % 2010 comparison, %
No 11% 33% 19% 57% Yes 89% 67% 81% 43% Total 349 198 547 963
Table 14: Commute Time to Work by Geographic Location (n=518)
On average, about how long does it take you to travel to work?
Incorporated, % Unincorporated, % Total, % 2010 comparison, %
1 to 15 minutes 40% 25% 35% 26% 16 to 30 minutes 34% 27% 32% 25% 31 to 45 minutes 16% 23% 18% 22% 46 minutes to 1 hour 8% 16% 11% 19% More than 1 hour 3% 9% 5% 8% Total 331 187 518 963

29 Pinal County Citizen Satisfaction Survey 2014-2015
RESIDENT LIVING AND RETIREMENT Participants were asked how many years they lived in Pinal County, and their likelihood of remaining in Pinal County for the next five years and whether or not they plan to retire in Pinal County. A majority of residents reported residing in Pinal County less 10 years or less (51%), followed by 11-20 years (20%), more than 20 years (22%). It is noteworthy that participants that reported living in an incorporated municipality were more likely to reside in Pinal County more than 20 years than residents living in unincorporated areas (30% vs. 13%). Respondents also were asked to indicate how likely or unlikely they would be to recommend living in Pinal County to others. About eight out of ten respondents reported that they would be “very” or “somewhat likely” to recommend living in Pinal County as well as to remain living in the county for the next five years. About two-thirds said they would be “somewhat” or “very likely” to retire in the County. The results were similar to 2010 results, although respondents in 2014-2015 reported they are more likely to retire in Pinal County than compared to 2010 (63% vs. 55%). The results regarding for this Resident Living and Retirement survey question were consistent with the 60% of participants who rated Pinal County as an “excellent” or “good” place to retire in the Quality of Life question section.
Table 15: Number of Years of Residency by Geographic Location
How many years have you lived in Pinal County?
Incorporated, % Unincorporated, % Total, % 2010 comparison, %
Less than 2 years 10% 5% 7% 14%
2-5 years 18% 25% 21% 31%
6-10 years 24% 35% 29% 23%
11-20 years 16% 24% 20% 13%
More than 20 years 32% 12% 22% 19%
Total, n 540 496 1036 963
Less than 2 years7%
2-5 years22%
6-10 years29%
11-20 years20%
More than 20 years22%
Figure 18: Number of Years Living in Pinal County

30 Pinal County Citizen Satisfaction Survey 2014-2015
Table 16: Likelihood of remaining in or recommending the community by geographic location
Percent reporting "very" or "somewhat likely"
Incorporated, % Unincorporated, % Total, %
2010 comparison, %
Recommend living in Pinal County 70% 88% 79% 77%
Remain in Pinal County for the next five years
76% 85% 80% 77%
Retire in Pinal County 56% 71% 63% 55%
Total 540 496 1036 963
79%
80%
63%
0% 10% 20% 30% 40% 50% 60% 70% 80% 90%
Recommend living in Pinal County
Remain in Pinal County for the next five years
Retire in Pinal County
Figure 19: Likelihood of remaining in or recommending community
Percent reporting "very" or "somewhat likely"

31 Pinal County Citizen Satisfaction Survey 2014-2015
ADDITIONAL DEMOGRAPHICS OF PARTICIPANTS
Table 17: Survey Participation by Zip Code and Geographic Location
Zip Code Incorporated Unincorporated Total n N % n %
85118 4 1% 39 8% 43 85119 28 5% 11 2% 39 85120 18 3% 0 0% 18 85122 120 22% 0 0% 120 85123 5 1% 60 12% 65 85124 0 0% 1 0% 1 85128 66 12% 0 0% 66 85130 2 0% 0 0% 2 85131 8 1% 1 0% 9 85132 112 21% 10 2% 122 85137 22 4% 1 0% 23 85138 39 7% 1 0% 40 85139 25 5% 14 3% 39 85140 11 2% 80 16% 90 85142 27 5% 31 6% 57 85143 8 1% 130 26% 138 85145 0 0% 4 1% 4 85153 0 0% 1 0% 1 85172 0 0% 1 0% 1 85173 14 3% 0 0% 14 85191 0 0% 1 0% 1 85192 1 0% 2 0% 3 85193 4 1% 1 0% 4 85194 17 3% 2 0% 19 85222 1 0% 0 0% 1 85232 1 0% 1 0% 2 85239 1 0% 0 0% 1 85240 0 0% 1 0% 1 85242 0 0% 1 0% 1 85291 0 0% 1 0% 1 85296 0 0% 1 0% 1 85519 0 0% 0 0% 0 85618 6 1% 1 0% 7 85623 0 0% 25 5% 25 85631 0 0% 14 3% 14 85658 2 0% 0 0% 2 85739 0 0% 59 12% 60 85912 0 0% 0 0% 0 89119 0 0% 1 0% 1
Total 540 100% 496 100% 1036

32 Pinal County Citizen Satisfaction Survey 2014-2015
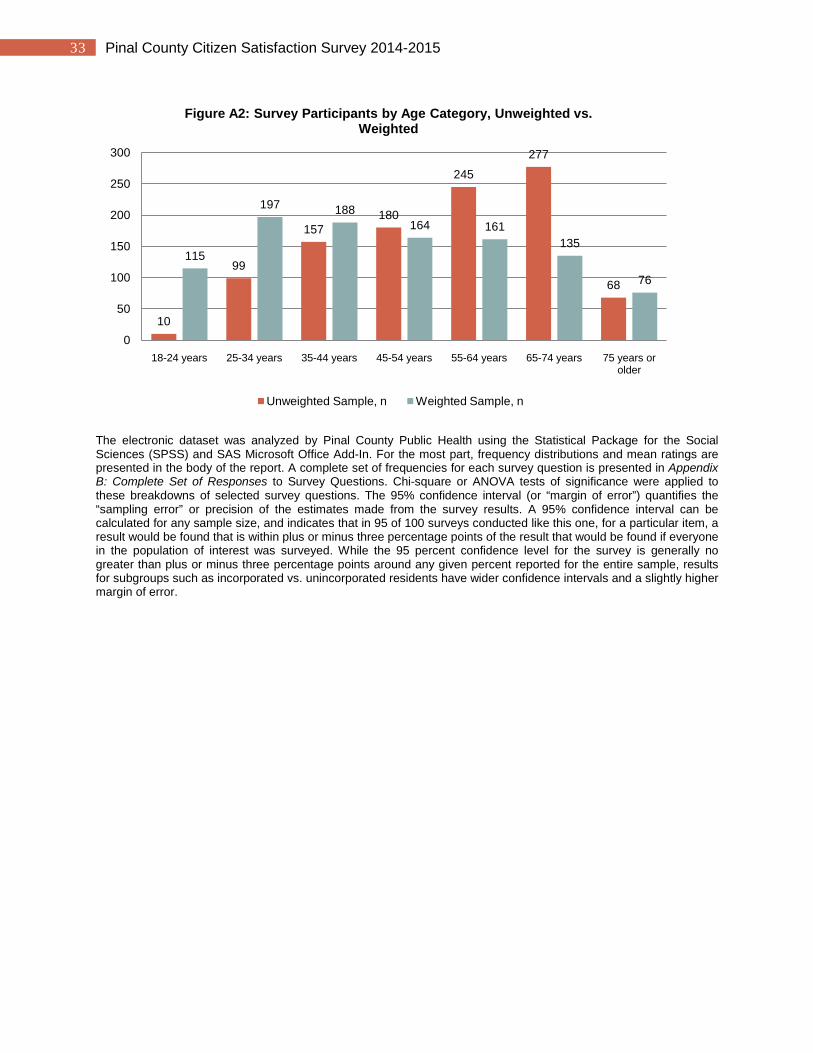
Appendix A Methodology: Data Analysis and Weighting The demographics reported by survey participants suggest that the sample is not truly representative of Pinal County demographics according to the U.S. Census American Community Survey (ACS) 2009-2013, and weighting adjustment of responses provides a better estimate of overall citizen satisfaction information. When selection bias is present in a convenience sample that is a much smaller subset of an actual population, weighting adjusts for over- and under-representation of demographic variables such as age that influence overall response results. Results were not weighted by race/ethnicity, due to refusal of 60 participants to report race/ethnicity using the defined categories. Analysis of the survey sample that completed the entire 40-question survey (n=1,036), shows participant age distribution appears left-skewed as older (Figure A1), suggesting an overrepresentation of participants aged 55-74 years old compared to Census estimates of Pinal County population by age and underrepresentation of young adults aged 18-34 years old. Although actual age was not captured in the survey, based on responses by age category both the mean and median age of survey participants is estimated around ~55 years. Figure A2 below demonstrates that weighting survey responses by age category fixes the age distribution of the sample to reflect the ACS 2009-2013 demographics.
1%
10%
15%17%
24%27%
7%
11%
19% 18%16% 16%
13%
7%
0%
5%
10%
15%
20%
25%
30%
18-24 years 25-34 years 35-44 years 45-54 years 55-64 years 65-74 years 75 years or older
Figure A1: Percent Distribution by Age Category, Unweighted
Sample, % Population, %
33 Pinal County Citizen Satisfaction Survey 2014-2015
The electronic dataset was analyzed by Pinal County Public Health using the Statistical Package for the Social Sciences (SPSS) and SAS Microsoft Office Add-In. For the most part, frequency distributions and mean ratings are presented in the body of the report. A complete set of frequencies for each survey question is presented in Appendix B: Complete Set of Responses to Survey Questions. Chi-square or ANOVA tests of significance were applied to these breakdowns of selected survey questions. The 95% confidence interval (or “margin of error”) quantifies the “sampling error” or precision of the estimates made from the survey results. A 95% confidence interval can be calculated for any sample size, and indicates that in 95 of 100 surveys conducted like this one, for a particular item, a result would be found that is within plus or minus three percentage points of the result that would be found if everyone in the population of interest was surveyed. While the 95 percent confidence level for the survey is generally no greater than plus or minus three percentage points around any given percent reported for the entire sample, results for subgroups such as incorporated vs. unincorporated residents have wider confidence intervals and a slightly higher margin of error.
10
99
157180
245
277
68
115
197 188164 161
135
76
0
50
100
150
200
250
300
18-24 years 25-34 years 35-44 years 45-54 years 55-64 years 65-74 years 75 years or older
Figure A2: Survey Participants by Age Category, Unweighted vs. Weighted
Unweighted Sample, n Weighted Sample, n

34 Pinal County Citizen Satisfaction Survey 2014-2015
Appendices B-C See attachments.