PIMCO BRAVO Fund III Fund Summary - · PDF file18/11/2016 · PIMCO BRAVO Fund III...
32
PIMCO BRAVO Fund III Fund Summary Sector: Strategy: Sub-Strategy: Special Situations Cross Asset Global Cross Asset IDD: January 2017 ODD: January 2017 Firm Overview PIMCO (the “GP”) is one of the largest investment management firms in the world with approximately $1.5 trillion in assets under management and 2,220 employees. The majority of its assets are run in its traditional fixed income strategies though the GP also has meaningful businesses in alternatives, equities and real return strategies. PIMCO was founded by Bill Gross and others in 1971 in Newport Beach as a subsidiary of Pacific Life Insurance Company, managing separate accounts for the firm’s institutional clients. From its founding through the 1990’s PIMCO was primarily focused on managing traditional fixed income funds and accounts. In 2000, it was purchased by Allianz but continued to operate as a mostly autonomous entity, expanding its alternatives investment management business starting in 2002 with the launch of a macro relative value strategy. Fund Summary General Partner PIMCO Sector Special Situations Strategy Cross Asset Sub-Strategy Global Cross Asset Main Office New York Geography Global Target Size $3-4 billion target ($5 billion hard cap) Management Fees 1.5% on invested capital Carried Interest 20% Closing Schedule: November 18, 2016: $820 mm December 30, 2016: $380 mm March 24, 2017: TBD Investment Period 3 years (final close) Extensions None specific Harvest Period PIMCO Extensions Special Situations Strategy PIMCO’s BRAVO investment strategy is among the more recent strategies launched at PIMCO with BRAVO I having first launched in 2011. The first fund had been launched to take advantage of NPL sales and bank recapitalization opportunities (BRAVO is an acronym for “bank recapitalization and value opportunities”). The second fund was then launched in 2013 with a shift in mandate towards securities, specialty finance and performing assets and the GP is currently raising PIMCO BRAVO Fund III (“BRAVO III”) with an even greater focus on specialty finance and asset backed originations. BRAVO III has a broad strategy that seeks to invest across a wide range of asset types across public and private markets and geographies. The strategy will target opportunities across residential real estate, commercial real estate, specialty finance and other financials. PIMCO does not expect there to be a material exposure to non-financial corporates. While BRAVO III may invest in distressed assets, the majority of exposure is expected to be to performing assets generating a high-single digit or greater unlevered yield. PIMCO intends to use a variety of financing structures to leverage performing assets (loans/securities) to produce a base-level of no loss IRR. The GP’s investments in real estate private equity and specialty finance equity will typically target meaningfully higher IRRs relative to its securities/loan portfolio. PRIVATE & CONFIDENTIAL
Transcript of PIMCO BRAVO Fund III Fund Summary - · PDF file18/11/2016 · PIMCO BRAVO Fund III...

PIMCO BRAVO Fund III Fund Summary
Sector: Strategy: Sub-Strategy:
Special Situations Cross Asset Global Cross Asset
IDD: January 2017 ODD: January 2017
Firm Overview
PIMCO (the “GP”) is one of the largest investment management firms in the world with approximately $1.5 trillion in assets under management and 2,220 employees. The majority of its assets are run in its traditional fixed income strategies though the GP also has meaningful businesses in alternatives, equities and real return strategies. PIMCO was founded by Bill Gross and others in 1971 in Newport Beach as a subsidiary of Pacific Life Insurance Company, managing separate accounts for the firm’s institutional clients. From its founding through the 1990’s PIMCO was primarily focused on managing traditional fixed income funds and accounts. In 2000, it was purchased by Allianz but continued to operate as a mostly autonomous entity, expanding its alternatives investment management business starting in 2002 with the launch of a macro relative value strategy.
Fund Summary
General Partner PIMCO Sector Special Situations Strategy Cross Asset Sub-Strategy Global Cross Asset Main Office New York Geography Global Target Size $3-4 billion target ($5 billion hard cap) Management Fees 1.5% on invested capital Carried Interest 20%
Closing Schedule: November 18, 2016: $820 mm December 30, 2016: $380 mm March 24, 2017: TBD
Investment Period 3 years (final close) Extensions None specific Harvest Period PIMCO Extensions Special Situations
Strategy
PIMCO’s BRAVO investment strategy is among the more recent strategies launched at PIMCO with BRAVO I having first launched in 2011. The first fund had been launched to take advantage of NPL sales and bank recapitalization opportunities (BRAVO is an acronym for “bank recapitalization and value opportunities”). The second fund was then launched in 2013 with a shift in mandate towards securities, specialty finance and performing assets and the GP is currently raising PIMCO BRAVO Fund III (“BRAVO III”) with an even greater focus on specialty finance and asset backed originations.
BRAVO III has a broad strategy that seeks to invest across a wide range of asset types across public and private markets and geographies. The strategy will target opportunities across residential real estate, commercial real estate, specialty finance and other financials. PIMCO does not expect there to be a material exposure to non-financial corporates. While BRAVO III may invest in distressed assets, the majority of exposure is expected to be to performing assets generating a high-single digit or greater unlevered yield. PIMCO intends to use a variety of financing structures to leverage performing assets (loans/securities) to produce a base-level of no loss IRR. The GP’s investments in real estate private equity and specialty finance equity will typically target meaningfully higher IRRs relative to its securities/loan portfolio.
PRIVATE & CONFIDENTIAL

PRIVATE AND CONFIDENTIAL: These materials are strictly confidential and/or legally privileged. These materials are intended only for the use of the individual or entity to which Aksia LLC or an affiliate (collectively, “Aksia”) has sent these materials (“Intended Recipient”) and may not be reproduced or distributed, posted electronically or incorporated into other documents in whole or in part except for the personal reference of the Intended Recipient. If you are not the Intended Recipient you are hereby requested to notify Aksia and either destroy or return these documents to Aksia. The Intended Recipient shall not use Aksia’s name or logo or explicitly reference Aksia’s research and/or advisory services in any of the Intended Recipient’s materials. NO OFFERING: These materials do not in any way constitute an offer or a solicitation of an offer to buy or sell funds, private investments or securities mentioned herein. These materials are provided only for use in conjunction with Aksia’s research and/or advisory services, as such services are defined in an executed agreement between Aksia and the Intended Recipient (hereinafter, the “Agreement”). In the event that an executed Agreement does not exist between Aksia and the Intended Recipient, these materials shall not constitute advice or an obligation to provide such services. RECOMMENDATIONS: Any Aksia recommendation or opinion contained in these materials is a statement of opinion provided in good faith by Aksia and based upon information which Aksia reasonably believes to be true. Recommendations or opinions expressed in these materials reflect Aksia’s judgment as of the date shown, and are subject to change without notice. Actual results may differ materially from any forecasts discussed in the materials. Except as otherwise agreed between Aksia and the Intended Recipient, Aksia is under no future obligation to review, revise or update its recommendations or opinions. NOT TAX, LEGAL OR REGULATORY ADVICE: An investor should consult his, her or its tax, legal and regulatory advisors before allocating to a private investment fund or other investment opportunity. Aksia is not providing due diligence or tax advice concerning the tax treatments of a private investment fund’s or investment opportunity’s holdings of assets or an investor’s allocations to such private investment fund or opportunity. RESPONSIBILITY FOR INVESTMENT DECISIONS: The Intended Recipient is responsible for performing his, her or its own reviews of any funds or other investment vehicles or opportunities described herein including, but not limited to, a thorough review and understanding of each vehicle’s or opportunity’s offering materials. The Intended Recipient is advised to consult his, her or its tax, legal and compliance professionals to assist in such reviews. For clients who receive only research services or non-discretionary advisory services from Aksia: the Intended Recipient acknowledges that he, she or it (and not Aksia) is responsible for his, her or its investment decisions with respect to any investment vehicles or opportunities described herein. No assurances can be given that a particular investment or portfolio will meet its investment objectives. Any projections, forecasts or market outlooks provided herein should not be relied upon as events which will occur. Past performance is not indicative of future results. Use of advanced portfolio construction processes, risk management techniques and proprietary technology does not assure any level of performance or guarantee against loss of capital. PERFORMANCE DATA: In cases where an investment manager or general partner implements an investment strategy through multiple investment vehicles (for tax purposes, participation in side pockets and new issues, domicile, currency denomination, etc.,) Aksia may use the returns of one class or series of an investment vehicle in a particular program in its reports to represent the returns of all the investment vehicles in such investment program. The returns for the particular class or series used in Aksia’s reports may be different from the returns of the class or series in which the Intended Recipient is invested. To obtain the actual performance of the particular class or series in the Intended Recipient’s portfolio, the Intended Recipient should contact the investment manager or general partner directly. RELIANCE ON THIRD PARTY DATA: These materials reflect and rely upon information provided by fund managers and other third parties which Aksia reasonably believes to be accurate and reliable. Such information may be used by Aksia without independent verification of accuracy or completeness, and Aksia makes no representations as to its accuracy and completeness. For the avoidance of doubt, these materials have not been produced, reviewed, verified or approved by the fund managers and other third parties to which the materials relate. As such, they do not necessarily reflect the views or opinions of such fund managers and third parties. RATING DOWNGRADES: Aksia client assets, in aggregate, may represent a large percentage of a manager’s or fund’s assets under management, and, as such, a rating downgrade by Aksia’s research teams could result in redemptions or withdrawals that may have an adverse effect on the performance of a fund. CONFLICTS OF INTEREST DISCLOSURE: Family members of Aksia personnel may from time to time be employed by managers that Aksia recommends to its clients. While this may pose a potential conflict of interest, we monitor such relationships to seek to minimize any impact of such potential conflict. PRIVATE INVESTMENT FUND DISCLOSURE: Investments in private investment funds and other similar investment opportunities involve a high degree of risk and you could lose all or substantially all of your investment. Any person or institution making such investments must fully understand and be willing to assume the risks involved. Some private investment funds and opportunities described herein may not be suitable for all investors. Such investments or investment vehicles may use leverage, hold significant illiquid positions, suspend redemptions indefinitely, provide no opportunity to redeem, modify investment strategy and documentation without notice, short sell securities, incur high fees and contain conflicts of interests. Such private investment funds or opportunities may also have limited operating history, lack transparency, manage concentrated portfolios, exhibit high volatility, depend on a concentrated group or individual for investment management or portfolio management and lack any regulatory oversight. For a description of the risks associated with a specific private investment fund or investment opportunity, investors and prospective investors are strongly encouraged to review each private investment fund or opportunity’s offering materials which contain a more specific description of the risks associated with each investment. Offering materials may be obtained from the fund manager. FOR RECIPIENTS OF REPORTS DISTRIBUTED BY AKSIA EUROPE LIMITED: Aksia Europe Limited is authorized and regulated by the Financial Conduct Authority.
PRIVATE & CONFIDENTIAL

New Mexico State Investment Council
February 2017An Introduction to PIMCO’s BRAVO Fund III

1
This is neither an offer to sell nor a solicitation of an offer to buy interests in the proposed PIMCO BRAVO Fund III (“BRAVO III” or the “Fund”). Offers are made solely pursuant to the Fund’s Private Placement Memorandum. This material has been prepared for informational purposes only and is not intended to provide, and should not be relied on for, accounting, legal, tax, or other advice. You should consult your advisers regarding such matters. Only qualified investors may invest in the Fund.
PIMCO Investments LLC, 1633 Broadway, New York, NY 10019, is a company of PIMCO. PIMCO Investments LLC (“PI”), a U.S. broker-dealer registered with the U.S. Securities and Exchange Commission, serves as the principal underwriter for the U.S. registered PIMCO Funds (“Funds”) and placement agent for the PIMCO-sponsored private funds (the “Private Funds”).
For qualified investor use only
Disclosures
CMR2017-0207-248113

2
Introduction

3
PIMCO BRAVO Fund III overview• Private equity-style opportunistic fund with an expected emphasis on markets influenced by regulatory reform (e.g. mortgage,
real estate and consumer markets) in the U.S. and Europe• Employs a “4 quadrant” investment approach across public and private debt and equity markets to identify attractive risk-
adjusted returns• Flexible investment approach, due to the complex interaction of monetary policies, regulation and fragmented capital markets• Target IRR and multiple of 14%–16% and 1.7x–1.9x, net of fees and carried interest (the “Target Return”)1
• Seven-year term from final close, with two possible one-year extensions
• Disciplined underwriting process that combines macro perspectives and asset-level expertise • Breadth of information available through the platform and proprietary analytics expected to result in a unique understanding
of and ability to identify and source relative value across the capital structure• Leverage PIMCO’s capital markets and structuring expertise to understand embedded options and increase exit strategy
optionality with the goal on optimizing returns• Strong financing platform
As of 31 December 2016. SOURCE: PIMCO1The Target Return is not a guarantee, projection or prediction of future results of the Fund. Actual results may vary significantly from the Target Return. Refer to the Appendix for important additional information on the Target Return. IRR represents the annualized internal rate of return for a specified period, based on capital contributions by investors, distributions to investors and the residual value of unrealized investments. Multiple represents the ratio of (i) distributions to investors plus the residual value of unrealized investments to (ii) capital contributions by investors.2Refer to following page for information on these prior funds. Net of fee value equals (i) distributions to investors plus (with respect to unrealized BRAVO investments) residual value to paid-in capital, net of fees, expenses and realized/unrealized carried interest, over (ii) capital contributions (approximately $9.2 billion). Does not include BRAVO II, the investment period of which has not ended.3 This figure includes commitments of BRAVO III’s General Partner and Limited Partners, as well as $62 million of commitments that will be accepted from prospective Limited Partners at future closes, assuming sufficient ERISA capacityThe above terms are preliminary and subject to change, and have been simplified for illustrative purposes. In particular, this summary omits certain important details about the stated terms, and does not address certain other key Fund terms or represent a complete list of all Fund terms. In the event of any conflict between the above terms and the Fund’s definitive legal documents, the latter will controlRefer to Appendix for additional performance and fee, investment strategy, target return and risk information
• BRAVO team includes over 80 portfolio management resources spanning a diverse range of backgrounds, including originations, capital markets, real estate acquisitions and asset management
• History of identifying investment opportunities, selecting and constructing teams to capitalize on these opportunities with afocus on achieving attractive returns
• Strong track record that has generated approximately $5.5 billion in net-of-fee value for limited partners in five prior comparable funds that have completed their investment periods2
Fund
Experience
Our edge
• $1.2 billion3 in total commitments raised to date (as of 30 December 2016)• Quarterly closes through 2017 subject to fund capacity• Robust investment pipeline; the fund has called 10% of committed capital to date
Fundraising status

4
Investment opportunity

5
The investment opportunity continues to evolve
TodayBRAVO III
2011BRAVO
Capitalize on bank deleveragingPosition for a recovery in real estate fundamentals
Do what banks can’t or won’t do
• Monetary policy driving demand for safe yield such as core CRE
• Real estate fundamentals generally improving, with greater dispersion across Europe
• Increasing pace of bank deleveraging and non-core business sales suggests building regulatory pressures
• Effectiveness of monetary policyis waning
• Dislocation emerging amidst growing political uncertainty
• Supply and demand for credit is unbalanced in select markets as banks continue to reduce balance sheet
• Traditional lenders’ business models continue to retreat in the face of regulatory and market pressures
• Banks are severely undercapitalized and face significant deleveraging pressure
• Largest portfolio sales are U.S. residential NPLs
• Significant uncertainty regarding the trajectory of future U.S. home prices
2013BRAVO II
Inve
stm
ent
back
drop
BRAV
O
stra
tegy
Refer to Appendix for additional investment strategy and risk information.

6
The timing, scope and true demand for de-regulation is highly uncertain
As of 23 January 20171. Risk Weighted Assets2. Current Expected Credit Losses 3. Capital Requirements Directive
Regulation is altering business decisions for financial institutions and expected to do so for years to come
(Affects Everything)
Structured products
U.S. CRE
European CRE
U.S. residential loans
UK/European residential loans
U.S. consumer loans
European consumer loans
Servicing platforms
Mortgage servicing rights
(MSRs)
Complex, off-the-run securities
U.S. commercial finance loans
European commercial
finance loans
EL Accounting (IFRS 9/CECL)2
RWA1 Floors(Basel IV) FRTB5CFPB4Basel III / CRD3
IV Dodd Frank
4. Consumer Financial Protection Bureau Current 5. Fundamental Review of the Trading Book
PIMCO estimates that the market impact could exceed $2 trillion
Refer to Appendix for additional forecast, investment strategy and risk information.

7
Real estate (CRE / RRE) Non-performing loans Bad bank: assets, primarily in Europe Structured products (ABS, CLO, legacy MBS) Non-standard commercial credit High yield securities
Banks have been systematically downsized
As of 31 December 2015SOURCE: Federal Reserve Economic DataRRE: Residential real estate, ABS: Asset-backed securities, CLO: Collateralized loan obligations, MBS: Mortgage-backed securities
Businesses now considered non-core include:
Non-prime credit (auto, unsecured consumer) Mortgage origination and warehousing,
particularly non-prime Mortgage servicing Mortgage insurance Insurance brokerage Real estate development origination
Bank assets that still need to be sold include:
Equates to a $285 billion reduction in bank profitability
-5
0
5
10
15
20
25
'90 '91 '93 '94 '96 '97 '99 '00 '02 '03 '05 '06 '08 '09 '11 '12 '14 '15
Aver
age
ROE
(%)
Average Return on Equity for all U.S. and EU BanksAverage U.S. ROEAverage EU ROE

8
Residential
The investments in this section are presented for illustrative purposes only, as a general example of the type of investments that may be acquired by BRAVO III as well as PIMCO's unique capabilities in sourcing, modeling and managing such investments. BRAVO III does not own any of these investments, and may invest significantly in asset types not referred to in these examples. There can be no guarantee that BRAVO III will have access to comparable investments, or that PIMCO will utilize similar strategies or techniques in connection with BRAVO III investments. In addition, the investments referred to in this section may be unrealized or partially realized, and actual returns may vary significantly; there can be no assurance that PIMCO's projections or forecasts for such investments will prove accurate. Descriptions of transactions and capital structures provided herein have been simplified for illustrative purposes.
This information should not be considered as investment advice or a recommendation of any particular investment, strategy or investment product (including BRAVO III), or as an indication that any particular strategy or investment product (including BRAVO III) will invest in these or similar instruments. The information presented herein is as of a specific date, may have changed since such time and is subject to future change. Such information should not be considered as an indication of the actual or potential returns of any particular strategy or investment product (or their respective investments). See the Appendix hereto, including the heading “Sample Investments”, for additional information.

9
Banks are purposefully ceding market share in targeted residential markets
As of 31 December 2016. SOURCE: Freddie Mac, Inside Mortgage Finance (latest data as of 3Q ‘16) (top right and bottom left), PIMCO, CoreLogic (bottom right)Refer to Appendix for additional outlook information.
0%
20%
40%
60%
80%
100%
$0
$500
$1,000
$1,500
$2,000
$2,500
$3,000
$3,500
'05 '06 '07 '08 '09 '10 '11 '12 '13 '14 '15 '16
Share of origination (%)
Billi
ons
Bank vs. non-bank mortgage origination share & total origination market volume
Est Total Originations (lhs) Bank (rhs) Non-Bank (rhs)
0%
20%
40%
60%
80%
100%
'03 '05 '06 '10 '15
Changing composition of U.S. residential origination market
MBS Non-agency RMBS Balance sheet
Sizable universe of potential borrowers remain unable to access mortgage credit
Banks retreat from lending due to changes in capital charges, punitive fines and regulatory action
Non-banks gain market share; low rates, lack of balance sheet, and investor base limits focus on non-agency lending
200-300bn of potential borrowers remain underserved by mortgage market
0%
20%
40%
60%
80%
100%
'00 '02 '04 '06 '08 '10 '12 '14 '16
FICO Score Distribution at Origination
Score 500-579 Score 580-659 Score 660-739Score 740-819 Score 820+

10
Investment example: U.S. non-qualified mortgage (QM) loans
Asset type Non-QM residential mortgage loans
Location National
Initial closing date October 2014
Deal size / peak equity Up to $400 million / $283 million
Expected holding period 5 years
Leverage L+2.50%
Underwritten IRR / multiple 15-18% / 1.6x
As of 31 December 2016. SOURCE: PIMCO. Sample investment for illustrative purposes only. IRR represents the annualized internal rate of return for a specified period, based on capital contributed, expected distributions received and the residual value of unrealized investments. Multiple represents the ratio of (i) expected distributions received plus the residual value of unrealized investments to (ii) capital contributed. IRRs and multiples are net of deal-related expenses and gross of fund expenses. IRRs and multiples reflect PIMCO's views at the time of investment, and may no longer be accurate or reflect PIMCO's current views. Expected holding period and deal size / peak equity are subject to change. Underwritten IRR / multiple as of initial closing date. Current estimates of future returns may differ materially from the Underwritten IRR.Note: investment owned by BRAVO II; BRAVO III does not own such an investmentPast performance is not a guarantee or reliable indicator of future results. There can be no guarantee that the expectations identified will be met.The case study discussed herein has been selected as a representative example of the types of transactions that are intended to be pursued by BRAVO III and has not been selected based on performance. QM: Qualified mortgages, L: LIBORRefer to Appendix for additional investment strategy and risk information
• Purchased $750 million in non-QM loans to date, including $517 million in 2016
• Entered into additional forward flow agreements with originators. To date, we have purchased loans from 5 different sellers
• Moving forward with plans to complete our first non-QM securitization in early 2017
Take advantage of the spread differential between conforming and non-conforming mortgage rates
Transaction summary Investment thesis Status update
• Strong investor demand for non-prime collateral due to the absence of a new origination non-Agency securitization market
• This void was driven in large part by uncertain / unproven regulatory changes with regards to non-QM legislation
• Upside potential via equity investment in originator
• Acquire newly originated non-qualified residential mortgages
• Sourced through a forward flow arrangement with a local originator
• Concurrent investment in a warrant to purchase 25% of the originator’s equity

11
Investment example: Controlling stake in a U.S. non-bank mortgage originator
Asset type Private equity investment
Location National lender (headquarters: Mid-Atlantic)
Initial closing date October 2014 (term loan) and September 2015 (equity)
Deal size / peak equity $130 million / $130 million
Expected holding period 5 years
Leverage Unlevered
Underwritten IRR / multiple 22% / 2.5x
Target well-capitalized, non-bank mortgage companies that can take market share
Transaction summary Investment thesis Status update• Closed the equity investment in September 2015 and
Company completed the purchase of an internet based direct-to-consumer mortgage originator in Q2 2016. Successfully completed integration in Q3 and have begun to hire and scale platform in 2017
• For 2016, origination volumes increased by more than 60%, YOY, in 2016, and pretax profit expected to be up 15-20%
• Build-out of platform infrastructure and risk management systems substantially completed
• While volume growth and operating results are expected to decline during the first half of 2017 in response to the Q4 2016 increase in interest rates, FGMC expects second half volume and profit to recover with the growth from the internet direct-to-consumer lender and expansion of its wholesale lending channel
• Tightening regulatory conditions have created an opportunity for strong, well-capitalized, non-bank mortgage companies to take market share
• The company operates within a less competitive niche of the market enabling it to generate higher margins
• With additional capital, the company can expand into other profitable loan products and leverage fixed cost to further boost profitability
• Acquired a controlling interest in a non-bank mortgage-banking company with ~$325 million of monthly production
• Term loan provided to company to fund part of purchase price in addition to growth capital and was later converted to equity
• Finalized the purchase price in 2014 and negotiated that all interim earnings would be retained by the company with no adjustment for the seller
• Sourced through a long-term relationship with an industry advisor
As of 31 December 2016. SOURCE: PIMCO. Sample investment for illustrative purposes only. IRR represents the annualized internal rate of return for a specified period, based on capital contributed, expected distributions received and the residual value of unrealized investments. Multiple represents the ratio of (i) expected distributions received plus the residual value of unrealized investments to (ii) capital contributed. IRRs and multiples are net of deal-related expenses and gross of fund expenses. IRRs and multiples reflect PIMCO's views at the time of investment, and may no longer be accurate or reflect PIMCO's current views. Expected holding period and deal size / peak equity are subject to change. Underwritten IRR / multiple as of initial closing date. Current estimates of future returns may differ materially from the Underwritten IRR.Note: investment owned by BRAVO II; BRAVO III does not own such an investmentPast performance is not a guarantee or reliable indicator of future results. There can be no guarantee that the expectations identified will be met.The case study discussed herein has been selected as a representative example of the types of transactions that are intended to be pursued by BRAVO III and has not been selected based on performance. Refer to Appendix for additional investment strategy and risk information

12
Commercial
The investments in this section are presented for illustrative purposes only, as a general example of the type of investments that may be acquired by BRAVO III as well as PIMCO's unique capabilities in sourcing, modeling and managing such investments. BRAVO III does not own any of these investments, and may invest significantly in asset types not referred to in these examples. There can be no guarantee that BRAVO III will have access to comparable investments, or that PIMCO will utilize similar strategies or techniques in connection with BRAVO III investments. In addition, the investments referred to in this section may be unrealized or partially realized, and actual returns may vary significantly; there can be no assurance that PIMCO's projections or forecasts for such investments will prove accurate. Descriptions of transactions and capital structures provided herein have been simplified for illustrative purposes.
This information should not be considered as investment advice or a recommendation of any particular investment, strategy or investment product (including BRAVO III), or as an indication that any particular strategy or investment product (including BRAVO III) will invest in these or similar instruments. The information presented herein is as of a specific date, may have changed since such time and is subject to future change. Such information should not be considered as an indication of the actual or potential returns of any particular strategy or investment product (or their respective investments). See the Appendix hereto, including the heading “Sample Investments”, for additional information.

13
0
100
200
300
400
500
2016 2017 2018 2019 2020 2021 2022 2023 2024 2025
CM
BS m
atur
ity sc
hedu
le ($
bn)
10-year unwind of debt and private equity is upon us
Banks CMBS Life Cos Other
Dislocation grows in U.S. CRE due to a confluence of public market, financing & regulatory pressures
Regulations just now taking effect
Risk retention stunting $50-100bn CMBS origination market
Various regulations reducing bank dealer inventory of CMBS by over 75% since 2011
HVCRE (Basel 3) curtailing bank development lending
Sizeable buyer base ($15-20bn per year) disappearing due to new FINRA regulations for non-traded REIT disclosures
As of 31 December 2016. SOURCE: Markit and Barclays (top right), Federal Reserve, Trepp, Morgan Stanley Research (bottom left), CBRE Research, Real Capital Analytics, Moody’s/RCA CPPI (bottom right)HVCRE: High volatility commercial real estate, CMBX: Markit CMBX Index, Barclays HY: Barclays US Corporate High Yield IndexRefer to Appendix for additional outlook and risk information.
Peak CMBS maturities in 2016/2017
400
500
600
700
800
900
1000
Jan '15 May '15 Oct '15 Feb '16 Jul '16 Dec '16
Spre
ads
(bas
is p
oint
s)
CMBS sensitivity to HY market heightened with reduced dealer inventory
CMBX.BB.7 Barclays HY
80
130
180
230
280
'07 '08 '09 '10 '11 '12 '13 '14 '15 '16
Dec
-00
Inde
x=10
0
Moody's/RCA CPPI: Major Markets and Non-Major Markets Composite
National Major Markets Non-Major Markets
Prior peaks

14
0%
25%
50%
75%
100%
'04 '05 '06 '07 '08 '09 '10 '11 '12 '13 '14
Out
stan
ding
deb
t to
Eur
opea
n C
RE
Traditional credit sources constrained
Banks Bad Banks Non-Banks CMBS Bonds
European CRE experiencing structural dislocation
As of 30 September 2016. SOURCE: C&W Corporate Finance (top left), CBRE ERIX (top right), DTZ Research (bottom left), FIEC (European Construction Industry Federation) (bottom right). AMA: Asset Management AgenciesRefer to Appendix for additional outlook and risk information.
0
50
100
150
200
250
300
AMA Deleveraging plan/Internal non-core units
Other
Non
-cor
e ex
posu
re (
(€bn
)
European Bank Exposure to Non-Core Real Estate
Gross NetTotal Gross: €531bnTotal Net: €333bn
0
4000
8000
12000
16000
20000
24000
28000
Cap
ital v
alue
(€/s
qm)
Dislocation between Primary and Secondary Markets(Office sector)
Historic High Historic Low Q3 2016
80
85
90
95
100
105
110
'06 '07 '08 '09 '10 '11 '12 '13 '14 '15
2006
= 1
00
Lack of new supply
Housebuilding Non-residential Total construction

15
Investment example: U.S. CMBS AJ tranche
Asset type U.S. CMBS
Location U.S. – various
Initial closing date February 2016
Deal size / peak equity $93 million / $93 million
Expected holding period 1–2 years
Leverage L+225
Underwritten IRR / multiple 28–30% / 1.6–1.7x
Provide liquidity to forced sellers during periods of market volatility
Transaction summary Investment thesis Status update• Acquired in February 2016 utilizing
a combination of PIMCO's CMBS, CRE and quantitative desk expertiseto underwrite and stress test securities
• Both vintages have de-levered since acquisition:− 2006 vintage AJ tranche now
represents 100% of the transaction and PIMCO has received 46% of the bond’s face value in principal pay downs
− 2007 vintage AJ tranche now represents 0-30% versus 0-14% at time of purchase
− Improved financing to L+150 bps from L+225 bps at time of purchase
• Capitalized on market dislocations to acquireseasoned, short duration securities with solid carry profiles
• Represented attractive relative value when compared to new issue B-piece investments given the significant performance history of the underlying loans
• Potential upside as bond continues to de-lever over the next two years or as market recovers
• Purchased in limitedcompetition from a distressed hedge fund at a discount to fundamental value
• Acquired 2006 and 2007 vintage CMBS AJ tranches
• Controlling class positions • Top ten loans represented
between 60-70% of unpaid principal balance at purchase
• Underlying collateral is primarily office buildings located in core markets
As of 31 December 2016. SOURCE: PIMCO. Sample investment for illustrative purposes only. IRR represents the annualized internal rate of return for a specified period, based on capital contributed, expected distributions received and the residual value of unrealized investments. Multiple represents the ratio of (i) expected distributions received plus the residual value of unrealized investments to (ii) capital contributed. IRRs and multiples are net of deal-related expenses and gross of fund expenses. IRRs and multiples reflect PIMCO's views at the time of investment, and may no longer be accurate or reflect PIMCO's current views. Expected holding period and deal size / peak equity are subject to change. Underwritten IRR / multiple as of initial closing date. Current estimates of future returns may differ materially from the Underwritten IRR.Note: investment owned by BRAVO II; BRAVO III does not own such an investmentPast performance is not a guarantee or reliable indicator of future results. There can be no guarantee that the expectations identified will be met.The case study discussed herein has been selected as a representative example of the types of transactions that are intended to be pursued by BRAVO III and has not been selected based on performance.Refer to Appendix for additional investment strategy and risk information
100%
90%
80%
70%
60%
50%
40%
30%
20%
10%
0%
AJ
Duper
AM
AJ
Duper
AM
2007 vintage -at purchase
Cum
ulat
ive
loss
es
2007 vintage -current

16
Investment example: U.S. CRE CDO
Asset type CRE CDO
Location U.S. – various
Initial closing date August 2014
Deal size / peak equity $156 million / $156 million
Expected holding period 1-3 years
Leverage Unlevered
Underwritten IRR / multiple 16% / 1.4x
Acquire controlling position through purchases of mezzanine and the preferred equity tranche
Transaction summary Investment thesis Status update
• In July 2015 the fund purchased a 300 key hotel out of the CDO which was previously foreclosed on by the CDO servicer̵ Optimization of revenue management has led to
significant NOI growth
• In December 2015 the fund acquired a senior note collateralized by two hotels
• Effectuated auction in May 2016̵ Substantially de-levered the structure̵ Retained mezzanine and preferred equity tranches which
PIMCO believes could provide additional upside through active asset management of underlying assets
• Utilize controlling position to exercise auction call and liquidate assets at a premium to purchase price
• Potential upside due to preferred share holders’ right to make the final bid on all underlying asset sales during auction calls
• Capitalize on controlling class position to uniquely access underlying assets that PIMCO believes are priced at a discount to fundamental value
• Purchased in limited competition from a liquidating private equity fund at a discount to NAV
• Controlling class positions• Collateral primarily consists of loans, CMBS and CRE
CDOs
As of 31 December 2016. SOURCE: PIMCO. Sample investment for illustrative purposes only. IRR represents the annualized internal rate of return for a specified period, based on capital contributed, expected distributions received and the residual value of unrealized investments. Multiple represents the ratio of (i) expected distributions received plus the residual value of unrealized investments to (ii) capital contributed. IRRs and multiples are net of deal-related expenses and gross of fund expenses. IRRs and multiples reflect PIMCO's views at the time of investment, and may no longer be accurate or reflect PIMCO's current views. Expected holding period and deal size / peak equity are subject to change. Underwritten IRR / multiple as of initial closing date. Current estimates of future returns may differ materially from the Underwritten IRR.Note: investment owned by BRAVO II; BRAVO III does not own such an investmentPast performance is not a guarantee or reliable indicator of future results. There can be no guarantee that the expectations identified will be met.The case study discussed herein has been selected as a representative example of the types of transactions that are intended to be pursued by BRAVO III and has not been selected based on performance. Refer to Appendix for additional investment strategy and risk information
Preferred equity
Mezz
Senior
0%
25%
50%
75%
100%Capital stack
PIMCOOwned

17
Additional information

18
Consumer credit availability remains constrained
As of 30 June 2016. SOURCE: DTZ Research (top left), OECD (top right), University of Birmingham Financial Inclusion Report 2015 (bottom left), BIS (bottom right). Refer to Appendix for additional outlook information.
Near Prime Consumer
05
1015202530354045
Perc
ent
Surveys suggest consumers still find credit difficult to access
Just about getting by Finding it quite difficult Finding it very difficult
AUS
ESPGBR
IRL
ITASWE
USA80859095
100105110115120125130
2005 2006 2007 2008 2009 2010 2011 2012 2013 2014 2015
Hou
seho
ld D
ebt
to N
et D
ispo
sabl
e In
com
e (O
ECD
, Ind
exed
to
2005
)
Many geographies have meaningfully deleveraged
2%5%
7%
12%15%
18%
27%
13%
5%7%
9% 10%
13%
17%19%
20%
0%
5%
10%
15%
20%
25%
30%
300-499 500-549 550-599 600-649 650-699 700-749 750-799 800-850
Perc
ent
of p
opul
atio
n
FICO scores
Sizeable application for near-prime financing
Pre-2009 Apr '16
Bank credit to non-financial sector, % of GDP
2010 2011 2012 2013 2014 2015 Q2 ‘16 Change
Ireland 133 115 111 104 82 54 52 -61%
Portugal 151 152 149 140 127 118 115 -24%
Spain 165 159 148 135 124 114 115 -30%
United Kingdom 107 101 98 94 90 90 91 -15%

19
Investment flexibility is critical
Commercial or residential real estate
RE preferred equity
Corporate / portfolio acquisitions
Regulatory capital relief transactions
Structured credit (CMBS, RMBS, CLOs, etc.)
Credit default swaps
Financial institution debt
Equity or mortgage REIT investments during sell-offs
Financial institution equity or equity-linked securities
Private debt Newly originated mortgage or consumer
loans
Sub-performing or non-performing loan acquisitions
Mezzanine capital for CRE re-financings
Financing for mortgage servicing rights / single family rentals
CRE and homebuilder development financing
The ability to invest in cheap forms of risk is key to achieving attractive returns
Private debt
Private equity Public equity
Public debt
Note: the above represent potential Fund transactions, based on current market conditions, the Fund investment team’s experience and investments made or evaluated by prior PIMCO-advised investment funds. However, no assurance can be given that the Fund will actually make these or comparable investments. In addition, the Fund has a broad and flexible investment mandate, and is likely to make investments that are materially different from those described above.CMBS: Commercial mortgage-backed securities, RMBS: Residential mortgage-backed securities, CLO: Collateralized loan obligations, CRE: Commercial real estate, REIT: Real Estate Investment TrustRefer to Appendix for additional investment strategy and risk information.
20
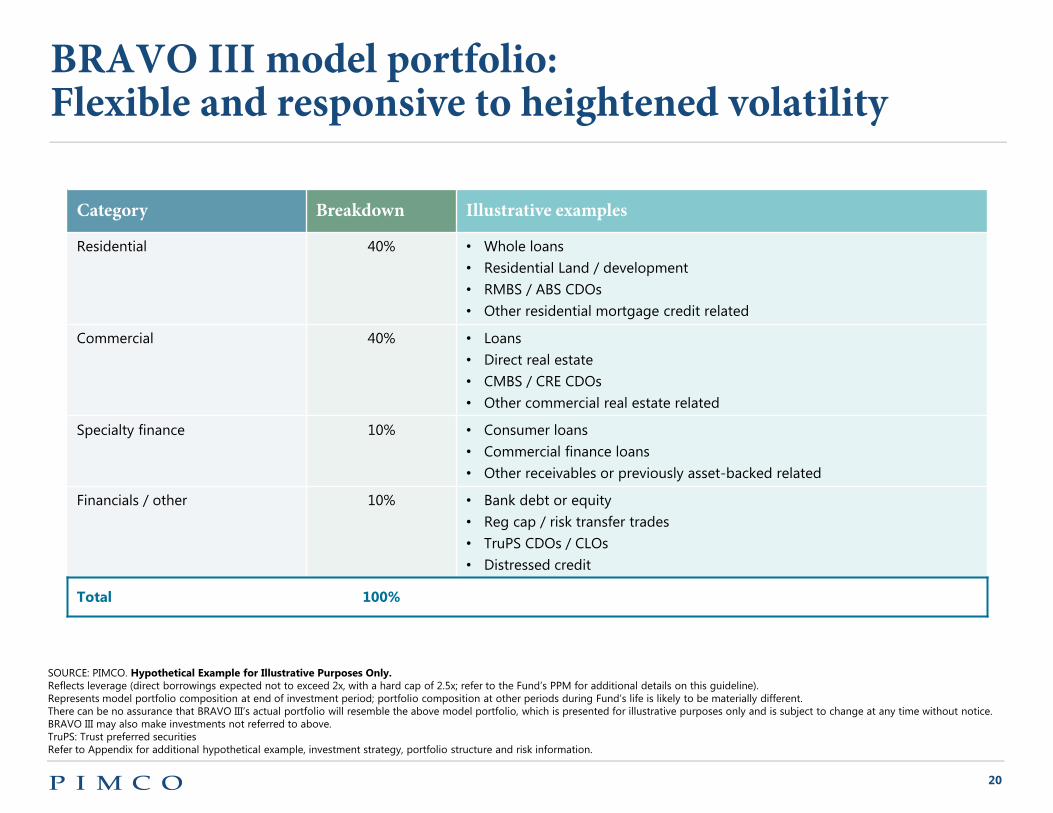
BRAVO III model portfolio:Flexible and responsive to heightened volatility
SOURCE: PIMCO. Hypothetical Example for Illustrative Purposes Only.Reflects leverage (direct borrowings expected not to exceed 2x, with a hard cap of 2.5x; refer to the Fund’s PPM for additional details on this guideline).Represents model portfolio composition at end of investment period; portfolio composition at other periods during Fund’s life is likely to be materially different.There can be no assurance that BRAVO III’s actual portfolio will resemble the above model portfolio, which is presented for illustrative purposes only and is subject to change at any time without notice. BRAVO III may also make investments not referred to above.TruPS: Trust preferred securities Refer to Appendix for additional hypothetical example, investment strategy, portfolio structure and risk information.
Category Breakdown Illustrative examples
Residential 40% • Whole loans• Residential Land / development• RMBS / ABS CDOs• Other residential mortgage credit related
Commercial 40% • Loans• Direct real estate • CMBS / CRE CDOs• Other commercial real estate related
Specialty finance 10% • Consumer loans• Commercial finance loans• Other receivables or previously asset-backed related
Financials / other 10% • Bank debt or equity• Reg cap / risk transfer trades• TruPS CDOs / CLOs• Distressed credit
Total 100%

21
Investment roadmapASSET
RESIDENTIAL
COMMERCIAL
SPECIALTY FINANCE
FINANCIALS
As of 31 December 2016Note: the above represent potential Fund transactions, based on current market conditions, the Fund investment team’s experience and investments made or evaluated by prior PIMCO advised investment funds. However, no assurance can be given that the Fund will actually make these or comparable investments. In addition, the Fund has a broad and flexible investment mandate, and is likely to make investments that are materially different from those described above.Refer to Appendix for additional investment strategy and risk information.
ILLUSTRATIVE STRATEGIES
• Buy and warehouse newly originated non-conforming loans with exit optionality through securitization
• Acquire interests in non-bank mortgage originations companies
• Purchase legacy loans from banks, government entities and other funds, retain exit optionality through securitization
• Provide alternative debt financing to CMBS or banks on transitional or secondary assets
• Structure NPL/SPL participations to address the EUR400bn+ of sub-performing European loans
• Pursue core versus non-core arbitrages through development or portfolio acquisitions
• Buy or enter into forward flow agreements with originators of consumer and commercial finance loans and other financial assets
• Provide warehouse and term financing to specialty finance companies
• Acquire equity and equity-like interests in privately-held specialty finance companies
• Provide regulatory relief to banks through bespoke structured transactions
• Acquire select bank capital holdings
ILLUSTRATIVE INVESTMENTS
• Forward flow arrangements to acquire newly originated U.S. non-QM loans
• Control investment in non-bank mortgage originator• Acquisition of UK second lien mortgage pools from
institutions exiting businesses now considered “non core”
• Mezzanine loan on a mixed use development project• Wholesale-to-retail arbitrages in Bay Area office and UK
retail portfolios• Controlling stake in a European investment development
company
• Preferred equity investment in a diversified specialty finance company in Ireland
• Joint venture with specialty finance company to originate trade receivables in Spain
• PE investment in a specialty finance company engaged in regulatory capital relief transactions
• Senior secured debt from a bad bank institution

22
Monetize illiquidity premiums through structuring
Performing loans
Non-performing loans
Risk-transfer
Complex credit
Distressed securities
New issue securitiesBridge loans
Mortgage loans
Public Private
Seco
ndar
yPr
imar
y
Restructure
Seas
on
Note: the above represent potential Fund transactions, based on current market conditions, the Fund investment team’s experience and investments made or evaluated by prior PIMCO-advised investment funds. However, no assurance can be given that the Fund will actually make these or comparable investments. In addition, the Fund has a broad and flexible investment mandate, and is likely to make investments that are materially different from those described above.Refer to Appendix for additional investment strategy and risk information.

23
9.1%11.0%
35.4% 34.3%
22.4%
12.3%
0%
5%
10%
15%
20%
25%
30%
35%
40%
DMF² DiSCO³ DMF II⁴ TALF⁵ BRAVO⁶ BRAVO II⁷
Since inception net IRR DISTRIBUTING INVESTINGMATURED
Vintage 2008 2008 2009 2009 2011 2013
Committedcapital ($mm) $2,867 $2,681 $610 $1,502 $2,345 $5,495
Net multiple 1.4x 1.4x 2.9x 1.4x 1.8x 1.3x
Focus Senior non-Agency MBS, ABS CDOs Senior structured credit Senior non-Agency
MBS, ABS CDOsSenior CMBS,
Consumer ABS
Broad range of commercial, residential, consumer & financial
assets
Broad range of commercial, residential, consumer & financial
assets
PIMCO’s track record in comparable opportunistic PE-style funds¹
As of 31 December 2016. SOURCE: PIMCO. Please note all the funds presented above are closed to new investors.The data contained in this section is for information purposes only and should not be treated or relied on by any person as an offer, placement, invitation, inducement or any other type of solicitation or promotion with respect to any transferable security, unit in a collective investment undertaking, or other financial instrument to which the data relates or may relate.The above table provides information about the returns of certain other investment funds sponsored by PIMCO whose primary investment strategies include or included mortgage and real estate-related assets that are distressed and/or undervalued due to market dislocations or other factors. Past performance is not indicative of future results, and there can be no assurance that the Fund will be able to implement its investment strategy or achieve any particular level of returns (including returns comparable to the above funds or any other funds advised by PIMCO).Please see the Appendix for the footnotes relating to the above chart and additional information.
24
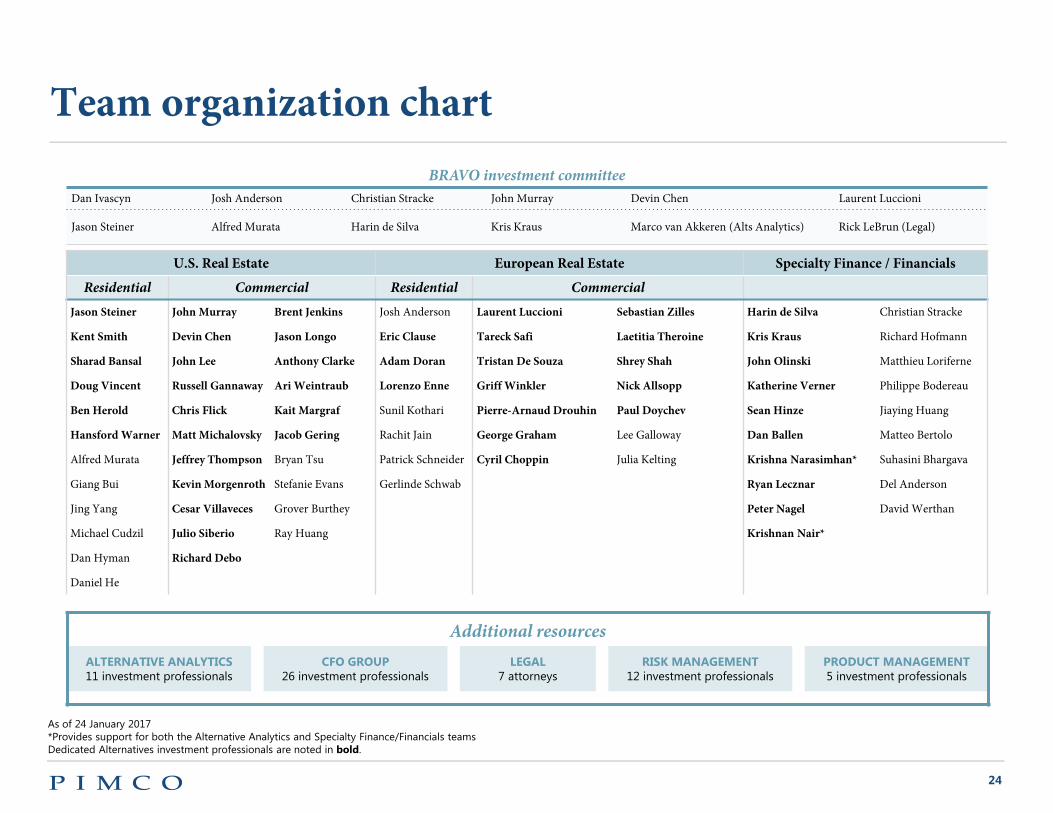
Team organization chart
As of 24 January 2017*Provides support for both the Alternative Analytics and Specialty Finance/Financials teamsDedicated Alternatives investment professionals are noted in bold.
BRAVO investment committeeDan Ivascyn Josh Anderson Christian Stracke John Murray Devin Chen Laurent Luccioni
Jason Steiner Alfred Murata Harin de Silva Kris Kraus Marco van Akkeren (Alts Analytics) Rick LeBrun (Legal)
U.S. Real Estate European Real Estate Specialty Finance / FinancialsResidential Commercial Residential Commercial
Jason Steiner John Murray Brent Jenkins Josh Anderson Laurent Luccioni Sebastian Zilles Harin de Silva Christian Stracke
Kent Smith Devin Chen Jason Longo Eric Clause Tareck Safi Laetitia Theroine Kris Kraus Richard Hofmann
Sharad Bansal John Lee Anthony Clarke Adam Doran Tristan De Souza Shrey Shah John Olinski Matthieu Loriferne
Doug Vincent Russell Gannaway Ari Weintraub Lorenzo Enne Griff Winkler Nick Allsopp Katherine Verner Philippe Bodereau
Ben Herold Chris Flick Kait Margraf Sunil Kothari Pierre-Arnaud Drouhin Paul Doychev Sean Hinze Jiaying Huang
Hansford Warner Matt Michalovsky Jacob Gering Rachit Jain George Graham Lee Galloway Dan Ballen Matteo Bertolo
Alfred Murata Jeffrey Thompson Bryan Tsu Patrick Schneider Cyril Choppin Julia Kelting Krishna Narasimhan* Suhasini Bhargava
Giang Bui Kevin Morgenroth Stefanie Evans Gerlinde Schwab Ryan Lecznar Del Anderson
Jing Yang Cesar Villaveces Grover Burthey Peter Nagel David Werthan
Michael Cudzil Julio Siberio Ray Huang Krishnan Nair*
Dan Hyman Richard Debo
Daniel He
Additional resourcesALTERNATIVE ANALYTICS11 investment professionals
CFO GROUP26 investment professionals
LEGAL7 attorneys
RISK MANAGEMENT12 investment professionals
PRODUCT MANAGEMENT5 investment professionals
25
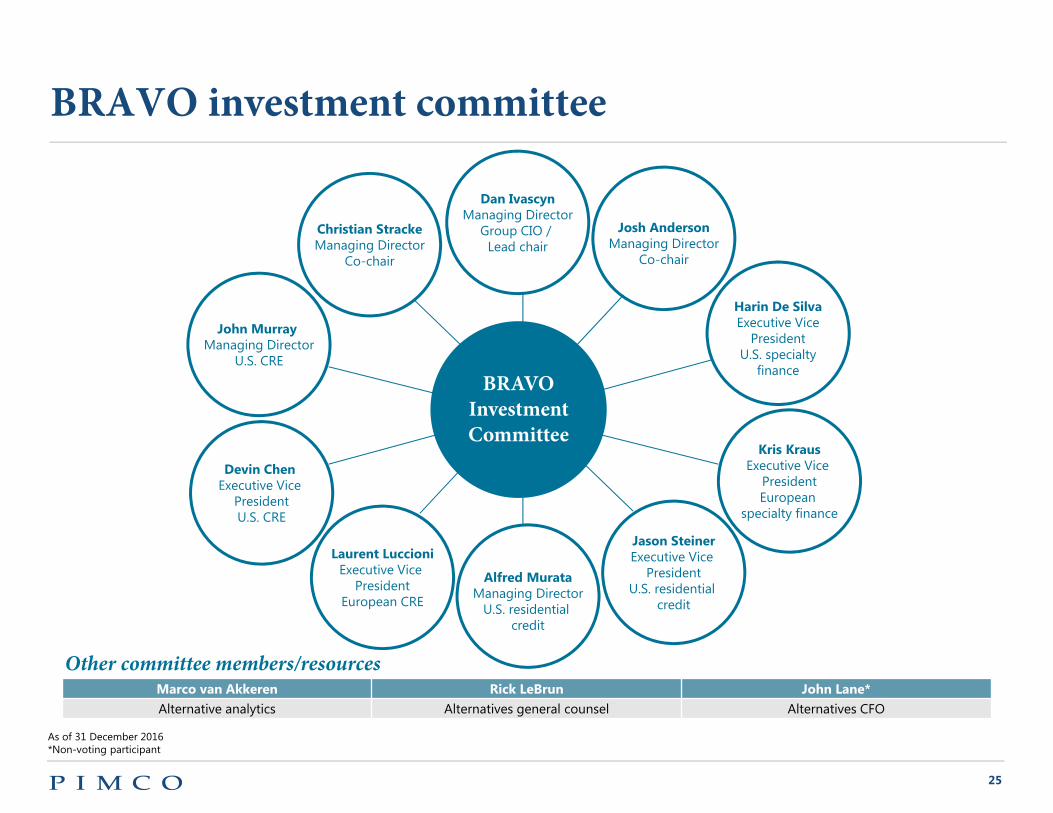
BRAVO investment committee
Jason SteinerExecutive Vice
PresidentU.S. residential
credit
John Murray Managing Director
U.S. CRE
Marco van Akkeren Rick LeBrun John Lane*Alternative analytics Alternatives general counsel Alternatives CFO
Kris KrausExecutive Vice
PresidentEuropean
specialty finance
Other committee members/resources
Dan IvascynManaging Director
Group CIO / Lead chair
Josh AndersonManaging Director
Co-chair
Harin De SilvaExecutive Vice
PresidentU.S. specialty
finance
Alfred MurataManaging Director
U.S. residential credit
Laurent LuccioniExecutive Vice
PresidentEuropean CRE
Devin Chen Executive Vice
PresidentU.S. CRE
Christian StrackeManaging Director
Co-chair
As of 31 December 2016*Non-voting participant
BRAVOInvestment Committee

26
Additional notes on PIMCO’s track record in comparable opportunistic PE-style funds (page 23)1 All funds presented are private equity-style investment funds. PIMCO manages or has managed other funds with different structures (e.g., hedge funds) whose primary investment strategies include or included similar asset classes; information about such funds is not presented herein. Assumes that BRAVO and BRAVO II are each liquidated as of December 31, 2016 (such date is the “Reference Date”). DMF II concluded operations on April 29, 2013 (a final de minimis distribution was made in September 2013), DMF concluded operations on November 16, 2012 (a final de minimis distribution was made in April 2013), DiSCO concluded operations on March 5, 2012 (a final de minimis distribution was made in late October 2012), and TALF concluded operations on June 7, 2011. The returns for DMF and DMF II are subject to further changes as a result of the fund’s final audit. Except for any Gross IRRs presented, the returns for each fund have been calculated net of all fees (including management fees and administration fees), expenses (including any expenses associated with leverage) and realized and unrealized carried interest and are shown since the date of the initial capital call of each fund (i.e., January 14, 2011 (for BRAVO); March 19, 2013 (for BRAVO II); October 31, 2007 (for DMF); December 1, 2008 (for DMF II); July 7, 2008 (for DiSCO); and June 2, 2009 (for TALF). IRR represents the annualized internal rate of return for the period indicated (i.e., from the initial capital call date through the date on which operations concluded or, for the Active Prior Funds (as defined below), the Reference Date), based on capital contributions by investors, distributions to investors and (for the Active Prior Funds) the residual value of unrealized investments. Multiple represents the ratio of (i) distributions to investors plus (for the Active Prior Funds) the residual value of unrealized investments (net of fees, expenses and realized/unrealized carried interest) to (ii) capital contributions by investors. The returns shown above are those of each fund complex as a whole (i.e., the master fund and feeder funds). Returns to specific fund investors were different due to (among other factors) the impact of (i) fee and/or carried interest/performance allocation reductions, (ii) tax considerations applicable to different investors and (iii) certain investors electing or being required to prepay their entire commitments upon admission. In addition, the returns shown above take into account management fee and carried interest/performance allocation waivers granted to employee and affiliated investors and generally unavailable to third party investors, although such waivers did not materially impact fund returns. The returns for each fund reflect the use of leverage, which can magnify returns and/or make returns more volatile. The investment performance of each fund has been calculated on the basis of both net cash flows generated from the disposition of realized investments and, with respect to unrealized investments of the Active Prior Funds, estimated net cash flows as though such investments were disposed of at their valuations determined as of the Reference Date. In many cases these unrealized investments were “fair valued” as of the Reference Date. With respect to the performance returns for funds with unrealized investments, actual returns will vary from the estimates and the variations may be significant. Each of the funds listed above has one or more feeder funds that invest or invested all or substantially all of its assets in such fund. The performance of such feeder funds may differ from the performance listed in the chart above due to different fee and expense arrangements and/or tax consequences.2 DMF has concluded operations and made a liquidation distribution to limited partners on November 16, 2012 (a final de minimis distribution was made in April 2013).3 DiSCO has concluded operations and made a liquidation distribution to its limited partners on March 5, 2012 (a final de minimis distribution was made in late October 2012).4 DMF II concluded operations and made a liquidation distribution to limited partners on April 29, 2013 (a final de minimis distribution was made in September 2013).5 TALF has concluded operations and made a final distribution to its limited partners on June 7, 2011. 6 As of December 6, 2013, BRAVO had called 100% of its committed capital.7 Investment period has not ended. As of December 31, 2016, BRAVO II had called 80.0% of its committed capital.
With respect to the Active Prior Funds (as defined below), the returns above represent the net return as of the applicable Reference Date, may have changed since such date, include both realized and unrealized returns and are likely to change over the life of these funds.
BRAVO and BRAVO II seek to capitalize on capital infusion and risk disposition opportunities across the financial system, including residential and commercial real estate investments. DMF II and DMF sought to capitalize on the historic dislocation in the U.S. and global mortgage markets. DiSCO sought to capitalize on the liquidity crisis in senior bonds across credit markets primarily in MBS, ABS, CMBS, investment grade and high yield. TALF sought to capitalize on government-guaranteed, non-recourse financing of TALF-eligible consumer ABS and CMBS. BRAVO and BRAVO II (collectively, the “Active Prior Funds”) continue to be implemented based on their respective investment strategies; DMF II, DMF, DiSCO and TALF (collectively, and together with the Active Prior Funds, the “Prior Funds”) have concluded operations. The Prior Funds are closed to new investors and have different overall investment strategies, risks and investment considerations than the Fund.
PIMCO believes that the performance records of these Prior Funds are relevant to prospective investors because PIMCO expects that mortgage and real estate-related assets that are distressed and/or undervalued due to market dislocations or other factors are expected to constitute a significant part of the overall strategy of PIMCO BRAVO Fund III (the “Fund”). In addition, while the Fund’s investment team is not the same as the teams that are responsible for the performance of the Prior Funds, there is substantial overlap between the Prior Funds’ investment teams and the Fund’s investment team. PIMCO has managed and continues to manage a number of other private investment vehicles whose performance is not presented because they utilized or utilize different investment strategies, they utilized or utilize different investment structures, and/or they were or are managed by different teams; the performance of those other funds is different from the performance of the Prior Funds listed above. The performance of the Prior Funds was achieved during periods of extreme market dislocations that presented unique opportunities that may not repeat and is due in part to a general recovery in the securitized product sector that also may have been unique. Certain of the Prior Funds benefitted from financing terms (including the availability of financing through the U.S. Federal Reserve’s Term Asset-Backed Securities Loan Facility program) that are not expected to be available to the Fund; in addition, the utilization of leverage contributed to the Prior Funds’ performance, and there can be no assurance that the Fund will utilize leverage in a similar manner or to a similar extent.
Appendix
GCOF_appendix_01

27
The Prior Funds’ strategies, although similar to the Fund’s strategy in some respects, are substantially different in other respects; in addition, the Prior Funds have broad investment mandates and/or have significant flexibility to invest in assets other than mortgage and real estate-related assets that are distressed and/or undervalued due to market dislocations or other factors. Because of these differences and other factors, the performance of the Prior Funds should not be considered to be predictive of the Fund’s performance.
Past performance is not indicative of future results and no assurance can be made that the Fund will achieve returns comparable to the Prior Funds. One or more of the Prior Funds have different fee, profit allocation and expense arrangements than each other and the Fund. Performance in a particular fund may vary because of differing fees and expenses (e.g., distribution or organizational expenses), the effect of investing through “blockers” or parallel vehicles or other reasons. Additional fee, expense and carried interest/performance allocation information for these funds is available upon request.
Any investment decision should be based only on the Fund’s private placement memorandum (the “PPM”), limited partnership agreement, subscription agreement and other definitive Fund documents (the “Documents”), which shall govern in the event of any conflict with the information contained herein. You must rely only on the information in the Documents in making any decision to invest.
This information is being furnished to you solely for the purpose of giving you a preliminary indication of the strategy and structure of the Fund and is not to be used for any other purpose or made available to anyone not directly concerned with your evaluation of the possibility of requesting further information regarding an investment. The summary of the structure and other information for the Fund mentioned in the presentation are not and do not purport to be complete, and are qualified by and will be subject to Documents. If the Fund is launched and you express an interest in investing in the Fund, an offer will be made by, and you will be provided with, the Documents.
This summary is for informational purposes only, and does not constitute an offer to sell, or a solicitation of an offer to buy, interests in the Fund described above or to participate in any trading strategy. In the event that an offer were to be made, any such offer would be made only after a prospective purchaser has had the opportunity to conduct its own independent evaluation of the Fund and has received all information required to make its own investment decision, including a copy of Documents, which will contain material information not included herein and to which prospective purchasers are referred. This summary is intended solely to determine the level of interest, if any, in the Fund. No person has been authorized to give any information or to make any representation with respect to the Fund other than those contained in this summary and, if given or made, such information or representations must not be relied upon as having been authorized. Each prospective investor should consult its own counsel, accountant, or tax or business adviser as to legal, accounting, regulatory, tax and related matters, as well as economic risks and merits, concerning the possibility of making an investment in the Fund.
PERFORMANCE AND FEESPast performance is not a guarantee or a reliable indicator of future results. The Fund’s fees are discussed within the PPM.
FORECASTForecasts, estimates and certain information contained herein are based upon proprietary research and should not be considered as investment advice or a recommendation of any particular security,strategy or investment product. There is no guarantee that results will be achieved.
HYPOTHETICAL EXAMPLEHypothetical example for illustrative purposes only. No representation is being made that any account, product, or strategy will or is likely to achieve profits, losses, or results similar to those shown.Hypothetical or simulated performance results have several inherent limitations. Unlike an actual performance record, simulated results do not represent actual performance and are generally preparedwith the benefit of hindsight. There are frequently sharp differences between simulated performance results and the actual results subsequently achieved by any particularaccount, product or strategy. In addition, since trades have not actually been executed, simulated results cannot account for the impact of certain market risks such as lack of liquidity. There arenumerous other factors related to the markets in general or the implementation of any specific investment strategy, which cannot be fully accounted for in the preparation of simulated results and allof which can adversely affect actual results.
INVESTMENT STRATEGYThere is no guarantee that the Fund’s investment strategies will work under all market conditions. Each investor should evaluate its ability to invest long-term, especially during periods of downturn in the market.
Appendix
GCOF_appendix_01

28
MANAGEMENT TEAMThe individuals referred to herein may not continue to be employed by PIMCO during the entire term of the Fund. Furthermore, the composition, structure and/or operations of the Fund investment committee may change from time to time (or the Fund may cease to have an investment committee), each without the consent of or notice to limited partners. In addition, a number of members of the professional staff of PIMCO are investors in other funds advised by PIMCO and are actively involved in managing the investment decisions of these funds, as well as investment decisions of other clients of PIMCO. Accordingly, the members of the professional staff of PIMCO will have demands on their time for the investment, monitoring and other functions of other funds and other clients advised by PIMCO.
OUTLOOKStatements concerning financial market trends or portfolio strategies are based on current market conditions, which will fluctuate. Outlook and strategies are subject to change without notice.
PORTFOLIO STRUCTUREPortfolio structure is subject to change without notice and may not be representative of current or future allocations.
RISKThe Fund will not be subject to the same regulatory requirements as mutual funds. The Fund is expected to be leveraged and to engage in speculative investment practices that will increase the risk of investment loss. The Fund performance could be volatile; an investor could lose all or a substantial amount of its investment. The Fund manager will have broad trading authority over the Fund. The use of a single adviser applying generally similar trading programs could mean lack of diversification and, consequently, higher risk. The Fund will not be restricted to tracking a particular benchmark. There is no secondary market for investors’ interest and none is expected to develop. There will be restrictions on transferring interests in the Fund and limited liquidity provisions. The Fund’s fees and expenses may offset the its trading profits. The Fund will not be required to provide periodic pricing or valuation information to investors. The Fund will involve complex tax structures and there may be delays in distributing important tax information.
A purchase of Fund interests involves a high degree of risk that each prospective investor must carefully consider prior to making such an investment. Investors should thoroughly review the PPM for a more complete description of these risks. Prospective investors are advised that investment in the Fund is suitable only for persons of adequate financial means who have no need for liquidity with respect to their investment and who can bear the economic risk, including the possible complete loss, of their investment.
CERTAIN RISKSThe Fund’s investments are expected to give rise to numerous risks. Investments in residential/commercial mortgage loans and consumer loans are subject to risks that include prepayment, delinquency, foreclosure, risks of loss, servicing risks and adverse regulatory developments, which risks may be heightened in the case of non-performing loans. The Fund will also have exposure to such risks through its investments in mortgage and asset-backed securities, which are highly complex instruments that may be sensitive to changes in interest rates and subject to early repayment risk. Structured products such as collateralized debt obligations are also highly complex instruments, typically involving a high degree of risk; use of these instruments may involve derivative instruments that could lose more than the principal amount invested. The Fund will also be subject to real estate-related risks, which include new regulatory or legislative developments, the attractiveness and location of properties, the financial condition of tenants, potential liability under environmental and other laws, as well as natural disasters and other factors beyond the Fund’s control. Equity investments may decline in value due to both real and perceived general market, economic and industry conditions, while debt investments are subject to credit, interest rate and other risks. Investing in banks and related entities is a highly complex field subject to extensive regulation, and investments in such entities or other operating companies may give rise to control person liability and other risks. In addition, there can be no assurance that PIMCO’s strategies with respect to any investment will be capable of implementation or, if implemented, will be successful. Investing in foreign denominated and/or domiciled securities may involve heightened risk due to currency fluctuations, and economic and political risks. The current regulatory climate relating to the Fund and its investments is uncertain and rapidly evolving and future developments could adversely affect the Fund and/or its investments. The foregoing is only a description of certain key risks relating to the Fund’s investments, and is not a complete enumeration of all risks to which the Fund will be subject. The Fund will be subject to numerous other risks not described herein. Prospective investors must carefully review the Documents (including, without limitation, the risk factors contained in the PPM) prior to making any investment decision.
TARGET RETURNThe Target Return is not a guarantee, projection or prediction and is not indicative of future results of the Fund. There can be no assurance that the Fund will achieve the Target Return and actual results may vary significantly from the Target Return. Investors may experience different investment returns as a result of (among other things) having pre-funded their commitments due to the difference in timing between the date on which such investors pre-fund and the application of their capital contributions in satisfaction of a capital call. An investor may lose all of its money by investing in the Fund.
Appendix
GCOF_appendix_01

29
Actual gross returns in any given year may be lower than the Target Return. Even if the Target Return is met, actual returns to investors will be lower due to expenses, taxes, structuring considerations and other factors. In addition, the Target Return may be adjusted without notice to investors in light of available investment opportunities and/or changing market conditions. PIMCO believes that the Target Return is reasonable based on a combination of factors, including the Fund’s investment team’s general experience, the availability of leverage and financing at expected times, amounts, costs and other terms and an assessment of prevailing market conditions and investment opportunities. There are, however, numerous assumptions that factor into the Target Return that may not be consistent with future market conditions and that may significantly affect actual investment results. Such assumptions include (i) the ability to source and acquire attractively priced assets; (ii) the expected response of specific investments to market conditions; (iii) the availability of leverage for certain investments at expected terms; and (iv) PIMCO’s outlook for certain global and local economies and markets as it relates to potential changes to the regulatory environment, interest rates, growth expectations, residential and commercial real estate or consumer fundamentals and the health of the economy. No representation or warranty is made as to the reasonableness of the assumptions made or that all assumptions used in calculating the Target Return have been stated or fully considered. Prospective investors reviewing the Target Return contained herein must make their own determination as to the reasonableness of the assumptions and the reliability of the Target Return. Actual results and events may differ significantly from the assumptions and estimates on which the Target Return is based.
The Target Return reflects in part the measure of risk that the Fund’s general partner expects to take with respect to Fund investments. The Fund may make investments for which the general partner’s cash flow analysis indicates a higher or lower target return. Actual returns from an investment in the Fund over any given time horizon may vary significantly from the Target Return.
This material contains the current opinions of PIMCO and such opinions are subject to change without notice. There can be no assurance that such opinions are or will remain accurate, or that other opinions or methodologies would not produce different results. This material has been distributed for informational purposes only and should not be considered as investment advice or a recommendation of any particular security, strategy or investment product. None of the Fund, PIMCO or any of their affiliates shall have any duty to update any of the information presented herein.
Information contained herein has been obtained from sources believed to be reliable, but not guaranteed.
INDEXES/BENCHMARKSReferences to the MSCI US REIT Index and any other benchmark(s) referred to herein are for illustrative purposes only. Any such benchmarks are included merely to show general trends in the markets in the periods indicated and are not intended to imply that the Fund’s portfolio will be similar to any such benchmarks, either in composition or element of risk or otherwise. The Fund will not attempt to track a benchmark and there is no guarantee that the Fund will meet or exceed any benchmark.
The Barclays U.S. Corporate High-Yield Index the covers the USD-denominated, non-investment grade, fixed-rate, taxable corporate bond market. Securities are classified as high-yield if the middle rating of Moody’s, Fitch, and S&P is Ba1/BB+/BB+ or below. The index excludes Emerging Markets debt.
The Markit CMBX index is a synthetic tradable index referencing a basket of 25 commercial mortgage-backed securities.
The MSCI US REIT Index is a free float market capitalization weighted benchmark that is comprised of equity REIT securities that belong to the MSCI US Investable Market 2500 Index. The index is designed to cover about two-thirds of the value of the entire U.S. REIT market.It is not possible to invest directly in an unmanaged index.
Appendix
GCOF_appendix_01