Pilot Study to Evaluate the Effectiveness of DTBird in Reducing … Pilot Study... · Multi-season...
22
Pilot Study to Evaluate the Effectiveness of DTBird in Reducing Risk of Golden Eagles and Other Raptors Colliding with Operational Wind Turbines Jeff P. Smith, Jeff A. Zirpoli, Kristina M. Wolf Judd A. Howell, and Scott B. Terrill H. T. Harvey & Associates–Los Gatos, California Photo by S. Rottenborn Presented at the NWCC Wind Wildlife Research Meeting XII–November 2018
Transcript of Pilot Study to Evaluate the Effectiveness of DTBird in Reducing … Pilot Study... · Multi-season...

Pilot Study to Evaluate the Effectiveness of DTBirdin Reducing Risk of Golden Eagles and Other Raptors
Colliding with Operational Wind Turbines
Jeff P. Smith, Jeff A. Zirpoli, Kristina M. WolfJudd A. Howell, and Scott B. Terrill
H. T. Harvey & Associates–Los Gatos, California
Photo by S. Rottenborn
Presented at the NWCC Wind Wildlife Research Meeting XII–November 2018

Study Goal
Evaluate effectiveness of DTBird automated detection and audio deterrent system in reducing the risk of Golden Eagles and other raptors entering the rotor swept zone (RSZ) of operating turbines
First rigorous pilot study of technology in North America
Photo by S. Rottenborn

American Wind Wildlife Institute– Research Sponsor/Facilitator
Liquen Consultoría Ambiental, S.L. – DTBird Vendor
Avangrid Renewables – Facility Operator & Funding
EDF Renewables – Funding Partner
Alta Environmental Services – UAV Provider & Pilot
AUV Flight Services – UAV Provider & Pilot
Project Sponsors/Collaborators

Video cameras (4; 6 MP) track objects againstdaytime skies, calibrated for targeted wingspan(s)
When turbine spinning, speakers (4) emit warningand stronger dissuasion deterrent signals attrigger distances calibrated for focal birds
System records timestamped detection anddeterrent event data and video clips
Analysts use on-line digital analysis platformto classify / evaluate detected objects andexport data / video clips for further analysis
DTBird System Overview
camera
speakers

Detection and tracking based on expectedpixel occupancy for birds of targeted size
Theoretical maximum detection range of 240–300 m for eagle (1.8–2.3 m wingspan)with wings fully exposed to camera
Smaller birds trigger events at closerdistances proportional to size
System does not distinguish birds from other airborne objects, butfiltering reduces false positives (detections of non-target objects)
Simultaneous tracking of multiple birds across camera viewsheds, but does not produce independent DAP event records
DTBird Detection System
Species-specific ID is difficult

DTBird Deterrent System Audio deterrents trigger at calibrated
distances depending on potential risk level
Above red line: high risk of entering RSZ
• Warning 170 – 240 m
• Dissuasion 0 – 170 m
Below red line: lower risk
• Detection only 170 – 240 m
• Warning 100 – 170 m
• Dissuasion 0 – 100 m
Signaling continues (no new event records)until all tracked objects exit response envelope + 25 sec
RSZ

Study Objectives Evaluate detection module using eagle-like UAVs (drones)
• Rigorous evaluation of detection and deterrent-triggering response envelopes and influence of flight and visibility factors
• Estimate probability of detection
Evaluate deterrence module by assessing behavioral responses of in situ Golden Eagles and other raptors revealed in DTBird videos
• Estimate probability of deterrence
Probability of detection X probability of deterrence
• Estimate potential for reducing risk of entering RSZ
Evaluate false-positive rates and system performance reliability

Study Site – Antelope Valley, California
Manzana Wind Power Project – Avangrid Renewables
126 1.5-MW turbines
Mojave desert foothills of Tehachapi Mountains
Known local eagle activity

DTBird Study Setup
Seven systems installed
Strategic placement:
• known eagle activity
• habitat diversity
• efficient network integration
• UAV flight trial logistics
Analyzed event data from December 2016 through August 2017

UAV Flight Trials
Eagle-like UAVs – high-precision GPS tracking and avionics flight-data recording
Multi-season sampling at all installations
Stratified – distance, altitude, orientation, and trajectory – random transect arrays
Automated missions plus manual low-altitude flights
Limited by winds>10 m/sec andmoisture in air

Example Session Array of Flight Tracks and Triggered DTBird Events
• Inner sphere represents RSZ• Outer hemisphere represents 240-m
theoretical maximum detection range for UAV / Golden Eagle with 1.8-m wingspan
Detection
Warning
Dissuasion
UAV Flight Trials
UAV Flight Tracks
240-m detection rangeAuto-loiter protocol ensuresindependent flight segments
Clipped to remove loiter tracks
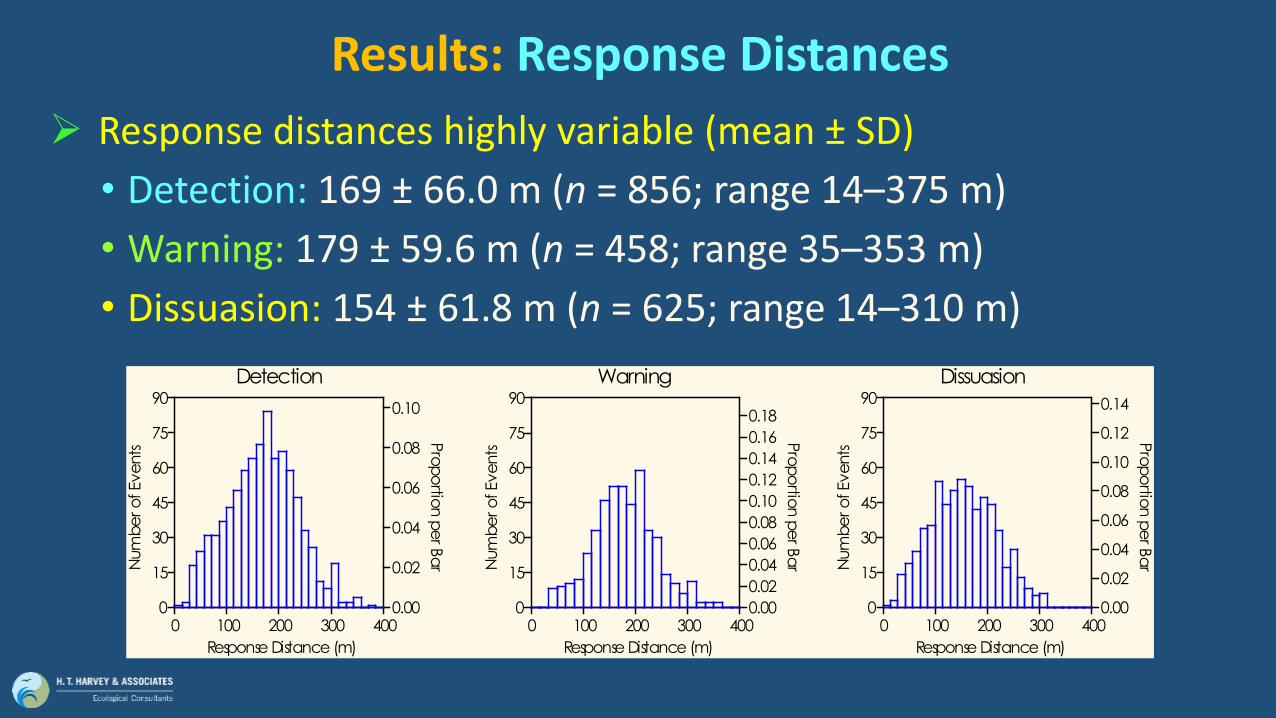
Results: Response Distances
Response distances highly variable (mean ± SD)
• Detection: 169 ± 66.0 m (n = 856; range 14–375 m)
• Warning: 179 ± 59.6 m (n = 458; range 35–353 m)
• Dissuasion: 154 ± 61.8 m (n = 625; range 14–310 m)
Detection
0 100 200 300 400
Response Distance (m)
0
15
30
45
60
75
90
Num
be
ro
fEve
nts
0.00
0.02
0.04
0.06
0.08
0.10
Pro
po
rtion
pe
rBa
r
Dissuasion
0 100 200 300 400
Response Distance (m)
0
15
30
45
60
75
90
Num
be
ro
fEve
nts
0.00
0.02
0.04
0.06
0.08
0.10
0.12
0.14
Pro
po
rtion
pe
rBa
r
Warning
0 100 200 300 400
Response Distance (m)
0
15
30
45
60
75
90
Num
be
ro
fEve
nts
0.00
0.02
0.04
0.06
0.08
0.10
0.12
0.14
0.16
0.18
Pro
po
rtion
pe
rBa
r

Results: Response Distance GLMM AIC-based evaluation of generalized linear mixed-effects models:
Response distance ≈ Turbine ID (random effect) + Event Type + UAV ID +visibility factors + flight/position variables + selected 2-way interactions
Flight / position / visibility predictors retained in top model:
• Cloud Cover: Highest detectability under whitish mostly cloudy skies and poorest under highly variable partly cloudy skies
• Solar Irradiation: Reduced detectability when sun at moderate elevation angles produces more glare
• Roll/Pitch, Climb Rate, and Wind Speed: Improved detectability when variable movement increases relative exposure of UAV profile
• UAV Elevation Angle x Relative Altitude: Improved detectability mid-viewshed; poorer for low approach or when high overhead

Results: Probability of Detection
Flight segments isolated as independent sampling units
Proportion matched with a DTBird detection event =overall probability of detecting eagle-like UAV
Average overall detectability across turbines:63 ± 10% (SD)
Detectability in selected distance bands:>230 m: ≈51% 80–140 m: >85% <80 m: <60%

Results: Probability of Detection
Reduced for south-facing cameras - sun glare Reduced toward E-SE with morning sun Improved with midday sun overhead
0
1000
2000
3000
4000
5000
Camera 1
(West)
Camera 2
(South)
Camera 3
(East)
Camera 4
(North)
De
tec
tio
n E
ve
nts
All Detections
Confirmed Non-
UAV Detections
Confirmed UAV
Detections x 5 GLMM relating probability of detection to hour-of-day and sun exposure

Evaluating Deterrent Responses of In Situ Raptors
Randomized sampling of ≈5,000 of 16,000 DTBird event records from January–August and classification of raptor deterrent responses
Flight diversions >15° away from risk and attendant changes in flight style indicative of successful deterrence
Logistic regression to evaluate influence of wind speed and month on probability of deterrencea
Photo by G. Lau Photo by B. Schmoker
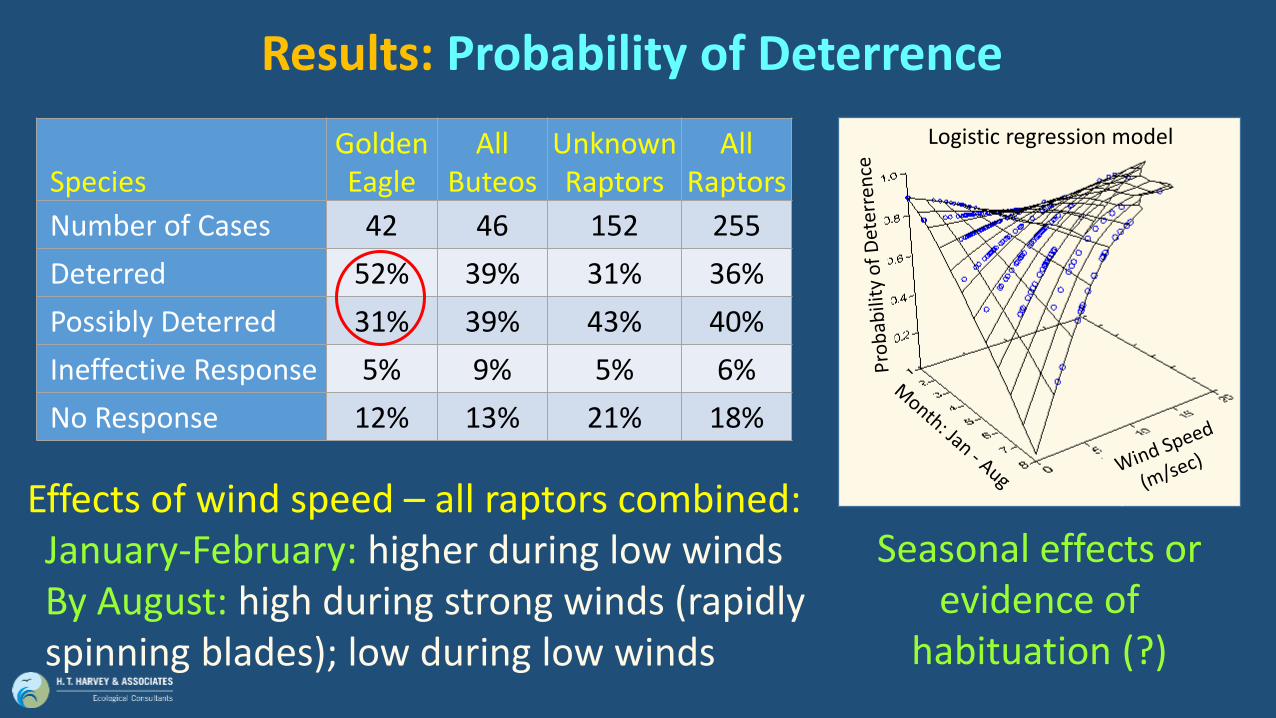
Results: Probability of Deterrence
Effects of wind speed – all raptors combined:January-February: higher during low windsBy August: high during strong winds (rapidlyspinning blades); low during low winds
SpeciesGolden Eagle
AllButeos
UnknownRaptors
All Raptors
Number of Cases 42 46 152 255
Deterred 52% 39% 31% 36%
Possibly Deterred 31% 39% 43% 40%
Ineffective Response 5% 9% 5% 6%
No Response 12% 13% 21% 18%
Seasonal effects orevidence of
habituation (?)
Logistic regression model

Results: Estimated Reduction in Risk of Entering RSZ
Golden Eagles: 33–53%
• Minimum = estimated probability of detecting eagle-like UAV (63%) X “successful” probability of deterring Golden Eagle (52%)
• Maximum = 63% probability of detection X “successful + possible” probability of deterring Golden Eagle (83%)
All Raptors: 24–62%
Photo by S. Rottenborn

Caveats
Results indicative of potential for risk reduction at individual turbines – not at facility level – in similar circumstances
Ultimate feasibility and effectiveness dependent on:
• Site layout and placement of DTBird systems
• Landscape setting and environmental conditions
• Site-specific eagle/raptor occurrence and behavior
• False-positive deterrent triggering – potential habituation effects and disturbance of nearby residents and nontarget wildlife
• Feasibility and cost of integration into existing infrastructure
• Longevity, durability, and maintenance needs of equipment
Photo by S. Rottenborn

Management Implications & Further Research
Technology has potential to reduce collision risk for eagles / raptors
Results mostly consistent with other European pilot studies
Further testing required to:
• Expand/refine analyses of performance nuances
• Evaluate potential for habituation to influencelong-term deterrent effectiveness
• Conduct similarly rigorous testing at facilitiesin other landscape settings
• Formulate robust recommendations forsystem improvement
Photo by E. Baker

Publicly AvailableTechnical Report
https://awwi.org/resources/dtbird-technical-report
Forthcoming Research
2019–2021 expansion to WA study site
sponsored by U.S. Department of Energy

For more information contact:Dr. Jeff Smith, Associate Ecologist
H. T. Harvey & [email protected]
408-458-3245www.harveyecology.com