Managing Visual Studio Standard subscriptions (MSDN Subscriptions)
No subscription can be received on the basis of these financial statements. Subscriptions may only be accepted on the basis of the current prospectus accompanied by an application form, the key investor information documents, the latest available annual report of the fund and the latest semi-annual report if published thereafter.
Merrill Lynch Investment Solutions
Unaudited semi-annual report as at September 30, 2016
Société d’Investissement à Capital Variable
R.C.S. Luxembourg B 133.445

Unaudited semi-annual report
1Merrill Lynch Investment Solutions
Table of contents Page
Management and Administration 2
Information to the Shareholders 6
Additional Information for Investors in the Federal Republic of Germany 11
Statements of Net Assets as at September 30, 2016 12
Statistical information 16
Schedule of Investments as at September 30, 2016 34
Merrill Lynch Investment Solutions – Marshall Wace TOPS UCITS Fund (Market Neutral) 34
Merrill Lynch Investment Solutions – York Event-Driven UCITS Fund 66
Merrill Lynch Investment Solutions – CCI Healthcare Long-Short UCITS Fund 73
Merrill Lynch Investment Solutions – Theorema European Equity Long-Short UCITS Fund 77
Merrill Lynch Investment Solutions – York Asian Event-Driven UCITS Fund 81
Merrill Lynch Investment Solutions – AQR Global Relative Value UCITS Fund 90
Merrill Lynch Investment Solutions – Och-Ziff European Multi-Strategy UCITS Fund 109
Merrill Lynch Investment Solutions – Beach Point Diversified Credit UCITS Fund 128
Merrill Lynch Investment Solutions – Merrill Lynch WNT Diversified Futures UCITS Fund 134
Merrill Lynch Investment Solutions – Merrill Lynch Enhanced Equity Volatility Premium Fund 142
Merrill Lynch Investment Solutions – Merrill Lynch MLCX Commodity Enhanced Beta Fund 144
Merrill Lynch Investment Solutions – Merrill Lynch MLCX Commodity Enhanced Beta ex Agriculture Fund 146
Merrill Lynch Investment Solutions – Merrill Lynch MLCX Commodity Alpha Fund 147
Merrill Lynch Investment Solutions – Fenician Equity Long Short UCITS Fund 149
Merrill Lynch Investment Solutions – Zeal Greater China Long Short UCITS Fund 152
Merrill Lynch Investment Solutions – Gotham U.S. Equity Long/Short UCITS Fund 155
Merrill Lynch Investment Solutions – Merrill Lynch Credit Fund 2016 170
Merrill Lynch Investment Solutions – Passport Capital Global Equity Long Short UCITS Fund 173
Merrill Lynch Investment Solutions – Willowbridge-Praxis Global Macro UCITS Fund 176
Merrill Lynch Investment Solutions – Ramius Merger Arbitrage UCITS Fund 178
Merrill Lynch Investment Solutions – Merrill Lynch Enhanced Cross-Asset Volatility Premium Fund 182
Notes to the financial statements as at September 30, 2016 183

2 Merrill Lynch Investment Solutions
Unaudited semi-annual report
Management and AdministrationBoard of Directors of the SICAV
ChairmanMr Jean-Claude Wolter,Avocat Honoraire,11 B boulevard Joseph II,L-1840 Luxembourg,Grand Duchy of Luxembourg
DirectorsMr Paul Guillaume,Managing Partner,Altra Partners S.A.,370 route de Longwy,L-1940 Luxembourg,Grand Duchy of Luxembourg
Mr Patrick Schegin1,Managing Director,Merrill Lynch International,2 King Edward Street,London EC1A 1HQ,United Kingdom
Mr James Munce2, COO of Fund Solutions Group and CM Investment Solutions Limited,2 King Edward Street,London EC1A 1HQ,United Kingdom
Mr Thomas Nummer,Carne Global Financial Services (Luxembourg) S.à r.l.,European Bank and Business Centre,6B route de Trèves,L-2633 Senningerberg,Grand Duchy of Luxembourg
1 Resigned on July 26, 20162 Appointed on July 26, 2016
Board of Directors of the Management Company
ChairmanMr Patrick Schegin,Managing Director,Merrill Lynch International,2 King Edward Street,London EC1A 1HQ,United Kingdom
DirectorsMr Gavin Lay,Managing Director,Merrill Lynch International,2 King Edward Street,London EC1A 1HQ,United Kingdom
Mr Philippe Lopategui,Managing Director,Merrill Lynch International,2 King Edward Street,London EC1A 1HQ,United Kingdom
Management CompanyCM Investment Solutions Limited,Bank of America Merrill Lynch Financial Centre,2 King Edward Street,London EC1A 1HQ,United Kingdom,
Registered Office of the SICAV49 avenue J. F. Kennedy,L-1855 Luxembourg,Grand Duchy of Luxembourg
Depository and Paying AgentState Street Bank Luxembourg S.C.A.,49 avenue J. F. Kennedy,L-1855 Luxembourg,Grand Duchy of Luxembourg

Management and Administration (cont.)
3Merrill Lynch Investment Solutions
Unaudited semi-annual report
Registrar and Transfer AgentState Street Bank Luxembourg S.C.A.,49 avenue J. F. Kennedy,L-1855 Luxembourg,Grand Duchy of Luxembourg
Administrative, Corporate and Domiciliary AgentState Street Bank Luxembourg S.C.A.,49 avenue J. F. Kennedy,L-1855 Luxembourg,Grand Duchy of Luxembourg
Global DistributorMerrill Lynch International,2 King Edward Street,London EC1A 1HQ,United Kingdom
Legal AdviserLinklaters LLP,35 avenue J. F. Kennedy,L-1855 Luxembourg,Grand Duchy of Luxembourg
AuditorPricewaterhouseCoopers, Société coopérative,2, rue Gerhard Mercator,B.P. 1443,L-1014 Luxembourg,Grand Duchy of Luxembourg
Investment ManagersFor the Sub-Fund Merrill Lynch Investment Solutions –Marshall Wace TOPS UCITS Fund (Market Neutral):Marshall Wace LLP,The Adelphi, 13th Floor,1/11 John Adam Street,London WC2N 6HT,United Kingdom
For the Sub-Funds Merrill Lynch Investment Solutions –York Event-Driven UCITS Fund and Merrill Lynch InvestmentSolutions – York Asian Event-Driven UCITS Fund:York UCITS Holdings, LLC,767 Fifth Avenue, 17th FloorNew York 10153,USA
For the Sub-Fund Merrill Lynch Investment Solutions –CCI Healthcare Long-Short UCITS Fund:Columbus Circle Investors GP,Metro Center, One Station Place, 8th Floor,Stamford, CT 06902,USA
For the Sub-Fund Merrill Lynch Investment Solutions –Theorema European Equity Long-Short UCITS Fund:Theorema Advisors UK LLP,20 Balderton Street,London W1K 6TL,United Kingdom
For the Sub-Fund Merrill Lynch Investment Solutions –Graham Capital Systematic Macro UCITS Fund1:Graham Capital Management L.P.,Rock Ledge Financial Center,40 Highland Avenue,Rowayton CT 06853,USA
1 Graham Capital Systematic Macro UCITS Fund was liquidated on May 11, 2016.
Management and Administration (cont.)
4 Merrill Lynch Investment Solutions
Unaudited semi-annual report
Investment Managers (cont.)For the Sub-Fund Merrill Lynch Investment Solutions –AQR Global Relative Value UCITS Fund:AQR Capital Management LLC,Two Greenwich Plaza, 3rd Floor,Greenwich, CT 06830,USA
For the Sub-Fund Merrill Lynch Investment Solutions –Och-Ziff European Multi-Strategy UCITS Fund:OZ Management LP, c/o Corporation Trust Center,1209 Orange Street,Wilmington, Delaware 19801,USA
For the Sub-Fund Merrill Lynch Investment Solutions –Beach Point Diversified Credit UCITS Fund:Beach Point UCITS Management LLC,489 5th Avenue,New York, NY 10017,USA
For the Sub-Fund Merrill Lynch Investment Solutions –Beach Point Diversified Credit UCITS Fund:Beach Point UCITS Management LLC,489 5th Avenue,New York, NY 10017,USA
For the Sub-Funds Merrill Lynch Investment Solutions –Merrill Lynch WNT Diversified Futures UCITS Fund, Merrill Lynch Dynamic Capital Protection UCITS Fund2, Merrill Lynch Enhanced Equity Volatility Premium Fund, Merrill Lynch MLCX Commodity Enhanced Beta Fund, Merrill Lynch MLCX Commodity Enhanced Beta ex Agriculture Fund, Merrill Lynch Credit Fund 2016 and Merrill Lynch MLCX Commodity Alpha Fund:CM Investment Solutions Limited,Bank of America Merrill Lynch Financial Centre,2 King Edward Street,London EC1A 1HQ,United Kingdom,
Investment Managers (cont.)For the Sub-Fund Merrill Lynch Investment Solutions –Fenician Equity Long Short UCITS Fund:Fenician Capital Management LLP,23 Buckingham Gate,London SW1E 6LB,United Kingdom
For the Sub-Fund Merrill Lynch Investment Solutions –Zeal Greater China Long Short UCITS Fund:Zeal Asset Management Limited,Suite 2605, Tower 1, Lippo Centre,89 Queensway,Hong Kong
For the Sub-Fund Merrill Lynch Investment Solutions – Gotham U.S. Equity Long/Short UCITS Fund:Gotham Asset Management, LLC,535 Madison Avenue, 30th Floor,New York, NY 10022,USA
For the Sub-Funds Merrill Lynch Investment Solutions – Passport Capital Global Equity Long Short UCITS Fund:Passport Capital LLC,One Market Street, Steuart Tower, Ste 2200San Francisco, CA 94105USA
For the Sub-Funds Merrill Lynch Investment Solutions – Willowbridge-Praxis Global Macro Ucits Fund:Willowbridge Associates Inc.,101 Morgan Lane, Suite 180,Plainsboro, NJ 08536USA
2 Credit Fund 2016 and MLCX Commodity Alpha Fund were launched on July 8, 2016.
Management and Administration (cont.)
5Merrill Lynch Investment Solutions
Unaudited semi-annual report
Investment Managers (cont.)For the Sub-Funds Merrill Lynch Investment Solutions – Ramius Merger Arbitrage Ucits Fund1:Ramius LLC,599 Lexington Avenue,New York, NY 10022,USA
For the Sub-Funds Merrill Lynch Investment Solutions – Merrill Lynch Enhanced Cross-Asset Volatility Premium Fund2:CM Investment Solutions Limited,Bank of America Merrill Lynch Financial Centre,2 King Edward Street,London EC1A 1HQ,United Kingdom,
Investment AdvisorsFor the Sub-Fund Merrill Lynch Investment Solutions –Marshall Wace TOPS UCITS Fund(Market Neutral):
Marshall Wace Asia Limited28/F One IFC One Harbour View Road,Hong Kong
Marshall Wace North America L.P.,55 Railroad Avenue, Greenwich,Connecticut,USA
For the Sub-Fund Merrill Lynch Investment Solutions –Merrill Lynch Dynamic Capital Protection UCITS Fund:Koris International,Espace Saint-Philippe,Immeuble NERI,200 avenue de Roumanille,06410 Biot,France
For the Sub-Fund Merrill Lynch Investment Solutions –Merrill Lynch Enhanced Volatility Premium Fund,Merrill Lynch Enhanced Cross-Asset Volatility Premium Fund2:Union Investment Institutional GmbH,Product Management,Wiesenhüttenstraße 10,60329 Frankfurt am Main,Germany
1 Ramius Merger Arbitrage Ucits Fund was launched on July 8, 2016.2 Merrill Lynch Enhanced Cross-Asset Volatility Premium Fund was launched
on September 16, 2016.

Unaudited semi-annual report
6 Merrill Lynch Investment Solutions
Information to the Shareholders The annual general meeting of Shareholders is held, each year, at the registered office of the SICAV or at the place specified in the convening notice on the last Monday of July (at 12 noon Luxembourg time) or the next following Luxembourg Business Day.
The meetings of Shareholders of Shares of a particular Sub-Fund may decide on matters which are relevant only for the Sub-Fund concerned.
Notices to Shareholders will be published in the Luxemburger Wort and / or in any other newspaper(s) in those countries where the Shares are sold, as determined by the Board of Directors.
Audited annual reports are made available on the website www.funds-invest.baml.com/ and for shareholders’ inspection at each of the registered offices of the SICAV and of the Custodian Bank. They will be published within four months following the relevant accounting period, and the latest annual report is made available at least eight days before the annual general meeting. Moreover, unaudited semi-annual reports are made available for shareholders’ inspection at each of the registered offices of the SICAV and of the Custodian Bank and will be published within two months following the relevant accounting period.
The financial year ends on March 31 of each year.
The list of changes in the portfolio, for the year ended September 30, 2016, is available at the registered office of the SICAV.
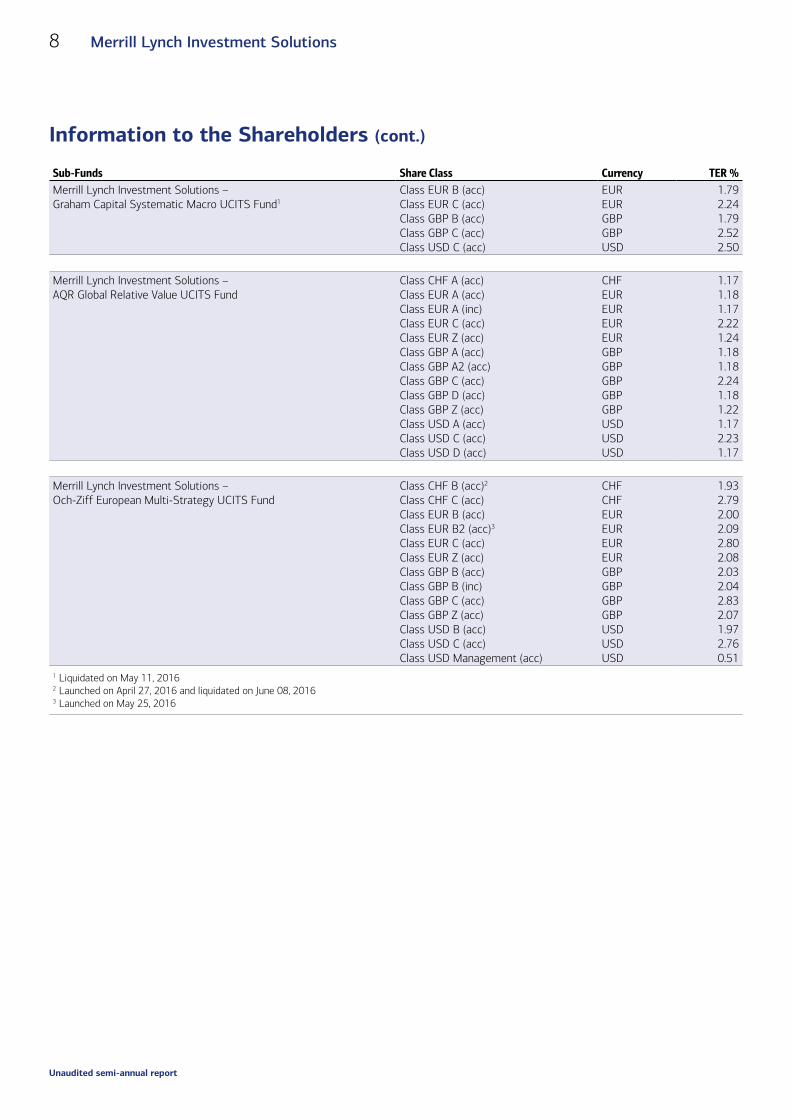
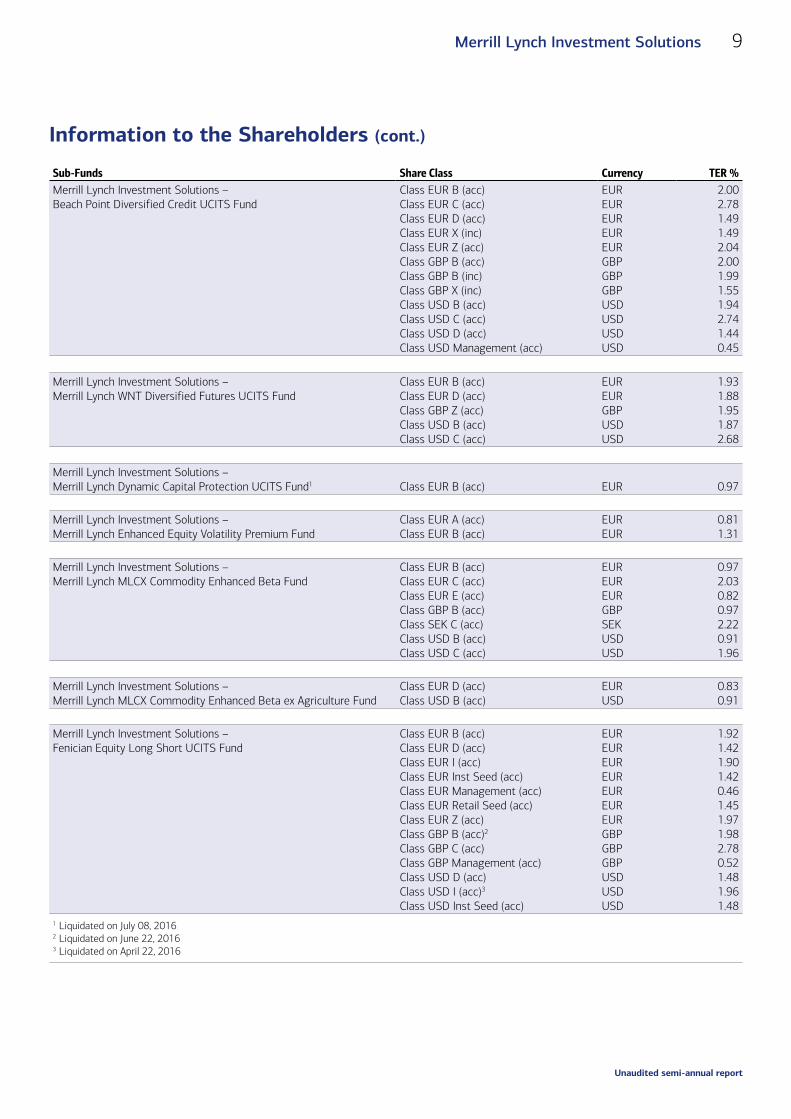
The Total Expense Ratios (TER) calculated for the last 12 months are the following:
Sub-Funds Share Class Currency TER %Merrill Lynch Investment Solutions – Marshall Wace TOPS UCITS Fund (Market Neutral)
Class EUR A (acc)Class EUR A (inc)Class EUR B (acc)Class EUR B (inc)Class EUR C (acc)Class EUR C (inc)Class EUR G (acc)Class EUR Z (acc)Class GBP A (inc)Class GBP B (acc)Class GBP B (inc)Class GBP C (acc)Class GBP C (inc)Class GBP G (acc)Class GBP Management (inc)Class GBP Z (acc)Class USD A (acc) Class USD B (acc) Class USD C (acc) Class USD G (acc)
EUREUREUREUREUREUREUREURGBPGBPGBPGBPGBPGBPGBPGBPUSDUSDUSDUSD
2.072.071.821.822.702.701.851.952.071.821.822.712.721.860.941.962.071.822.711.86

Unaudited semi-annual report
7Merrill Lynch Investment Solutions
Information to the Shareholders (cont.)
Sub-Funds Share Class Currency TER %Merrill Lynch Investment Solutions – York Event-Driven UCITS Fund
Class AUD E (acc)Class CHF A (acc)Class CHF E (acc)Class CHF F (acc)Class EUR A (acc)Class EUR B (acc)Class EUR C (acc)Class EUR D (acc)Class EUR E (acc)Class EUR F (acc)Class EUR Z (acc)Class GBP A (acc)Class GBP A (inc)Class GBP B (acc)Class GBP B (inc)Class GBP C (inc)Class GBP D (acc)Class GBP E (acc)Class GBP E (inc)Class GBP F (acc)Class GBP Z (acc)Class USD A (acc)Class USD B (acc)Class USD C (acc)Class USD D (acc)Class USD E (acc)Class USD F (acc)Class USD Z (acc)
AUDCHFCHFCHFEUREUREUREUREUREUREURGBPGBPGBPGBPGBPGBPGBPGBPGBPGBPUSDUSDUSDUSDUSDUSDUSD
1.731.741.762.791.681.702.731.471.692.731.731.761.761.791.812.691.511.761.762.791.791.741.762.761.541.752.791.79
Merrill Lynch Investment Solutions – CCI Healthcare Long-Short UCITS Fund
Class EUR B (acc) Class EUR C (acc)Class EUR D (acc)Class EUR Z (acc)Class GBP B (acc)Class GBP C (acc)Class GBP C (inc)Class GBP Z (acc) Class USD B (acc) Class USD C (acc) Class USD Z (acc)
EUREUREUREURGBPGBPGBPGBPUSDUSDUSD
1.982.761.982.011.972.762.772.011.922.711.96
Merrill Lynch Investment Solutions – Theorema European Equity Long-Short UCITS Fund
Class EUR B (acc) Class EUR C (acc) Class EUR I (inc)Class EUR Management (acc) Class USD B (acc)Class USD C (acc)
EUREUREUREURUSDUSD
2.443.232.192.482.503.29
Merrill Lynch Investment Solutions – York Asian Event-Driven UCITS Fund
Class CHF D (acc)Class EUR B (acc)Class EUR C (acc)Class EUR D (acc)Class GBP C (acc)Class USD A (acc)Class USD B (acc)Class USD C (acc)Class USD D (acc)
CHFEUREUREURGBPUSDUSDUSDUSD
1.741.932.731.682.801.971.992.861.74
Unaudited semi-annual report
8 Merrill Lynch Investment Solutions
Information to the Shareholders (cont.)
Sub-Funds Share Class Currency TER %Merrill Lynch Investment Solutions – Graham Capital Systematic Macro UCITS Fund1
Class EUR B (acc)Class EUR C (acc)Class GBP B (acc)Class GBP C (acc)Class USD C (acc)
EUREURGBPGBPUSD
1.792.241.792.522.50
Merrill Lynch Investment Solutions – AQR Global Relative Value UCITS Fund
Class CHF A (acc)Class EUR A (acc)Class EUR A (inc)Class EUR C (acc)Class EUR Z (acc)Class GBP A (acc)Class GBP A2 (acc)Class GBP C (acc)Class GBP D (acc)Class GBP Z (acc)Class USD A (acc)Class USD C (acc)Class USD D (acc)
CHFEUREUREUREURGBPGBPGBPGBPGBPUSDUSDUSD
1.171.181.172.221.241.181.182.241.181.221.172.231.17
Merrill Lynch Investment Solutions – Och-Ziff European Multi-Strategy UCITS Fund
Class CHF B (acc)2
Class CHF C (acc) Class EUR B (acc)Class EUR B2 (acc)3
Class EUR C (acc)Class EUR Z (acc)Class GBP B (acc)Class GBP B (inc) Class GBP C (acc)Class GBP Z (acc)Class USD B (acc) Class USD C (acc) Class USD Management (acc)
CHFCHFEUREUREUREURGBPGBPGBPGBPUSDUSDUSD
1.932.792.002.092.802.082.032.042.832.071.972.760.51
1 Liquidated on May 11, 20162 Launched on April 27, 2016 and liquidated on June 08, 20163 Launched on May 25, 2016
Unaudited semi-annual report
9Merrill Lynch Investment Solutions
Information to the Shareholders (cont.)
Sub-Funds Share Class Currency TER %Merrill Lynch Investment Solutions – Beach Point Diversified Credit UCITS Fund
Class EUR B (acc)Class EUR C (acc)Class EUR D (acc)Class EUR X (inc)Class EUR Z (acc)Class GBP B (acc)Class GBP B (inc)Class GBP X (inc)Class USD B (acc)Class USD C (acc)Class USD D (acc)Class USD Management (acc)
EUREUREUREUREURGBPGBPGBPUSDUSDUSDUSD
2.002.781.491.492.042.001.991.551.942.741.440.45
Merrill Lynch Investment Solutions – Merrill Lynch WNT Diversified Futures UCITS Fund
Class EUR B (acc)Class EUR D (acc)Class GBP Z (acc)Class USD B (acc)Class USD C (acc)
EUREURGBPUSDUSD
1.931.881.951.872.68
Merrill Lynch Investment Solutions – Merrill Lynch Dynamic Capital Protection UCITS Fund1 Class EUR B (acc) EUR 0.97
Merrill Lynch Investment Solutions – Merrill Lynch Enhanced Equity Volatility Premium Fund
Class EUR A (acc)Class EUR B (acc)
EUREUR
0.811.31
Merrill Lynch Investment Solutions – Merrill Lynch MLCX Commodity Enhanced Beta Fund
Class EUR B (acc)Class EUR C (acc)Class EUR E (acc)Class GBP B (acc)Class SEK C (acc)Class USD B (acc)Class USD C (acc)
EUREUREURGBPSEKUSDUSD
0.972.030.820.972.220.911.96
Merrill Lynch Investment Solutions – Merrill Lynch MLCX Commodity Enhanced Beta ex Agriculture Fund
Class EUR D (acc)Class USD B (acc)
EURUSD
0.830.91
Merrill Lynch Investment Solutions – Fenician Equity Long Short UCITS Fund
Class EUR B (acc)Class EUR D (acc)Class EUR I (acc)Class EUR Inst Seed (acc)Class EUR Management (acc)Class EUR Retail Seed (acc)Class EUR Z (acc)Class GBP B (acc)2
Class GBP C (acc)Class GBP Management (acc)Class USD D (acc)Class USD I (acc)3
Class USD Inst Seed (acc)
EUREUREUREUREUREUREURGBPGBPGBPUSDUSDUSD
1.921.421.901.420.461.451.971.982.780.521.481.961.48
1 Liquidated on July 08, 20162 Liquidated on June 22, 20163 Liquidated on April 22, 2016

Unaudited semi-annual report
10 Merrill Lynch Investment Solutions
Information to the Shareholders (cont.)
Sub-Funds Share Class Currency TER %Merrill Lynch Investment Solutions – Zeal Greater China Long Short UCITS Fund
Class EUR D (acc)1
Class USD B (acc)Class USD D (acc)2
Class USD Management (acc)Class USD Z (acc)
EURUSDUSDUSDUSD
1.752.171.680.462.21
Merrill Lynch Investment Solutions – Gotham U.S. Equity Long/Short UCITS Fund
Class EUR B (acc)Class EUR C (acc)Class EUR D (acc)Class EUR X (acc)3
Class GBP X (inc)4
Class USD B (acc)Class USD C (acc)Class USD D (acc)Class USD X (acc)5
EUREUREUREURGBPUSDUSDUSDUSD
1.992.781.741.731.731.932.721.681.67
Merrill Lynch Investment Solutions – Passport Capital Global Equity Long Short UCITS Fund
Class CHF C (acc)Class CHF D (acc)6
Class EUR B (acc)7
Class EUR D (acc)Class USD B (acc)Class USD C (acc)Class USD D (acc)Class USD Management (acc)
CHFCHFEUREURUSDUSDUSDUSD
2.511.431.731.421.662.781.360.45
Merrill Lynch Investment Solutions – Willowbridge-Praxis Global Macro UCITS Fund
Class EUR D (acc)Class USD B (acc)Class USD C (acc)Class USD D (acc)Class USD Management (acc)
EURUSDUSDUSDUSD
1.481.902.571.420.28
Merrill Lynch Investment Solutions – Merrill Lynch Credit Fund 2016 Class EUR B (inc) EUR 0.17
Merrill Lynch Investment Solutions – MLCX Commodity Alpha Fund
Class EUR B-5 (acc)Class EUR C-5 (acc)Class EUR E-5 (acc)Class GBP B-5 (acc)Class USD B-5 (acc)Class USD C-5 (acc)
EUREUREURGBPUSDUSD
1.072.110.821.071.012.05
Merrill Lynch Investment Solutions – Ramius Merger Arbitrage UCITS Fund8
Class USD B (acc)Class USD C (acc)Class USD D (acc)Class USD Management (acc)
USDUSDUSDUSD
1.462.271.420.46
Merrill Lynch Investment Solutions – Merrill Lynch Enhanced Cross-Asset Volatility Premium Fund9 Class EUR A (acc) EUR 0.751 Liquidated on June 30, 2016 and relaunched on August 31, 20162 Launched on July 18, 20163 Liquidated on September 27, 20164 Liquidated on July 22, 20165 Liquidated on September 06, 2016
6 Launched on May 06, 20167 Launched on May 20, 20168 Launched on July 08, 20169 Launched on September 16, 2016
The Total Expense Ratio includes all fees but excludes transaction costs and performance fees. For classes launched during the year, fees have been annualised.
Unaudited semi-annual report
11Merrill Lynch Investment Solutions
Additional Information for Investors in the Federal Republic of Germany Marcard, Stein & Co AG, Ballindamm 36, D-20095 Hamburg, has undertaken the function of Paying and Information Agent for the Federal Republic of Germany (the “German Paying and Information Agent”).
Applications for the redemption and conversion of shares may be sent to the German Paying and Information Agent.
All payments to investors, including redemption proceeds and potential distributions, may, upon request, be paid through the German Paying and Information Agent.
The prospectus, the key investor information documents, the articles of incorporation and the annual and semi-annual reports may be obtained, free of charge, in hardcopy form at the office of the German Paying and Information Agent during normal opening hours.
The statement of changes in the composition of the investment portfolio is also available free of charge upon request at the office of the German Paying and Information Agent.
Issue, redemption and conversion prices of shares and any other information to the shareholders are also available, free of charge, from the German Paying and Information Agent.
Fiscal information on taxable income to the shareholders are also available, free of charge, from the German Paying and Information Agent.
The issue, redemption and conversion prices of shares and the notices to the shareholders will be published on the following website www.funds-invest.baml.com/.

Una
udit
ed s
emi-
annu
al r
epor
t
The
acco
mpa
nyin
g no
tes
form
an
inte
gral
par
t of
the
se fi
nanc
ial s
tate
men
ts.
12M
erri
ll Ly
nch
Inve
stm
ent
Solu
tion
s
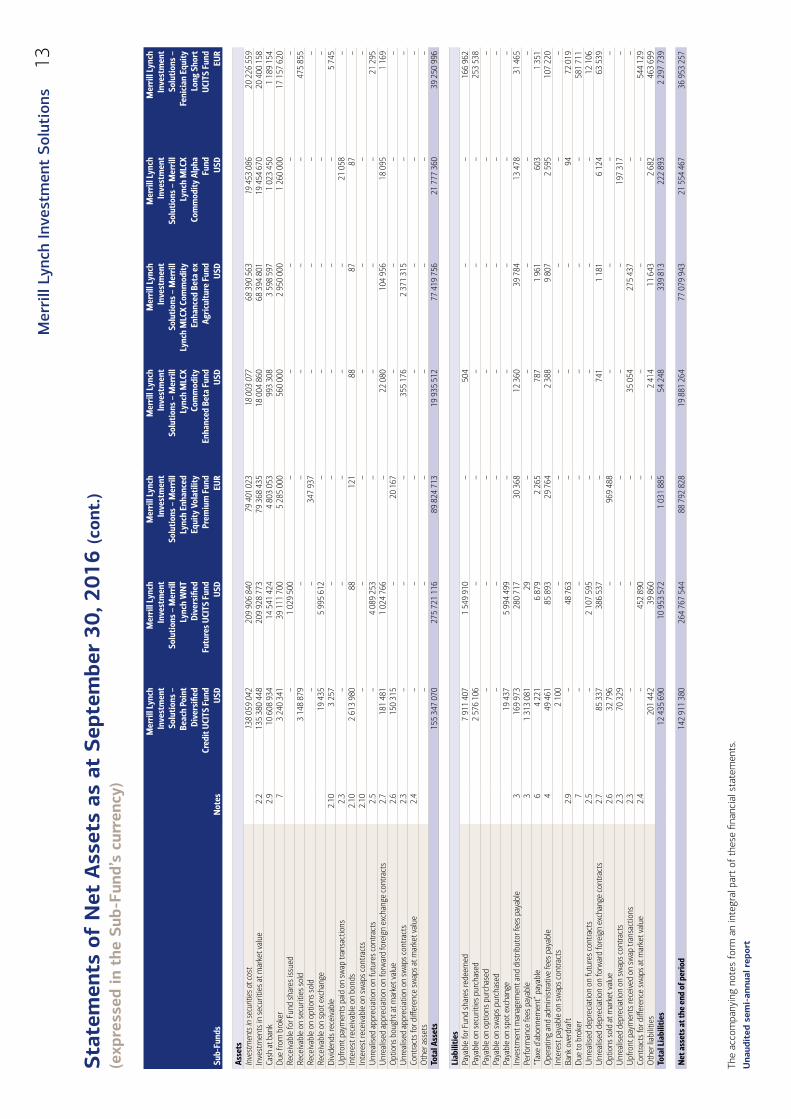
Sta
tem
ents
of
Net
Ass
ets
as a
t S
epte
mbe
r 30
, 201
6(e
xpre
ssed
in t
he S
ub-F
und’
s cu
rren
cy)
Mer
rill
Lync
h In
vest
men
t So
lutio
ns –
M
arsh
all W
ace
TOPS
UCI
TS F
und
(Mar
ket N
eutr
al)
Mer
rill
Lync
h In
vest
men
t So
lutio
ns –
Yor
k Ev
ent-
Driv
en
UCI
TS F
und
Mer
rill
Lync
h In
vest
men
t So
lutio
ns –
CCI
H
ealth
care
Lon
g-
Shor
t UCI
TS F
und
Mer
rill
Lync
h In
vest
men
t So
lutio
ns –
Th
eore
ma
Euro
pean
Eq
uity
Lon
g-Sh
ort
UCI
TS F
und
Mer
rill
Lync
h In
vest
men
t So
lutio
ns –
Yor
k As
ian
Even
t-Dr
iven
U
CITS
Fun
d
Mer
rill
Lync
h In
vest
men
t So
lutio
ns –
AQ
R Gl
obal
Re
lativ
e Va
lue
UCI
TS F
und
Mer
rill
Lync
h In
vest
men
t So
lutio
ns –
Och
- Zi
ff E
urop
ean
Mul
ti-St
rate
gy
UCI
TS F
und
Sub-
Fund
sN
otes
USD
EUR
USD
EUR
EUR
USD
USD
Asse
tsIn
vest
men
ts in
secu
ritie
s at c
ost
1 61
5 55
7 56
210
2 44
1 95
411
7 06
6 80
836
564
119
59 5
45 0
7190
0 38
6 36
396
394
709
Inve
stm
ents
in s
ecur
ities
at m
arke
t val
ue2.
21
661
910
485
111
532
336
117
128
034
36 0
87 8
5560
590
736
918
319
174
92 0
25 8
82Ca
sh a
t ban
k2.
91
026
883
908
39 9
09 3
482
753
084
6 22
3 68
912
176
779
244
962
315
11 6
72 5
46Du
e fr
om b
roke
r7
515
426
386
19 7
01 4
1729
485
839
30 6
78 8
0927
593
701
334
332
742
52 1
28 5
66Re
ceiv
able
for F
und
shar
es is
sued
1 95
0 56
446
668
773
––
753
708
885
Rece
ivab
le o
n se
curit
ies
sold
324
113
936
850
061
26 8
11 4
15–
4 02
6 45
58
126
769
1 03
2 22
0Re
ceiv
able
on
optio
ns s
old
––
––
––
–Re
ceiv
able
on
spot
exc
hang
e22
819
902
622
244
––
251
339
121
432
438
534
323
Divi
dend
s re
ceiv
able
2.10
554
067
131
797
41 1
591
166
109
834
111
093
7 09
3U
pfro
nt p
aym
ents
pai
d on
sw
ap tr
ansa
ctio
ns2.
3–
––
––
4 90
8 29
111
1 98
2In
tere
st re
ceiv
able
on
bond
s2.
108
890
45 3
04–
10 6
22–
223
612
243
806
Inte
rest
rece
ivab
le o
n sw
aps
cont
ract
s2.
10–
––
–3
555
277
24 3
55–
Unr
ealis
ed a
ppre
ciat
ion
on fu
ture
s co
ntra
cts
2.5
121
600
23 4
18–
–22
2 66
38
639
341
9 91
3U
nrea
lised
app
reci
atio
n on
forw
ard
fore
ign
exch
ange
con
trac
ts2.
718
737
755
844
895
22 4
7474
685
920
16 1
85 7
3965
0 83
8O
ptio
ns b
ough
t at m
arke
t val
ue2.
6–
1 40
5 10
832
130
1537
7 05
4–
6 15
9 12
2U
nrea
lised
app
reci
atio
n on
sw
aps
cont
ract
s2.
3–
––
––
282
613
67 9
10Co
ntra
cts
for d
iffer
ence
sw
aps
at m
arke
t val
ue2.
442
642
096
3 20
2 04
828
6 65
01
628
390
384
488
3 79
0 66
22
999
237
Oth
er a
sset
s–
––
––
–1
373
Tota
l Ass
ets
3 61
5 16
9 58
917
8 31
4 64
417
6 56
1 55
874
631
292
109
374
246
1 66
2 09
2 85
216
7 64
5 69
6
Liab
ilitie
sPa
yabl
e fo
r Fun
d sh
ares
rede
emed
3 95
6 95
91
184
910
6 85
3 77
56
010
792
100
1 50
9 02
22
068
Paya
ble
on s
ecur
ities
pur
chas
ed32
6 76
6 90
817
264
415
9 34
7 92
334
0 91
73
499
994
5 99
2 45
291
7 11
6Pa
yabl
e on
opt
ions
pur
chas
ed–
––
––
–36
1 03
1Pa
yabl
e on
sw
aps
purc
hase
d–
––
––
1 50
2 30
1–
Paya
ble
on s
pot e
xcha
nge
22 8
24 8
9262
2 56
5–
–25
1 90
912
1 36
0 50
353
6 02
2In
vest
men
t man
agem
ent a
nd d
istr
ibut
or fe
es p
ayab
le3
4 17
3 42
124
8 59
426
4 01
510
8 86
410
7 04
91
219
713
192
281
Perfo
rman
ce fe
es p
ayab
le3
5 06
0 14
990
––
–98
895
–“T
axe
d’ab
onne
men
t” p
ayab
le6
138
075
15 1
6514
657
4 65
22
591
40 6
574
744
Ope
ratin
g an
d ad
min
istr
ativ
e fe
es p
ayab
le4
814
685
52 3
2755
656
22 1
9433
559
179
753
50 1
05In
tere
st p
ayab
le o
n sw
aps
cont
ract
s–
––
––
–8
162
Bank
ove
rdra
ft2.
913
985
860
1 02
8 05
221
07
143
651
286
5 58
3 19
211
Due
to b
roke
r7
27 0
00 0
011
426
803
–8
377
168
1 42
5 31
06
077
997
8 61
1 83
9U
nrea
lised
dep
reci
atio
n on
futu
res
cont
ract
s2.
557
4 40
254
7 02
9–
–21
066
4 40
2 11
831
6 30
6U
nrea
lised
dep
reci
atio
n on
forw
ard
fore
ign
exch
ange
con
trac
ts2.
74
064
905
576
928
23 7
63–
383
847
13 1
19 3
0630
1 12
7O
ptio
ns s
old
at m
arke
t val
ue2.
6–
424
––
––
1 90
7 67
3U
nrea
lised
dep
reci
atio
n on
sw
aps
cont
ract
s2.
3–
––
––
700
423
96 8
72U
pfro
nt p
aym
ents
rece
ived
on
swap
tran
sact
ions
2.3
––
––
–3
875
415
407
870
Cont
ract
s fo
r diff
eren
ce s
wap
s at
mar
ket v
alue
2.4
52 2
64 9
551
346
240
703
072
–1
372
676
14 0
77 6
764
634
827
Oth
er li
abili
ties
–17
723
7 89
520
93
263
–11
208
Tota
l Lia
bilit
ies
461
625
212
24 3
31 2
6517
270
966
8 86
7 15
78
544
650
179
739
423
18 3
59 2
62
Net
ass
ets
at th
e en
d of
per
iod
3 15
3 54
4 37
715
3 98
3 37
915
9 29
0 59
265
764
135
100
829
596
1 48
2 35
3 42
914
9 28
6 43
4
Una
udit
ed s
emi-
annu
al r
epor
t
The
acco
mpa
nyin
g no
tes
form
an
inte
gral
par
t of
the
se fi
nanc
ial s
tate
men
ts.
13M
erri
ll Ly
nch
Inve
stm
ent
Solu
tion
s
Sta
tem
ents
of
Net
Ass
ets
as a
t S
epte
mbe
r 30
, 201
6 (c
ont.
)(e
xpre
ssed
in t
he S
ub-F
und’
s cu
rren
cy)
Mer
rill
Lync
h In
vest
men
t So
lutio
ns –
Be
ach
Poin
t Di
vers
ified
Cr
edit
UCI
TS F
und
Mer
rill
Lync
h In
vest
men
t So
lutio
ns –
Mer
rill
Lync
h W
NT
Dive
rsifi
ed
Futu
res
UCI
TS F
und
Mer
rill
Lync
h In
vest
men
t So
lutio
ns –
Mer
rill
Lync
h En
hanc
ed
Equi
ty V
olat
ility
Pr
emiu
m F
und
Mer
rill
Lync
h In
vest
men
t So
lutio
ns –
Mer
rill
Lync
h M
LCX
Com
mod
ity
Enha
nced
Bet
a Fu
nd
Mer
rill
Lync
h In
vest
men
t So
lutio
ns –
Mer
rill
Lync
h M
LCX
Com
mod
ity
Enha
nced
Bet
a ex
Ag
ricu
lture
Fun
d
Mer
rill
Lync
h In
vest
men
t So
lutio
ns –
Mer
rill
Lync
h M
LCX
Com
mod
ity A
lpha
Fu
nd
Mer
rill
Lync
h In
vest
men
t So
lutio
ns –
Fe
nici
an E
quity
Lo
ng S
hort
U
CITS
Fun
dSu
b-Fu
nds
Not
esU
SDU
SDEU
RU
SDU
SDU
SDEU
R
Asse
tsIn
vest
men
ts in
secu
ritie
s at c
ost
138
059
042
209
906
840
79 4
01 0
2318
003
077
68 3
90 5
6319
453
086
20 2
26 5
59In
vest
men
ts in
sec
uriti
es a
t mar
ket v
alue
2.2
135
380
448
209
928
773
79 3
68 4
3518
004
860
68 3
94 8
0119
454
670
20 4
00 1
58Ca
sh a
t ban
k2.
910
608
934
14 5
41 4
244
803
053
993
308
3 59
8 59
71
023
450
1 18
9 15
4Du
e fr
om b
roke
r7
3 24
0 34
139
111
700
5 28
5 00
056
0 00
02
950
000
1 26
0 00
017
157
620
Rece
ivab
le fo
r Fun
d sh
ares
issu
ed–
1 02
9 50
0–
––
––
Rece
ivab
le o
n se
curit
ies
sold
3 14
8 87
9–
––
––
475
855
Rece
ivab
le o
n op
tions
sol
d–
–34
7 93
7–
––
–Re
ceiv
able
on
spot
exc
hang
e19
435
5 99
5 61
2–
––
––
Divi
dend
s re
ceiv
able
2.10
3 25
7–
––
––
5 74
5U
pfro
nt p
aym
ents
pai
d on
sw
ap tr
ansa
ctio
ns2.
3–
––
––
21 0
58–
Inte
rest
rece
ivab
le o
n bo
nds
2.10
2 61
3 98
088
121
8887
87–
Inte
rest
rece
ivab
le o
n sw
aps
cont
ract
s2.
10–
––
––
––
Unr
ealis
ed a
ppre
ciat
ion
on fu
ture
s co
ntra
cts
2.5
–4
089
253
––
––
21 2
95U
nrea
lised
app
reci
atio
n on
forw
ard
fore
ign
exch
ange
con
trac
ts2.
718
1 48
11
024
766
–22
080
104
956
18 0
951
169
Opt
ions
bou
ght a
t mar
ket v
alue
2.6
150
315
–20
167
––
––
Unr
ealis
ed a
ppre
ciat
ion
on s
wap
s co
ntra
cts
2.3
––
–35
5 17
62
371
315
––
Cont
ract
s fo
r diff
eren
ce s
wap
s at
mar
ket v
alue
2.4
––
––
––
–O
ther
ass
ets
––
––
––
–To
tal A
sset
s15
5 34
7 07
027
5 72
1 11
689
824
713
19 9
35 5
1277
419
756
21 7
77 3
6039
250
996
Liab
ilitie
sPa
yabl
e fo
r Fun
d sh
ares
rede
emed
7 91
1 40
71
549
910
–50
4–
–16
6 96
2Pa
yabl
e on
sec
uriti
es p
urch
ased
2 57
6 10
6–
––
––
253
538
Paya
ble
on o
ptio
ns p
urch
ased
––
––
––
–Pa
yabl
e on
sw
aps
purc
hase
d–
––
––
––
Paya
ble
on s
pot e
xcha
nge
19 4
375
994
499
––
––
–In
vest
men
t man
agem
ent a
nd d
istr
ibut
or fe
es p
ayab
le3
169
973
280
717
30 3
6812
360
39 7
8413
478
31 4
65Pe
rform
ance
fees
pay
able
31
313
081
29–
––
––
“Tax
e d’
abon
nem
ent”
pay
able
64
221
6 87
92
265
787
1 96
160
31
351
Ope
ratin
g an
d ad
min
istr
ativ
e fe
es p
ayab
le4
49 4
6185
893
29 7
642
388
9 80
72
595
107
220
Inte
rest
pay
able
on
swap
s co
ntra
cts
2 10
0–
––
––
–Ba
nk o
verd
raft
2.9
–48
763
––
–94
72 0
19Du
e to
bro
ker
7–
––
––
–58
1 71
1U
nrea
lised
dep
reci
atio
n on
futu
res
cont
ract
s2.
5–
2 10
7 59
5–
––
–12
106
Unr
ealis
ed d
epre
ciat
ion
on fo
rwar
d fo
reig
n ex
chan
ge c
ontr
acts
2.7
85 3
3738
6 53
7–
741
1 18
16
124
63 5
39O
ptio
ns s
old
at m
arke
t val
ue2.
632
796
–96
9 48
8–
––
–U
nrea
lised
dep
reci
atio
n on
sw
aps
cont
ract
s2.
370
329
––
––
197
317
–U
pfro
nt p
aym
ents
rece
ived
on
swap
tran
sact
ions
2.3
––
–35
054
275
437
––
Cont
ract
s fo
r diff
eren
ce s
wap
s at
mar
ket v
alue
2.4
–45
2 89
0–
––
–54
4 12
9O
ther
liab
ilitie
s20
1 44
239
860
–2
414
11 6
432
682
463
699
Tota
l Lia
bilit
ies
12 4
35 6
9010
953
572
1 03
1 88
554
248
339
813
222
893
2 29
7 73
9
Net
ass
ets
at th
e en
d of
per
iod
142
911
380
264
767
544
88 7
92 8
2819
881
264
77 0
79 9
4321
554
467
36 9
53 2
57

Una
udit
ed s
emi-
annu
al r
epor
t
The
acco
mpa
nyin
g no
tes
form
an
inte
gral
par
t of
the
se fi
nanc
ial s
tate
men
ts.
14M
erri
ll Ly
nch
Inve
stm
ent
Solu
tion
s
Sta
tem
ents
of
Net
Ass
ets
as a
t S
epte
mbe
r 30
, 201
6 (c
ont.
)(e
xpre
ssed
in t
he S
ub-F
und’
s cu
rren
cy)
Mer
rill
Lync
h In
vest
men
t So
lutio
ns –
Zea
l Gr
eate
r Chi
na
Long
Sho
rt
UCI
TS F
und
Mer
rill
Lync
h In
vest
men
t So
lutio
ns –
Go
tham
U.S
. Eq
uity
Lon
g/Sh
ort
UCI
TS F
und
Mer
rill
Lync
h In
vest
men
t So
lutio
ns –
M
erri
ll Ly
nch
Cred
it Fu
nd 2
016
Mer
rill
Lync
h In
vest
men
t So
lutio
ns –
Pa
sspo
rt C
apita
l Glo
bal
Equi
ty L
ong
Shor
t U
CITS
Fun
d
Mer
rill
Lync
h In
vest
men
t So
lutio
ns –
W
illow
brid
ge-P
raxi
s Gl
obal
Mac
ro
UCI
TS F
und
Mer
rill
Lync
h In
vest
men
t So
lutio
ns –
Ra
miu
s M
erge
r Ar
bitr
age
UCI
TS F
und1
Mer
rill
Lync
h In
vest
men
t So
lutio
ns –
M
erri
ll Ly
nch
Enha
nced
Cr
oss-
Asse
t Vol
atili
ty
Prem
ium
Fun
d2
Sub-
Fund
sN
otes
USD
USD
EUR
USD
USD
USD
EUR
Asse
tsIn
vest
men
ts in
secu
ritie
s at c
ost
24 8
73 2
1542
933
687
111
507
123
30 3
30 4
5827
553
112
13 8
97 8
2947
628
081
Inve
stm
ents
in s
ecur
ities
at m
arke
t val
ue2.
228
097
338
43 9
08 2
8310
7 94
7 63
432
035
016
27 3
85 2
3414
065
734
47 6
02 5
60Ca
sh a
t ban
k2.
93
350
984
–8
612
373
5 41
9 69
34
465
595
2 29
2 72
92
536
294
Due
from
bro
ker
74
556
541
3 82
8 68
1–
3 35
7 64
713
594
362
4 13
4 56
3–
Rece
ivab
le fo
r Fun
d sh
ares
issu
ed–
––
––
––
Rece
ivab
le o
n se
curit
ies
sold
240
554
3 48
1 61
6–
––
886
665
–Re
ceiv
able
on
optio
ns s
old
––
––
––
–Re
ceiv
able
on
spot
exc
hang
e–
––
27 4
21–
––
Divi
dend
s re
ceiv
able
2.10
87 2
3533
179
–21
545
1 60
121
1–
Upf
ront
pay
men
ts p
aid
on s
wap
tran
sact
ions
2.3
––
––
––
801
Inte
rest
rece
ivab
le o
n bo
nds
2.10
––
1 14
8 09
4–
92
528
121
Inte
rest
rece
ivab
le o
n sw
aps
cont
ract
s2.
10–
–27
5 45
0–
––
–U
nrea
lised
app
reci
atio
n on
futu
res
cont
ract
s2.
556
273
––
–17
3 69
2–
–U
nrea
lised
app
reci
atio
n on
forw
ard
fore
ign
exch
ange
con
trac
ts2.
7–
––
–51
6 24
5–
–O
ptio
ns b
ough
t at m
arke
t val
ue2.
6–
––
6 91
0–
54 4
02–
Unr
ealis
ed a
ppre
ciat
ion
on s
wap
s co
ntra
cts
2.3
––
1 08
8 92
6–
––
305
076
Cont
ract
s fo
r diff
eren
ce s
wap
s at
mar
ket v
alue
2.4
95 2
76–
––
–10
3 91
7–
Oth
er a
sset
s–
––
––
–12
5 19
8To
tal A
sset
s36
484
201
51 2
51 7
5911
9 07
2 47
740
868
232
46 1
36 7
3821
540
749
50 5
70 0
50
Liab
ilitie
sPa
yabl
e fo
r Fun
d sh
ares
rede
emed
––
––
1 31
7 39
1–
–Pa
yabl
e on
sec
uriti
es p
urch
ased
518
003
918
133
––
1 00
32
069
966
–Pa
yabl
e on
opt
ions
pur
chas
ed–
––
––
––
Paya
ble
on s
wap
s pu
rcha
sed
––
––
––
–Pa
yabl
e on
spo
t exc
hang
e–
––
27 4
40–
––
Inve
stm
ent m
anag
emen
t and
dis
trib
utor
fees
pay
able
311
879
53 4
8434
554
32 8
4913
403
3 93
99
641
Perfo
rman
ce fe
es p
ayab
le3
57 9
74–
–25
5–
7 18
0–
“Tax
e d’
abon
nem
ent”
pay
able
63
917
1 28
42
824
1 13
04
115
2 06
71
288
Ope
ratin
g an
d ad
min
istr
ativ
e fe
es p
ayab
le4
11 8
1816
452
69 1
0613
195
8 04
96
275
3 45
2In
tere
st p
ayab
le o
n sw
aps
cont
ract
s–
––
––
––
Bank
ove
rdra
ft2.
9–
2 29
0 77
6–
18 3
2427
619
493
–Du
e to
bro
ker
726
0–
––
97 9
62–
–U
nrea
lised
dep
reci
atio
n on
futu
res
cont
ract
s2.
5–
––
–14
8 30
0–
–U
nrea
lised
dep
reci
atio
n on
forw
ard
fore
ign
exch
ange
con
trac
ts2.
750
04
375
–15
883
405
010
––
Opt
ions
sol
d at
mar
ket v
alue
2.6
––
–30
6–
30 1
58–
Unr
ealis
ed d
epre
ciat
ion
on s
wap
s co
ntra
cts
2.3
––
––
––
–U
pfro
nt p
aym
ents
rece
ived
on
swap
tran
sact
ions
2.3
––
––
––
–Co
ntra
cts
for d
iffer
ence
sw
aps
at m
arke
t val
ue2.
415
934
1 07
4 95
8–
76 3
58–
––
Oth
er li
abili
ties
411
718
6 00
5 71
54
823
150
159
–10
0 15
8To
tal L
iabi
litie
s62
0 32
64
361
180
6 11
2 19
919
0 56
32
145
668
2 13
9 07
811
4 53
9
Net
ass
ets
at th
e en
d of
per
iod
35 8
63 8
7546
890
579
112
960
278
40 6
77 6
6943
991
070
19 4
01 6
7150
455
511
1 Lau
nche
d on
July
8, 2
016
2 Lau
nche
d on
Sep
tem
ber 1
6, 2
016

Una
udit
ed s
emi-
annu
al r
epor
t
The
acco
mpa
nyin
g no
tes
form
an
inte
gral
par
t of
the
se fi
nanc
ial s
tate
men
ts.
15M
erri
ll Ly
nch
Inve
stm
ent
Solu
tion
s
Sta
tem
ents
of
Net
Ass
ets
as a
t S
epte
mbe
r 30
, 201
6 (c
ont.
)(e
xpre
ssed
in t
he S
ub-F
und’
s cu
rren
cy)
Com
bine
dSu
b-Fu
nds
Not
esEU
R
Asse
tsIn
vest
men
ts in
secu
ritie
s at c
ost
3 41
4 07
3 28
8In
vest
men
ts in
sec
uriti
es a
t mar
ket v
alue
2.2
3 47
6 55
5 64
7Ca
sh a
t ban
k2.
91
261
219
056
Due
from
bro
ker
799
7 34
4 21
6Re
ceiv
able
for F
und
shar
es is
sued
3 37
0 59
6Re
ceiv
able
on
secu
ritie
s so
ld33
2 67
2 20
9Re
ceiv
able
on
optio
ns s
old
347
937
Rece
ivab
le o
n sp
ot e
xcha
nge
135
087
075
Divi
dend
s re
ceiv
able
2.10
1 01
4 19
4U
pfro
nt p
aym
ents
pai
d on
sw
ap tr
ansa
ctio
ns2.
34
486
769
Inte
rest
rece
ivab
le o
n bo
nds
2.10
3 95
6 68
7In
tere
st re
ceiv
able
on
swap
s co
ntra
cts
2.10
3 85
2 39
9U
nrea
lised
app
reci
atio
n on
futu
res
cont
ract
s2.
511
915
419
Unr
ealis
ed a
ppre
ciat
ion
on fo
rwar
d fo
reig
n ex
chan
ge c
ontr
acts
2.7
34 2
70 0
03O
ptio
ns b
ough
t at m
arke
t val
ue2.
67
499
869
Unr
ealis
ed a
ppre
ciat
ion
on s
wap
s co
ntra
cts
2.3
4 13
2 04
6Co
ntra
cts
for d
iffer
ence
sw
aps
at m
arke
t val
ue2.
449
633
715
Oth
er a
sset
s12
6 42
0To
tal A
sset
s6
327
484
257
Liab
ilitie
sPa
yabl
e fo
r Fun
d sh
ares
rede
emed
22 7
06 1
62Pa
yabl
e on
sec
uriti
es p
urch
ased
332
008
081
Paya
ble
on o
ptio
ns p
urch
ased
321
259
Paya
ble
on s
wap
s pu
rcha
sed
1 33
6 80
5Pa
yabl
e on
spo
t exc
hang
e13
5 02
8 93
6In
vest
men
t man
agem
ent a
nd d
istr
ibut
or fe
es p
ayab
le3
6 33
7 83
8Pe
rform
ance
fees
pay
able
35
817
462
“Tax
e d’
abon
nem
ent”
pay
able
623
0 43
6O
pera
ting
and
adm
inis
trat
ive
fees
pay
able
41
479
868
Inte
rest
pay
able
on
swap
s co
ntra
cts
9 13
2Ba
nk o
verd
raft
2.9
21 2
87 7
74Du
e to
bro
ker
748
995
595
Unr
ealis
ed d
epre
ciat
ion
on fu
ture
s co
ntra
cts
2.5
7 92
7 34
0U
nrea
lised
dep
reci
atio
n on
forw
ard
fore
ign
exch
ange
con
trac
ts2.
717
410
493
Opt
ions
sol
d at
mar
ket v
alue
2.6
2 72
3 72
3U
nrea
lised
dep
reci
atio
n on
sw
aps
cont
ract
s2.
3 9
47 6
25U
pfro
nt p
aym
ents
rece
ived
on
swap
tran
sact
ions
2.3
4 08
7 71
6Co
ntra
cts
for d
iffer
ence
sw
aps
at m
arke
t val
ue2.
464
488
767
Oth
er li
abili
ties
6 97
6 85
3To
tal L
iabi
litie
s68
3 49
1 86
5
Net
ass
ets
at th
e en
d of
per
iod
5 64
3 99
2 39
2

Unaudited semi-annual report
16 Merrill Lynch Investment Solutions
The accompanying notes form an integral part of these financial statements.
Statistical information
Statistical information
Year ending as of: September 30, 2016 March 31, 2016 March 31, 2015Merrill Lynch Investment Solutions – Marshall Wace TOPS UCITS Fund (Market Neutral)Total Net Assets USD 3 153 544 377 3 289 710 868 2 136 898 753
Class EUR A (acc)Number of shares 316 740.326 339 465.171 234 456.833Net asset value per share EUR 138.26 138.15 131.02
Class EUR A (inc)Number of shares 10 221.761 14 028.691 4 734.872Net asset value per share EUR 140.30 140.21 133.02
Class EUR B (acc)Number of shares 10 387 673.902 10 709 719.371 8 089 760.213Net asset value per share EUR 137.83 137.50 129.57
Class EUR B (inc)Number of shares 1 962 257.807 1 923 656.344 293 893.601Net asset value per share EUR 118.58 118.29 111.47
Class EUR C (acc)Number of shares 2 591 371.543 2 665 287.886 1 673 336.675Net asset value per share EUR 132.18 132.43 125.73
Class EUR C (inc)Number of shares 183 150.505 186 378.856 158 625.933Net asset value per share EUR 115.76 115.94 110.04
Class EUR G (acc)Number of shares 369 929.755 479 231.343 468 169.456Net asset value per share EUR 131.83 131.54 123.98
Class EUR Z (acc)Number of shares 115 738.438 116 795.112 14 695.596Net asset value per share EUR 118.18 117.97 111.27
Class GBP A (inc)Number of shares 2 004.961 2 004.961 1 208.905Net asset value per share GBP 137.60 137.09 129.18
Class GBP B (acc)Number of shares 1 151 971.450 1 124 284.778 920 587.240Net asset value per share GBP 141.15 140.39 131.46
Class GBP B (inc)Number of shares 87 855.379 80 241.563 205 455.291Net asset value per share GBP 139.90 139.15 130.24
Class GBP C (acc)Number of shares 17 157.621 18 290.247 238 023.964Net asset value per share GBP 127.49 127.27 120.03
Class GBP C (inc)Number of shares 2 419.225 1 709.128 3 608.238Net asset value per share GBP 133.88 133.69 126.04
Class GBP G (acc)Number of shares 114 708.252 189 614.252 267 568.909Net asset value per share GBP 134.25 133.55 125.07
Class GBP Management (inc)Number of shares 590.788 1 262.086 964.976Net asset value per share GBP 169.96 168.30 155.07
Unaudited semi-annual report
17Merrill Lynch Investment Solutions
The accompanying notes form an integral part of these financial statements.
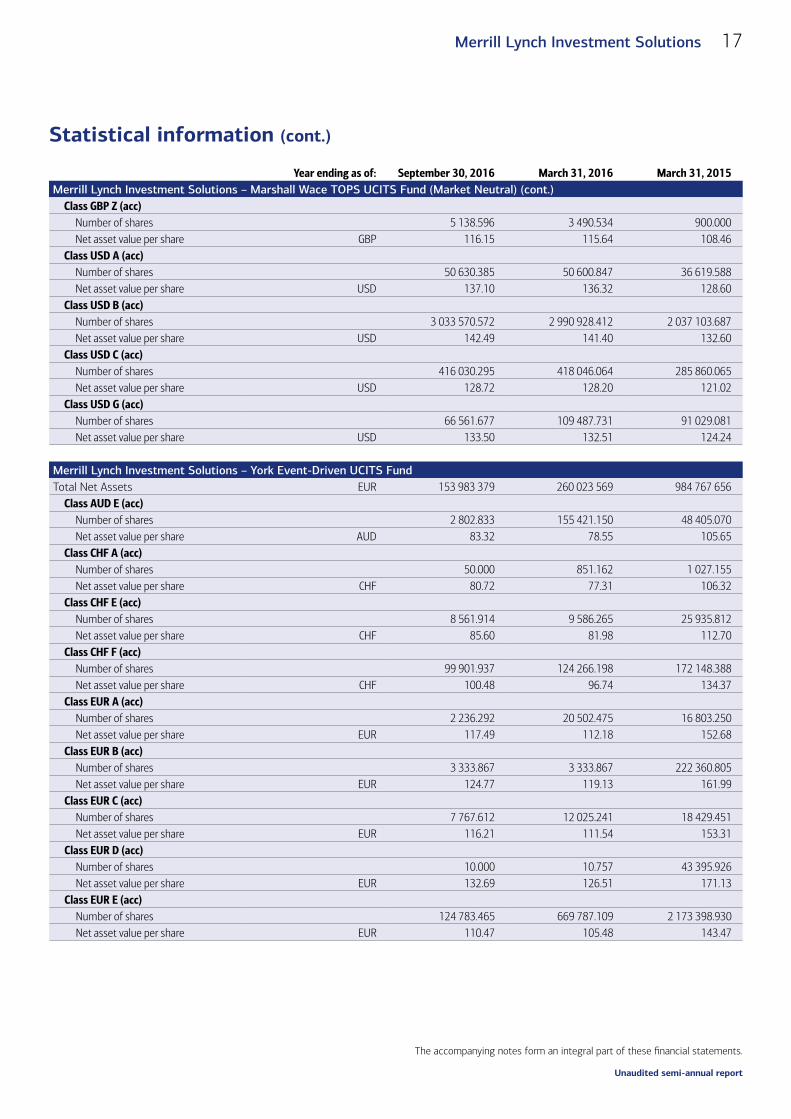
Statistical information (cont.)
Year ending as of: September 30, 2016 March 31, 2016 March 31, 2015Merrill Lynch Investment Solutions – Marshall Wace TOPS UCITS Fund (Market Neutral) (cont.)
Class GBP Z (acc)Number of shares 5 138.596 3 490.534 900.000Net asset value per share GBP 116.15 115.64 108.46
Class USD A (acc)Number of shares 50 630.385 50 600.847 36 619.588Net asset value per share USD 137.10 136.32 128.60
Class USD B (acc)Number of shares 3 033 570.572 2 990 928.412 2 037 103.687Net asset value per share USD 142.49 141.40 132.60
Class USD C (acc)Number of shares 416 030.295 418 046.064 285 860.065Net asset value per share USD 128.72 128.20 121.02
Class USD G (acc)Number of shares 66 561.677 109 487.731 91 029.081Net asset value per share USD 133.50 132.51 124.24
Merrill Lynch Investment Solutions – York Event-Driven UCITS FundTotal Net Assets EUR 153 983 379 260 023 569 984 767 656
Class AUD E (acc)Number of shares 2 802.833 155 421.150 48 405.070Net asset value per share AUD 83.32 78.55 105.65
Class CHF A (acc)Number of shares 50.000 851.162 1 027.155Net asset value per share CHF 80.72 77.31 106.32
Class CHF E (acc)Number of shares 8 561.914 9 586.265 25 935.812Net asset value per share CHF 85.60 81.98 112.70
Class CHF F (acc)Number of shares 99 901.937 124 266.198 172 148.388Net asset value per share CHF 100.48 96.74 134.37
Class EUR A (acc)Number of shares 2 236.292 20 502.475 16 803.250Net asset value per share EUR 117.49 112.18 152.68
Class EUR B (acc)Number of shares 3 333.867 3 333.867 222 360.805Net asset value per share EUR 124.77 119.13 161.99
Class EUR C (acc)Number of shares 7 767.612 12 025.241 18 429.451Net asset value per share EUR 116.21 111.54 153.31
Class EUR D (acc)Number of shares 10.000 10.757 43 395.926Net asset value per share EUR 132.69 126.51 171.13
Class EUR E (acc)Number of shares 124 783.465 669 787.109 2 173 398.930Net asset value per share EUR 110.47 105.48 143.47

Unaudited semi-annual report
18 Merrill Lynch Investment Solutions
The accompanying notes form an integral part of these financial statements.
Statistical information (cont.)
Year ending as of: September 30, 2016 March 31, 2016 March 31, 2015Merrill Lynch Investment Solutions – York Event-Driven UCITS Fund (cont.)
Class EUR F (acc)Number of shares 179 601.995 247 445.035 424 153.380Net asset value per share EUR 103.00 98.86 135.87
Class EUR Z (acc)Number of shares 36 230.104 64 968.942 50 194.401Net asset value per share EUR 104.22 99.53 135.40
Class GBP A (acc)Number of shares 1 297.516 1 490.883 2 611.964Net asset value per share GBP 118.56 112.98 153.74
Class GBP A (inc)Number of shares 7 306.000 8 005.000 17 209.859Net asset value per share GBP 118.44 112.87 153.59
Class GBP B (acc)Number of shares 10.000 10.000 35 412.471Net asset value per share GBP 125.19 119.28 162.30
Class GBP B (inc)Number of shares 10.000 10.000 10.000Net asset value per share GBP 125.68 119.78 162.90
Class GBP C (inc)Number of shares 10.000 10.007 100.497Net asset value per share GBP 117.93 112.89 155.25
Class GBP D (acc)Number of shares 1 455.537 1 455.537 1 455.537Net asset value per share GBP 133.75 127.30 172.38
Class GBP E (acc)Number of shares 3 132.860 13 885.640 430 375.185Net asset value per share GBP 110.42 105.22 143.20
Class GBP E (inc)Number of shares 12 755.496 19 671.648 58 968.288Net asset value per share GBP 103.71 98.83 134.50
Class GBP F (acc)Number of shares 11 810.000 18 320.086 55 051.288Net asset value per share GBP 100.64 96.41 132.56
Class GBP Z (acc)Number of shares 25 798.346 57 386.898 193 057.109Net asset value per share GBP 103.65 98.79 134.51
Class SEK E (acc) Number of shares – – 18 805.954Net asset value per share SEK – – 608.85
Class USD A (acc)Number of shares 19 288.473 45 951.674 63 693.480Net asset value per share USD 118.13 112.16 152.84
Class USD B (acc)Number of shares 61 344.000 64 776.298 70 888.298Net asset value per share USD 126.26 119.88 163.35

Unaudited semi-annual report
19Merrill Lynch Investment Solutions
The accompanying notes form an integral part of these financial statements.
Statistical information (cont.)
Year ending as of: September 30, 2016 March 31, 2016 March 31, 2015Merrill Lynch Investment Solutions – York Event-Driven UCITS Fund (cont.)
Class USD C (acc)Number of shares 10.000 10 263.000 12 498.000Net asset value per share USD 117.56 112.19 154.47
Class USD D (acc)Number of shares 66 223.862 1 935.607 1 935.607Net asset value per share USD 134.38 127.43 172.78
Class USD E (acc)Number of shares 86 145.662 126 455.792 1 087 205.857Net asset value per share USD 110.52 104.93 143.00
Class USD F (acc)Number of shares 768 807.486 1 060 906.330 1 556 581.665Net asset value per share USD 104.49 99.73 137.32
Class USD Z (acc)Number of shares 23 900.41 30 882.125 97 229.513Net asset value per share USD 79.65 75.64 103.10
Merrill Lynch Investment Solutions – CCI Healthcare Long-Short UCITS FundTotal Net Assets USD 159 290 592 306 261 657 607 022 016
Class EUR B (acc)Number of shares 190 236.440 712 131.022 1 662 774.359Net asset value per share EUR 123.75 121.01 153.46
Class EUR C (acc)Number of shares 57 295.432 87 814.818 117 147.764Net asset value per share EUR 118.25 116.08 148.54
Class EUR D (acc)Number of shares 1 090.000 1 040.000 7 116.000Net asset value per share EUR 132.33 129.39 163.74
Class EUR Z (acc)Number of shares 5 261.295 10 213.852 1 970.508Net asset value per share EUR 106.82 104.46 133.56
Class GBP B (acc)Number of shares 2 346.821 20 044.422 38 008.240Net asset value per share GBP 129.22 125.85 159.35
Class GBP B (inc) Number of shares – – 10.000Net asset value per share GBP – – 159.81
Class GBP C (acc)Number of shares 5 728.024 8 684.725 9 784.378Net asset value per share GBP 122.15 119.44 152.22
Class GBP C (inc)Number of shares 639.000 751.000 18 304.672Net asset value per share GBP 124.98 122.21 155.66
Unaudited semi-annual report
20 Merrill Lynch Investment Solutions
The accompanying notes form an integral part of these financial statements.
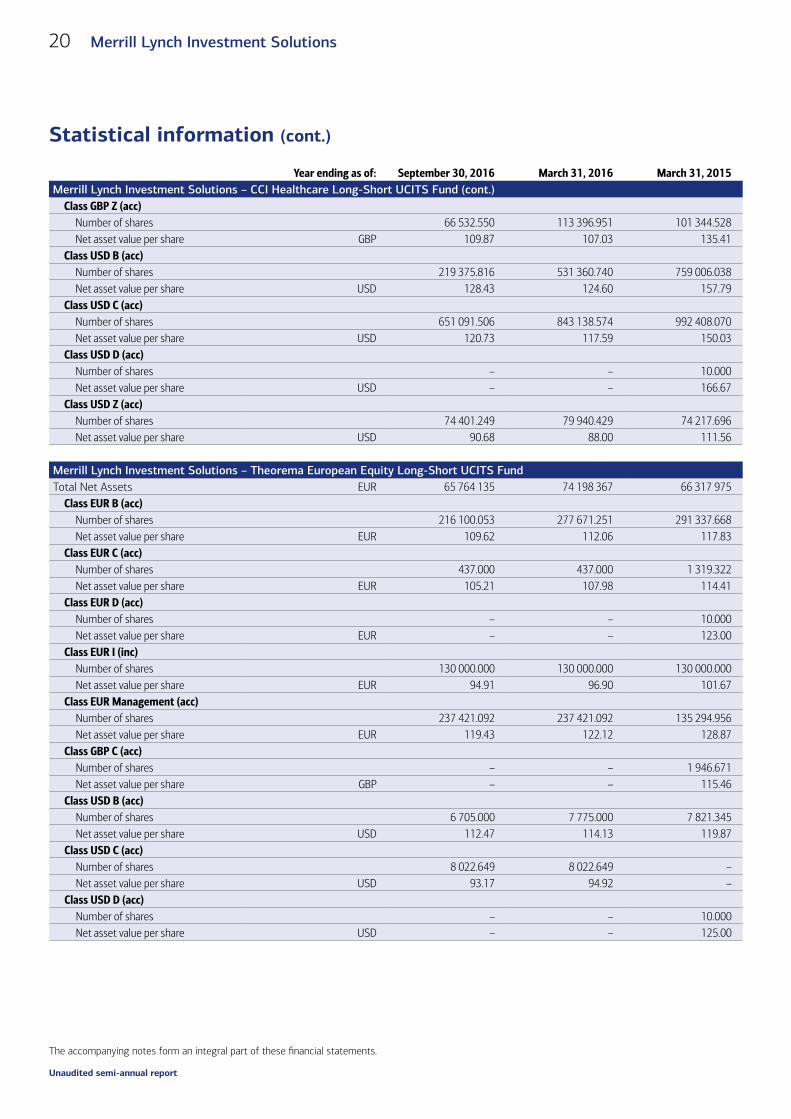
Statistical information (cont.)
Year ending as of: September 30, 2016 March 31, 2016 March 31, 2015Merrill Lynch Investment Solutions – CCI Healthcare Long-Short UCITS Fund (cont.)
Class GBP Z (acc)Number of shares 66 532.550 113 396.951 101 344.528Net asset value per share GBP 109.87 107.03 135.41
Class USD B (acc)Number of shares 219 375.816 531 360.740 759 006.038Net asset value per share USD 128.43 124.60 157.79
Class USD C (acc)Number of shares 651 091.506 843 138.574 992 408.070Net asset value per share USD 120.73 117.59 150.03
Class USD D (acc) Number of shares – – 10.000Net asset value per share USD – – 166.67
Class USD Z (acc)Number of shares 74 401.249 79 940.429 74 217.696Net asset value per share USD 90.68 88.00 111.56
Merrill Lynch Investment Solutions – Theorema European Equity Long-Short UCITS FundTotal Net Assets EUR 65 764 135 74 198 367 66 317 975
Class EUR B (acc)Number of shares 216 100.053 277 671.251 291 337.668Net asset value per share EUR 109.62 112.06 117.83
Class EUR C (acc)Number of shares 437.000 437.000 1 319.322Net asset value per share EUR 105.21 107.98 114.41
Class EUR D (acc) Number of shares – – 10.000Net asset value per share EUR – – 123.00
Class EUR I (inc)Number of shares 130 000.000 130 000.000 130 000.000Net asset value per share EUR 94.91 96.90 101.67
Class EUR Management (acc)Number of shares 237 421.092 237 421.092 135 294.956Net asset value per share EUR 119.43 122.12 128.87
Class GBP C (acc) Number of shares – – 1 946.671Net asset value per share GBP – – 115.46
Class USD B (acc)Number of shares 6 705.000 7 775.000 7 821.345Net asset value per share USD 112.47 114.13 119.87
Class USD C (acc)Number of shares 8 022.649 8 022.649 –Net asset value per share USD 93.17 94.92 –
Class USD D (acc) Number of shares – – 10.000Net asset value per share USD – – 125.00

Unaudited semi-annual report
21Merrill Lynch Investment Solutions
The accompanying notes form an integral part of these financial statements.
Statistical information (cont.)
Year ending as of: September 30, 2016 March 31, 2016 March 31, 2015Merrill Lynch Investment Solutions – York Asian Event-Driven UCITS FundTotal Net Assets EUR 100 829 596 159 561 271 20 330 945
Class CHF D (acc)Number of shares 25 000.000 25 000.000 –Net asset value per share CHF 96.91 99.67 –
Class EUR B (acc)Number of shares 8 117.593 6 660.875 62 637.386Net asset value per share EUR 103.70 106.41 111.50
Class EUR C (acc)Number of shares 10.001 1 359.428 10.001Net asset value per share EUR 99.95 102.96 109.80
Class EUR D (acc)Number of shares 676 950.838 1 224 144.382 18 908.033Net asset value per share EUR 109.04 111.76 116.59
Class GBP C (acc)Number of shares 80.000 80.000 80.000Net asset value per share GBP 104.46 107.33 112.02
Class USD A (acc)Number of shares 10.000 10.000 10.000Net asset value per share USD 106.32 108.54 112.46
Class USD B (acc)Number of shares 102 790.521 116 074.143 100 000.602Net asset value per share USD 105.71 107.92 111.95
Class USD C (acc)Number of shares 10.002 10.002 6 835.350Net asset value per share USD 103.09 105.68 110.42
Class USD D (acc)Number of shares 145 100.475 87 152.387 10.000Net asset value per share USD 110.51 112.68 116.75
Merrill Lynch Investment Solutions – Graham Capital Systematic Macro UCITS Fund Total Net Assets USD – 8 154 558 86 740 197
Class EUR B (acc) 1
Number of shares – 18 915.870 23 584.037Net asset value per share EUR – 101.05 111.80
Class EUR C (acc) 1
Number of shares – 854.611 1 243.228Net asset value per share EUR – 102.02 113.86
Class EUR D (acc)Number of shares – – 10.000Net asset value per share EUR – – 120.64
Class GBP B (acc) 1
Number of shares – 19 613.923 444 102.094Net asset value per share GBP – 104.49 114.76
Class GBP C (acc) 1
Number of shares – 17 295.279 14 967.436Net asset value per share GBP – 104.17 115.51
1 Liquidated on May 11, 2016

Unaudited semi-annual report
22 Merrill Lynch Investment Solutions
The accompanying notes form an integral part of these financial statements.
Statistical information (cont.)
Year ending as of: September 30, 2016 March 31, 2016 March 31, 2015Merrill Lynch Investment Solutions – Graham Capital Systematic Macro UCITS Fund (cont.)
Class GBP D (acc)Number of shares – – 10.000Net asset value per share GBP – – 121.31
Class USD B (acc)Number of shares – – 40 161.436Net asset value per share USD – – 111.03
Class USD C (acc)1
Number of shares – 2 787.850 7 715.320Net asset value per share USD – 123.33 137.28
Merrill Lynch Investment Solutions – AQR Global Relative Value UCITS FundTotal Net Assets USD 1 482 353 429 1 202 298 491 880 471 678
Class CHF A (acc)Number of shares 235 423.584 76 251.299 35 700.000Net asset value per share CHF 109.45 111.44 105.97
Class EUR A (acc)Number of shares 5 537 019.858 3 861 248.195 2 264 864.790Net asset value per share EUR 119.94 121.79 115.08
Class EUR A (inc)Number of shares 1 968 347.751 1 944 439.791 1 774 023.176Net asset value per share EUR 119.72 121.69 114.97
Class EUR C (acc)Number of shares 35 605.782 22 741.343 11 457.717Net asset value per share EUR 114.27 116.64 111.23
Class EUR D (acc)Number of shares – – 9.995Net asset value per share EUR – – 117.18
Class EUR Z (acc)Number of shares 13 815.314 3 267.000 –Net asset value per share EUR 97.72 99.34 –
Class GBP A (acc)Number of shares 1 717 580.287 1 455 249.505 1 504 001.566Net asset value per share GBP 122.78 123.82 115.81
Class GBP A2 (acc)Number of shares 483 167.614 470 261.820 601 163.227Net asset value per share GBP 114.83 115.81 108.64
Class GBP C (acc)Number of shares 45.010 45.010 10.007Net asset value per share GBP 104.84 106.27 113.30
Class GBP D (acc)Number of shares 989.805 989.805 999.805Net asset value per share GBP 125.28 126.34 118.18
Class GBP Z (acc)Number of shares 7 006.370 6 431.476 –Net asset value per share GBP 104.60 105.51 –
1 Liquidated on May 11, 2016
Unaudited semi-annual report
23Merrill Lynch Investment Solutions
The accompanying notes form an integral part of these financial statements.
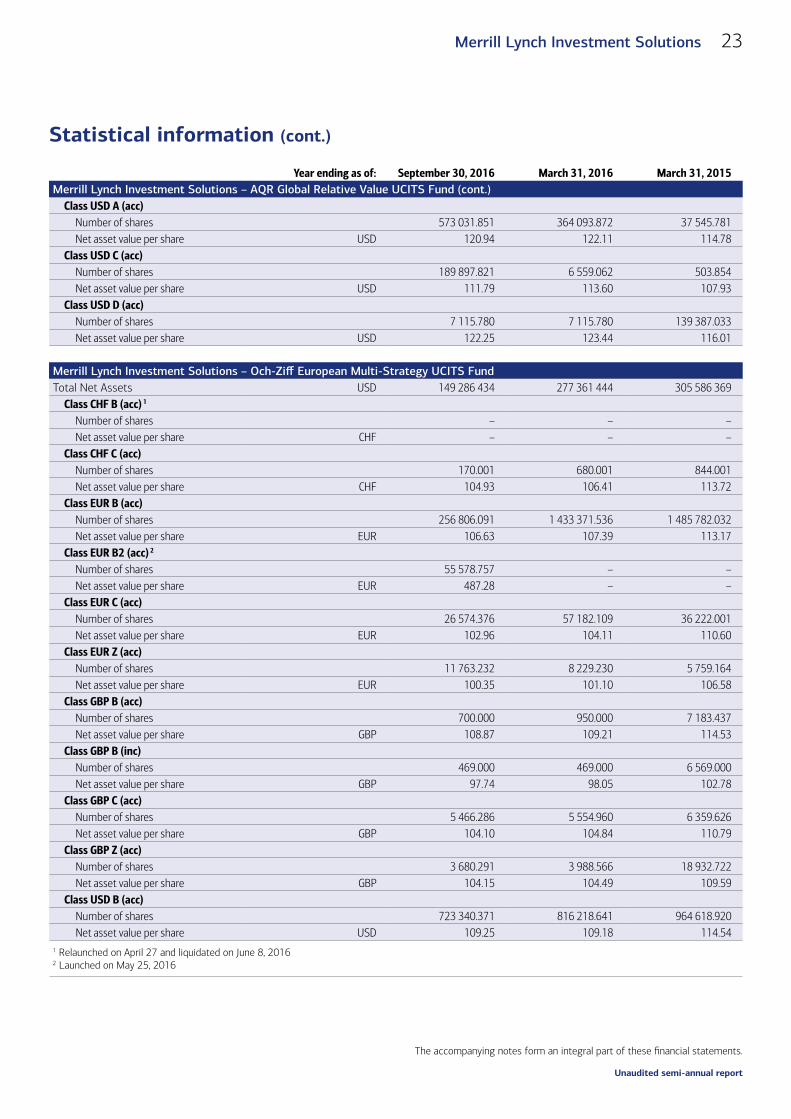
Statistical information (cont.)
Year ending as of: September 30, 2016 March 31, 2016 March 31, 2015Merrill Lynch Investment Solutions – AQR Global Relative Value UCITS Fund (cont.)
Class USD A (acc)Number of shares 573 031.851 364 093.872 37 545.781Net asset value per share USD 120.94 122.11 114.78
Class USD C (acc)Number of shares 189 897.821 6 559.062 503.854Net asset value per share USD 111.79 113.60 107.93
Class USD D (acc)Number of shares 7 115.780 7 115.780 139 387.033Net asset value per share USD 122.25 123.44 116.01
Merrill Lynch Investment Solutions – Och-Ziff European Multi-Strategy UCITS FundTotal Net Assets USD 149 286 434 277 361 444 305 586 369
Class CHF B (acc) 1
Number of shares – – –Net asset value per share CHF – – –
Class CHF C (acc)Number of shares 170.001 680.001 844.001Net asset value per share CHF 104.93 106.41 113.72
Class EUR B (acc)Number of shares 256 806.091 1 433 371.536 1 485 782.032Net asset value per share EUR 106.63 107.39 113.17
Class EUR B2 (acc) 2
Number of shares 55 578.757 – –Net asset value per share EUR 487.28 – –
Class EUR C (acc)Number of shares 26 574.376 57 182.109 36 222.001Net asset value per share EUR 102.96 104.11 110.60
Class EUR Z (acc)Number of shares 11 763.232 8 229.230 5 759.164Net asset value per share EUR 100.35 101.10 106.58
Class GBP B (acc)Number of shares 700.000 950.000 7 183.437Net asset value per share GBP 108.87 109.21 114.53
Class GBP B (inc)Number of shares 469.000 469.000 6 569.000Net asset value per share GBP 97.74 98.05 102.78
Class GBP C (acc)Number of shares 5 466.286 5 554.960 6 359.626Net asset value per share GBP 104.10 104.84 110.79
Class GBP Z (acc)Number of shares 3 680.291 3 988.566 18 932.722Net asset value per share GBP 104.15 104.49 109.59
Class USD B (acc)Number of shares 723 340.371 816 218.641 964 618.920Net asset value per share USD 109.25 109.18 114.54
1 Relaunched on April 27 and liquidated on June 8, 20162 Launched on May 25, 2016

Unaudited semi-annual report
24 Merrill Lynch Investment Solutions
The accompanying notes form an integral part of these financial statements.
Statistical information (cont.)
Year ending as of: September 30, 2016 March 31, 2016 March 31, 2015Merrill Lynch Investment Solutions – Och-Ziff European Multi-Strategy UCITS Fund (cont.)
Class USD C (acc)Number of shares 30 663.748 31 889.517 27 707.931Net asset value per share USD 104.88 105.23 111.30
Class USD Management (acc)Number of shares 200.000 200.000 200.000Net asset value per share USD 101.07 100.26 103.20
Merrill Lynch Investment Solutions – Westchester Merger Arbitrage UCITS Fund 1
Total Net Assets USD – 7 343 220 10 691 494Class EUR B (acc)
Number of shares – – 10.000Net asset value per share EUR – – 109.21
Class EUR C (acc)Number of shares – 109.216 69.700Net asset value per share EUR – 100.12 108.12
Class EUR D (acc)Number of shares – – 10.000Net asset value per share EUR – – 111.56
Class GBP B (acc)Number of shares – – 10.000Net asset value per share GBP – – 110.39
Class GBP B (inc)Number of shares – – 10.000Net asset value per share GBP – – 110.34
Class GBP C (acc)Number of shares – – 10.000Net asset value per share GBP – – 108.21
Class GBP D (acc)Number of shares – – 10.000Net asset value per share GBP – – 112.13
Class USD B (acc)Number of shares – 83.000 26 750.000Net asset value per share USD – 103.32 110.19
Class USD C (acc)Number of shares – – 28.689Net asset value per share USD – – 107.58
Class USD D (acc)Number of shares – – 10.000Net asset value per share USD – – 112.91
Class USD Management (acc)Number of shares – 65 806.670 65 806.670Net asset value per share USD – 111.27 117.36
1 Liquidated on March 31, 2016

Unaudited semi-annual report
25Merrill Lynch Investment Solutions
The accompanying notes form an integral part of these financial statements.
Statistical information (cont.)
Year ending as of: September 30, 2016 March 31, 2016 March 31, 2015Merrill Lynch Investment Solutions – Van Eck Commodities Long-Short Equity UCITS Fund 1
Total Net Assets USD – – 9 942 307Class EUR D (acc)
Number of shares – – 7 435.000Net asset value per share EUR – – 89.00
Class USD B (acc)Number of shares – – 10.000Net asset value per share USD – – 89.30
Class USD C (acc)Number of shares – – 10.000Net asset value per share USD – – 87.71
Class USD Management (acc)Number of shares – – 100 000.000Net asset value per share USD – – 92.30
Merrill Lynch Investment Solutions – Beach Point Diversified Credit UCITS FundTotal Net Assets USD 142 911 380 186 458 516 191 879 123
Class EUR B (acc)Number of shares 664 308.436 833 114.861 620 788.748Net asset value per share EUR 103.43 97.18 101.89
Class EUR C (acc)Number of shares 13 130.944 18 076.091 22 457.150Net asset value per share EUR 101.23 94.50 99.83
Class EUR D (acc)Number of shares 32 354.699 85 670.991 268 811.311Net asset value per share EUR 113.68 105.75 110.29
Class EUR X (inc)Number of shares 182 630.000 540 830.000 589 380.000Net asset value per share EUR 104.61 97.320 101.500
Class EUR Z (acc)Number of shares 2 385.000 3 885.000 3 885.000Net asset value per share EUR 108.03 100.95 105.87
Class GBP B (acc)Number of shares 26 897.588 21 608.879 10.000Net asset value per share GBP 102.82 96.21 100.49
Class GBP B (inc)Number of shares 21 383.746 547.523 10.000Net asset value per share GBP 102.84 96.27 100.49
Class GBP C (acc)Number of shares – – 10.000Net asset value per share GBP – – 99.83
Class GBP X (inc)Number of shares 6 087.011 2 907.692 2 276.940Net asset value per share GBP 103.63 96.97 100.52
1 Liquidated on July 7, 2015
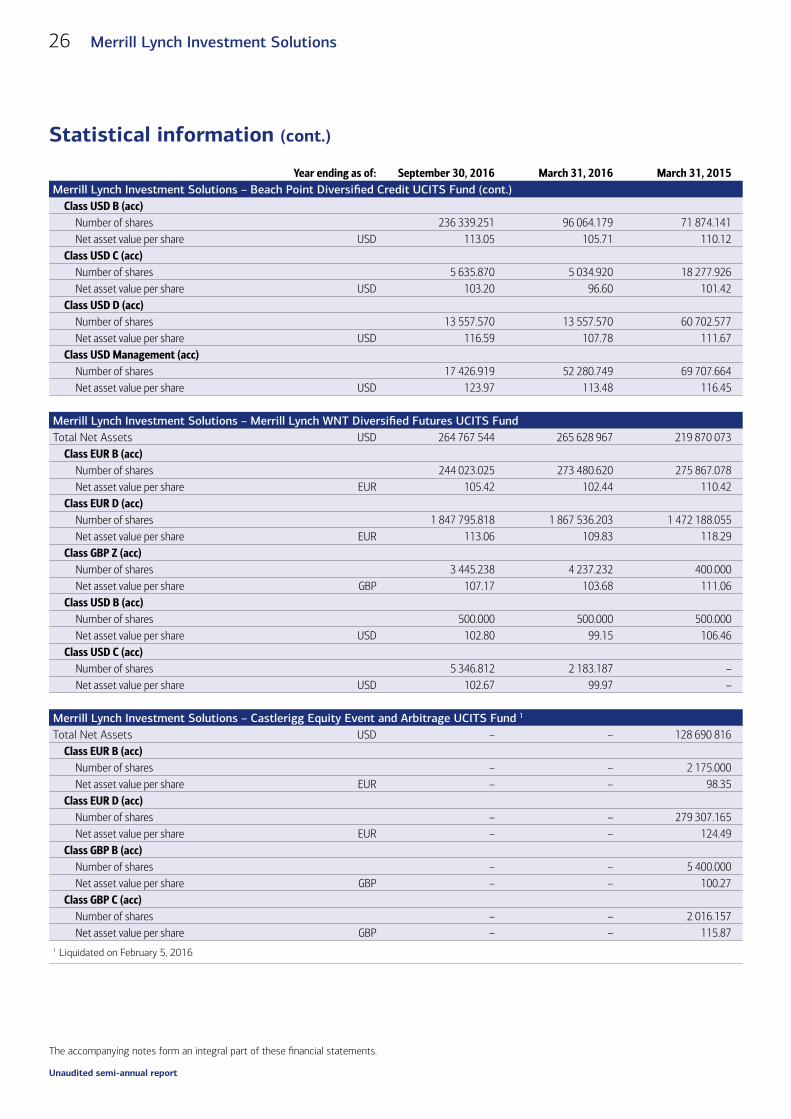
Unaudited semi-annual report
26 Merrill Lynch Investment Solutions
The accompanying notes form an integral part of these financial statements.
Statistical information (cont.)
Year ending as of: September 30, 2016 March 31, 2016 March 31, 2015Merrill Lynch Investment Solutions – Beach Point Diversified Credit UCITS Fund (cont.)
Class USD B (acc)Number of shares 236 339.251 96 064.179 71 874.141Net asset value per share USD 113.05 105.71 110.12
Class USD C (acc)Number of shares 5 635.870 5 034.920 18 277.926Net asset value per share USD 103.20 96.60 101.42
Class USD D (acc)Number of shares 13 557.570 13 557.570 60 702.577Net asset value per share USD 116.59 107.78 111.67
Class USD Management (acc)Number of shares 17 426.919 52 280.749 69 707.664Net asset value per share USD 123.97 113.48 116.45
Merrill Lynch Investment Solutions – Merrill Lynch WNT Diversified Futures UCITS FundTotal Net Assets USD 264 767 544 265 628 967 219 870 073
Class EUR B (acc)Number of shares 244 023.025 273 480.620 275 867.078Net asset value per share EUR 105.42 102.44 110.42
Class EUR D (acc)Number of shares 1 847 795.818 1 867 536.203 1 472 188.055Net asset value per share EUR 113.06 109.83 118.29
Class GBP Z (acc)Number of shares 3 445.238 4 237.232 400.000Net asset value per share GBP 107.17 103.68 111.06
Class USD B (acc)Number of shares 500.000 500.000 500.000Net asset value per share USD 102.80 99.15 106.46
Class USD C (acc)Number of shares 5 346.812 2 183.187 –Net asset value per share USD 102.67 99.97 –
Merrill Lynch Investment Solutions – Castlerigg Equity Event and Arbitrage UCITS Fund 1
Total Net Assets USD – – 128 690 816Class EUR B (acc)
Number of shares – – 2 175.000Net asset value per share EUR – – 98.35
Class EUR D (acc)Number of shares – – 279 307.165Net asset value per share EUR – – 124.49
Class GBP B (acc)Number of shares – – 5 400.000Net asset value per share GBP – – 100.27
Class GBP C (acc)Number of shares – – 2 016.157Net asset value per share GBP – – 115.87
1 Liquidated on February 5, 2016

Unaudited semi-annual report
27Merrill Lynch Investment Solutions
The accompanying notes form an integral part of these financial statements.
Statistical information (cont.)
Year ending as of: September 30, 2016 March 31, 2016 March 31, 2015Merrill Lynch Investment Solutions – Castlerigg Equity Event and Arbitrage UCITS Fund 1 (cont.)
Class GBP D (acc)Number of shares – – 211 886.436Net asset value per share GBP – – 126.30
Class USD B (acc)Number of shares – – 10 000.001Net asset value per share USD – – 101.45
Class USD D (acc)Number of shares – – 174 888.199Net asset value per share USD – – 126.83
Class USD Management (acc)Number of shares – – 208 141.970Net asset value per share USD – – 129.93
Merrill Lynch Investment Solutions – Merrill Lynch Dynamic Capital Protection UCITS FundTotal Net Assets EUR – 27 403 795 49 357 814
Class EUR B (acc) 2
Number of shares – 281 626.003 474 601.290Net asset value per share EUR – 97.31 104.00
Merrill Lynch Investment Solutions – Merrill Lynch Enhanced Equity Volatility Premium FundTotal Net Assets EUR 88 792 828 88 053 215 68 976 668
Class EUR A (acc)Number of shares 792 269.000 787 373.000 489 844.000Net asset value per share EUR 110.27 100.81 103.19
Class EUR B (acc)Number of shares 13 064.062 86 546.774 178 623.527Net asset value per share EUR 109.44 100.29 103.18
Merrill Lynch Investment Solutions – Multi-Strategy Fund of UCITS Fund 3
Total Net Assets EUR – – 9 840 509Class EUR B (inc)
Number of shares – – 40 818.211Net asset value per share EUR – – 105.66
Class EUR C (acc)Number of shares – – 20 000.000Net asset value per share EUR – – 107.32
Class EUR C (inc)Number of shares – – 21 380.000Net asset value per share EUR – – 107.33
Class EUR D (inc)Number of shares – – 9 750.000Net asset value per share EUR – – 111.44
1 Liquidated on February 5, 20162 Liquidated on July 8, 20163 Liquidated on July 2, 2015

Unaudited semi-annual report
28 Merrill Lynch Investment Solutions
The accompanying notes form an integral part of these financial statements.
Statistical information (cont.)
Year ending as of: September 30, 2016 March 31, 2016 March 31, 2015Merrill Lynch Investment Solutions – Merrill Lynch MLCX Commodity Enhanced Beta FundTotal Net Assets USD 19 881 264 18 872 835 91 561 693
Class EUR B (acc)Number of shares 14 222.353 15 789.074 95 640.164Net asset value per share EUR 60.10 56.39 70.47
Class EUR C (acc)Number of shares 146.336 146.336 242.336Net asset value per share EUR 56.50 53.30 67.30
Class EUR E (acc)Number of shares 118 584.573 98 826.861 66 359.878Net asset value per share EUR 113.38 106.30 69.31
Class GBP B (acc)Number of shares 1 608.390 3 561.781 5 770.173Net asset value per share GBP 56.03 52.48 65.18
Class GBP C (acc)Number of shares – – 10.000Net asset value per share GBP – – 68.34
Class GBP E (acc)Number of shares – – 10.000Net asset value per share GBP – – 70.08
Class SEK C (acc)Number of shares 4 115.625 3 317.117 3 146.882Net asset value per share SEK 539.87 510.97 648.99
Class USD B (acc)Number of shares 14 921.254 56 950.498 105 581.025Net asset value per share USD 63.29 58.87 72.81
Class USD C (acc)Number of shares 42 384.538 37 412.833 43 490.976Net asset value per share USD 58.53 54.73 68.40
Class USD E (acc)Number of shares – – 949 034.913Net asset value per share USD – – 71.55
Merrill Lynch Investment Solutions – Merrill Lynch MLCX Commodity Enhanced Beta ex Agriculture FundTotal Net Assets USD 77 079 943 72 173 576 26 126 748
Class EUR B (acc)Number of shares – – 10.000Net asset value per share EUR – – 70.08
Class EUR D (acc)Number of shares 885 573.000 848 729.000 125 700.000Net asset value per share EUR 77.36 69.16 91.24
Class USD B (acc)Number of shares 1 500.000 98 000.000 196 010.000Net asset value per share USD 60.85 53.95 70.45

Unaudited semi-annual report
29Merrill Lynch Investment Solutions
The accompanying notes form an integral part of these financial statements.
Statistical information (cont.)
Year ending as of: September 30, 2016 March 31, 2016 March 31, 2015Merrill Lynch Investment Solutions – Merrill Lynch MLCX Commodity Alpha FundTotal Net Assets USD 21 554 467 22 436 362 –
Class EUR B-5 (acc)Number of shares 7 537.216 7 537.216 –Net asset value per share EUR 119.91 121.42 –
Class EUR C-5 (acc)Number of shares 2 678.284 3 269.798 –Net asset value per share EUR 109.14 111.10 –
Class EUR E-5 (acc)Number of shares 78 313.960 73 350.458 –Net asset value per share EUR 99.38 100.50 –
Class GBP B-5 (acc)Number of shares 56 303.770 56 706.057 –Net asset value per share GBP 123.21 124.06 –
Class USD B-5 (acc)Number of shares 18 328.555 18 328.555 –Net asset value per share USD 122.18 122.83 –
Class USD C-5 (acc)Number of shares 1 943.314 1 943.314 –Net asset value per share USD 109.90 111.06 –
Merrill Lynch Investment Solutions – Fenician Equity Long Short UCITS FundTotal Net Assets EUR 36 953 257 67 257 596 69 118 049
Class EUR B (acc)Number of shares 6 553.527 5 490.831 10.000Net asset value per share EUR 96.99 99.11 105.35
Class EUR C (acc)Number of shares – – 17 510.000Net asset value per share EUR – – 104.84
Class EUR D (acc)Number of shares 227 378.673 285 065.276 58 542.210Net asset value per share EUR 98.01 99.90 105.67
Class EUR I (acc)Number of shares 107.931 150 850.082 375 492.405Net asset value per share EUR 97.51 99.66 105.73
Class EUR Inst Seed (acc)Number of shares 20 088.256 20 088.256 20 088.256Net asset value per share EUR 98.64 100.55 106.42
Class EUR Management (acc)Number of shares 3 023.300 3 023.300 1 500.000Net asset value per share EUR 101.32 102.78 107.90
Class EUR Retail Seed (acc)Number of shares 12 052.228 21 421.658 27 377.340Net asset value per share EUR 98.55 100.46 106.37

Unaudited semi-annual report
30 Merrill Lynch Investment Solutions
The accompanying notes form an integral part of these financial statements.
Statistical information (cont.)
Year ending as of: September 30, 2016 March 31, 2016 March 31, 2015Merrill Lynch Investment Solutions – Fenician Equity Long Short UCITS Fund (cont.)
Class EUR Z (acc)Number of shares 22 854.796 20 678.517 –Net asset value per share EUR 91.12 93.13 –
Class GBP B (acc) 1
Number of shares – 22 000.000 –Net asset value per share GBP – 93.81 –
Class GBP C (acc)Number of shares 650.000 650.000 –Net asset value per share GBP 93.25 95.32 –
Class GBP Management (acc)Number of shares 2 683.050 2 782.896 2 000.073Net asset value per share GBP 102.22 103.32 108.09
Class USD D (acc)Number of shares 9 630.492 13 577.195 –Net asset value per share USD 93.68 94.89 –
Class USD I (acc) 2
Number of shares – 61 068.166 41 207.240Net asset value per share USD – 99.87 105.61
Class USD Inst Seed (acc)Number of shares 82 212.330 82 212.330 119 569.328Net asset value per share USD 99.42 100.71 106.26
Merrill Lynch Investment Solutions – APQ Emerging Markets UCITS Fund 3
Total Net Assets USD – – 18 182 407Class CAD Management (acc)
Number of shares – – 74 712.780Net asset value per share USD – – 88.81
Class USD B (acc)Number of shares – – 10.000Net asset value per share USD – – 87.14
Class USD Management (acc)Number of shares – – 149 999.000Net asset value per share USD – – 86.28
Merrill Lynch Investment Solutions – Zeal Greater China Long Short UCITS FundTotal Net Assets USD 35 863 875 28 818 083 20 340 116
Class EUR D (acc) 4
Number of shares 8 082.519 14 064.741 –Net asset value per share EUR 101.25 96.83 –
Class USD B (acc)Number of shares 859.313 859.313 10.000Net asset value per share USD 105.12 97.80 111.66
1 Liquidated on June 22, 20162 Liquidated on April 22, 20163 Liquidated on September 9, 20154 Liquidated on June 30, 2016 and relaunched on August 31, 2016
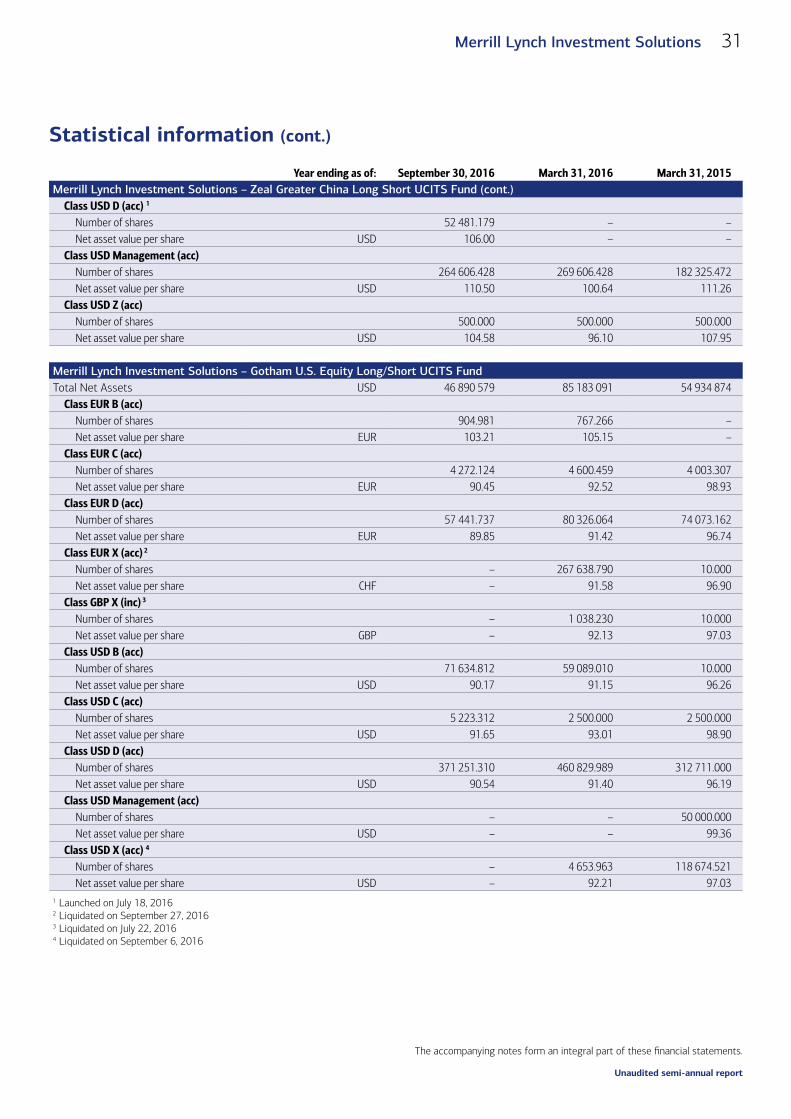
Unaudited semi-annual report
31Merrill Lynch Investment Solutions
The accompanying notes form an integral part of these financial statements.
Statistical information (cont.)
Year ending as of: September 30, 2016 March 31, 2016 March 31, 2015Merrill Lynch Investment Solutions – Zeal Greater China Long Short UCITS Fund (cont.)
Class USD D (acc) 1
Number of shares 52 481.179 – –Net asset value per share USD 106.00 – –
Class USD Management (acc)Number of shares 264 606.428 269 606.428 182 325.472Net asset value per share USD 110.50 100.64 111.26
Class USD Z (acc)Number of shares 500.000 500.000 500.000Net asset value per share USD 104.58 96.10 107.95
Merrill Lynch Investment Solutions – Gotham U.S. Equity Long/Short UCITS FundTotal Net Assets USD 46 890 579 85 183 091 54 934 874
Class EUR B (acc)Number of shares 904.981 767.266 –Net asset value per share EUR 103.21 105.15 –
Class EUR C (acc)Number of shares 4 272.124 4 600.459 4 003.307Net asset value per share EUR 90.45 92.52 98.93
Class EUR D (acc)Number of shares 57 441.737 80 326.064 74 073.162Net asset value per share EUR 89.85 91.42 96.74
Class EUR X (acc) 2
Number of shares – 267 638.790 10.000Net asset value per share CHF – 91.58 96.90
Class GBP X (inc) 3
Number of shares – 1 038.230 10.000Net asset value per share GBP – 92.13 97.03
Class USD B (acc)Number of shares 71 634.812 59 089.010 10.000Net asset value per share USD 90.17 91.15 96.26
Class USD C (acc)Number of shares 5 223.312 2 500.000 2 500.000Net asset value per share USD 91.65 93.01 98.90
Class USD D (acc)Number of shares 371 251.310 460 829.989 312 711.000Net asset value per share USD 90.54 91.40 96.19
Class USD Management (acc)Number of shares – – 50 000.000Net asset value per share USD – – 99.36
Class USD X (acc) 4
Number of shares – 4 653.963 118 674.521Net asset value per share USD – 92.21 97.03
1 Launched on July 18, 20162 Liquidated on September 27, 20163 Liquidated on July 22, 20164 Liquidated on September 6, 2016

Unaudited semi-annual report
32 Merrill Lynch Investment Solutions
The accompanying notes form an integral part of these financial statements.
Statistical information (cont.)
Year ending as of: September 30, 2016 March 31, 2016 March 31, 2015Merrill Lynch Investment Solutions – Merrill Lynch Credit Fund 2016Total Net Assets EUR 112 960 278 113 068 868 –
Class EUR B (inc)Number of shares 1 200 000.000 1 200 000.000 –Net asset value per share EUR 94.13 94.22 –
Merrill Lynch Investment Solutions – Passport Capital Global Equity Long Short UCITS FundTotal Net Assets USD 40 677 669 41 421 742 –
Class CHF C (acc)Number of shares 1 450.000 2 500.000 –Net asset value per share CHF 96.25 97.61 –
Class CHF D (acc) 1
Number of shares 20 000.000 – –Net asset value per share CHF 98.76 – –
Class EUR B (acc) 2
Number of shares 5 000.000 – –Net asset value per share EUR 99.49 – –
Class EUR D (acc)Number of shares 233 912.738 298 682.144 –Net asset value per share EUR 94.32 94.86 –
Class USD B (acc)Number of shares 74 156.436 50 328.000 –Net asset value per share USD 100.32 100.32 –
Class USD C (acc)Number of shares 8.000 8.000 –Net asset value per share USD 99.39 99.89 –
Class USD D (acc)Number of shares 51 741.510 32 206.364 –Net asset value per share USD 95.33 95.16 –
Class USD Management (acc)Number of shares 7 983.118 7 983.118 –Net asset value per share USD 96.39 95.77 –
Merrill Lynch Investment Solutions – Willowbridge-Praxis Global Macro UCITS FundTotal Net Assets USD 43 991 070 44 441 650 –
Class EUR D (acc)Number of shares 85 930.855 108 432.134 –Net asset value per share EUR 95.13 98.61 –
Class USD B (acc)Number of shares 10.000 10.000 –Net asset value per share USD 95.39 98.35 –
Class USD C (acc)Number of shares 2 110.000 10.000 –Net asset value per share USD 94.61 97.97 –
1 Launched on May 6, 20162 Launched on May 20, 2016

Unaudited semi-annual report
33Merrill Lynch Investment Solutions
The accompanying notes form an integral part of these financial statements.
Statistical information (cont.)
Year ending as of: September 30, 2016 March 31, 2016 March 31, 2015Merrill Lynch Investment Solutions – Willowbridge-Praxis Global Macro UCITS Fund (cont.)
Class USD D (acc)Number of shares 57 292.927 25 249.984 –Net asset value per share USD 96.54 99.35 –
Class USD Management (acc)Number of shares 302 511.518 302 511.518 –Net asset value per share USD 96.11 98.33 –
Merrill Lynch Investment Solutions – Ramius Merger Arbitrage UCITS Fund 1
Total Net Assets USD 19 401 671 – –Class USD B (acc) 1
Number of shares 10.000 – –Net asset value per share USD 102.15 – –
Class USD C (acc) 1
Number of shares 10.000 – –Net asset value per share USD 102.00 – –
Class USD D (acc) Number of shares 38 721.294 – –Net asset value per share USD 102.41 – –
Class USD Management (acc) Number of shares 149 970.000 – –Net asset value per share USD 102.91 – –
Merrill Lynch Investment Solutions – Merrill Lynch Enhanced Cross-Asset Volatility Premium Fund 2
Total Net Assets EUR 50 455 511 – –Class EUR A (acc)
Number of shares 501 790.000 – –Net asset value per share EUR 100.55 – –
1 Launched on July 8, 20162 Launched on September 16, 2016

The accompanying notes form an integral part of these financial statements.
Schedule of Investments as at September 30, 2016 (expressed in USD)
Merrill Lynch Investment Solutions – Marshall WaceTOPS UCITS Fund (Market Neutral)
34 Merrill Lynch Investment Solutions
Unaudited semi-annual report
Schedule of Investments as at September 30, 2016 (expressed in USD)
Quantity DescriptionQuotation
CurrencyCost USD
Market value
USD% of net
assets
Transferable securities and money market instruments admitted to an official exchange listing or dealt in on another regulated market (cont.)
Shares (cont.)123 696 8Point3 Energy Partners LP USD 1 812 146 1 781 222 0.06
14 384 8x8, Inc. USD 217 339 221 945 0.01760 640 A2A SpA EUR 1 027 244 1 074 493 0.03
140 AAR Corp. USD 3 990 4 385 0.0097 ABIOMED, Inc. USD 8 524 12 472 0.00
4 939 AC Immune S.A. USD 77 345 81 345 0.0058 895 Acacia Research Corp. USD 339 824 383 995 0.0149 113 Acadia Healthcare Co, Inc. USD 2 456 668 2 433 549 0.08
2 833 Achillion Pharmaceuticals, Inc. USD 23 259 22 947 0.0022 850 Activision Blizzard, Inc. USD 928 652 1 012 255 0.03
7 957 adidas AG - ADR USD 667 309 691 463 0.0248 995 Adobe Systems, Inc. USD 4 707 447 5 317 917 0.17
168 964 Advance Auto Parts, Inc. USD 26 510 387 25 195 912 0.801 943 207 Advanced Micro Devices, Inc. USD 11 755 348 13 427 560 0.43
249 412 Advantage Oil & Gas Ltd. CAD 1 350 029 1 745 931 0.0672 415 AES Corp. USD 937 774 930 533 0.03
142 880 Affiliated Managers Group, Inc. USD 22 547 711 20 674 736 0.6625 505 Agilent Technologies, Inc. USD 1 016 023 1 201 030 0.04
786 Agios Pharmaceuticals, Inc. USD 34 637 41 517 0.00117 309 Air Lease Corp. USD 3 303 600 3 352 691 0.11
78 906 Air Products & Chemicals, Inc. USD 11 916 878 11 862 728 0.38118 614 Akamai Technologies, Inc. USD 6 145 657 6 285 356 0.20140 699 Alaska Air Group, Inc. USD 9 205 936 9 266 436 0.29
2 185 Alder Biopharmaceuticals, Inc. USD 71 432 71 602 0.0050 383 Alere, Inc. USD 2 091 769 2 178 561 0.07
908 Alexion Pharmaceuticals, Inc. USD 113 035 111 266 0.0058 085 Alimentation Couche-Tard, Inc. - B CAD 2 449 427 2 810 001 0.09
1 565 Alkermes Plc. USD 74 350 73 602 0.00148 562 Allegion Plc. USD 10 078 898 10 237 407 0.32147 290 Allison Transmission Hldg., Inc. USD 4 076 062 4 224 277 0.13
3 868 Allscripts Healthcare Solutions, Inc. USD 50 438 50 942 0.00154 578 Alpek SAB de CV MXN 263 065 262 935 0.01
21 418 Alphabet, Inc. - A USD 16 603 669 17 221 357 0.5554 Alphabet, Inc. - C USD 42 192 41 974 0.00
6 384 Alsea SAB de CV MXN 22 984 21 698 0.006 267 Amazon.com, Inc. USD 4 800 419 5 247 422 0.17
52 088 AMC Networks, Inc. - A USD 2 723 115 2 701 284 0.0954 538 Amedisys, Inc. USD 2 706 948 2 587 283 0.0829 849 American Axle & Manufacturing Hldg., Inc. USD 497 809 514 000 0.02
573 American Eagle Outfitters, Inc. USD 10 180 10 234 0.00488 477 American Homes 4 Rent - A USD 10 642 746 10 570 642 0.34
543 American Woodmark Corp. USD 44 123 43 750 0.00979 Amgen, Inc. USD 167 187 163 307 0.01
Merrill Lynch Investment Solutions – Marshall WaceTOPS UCITS Fund (Market Neutral)
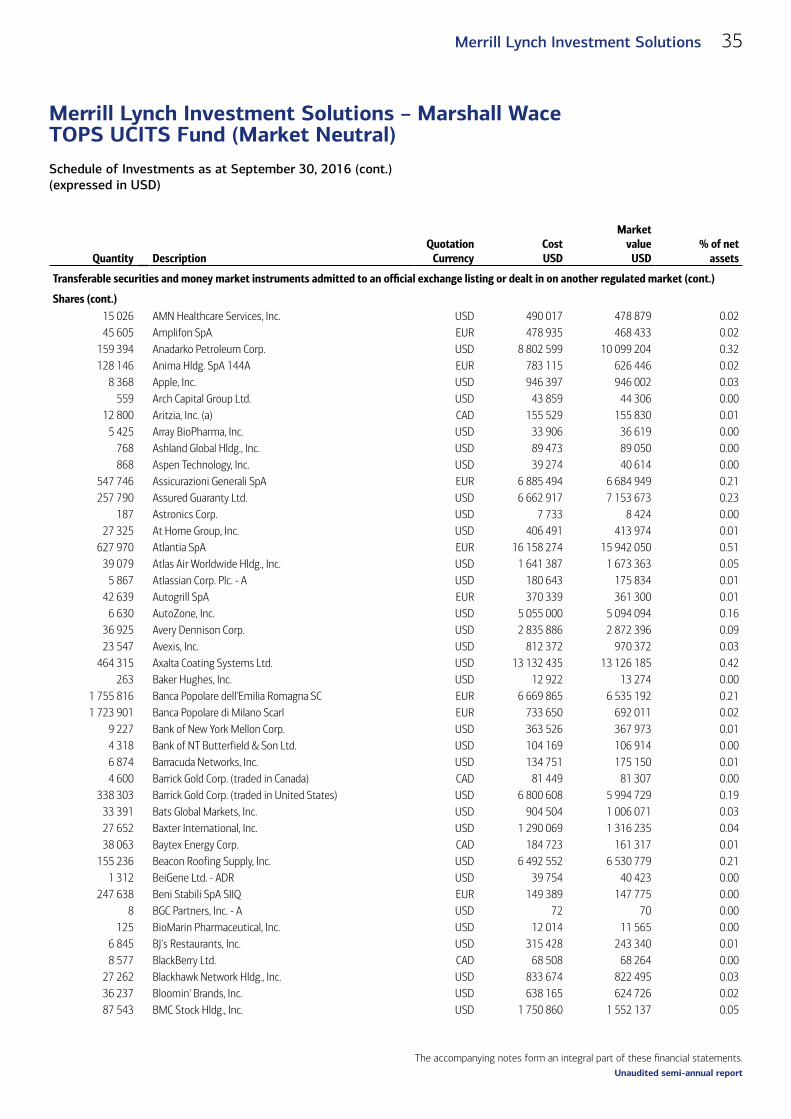
The accompanying notes form an integral part of these financial statements.
Schedule of Investments as at September 30, 2016 (cont.)(expressed in USD)
Merrill Lynch Investment Solutions – Marshall WaceTOPS UCITS Fund (Market Neutral)
35Merrill Lynch Investment Solutions
Unaudited semi-annual report
Quantity DescriptionQuotation
CurrencyCost USD
Market value
USD% of net
assets
Transferable securities and money market instruments admitted to an official exchange listing or dealt in on another regulated market (cont.)
Shares (cont.)15 026 AMN Healthcare Services, Inc. USD 490 017 478 879 0.0245 605 Amplifon SpA EUR 478 935 468 433 0.02
159 394 Anadarko Petroleum Corp. USD 8 802 599 10 099 204 0.32128 146 Anima Hldg. SpA 144A EUR 783 115 626 446 0.02
8 368 Apple, Inc. USD 946 397 946 002 0.03559 Arch Capital Group Ltd. USD 43 859 44 306 0.00
12 800 Aritzia, Inc. (a) CAD 155 529 155 830 0.015 425 Array BioPharma, Inc. USD 33 906 36 619 0.00
768 Ashland Global Hldg., Inc. USD 89 473 89 050 0.00868 Aspen Technology, Inc. USD 39 274 40 614 0.00
547 746 Assicurazioni Generali SpA EUR 6 885 494 6 684 949 0.21257 790 Assured Guaranty Ltd. USD 6 662 917 7 153 673 0.23
187 Astronics Corp. USD 7 733 8 424 0.0027 325 At Home Group, Inc. USD 406 491 413 974 0.01
627 970 Atlantia SpA EUR 16 158 274 15 942 050 0.5139 079 Atlas Air Worldwide Hldg., Inc. USD 1 641 387 1 673 363 0.05
5 867 Atlassian Corp. Plc. - A USD 180 643 175 834 0.0142 639 Autogrill SpA EUR 370 339 361 300 0.01
6 630 AutoZone, Inc. USD 5 055 000 5 094 094 0.1636 925 Avery Dennison Corp. USD 2 835 886 2 872 396 0.0923 547 Avexis, Inc. USD 812 372 970 372 0.03
464 315 Axalta Coating Systems Ltd. USD 13 132 435 13 126 185 0.42263 Baker Hughes, Inc. USD 12 922 13 274 0.00
1 755 816 Banca Popolare dell'Emilia Romagna SC EUR 6 669 865 6 535 192 0.211 723 901 Banca Popolare di Milano Scarl EUR 733 650 692 011 0.02
9 227 Bank of New York Mellon Corp. USD 363 526 367 973 0.014 318 Bank of NT Butterfield & Son Ltd. USD 104 169 106 914 0.006 874 Barracuda Networks, Inc. USD 134 751 175 150 0.014 600 Barrick Gold Corp. (traded in Canada) CAD 81 449 81 307 0.00
338 303 Barrick Gold Corp. (traded in United States) USD 6 800 608 5 994 729 0.1933 391 Bats Global Markets, Inc. USD 904 504 1 006 071 0.0327 652 Baxter International, Inc. USD 1 290 069 1 316 235 0.0438 063 Baytex Energy Corp. CAD 184 723 161 317 0.01
155 236 Beacon Roofing Supply, Inc. USD 6 492 552 6 530 779 0.211 312 BeiGene Ltd. - ADR USD 39 754 40 423 0.00
247 638 Beni Stabili SpA SIIQ EUR 149 389 147 775 0.008 BGC Partners, Inc. - A USD 72 70 0.00
125 BioMarin Pharmaceutical, Inc. USD 12 014 11 565 0.006 845 BJ's Restaurants, Inc. USD 315 428 243 340 0.018 577 BlackBerry Ltd. CAD 68 508 68 264 0.00
27 262 Blackhawk Network Hldg., Inc. USD 833 674 822 495 0.0336 237 Bloomin' Brands, Inc. USD 638 165 624 726 0.0287 543 BMC Stock Hldg., Inc. USD 1 750 860 1 552 137 0.05

The accompanying notes form an integral part of these financial statements.
Schedule of Investments as at September 30, 2016 (cont.)(expressed in USD)
Merrill Lynch Investment Solutions – Marshall WaceTOPS UCITS Fund (Market Neutral)
36 Merrill Lynch Investment Solutions
Unaudited semi-annual report
Quantity DescriptionQuotation
CurrencyCost USD
Market value
USD% of net
assets
Transferable securities and money market instruments admitted to an official exchange listing or dealt in on another regulated market (cont.)
Shares (cont.)233 149 Booz Allen Hamilton Hldg. Corp. USD 6 748 142 7 369 840 0.23387 531 Boston Scientific Corp. USD 9 152 258 9 223 238 0.29378 386 Boyd Gaming Corp. USD 6 749 220 7 484 475 0.24
2 210 Braskem S.A. - ADR USD 27 681 33 990 0.00185 Bright Horizons Family Solutions, Inc. USD 12 352 12 375 0.00
212 590 Bristol-Myers Squibb Co. USD 12 655 288 11 462 853 0.362 919 Broadcom Ltd. USD 494 407 503 586 0.024 371 Brookfield Asset Management, Inc. - A CAD 146 866 153 422 0.011 590 Brookfield Infrastructure Partners LP CAD 54 902 54 998 0.00
293 642 Bruker Corp. USD 7 350 903 6 650 991 0.2118 352 Buffalo Wild Wings, Inc. USD 2 706 494 2 582 860 0.08
304 037 Builders FirstSource, Inc. USD 3 289 124 3 499 466 0.1126 730 Callaway Golf Co. USD 231 653 310 335 0.01
131 477 Callidus Software, Inc. USD 2 375 224 2 412 603 0.08582 525 Callon Petroleum Co. USD 6 834 312 9 145 643 0.29
5 122 Campbell Soup Co. USD 293 579 280 173 0.014 415 Canadian Tire Corp. Ltd. - A CAD 471 808 441 349 0.01
33 614 CARBO Ceramics, Inc. USD 446 397 367 737 0.019 867 CarMax, Inc. USD 536 914 526 404 0.025 827 Cascades, Inc. CAD 56 189 56 884 0.00
866 Casey's General Stores, Inc. USD 102 556 104 050 0.00322 212 Catalent, Inc. USD 7 686 097 8 325 958 0.26
12 654 Cavium, Inc. USD 680 765 736 463 0.0283 531 CBOE Hldg., Inc. USD 5 584 950 5 416 985 0.17
271 412 CBS Corp. - B USD 13 706 243 14 857 093 0.47595 CDK Global, Inc. USD 34 219 34 129 0.00
8 625 Celanese Corp. - A USD 555 707 574 080 0.0223 602 Celgene Corp. USD 2 490 939 2 467 117 0.0834 367 Cenovus Energy, Inc. (traded in Canada) CAD 486 774 492 395 0.0258 234 Cenovus Energy, Inc. (traded in United States) USD 813 919 836 823 0.0337 443 Cerved Information Solutions SpA EUR 308 492 316 851 0.01
4 482 Charter Communications, Inc. - A USD 1 017 189 1 210 006 0.048 121 Check Point Software Technologies Ltd. USD 614 481 630 271 0.02
56 583 Cheesecake Factory, Inc. USD 2 897 217 2 832 545 0.0950 420 Chesapeake Energy Corp. USD 353 990 316 133 0.01
687 Cia Cervecerias Unidas S.A. - ADR USD 14 066 13 871 0.007 752 Cia Paranaense de Energia - ADR USD 82 456 80 388 0.00
142 388 Cimarex Energy Co. USD 17 200 800 19 132 676 0.6149 874 Cintas Corp. USD 5 711 375 5 615 812 0.1842 766 Citrix Systems, Inc. USD 3 470 541 3 644 519 0.12
343 Clorox Co. USD 42 837 42 937 0.00694 CME Group, Inc. USD 72 577 72 537 0.00
3 767 Cobalt International Energy, Inc. USD 10 935 4 671 0.00

The accompanying notes form an integral part of these financial statements.
Schedule of Investments as at September 30, 2016 (cont.)(expressed in USD)
Merrill Lynch Investment Solutions – Marshall WaceTOPS UCITS Fund (Market Neutral)
37Merrill Lynch Investment Solutions
Unaudited semi-annual report
Quantity DescriptionQuotation
CurrencyCost USD
Market value
USD% of net
assets
Transferable securities and money market instruments admitted to an official exchange listing or dealt in on another regulated market (cont.)
Shares (cont.)804 Coca-Cola Femsa SAB de CV- ADR USD 58 575 60 300 0.00
101 158 Cognizant Technology Solutions Corp. - A USD 4 811 515 4 826 248 0.152 462 Colfax Corp. USD 72 149 77 381 0.001 782 Collegium Pharmaceutical, Inc. USD 25 215 34 321 0.002 945 Columbia Sportswear Co. USD 164 243 167 099 0.011 629 Comfort Systems USA, Inc. USD 51 901 47 746 0.00
451 409 CommScope Hldg. Co., Inc. USD 13 405 353 13 591 925 0.4343 217 ConAgra Foods, Inc. USD 1 873 064 2 035 953 0.06
172 807 CONSOL Energy, Inc. USD 2 962 505 3 317 894 0.1114 587 Constellation Brands, Inc. - A USD 2 408 534 2 428 590 0.0829 654 Constellium NV - A USD 569 983 213 509 0.0139 291 Continental Building Products, Inc. USD 735 170 824 718 0.03
554 584 Controladora Vuela Cia de Aviacion SAB de CV MXN 992 741 967 409 0.0348 992 Controladora Vuela Cia de Aviacion SAB de CV - ADR USD 890 404 851 971 0.0358 926 Cooper Tire & Rubber Co. USD 2 120 687 2 240 367 0.07
1 486 Corrections Corp. of America USD 23 333 20 611 0.0050 932 Cosan Ltd. - A USD 356 154 364 164 0.0158 154 Coty, Inc. - A USD 1 355 716 1 366 619 0.0446 798 CR Bard, Inc. USD 10 326 156 10 495 855 0.33
78 Crescent Point Energy Corp. (traded in Canada) CAD 998 1 027 0.00255 Crescent Point Energy Corp. (traded in United States) USD 3 513 3 366 0.00
272 779 CSX Corp. USD 6 992 889 8 319 760 0.2668 749 Cvent, Inc. USD 2 254 725 2 180 031 0.07
79 CVS Health Corp. USD 7 124 7 030 0.0016 602 CyberArk Software Ltd. USD 831 501 822 961 0.03
235 480 CyrusOne, Inc. USD 12 001 065 11 201 784 0.3622 007 Dana, Inc. USD 332 446 343 089 0.0129 634 Darden Restaurants, Inc. USD 1 833 597 1 817 157 0.0683 046 Dave & Buster's Entertainment, Inc. USD 3 161 283 3 253 742 0.1054 384 Davide Campari-Milano SpA EUR 611 268 613 001 0.0299 262 DaVita, Inc. USD 6 413 206 6 558 240 0.21
5 398 De' Longhi SpA EUR 135 981 130 668 0.0084 176 Dell Technologies, Inc. - V USD 4 032 402 4 023 613 0.13
2 264 Delphi Automotive Plc. USD 157 350 161 468 0.01199 704 Delta Air Lines, Inc. USD 7 552 217 7 860 349 0.25840 415 Denbury Resources, Inc. USD 3 368 101 2 714 540 0.09124 429 Dentsply Sirona, Inc. USD 7 605 786 7 394 815 0.23
46 282 Devon Energy Corp. USD 1 980 618 2 041 499 0.06128 658 DH Corp. CAD 3 280 781 2 776 291 0.09181 256 Diamond Offshore Drilling, Inc. USD 3 973 715 3 191 918 0.10
7 094 Diamondback Energy, Inc. USD 667 675 684 855 0.028 218 DiaSorin SpA EUR 507 388 528 264 0.02
42 937 Diebold, Inc. USD 1 098 692 1 064 408 0.03

The accompanying notes form an integral part of these financial statements.
Schedule of Investments as at September 30, 2016 (cont.)(expressed in USD)
Merrill Lynch Investment Solutions – Marshall WaceTOPS UCITS Fund (Market Neutral)
38 Merrill Lynch Investment Solutions
Unaudited semi-annual report
Quantity DescriptionQuotation
CurrencyCost USD
Market value
USD% of net
assets
Transferable securities and money market instruments admitted to an official exchange listing or dealt in on another regulated market (cont.)
Shares (cont.)210 Dillard's, Inc. - A USD 12 944 13 232 0.00
1 746 Discovery Communications, Inc. - A USD 45 449 47 002 0.0024 176 DISH Network Corp. - A USD 1 248 023 1 324 361 0.0444 176 Dollarama, Inc. CAD 3 111 284 3 442 989 0.11
1 755 Dominion Diamond Corp. USD 17 097 17 094 0.003 311 Domino's Pizza, Inc. USD 504 135 502 775 0.022 578 DR Horton, Inc. USD 78 470 77 856 0.00
213 898 Dr Pepper Snapple Group, Inc. USD 19 893 903 19 531 026 0.6216 006 DSW, Inc. - A USD 331 294 327 803 0.0116 998 Dycom Industries, Inc. USD 1 437 950 1 390 096 0.04
115 091 Dynegy, Inc. USD 1 465 698 1 425 978 0.052 602 Eaton Corp. Plc. USD 166 779 170 977 0.01
195 Ebix, Inc. USD 10 988 11 086 0.004 798 Eclipse Resources Corp. USD 16 793 15 785 0.00
82 Ecolab, Inc. USD 9 875 9 981 0.006 486 Edwards Lifesciences Corp. USD 762 234 781 952 0.038 895 El Puerto de Liverpool SAB de CV - C1 MXN 92 970 93 410 0.00
468 elf Beauty, Inc. USD 11 720 13 160 0.00199 574 Enav SpA 144A EUR 780 388 820 421 0.03
4 617 Energen Corp. USD 245 236 266 493 0.011 946 Energy Recovery, Inc. USD 23 475 31 097 0.00
123 400 Enerplus Corp. (traded in Canada) CAD 704 622 790 586 0.0347 828 Enerplus Corp. (traded in United States) USD 294 544 306 577 0.01
301 721 Eni SpA EUR 4 346 109 4 346 930 0.14208 252 Ensco Plc. - A USD 1 737 537 1 770 142 0.06
47 633 EOG Resources, Inc. USD 4 490 754 4 606 587 0.15254 143 Estee Lauder Cos, Inc. - A USD 22 769 084 22 506 904 0.71
16 Esterline Technologies Corp. USD 1 207 1 217 0.0077 467 Euronav NV USD 675 394 591 073 0.0211 929 Everest Re Group Ltd. USD 2 257 491 2 266 152 0.07
6 810 Evolent Health, Inc. - Class A USD 160 912 167 662 0.0133 571 EXOR SpA EUR 1 277 151 1 360 062 0.0447 199 Expedia, Inc. USD 5 100 975 5 509 067 0.17
1 449 Express Scripts Hldg. Co. USD 101 599 102 198 0.00172 200 Extended Stay America, Inc. USD 2 457 294 2 445 240 0.08
61 813 F5 Networks, Inc. USD 6 804 644 7 704 372 0.241 111 Fabrinet USD 48 866 49 539 0.002 399 Facebook, Inc. - A USD 308 938 307 720 0.01
101 652 Fairmount Santrol Hldg., Inc. USD 604 829 862 009 0.03102 165 Ferro Corp. USD 1 239 089 1 410 899 0.04
99 678 FinecoBank Banca Fineco SpA EUR 591 487 577 454 0.0215 228 First Hawaiian, Inc. USD 404 990 409 024 0.01
390 First Majestic Silver Corp. (traded in Canada) CAD 4 063 4 015 0.00

The accompanying notes form an integral part of these financial statements.
Schedule of Investments as at September 30, 2016 (cont.)(expressed in USD)
Merrill Lynch Investment Solutions – Marshall WaceTOPS UCITS Fund (Market Neutral)
39Merrill Lynch Investment Solutions
Unaudited semi-annual report
Quantity DescriptionQuotation
CurrencyCost USD
Market value
USD% of net
assets
Transferable securities and money market instruments admitted to an official exchange listing or dealt in on another regulated market (cont.)
Shares (cont.)4 489 First Majestic Silver Corp. (traded in United States) USD 47 553 46 237 0.00
172 722 First Quantum Minerals Ltd. CAD 1 449 112 1 427 248 0.0516 504 FirstEnergy Corp. USD 539 723 545 952 0.0268 110 Fiserv, Inc. USD 6 959 115 6 774 902 0.22
7 305 Fitbit, Inc. - A USD 110 124 108 406 0.00158 133 Five9, Inc. USD 2 237 294 2 479 525 0.08
51 245 FleetCor Technologies, Inc. USD 7 650 129 8 902 794 0.2828 280 Fleetmatics Group Plc. USD 1 695 157 1 696 234 0.0590 778 FLIR Systems, Inc. USD 2 819 440 2 852 245 0.09
145 948 FMC Technologies, Inc. USD 3 955 509 4 330 277 0.14112 907 Fortinet, Inc. USD 3 993 057 4 169 656 0.13233 300 Fortive Corp. USD 11 745 639 11 874 970 0.38
41 441 Francesca's Hldg. Corp. USD 637 589 639 435 0.023 096 G&K Services Inc - A USD 296 829 295 637 0.01
15 252 G-III Apparel Group Ltd. USD 445 249 444 596 0.0131 649 GameStop Corp. - A USD 899 332 873 196 0.03
145 294 GCP Applied Technologies, Inc. USD 3 779 104 4 114 726 0.1314 190 General Cable Corp. USD 209 394 212 566 0.01
6 365 General Electric Co. USD 189 425 188 531 0.012 312 GenMark Diagnostics, Inc. USD 27 355 27 282 0.00
239 148 Genworth Financial, Inc. - A USD 643 877 1 186 174 0.04142 998 Gilead Sciences, Inc. USD 11 630 060 11 314 002 0.36
4 910 Global Brass & Copper Hldg., Inc. USD 140 655 141 850 0.009 078 Globus Medical, Inc. - A USD 205 065 204 890 0.01
15 844 GoDaddy, Inc. - A USD 542 681 547 093 0.02323 232 Goodyear Tire & Rubber Co. USD 9 648 505 10 440 394 0.33260 221 Graphic Packaging Hldg. Co. USD 3 101 226 3 640 492 0.12430 958 Great Plains Energy, Inc. USD 11 463 647 11 760 844 0.37
11 009 Green Plains, Inc. USD 272 347 288 436 0.01971 Greenhill & Co., Inc. USD 22 812 22 886 0.00
8 431 Gridsum Hldg., Inc. - ADR USD 132 788 142 062 0.00405 579 Gruma SAB de CV - B MXN 5 670 951 5 342 616 0.17
7 659 Grupo Aeroportuario del Pacifico SAB de CV - ADR USD 695 577 727 375 0.0297 405 Grupo Aeroportuario del Pacifico SAB de CV - B MXN 894 769 926 615 0.03
212 Grupo Aeroportuario del Sureste SAB de CV - ADR USD 31 027 31 041 0.003 571 Grupo Aeroportuario del Sureste SAB de CV - B MXN 51 620 52 452 0.00
869 499 Grupo Lala SAB de CV MXN 1 732 343 1 659 162 0.051 381 Halliburton Co. USD 61 088 61 979 0.00
36 766 Hartford Financial Services Group, Inc. USD 1 543 610 1 574 320 0.0510 300 Hasbro, Inc. USD 824 676 817 099 0.0346 827 Hawaiian Hldg., Inc. USD 2 066 168 2 275 792 0.0729 848 HD Supply Hldg., Inc. USD 947 438 954 539 0.0310 178 Healthcare Services Group, Inc. USD 393 754 402 845 0.01

The accompanying notes form an integral part of these financial statements.
Schedule of Investments as at September 30, 2016 (cont.)(expressed in USD)
Merrill Lynch Investment Solutions – Marshall WaceTOPS UCITS Fund (Market Neutral)
40 Merrill Lynch Investment Solutions
Unaudited semi-annual report
Quantity DescriptionQuotation
CurrencyCost USD
Market value
USD% of net
assets
Transferable securities and money market instruments admitted to an official exchange listing or dealt in on another regulated market (cont.)
Shares (cont.)644 HEICO Corp. USD 44 585 44 565 0.00
50 299 Helix Energy Solutions Group, Inc. USD 374 387 408 931 0.01242 096 Hera SpA EUR 644 984 652 418 0.02
34 007 Hess Corp. USD 1 688 646 1 823 455 0.06929 687 Hewlett Packard Enterprise Co. USD 17 266 639 21 150 379 0.67
72 399 Hill-Rom Hldg., Inc. USD 3 803 663 4 487 290 0.14151 337 Hilton Worldwide Hldg., Inc. USD 3 512 280 3 470 157 0.11
17 002 Hologic, Inc. USD 652 266 660 188 0.02144 883 Honda Motor Co. Ltd. - ADR USD 4 291 657 4 190 016 0.13164 962 Hormel Foods Corp. USD 6 080 281 6 257 009 0.20
14 273 Host Hotels & Resorts, Inc. USD 223 826 222 231 0.0193 089 Houghton Mifflin Harcourt Co. USD 1 590 497 1 248 323 0.0422 303 Humana, Inc. USD 3 692 135 3 945 178 0.13
133 028 Hyatt Hotels Corp. - A USD 6 667 525 6 547 638 0.2119 773 ICON Plc. USD 1 498 213 1 529 837 0.05
8 758 ICU Medical, Inc. USD 930 256 1 106 836 0.0439 356 Illumina, Inc. USD 6 761 792 7 149 411 0.2317 780 Imperva, Inc. USD 934 842 954 964 0.03
237 595 INC Research Hldg., Inc. - A USD 10 430 856 10 591 985 0.34125 582 Incyte Corp. USD 9 967 246 11 841 127 0.38129 100 Independence Realty Trust, Inc. USD 1 161 900 1 161 900 0.04
8 306 Industria Macchine Automatiche SpA EUR 499 846 551 656 0.0294 411 Infoblox, Inc. USD 1 446 683 2 489 618 0.0857 893 Infrastrutture Wireless Italiane SpA 144A EUR 288 132 284 833 0.01
152 Ingersoll-Rand Plc. USD 9 867 10 327 0.00279 999 Ingram Micro, Inc. - A USD 9 671 670 9 984 764 0.32
293 Instructure, Inc. USD 7 495 7 433 0.00236 605 Integrated Device Technology, Inc. USD 4 773 977 5 465 576 0.17
6 204 InterContinental Hotels Group Plc. - ADR USD 254 314 258 273 0.0158 699 InterDigital, Inc. USD 3 978 009 4 648 961 0.1561 980 Interface, Inc. USD 1 010 797 1 034 446 0.0339 961 Interfor Corp. CAD 456 659 452 440 0.01
712 271 Interpublic Group of Cos, Inc. USD 15 662 941 15 919 257 0.5137 852 Interpump Group SpA EUR 578 420 645 303 0.02
5 954 Intersil Corp. - A USD 130 791 130 571 0.0017 755 InterXion Hldg. NV USD 656 979 643 086 0.02
1 986 641 Intesa Sanpaolo SpA EUR 4 559 593 4 407 127 0.14751 070 Intesa Sanpaolo SpA - Rsp EUR 1 653 363 1 573 314 0.05104 672 Intuit, Inc. USD 11 362 478 11 514 967 0.37
2 191 IPG Photonics Corp. USD 184 217 180 429 0.0124 540 Iridium Communications, Inc. USD 193 371 199 019 0.0194 667 Italcementi SpA EUR 1 108 384 1 125 572 0.04
552 Italmobiliare SpA EUR 27 685 27 878 0.00
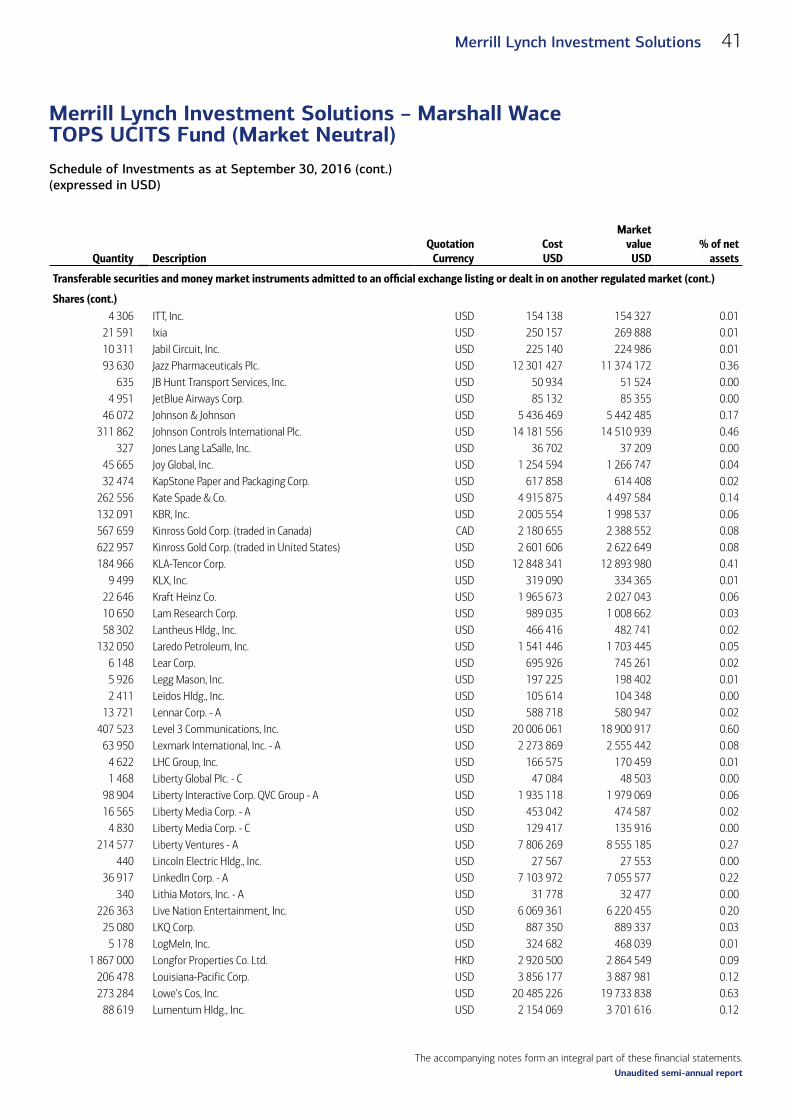
The accompanying notes form an integral part of these financial statements.
Schedule of Investments as at September 30, 2016 (cont.)(expressed in USD)
Merrill Lynch Investment Solutions – Marshall WaceTOPS UCITS Fund (Market Neutral)
41Merrill Lynch Investment Solutions
Unaudited semi-annual report
Quantity DescriptionQuotation
CurrencyCost USD
Market value
USD% of net
assets
Transferable securities and money market instruments admitted to an official exchange listing or dealt in on another regulated market (cont.)
Shares (cont.)4 306 ITT, Inc. USD 154 138 154 327 0.01
21 591 Ixia USD 250 157 269 888 0.0110 311 Jabil Circuit, Inc. USD 225 140 224 986 0.0193 630 Jazz Pharmaceuticals Plc. USD 12 301 427 11 374 172 0.36
635 JB Hunt Transport Services, Inc. USD 50 934 51 524 0.004 951 JetBlue Airways Corp. USD 85 132 85 355 0.00
46 072 Johnson & Johnson USD 5 436 469 5 442 485 0.17311 862 Johnson Controls International Plc. USD 14 181 556 14 510 939 0.46
327 Jones Lang LaSalle, Inc. USD 36 702 37 209 0.0045 665 Joy Global, Inc. USD 1 254 594 1 266 747 0.0432 474 KapStone Paper and Packaging Corp. USD 617 858 614 408 0.02
262 556 Kate Spade & Co. USD 4 915 875 4 497 584 0.14132 091 KBR, Inc. USD 2 005 554 1 998 537 0.06567 659 Kinross Gold Corp. (traded in Canada) CAD 2 180 655 2 388 552 0.08622 957 Kinross Gold Corp. (traded in United States) USD 2 601 606 2 622 649 0.08184 966 KLA-Tencor Corp. USD 12 848 341 12 893 980 0.41
9 499 KLX, Inc. USD 319 090 334 365 0.0122 646 Kraft Heinz Co. USD 1 965 673 2 027 043 0.0610 650 Lam Research Corp. USD 989 035 1 008 662 0.0358 302 Lantheus Hldg., Inc. USD 466 416 482 741 0.02
132 050 Laredo Petroleum, Inc. USD 1 541 446 1 703 445 0.056 148 Lear Corp. USD 695 926 745 261 0.025 926 Legg Mason, Inc. USD 197 225 198 402 0.012 411 Leidos Hldg., Inc. USD 105 614 104 348 0.00
13 721 Lennar Corp. - A USD 588 718 580 947 0.02407 523 Level 3 Communications, Inc. USD 20 006 061 18 900 917 0.60
63 950 Lexmark International, Inc. - A USD 2 273 869 2 555 442 0.084 622 LHC Group, Inc. USD 166 575 170 459 0.011 468 Liberty Global Plc. - C USD 47 084 48 503 0.00
98 904 Liberty Interactive Corp. QVC Group - A USD 1 935 118 1 979 069 0.0616 565 Liberty Media Corp. - A USD 453 042 474 587 0.02
4 830 Liberty Media Corp. - C USD 129 417 135 916 0.00214 577 Liberty Ventures - A USD 7 806 269 8 555 185 0.27
440 Lincoln Electric Hldg., Inc. USD 27 567 27 553 0.0036 917 LinkedIn Corp. - A USD 7 103 972 7 055 577 0.22
340 Lithia Motors, Inc. - A USD 31 778 32 477 0.00226 363 Live Nation Entertainment, Inc. USD 6 069 361 6 220 455 0.20
25 080 LKQ Corp. USD 887 350 889 337 0.035 178 LogMeIn, Inc. USD 324 682 468 039 0.01
1 867 000 Longfor Properties Co. Ltd. HKD 2 920 500 2 864 549 0.09206 478 Louisiana-Pacific Corp. USD 3 856 177 3 887 981 0.12273 284 Lowe's Cos, Inc. USD 20 485 226 19 733 838 0.63
88 619 Lumentum Hldg., Inc. USD 2 154 069 3 701 616 0.12

The accompanying notes form an integral part of these financial statements.
Schedule of Investments as at September 30, 2016 (cont.)(expressed in USD)
Merrill Lynch Investment Solutions – Marshall WaceTOPS UCITS Fund (Market Neutral)
42 Merrill Lynch Investment Solutions
Unaudited semi-annual report
Quantity DescriptionQuotation
CurrencyCost USD
Market value
USD% of net
assets
Transferable securities and money market instruments admitted to an official exchange listing or dealt in on another regulated market (cont.)
Shares (cont.)227 388 Lundin Mining Corp. CAD 704 489 897 960 0.03
2 336 Luxoft Hldg., Inc. USD 123 638 123 458 0.0064 580 Luxottica Group SpA EUR 3 151 692 3 085 889 0.10
305 811 LyondellBasell Industries NV - A USD 24 307 526 24 666 715 0.7856 233 MACOM Technology Solutions Hldg., Inc. USD 2 210 619 2 380 905 0.0851 477 Magna International, Inc. CAD 2 075 682 2 205 961 0.0762 627 Maire Tecnimont SpA EUR 172 207 154 977 0.0135 180 Manhattan Associates, Inc. USD 2 071 341 2 027 072 0.06
164 530 Manitowoc Foodservice, Inc. USD 2 851 713 2 668 677 0.0812 620 Marathon Petroleum Corp. USD 528 107 512 246 0.0276 046 Marriott International, Inc. - A USD 5 192 872 5 120 177 0.1615 784 Martin Marietta Materials, Inc. USD 2 877 274 2 827 072 0.09
564 705 Marvell Technology Group Ltd. USD 6 005 553 7 493 635 0.2415 580 Masco Corp. USD 548 001 534 550 0.02
412 141 MBIA, Inc. USD 2 817 378 3 210 578 0.1062 519 Mead Johnson Nutrition Co. USD 4 945 474 4 939 626 0.16
107 761 MedEquities Realty Trust, Inc. USD 1 249 682 1 266 192 0.04780 205 Mediaset SpA EUR 2 609 684 2 449 764 0.08
94 603 Mediobanca SpA EUR 654 883 615 563 0.024 019 Medpace Hldg., Inc. USD 119 944 120 007 0.00
10 147 Medtronic Plc. USD 874 301 876 701 0.0319 627 MeetMe, Inc. USD 126 392 121 687 0.0063 420 Merck & Co., Inc. USD 3 964 336 3 958 042 0.13
3 166 Methanex Corp. CAD 101 981 112 596 0.00558 168 MGIC Investment Corp. USD 3 919 081 4 465 344 0.14
59 061 MGM Growth Properties LLC - A USD 1 511 439 1 539 720 0.05312 095 Michaels Cos, Inc. USD 8 443 085 7 543 336 0.24
9 831 MicroStrategy, Inc. - A USD 1 696 135 1 646 103 0.051 062 Mimecast Ltd. USD 17 523 20 316 0.00
14 747 MINDBODY, Inc. - A USD 263 063 289 926 0.019 580 Minerals Technologies, Inc. USD 502 538 677 210 0.027 375 Minerva Neurosciences, Inc. USD 85 664 104 098 0.00
267 845 Mobile TeleSystems PJSC - ADR USD 2 140 082 2 043 657 0.077 515 Mohawk Industries, Inc. USD 1 517 923 1 505 555 0.051 459 Molina Healthcare, Inc. USD 83 930 85 089 0.00
224 322 Molson Coors Brewing Co. - B USD 22 362 071 24 630 556 0.78236 531 Moncler SpA EUR 3 959 045 4 037 708 0.13
24 523 Mondelez International, Inc. - A USD 1 061 636 1 076 560 0.03769 Monolithic Power Systems, Inc. USD 57 370 61 905 0.00
34 581 Monsanto Co. USD 3 531 701 3 534 178 0.11130 495 Moody's Corp. USD 13 335 380 14 129 999 0.45183 882 MSG Networks, Inc. - A USD 3 069 537 3 422 044 0.11
1 102 Murphy Oil Corp. USD 33 606 33 501 0.00
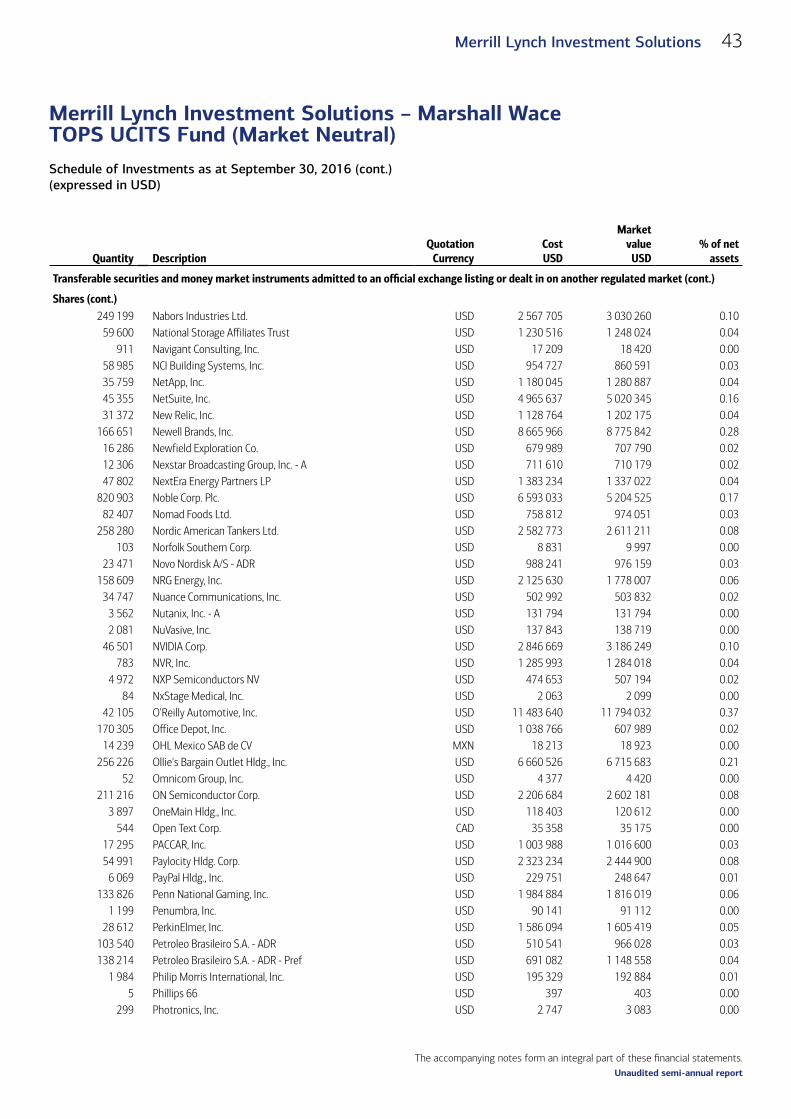
The accompanying notes form an integral part of these financial statements.
Schedule of Investments as at September 30, 2016 (cont.)(expressed in USD)
Merrill Lynch Investment Solutions – Marshall WaceTOPS UCITS Fund (Market Neutral)
43Merrill Lynch Investment Solutions
Unaudited semi-annual report
Quantity DescriptionQuotation
CurrencyCost USD
Market value
USD% of net
assets
Transferable securities and money market instruments admitted to an official exchange listing or dealt in on another regulated market (cont.)
Shares (cont.)249 199 Nabors Industries Ltd. USD 2 567 705 3 030 260 0.10
59 600 National Storage Affiliates Trust USD 1 230 516 1 248 024 0.04911 Navigant Consulting, Inc. USD 17 209 18 420 0.00
58 985 NCI Building Systems, Inc. USD 954 727 860 591 0.0335 759 NetApp, Inc. USD 1 180 045 1 280 887 0.0445 355 NetSuite, Inc. USD 4 965 637 5 020 345 0.1631 372 New Relic, Inc. USD 1 128 764 1 202 175 0.04
166 651 Newell Brands, Inc. USD 8 665 966 8 775 842 0.2816 286 Newfield Exploration Co. USD 679 989 707 790 0.0212 306 Nexstar Broadcasting Group, Inc. - A USD 711 610 710 179 0.0247 802 NextEra Energy Partners LP USD 1 383 234 1 337 022 0.04
820 903 Noble Corp. Plc. USD 6 593 033 5 204 525 0.1782 407 Nomad Foods Ltd. USD 758 812 974 051 0.03
258 280 Nordic American Tankers Ltd. USD 2 582 773 2 611 211 0.08103 Norfolk Southern Corp. USD 8 831 9 997 0.00
23 471 Novo Nordisk A/S - ADR USD 988 241 976 159 0.03158 609 NRG Energy, Inc. USD 2 125 630 1 778 007 0.06
34 747 Nuance Communications, Inc. USD 502 992 503 832 0.023 562 Nutanix, Inc. - A USD 131 794 131 794 0.002 081 NuVasive, Inc. USD 137 843 138 719 0.00
46 501 NVIDIA Corp. USD 2 846 669 3 186 249 0.10783 NVR, Inc. USD 1 285 993 1 284 018 0.04
4 972 NXP Semiconductors NV USD 474 653 507 194 0.0284 NxStage Medical, Inc. USD 2 063 2 099 0.00
42 105 O'Reilly Automotive, Inc. USD 11 483 640 11 794 032 0.37170 305 Office Depot, Inc. USD 1 038 766 607 989 0.02
14 239 OHL Mexico SAB de CV MXN 18 213 18 923 0.00256 226 Ollie's Bargain Outlet Hldg., Inc. USD 6 660 526 6 715 683 0.21
52 Omnicom Group, Inc. USD 4 377 4 420 0.00211 216 ON Semiconductor Corp. USD 2 206 684 2 602 181 0.08
3 897 OneMain Hldg., Inc. USD 118 403 120 612 0.00544 Open Text Corp. CAD 35 358 35 175 0.00
17 295 PACCAR, Inc. USD 1 003 988 1 016 600 0.0354 991 Paylocity Hldg. Corp. USD 2 323 234 2 444 900 0.08
6 069 PayPal Hldg., Inc. USD 229 751 248 647 0.01133 826 Penn National Gaming, Inc. USD 1 984 884 1 816 019 0.06
1 199 Penumbra, Inc. USD 90 141 91 112 0.0028 612 PerkinElmer, Inc. USD 1 586 094 1 605 419 0.05
103 540 Petroleo Brasileiro S.A. - ADR USD 510 541 966 028 0.03138 214 Petroleo Brasileiro S.A. - ADR - Pref USD 691 082 1 148 558 0.04
1 984 Philip Morris International, Inc. USD 195 329 192 884 0.015 Phillips 66 USD 397 403 0.00
299 Photronics, Inc. USD 2 747 3 083 0.00

The accompanying notes form an integral part of these financial statements.
Schedule of Investments as at September 30, 2016 (cont.)(expressed in USD)
Merrill Lynch Investment Solutions – Marshall WaceTOPS UCITS Fund (Market Neutral)
44 Merrill Lynch Investment Solutions
Unaudited semi-annual report
Quantity DescriptionQuotation
CurrencyCost USD
Market value
USD% of net
assets
Transferable securities and money market instruments admitted to an official exchange listing or dealt in on another regulated market (cont.)
Shares (cont.)45 738 Piaggio & C SpA EUR 83 243 85 530 0.00
1 651 Pioneer Natural Resources Co. USD 299 939 306 508 0.01183 651 Planet Fitness, Inc. - A USD 3 499 883 3 685 876 0.12
3 924 000 Postal Savings Bank of China Co. Ltd. - H 144A HKD 2 432 656 2 413 306 0.08147 809 PRA Health Sciences, Inc. USD 7 222 057 8 352 687 0.27
8 378 Precision Drilling Corp. CAD 32 110 34 934 0.00558 Premier, Inc. - A USD 17 600 18 046 0.00
196 800 ProMetic Life Sciences, Inc. CAD 451 238 437 250 0.0132 654 Promotora y Operadora de Infraestructura SAB de CV MXN 353 673 351 030 0.01
2 210 Providence Service Corp. USD 104 557 107 472 0.00147 270 Prysmian SpA EUR 3 574 066 3 859 507 0.12
1 076 PVH Corp. USD 104 267 118 898 0.00451 QEP Resources, Inc. USD 7 883 8 808 0.00
4 059 QUALCOMM, Inc. USD 278 658 278 042 0.0181 726 Quanta Services, Inc. USD 2 131 001 2 287 511 0.0723 465 Quest Diagnostics, Inc. USD 1 929 769 1 985 843 0.06
35 Quintiles Transnational Hldg., Inc. USD 2 779 2 837 0.00149 312 Rackspace Hosting, Inc. USD 4 708 022 4 731 697 0.15
88 Ralph Lauren Corp. USD 8 755 8 900 0.0020 163 Rambus, Inc. USD 279 258 252 038 0.0155 598 Range Resources Corp. USD 2 156 399 2 154 423 0.0721 695 Realogy Hldg. Corp. USD 580 790 561 033 0.02
5 435 Red Hat, Inc. USD 435 915 439 311 0.0178 081 Red Rock Resorts, Inc. - A USD 1 645 439 1 841 931 0.06
104 775 Rexnord Corp. USD 2 189 999 2 243 233 0.07577 Reynolds American, Inc. USD 28 790 27 206 0.00
1 512 RingCentral, Inc. - A USD 33 465 35 774 0.0015 262 Ritchie Bros Auctioneers, Inc. (traded in Canada) CAD 497 757 533 836 0.02
4 144 Ritchie Bros Auctioneers, Inc. (traded in United States) USD 141 998 145 330 0.0015 396 Robert Half International, Inc. USD 580 311 582 893 0.02
11 Rogers Corp. USD 652 672 0.00159 941 Ross Stores, Inc. USD 9 039 206 10 284 206 0.33
4 606 Rowan Cos Plc. - A USD 70 082 69 827 0.00130 663 S&P Global, Inc. USD 14 035 355 16 536 709 0.52
88 652 Sage Therapeutics, Inc. USD 3 219 024 4 082 425 0.1311 647 417 Saipem SpA EUR 5 109 455 4 930 765 0.16
119 salesforce.com, Inc. USD 8 709 8 488 0.001 244 Sanchez Energy Corp. USD 3 405 10 997 0.00
253 Schlumberger Ltd. USD 19 910 19 896 0.0023 600 SciClone Pharmaceuticals, Inc. USD 239 540 241 900 0.0113 759 Sealed Air Corp. USD 643 331 630 437 0.02
243 557 Secure Energy Services, Inc. CAD 1 474 004 1 717 918 0.0540 094 SEI Investments Co. USD 1 841 211 1 828 687 0.06

The accompanying notes form an integral part of these financial statements.
Schedule of Investments as at September 30, 2016 (cont.)(expressed in USD)
Merrill Lynch Investment Solutions – Marshall WaceTOPS UCITS Fund (Market Neutral)
45Merrill Lynch Investment Solutions
Unaudited semi-annual report
Quantity DescriptionQuotation
CurrencyCost USD
Market value
USD% of net
assets
Transferable securities and money market instruments admitted to an official exchange listing or dealt in on another regulated market (cont.)
Shares (cont.)284 133 Service Corp. International USD 7 688 792 7 540 890 0.24110 118 ServiceMaster Global Hldg., Inc. USD 3 736 727 3 708 774 0.12
72 715 Sherwin-Williams Co. USD 20 473 913 20 117 332 0.641 429 Shutterfly, Inc. USD 63 768 63 791 0.00
241 799 Signet Jewelers Ltd. USD 20 899 025 18 021 279 0.57129 SINA Corp USD 9 984 9 524 0.00
2 903 Sinclair Broadcast Group, Inc. - A USD 83 507 83 839 0.00611 Skyworks Solutions, Inc. USD 46 182 46 522 0.00
37 348 SM Energy Co. USD 1 287 170 1 440 886 0.05303 806 Snam SpA EUR 1 682 507 1 685 235 0.05100 929 Sonic Corp. USD 2 791 293 2 642 321 0.08
15 756 Southern Copper Corp. USD 407 863 414 383 0.01212 279 Southwest Airlines Co. USD 8 108 641 8 255 530 0.26115 269 Spirit AeroSystems Hldg., Inc. - A USD 5 345 381 5 134 081 0.16
8 508 SS&C Technologies Hldg., Inc. USD 275 686 273 532 0.01255 765 St Jude Medical, Inc. USD 20 037 828 20 399 816 0.65
17 553 Stanley Black & Decker, Inc. USD 2 134 205 2 158 668 0.0729 398 Starbucks Corp. USD 1 625 861 1 591 608 0.05
1 208 STERIS Plc. USD 86 804 88 305 0.00294 801 Summit Materials, Inc. - A USD 5 782 440 5 468 559 0.17
2 100 SunEdison Semiconductor Ltd. USD 23 963 23 919 0.00178 572 Superior Energy Services, Inc. USD 2 752 554 3 196 439 0.10
52 580 Surge Energy, Inc. CAD 108 686 108 421 0.002 669 Synergy Resources Corp. USD 18 484 18 496 0.00
103 740 Syngenta AG - ADR USD 8 234 462 9 087 624 0.2962 634 T-Mobile US, Inc. USD 2 873 755 2 926 260 0.09
7 131 Tabula Rasa HealthCare, Inc. USD 106 109 102 116 0.005 646 Take-Two Interactive Software, Inc. USD 255 252 254 522 0.018 797 Taser International, Inc. USD 231 070 251 682 0.01
27 814 Tech Data Corp. USD 2 372 961 2 356 124 0.075 697 Teck Resources Ltd. - B (traded in Canada) CAD 104 694 102 518 0.004 262 Teck Resources Ltd. - B (traded in United States) USD 78 016 76 844 0.00
11 880 Tegna, Inc. USD 253 091 259 697 0.0123 781 353 Telecom Italia SpA EUR 19 062 059 19 750 134 0.63
5 183 797 Telecom Italia SpA - Rsp EUR 3 512 088 3 518 633 0.1130 793 Tenaris S.A. - ADR USD 806 475 874 521 0.0315 896 Tenet Healthcare Corp. USD 356 021 360 203 0.01
6 533 Terex Corp. USD 163 387 166 004 0.0198 760 Tesoro Corp. USD 7 870 870 7 857 346 0.25
100 184 Tessera Technologies, Inc. USD 3 004 274 3 851 073 0.1224 415 TETRA Technologies, Inc. USD 146 687 149 176 0.00
7 026 Teva Pharmaceutical Industries Ltd. - ADR USD 324 873 323 266 0.0140 862 Texas Roadhouse, Inc. USD 1 727 692 1 594 844 0.05

The accompanying notes form an integral part of these financial statements.
Schedule of Investments as at September 30, 2016 (cont.)(expressed in USD)
Merrill Lynch Investment Solutions – Marshall WaceTOPS UCITS Fund (Market Neutral)
46 Merrill Lynch Investment Solutions
Unaudited semi-annual report
Quantity DescriptionQuotation
CurrencyCost USD
Market value
USD% of net
assets
Transferable securities and money market instruments admitted to an official exchange listing or dealt in on another regulated market (cont.)
Shares (cont.)457 TJX Cos, Inc. USD 34 355 34 174 0.00
106 884 TopBuild Corp. USD 3 787 586 3 548 549 0.1142 580 Total System Services, Inc. USD 2 107 257 2 007 647 0.06
28 Tourmaline Oil Corp. CAD 749 757 0.00136 461 Tower Semiconductor Ltd. USD 1 903 202 2 071 478 0.07
3 635 Tractor Supply Co. USD 247 439 244 817 0.0159 049 Transocean Ltd. USD 584 245 629 462 0.0286 606 TransUnion USD 2 743 808 2 987 907 0.09
189 Travelers Cos, Inc. USD 21 584 21 650 0.001 910 Tribune Media Co. - A USD 67 967 69 753 0.003 685 Tricon Capital Group, Inc. CAD 26 633 25 964 0.00
205 032 Trinseo S.A. USD 9 523 224 11 596 610 0.373 793 Tronox Ltd. - A USD 21 044 35 540 0.00
245 TrueBlue, Inc. USD 5 376 5 552 0.005 311 TrueCar, Inc. USD 45 322 50 136 0.00
497 Twenty-First Century Fox, Inc. - A USD 12 000 12 037 0.0033 422 Twenty-First Century Fox, Inc. - B USD 831 517 826 860 0.03
966 Ulta Salon Cosmetics & Fragrance, Inc. USD 224 975 229 889 0.01345 Ultimate Software Group, Inc. USD 71 921 70 515 0.00
7 989 Ultratech, Inc. USD 194 133 184 386 0.012 247 Unit Corp. USD 40 921 41 794 0.001 474 United Continental Hldg., Inc. USD 78 614 77 341 0.00
153 063 Universal Health Services, Inc. - B USD 19 114 029 18 860 423 0.6017 192 Universal Insurance Hldg., Inc. USD 345 008 433 238 0.01
908 US Concrete, Inc. USD 42 475 41 827 0.001 373 Vail Resorts, Inc. USD 216 014 215 396 0.01
23 705 Valero Energy Corp. USD 1 299 409 1 256 365 0.047 805 Valspar Corp. USD 828 425 827 876 0.03
63 680 Valvoline, Inc. USD 1 506 212 1 495 843 0.0523 075 VCA, Inc. USD 1 567 847 1 614 789 0.05
3 Veresen, Inc. CAD 21 31 0.00574 Verisk Analytics, Inc. USD 46 824 46 655 0.00
2 570 Viacom, Inc. - B USD 93 967 97 917 0.00208 692 VimpelCom Ltd. - ADR USD 730 422 726 248 0.02
22 133 Vista Outdoor, Inc. USD 872 504 882 221 0.03291 Visteon Corp. USD 20 847 20 853 0.00
7 114 Vonage Hldg. Corp. USD 45 335 47 024 0.00146 154 Voya Financial, Inc. USD 4 214 210 4 212 158 0.13174 734 Vulcan Materials Co. USD 20 048 356 19 872 498 0.63
70 848 VWR Corp. USD 1 955 300 2 009 249 0.0628 134 WABCO Hldg., Inc. USD 2 876 650 3 194 053 0.1012 453 Wabtec Corp. USD 973 708 1 016 787 0.03
157 Waste Connections, Inc. (traded in Canada) CAD 11 664 11 689 0.00

The accompanying notes form an integral part of these financial statements.
Schedule of Investments as at September 30, 2016 (cont.)(expressed in USD)
Merrill Lynch Investment Solutions – Marshall WaceTOPS UCITS Fund (Market Neutral)
47Merrill Lynch Investment Solutions
Unaudited semi-annual report
Quantity DescriptionQuotation
CurrencyCost USD
Market value
USD% of net
assets
Transferable securities and money market instruments admitted to an official exchange listing or dealt in on another regulated market (cont.)
Shares (cont.)1 773 Waste Connections, Inc. (traded in United States) USD 130 016 132 443 0.00
17 257 Waste Management, Inc. USD 1 096 682 1 100 306 0.04204 867 Weatherford International Plc. USD 1 245 418 1 151 353 0.04
12 174 WebMD Health Corp. USD 644 107 605 048 0.021 WestJet Airlines Ltd. CAD 19 17 0.00
95 857 Westlake Chemical Corp. USD 4 892 654 5 128 350 0.161 468 Whirlpool Corp. USD 238 517 238 051 0.01
152 102 Whiting Petroleum Corp. USD 1 441 303 1 329 371 0.041 122 Winpak Ltd. CAD 37 329 37 419 0.00
35 829 WisdomTree Investments, Inc. USD 367 926 368 680 0.01363 Wix.com Ltd. USD 15 824 15 765 0.00
75 067 World Wrestling Entertainment, Inc. - A USD 1 530 097 1 598 927 0.05104 096 WPX Energy, Inc. USD 962 785 1 373 026 0.04
99 555 Wright Medical Group NV USD 1 871 184 2 442 084 0.0857 048 Wyndham Worldwide Corp. USD 3 951 821 3 841 042 0.12
119 611 Xactly Corp. USD 1 663 920 1 760 674 0.0617 466 Yahoo!, Inc. USD 751 159 752 785 0.02
1 589 Yirendai Ltd. - ADR USD 40 273 37 628 0.0014 433 Yum! Brands, Inc. USD 1 303 560 1 310 661 0.04
2 272 Zimmer Biomet Hldg., Inc. USD 294 056 295 405 0.01398 601 Zoetis, Inc. USD 18 871 935 20 731 238 0.66
Total Shares 1 526 364 908 1 567 990 412 49.72
Other transferable securities
Investment funds839 589 Marshall Wace UCITS Funds Plc. – MW Liquid Alpha Fund
– C2 (a) USD 89 126 000 93 853 419 2.98Total Investment funds 89 126 000 93 853 419 2.98
Shares26 450 Contra Leap Wireless (a) USD 66 654 66 654 0.00
158 Kenmare Resources (a) GBP 0 0 0.00Total Shares 66 654 66 654 0.00Total Investments 1 615 557 562 1 661 910 485 52.70
(a) These securities are fair valued. See Notes 2.2.6 and 9.
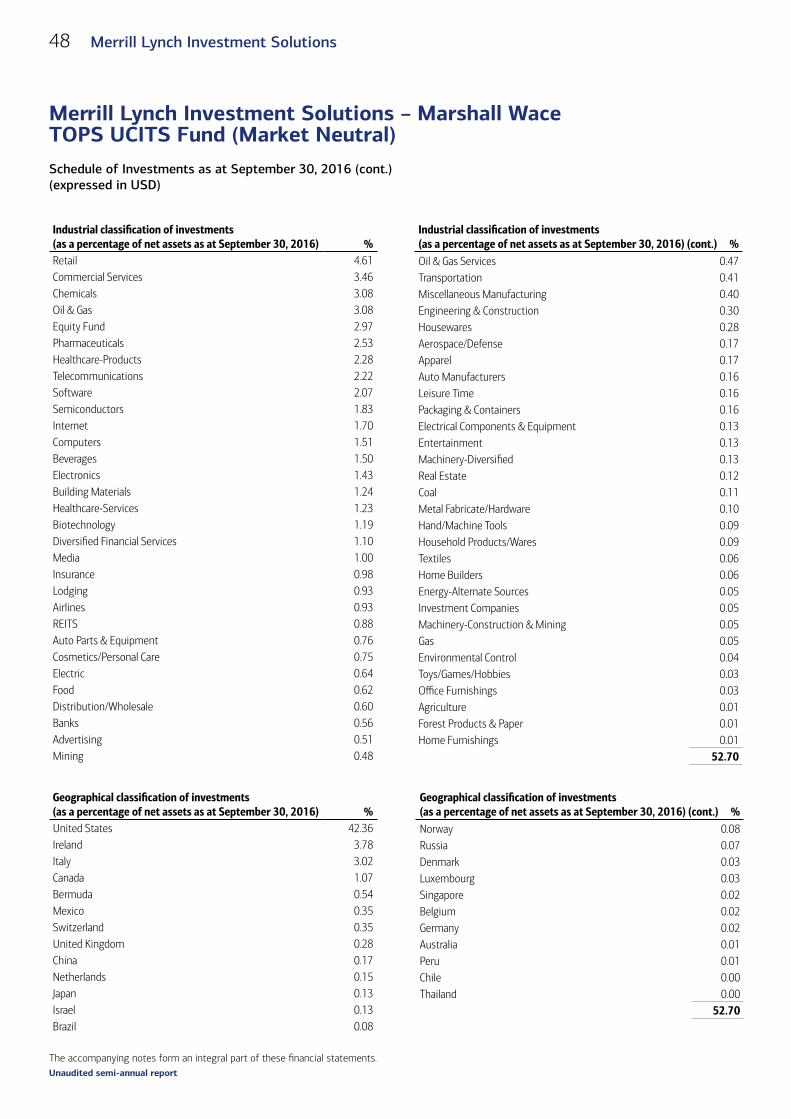
The accompanying notes form an integral part of these financial statements.
Schedule of Investments as at September 30, 2016 (cont.)(expressed in USD)
Merrill Lynch Investment Solutions – Marshall WaceTOPS UCITS Fund (Market Neutral)
48 Merrill Lynch Investment Solutions
Unaudited semi-annual report
Industrial classification of investments(as a percentage of net assets as at September 30, 2016) (cont.) %Retail 4.61 Commercial Services 3.46 Chemicals 3.08 Oil & Gas 3.08 Equity Fund 2.97 Pharmaceuticals 2.53 Healthcare-Products 2.28 Telecommunications 2.22 Software 2.07 Semiconductors 1.83 Internet 1.70 Computers 1.51 Beverages 1.50 Electronics 1.43 Building Materials 1.24 Healthcare-Services 1.23 Biotechnology 1.19 Diversified Financial Services 1.10 Media 1.00 Insurance 0.98 Lodging 0.93 Airlines 0.93 REITS 0.88 Auto Parts & Equipment 0.76 Cosmetics/Personal Care 0.75 Electric 0.64 Food 0.62 Distribution/Wholesale 0.60 Banks 0.56 Advertising 0.51 Mining 0.48
Industrial classification of investments(as a percentage of net assets as at September 30, 2016) (cont.) %Oil & Gas Services 0.47 Transportation 0.41 Miscellaneous Manufacturing 0.40 Engineering & Construction 0.30 Housewares 0.28 Aerospace/Defense 0.17 Apparel 0.17 Auto Manufacturers 0.16 Leisure Time 0.16 Packaging & Containers 0.16 Electrical Components & Equipment 0.13 Entertainment 0.13 Machinery-Diversified 0.13 Real Estate 0.12 Coal 0.11 Metal Fabricate/Hardware 0.10 Hand/Machine Tools 0.09 Household Products/Wares 0.09 Textiles 0.06 Home Builders 0.06 Energy-Alternate Sources 0.05 Investment Companies 0.05 Machinery-Construction & Mining 0.05 Gas 0.05 Environmental Control 0.04 Toys/Games/Hobbies 0.03 Office Furnishings 0.03 Agriculture 0.01 Forest Products & Paper 0.01 Home Furnishings 0.01
52.70
Geographical classification of investments(as a percentage of net assets as at September 30, 2016) (cont.) %United States 42.36Ireland 3.78Italy 3.02Canada 1.07Bermuda 0.54Mexico 0.35Switzerland 0.35United Kingdom 0.28China 0.17Netherlands 0.15Japan 0.13Israel 0.13Brazil 0.08
Geographical classification of investments(as a percentage of net assets as at September 30, 2016) (cont.) %Norway 0.08Russia 0.07Denmark 0.03Luxembourg 0.03Singapore 0.02Belgium 0.02Germany 0.02Australia 0.01Peru 0.01Chile 0.00Thailand 0.00
52.70
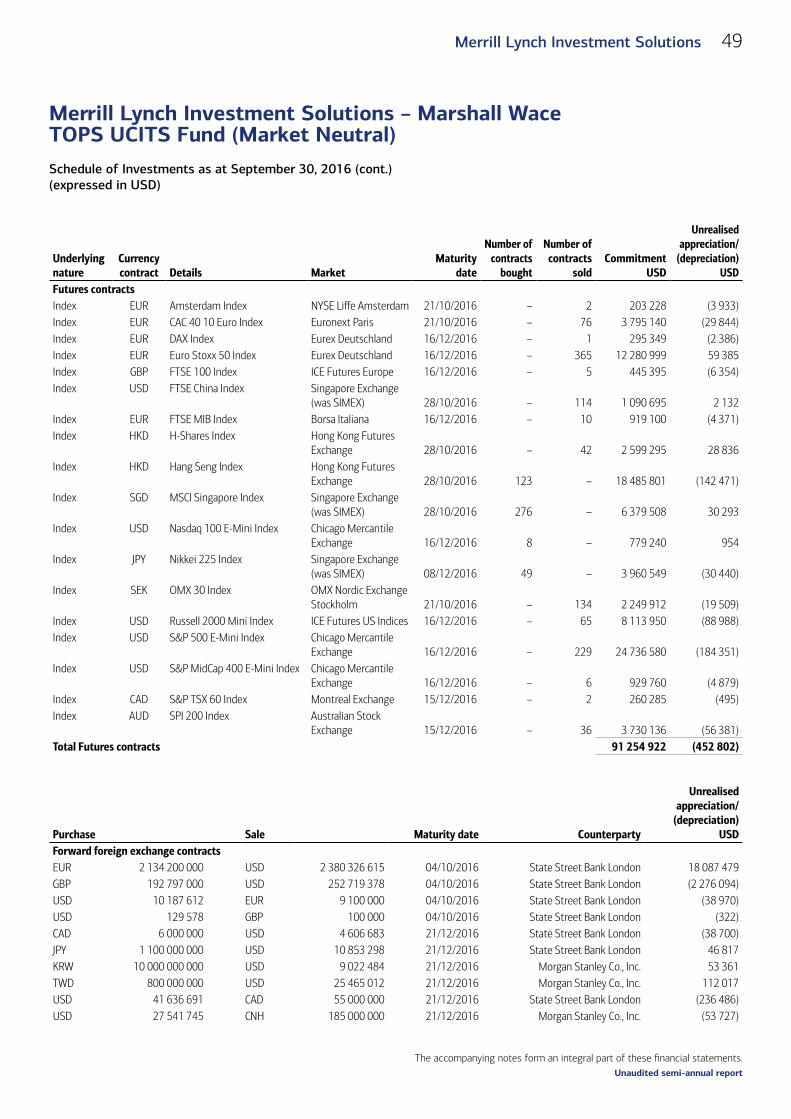
The accompanying notes form an integral part of these financial statements.
Schedule of Investments as at September 30, 2016 (cont.)(expressed in USD)
Merrill Lynch Investment Solutions – Marshall WaceTOPS UCITS Fund (Market Neutral)
49Merrill Lynch Investment Solutions
Unaudited semi-annual report
Underlying nature
Currency contract
Details
Market
Maturity date
Number of contracts
bought
Number of contracts
soldCommitment
USD
Unrealised appreciation/
(depreciation) USD
Futures contractsIndex EUR Amsterdam Index NYSE Liffe Amsterdam 21/10/2016 – 2 203 228 (3 933)Index EUR CAC 40 10 Euro Index Euronext Paris 21/10/2016 – 76 3 795 140 (29 844)Index EUR DAX Index Eurex Deutschland 16/12/2016 – 1 295 349 (2 386)Index EUR Euro Stoxx 50 Index Eurex Deutschland 16/12/2016 – 365 12 280 999 59 385Index GBP FTSE 100 Index ICE Futures Europe 16/12/2016 – 5 445 395 (6 354)Index USD FTSE China Index Singapore Exchange
(was SIMEX) 28/10/2016 – 114 1 090 695 2 132Index EUR FTSE MIB Index Borsa Italiana 16/12/2016 – 10 919 100 (4 371)Index HKD H-Shares Index Hong Kong Futures
Exchange 28/10/2016 – 42 2 599 295 28 836Index HKD Hang Seng Index Hong Kong Futures
Exchange 28/10/2016 123 – 18 485 801 (142 471)Index SGD MSCI Singapore Index Singapore Exchange
(was SIMEX) 28/10/2016 276 – 6 379 508 30 293Index USD Nasdaq 100 E-Mini Index Chicago Mercantile
Exchange 16/12/2016 8 – 779 240 954Index JPY Nikkei 225 Index Singapore Exchange
(was SIMEX) 08/12/2016 49 – 3 960 549 (30 440)Index SEK OMX 30 Index OMX Nordic Exchange
Stockholm 21/10/2016 – 134 2 249 912 (19 509)Index USD Russell 2000 Mini Index ICE Futures US Indices 16/12/2016 – 65 8 113 950 (88 988)Index USD S&P 500 E-Mini Index Chicago Mercantile
Exchange 16/12/2016 – 229 24 736 580 (184 351)Index USD S&P MidCap 400 E-Mini Index Chicago Mercantile
Exchange 16/12/2016 – 6 929 760 (4 879)Index CAD S&P TSX 60 Index Montreal Exchange 15/12/2016 – 2 260 285 (495)Index AUD SPI 200 Index Australian Stock
Exchange 15/12/2016 – 36 3 730 136 (56 381)Total Futures contracts 91 254 922 (452 802)
Purchase
Sale Maturity date Counterparty
Unrealised appreciation/
(depreciation) USD
Forward foreign exchange contracts (cont.)EUR 2 134 200 000 USD 2 380 326 615 04/10/2016 State Street Bank London 18 087 479GBP 192 797 000 USD 252 719 378 04/10/2016 State Street Bank London (2 276 094)USD 10 187 612 EUR 9 100 000 04/10/2016 State Street Bank London (38 970)USD 129 578 GBP 100 000 04/10/2016 State Street Bank London (322)CAD 6 000 000 USD 4 606 683 21/12/2016 State Street Bank London (38 700)JPY 1 100 000 000 USD 10 853 298 21/12/2016 State Street Bank London 46 817KRW 10 000 000 000 USD 9 022 484 21/12/2016 Morgan Stanley Co., Inc. 53 361TWD 800 000 000 USD 25 465 012 21/12/2016 Morgan Stanley Co., Inc. 112 017USD 41 636 691 CAD 55 000 000 21/12/2016 State Street Bank London (236 486)USD 27 541 745 CNH 185 000 000 21/12/2016 Morgan Stanley Co., Inc. (53 727)

The accompanying notes form an integral part of these financial statements.
Schedule of Investments as at September 30, 2016 (cont.)(expressed in USD)
Merrill Lynch Investment Solutions – Marshall WaceTOPS UCITS Fund (Market Neutral)
50 Merrill Lynch Investment Solutions
Unaudited semi-annual report
Purchase
Sale Maturity date Counterparty
Unrealised appreciation/
(depreciation) USD
Forward foreign exchange contracts (cont.)USD 121 012 920 EUR 108 000 000 21/12/2016 State Street Bank London (810 210)USD 9 145 990 GBP 7 000 000 21/12/2016 State Street Bank London 38 017USD 16 136 352 INR 1 100 000 000 21/12/2016 Morgan Stanley Co., Inc. (169 808)USD 7 948 451 JPY 800 000 000 21/12/2016 State Street Bank London 21 095USD 9 624 148 MXN 190 000 000 21/12/2016 State Street Bank London (108 900)KRW 22 000 000 000 USD 19 821 761 15/03/2017 Morgan Stanley Co., Inc. 148 828USD 69 298 494 CNH 465 000 000 15/03/2017 Morgan Stanley Co., Inc. 230 141USD 75 919 651 KRW 84 000 000 000 15/03/2017 Morgan Stanley Co., Inc. (331 688)Total forward foreign exchange contracts 14 672 850
The maximum individual counterparty exposure for OTC Derivatives as at September 30, 2016 is 1.81% of the NAV.
Contracts for difference swaps
The Sub-Fund Merrill Lynch Investment Solutions - Marshall Wace TOPS UCITS Fund (Market Neutral) entered into contracts for difference swaps with eight counterparties (Credit Suisse Securities (Europe) Limited, Deutsche Bank AG, Goldman Sachs International, JPMorgan Chase Bank NA, Merrill Lynch International Bank Ltd, Morgan Stanley International Plc., Morgan Stanley Capital Services Inc. and UBS AG.) with the following details:
1) Credit Suisse Securities (Europe) Limited
Commitment of USD 174 858 641 for the short portfolio composed of 37 equitiesCommitment of USD 234 551 068 for the long portfolio composed of 50 equities
Market value of USD 8 699 787 detailed as follows:– unrealised depreciation of short portfolio: USD (3 077 666)– unrealised appreciation of long portfolio: USD 8 526 446– realised result: USD 3 251 007 corresponding to the realised gain on securities which is still held at the counterparty (monthly reset)
The below table is composed of long and short positions:
Industrial sector Underlying nature Long/ShortCommitment
USD
Unrealised appreciation/
(depreciation)USD
Advertising Equity Short 10 755 836 (65 880)Aerospace/Defense Equity Long 2 505 876 7 325Airlines Equity Short 5 666 734 (4 128)Apparel Equity Long 11 340 752 10 330Auto Manufacturers Equity Long 310 481 5 054Auto Parts&Equipment Equity Long 11 032 335 1 428 363Banks Equity Long 46 142 607 1 554 432Banks Equity Short 50 660 787 (1 877 785)Beverages Equity Short 10 319 431 (44 121)Building Materials Equity Long 2 136 881 83 428

The accompanying notes form an integral part of these financial statements.
Schedule of Investments as at September 30, 2016 (cont.)(expressed in USD)
Merrill Lynch Investment Solutions – Marshall WaceTOPS UCITS Fund (Market Neutral)
51Merrill Lynch Investment Solutions
Unaudited semi-annual report
Industrial sector Underlying nature Long/ShortCommitment
USD
Unrealised appreciation/
(depreciation)USD
Building Materials Equity Short 295 164 635Chemicals Equity Long 4 170 384 107 624Commercial Services Equity Long 7 397 760 6 578Commercial Services Equity Short 2 603 271 221 801Computers Equity Long 673 761 8 043Cosmetics/Personal Care Equity Short 1 738 898 (9 621)Distribution/Wholesale Equity Long 2 136 368 42 912Distribution/Wholesale Equity Short 178 030 (8 161)Diversified Financial Services Equity Long 4 960 658 (101 485)Diversified Financial Services Equity Short 566 741 (9 332)Electrical Compo&Equip Equity Long 7 974 874 (118 243)Electric Equity Long 25 188 766 615 348Electric Equity Short 5 389 057 253 807Electronics Equity Short 12 546 490Engineering&Construction Equity Long 7 149 007 319 168Entertainment Equity Long 1 586 023 (423)Food Equity Long 12 702 221 (215 445)Food Equity Short 13 641 621 (1 470 237)Gas Equity Short 400 752 2 618Home Builders Equity Long 3 180 62Home Builders Equity Short 3 180 5Insurance Equity Long 33 561 823 2 677 040Insurance Equity Short 6 673 286 29 843Investment Companies Equity Short 570 270 (14 852)Iron/Steel Equity Long 1 788 790 139 250Lodging Equity Long 102 021 1 069Lodging Equity Short 571 003 3 067Machinery-Diversified Equity Long 981 832 21 326Machinery-Diversified Equity Short 5 323 806 105 633Media Equity Long 132 753 1 040Media Equity Short 1 883 163 (66 215)Mining Equity Long 10 455 051 1 260 185Oil&Gas Services Equity Long 1 661 902 133 523Oil&Gas Equity Long 1 630 842 25 531Oil&Gas Equity Short 26 117 808 20 096Pharmaceuticals Equity Long 3 388 579 92 524Pharmaceuticals Equity Short 17 905 398 (162 663)REITS Equity Short 7 394 168 55 099Retail Equity Long 5 074 390 (164 525)Retail Equity Short 6 133 910 (37 664)Software Equity Long 7 054 613 190 142Telecommunications Equity Long 20 658 942 388 793Transportation Equity Long 53 781 747Transportation Equity Short 53 781 (101)Water Equity Long 593 815 6 730Total 409 409 709 5 448 780

The accompanying notes form an integral part of these financial statements.
Schedule of Investments as at September 30, 2016 (cont.)(expressed in USD)
Merrill Lynch Investment Solutions – Marshall WaceTOPS UCITS Fund (Market Neutral)
52 Merrill Lynch Investment Solutions
Unaudited semi-annual report
2) Deutsche Bank AG
Commitment of USD 1 511 891 604 for the short portfolio composed of 631 equities and 1 derivativeCommitment of USD 1 547 564 282 for the long portfolio composed of 793 equities
Market value of USD (3 830 311) detailed as follows:
– unrealised depreciation of short portfolio: USD (14 929 309)– unrealised appreciation of long portfolio: USD 15 997 829– realised result: USD (4 898 831) corresponding to the realised loss on securities which is still held at the counterparty (monthly reset)
The below table is composed of long and short positions:
Industrial sector Underlying nature Long/ShortCommitment
USD
Unrealised appreciation/
(depreciation)USD
Swap Index - Diversified Derivatives Short 98 474 902Advertising Equity Long 2 122 451 (112 980)Aerospace/Defense Equity Long 4 152 840 292 670Aerospace/Defense Equity Short 6 739 743 (23 223)Agriculture Equity Long 22 519 064 777 095Agriculture Equity Short 2 638 591 94 383Airlines Equity Long 882 145 (13 488)Airlines Equity Short 15 404 154 475 174Apparel Equity Long 2 469 014 (17 006)Apparel Equity Short 3 496 936 93 621Auto Manufacturers Equity Long 55 242 879 215 425Auto Manufacturers Equity Short 57 650 423 809 398Auto Parts&Equipment Equity Long 31 884 895 (472 491)Auto Parts&Equipment Equity Short 34 209 016 (535 902)Banks Equity Long 139 609 821 (4 813 799)Banks Equity Short 142 177 243 (1 416 025)Beverages Equity Long 62 821 729 1 147 356Beverages Equity Short 3 780 730 (85 577)Biotechnology Equity Long 2 742 510 211 824Biotechnology Equity Short 19 114 675 573 368Building Materials Equity Long 50 207 627 1 455 379Building Materials Equity Short 9 531 154 227 064Chemicals Equity Long 119 172 364 3 092 207Chemicals Equity Short 14 778 681 123 123Coal Equity Long 6 393 776 265 387Commercial Services Equity Long 31 594 517 (354 562)Commercial Services Equity Short 11 321 238 303 226Computers Equity Long 14 983 844 622 611Computers Equity Short 40 430 309 (2 597 745)Cosmetics/Personal Care Equity Long 61 934 502 2 868 945Cosmetics/Personal Care Equity Short 6 639 861 (48 257)Distribution/Wholesale Equity Long 20 189 242 1 441 381Distribution/Wholesale Equity Short 34 010 064 (903 146)

The accompanying notes form an integral part of these financial statements.
Schedule of Investments as at September 30, 2016 (cont.)(expressed in USD)
Merrill Lynch Investment Solutions – Marshall WaceTOPS UCITS Fund (Market Neutral)
53Merrill Lynch Investment Solutions
Unaudited semi-annual report
Industrial sector Underlying nature Long/ShortCommitment
USD
Unrealised appreciation/
(depreciation)USD
Diversified Financial Services Equity Long 76 353 461 3 104 487Diversified Financial Services Equity Short 44 375 462 19 712Electrical Compo&Equip Equity Long 15 946 700 937 911Electrical Compo&Equip Equity Short 20 471 016 827 785Electric Equity Long 1 505 882 (124 824)Electric Equity Short 19 032 651 (62 811)Electronics Equity Long 33 249 942 801 286Electronics Equity Short 59 188 279 (730 113)Energy-Alternate Sources Equity Long 2 399 603 (91 857)Energy-Alternate Sources Equity Short 2 807 552 286 343Engineering&Construction Equity Long 50 131 975 (131 831)Engineering&Construction Equity Short 26 557 865 (2 108 822)Entertainment Equity Long 11 226 986 810 755Entertainment Equity Short 6 102 515 532Environmental Control Equity Long 200 835 (1 018)Environmental Control Equity Short 3 566 8Food Service Equity Short 738 444 52 595Food Equity Long 56 145 710 1 136 816Food Equity Short 63 307 518 (2 077 075)Forest Products&Paper Equity Long 6 574 574 (46 096)Forest Products&Paper Equity Short 781 897 (5 969)Gas Equity Long 83 742 (4 942)Gas Equity Short 30 808 765 (726 762)Hand/Machine Tools Equity Long 9 186 794 91 296Hand/Machine Tools Equity Short 10 703 170 (294 297)Healthcare-Products Equity Long 18 061 467 65 721Healthcare-Products Equity Short 10 318 103 (532 799)Healthcare-Services Equity Long 2 766 208 240 648Healthcare-Services Equity Short 6 453 384 173 245Holding Companies-Divers Equity Long 17 677 880 768 790Holding Companies-Divers Equity Short 41 839 320 (667 414)Home Builders Equity Long 16 270 402 (547 943)Home Builders Equity Short 214 818 (510)Home Furnishings Equity Long 7 151 620 54 084Home Furnishings Equity Short 53 283 880 (130 240)Household Products/Wares Equity Long 569 049 2 423Insurance Equity Long 43 028 006 (1 235 856)Insurance Equity Short 25 046 878 294 356Internet Equity Long 64 736 321 1 736 830Internet Equity Short 24 797 625 351 893Investment Companies Equity Long 2 272 754 (75 606)Investment Companies Equity Short 147 875 5 503Iron/Steel Equity Long 27 885 188 (244 191)Iron/Steel Equity Short 29 647 274 (104 956)Leisure Time Equity Long 1 328 014 (32 439)

The accompanying notes form an integral part of these financial statements.
Schedule of Investments as at September 30, 2016 (cont.)(expressed in USD)
Merrill Lynch Investment Solutions – Marshall WaceTOPS UCITS Fund (Market Neutral)
54 Merrill Lynch Investment Solutions
Unaudited semi-annual report
Industrial sector Underlying nature Long/ShortCommitment
USD
Unrealised appreciation/
(depreciation)USD
Leisure Time Equity Short 36 222 182 (2 138 319)Lodging Equity Long 10 606 430 28 362Lodging Equity Short 41 124 631 (2 573 896)Machinery-Constr&Mining Equity Long 1 336 166 (13 403)Machinery-Constr&Mining Equity Short 27 509 247 (160 537)Machinery-Diversified Equity Long 14 165 295 (363 834)Machinery-Diversified Equity Short 29 226 490 808 630Media Equity Long 8 604 479 332 093Media Equity Short 17 228 942 (745 439)Metal Fabricate/Hardware Equity Long 1 420 009 32 078Metal Fabricate/Hardware Equity Short 4 860 643 (72 538)Mining Equity Long 35 780 929 958 176Mining Equity Short 59 031 375 (1 773 039)Miscellaneous Manufactur Equity Long 34 784 080 1 636 869Miscellaneous Manufactur Equity Short 5 039 404 94 047Office/Business Equip Equity Long 947 968 (77 264)Office/Business Equip Equity Short 14 366 136 17 736Oil&Gas Equity Long 30 449 009 502 515Oil&Gas Equity Short 26 186 254 (549 563)Packaging&Containers Equity Long 4 857 593 200 197Packaging&Containers Equity Short 2 638 968 96 016Pharmaceuticals Equity Long 52 941 616 772 556Pharmaceuticals Equity Short 13 914 193 (611 259)Pipelines Equity Short 123 318 (33)Private Equity Equity Long 69 679 (1 199)Real Estate Equity Long 64 235 861 (1 401 653)Real Estate Equity Short 33 609 485 (338 288)REITS Equity Long 3 757 506 106 554REITS Equity Short 40 732 330 868 012Retail Equity Long 28 343 558 (366 939)Retail Equity Short 82 936 967 2 759 500Semiconductors Equity Long 40 269 164 601 551Semiconductors Equity Short 36 981 738 (1 060 184)Shipbuilding Equity Short 4 927 588 157 937Software Equity Long 25 424 892 883 905Software Equity Short 17 489 927 (2 914 373)Telecommunications Equity Long 55 315 882 (736 088)Telecommunications Equity Short 110 496 252 1 873 875Textiles Equity Long 1 733 660 142 458Toys/Games/Hobbies Equity Long 4 202 701 (57 862)Toys/Games/Hobbies Equity Short 5 466 146Transportation Equity Long 32 981 091 (949 994)Transportation Equity Short 28 590 922 (328 325)Water Equity Long 1 660 378 (51 649)Total 3 059 455 886 1 068 521
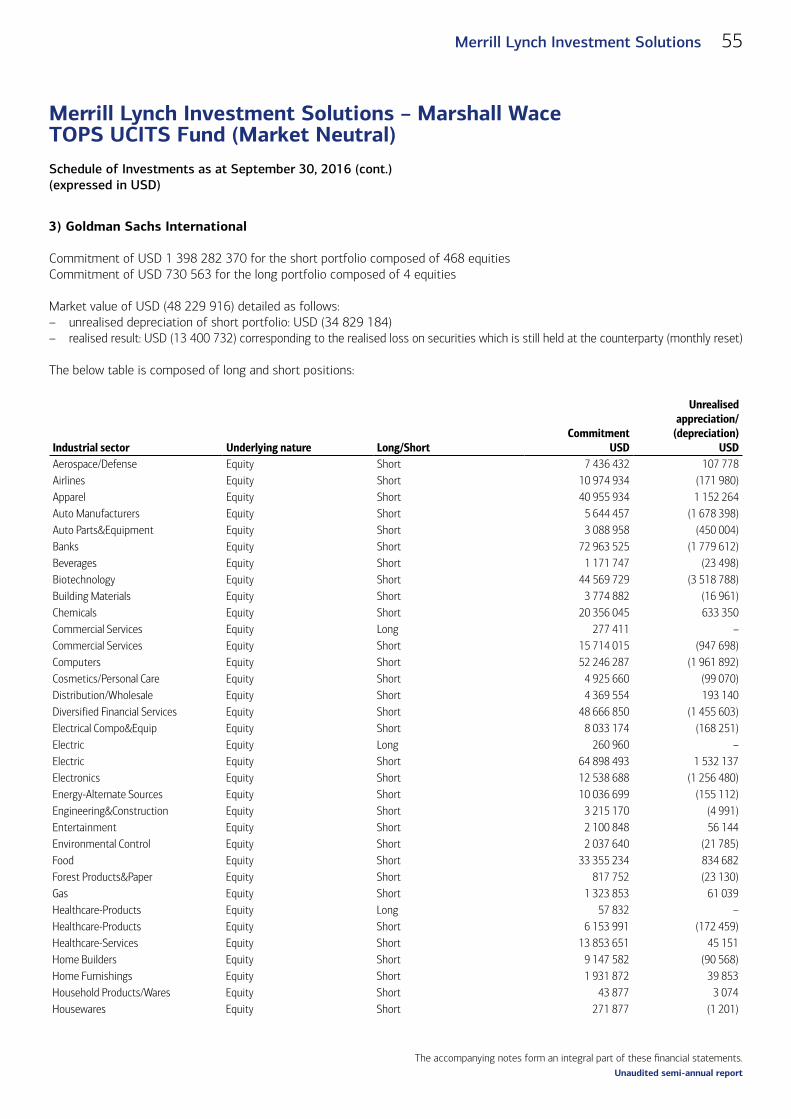
The accompanying notes form an integral part of these financial statements.
Schedule of Investments as at September 30, 2016 (cont.)(expressed in USD)
Merrill Lynch Investment Solutions – Marshall WaceTOPS UCITS Fund (Market Neutral)
55Merrill Lynch Investment Solutions
Unaudited semi-annual report
3) Goldman Sachs International
Commitment of USD 1 398 282 370 for the short portfolio composed of 468 equitiesCommitment of USD 730 563 for the long portfolio composed of 4 equities
Market value of USD (48 229 916) detailed as follows:– unrealised depreciation of short portfolio: USD (34 829 184)– realised result: USD (13 400 732) corresponding to the realised loss on securities which is still held at the counterparty (monthly reset)
The below table is composed of long and short positions:
Industrial sector Underlying nature Long/ShortCommitment
USD
Unrealised appreciation/
(depreciation)USD
Aerospace/Defense Equity Short 7 436 432 107 778Airlines Equity Short 10 974 934 (171 980)Apparel Equity Short 40 955 934 1 152 264Auto Manufacturers Equity Short 5 644 457 (1 678 398)Auto Parts&Equipment Equity Short 3 088 958 (450 004)Banks Equity Short 72 963 525 (1 779 612)Beverages Equity Short 1 171 747 (23 498)Biotechnology Equity Short 44 569 729 (3 518 788)Building Materials Equity Short 3 774 882 (16 961)Chemicals Equity Short 20 356 045 633 350Commercial Services Equity Long 277 411 –Commercial Services Equity Short 15 714 015 (947 698)Computers Equity Short 52 246 287 (1 961 892)Cosmetics/Personal Care Equity Short 4 925 660 (99 070)Distribution/Wholesale Equity Short 4 369 554 193 140Diversified Financial Services Equity Short 48 666 850 (1 455 603)Electrical Compo&Equip Equity Short 8 033 174 (168 251)Electric Equity Long 260 960 –Electric Equity Short 64 898 493 1 532 137Electronics Equity Short 12 538 688 (1 256 480)Energy-Alternate Sources Equity Short 10 036 699 (155 112)Engineering&Construction Equity Short 3 215 170 (4 991)Entertainment Equity Short 2 100 848 56 144Environmental Control Equity Short 2 037 640 (21 785)Food Equity Short 33 355 234 834 682Forest Products&Paper Equity Short 817 752 (23 130)Gas Equity Short 1 323 853 61 039Healthcare-Products Equity Long 57 832 –Healthcare-Products Equity Short 6 153 991 (172 459)Healthcare-Services Equity Short 13 853 651 45 151Home Builders Equity Short 9 147 582 (90 568)Home Furnishings Equity Short 1 931 872 39 853Household Products/Wares Equity Short 43 877 3 074Housewares Equity Short 271 877 (1 201)
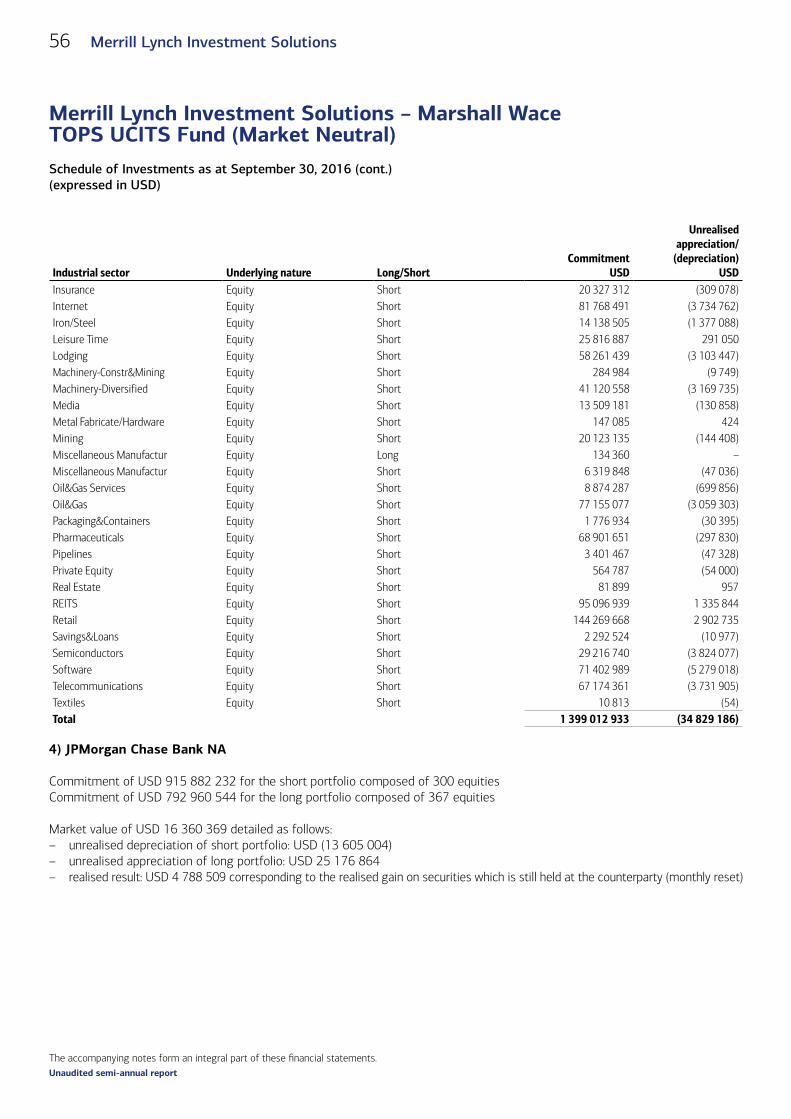
The accompanying notes form an integral part of these financial statements.
Schedule of Investments as at September 30, 2016 (cont.)(expressed in USD)
Merrill Lynch Investment Solutions – Marshall WaceTOPS UCITS Fund (Market Neutral)
56 Merrill Lynch Investment Solutions
Unaudited semi-annual report
Industrial sector Underlying nature Long/ShortCommitment
USD
Unrealised appreciation/
(depreciation)USD
Insurance Equity Short 20 327 312 (309 078)Internet Equity Short 81 768 491 (3 734 762)Iron/Steel Equity Short 14 138 505 (1 377 088)Leisure Time Equity Short 25 816 887 291 050Lodging Equity Short 58 261 439 (3 103 447)Machinery-Constr&Mining Equity Short 284 984 (9 749)Machinery-Diversified Equity Short 41 120 558 (3 169 735)Media Equity Short 13 509 181 (130 858)Metal Fabricate/Hardware Equity Short 147 085 424Mining Equity Short 20 123 135 (144 408)Miscellaneous Manufactur Equity Long 134 360 –Miscellaneous Manufactur Equity Short 6 319 848 (47 036)Oil&Gas Services Equity Short 8 874 287 (699 856)Oil&Gas Equity Short 77 155 077 (3 059 303)Packaging&Containers Equity Short 1 776 934 (30 395)Pharmaceuticals Equity Short 68 901 651 (297 830)Pipelines Equity Short 3 401 467 (47 328)Private Equity Equity Short 564 787 (54 000)Real Estate Equity Short 81 899 957REITS Equity Short 95 096 939 1 335 844Retail Equity Short 144 269 668 2 902 735Savings&Loans Equity Short 2 292 524 (10 977)Semiconductors Equity Short 29 216 740 (3 824 077)Software Equity Short 71 402 989 (5 279 018)Telecommunications Equity Short 67 174 361 (3 731 905)Textiles Equity Short 10 813 (54)Total 1 399 012 933 (34 829 186)
4) JPMorgan Chase Bank NA
Commitment of USD 915 882 232 for the short portfolio composed of 300 equitiesCommitment of USD 792 960 544 for the long portfolio composed of 367 equities
Market value of USD 16 360 369 detailed as follows:– unrealised depreciation of short portfolio: USD (13 605 004)– unrealised appreciation of long portfolio: USD 25 176 864– realised result: USD 4 788 509 corresponding to the realised gain on securities which is still held at the counterparty (monthly reset)
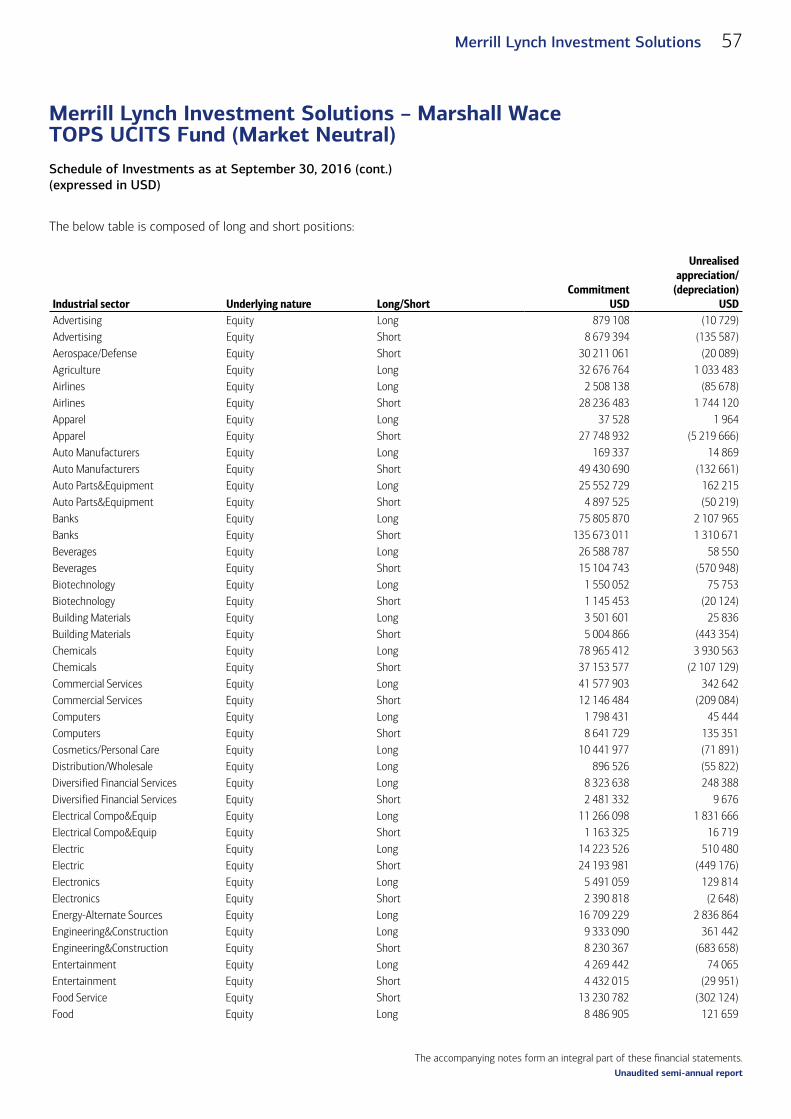
The accompanying notes form an integral part of these financial statements.
Schedule of Investments as at September 30, 2016 (cont.)(expressed in USD)
Merrill Lynch Investment Solutions – Marshall WaceTOPS UCITS Fund (Market Neutral)
57Merrill Lynch Investment Solutions
Unaudited semi-annual report
The below table is composed of long and short positions:
Industrial sector Underlying nature Long/ShortCommitment
USD
Unrealised appreciation/
(depreciation)USD
Advertising Equity Long 879 108 (10 729)Advertising Equity Short 8 679 394 (135 587)Aerospace/Defense Equity Short 30 211 061 (20 089)Agriculture Equity Long 32 676 764 1 033 483Airlines Equity Long 2 508 138 (85 678)Airlines Equity Short 28 236 483 1 744 120Apparel Equity Long 37 528 1 964Apparel Equity Short 27 748 932 (5 219 666)Auto Manufacturers Equity Long 169 337 14 869Auto Manufacturers Equity Short 49 430 690 (132 661)Auto Parts&Equipment Equity Long 25 552 729 162 215Auto Parts&Equipment Equity Short 4 897 525 (50 219)Banks Equity Long 75 805 870 2 107 965Banks Equity Short 135 673 011 1 310 671Beverages Equity Long 26 588 787 58 550Beverages Equity Short 15 104 743 (570 948)Biotechnology Equity Long 1 550 052 75 753Biotechnology Equity Short 1 145 453 (20 124)Building Materials Equity Long 3 501 601 25 836Building Materials Equity Short 5 004 866 (443 354)Chemicals Equity Long 78 965 412 3 930 563Chemicals Equity Short 37 153 577 (2 107 129)Commercial Services Equity Long 41 577 903 342 642Commercial Services Equity Short 12 146 484 (209 084)Computers Equity Long 1 798 431 45 444Computers Equity Short 8 641 729 135 351Cosmetics/Personal Care Equity Long 10 441 977 (71 891)Distribution/Wholesale Equity Long 896 526 (55 822)Diversified Financial Services Equity Long 8 323 638 248 388Diversified Financial Services Equity Short 2 481 332 9 676Electrical Compo&Equip Equity Long 11 266 098 1 831 666Electrical Compo&Equip Equity Short 1 163 325 16 719Electric Equity Long 14 223 526 510 480Electric Equity Short 24 193 981 (449 176)Electronics Equity Long 5 491 059 129 814Electronics Equity Short 2 390 818 (2 648)Energy-Alternate Sources Equity Long 16 709 229 2 836 864Engineering&Construction Equity Long 9 333 090 361 442Engineering&Construction Equity Short 8 230 367 (683 658)Entertainment Equity Long 4 269 442 74 065Entertainment Equity Short 4 432 015 (29 951)Food Service Equity Short 13 230 782 (302 124)Food Equity Long 8 486 905 121 659
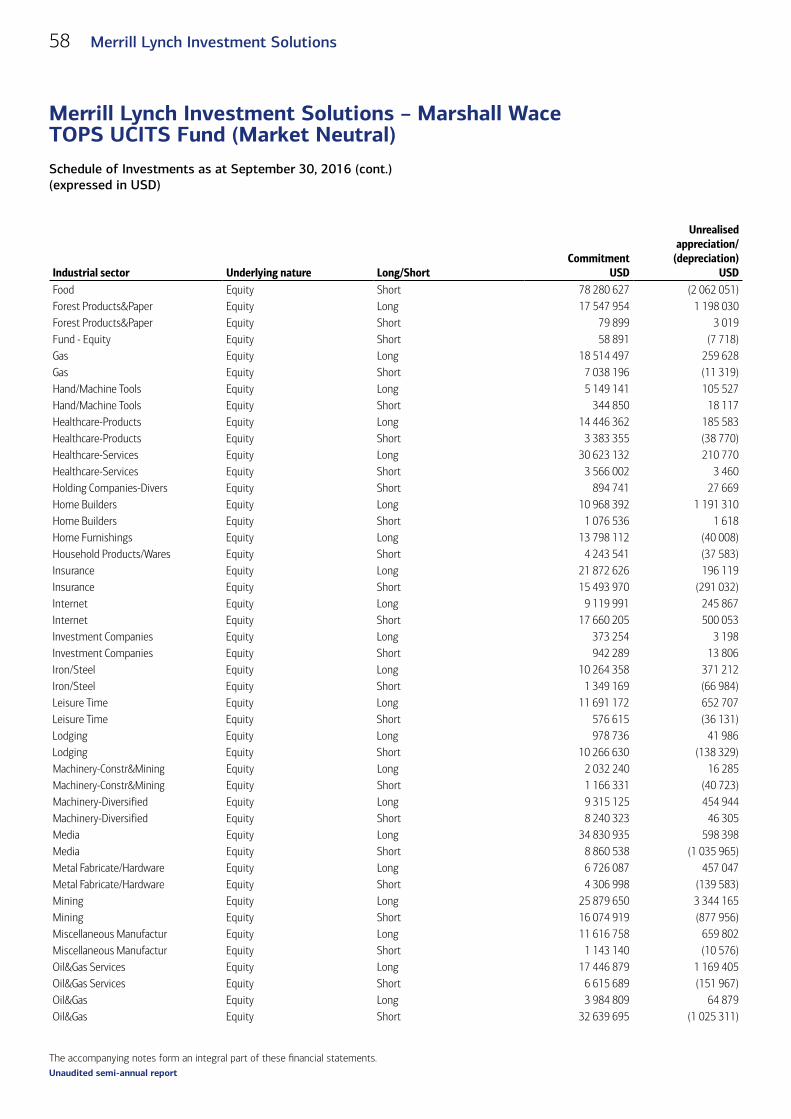
The accompanying notes form an integral part of these financial statements.
Schedule of Investments as at September 30, 2016 (cont.)(expressed in USD)
Merrill Lynch Investment Solutions – Marshall WaceTOPS UCITS Fund (Market Neutral)
58 Merrill Lynch Investment Solutions
Unaudited semi-annual report
Industrial sector Underlying nature Long/ShortCommitment
USD
Unrealised appreciation/
(depreciation)USD
Food Equity Short 78 280 627 (2 062 051)Forest Products&Paper Equity Long 17 547 954 1 198 030Forest Products&Paper Equity Short 79 899 3 019Fund - Equity Equity Short 58 891 (7 718)Gas Equity Long 18 514 497 259 628Gas Equity Short 7 038 196 (11 319)Hand/Machine Tools Equity Long 5 149 141 105 527Hand/Machine Tools Equity Short 344 850 18 117Healthcare-Products Equity Long 14 446 362 185 583Healthcare-Products Equity Short 3 383 355 (38 770)Healthcare-Services Equity Long 30 623 132 210 770Healthcare-Services Equity Short 3 566 002 3 460Holding Companies-Divers Equity Short 894 741 27 669Home Builders Equity Long 10 968 392 1 191 310Home Builders Equity Short 1 076 536 1 618Home Furnishings Equity Long 13 798 112 (40 008)Household Products/Wares Equity Short 4 243 541 (37 583)Insurance Equity Long 21 872 626 196 119Insurance Equity Short 15 493 970 (291 032)Internet Equity Long 9 119 991 245 867Internet Equity Short 17 660 205 500 053Investment Companies Equity Long 373 254 3 198Investment Companies Equity Short 942 289 13 806Iron/Steel Equity Long 10 264 358 371 212Iron/Steel Equity Short 1 349 169 (66 984)Leisure Time Equity Long 11 691 172 652 707Leisure Time Equity Short 576 615 (36 131)Lodging Equity Long 978 736 41 986Lodging Equity Short 10 266 630 (138 329)Machinery-Constr&Mining Equity Long 2 032 240 16 285Machinery-Constr&Mining Equity Short 1 166 331 (40 723)Machinery-Diversified Equity Long 9 315 125 454 944Machinery-Diversified Equity Short 8 240 323 46 305Media Equity Long 34 830 935 598 398Media Equity Short 8 860 538 (1 035 965)Metal Fabricate/Hardware Equity Long 6 726 087 457 047Metal Fabricate/Hardware Equity Short 4 306 998 (139 583)Mining Equity Long 25 879 650 3 344 165Mining Equity Short 16 074 919 (877 956)Miscellaneous Manufactur Equity Long 11 616 758 659 802Miscellaneous Manufactur Equity Short 1 143 140 (10 576)Oil&Gas Services Equity Long 17 446 879 1 169 405Oil&Gas Services Equity Short 6 615 689 (151 967)Oil&Gas Equity Long 3 984 809 64 879Oil&Gas Equity Short 32 639 695 (1 025 311)

The accompanying notes form an integral part of these financial statements.
Schedule of Investments as at September 30, 2016 (cont.)(expressed in USD)
Merrill Lynch Investment Solutions – Marshall WaceTOPS UCITS Fund (Market Neutral)
59Merrill Lynch Investment Solutions
Unaudited semi-annual report
Industrial sector Underlying nature Long/ShortCommitment
USD
Unrealised appreciation/
(depreciation)USD
Packaging&Containers Equity Long 2 919 575 73 702Packaging&Containers Equity Short 64 597 (228)Pharmaceuticals Equity Long 34 102 793 (1 012 171)Pharmaceuticals Equity Short 61 119 461 1 442 085Pipelines Equity Long 2 459 337 45 074Private Equity Equity Long 5 201 467 711 582Real Estate Equity Long 3 315 492 (38 829)Real Estate Equity Short 13 508 020 385 810REITS Equity Long 2 399 116 65 321REITS Equity Short 14 903 490 (177 455)Retail Equity Long 41 251 974 (204 563)Retail Equity Short 69 605 163 154 468Semiconductors Equity Long 4 847 016 519 005Semiconductors Equity Short 14 921 068 (1 692 335)Software Equity Long 5 398 550 261 063Software Equity Short 26 936 626 (1 108 438)Telecommunications Equity Long 21 881 740 (579 434)Telecommunications Equity Short 61 624 101 (131 314)Transportation Equity Long 9 887 758 216 031Transportation Equity Short 8 699 990 40 234Water Equity Long 1 062 364 43 687Total 1 708 842 775 11 571 859
5) Merrill Lynch International Bank Ltd
Commitment of USD 105 442 698 for the short portfolio composed of 41 equitiesCommitment of USD 135 318 438 for the long portfolio composed of 44 equities
Market value of USD 4 453 081 detailed as follows:– unrealised appreciation of short portfolio: USD 1 165 334– unrealised appreciation of long portfolio: USD 2 948 263– realised result: USD 339 484 corresponding to the realised gain on securities which is still held at the counterparty (monthly reset)
The below table is composed of long and short positions:
Industrial sector Underlying nature Long/ShortCommitment
USD
Unrealised appreciation/
(depreciation)USD
Advertising Equity Short 1 566 994 71 303Aerospace/Defense Equity Short 10 068 692 (403 491)Airlines Equity Short 2 041 751 1 118 172Apparel Equity Short 573 599 (10 392)Auto Manufacturers Equity Long 246 009 1 984Auto Parts&Equipment Equity Long 15 220 503 330 499

The accompanying notes form an integral part of these financial statements.
Schedule of Investments as at September 30, 2016 (cont.)(expressed in USD)
Merrill Lynch Investment Solutions – Marshall WaceTOPS UCITS Fund (Market Neutral)
60 Merrill Lynch Investment Solutions
Unaudited semi-annual report
Industrial sector Underlying nature Long/ShortCommitment
USD
Unrealised appreciation/
(depreciation)USD
Beverages Equity Long 95 022 (562)Biotechnology Equity Short 95 788 13 812Building Materials Equity Long 8 600 329 465 154Building Materials Equity Short 1 118 464 (10 014)Chemicals Equity Long 62 728 (706)Chemicals Equity Short 145 645 (13 858)Commercial Services Equity Long 1 007 570 (16 359)Commercial Services Equity Short 2 895 766 (329 018)Computers Equity Long 14 731 241 729 897Computers Equity Short 7 289 173 925 388Cosmetics/Personal Care Equity Long 21 244 908 (388 136)Cosmetics/Personal Care Equity Short 14 665 752 32 105Distribution/Wholesale Equity Long 956 796 (16 570)Diversified Financial Services Equity Long 429 885 70 918Diversified Financial Services Equity Short 3 344 (6)Electrical Compo&Equip Equity Long 1 772 222 237 579Engineering&Construction Equity Long 252 971 2 524Engineering&Construction Equity Short 3 408 423 (39 652)Entertainment Equity Long 219 595 1 599Food Service Equity Long 858 995 11 933Food Equity Long 364 727 3 003Food Equity Short 6 486 589 724 670Healthcare-Products Equity Long 16 486 161 308 999Healthcare-Services Equity Long 893 822 69 208Healthcare-Services Equity Short 279 936 (1 911)Holding Companies-Divers Equity Short 1 007 598 (21 740)Home Builders Equity Long 184 866 23 266Home Furnishings Equity Long 360 354 39 564Household Products/Wares Equity Long 627 005 48 972Insurance Equity Long 20 318 029 218 423Internet Equity Long 844 853 58 833Machinery-Constr&Mining Equity Short 3 962 415 (125 150)Media Equity Long 1 192 549 97 988Media Equity Short 395 753 (103)Metal Fabricate/Hardware Equity Short 1 027 011 (17 732)Oil&Gas Equity Long 11 041 926 107 807Pharmaceuticals Equity Long 414 686 11 999Pharmaceuticals Equity Short 25 350 551 (600 537)Real Estate Equity Short 4 658 696 15 549REITS Equity Long 1 300 325 40 778REITS Equity Short 8 799 465 187 326Retail Equity Long 173 533 (4 956)Semiconductors Equity Short 2 147 257 (104 660)Software Equity Long 1 285 004 (28 043)Telecommunications Equity Short 6 795 377 (259 833)

The accompanying notes form an integral part of these financial statements.
Schedule of Investments as at September 30, 2016 (cont.)(expressed in USD)
Merrill Lynch Investment Solutions – Marshall WaceTOPS UCITS Fund (Market Neutral)
61Merrill Lynch Investment Solutions
Unaudited semi-annual report
Industrial sector Underlying nature Long/ShortCommitment
USD
Unrealised appreciation/
(depreciation)USD
Transportation Equity Short 658 659 15 105Water Equity Long 14 131 824 522 668Total 240 761 136 4 113 596
6) Morgan Stanley International Plc.
Commitment of USD 193 170 626 for the short portfolio composed of 135 equities and 1 derivativeCommitment of USD 120 136 931 for the long portfolio composed of 141 equities
Market value of USD 7 967 288 detailed as follows:– unrealised appreciation of short portfolio: USD 2 857 938– unrealised appreciation of long portfolio: USD 2 298 857– realised result: USD 2 810 493 corresponding to the realised gain on securities which is still held at the counterparty (monthly reset)
The below table is composed of long and short positions:
Industrial sector Underlying nature Long/ShortCommitment
USD
Unrealised appreciation/
(depreciation)USD
Auto Parts&Equipment Bond Long 1 518 674 19 859Auto Parts&Equipment Bond Short 189 586 (2 082)Banks Bond Long 1 296 011 (30 123)Banks Bond Short 11 974 777 64 222Commercial Services Bond Short 23 823 448Diversified Financial Services Bond Long 1 135 113 (33 902)Diversified Financial Services Bond Short 8 905 502 161 092Electric Bond Long 52 470 (152)Engineering&Construction Bond Long 1 142 746 (43 039)Engineering&Construction Bond Short 29 811 (39)Food Bond Long 39 830 58Food Bond Short 509 818 20 672Healthcare-Products Bond Short 853 933 30 093Media Bond Long 670 574 8 102Mining Bond Long 140 434 1 211Miscellaneous Manufactur Bond Long 13 212 (699)Miscellaneous Manufactur Bond Short 13 212 (35)Textiles Bond Long 348 704 (3 080)Swap Index - Diversified Derivatives Short 253 292 172Advertising Equity Long 60 019 1 696Aerospace/Defense Equity Short 4 472 247 (16 799)Agriculture Equity Long 11 110 001 615 247Airlines Equity Long 813 196 9 305Airlines Equity Short 2 476 511 307 165Apparel Equity Short 817 962 26 511Auto Manufacturers Equity Long 613 635 18 046

The accompanying notes form an integral part of these financial statements.
Schedule of Investments as at September 30, 2016 (cont.)(expressed in USD)
Merrill Lynch Investment Solutions – Marshall WaceTOPS UCITS Fund (Market Neutral)
62 Merrill Lynch Investment Solutions
Unaudited semi-annual report
Industrial sector Underlying nature Long/ShortCommitment
USD
Unrealised appreciation/
(depreciation)USD
Auto Manufacturers Equity Short 4 033 510 130 964Auto Parts&Equipment Equity Long 23 5Banks Equity Long 79 613 324Banks Equity Long 3 659 618 197 772Banks Equity Short 36 861 741 430 704Beverages Equity Long 390 594 16 475Beverages Equity Short 5 246 236 167 645Biotechnology Equity Short 3 107 755 64 847Building Materials Equity Short 172 476 4 246Chemicals Equity Long 9 131 969 (130 743)Chemicals Equity Short 4 084 203 226 643Coal Equity Long 496 477 10 055Commercial Services Equity Long 1 015 882 9 899Commercial Services Equity Short 2 749 087 47 768Computers Equity Long 2 425 353 (153 987)Computers Equity Short 3 831 936 13 736Diversified Financial Services Equity Long 6 769 775 16 238Diversified Financial Services Equity Short 14 291 371 271 341Electrical Compo&Equip Equity Long 252 702 (4 642)Electrical Compo&Equip Equity Short 3 878 522 190 079Electric Equity Long 8 631 131 51 269Electric Equity Short 1 078 859 (16 462)Electronics Equity Long 195 472 (1 372)Electronics Equity Short 1 954 722 108 804Engineering&Construction Equity Long 2 302 811 48 482Engineering&Construction Equity Short 1 082 049 (20 997)Food Equity Long 2 852 051 (21 564)Food Equity Short 3 299 519 25 923Forest Products&Paper Equity Long 6 495 (14)Forest Products&Paper Equity Short 116 899 5 742Gas Equity Long 1 109 744 46 551Gas Equity Short 648 925 7 762Hand/Machine Tools Equity Short 1 239 113 (23 485)Healthcare-Products Equity Short 534 488 9 803Healthcare-Services Equity Long 235 847 (2 356)Home Builders Equity Short 48 623 1 506Home Furnishings Equity Long 3 118 355 261 480Home Furnishings Equity Short 2 404 190 42 549Household Products/Wares Equity Long 1 161 770 (19 716)Insurance Equity Long 2 184 727 (29 228)Insurance Equity Short 219 629 400Iron/Steel Equity Long 1 196 316 4 210Iron/Steel Equity Short 16 987 547 436 306Leisure Time Equity Long 1 679 151 67 615
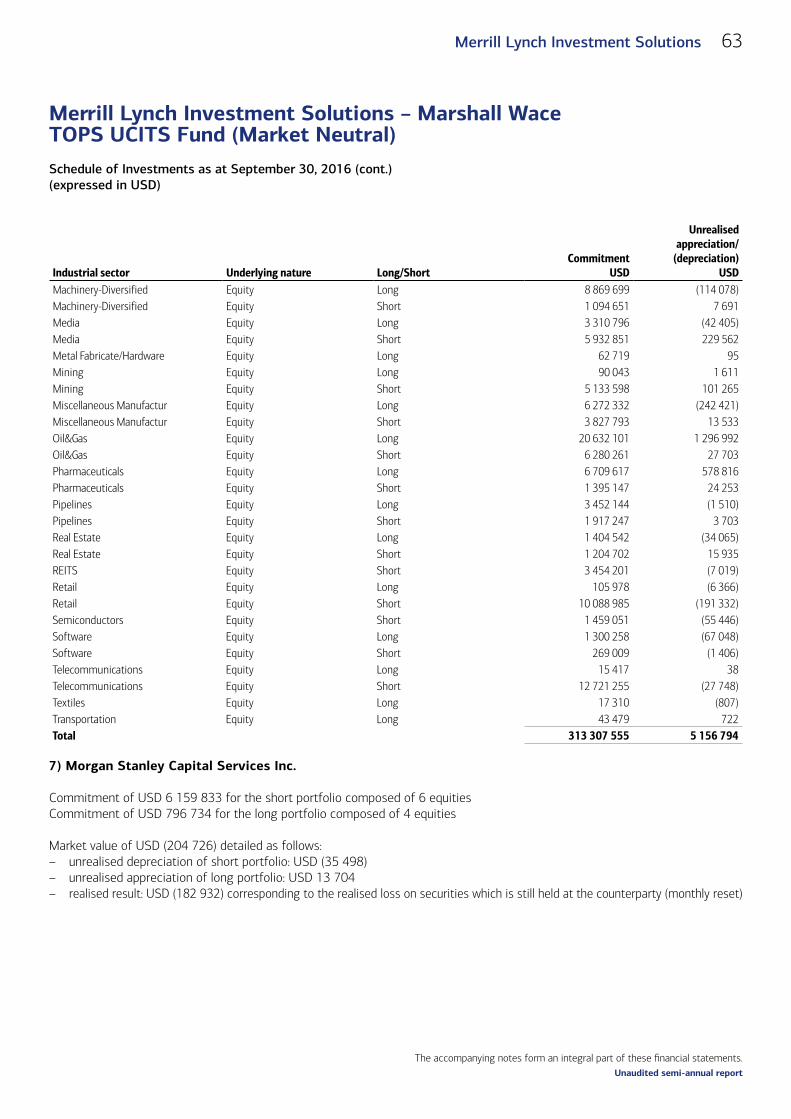
The accompanying notes form an integral part of these financial statements.
Schedule of Investments as at September 30, 2016 (cont.)(expressed in USD)
Merrill Lynch Investment Solutions – Marshall WaceTOPS UCITS Fund (Market Neutral)
63Merrill Lynch Investment Solutions
Unaudited semi-annual report
Industrial sector Underlying nature Long/ShortCommitment
USD
Unrealised appreciation/
(depreciation)USD
Machinery-Diversified Equity Long 8 869 699 (114 078)Machinery-Diversified Equity Short 1 094 651 7 691Media Equity Long 3 310 796 (42 405)Media Equity Short 5 932 851 229 562Metal Fabricate/Hardware Equity Long 62 719 95Mining Equity Long 90 043 1 611Mining Equity Short 5 133 598 101 265Miscellaneous Manufactur Equity Long 6 272 332 (242 421)Miscellaneous Manufactur Equity Short 3 827 793 13 533Oil&Gas Equity Long 20 632 101 1 296 992Oil&Gas Equity Short 6 280 261 27 703Pharmaceuticals Equity Long 6 709 617 578 816Pharmaceuticals Equity Short 1 395 147 24 253Pipelines Equity Long 3 452 144 (1 510)Pipelines Equity Short 1 917 247 3 703Real Estate Equity Long 1 404 542 (34 065)Real Estate Equity Short 1 204 702 15 935REITS Equity Short 3 454 201 (7 019)Retail Equity Long 105 978 (6 366)Retail Equity Short 10 088 985 (191 332)Semiconductors Equity Short 1 459 051 (55 446)Software Equity Long 1 300 258 (67 048)Software Equity Short 269 009 (1 406)Telecommunications Equity Long 15 417 38Telecommunications Equity Short 12 721 255 (27 748)Textiles Equity Long 17 310 (807)Transportation Equity Long 43 479 722Total 313 307 555 5 156 794
7) Morgan Stanley Capital Services Inc.
Commitment of USD 6 159 833 for the short portfolio composed of 6 equitiesCommitment of USD 796 734 for the long portfolio composed of 4 equities
Market value of USD (204 726) detailed as follows:– unrealised depreciation of short portfolio: USD (35 498)– unrealised appreciation of long portfolio: USD 13 704– realised result: USD (182 932) corresponding to the realised loss on securities which is still held at the counterparty (monthly reset)
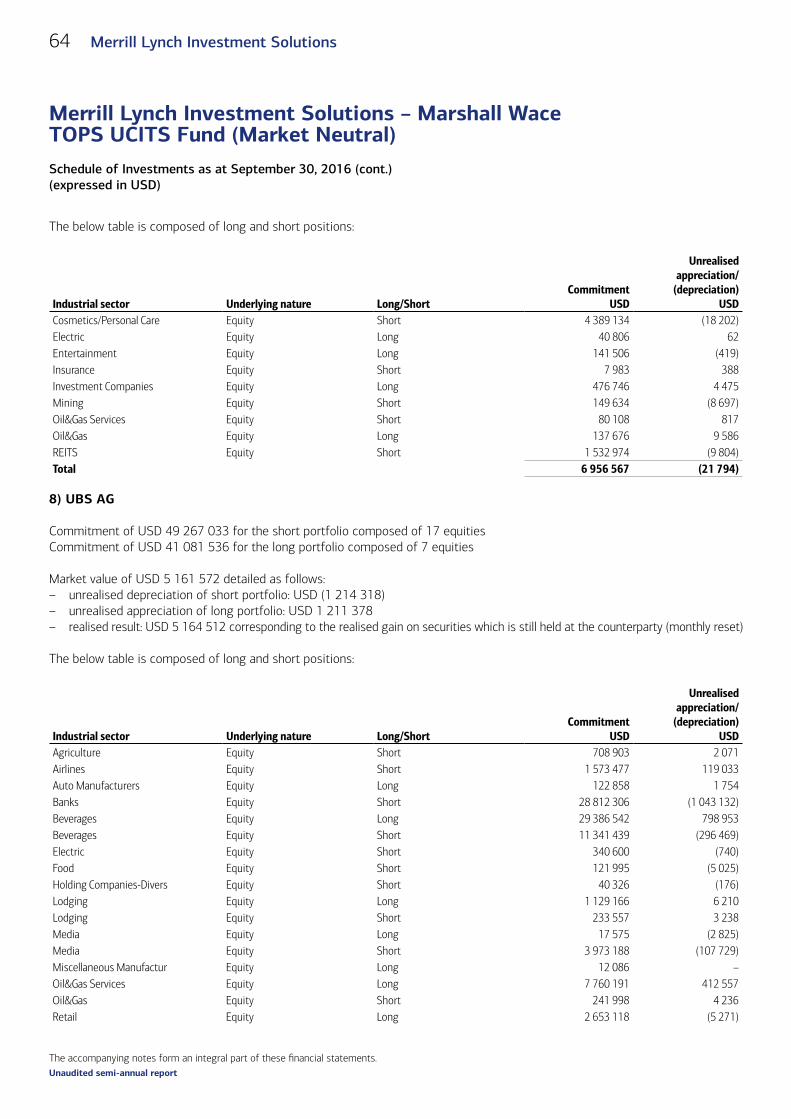
The accompanying notes form an integral part of these financial statements.
Schedule of Investments as at September 30, 2016 (cont.)(expressed in USD)
Merrill Lynch Investment Solutions – Marshall WaceTOPS UCITS Fund (Market Neutral)
64 Merrill Lynch Investment Solutions
Unaudited semi-annual report
The below table is composed of long and short positions:
Industrial sector Underlying nature Long/ShortCommitment
USD
Unrealised appreciation/
(depreciation)USD
Cosmetics/Personal Care Equity Short 4 389 134 (18 202)Electric Equity Long 40 806 62Entertainment Equity Long 141 506 (419)Insurance Equity Short 7 983 388Investment Companies Equity Long 476 746 4 475Mining Equity Short 149 634 (8 697)Oil&Gas Services Equity Short 80 108 817Oil&Gas Equity Long 137 676 9 586REITS Equity Short 1 532 974 (9 804)Total 6 956 567 (21 794)
8) UBS AG
Commitment of USD 49 267 033 for the short portfolio composed of 17 equitiesCommitment of USD 41 081 536 for the long portfolio composed of 7 equities
Market value of USD 5 161 572 detailed as follows:– unrealised depreciation of short portfolio: USD (1 214 318)– unrealised appreciation of long portfolio: USD 1 211 378– realised result: USD 5 164 512 corresponding to the realised gain on securities which is still held at the counterparty (monthly reset)
The below table is composed of long and short positions:
Industrial sector Underlying nature Long/ShortCommitment
USD
Unrealised appreciation/
(depreciation)USD
Agriculture Equity Short 708 903 2 071Airlines Equity Short 1 573 477 119 033Auto Manufacturers Equity Long 122 858 1 754Banks Equity Short 28 812 306 (1 043 132)Beverages Equity Long 29 386 542 798 953Beverages Equity Short 11 341 439 (296 469)Electric Equity Short 340 600 (740)Food Equity Short 121 995 (5 025)Holding Companies-Divers Equity Short 40 326 (176)Lodging Equity Long 1 129 166 6 210Lodging Equity Short 233 557 3 238Media Equity Long 17 575 (2 825)Media Equity Short 3 973 188 (107 729)Miscellaneous Manufactur Equity Long 12 086 –Oil&Gas Services Equity Long 7 760 191 412 557Oil&Gas Equity Short 241 998 4 236Retail Equity Long 2 653 118 (5 271)

The accompanying notes form an integral part of these financial statements.
Schedule of Investments as at September 30, 2016 (cont.)(expressed in USD)
Merrill Lynch Investment Solutions – Marshall WaceTOPS UCITS Fund (Market Neutral)
65Merrill Lynch Investment Solutions
Unaudited semi-annual report
Industrial sector Underlying nature Long/ShortCommitment
USD
Unrealised appreciation/
(depreciation)USD
Telecommunications Equity Short 1 143 322 106 120Transportation Equity Short 735 922 4 255Total 90 348 569 (2 940)
The total market value of the contracts for difference swaps is USD (9 622 859).

The accompanying notes form an integral part of these financial statements.
Schedule of Investments as at September 30, 2016 (expressed in EUR)
Merrill Lynch Investment Solutions – York Event-Driven UCITS Fund
66 Merrill Lynch Investment Solutions
Unaudited semi-annual report
Schedule of Investments as at September 30, 2016 (expressed in EUR)
Nominal value/
Quantity DescriptionQuotation
CurrencyCost EUR
Market value
EUR% of net
assets
Transferable securities and money market instruments admitted to an official exchange listing or dealt in on another regulated market (cont.)
Bonds1 601 000 Energy Future Intermediate Hldg. Co. LLC (Defaulted) 144A
FRN 01/12/2018 USD 1 127 559 1 417 508 0.92892 000 GenOn Energy, Inc. 9.500% 15/10/2018 USD 625 485 627 051 0.41260 000 GenOn Energy, Inc. 9.875% 15/10/2020 USD 162 929 172 362 0.11
47 000 Lehman Brothers Hldg., Inc. (Defaulted) FRN 09/11/2009 EUR 416 4 183 0.00750 000 Lehman Brothers Hldg., Inc. (Defaulted) FRN 10/05/2012 EUR 0 66 750 0.04200 000 Lehman Brothers Hldg., Inc. (Defaulted) FRN 17/10/2012 EUR 0 17 680 0.01
7 479 000 Lehman Brothers Hldg., Inc. Escrow FRN 24/01/2013 USD 429 414 502 460 0.3313 350 000 Lehman Brothers Hldg., Inc. Escrow FRN 26/09/2014 USD 65 915 897 0.60
99 000 Lehman Brothers Hldg., Inc. Escrow FRN 30/12/2016 USD 0 6 651 0.013 836 000 Lehman Brothers Hldg., Inc. Escrow FRN 30/12/2016 USD 0 257 713 0.176 986 000 Lehman Brothers Hldg., Inc. Escrow FRN 02/05/2018 USD 985 196 477 420 0.31
13 770 000 Lehman Brothers Hldg., Inc. Escrow FRN 27/09/2027 USD 323 330 928 783 0.6012 194 000 Lehman Brothers Hldg., Inc. Escrow FRN Perpetual USD (13) 819 227 0.53
1 578 000 Lehman Brothers Hldg., Inc. Escrow FRN Perpetual USD 36 891 106 716 0.07758 000 Lehman Brothers Hldg., Inc. Escrow FRN Perpetual USD 5 987 50 925 0.03770 000 Lehman Brothers Hldg., Inc. Escrow FRN Perpetual USD 6 081 52 073 0.03
13 410 000 Lehman Brothers Hldg., Inc. Escrow FRN Perpetual USD 104 914 900 921 0.593 777 000 Lehman Brothers Hldg., Inc. Escrow FRN Perpetual USD 29 749 252 741 0.17
65 000 Lehman Brothers Hldg., Inc. Escrow FRN Perpetual USD 513 4 367 0.004 188 000 Lehman Brothers Hldg., Inc. Escrow FRN Perpetual USD 238 295 281 361 0.18
11 776 000 Lehman Brothers Hldg., Inc. Escrow FRN Perpetual USD 64 224 791 144 0.51Total Bonds 4 141 035 8 653 933 5.62
Shares53 632 Akzo Nobel NV EUR 3 342 117 3 233 473 2.1014 365 Alere, Inc. USD 572 325 552 716 0.3614 897 Allergan Plc. USD 3 123 220 3 052 970 1.9870 180 American Capital Ltd. USD 1 008 912 1 056 010 0.69
70 AP Moeller - Maersk A/S - A DKK 85 109 87 427 0.06694 AP Moeller - Maersk A/S - B DKK 897 233 905 917 0.59
2 148 Aritzia, Inc. CAD 23 154 23 270 0.022 950 Biogen, Inc. USD 802 888 821 711 0.53
17 869 Cabela’s, Inc. USD 822 600 873 415 0.5718 993 Callidus Software, Inc. USD 317 679 310 128 0.2013 680 CBS Corp. - B USD 666 188 666 349 0.4330 639 Coca-Cola European Partners Plc. USD 1 050 060 1 087 824 0.7154 485 Comcast Corp. - A USD 2 912 059 3 216 351 2.09
8 844 Cornerstone OnDemand, Inc. USD 346 460 361 614 0.23181 225 Coty, Inc. - A USD 3 809 457 3 789 631 2.46
39 634 Dycom Industries, Inc. USD 1 319 347 2 884 204 1.878 031 Edgewell Personal Care Co. USD 551 907 568 273 0.37
22 369 EME Reorganization Trust USD 2 543 92 0.0014 408 FireEye, Inc. USD 210 422 188 850 0.1215 147 Fleetmatics Group Plc. USD 807 274 808 433 0.53
Merrill Lynch Investment Solutions – York Event-Driven UCITS Fund
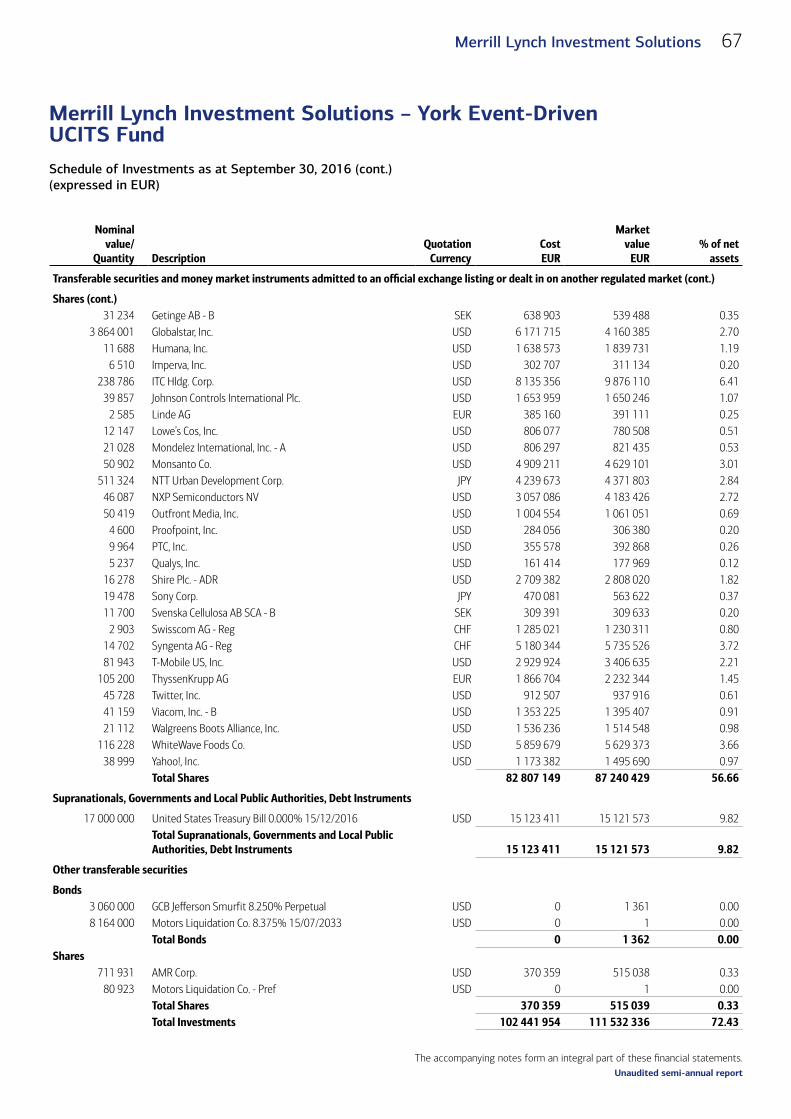
The accompanying notes form an integral part of these financial statements.
Schedule of Investments as at September 30, 2016 (cont.)(expressed in EUR)
Merrill Lynch Investment Solutions – York Event-Driven UCITS Fund
67Merrill Lynch Investment Solutions
Unaudited semi-annual report
Nominal value/
Quantity DescriptionQuotation
CurrencyCost EUR
Market value
EUR% of net
assets
Transferable securities and money market instruments admitted to an official exchange listing or dealt in on another regulated market (cont.)
Shares (cont.)31 234 Getinge AB - B SEK 638 903 539 488 0.35
3 864 001 Globalstar, Inc. USD 6 171 715 4 160 385 2.7011 688 Humana, Inc. USD 1 638 573 1 839 731 1.19
6 510 Imperva, Inc. USD 302 707 311 134 0.20238 786 ITC Hldg. Corp. USD 8 135 356 9 876 110 6.41
39 857 Johnson Controls International Plc. USD 1 653 959 1 650 246 1.072 585 Linde AG EUR 385 160 391 111 0.25
12 147 Lowe’s Cos, Inc. USD 806 077 780 508 0.5121 028 Mondelez International, Inc. - A USD 806 297 821 435 0.5350 902 Monsanto Co. USD 4 909 211 4 629 101 3.01
511 324 NTT Urban Development Corp. JPY 4 239 673 4 371 803 2.8446 087 NXP Semiconductors NV USD 3 057 086 4 183 426 2.7250 419 Outfront Media, Inc. USD 1 004 554 1 061 051 0.69
4 600 Proofpoint, Inc. USD 284 056 306 380 0.209 964 PTC, Inc. USD 355 578 392 868 0.265 237 Qualys, Inc. USD 161 414 177 969 0.12
16 278 Shire Plc. - ADR USD 2 709 382 2 808 020 1.8219 478 Sony Corp. JPY 470 081 563 622 0.3711 700 Svenska Cellulosa AB SCA - B SEK 309 391 309 633 0.20
2 903 Swisscom AG - Reg CHF 1 285 021 1 230 311 0.8014 702 Syngenta AG - Reg CHF 5 180 344 5 735 526 3.7281 943 T-Mobile US, Inc. USD 2 929 924 3 406 635 2.21
105 200 ThyssenKrupp AG EUR 1 866 704 2 232 344 1.4545 728 Twitter, Inc. USD 912 507 937 916 0.6141 159 Viacom, Inc. - B USD 1 353 225 1 395 407 0.9121 112 Walgreens Boots Alliance, Inc. USD 1 536 236 1 514 548 0.98
116 228 WhiteWave Foods Co. USD 5 859 679 5 629 373 3.6638 999 Yahoo!, Inc. USD 1 173 382 1 495 690 0.97
Total Shares 82 807 149 87 240 429 56.66
Supranationals, Governments and Local Public Authorities, Debt Instruments
17 000 000 United States Treasury Bill 0.000% 15/12/2016 USD 15 123 411 15 121 573 9.82Total Supranationals, Governments and Local Public Authorities, Debt Instruments 15 123 411 15 121 573 9.82
Other transferable securities
Bonds3 060 000 GCB Jefferson Smurfit 8.250% Perpetual USD 0 1 361 0.008 164 000 Motors Liquidation Co. 8.375% 15/07/2033 USD 0 1 0.00
Total Bonds 0 1 362 0.00Shares
711 931 AMR Corp. USD 370 359 515 038 0.3380 923 Motors Liquidation Co. - Pref USD 0 1 0.00
Total Shares 370 359 515 039 0.33Total Investments 102 441 954 111 532 336 72.43

The accompanying notes form an integral part of these financial statements.
Schedule of Investments as at September 30, 2016 (cont.)(expressed in EUR)
Merrill Lynch Investment Solutions – York Event-Driven UCITS Fund
68 Merrill Lynch Investment Solutions
Unaudited semi-annual report
Industrial classification of investments(as a percentage of net assets as at September 30, 2016) %Sovereign 9.82 Chemicals 9.08 Electric 7.85 Telecommunications 5.71 Food 4.19 Diversified Finan Serv 4.18 Pharmaceuticals 3.80 Media 3.43 Cosmetics/Personal Care 3.03 Real Estate 2.84 Semiconductors 2.72 Retail 2.06 Engineering & Construction 1.87 Internet 1.70 Iron/Steel 1.45 Healthcare-Services 1.19 Software 1.09 Electronics 1.07 Beverages 0.71 Healthcare-Products 0.71 Investment Companies 0.69 REITS 0.69 Computers 0.65 Transportation 0.65 Biotechnology 0.53 Home Furnishings 0.37 Airlines 0.33 Apparel 0.02
72.43
Geographical classification of investments(as a percentage of net assets as at September 30, 2016) %United States 55.72Netherlands 4.82Switzerland 4.52Japan 3.21Germany 1.7Britain 0.71Denmark 0.65Sweden 0.55Ireland 0.53Canada 0.02
72.43
Underlying nature
Currency contract
Details
Market
Maturity date
Number of contracts
bought
Number of contracts
soldCommitment
EUR
Unrealised appreciation/
(depreciation) EUR
Futures contractsIndex EUR Euro Stoxx 50 Index Eurex Deutschland 16/12/2016 – 128 3 832 320 (37 610)Index USD S&P 500 E-Mini Index Chicago Mercantile
Exchange 16/12/2016 – 258 24 799 038 (509 419)Index JPY Topix Index Osaka Exchange 08/12/2016 – 13 1 511 314 23 418Total Futures contracts 30 142 672 (523 611)
Purchase
Sale Maturity date Counterparty
Unrealised appreciation/
(depreciation) EURForward foreign exchange contractsAUD 233 520 EUR 156 645 21/12/2016 State Street Bank and Trust Co. 1 509

The accompanying notes form an integral part of these financial statements.
Schedule of Investments as at September 30, 2016 (cont.)(expressed in EUR)
Merrill Lynch Investment Solutions – York Event-Driven UCITS Fund
69Merrill Lynch Investment Solutions
Unaudited semi-annual report
Purchase
Sale Maturity date Counterparty
Unrealised appreciation/
(depreciation) EURCHF 10 889 372 EUR 9 958 457 21/12/2016 State Street Bank and Trust Co. 47 503EUR 4 420 924 CAD 6 570 000 21/12/2016 State Street Bank and Trust Co. (13 432)EUR 1 534 628 CHF 1 676 054 21/12/2016 State Street Bank and Trust Co. (5 454)EUR 3 923 843 GBP 3 349 075 21/12/2016 State Street Bank and Trust Co. 60 685EUR 6 591 730 JPY 760 000 000 21/12/2016 State Street Bank and Trust Co. (84 726)EUR 545 471 SEK 5 200 000 21/12/2016 State Street Bank and Trust Co. 5 254EUR 126 988 584 USD 142 418 827 21/12/2016 State Street Bank and Trust Co. 729 944GBP 7 675 809 EUR 9 057 661 21/12/2016 State Street Bank and Trust Co. (203 617)USD 119 394 779 EUR 106 116 817 21/12/2016 State Street Bank and Trust Co. (269 699)Total forward foreign exchange contracts 267 967
Short/Long
Currency Description
Put/Call
Strike Price
Maturity date Quantity
Market value
EURCommitment
EUROptionsLong USD Apple, Inc. Call 100.000 20/01/2017 539 685 860 –Long USD Dish Network Corp. Call 50.000 20/01/2017 981 672 157 –Short USD Monsanto Co. Call 115.000 21/10/2016 (44) (157) 450 258*Short USD Monsanto Co. Call 115.000 20/01/2017 (7) (268) 71 632*Long USD S&P 500 Index Put 2 150.000 21/10/2016 18 27 870 –Long USD S&P 500 Index Put 2 125.000 21/10/2016 18 19 221 –Total Options 1 404 683 521 890
* The commitment on short call positions is unlimited.
Merrill Lynch Professional Clearing is the counterparty to these options.
The maximum individual counterparty exposure for OTC Derivatives as at September 30, 2016 is 1.75% of the NAV.
Contracts for difference swaps
The Sub-Fund Merrill Lynch Investment Solutions - York Event-Driven UCITS Fund entered into contracts for difference swaps with six counterparties (Bank of America N.A., Deutsche Bank AG, Goldman Sachs International, JPMorgan Chase Bank NA, Morgan Stanley Capital Services Inc. and UBS AG.) with the following details:
1) Bank of America N.A.
Commitment of EUR 1 251 370 for the short portfolio composed of 2 equities
Market value of EUR 141 715 detailed as follows:– unrealised appreciation of short portfolio: EUR 143 721– realised result: EUR (2 006) corresponding to the realised loss on securities which is still held at the counterparty (monthly reset)
The below table is composed of short positions:

The accompanying notes form an integral part of these financial statements.
Schedule of Investments as at September 30, 2016 (cont.)(expressed in EUR)
Merrill Lynch Investment Solutions – York Event-Driven UCITS Fund
70 Merrill Lynch Investment Solutions
Unaudited semi-annual report
Industrial sector Underlying nature Long/ShortCommitment
EUR
Unrealised appreciation/
(depreciation)EUR
Real Estate Equity Short 1 251 370 143 721Total 1 251 370 143 721
2) Deutsche Bank AG
Commitment of EUR 596 067 for the short portfolio composed of 1 derivative
Market value of EUR 53 847 detailed as follows:– unrealised appreciation of short portfolio: EUR 54 079– realised result: EUR (232) corresponding to the realised loss on securities which is still held at the counterparty (monthly reset)
The below table is composed of short positions:
Industrial sector Underlying nature Long/ShortCommitment
EUR
Unrealised appreciation/
(depreciation)EUR
Swap Index - Diversified Derivatives Short 596 067 54 079Total 596 067 54 079
3) Goldman Sachs International
Commitment of EUR 786 683 for the long portfolio composed of 1 equity
Market value of EUR (8 986) detailed as follows:– unrealised depreciation of long portfolio: EUR (8 972)– realised result: EUR (14) corresponding to the realised loss on securities which is still held at the counterparty (monthly reset)
The below table is composed of long positions:
Industrial sector Underlying nature Long/ShortCommitment
EUR
Unrealised appreciation/
(depreciation)EUR
Agriculture Equity Long 786 683 (8 972)Total 786 683 (8 972)

The accompanying notes form an integral part of these financial statements.
Schedule of Investments as at September 30, 2016 (cont.)(expressed in EUR)
Merrill Lynch Investment Solutions – York Event-Driven UCITS Fund
71Merrill Lynch Investment Solutions
Unaudited semi-annual report
4) JPMorgan Chase Bank NA
Commitment of EUR 101 844 for the short portfolio composed of 1 equityCommitment of EUR 1 440 433 for the long portfolio composed of 1 equity
Market value of EUR 309 390 detailed as follows:– unrealised depreciation of short portfolio: EUR (3 058)– unrealised appreciation of long portfolio: EUR 301 775– realised result: EUR 10 673 corresponding to the realised gain on securities which is still held at the counterparty (monthly reset)
The below table is composed of long and short positions:
Industrial sector Underlying nature Long/ShortCommitment
EUR
Unrealised appreciation/
(depreciation)EUR
Insurance Equity Long 1 440 433 301 775Real Estate Equity Short 101 844 (3 058)Total 1 542 277 298 717
5) Morgan Stanley Capital Services Inc.
Commitment of EUR 20 421 216 for the short portfolio composed of 2 derivatives and 12 equitiesCommitment of EUR 42 225 757 for the long portfolio composed of 9 equities
Market value of EUR 2 697 102 detailed as follows:– unrealised depreciation of short portfolio: EUR (323 413)– unrealised appreciation of long portfolio: EUR 3 239 775– realised result: EUR (219 260) corresponding to the realised loss on securities which is still held at the counterparty (monthly reset)
The below table is composed of long and short positions:
Industrial sector Underlying nature Long/ShortCommitment
EUR
Unrealised appreciation/
(depreciation)EUR
Swap Index - Diversified Derivatives Short 9 728 634 443 762Banks Equity Short 1 010 091 1 840Beverages Equity Long 15 188 841 1 856 531Chemicals Equity Long 5 517 149 432 690Computers Equity Long 1 795 243 794 282Distribution/Wholesale Equity Short 870 710 (5 325)Electric Equity Short 5 129 457 (710 852)Engineering&Construction Equity Long 925 478 37 250Healthcare-Products Equity Long 3 105 728 47 166Healthcare-Products Equity Short 1 433 939 (60 804)Home Builders Equity Short 75 263 (4 032)Internet Equity Long 8 420 130 (59 917)Investment Companies Equity Short 467 524 (20 934)

The accompanying notes form an integral part of these financial statements.
Schedule of Investments as at September 30, 2016 (cont.)(expressed in EUR)
Merrill Lynch Investment Solutions – York Event-Driven UCITS Fund
72 Merrill Lynch Investment Solutions
Unaudited semi-annual report
Industrial sector Underlying nature Long/ShortCommitment
EUR
Unrealised appreciation/
(depreciation)EUR
Machinery-Diversified Equity Short 693 059 (19 888)Media Equity Long 3 909 521 (518 832)Media Equity Short 374 143 54 988REITS Equity Short 264 483 (503)Retail Equity Short 153 821 (2 250)Semiconductors Equity Long 2 973 429 706 092Telecommunications Equity Long 390 238 (55 487)Telecommunications Equity Short 220 092 585Total 62 646 973 2 916 362
6) UBS AG
Commitment of EUR 821 233 for the long portfolio composed of 2 equities
Market value of EUR (1 337 253) detailed as follows:– unrealised depreciation of long portfolio: EUR (1 332 640)– realised result: EUR (4 613) corresponding to the realised loss on securities which is still held at the counterparty (monthly reset)
The below table is composed of long positions:
Industrial sector Underlying nature Long/ShortCommitment
EUR
Unrealised appreciation/
(depreciation)EUR
Aerospace/Defense Equity Long 590 427 17 666Oil&Gas Equity Long 230 806 (1 350 306)Total 821 233 (1 332 640)
The total market value of the contracts for difference swaps is EUR 1 855 808.
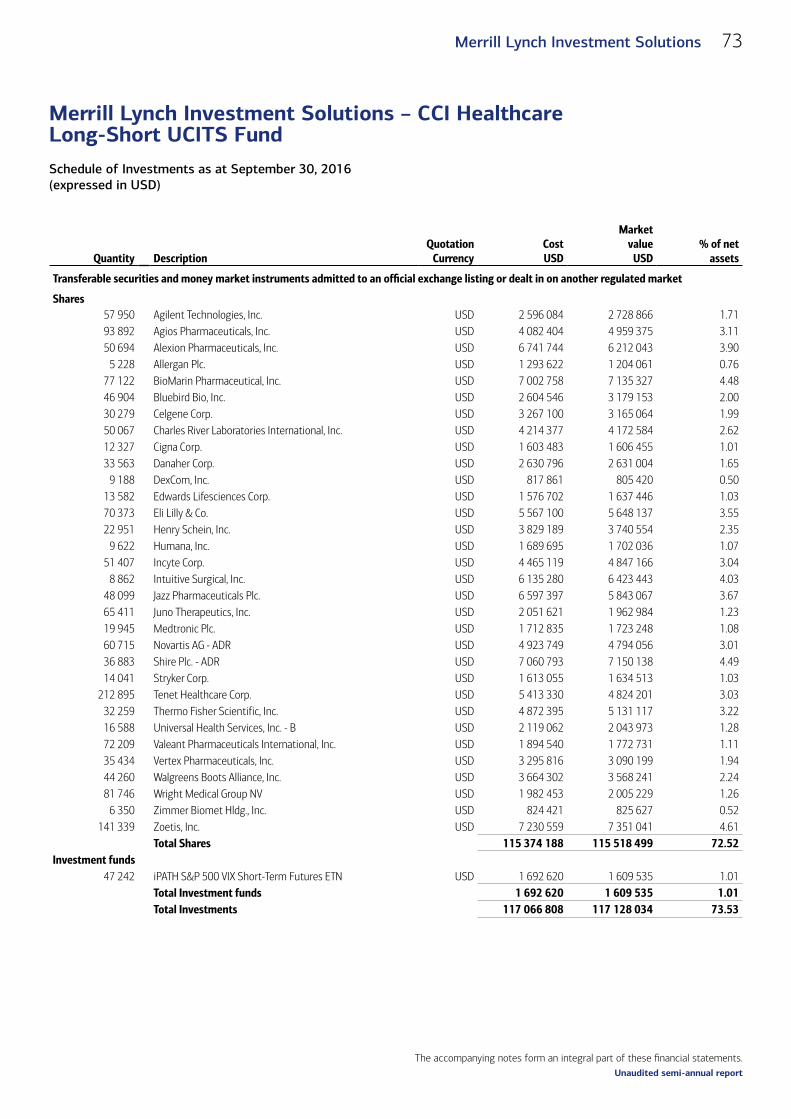
The accompanying notes form an integral part of these financial statements.
Schedule of Investments as at September 30, 2016 (expressed in USD)
Merrill Lynch Investment Solutions – CCI Healthcare Long-Short UCITS Fund
73Merrill Lynch Investment Solutions
Unaudited semi-annual report
Schedule of Investments as at September 30, 2016 (expressed in USD)
Quantity DescriptionQuotation
CurrencyCost USD
Market value
USD% of net
assets
Transferable securities and money market instruments admitted to an official exchange listing or dealt in on another regulated market (cont.)
Shares (cont.)57 950 Agilent Technologies, Inc. USD 2 596 084 2 728 866 1.7193 892 Agios Pharmaceuticals, Inc. USD 4 082 404 4 959 375 3.1150 694 Alexion Pharmaceuticals, Inc. USD 6 741 744 6 212 043 3.90
5 228 Allergan Plc. USD 1 293 622 1 204 061 0.7677 122 BioMarin Pharmaceutical, Inc. USD 7 002 758 7 135 327 4.4846 904 Bluebird Bio, Inc. USD 2 604 546 3 179 153 2.0030 279 Celgene Corp. USD 3 267 100 3 165 064 1.9950 067 Charles River Laboratories International, Inc. USD 4 214 377 4 172 584 2.6212 327 Cigna Corp. USD 1 603 483 1 606 455 1.0133 563 Danaher Corp. USD 2 630 796 2 631 004 1.65
9 188 DexCom, Inc. USD 817 861 805 420 0.5013 582 Edwards Lifesciences Corp. USD 1 576 702 1 637 446 1.0370 373 Eli Lilly & Co. USD 5 567 100 5 648 137 3.5522 951 Henry Schein, Inc. USD 3 829 189 3 740 554 2.35
9 622 Humana, Inc. USD 1 689 695 1 702 036 1.0751 407 Incyte Corp. USD 4 465 119 4 847 166 3.04
8 862 Intuitive Surgical, Inc. USD 6 135 280 6 423 443 4.0348 099 Jazz Pharmaceuticals Plc. USD 6 597 397 5 843 067 3.6765 411 Juno Therapeutics, Inc. USD 2 051 621 1 962 984 1.2319 945 Medtronic Plc. USD 1 712 835 1 723 248 1.0860 715 Novartis AG - ADR USD 4 923 749 4 794 056 3.0136 883 Shire Plc. - ADR USD 7 060 793 7 150 138 4.4914 041 Stryker Corp. USD 1 613 055 1 634 513 1.03
212 895 Tenet Healthcare Corp. USD 5 413 330 4 824 201 3.0332 259 Thermo Fisher Scientific, Inc. USD 4 872 395 5 131 117 3.2216 588 Universal Health Services, Inc. - B USD 2 119 062 2 043 973 1.2872 209 Valeant Pharmaceuticals International, Inc. USD 1 894 540 1 772 731 1.1135 434 Vertex Pharmaceuticals, Inc. USD 3 295 816 3 090 199 1.9444 260 Walgreens Boots Alliance, Inc. USD 3 664 302 3 568 241 2.2481 746 Wright Medical Group NV USD 1 982 453 2 005 229 1.26
6 350 Zimmer Biomet Hldg., Inc. USD 824 421 825 627 0.52141 339 Zoetis, Inc. USD 7 230 559 7 351 041 4.61
Total Shares 115 374 188 115 518 499 72.52Investment funds
47 242 iPATH S&P 500 VIX Short-Term Futures ETN USD 1 692 620 1 609 535 1.01Total Investment funds 1 692 620 1 609 535 1.01Total Investments 117 066 808 117 128 034 73.53
Merrill Lynch Investment Solutions – CCI Healthcare Long-Short UCITS Fund
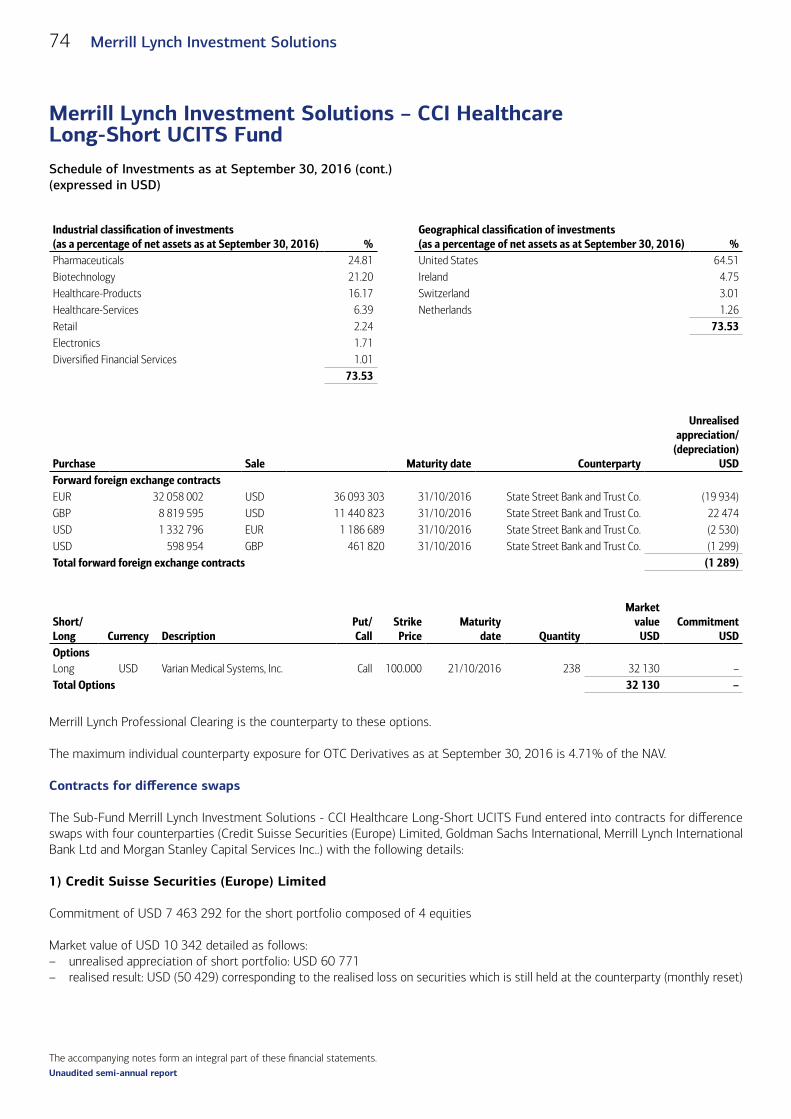
The accompanying notes form an integral part of these financial statements.
Schedule of Investments as at September 30, 2016 (cont.)(expressed in USD)
Merrill Lynch Investment Solutions – CCI Healthcare Long-Short UCITS Fund
74 Merrill Lynch Investment Solutions
Unaudited semi-annual report
Industrial classification of investments(as a percentage of net assets as at September 30, 2016) %
Geographical classification of investments(as a percentage of net assets as at September 30, 2016) %
Pharmaceuticals 24.81 United States 64.51Biotechnology 21.20 Ireland 4.75Healthcare-Products 16.17 Switzerland 3.01 Healthcare-Services 6.39 Netherlands 1.26Retail 2.24 73.53Electronics 1.71Diversified Financial Services 1.01
73.53
Purchase
Sale Maturity date Counterparty
Unrealised appreciation/
(depreciation)USD
Forward foreign exchange contractsEUR 32 058 002 USD 36 093 303 31/10/2016 State Street Bank and Trust Co. (19 934)GBP 8 819 595 USD 11 440 823 31/10/2016 State Street Bank and Trust Co. 22 474USD 1 332 796 EUR 1 186 689 31/10/2016 State Street Bank and Trust Co. (2 530)USD 598 954 GBP 461 820 31/10/2016 State Street Bank and Trust Co. (1 299)Total forward foreign exchange contracts (1 289)
Short/Long
Currency Description
Put/Call
Strike Price
Maturity date Quantity
Market value
USDCommitment
USDOptionsLong USD Varian Medical Systems, Inc. Call 100.000 21/10/2016 238 32 130 –Total Options 32 130 –
Merrill Lynch Professional Clearing is the counterparty to these options.
The maximum individual counterparty exposure for OTC Derivatives as at September 30, 2016 is 4.71% of the NAV.
Contracts for difference swaps
The Sub-Fund Merrill Lynch Investment Solutions - CCI Healthcare Long-Short UCITS Fund entered into contracts for difference swaps with four counterparties (Credit Suisse Securities (Europe) Limited, Goldman Sachs International, Merrill Lynch International Bank Ltd and Morgan Stanley Capital Services Inc..) with the following details:
1) Credit Suisse Securities (Europe) Limited
Commitment of USD 7 463 292 for the short portfolio composed of 4 equities
Market value of USD 10 342 detailed as follows:– unrealised appreciation of short portfolio: USD 60 771– realised result: USD (50 429) corresponding to the realised loss on securities which is still held at the counterparty (monthly reset)
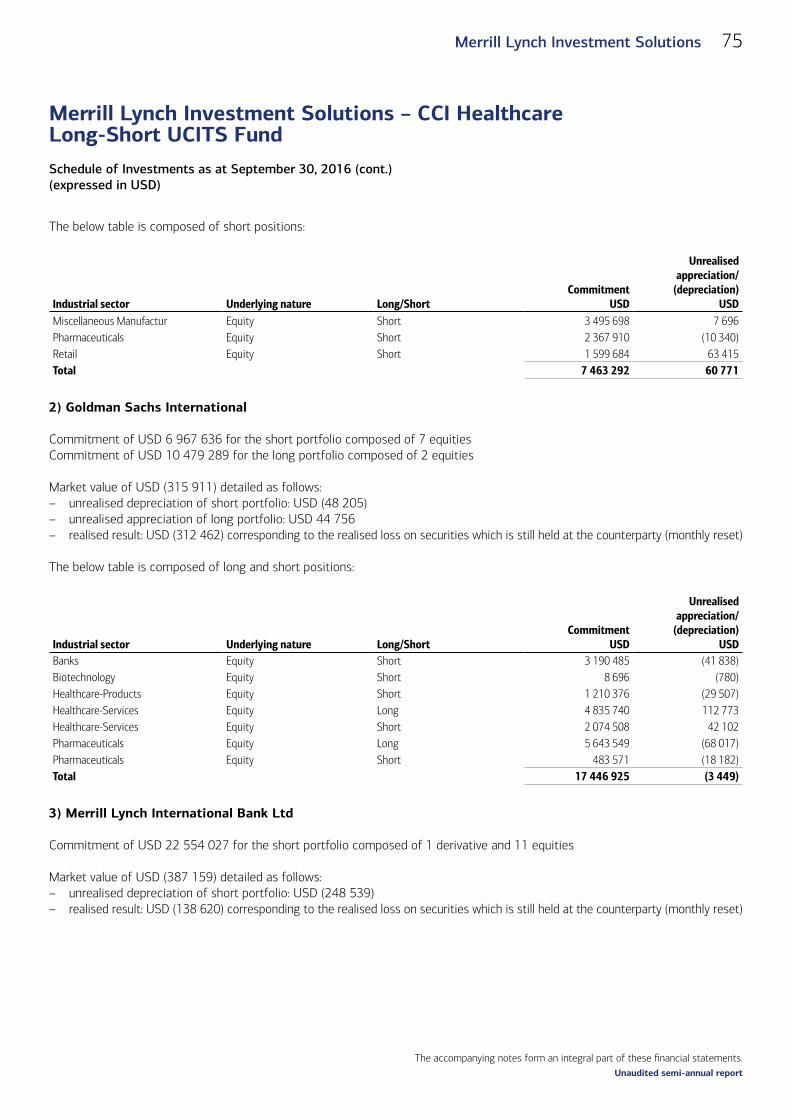
The accompanying notes form an integral part of these financial statements.
Schedule of Investments as at September 30, 2016 (cont.)(expressed in USD)
Merrill Lynch Investment Solutions – CCI Healthcare Long-Short UCITS Fund
75Merrill Lynch Investment Solutions
Unaudited semi-annual report
The below table is composed of short positions:
Industrial sector Underlying nature Long/ShortCommitment
USD
Unrealised appreciation/
(depreciation)USD
Miscellaneous Manufactur Equity Short 3 495 698 7 696Pharmaceuticals Equity Short 2 367 910 (10 340)Retail Equity Short 1 599 684 63 415Total 7 463 292 60 771
2) Goldman Sachs International
Commitment of USD 6 967 636 for the short portfolio composed of 7 equitiesCommitment of USD 10 479 289 for the long portfolio composed of 2 equities
Market value of USD (315 911) detailed as follows:– unrealised depreciation of short portfolio: USD (48 205)– unrealised appreciation of long portfolio: USD 44 756– realised result: USD (312 462) corresponding to the realised loss on securities which is still held at the counterparty (monthly reset)
The below table is composed of long and short positions:
Industrial sector Underlying nature Long/ShortCommitment
USD
Unrealised appreciation/
(depreciation)USD
Banks Equity Short 3 190 485 (41 838)Biotechnology Equity Short 8 696 (780)Healthcare-Products Equity Short 1 210 376 (29 507)Healthcare-Services Equity Long 4 835 740 112 773Healthcare-Services Equity Short 2 074 508 42 102Pharmaceuticals Equity Long 5 643 549 (68 017)Pharmaceuticals Equity Short 483 571 (18 182)Total 17 446 925 (3 449)
3) Merrill Lynch International Bank Ltd
Commitment of USD 22 554 027 for the short portfolio composed of 1 derivative and 11 equities
Market value of USD (387 159) detailed as follows:– unrealised depreciation of short portfolio: USD (248 539)– realised result: USD (138 620) corresponding to the realised loss on securities which is still held at the counterparty (monthly reset)

The accompanying notes form an integral part of these financial statements.
Schedule of Investments as at September 30, 2016 (cont.)(expressed in USD)
Merrill Lynch Investment Solutions – CCI Healthcare Long-Short UCITS Fund
76 Merrill Lynch Investment Solutions
Unaudited semi-annual report
The below table is composed of short positions:
Industrial sector Underlying nature Long/ShortCommitment
USD
Unrealised appreciation/
(depreciation)USD
Swap Index - Diversified Derivatives Short 3 978 775 (28 956)Biotechnology Equity Short 5 016 741 (91 284)Diversified Financial Services Equity Short 3 262 749 (23 415)Electronics Equity Short 1 637 963 (89 733)Healthcare-Products Equity Short 3 820 165 (85 680)Healthcare-Services Equity Short 1 626 591 (8 082)Pharmaceuticals Equity Short 3 211 043 78 611Total 22 554 027 (248 539)
4) Morgan Stanley Capital Services Inc.
Commitment of USD 11 668 885 for the short portfolio composed of 6 equities
Market value of USD 276 307 detailed as follows:– unrealised appreciation of short portfolio: USD 64 284– realised result: USD 212 023 corresponding to the realised gain on securities which is still held at the counterparty (monthly reset)
The below table is composed of short positions:
Industrial sector Underlying nature Long/ShortCommitment
USD
Unrealised appreciation/
(depreciation)USD
Biotechnology Equity Short 1 657 961 15 662Healthcare-Products Equity Short 1 230 589 (58 235)Healthcare-Services Equity Short 2 008 484 (12 926)REITS Equity Short 5 564 145 103 499Software Equity Short 1 207 706 16 284Total 11 668 885 64 284
The total market value of the contracts for difference swaps is USD (416 422).

The accompanying notes form an integral part of these financial statements.
Schedule of Investments as at September 30, 2016 (expressed in EUR)
Merrill Lynch Investment Solutions – Theorema European Equity Long-Short UCITS Fund
77Merrill Lynch Investment Solutions
Unaudited semi-annual report
Schedule of Investments as at September 30, 2016 (expressed in EUR)
Nominal value/
Quantity DescriptionQuotation
CurrencyCost EUR
Market value
EUR% of net
assets
Transferable securities and money market instruments admitted to an official exchange listing or dealt in on another regulated market
Shares80 629 Cerved Information Solutions SpA EUR 587 381 607 136 0.92
4 000 Charter Communications, Inc. - A USD 815 820 960 918 1.4617 448 Ei Towers SpA EUR 859 342 818 311 1.2432 400 ERG SpA EUR 338 524 330 804 0.5073 620 Infrastrutture Wireless Italiane SpA 144A EUR 317 113 322 308 0.49
139 000 Intesa Sanpaolo SpA EUR 384 771 274 386 0.42351 000 Iren SpA EUR 520 492 537 732 0.82
74 619 Italcementi SpA EUR 745 723 789 469 1.20207 Italia Independent Group EUR 38 479 923 0.00
18 500 Recordati SpA EUR 439 927 529 285 0.81252 124 Snam SpA EUR 1 256 787 1 244 484 1.89
1 700 240 Telecom Italia SpA - Rsp EUR 1 629 649 1 026 945 1.5649 278 Vittoria Assicurazioni SpA EUR 439 816 477 997 0.7330 200 Yahoo!, Inc. USD 1 179 711 1 158 231 1.76
Total Shares 9 553 535 9 078 929 13.80
Supranationals, Governments and Local Public Authorities, Debt Instruments
5 000 000 France Government Bond 0.250% 25/11/2016 EUR 5 008 000 5 005 890 7.6122 000 000 Italy Buoni Ordinari del Tesoro BOT 0.000% 14/10/2016 EUR 22 002 584 22 003 036 33.46
Total Supranationals, Governments and Local Public Authorities, Debt Instruments 27 010 584 27 008 926 41.07Total Investments 36 564 119 36 087 855 54.87
Industrial classification of investments(as a percentage of net assets as at September 30, 2016) %
Geographical classification of investments(as a percentage of net assets as at September 30, 2016) %
Sovereign 41.07 Italy 44.04 Telecommunications 3.29 France 7.61 Gas 1.89 United States 3.22 Internet 1.76 54.87Media 1.46 Electric 1.32 Building Materials 1.20 Commercial Services 0.92 Pharmaceuticals 0.81 Insurance 0.73 Banks 0.42 Retail 0.00
54.87
Merrill Lynch Investment Solutions – Theorema European Equity Long-Short UCITS Fund

The accompanying notes form an integral part of these financial statements.
Schedule of Investments as at September 30, 2016 (cont.)(expressed in EUR)
Merrill Lynch Investment Solutions – Theorema European Equity Long-Short UCITS Fund
78 Merrill Lynch Investment Solutions
Unaudited semi-annual report
Purchase
Sale
Maturity date Counterparty
Unrealised appreciation/
(depreciation)EUR
Forward foreign exchange contractsEUR 6 004 USD 6 749 31/10/2016 State Street Bank and Trust Co. 6USD 1 519 157 EUR 1 349 317 31/10/2016 State Street Bank and Trust Co. 740Total forward foreign exchange contracts 746
Short/Long
Currency Description
Put/ Call
Strike Price
Maturity date Quantity
Market value
EURCommitment
EUROptionsLong EUR Euro Stoxx 50 Index Call 3 050.000 30/09/2016 150 15 –Total Options 15 –
Merrill Lynch International Ltd. is the counterparty to this option.
The maximum individual counterparty exposure for OTC Derivatives as at September 30, 2016 is 3.21% of the NAV.
Contracts for difference swaps
The Sub-Fund Merrill Lynch Investment Solutions - Theorema European Equity Long-Short UCITS Fund entered into contracts for difference swaps with one counterparty (Merrill Lynch International Bank Ltd.) with the following details:
1) Merrill Lynch International Bank Ltd
Commitment of EUR 24 208 441 for the short portfolio composed of 64 equities and 2 derivativesCommitment of EUR 34 514 612 for the long portfolio composed of 51 equities
Market value of EUR 1 628 386 detailed as follows:– unrealised depreciation of short portfolio: EUR (38 013)– unrealised appreciation of long portfolio: EUR 1 761 056– realised result: EUR (94 657) corresponding to the realised loss on securities which is still held at the counterparty (monthly reset)
The below table is composed of long and short positions:
Industrial sector Underlying nature Long/ShortCommitment
EUR
Unrealised appreciation/
(depreciation)EUR
Swap Index - Diversified Derivatives Short 329 258 (3 081)Swap Index - Industrial Derivatives Short 848 654 (70 783)Aerospace/Defense Equity Long 2 649 286 (95 875)Aerospace/Defense Equity Short 1 109 329 (28 513)Agriculture Equity Long 831 327 (18 197)Airlines Equity Long 1 840 826 (295 276)Airlines Equity Short 470 192 (10 183)Auto Manufacturers Equity Long 1 437 181 (14 666)

The accompanying notes form an integral part of these financial statements.
Schedule of Investments as at September 30, 2016 (cont.)(expressed in EUR)
Merrill Lynch Investment Solutions – Theorema European Equity Long-Short UCITS Fund
79Merrill Lynch Investment Solutions
Unaudited semi-annual report
Industrial sector Underlying nature Long/ShortCommitment
EUR
Unrealised appreciation/
(depreciation)EUR
Auto Manufacturers Equity Short 1 379 959 75 914Auto Parts&Equipment Equity Short 267 986 (33 332)Banks Equity Long 621 963 (18 571)Banks Equity Short 427 015 63 155Beverages Equity Long 321 619 (3 135)Beverages Equity Short 669 834 (1 599)Chemicals Equity Long 2 171 349 274 043Chemicals Equity Short 963 966 (126 482)Commercial Services Equity Long 250 900 (4 650)Commercial Services Equity Short 131 657 (3 554)Computers Equity Long 704 714 92 045Computers Equity Short 519 906 28 364Cosmetics/Personal Care Equity Long 336 200 2 431Distribution/Wholesale Equity Short 296 436 (41 440)Diversified Financial Services Equity Long 2 450 251 72 851Electrical Compo&Equip Equity Short 289 590 4 383Electric Equity Long 508 932 4 723Electronics Equity Long 167 646 39 869Engineering&Construction Equity Long 2 283 964 420 288Engineering&Construction Equity Short 623 846 (64 217)Food Equity Long 1 962 621 76 690Food Equity Short 2 457 310 (94 261)Gas Equity Short 846 072 (20 965)Hand/Machine Tools Equity Long 1 042 010 64 315Healthcare-Products Equity Short 713 161 9 660Healthcare-Services Equity Long 667 408 1 966Healthcare-Services Equity Short 257 668 9 989Home Builders Equity Long 756 726 (162 784)Household Products/Wares Equity Long 707 247 (20 921)Insurance Equity Long 3 469 158 281 171Insurance Equity Short 1 251 706 2 996Internet Equity Long 3 030 217 607 697Internet Equity Short 1 052 823 57 094Lodging Equity Long 653 146 30 713Machinery-Constr&Mining Equity Long 197 938 12 963Machinery-Constr&Mining Equity Short 352 770 (53 691)Media Equity Long 1 171 516 3 185Media Equity Short 369 250 (1 753)Miscellaneous Manufactur Equity Short 779 245 (48 262)Oil&Gas Services Equity Short 414 508 (100 654)Oil&Gas Equity Short 386 386 (29 031)Pharmaceuticals Equity Short 534 560 112 812Real Estate Equity Long 671 689 (5 371)REITS Equity Long 368 876 (10 221)

The accompanying notes form an integral part of these financial statements.
Schedule of Investments as at September 30, 2016 (cont.)(expressed in EUR)
Merrill Lynch Investment Solutions – Theorema European Equity Long-Short UCITS Fund
80 Merrill Lynch Investment Solutions
Unaudited semi-annual report
Industrial sector Underlying nature Long/ShortCommitment
EUR
Unrealised appreciation/
(depreciation)EUR
REITS Equity Short 719 686 676Retail Equity Long 641 752 10 693Retail Equity Short 1 833 567 50 829Semiconductors Equity Long 1 254 150 164 427Semiconductors Equity Short 522 575 (41 577)Software Equity Long 1 344 000 250 654Software Equity Short 66 268 (4 337)Telecommunications Equity Short 2 987 660 328 973Transportation Equity Short 5 658 (63)Water Equity Short 329 940 (5 079)Total 58 723 053 1 723 045
The total market value of the contracts for difference swaps is EUR 1 628 390.
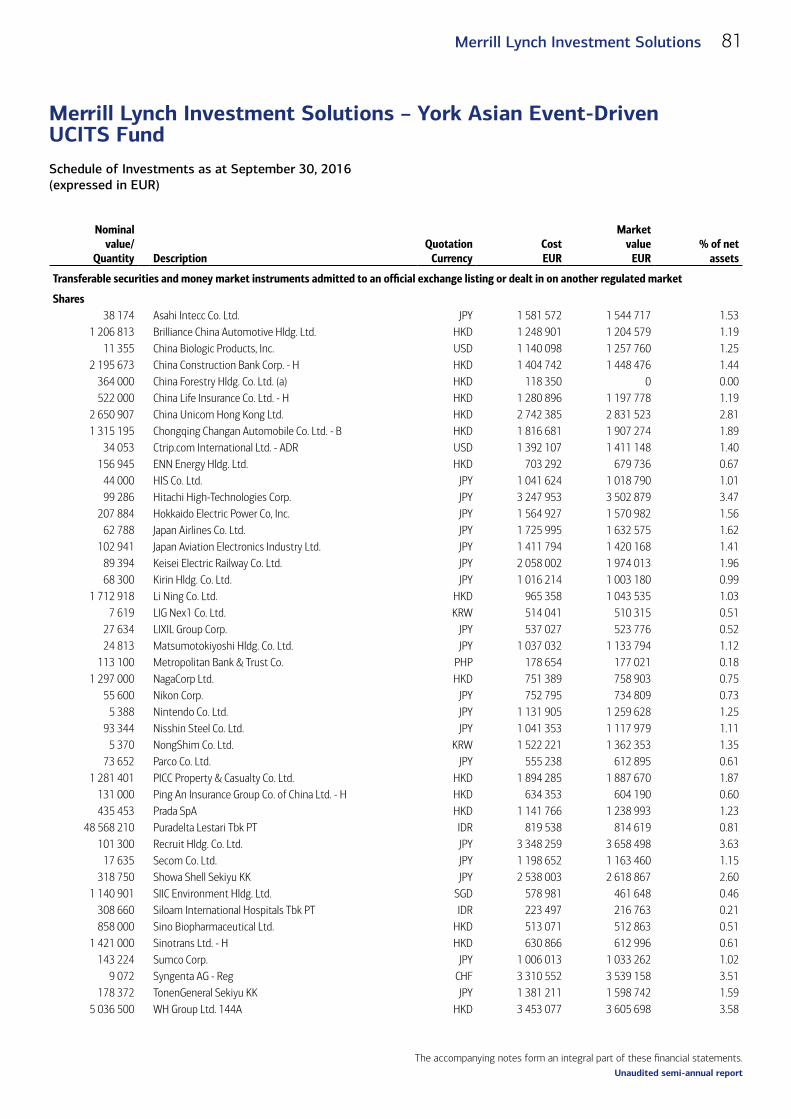
The accompanying notes form an integral part of these financial statements.
Schedule of Investments as at September 30, 2016 (expressed in EUR)
Merrill Lynch Investment Solutions – York Asian Event-Driven UCITS Fund
81Merrill Lynch Investment Solutions
Unaudited semi-annual report
Schedule of Investments as at September 30, 2016 (expressed in EUR)
Nominal value/
Quantity DescriptionQuotation
CurrencyCost EUR
Market value
EUR% of net
assets
Transferable securities and money market instruments admitted to an official exchange listing or dealt in on another regulated market (cont.)
Shares (cont.)38 174 Asahi Intecc Co. Ltd. JPY 1 581 572 1 544 717 1.53
1 206 813 Brilliance China Automotive Hldg. Ltd. HKD 1 248 901 1 204 579 1.1911 355 China Biologic Products, Inc. USD 1 140 098 1 257 760 1.25
2 195 673 China Construction Bank Corp. - H HKD 1 404 742 1 448 476 1.44364 000 China Forestry Hldg. Co. Ltd. (a) HKD 118 350 0 0.00522 000 China Life Insurance Co. Ltd. - H HKD 1 280 896 1 197 778 1.19
2 650 907 China Unicom Hong Kong Ltd. HKD 2 742 385 2 831 523 2.811 315 195 Chongqing Changan Automobile Co. Ltd. - B HKD 1 816 681 1 907 274 1.89
34 053 Ctrip.com International Ltd. - ADR USD 1 392 107 1 411 148 1.40156 945 ENN Energy Hldg. Ltd. HKD 703 292 679 736 0.67
44 000 HIS Co. Ltd. JPY 1 041 624 1 018 790 1.0199 286 Hitachi High-Technologies Corp. JPY 3 247 953 3 502 879 3.47
207 884 Hokkaido Electric Power Co, Inc. JPY 1 564 927 1 570 982 1.5662 788 Japan Airlines Co. Ltd. JPY 1 725 995 1 632 575 1.62
102 941 Japan Aviation Electronics Industry Ltd. JPY 1 411 794 1 420 168 1.4189 394 Keisei Electric Railway Co. Ltd. JPY 2 058 002 1 974 013 1.9668 300 Kirin Hldg. Co. Ltd. JPY 1 016 214 1 003 180 0.99
1 712 918 Li Ning Co. Ltd. HKD 965 358 1 043 535 1.037 619 LIG Nex1 Co. Ltd. KRW 514 041 510 315 0.51
27 634 LIXIL Group Corp. JPY 537 027 523 776 0.5224 813 Matsumotokiyoshi Hldg. Co. Ltd. JPY 1 037 032 1 133 794 1.12
113 100 Metropolitan Bank & Trust Co. PHP 178 654 177 021 0.181 297 000 NagaCorp Ltd. HKD 751 389 758 903 0.75
55 600 Nikon Corp. JPY 752 795 734 809 0.735 388 Nintendo Co. Ltd. JPY 1 131 905 1 259 628 1.25
93 344 Nisshin Steel Co. Ltd. JPY 1 041 353 1 117 979 1.115 370 NongShim Co. Ltd. KRW 1 522 221 1 362 353 1.35
73 652 Parco Co. Ltd. JPY 555 238 612 895 0.611 281 401 PICC Property & Casualty Co. Ltd. HKD 1 894 285 1 887 670 1.87
131 000 Ping An Insurance Group Co. of China Ltd. - H HKD 634 353 604 190 0.60435 453 Prada SpA HKD 1 141 766 1 238 993 1.23
48 568 210 Puradelta Lestari Tbk PT IDR 819 538 814 619 0.81101 300 Recruit Hldg. Co. Ltd. JPY 3 348 259 3 658 498 3.63
17 635 Secom Co. Ltd. JPY 1 198 652 1 163 460 1.15318 750 Showa Shell Sekiyu KK JPY 2 538 003 2 618 867 2.60
1 140 901 SIIC Environment Hldg. Ltd. SGD 578 981 461 648 0.46308 660 Siloam International Hospitals Tbk PT IDR 223 497 216 763 0.21858 000 Sino Biopharmaceutical Ltd. HKD 513 071 512 863 0.51
1 421 000 Sinotrans Ltd. - H HKD 630 866 612 996 0.61143 224 Sumco Corp. JPY 1 006 013 1 033 262 1.02
9 072 Syngenta AG - Reg CHF 3 310 552 3 539 158 3.51178 372 TonenGeneral Sekiyu KK JPY 1 381 211 1 598 742 1.59
5 036 500 WH Group Ltd. 144A HKD 3 453 077 3 605 698 3.58
Merrill Lynch Investment Solutions – York Asian Event-Driven UCITS Fund
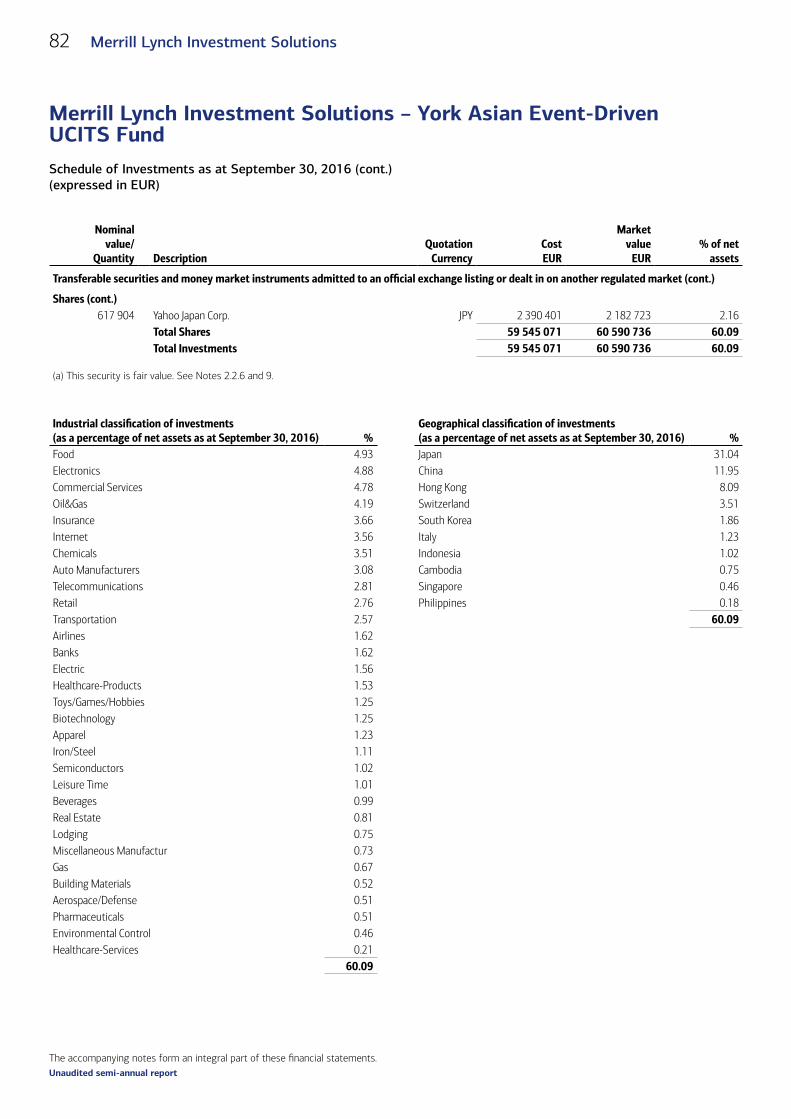
The accompanying notes form an integral part of these financial statements.
Schedule of Investments as at September 30, 2016 (cont.)(expressed in EUR)
Merrill Lynch Investment Solutions – York Asian Event-Driven UCITS Fund
82 Merrill Lynch Investment Solutions
Unaudited semi-annual report
Nominal value/
Quantity DescriptionQuotation
CurrencyCost EUR
Market value
EUR% of net
assets
Transferable securities and money market instruments admitted to an official exchange listing or dealt in on another regulated market (cont.)
Shares (cont.)617 904 Yahoo Japan Corp. JPY 2 390 401 2 182 723 2.16
Total Shares 59 545 071 60 590 736 60.09Total Investments 59 545 071 60 590 736 60.09
(a) This security is fair value. See Notes 2.2.6 and 9.
Industrial classification of investments(as a percentage of net assets as at September 30, 2016) %
Geographical classification of investments(as a percentage of net assets as at September 30, 2016) %
Food 4.93 Japan 31.04Electronics 4.88 China 11.95Commercial Services 4.78 Hong Kong 8.09Oil&Gas 4.19 Switzerland 3.51Insurance 3.66 South Korea 1.86Internet 3.56 Italy 1.23Chemicals 3.51 Indonesia 1.02Auto Manufacturers 3.08 Cambodia 0.75Telecommunications 2.81 Singapore 0.46Retail 2.76 Philippines 0.18Transportation 2.57 60.09Airlines 1.62 Banks 1.62 Electric 1.56 Healthcare-Products 1.53 Toys/Games/Hobbies 1.25 Biotechnology 1.25 Apparel 1.23 Iron/Steel 1.11 Semiconductors 1.02 Leisure Time 1.01 Beverages 0.99 Real Estate 0.81 Lodging 0.75 Miscellaneous Manufactur 0.73 Gas 0.67 Building Materials 0.52 Aerospace/Defense 0.51 Pharmaceuticals 0.51 Environmental Control 0.46 Healthcare-Services 0.21
60.09

The accompanying notes form an integral part of these financial statements.
Schedule of Investments as at September 30, 2016 (cont.)(expressed in EUR)
Merrill Lynch Investment Solutions – York Asian Event-Driven UCITS Fund
83Merrill Lynch Investment Solutions
Unaudited semi-annual report
Underlying nature
Currency contract
Details
Market
Maturity date
Number of contracts
bought
Number of contracts
soldCommitment
EUR
Unrealised appreciation/
(depreciation) EUR
Futures contractsIndex USD FTSE China Index Singapore Exchange (was SIMEX) 28/10/2016 – 397 3 379 869 52 548Index HKD H-Shares Index Hong Kong Futures Exchange 28/10/2016 – 25 1 376 757 42 846Index HKD Hang Seng Index Hong Kong Futures Exchange 28/10/2016 – 15 2 006 021 42 077Index JPY Nikkei 225 Index Osaka Exchange 08/12/2016 – 43 6 215 641 85 192Index JPY Topix Index Osaka Exchange 08/12/2016 – 51 5 929 002 (21 066)Total Futures contracts 18 907 290 201 597
Purchase
Sale
Maturity date Counterparty
Unrealised appreci-ation/(deprecia-
tion) EUR
Forward foreign exchange contractsCHF 2 433 410 EUR 2 225 349 21/12/2016 State Street Bank and Trust Co. 10 647EUR 17 982 CHF 19 667 21/12/2016 State Street Bank and Trust Co. (89)EUR 685 GBP 581 21/12/2016 State Street Bank and Trust Co. 15EUR 10 471 062 HKD 91 455 306 21/12/2016 State Street Bank and Trust Co. 9 184EUR 51 965 498 JPY 5 941 295 266 21/12/2016 State Street Bank and Trust Co. (227 658)EUR 560 882 SGD 860 000 21/12/2016 State Street Bank and Trust Co. 1 441EUR 27 928 924 USD 31 464 726 21/12/2016 State Street Bank and Trust Co. 34 484GBP 8 938 EUR 10 547 21/12/2016 State Street Bank and Trust Co. (237)JPY 510 838 600 EUR 4 500 000 21/12/2016 State Street Bank and Trust Co. (12 379)JPY 226 549 340 USD 2 250 000 21/12/2016 State Street Bank and Trust Co. (4 501)KRW 831 025 000 USD 750 000 21/12/2016 Merrill Lynch International Bank Ltd. 3 765TWD 104 197 500 USD 3 301 568 21/12/2016 Merrill Lynch International Bank Ltd. 26 384USD 1 205 468 AUD 1 599 352 21/12/2016 State Street Bank and Trust Co. (14 492)USD 26 939 548 EUR 23 951 067 21/12/2016 State Street Bank and Trust Co. (68 335)USD 8 772 156 HKD 68 000 000 21/12/2016 State Street Bank and Trust Co. (1 963)USD 450 000 JPY 46 244 655 21/12/2016 State Street Bank and Trust Co. (7 312)USD 2 174 706 KRW 2 419 825 000 21/12/2016 Merrill Lynch International Bank Ltd. (19 107)USD 3 300 000 TWD 104 197 500 21/12/2016 Merrill Lynch International Bank Ltd. (27 774)Total forward foreign exchange contracts (297 927)

The accompanying notes form an integral part of these financial statements.
Schedule of Investments as at September 30, 2016 (cont.)(expressed in EUR)
Merrill Lynch Investment Solutions – York Asian Event-Driven UCITS Fund
84 Merrill Lynch Investment Solutions
Unaudited semi-annual report
Short/Long
Currency Description
Put/ Call
Strike Price
Maturity date Quantity
Market value
EURCommitment
EUROptionsLong HKD HSCEI Call 10 000.000 28/10/2016 3 750 34 766 –Long KRW KOSPI Put 250.000 13/10/2016 34 000 000 13 769 –Long JPY Topix Index Call 1 400.000 14/10/2016 280 000 1 340 –Long JPY Topix Index Call 1 400.000 14/10/2016 670 000 3 205 –Long USD USD/CNH Call 6.550 20/10/2016 18 100 000 323 974 –Total Options 377 054 –
JP Morgan Chase Bank N.A., Merrill Lynch International Ltd., Morgan Stanley and Co. and UBS AG are the counterparties to these options.
The maximum individual counterparty exposure for OTC Derivatives as at September 30, 2016 is 5.90% of the NAV.
Contracts for difference swaps
The Sub-Fund Merrill Lynch Investment Solutions - York Asian Event-Driven UCITS Fund entered into contracts for difference swaps with eight counterparties (Bank of America N.A., Citibank NA, Credit Suisse Securities (Europe) Limited, Deutsche Bank AG, Goldman Sachs International, JPMorgan Chase Bank NA, Morgan Stanley Capital Services Inc. and UBS AG.) with the following details:
1) Bank of America N.A.
Commitment of EUR 3 870 930 for the short portfolio composed of 5 equitiesCommitment of EUR 9 112 440 for the long portfolio composed of 2 equities
Market value of EUR (100 929) detailed as follows:– unrealised appreciation of short portfolio: EUR 33 180– unrealised depreciation of long portfolio: EUR (186 575)– realised result: EUR 52 466 corresponding to the realised gain on securities which is still held at the counterparty (monthly reset)

The accompanying notes form an integral part of these financial statements.
Schedule of Investments as at September 30, 2016 (cont.)(expressed in EUR)
Merrill Lynch Investment Solutions – York Asian Event-Driven UCITS Fund
85Merrill Lynch Investment Solutions
Unaudited semi-annual report
The below table is composed of long and short positions:
Industrial sector Underlying nature Long/ShortCommitment
EUR
Unrealised appreciation/
(depreciation)EUR
Airlines Equity Short 1 653 632 21 373Auto Manufacturers Equity Short 736 330 30 144Auto Parts&Equipment Equity Long 7 098 005 (96 308)Food Equity Short 522 348 (20 457)Insurance Equity Long 2 014 435 (90 267)Real Estate Equity Short 958 620 2 120Total 12 983 370 (153 395)
2) Citibank NA
Commitment of EUR 5 554 456 for the short portfolio composed of 8 equitiesCommitment of EUR 4 969 143 for the long portfolio composed of 3 equities and 1 derivative
Market value of EUR (41 801) detailed as follows:– unrealised appreciation of short portfolio: EUR 187 053– unrealised depreciation of long portfolio: EUR (184 835)– realised result: EUR (44 019) corresponding to the realised loss on securities which is still held at the counterparty (monthly reset)
The below table is composed of long and short positions:
Industrial sector Underlying nature Long/ShortCommitment
EUR
Unrealised appreciation/
(depreciation)EUR
Swap Index - Diversified Derivatives Long 959 856 (59 367)Auto Manufacturers Equity Long 2 302 955 (84 990)Banks Equity Short 1 660 869 16 872Building Materials Equity Long 237 148 (13 556)Entertainment Equity Short 1 708 656 135 062Healthcare-Products Equity Short 137 893 5 269Home Furnishings Equity Long 1 469 184 (26 922)Insurance Equity Short 1 493 151 27 337Media Equity Short 296 657 (2 616)Real Estate Equity Short 50 877 821Telecommunications Equity Short 206 353 4 308Total 10 523 599 2 218
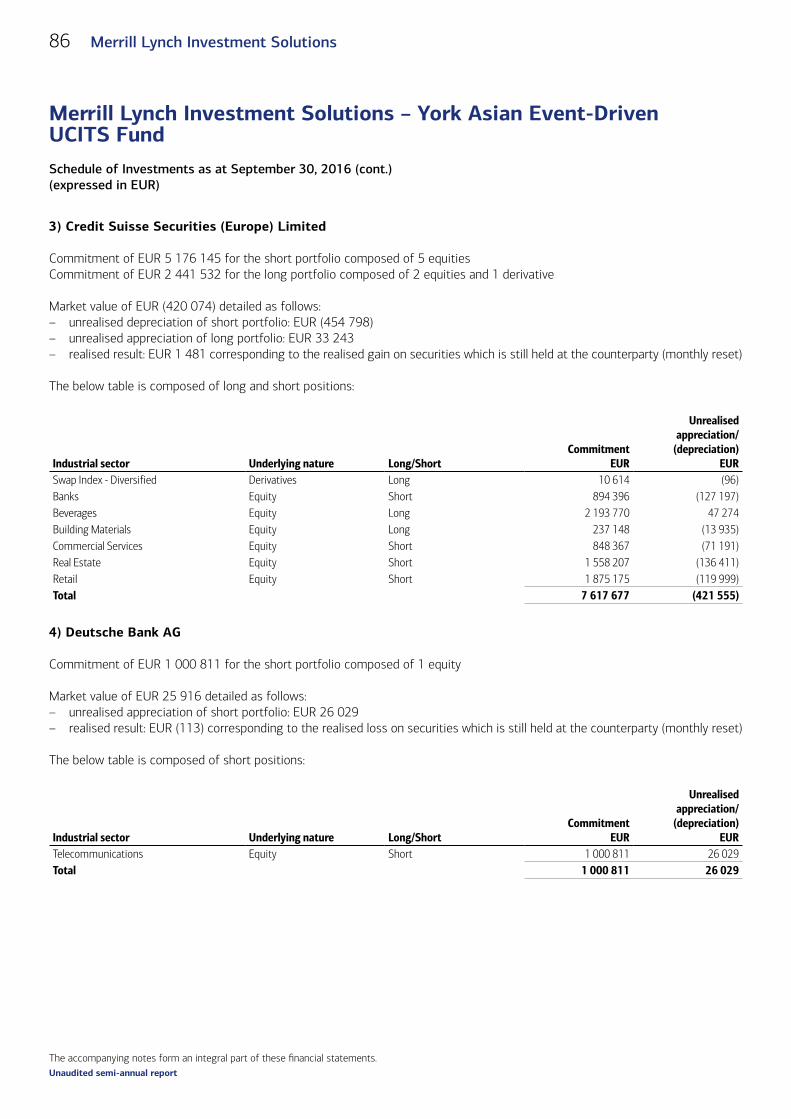
The accompanying notes form an integral part of these financial statements.
Schedule of Investments as at September 30, 2016 (cont.)(expressed in EUR)
Merrill Lynch Investment Solutions – York Asian Event-Driven UCITS Fund
86 Merrill Lynch Investment Solutions
Unaudited semi-annual report
3) Credit Suisse Securities (Europe) Limited
Commitment of EUR 5 176 145 for the short portfolio composed of 5 equitiesCommitment of EUR 2 441 532 for the long portfolio composed of 2 equities and 1 derivative
Market value of EUR (420 074) detailed as follows:– unrealised depreciation of short portfolio: EUR (454 798)– unrealised appreciation of long portfolio: EUR 33 243– realised result: EUR 1 481 corresponding to the realised gain on securities which is still held at the counterparty (monthly reset)
The below table is composed of long and short positions:
Industrial sector Underlying nature Long/ShortCommitment
EUR
Unrealised appreciation/
(depreciation)EUR
Swap Index - Diversified Derivatives Long 10 614 (96)Banks Equity Short 894 396 (127 197)Beverages Equity Long 2 193 770 47 274Building Materials Equity Long 237 148 (13 935)Commercial Services Equity Short 848 367 (71 191)Real Estate Equity Short 1 558 207 (136 411)Retail Equity Short 1 875 175 (119 999)Total 7 617 677 (421 555)
4) Deutsche Bank AG
Commitment of EUR 1 000 811 for the short portfolio composed of 1 equity
Market value of EUR 25 916 detailed as follows:– unrealised appreciation of short portfolio: EUR 26 029– realised result: EUR (113) corresponding to the realised loss on securities which is still held at the counterparty (monthly reset)
The below table is composed of short positions:
Industrial sector Underlying nature Long/ShortCommitment
EUR
Unrealised appreciation/
(depreciation)EUR
Telecommunications Equity Short 1 000 811 26 029Total 1 000 811 26 029

The accompanying notes form an integral part of these financial statements.
Schedule of Investments as at September 30, 2016 (cont.)(expressed in EUR)
Merrill Lynch Investment Solutions – York Asian Event-Driven UCITS Fund
87Merrill Lynch Investment Solutions
Unaudited semi-annual report
5) Goldman Sachs International
Commitment of EUR 4 834 196 for the short portfolio composed of 4 equitiesCommitment of EUR 3 746 867 for the long portfolio composed of 2 equities
Market value of EUR (290 285) detailed as follows:– unrealised depreciation of short portfolio: EUR (168 703)– realised result: EUR (121 582) corresponding to the realised loss on securities which is still held at the counterparty (monthly reset)
The below table is composed of long and short positions:
Industrial sector Underlying nature Long/ShortCommitment
EUR
Unrealised appreciation/
(depreciation)EUR
Aerospace/Defense Equity Short 1 541 718 (147 071)Banks Equity Short 1 524 741 (22 379)Electronics Equity Long 2 314 171 –Engineering&Construction Equity Long 1 432 696 –Oil&Gas Equity Short 1 767 737 –Total 8 581 063 (169 450)
6) JPMorgan Chase Bank NA
Commitment of EUR 6 533 767 for the short portfolio composed of 10 equities
Market value of EUR (318 981) detailed as follows:– unrealised depreciation of short portfolio: EUR (175 550)– realised result: EUR (143 431) corresponding to the realised loss on securities which is still held at the counterparty (monthly reset)
The below table is composed of short positions:
Industrial sector Underlying nature Long/ShortCommitment
EUR
Unrealised appreciation/
(depreciation)EUR
Auto Parts&Equipment Equity Short 1 025 315 (129 769)Coal Equity Short 492 525 (32 001)Electrical Compo&Equip Equity Short 592 782 87 922Electric Equity Short 1 468 999 3 305Engineering&Construction Equity Short 519 641 (4 339)Food Equity Short 514 659 (3 575)Gas Equity Short 700 187 (91 409)Real Estate Equity Short 1 219 659 (5 684)Total 6 533 767 (175 550)

The accompanying notes form an integral part of these financial statements.
Schedule of Investments as at September 30, 2016 (cont.)(expressed in EUR)
Merrill Lynch Investment Solutions – York Asian Event-Driven UCITS Fund
88 Merrill Lynch Investment Solutions
Unaudited semi-annual report
7) Morgan Stanley Capital Services Inc.
Commitment of EUR 11 468 638 for the short portfolio composed of 9 equities and 2 derivativesCommitment of EUR 10 069 432 for the long portfolio composed of 5 equities
Market value of EUR (385 127) detailed as follows:– unrealised depreciation of short portfolio: EUR (295 057)– unrealised appreciation of long portfolio: EUR 54 124– realised result: EUR (144 194) corresponding to the realised loss on securities which is still held at the counterparty (monthly reset)
The below table is composed of long and short positions:
Industrial sector Underlying nature Long/ShortCommitment
EUR
Unrealised appreciation/
(depreciation)EUR
Swap Index - Diversified Derivatives Short 1 541 126 1 365Auto Manufacturers Equity Short 757 307 (31 919)Banks Equity Short 17 778 723Beverages Equity Long 1 891 831 53 555Building Materials Equity Long 2 402 889 (41 237)Building Materials Equity Short 1 913 835 55 907Cosmetics/Personal Care Equity Short 538 376 (12 196)Electric Equity Short 970 020 (53 848)Fund - Equity Equity Short 3 666 591 (237 304)Home Furnishings Equity Long 1 422 847 (47 647)Internet Equity Short 1 001 881 1 539Real Estate Equity Long 4 351 865 89 453REITS Equity Short 1 061 724 (19 324)Total 21 538 070 (240 933)
8) UBS AG
Commitment of EUR 7 618 141 for the short portfolio composed of 11 equitiesCommitment of EUR 7 385 319 for the long portfolio composed of 4 equities
Market value of EUR 358 573 detailed as follows:– unrealised depreciation of short portfolio: EUR (103 893)– unrealised appreciation of long portfolio: EUR 582 554– realised result: EUR (120 088) corresponding to the realised loss on securities which is still held at the counterparty (monthly reset)
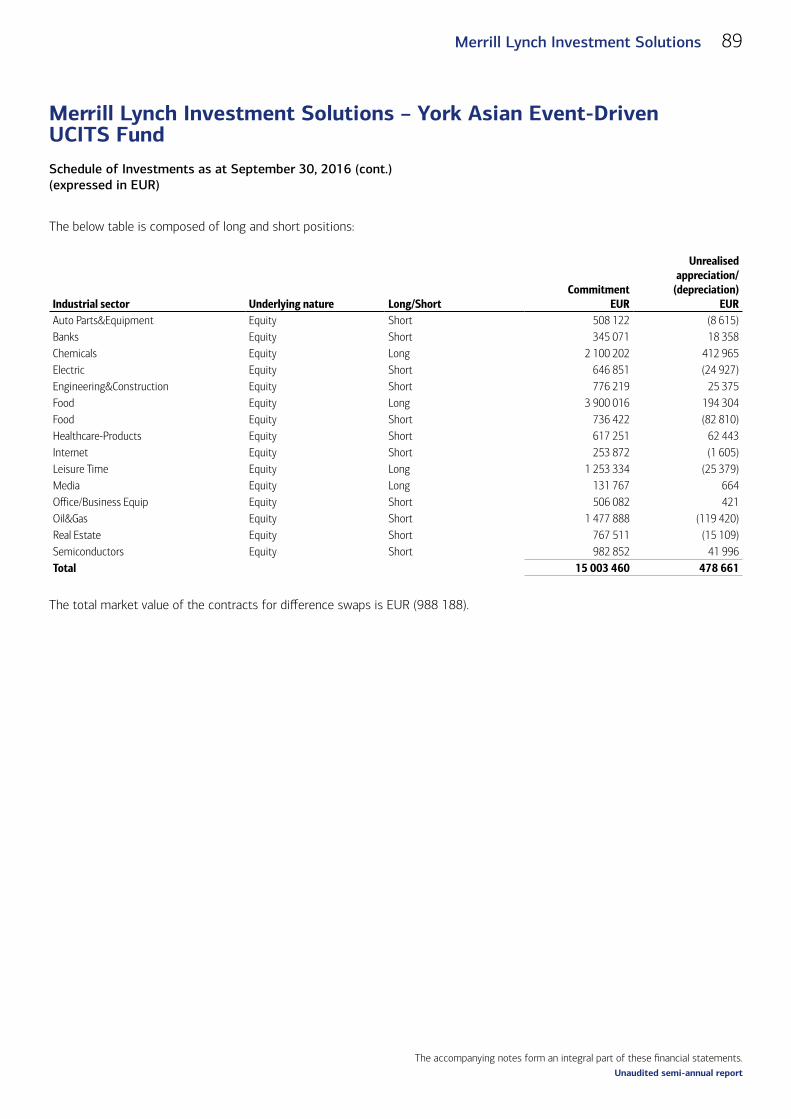
The accompanying notes form an integral part of these financial statements.
Schedule of Investments as at September 30, 2016 (cont.)(expressed in EUR)
Merrill Lynch Investment Solutions – York Asian Event-Driven UCITS Fund
89Merrill Lynch Investment Solutions
Unaudited semi-annual report
The below table is composed of long and short positions:
Industrial sector Underlying nature Long/ShortCommitment
EUR
Unrealised appreciation/
(depreciation)EUR
Auto Parts&Equipment Equity Short 508 122 (8 615)Banks Equity Short 345 071 18 358Chemicals Equity Long 2 100 202 412 965Electric Equity Short 646 851 (24 927)Engineering&Construction Equity Short 776 219 25 375Food Equity Long 3 900 016 194 304Food Equity Short 736 422 (82 810)Healthcare-Products Equity Short 617 251 62 443Internet Equity Short 253 872 (1 605)Leisure Time Equity Long 1 253 334 (25 379)Media Equity Long 131 767 664Office/Business Equip Equity Short 506 082 421Oil&Gas Equity Short 1 477 888 (119 420)Real Estate Equity Short 767 511 (15 109)Semiconductors Equity Short 982 852 41 996Total 15 003 460 478 661
The total market value of the contracts for difference swaps is EUR (988 188).
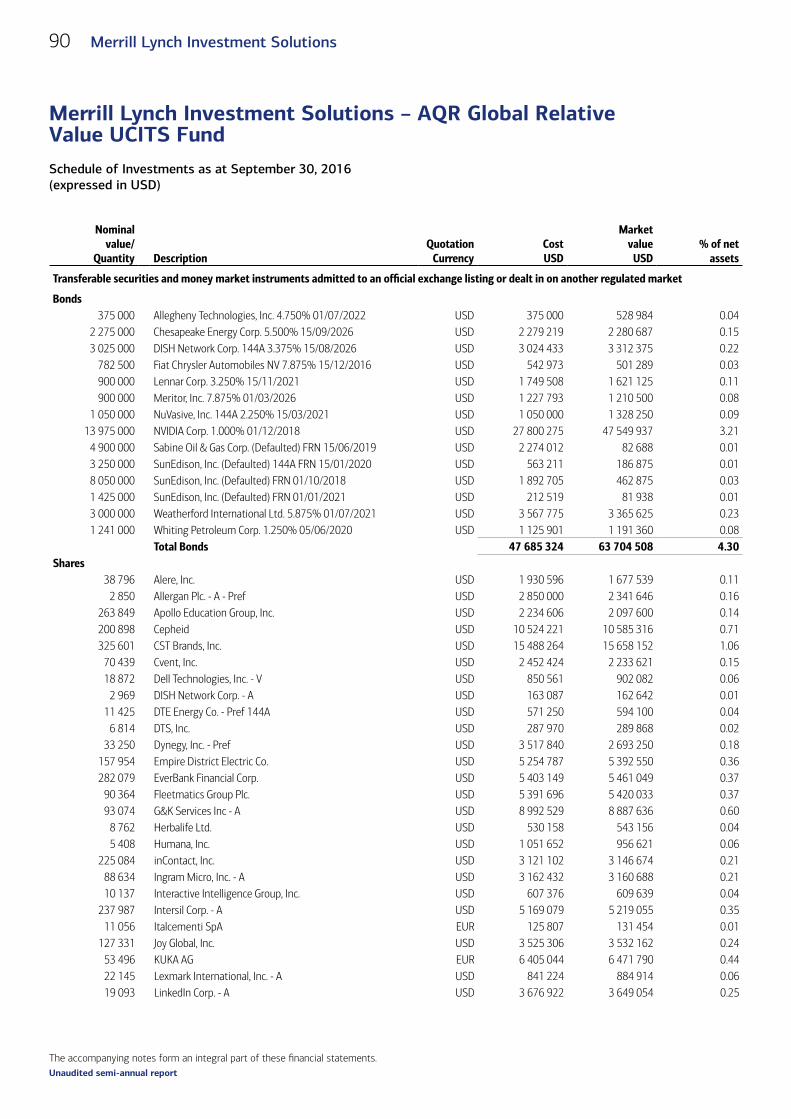
The accompanying notes form an integral part of these financial statements.
Schedule of Investments as at September 30, 2016 (expressed in USD)
Merrill Lynch Investment Solutions – AQR Global Relative Value UCITS Fund
90 Merrill Lynch Investment Solutions
Unaudited semi-annual report
Schedule of Investments as at September 30, 2016 (expressed in USD)
Nominal value/
Quantity DescriptionQuotation
CurrencyCost USD
Market value
USD% of net
assets
Transferable securities and money market instruments admitted to an official exchange listing or dealt in on another regulated market (cont.)
Bonds375 000 Allegheny Technologies, Inc. 4.750% 01/07/2022 USD 375 000 528 984 0.04
2 275 000 Chesapeake Energy Corp. 5.500% 15/09/2026 USD 2 279 219 2 280 687 0.153 025 000 DISH Network Corp. 144A 3.375% 15/08/2026 USD 3 024 433 3 312 375 0.22
782 500 Fiat Chrysler Automobiles NV 7.875% 15/12/2016 USD 542 973 501 289 0.03900 000 Lennar Corp. 3.250% 15/11/2021 USD 1 749 508 1 621 125 0.11900 000 Meritor, Inc. 7.875% 01/03/2026 USD 1 227 793 1 210 500 0.08
1 050 000 NuVasive, Inc. 144A 2.250% 15/03/2021 USD 1 050 000 1 328 250 0.0913 975 000 NVIDIA Corp. 1.000% 01/12/2018 USD 27 800 275 47 549 937 3.21
4 900 000 Sabine Oil & Gas Corp. (Defaulted) FRN 15/06/2019 USD 2 274 012 82 688 0.013 250 000 SunEdison, Inc. (Defaulted) 144A FRN 15/01/2020 USD 563 211 186 875 0.018 050 000 SunEdison, Inc. (Defaulted) FRN 01/10/2018 USD 1 892 705 462 875 0.031 425 000 SunEdison, Inc. (Defaulted) FRN 01/01/2021 USD 212 519 81 938 0.013 000 000 Weatherford International Ltd. 5.875% 01/07/2021 USD 3 567 775 3 365 625 0.231 241 000 Whiting Petroleum Corp. 1.250% 05/06/2020 USD 1 125 901 1 191 360 0.08
Total Bonds 47 685 324 63 704 508 4.30Shares
38 796 Alere, Inc. USD 1 930 596 1 677 539 0.112 850 Allergan Plc. - A - Pref USD 2 850 000 2 341 646 0.16
263 849 Apollo Education Group, Inc. USD 2 234 606 2 097 600 0.14200 898 Cepheid USD 10 524 221 10 585 316 0.71325 601 CST Brands, Inc. USD 15 488 264 15 658 152 1.06
70 439 Cvent, Inc. USD 2 452 424 2 233 621 0.1518 872 Dell Technologies, Inc. - V USD 850 561 902 082 0.06
2 969 DISH Network Corp. - A USD 163 087 162 642 0.0111 425 DTE Energy Co. - Pref 144A USD 571 250 594 100 0.04
6 814 DTS, Inc. USD 287 970 289 868 0.0233 250 Dynegy, Inc. - Pref USD 3 517 840 2 693 250 0.18
157 954 Empire District Electric Co. USD 5 254 787 5 392 550 0.36282 079 EverBank Financial Corp. USD 5 403 149 5 461 049 0.37
90 364 Fleetmatics Group Plc. USD 5 391 696 5 420 033 0.3793 074 G&K Services Inc - A USD 8 992 529 8 887 636 0.60
8 762 Herbalife Ltd. USD 530 158 543 156 0.045 408 Humana, Inc. USD 1 051 652 956 621 0.06
225 084 inContact, Inc. USD 3 121 102 3 146 674 0.2188 634 Ingram Micro, Inc. - A USD 3 162 432 3 160 688 0.2110 137 Interactive Intelligence Group, Inc. USD 607 376 609 639 0.04
237 987 Intersil Corp. - A USD 5 169 079 5 219 055 0.3511 056 Italcementi SpA EUR 125 807 131 454 0.01
127 331 Joy Global, Inc. USD 3 525 306 3 532 162 0.2453 496 KUKA AG EUR 6 405 044 6 471 790 0.4422 145 Lexmark International, Inc. - A USD 841 224 884 914 0.0619 093 LinkedIn Corp. - A USD 3 676 922 3 649 054 0.25
Merrill Lynch Investment Solutions – AQR Global Relative Value UCITS Fund

The accompanying notes form an integral part of these financial statements.
Schedule of Investments as at September 30, 2016 (cont.)(expressed in USD)
Merrill Lynch Investment Solutions – AQR Global Relative Value UCITS Fund
91Merrill Lynch Investment Solutions
Unaudited semi-annual report
Nominal value/
Quantity DescriptionQuotation
CurrencyCost USD
Market value
USD% of net
assets
Transferable securities and money market instruments admitted to an official exchange listing or dealt in on another regulated market (cont.)
125 745 Mandatory Exchangeable Trust - Pref 144A (a) USD 12 676 251 16 229 907 1.0960 393 Monsanto Co. USD 6 431 767 6 172 165 0.4245 715 NetSuite, Inc. USD 4 956 488 5 060 193 0.3442 147 Piedmont Natural Gas Co., Inc. USD 2 421 368 2 530 506 0.17
7 250 Post Hldg., Inc. - Pref USD 750 142 1 063 031 0.0787 590 Press Ganey Hldg., Inc. USD 3 540 488 3 538 636 0.24
289 135 Rackspace Hosting, Inc. USD 9 105 863 9 162 688 0.621 296 431 Rite Aid Corp. USD 10 272 774 9 969 554 0.67
121 624 Rofin-Sinar Technologies, Inc. USD 3 816 804 3 913 860 0.2667 475 Southwestern Energy Co. - B USD 3 421 933 2 130 186 0.1465 875 T-Mobile US, Inc. - Pref USD 3 302 607 5 142 861 0.35
235 184 Talen Energy Corp. USD 3 243 089 3 257 298 0.2225 300 Teva Pharmaceutical Industries Ltd. - Pref USD 21 450 443 20 576 723 1.3967 910 Valspar Corp. USD 7 151 998 7 203 214 0.4933 089 Virgin America, Inc. USD 1 807 658 1 770 592 0.1261 122 Vitae Pharmaceuticals, Inc. USD 1 274 774 1 278 672 0.09
214 791 WhiteWave Foods Co. USD 11 932 095 11 691 074 0.79Total Shares 201 685 624 203 393 451 13.72
Supranationals, Governments and Local Public Authorities, Debt Instruments
57 279 000 United States Treasury Bill 0.000% 06/10/2016 USD 57 275 954 57 278 484 3.8640 000 000 United States Treasury Bill 0.000% 03/11/2016 USD 39 986 433 39 993 160 2.7030 284 000 United States Treasury Bill 0.000% 17/11/2016 USD 30 269 371 30 277 368 2.0428 000 000 United States Treasury Bill 0.000% 25/11/2016 USD 27 979 536 27 993 168 1.8959 600 000 United States Treasury Bill 0.000% 05/01/2017 USD 59 545 986 59 557 565 4.0274 064 000 United States Treasury Bill 0.000% 12/01/2017 USD 73 981 018 74 009 785 4.9955 000 000 United States Treasury Bill 0.000% 02/02/2017 USD 54 925 354 54 938 730 3.7142 402 000 United States Treasury Bill 0.000% 09/02/2017 USD 42 334 316 42 350 312 2.8690 000 000 United States Treasury Bill 0.000% 23/02/2017 USD 89 836 875 89 874 450 6.0663 853 000 United States Treasury Bill 0.000% 16/03/2017 USD 63 694 019 63 733 276 4.30
109 112 000 United States Treasury Bill 0.000% 23/03/2017 USD 108 849 828 108 893 667 7.34Total Supranationals, Governments and Local Public Authorities, Debt Instruments 648 678 690 648 899 965 43.77
Other transferable securities
Shares46 425 Great Plains Energy, Inc. - Pref (a) USD 2 336 725 2 321 250 0.16
Total Shares 2 336 725 2 321 250 0.16Total Investments 900 386 363 918 319 174 61.95
(a) These securities are fair valued. See Notes 2.2.6 and 10.

The accompanying notes form an integral part of these financial statements.
Schedule of Investments as at September 30, 2016 (cont.)(expressed in USD)
Merrill Lynch Investment Solutions – AQR Global Relative Value UCITS Fund
92 Merrill Lynch Investment Solutions
Unaudited semi-annual report
Industrial classification of investments(as a percentage of net assets as at September 30, 2016) %
Geographical classification of investments(as a percentage of net assets as at September 30, 2016) %
Sovereign 43.78 United States 59.32Semiconductors 3.56 Israel 1.39 Retail 1.73 Ireland 0.53 Pharmaceuticals 1.68 Germany 0.44 Software 1.60 Bermuda 0.23 Investment Companies 1.09 Netherlands 0.03 Electric 0.96 Italy 0.01Chemicals 0.91 61.95Healthcare-Products 0.91 Food 0.86 Textiles 0.60 Computers 0.49 Hand/Machine Tools 0.44 Oil & Gas 0.38 Savings & Loans 0.37 Telecommunications 0.35 Electronics 0.26 Internet 0.25 Machinery-Constr & Mining 0.24 Media 0.23 Oil & Gas Services 0.23 Distribution/Wholesale 0.21 Gas 0.17 Commercial Services 0.14 Airlines 0.12 Home Builders 0.11 Auto Parts & Equipment 0.08 Healthcare-Services 0.06 Energy-Alternate Sources 0.05 Iron/Steel 0.03 Auto Manufacturers 0.03 Home Furnishings 0.02 Building Materials 0.01
61.95
Underlying nature
Currency contract
Details
Market
Maturity date
Number of contracts
bought
Number of contracts
soldCommitment
USD
Unrealised appreciation/
(depreciation) USD
Futures contracts (cont.)Index EUR Amsterdam Index NYSE Liffe Amsterdam 21/10/2016 – 79 8 027 506 (103 524)Index TRY BIST 30 Index Borsa Istanbul 31/10/2016 326 – 1 023 130 (11 365)Index EUR CAC 40 10 Euro
Index Euronext Paris 21/10/2016 – 414 20 673 527 (411 777)Index EUR DAX Index Eurex Deutschland 16/12/2016 356 – 105 144 139 1 223 804Index USD DJIA Mini Index Chicago Board of Trade 16/12/2016 158 – 14 393 010 60 400Index EUR Euro Stoxx 50 Index Eurex Deutschland 16/12/2016 – 228 7 671 419 (29 016)

The accompanying notes form an integral part of these financial statements.
Schedule of Investments as at September 30, 2016 (cont.)(expressed in USD)
Merrill Lynch Investment Solutions – AQR Global Relative Value UCITS Fund
93Merrill Lynch Investment Solutions
Unaudited semi-annual report
Underlying nature
Currency contract
Details
Market
Maturity date
Number of contracts
bought
Number of contracts
soldCommitment
USD
Unrealised appreciation/
(depreciation) USD
Futures contracts (cont.)Index GBP FTSE 100 Index ICE Futures Europe 16/12/2016 633 – 56 386 955 1 681 913Index ZAR FTSE JSE TOP 40
Index South African Futures Exchange 15/12/2016 – 414 13 826 945 421 697Index MYR FTSE KLCI Index Bursa Malaysia 31/10/2016 7 – 139 983 (1 017)Index EUR FTSE MIB Index Borsa Italiana 16/12/2016 – 115 10 569 649 166 940Index HKD H-Shares Index Hong Kong Futures Exchange 28/10/2016 71 – 4 394 046 (40 279)Index HKD Hang Seng Index Hong Kong Futures Exchange 28/10/2016 1 – 150 291 (954)Index EUR IBEX 35 Index Meff Renta Variable Madrid 21/10/2016 112 – 11 029 100 (10 275)Index MXN Mexican Bolsa Index Mercado Mexicano de
Derivados 16/12/2016 – 26 633 949 (11 798)Index USD Mini MSCI EAFE
Index ICE Futures US Indices 16/12/2016 22 – 1 877 370 22 242Index USD MSCI Emerging
Markets Mini Index ICE Futures US Indices 16/12/2016 197 – 8 988 125 (121 714)Index SGD MSCI Singapore
IndexSingapore Exchange (was SIMEX) 28/10/2016 – 157 3 628 923 (36 925)
Index USD MSCI Taiwan Index Singapore Exchange (was SIMEX) 28/10/2016 98 – 3 348 660 (14 700)
Index USD Nasdaq 100 E-Mini Index Chicago Mercantile Exchange 16/12/2016 245 – 23 864 225 650 035
Index JPY Nikkei 225 Index Osaka Exchange 08/12/2016 – 18 2 924 011 97 230Index SEK OMX 30 Index OMX Nordic Exchange
Stockholm 21/10/2016 167 – 2 803 995 56 256Index USD Russell 2000 Mini
Index ICE Futures US Indices 16/12/2016 – 220 27 462 600 (503 816)Index USD S&P 500 E-Mini
Index Chicago Mercantile Exchange 16/12/2016 – 321 34 674 420 (272 998)Index USD S&P MidCap 400
E-Mini Index Chicago Mercantile Exchange 16/12/2016 50 – 7 748 000 36 940Index CAD S&P TSX 60 Index Montreal Exchange 15/12/2016 117 – 15 226 692 32 779Index THB SET 50 Index Thailand Futures Exchange 29/12/2016 – 393 2 144 317 825Index USD SGX Nifty 50 Index Singapore Exchange (was
SIMEX) 27/10/2016 36 – 622 872 (9 994)Index AUD SPI 200 Index Australian Stock Exchange 15/12/2016 – 143 14 816 929 (605 370)Index JPY Topix Index Osaka Exchange 08/12/2016 64 – 8 361 428 (28 530)Interest rate AUD 10 Year Australian
Treasury Bond Australian Stock Exchange 15/12/2016 – 651 48 863 783 (478 546)Interest rate CAD 10 Year Government
of Canada Bond Montreal Exchange 19/12/2016 – 888 99 269 515 (353 808)Interest rate JPY 10 Year Japan
Government Bond Osaka Exchange 13/12/2016 – 91 136 897 670 (632 499)Interest rate USD 10 Year US Treasury Chicago Board of Trade 20/12/2016 657 – 86 149 125 (24 695)Interest rate USD 2 Year US Treasury
Note Chicago Board of Trade 30/12/2016 – 342 74 716 313 (48 816)Interest rate CAD 3 Month Canadian
Banker’s Acceptance Montreal Exchange 19/12/2016 – 48 9 049 876 (4 873)

The accompanying notes form an integral part of these financial statements.
Schedule of Investments as at September 30, 2016 (cont.)(expressed in USD)
Merrill Lynch Investment Solutions – AQR Global Relative Value UCITS Fund
94 Merrill Lynch Investment Solutions
Unaudited semi-annual report
Underlying nature
Currency contract
Details
Market
Maturity date
Number of contracts
bought
Number of contracts
soldCommitment
USD
Unrealised appreciation/
(depreciation) USD
Futures contracts (cont.)Interest rate CAD 3 Month Canadian
Banker’s Acceptance Montreal Exchange 19/06/2017 – 214 40 355 507 (17 674)Interest rate CAD 3 Month Canadian
Banker’s Acceptance Montreal Exchange 18/09/2017 – 87 16 406 211 (2 701)Interest rate CAD 3 Month Canadian
Banker’s Acceptance Montreal Exchange 13/03/2017 – 299 56 381 720 (30 402)Interest rate EUR 3 Month Euribor ICE Futures Europe 13/03/2017 725 – 204 330 380 (12 280)Interest rate EUR 3 Month Euribor ICE Futures Europe 19/06/2017 759 – 213 955 419 (44 329)Interest rate EUR 3 Month Euribor ICE Futures Europe 18/09/2017 888 – 250 356 806 (50 515)Interest rate EUR 3 Month Euribor ICE Futures Europe 18/12/2017 334 – 94 179 811 11 547Interest rate EUR 3 Month Euribor ICE Futures Europe 19/03/2018 383 – 108 007 370 66 332Interest rate EUR 3 Month Euribor ICE Futures Europe 18/06/2018 353 – 99 547 263 20 509Interest rate EUR 3 Month Euribor ICE Futures Europe 17/09/2018 315 – 88 831 127 9 693Interest rate CHF 3 Month Euroswiss ICE Futures Europe 13/03/2017 – 60 15 601 919 (4 539)Interest rate CHF 3 Month Euroswiss ICE Futures Europe 19/06/2017 – 40 10 402 311 (3 610)Interest rate CHF 3 Month Euroswiss ICE Futures Europe 18/09/2017 – 29 7 541 675 (2 966)Interest rate AUD 3 Month New
Zealand Bank Bill Australian Stock Exchange 09/03/2017 446 – 33 563 602 444 18 071Interest rate AUD 3 Year Australian
Treasury Bond Australian Stock Exchange 15/12/2016 – 341 25 716 657 (116 557)Interest rate USD 5 Year US Treasury
Note Chicago Board of Trade 30/12/2016 350 – 42 530 469 (1 257)Interest rate AUD 90 Day Australian
Bank Bill Australian Stock Exchange 08/06/2017 463 – 34 857 105 012 44 836Interest rate AUD 90 Day Australian
Bank Bill Australian Stock Exchange 07/09/2017 518 – 39 005 725 822 30 605Interest rate USD 90 Day Eurodollar Chicago Mercantile Exchange 13/03/2017 – 2,016 499 237 200 108 875Interest rate USD 90 Day Eurodollar Chicago Mercantile Exchange 19/06/2017 – 1,872 463 390 200 129 767Interest rate USD 90 Day Eurodollar Chicago Mercantile Exchange 18/09/2017 – 1,725 426 851 250 (72 831)Interest rate USD 90 Day Eurodollar Chicago Mercantile Exchange 18/12/2017 – 62 15 334 925 (5 261)Interest rate USD 90 Day Eurodollar Chicago Mercantile Exchange 19/03/2018 57 – 14 095 388 (2 311)Interest rate USD 90 Day Eurodollar Chicago Mercantile Exchange 18/06/2018 102 – 25 215 675 (3 673)Interest rate USD 90 Day Eurodollar Chicago Mercantile Exchange 17/09/2018 119 – 29 407 875 (7 601)Interest rate GBP 90 Day Sterling ICE Futures Europe 21/12/2016 291 – 47 092 830 (25 145)Interest rate GBP 90 Day Sterling ICE Futures Europe 15/03/2017 1,486 – 240 565 364 (15 034)Interest rate GBP 90 Day Sterling ICE Futures Europe 21/06/2017 1,536 – 248 709 638 31 836Interest rate GBP 90 Day Sterling ICE Futures Europe 20/09/2017 1,275 – 206 469 133 (26 175)Interest rate GBP 90 Day Sterling ICE Futures Europe 20/12/2017 569 – 92 151 150 120 158Interest rate GBP 90 Day Sterling ICE Futures Europe 21/03/2018 532 – 86 158 896 117 502Interest rate GBP 90 Day Sterling ICE Futures Europe 20/06/2018 513 – 83 073 463 100 088Interest rate GBP 90 Day Sterling ICE Futures Europe 19/09/2018 499 – 80 798 248 28 448Interest rate EUR Euro BTP Eurex Deutschland 08/12/2016 200 – 32 160 910 (28 545)Interest rate EUR Euro OAT Eurex Deutschland 08/12/2016 169 – 30 410 344 219 175
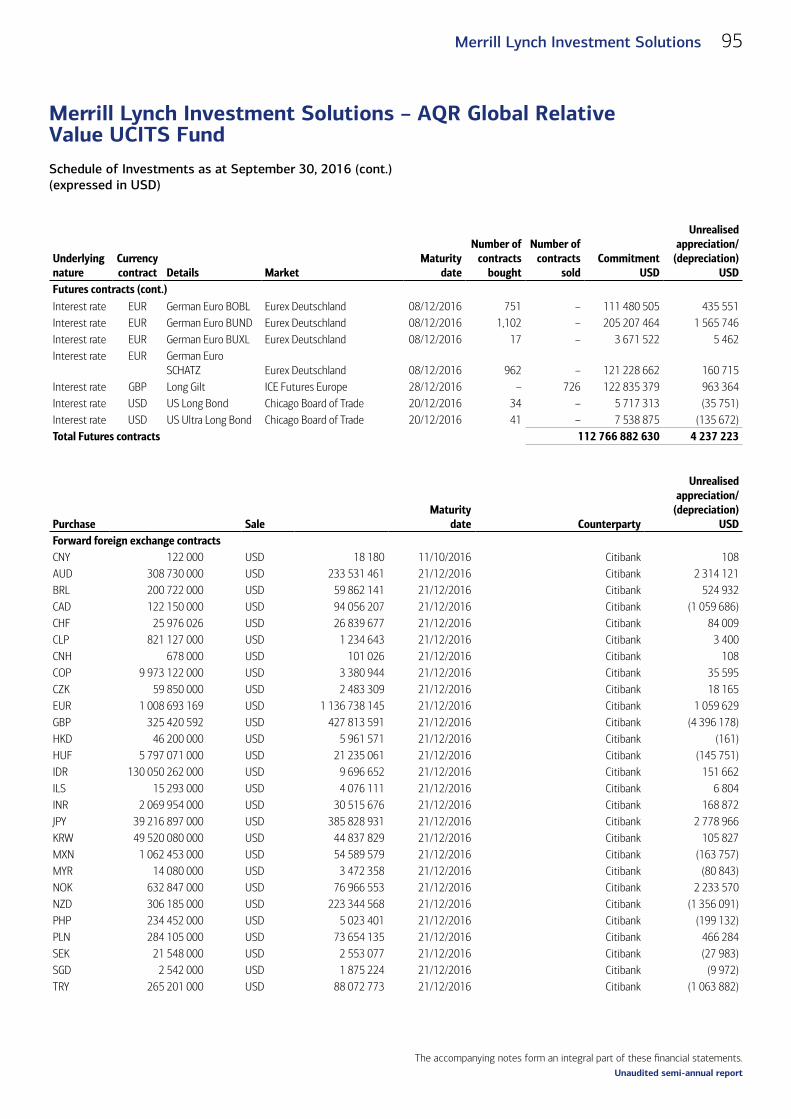
The accompanying notes form an integral part of these financial statements.
Schedule of Investments as at September 30, 2016 (cont.)(expressed in USD)
Merrill Lynch Investment Solutions – AQR Global Relative Value UCITS Fund
95Merrill Lynch Investment Solutions
Unaudited semi-annual report
Underlying nature
Currency contract
Details
Market
Maturity date
Number of contracts
bought
Number of contracts
soldCommitment
USD
Unrealised appreciation/
(depreciation) USD
Futures contracts (cont.)Interest rate EUR German Euro BOBL Eurex Deutschland 08/12/2016 751 – 111 480 505 435 551Interest rate EUR German Euro BUND Eurex Deutschland 08/12/2016 1,102 – 205 207 464 1 565 746Interest rate EUR German Euro BUXL Eurex Deutschland 08/12/2016 17 – 3 671 522 5 462Interest rate EUR German Euro
SCHATZ Eurex Deutschland 08/12/2016 962 – 121 228 662 160 715Interest rate GBP Long Gilt ICE Futures Europe 28/12/2016 – 726 122 835 379 963 364Interest rate USD US Long Bond Chicago Board of Trade 20/12/2016 34 – 5 717 313 (35 751)Interest rate USD US Ultra Long Bond Chicago Board of Trade 20/12/2016 41 – 7 538 875 (135 672) Total Futures contracts 112 766 882 630 4 237 223
Purchase
Sale
Maturity date Counterparty
Unrealised appreciation/
(depreciation) USD
Forward foreign exchange contracts (cont.)CNY 122 000 USD 18 180 11/10/2016 Citibank 108AUD 308 730 000 USD 233 531 461 21/12/2016 Citibank 2 314 121BRL 200 722 000 USD 59 862 141 21/12/2016 Citibank 524 932CAD 122 150 000 USD 94 056 207 21/12/2016 Citibank (1 059 686)CHF 25 976 026 USD 26 839 677 21/12/2016 Citibank 84 009CLP 821 127 000 USD 1 234 643 21/12/2016 Citibank 3 400CNH 678 000 USD 101 026 21/12/2016 Citibank 108COP 9 973 122 000 USD 3 380 944 21/12/2016 Citibank 35 595CZK 59 850 000 USD 2 483 309 21/12/2016 Citibank 18 165EUR 1 008 693 169 USD 1 136 738 145 21/12/2016 Citibank 1 059 629GBP 325 420 592 USD 427 813 591 21/12/2016 Citibank (4 396 178)HKD 46 200 000 USD 5 961 571 21/12/2016 Citibank (161)HUF 5 797 071 000 USD 21 235 061 21/12/2016 Citibank (145 751)IDR 130 050 262 000 USD 9 696 652 21/12/2016 Citibank 151 662ILS 15 293 000 USD 4 076 111 21/12/2016 Citibank 6 804INR 2 069 954 000 USD 30 515 676 21/12/2016 Citibank 168 872JPY 39 216 897 000 USD 385 828 931 21/12/2016 Citibank 2 778 966KRW 49 520 080 000 USD 44 837 829 21/12/2016 Citibank 105 827MXN 1 062 453 000 USD 54 589 579 21/12/2016 Citibank (163 757)MYR 14 080 000 USD 3 472 358 21/12/2016 Citibank (80 843)NOK 632 847 000 USD 76 966 553 21/12/2016 Citibank 2 233 570NZD 306 185 000 USD 223 344 568 21/12/2016 Citibank (1 356 091)PHP 234 452 000 USD 5 023 401 21/12/2016 Citibank (199 132)PLN 284 105 000 USD 73 654 135 21/12/2016 Citibank 466 284SEK 21 548 000 USD 2 553 077 21/12/2016 Citibank (27 983)SGD 2 542 000 USD 1 875 224 21/12/2016 Citibank (9 972)TRY 265 201 000 USD 88 072 773 21/12/2016 Citibank (1 063 882)

The accompanying notes form an integral part of these financial statements.
Schedule of Investments as at September 30, 2016 (cont.)(expressed in USD)
Merrill Lynch Investment Solutions – AQR Global Relative Value UCITS Fund
96 Merrill Lynch Investment Solutions
Unaudited semi-annual report
Purchase
Sale
Maturity date Counterparty
Unrealised appreciation/
(depreciation) USD
Forward foreign exchange contracts (cont.)TWD 827 548 000 USD 26 418 505 21/12/2016 Citibank 39 269USD 26 894 388 AUD 35 978 000 21/12/2016 Citibank (589 991)USD 22 784 677 BRL 75 597 000 21/12/2016 Citibank 41 372USD 126 558 247 CAD 166 665 000 21/12/2016 Citibank (328 901)USD 166 813 339 CHF 161 410 000 21/12/2016 Citibank (485 236)USD 43 459 943 CLP 29 464 113 000 21/12/2016 Citibank (964 166)USD 4 722 354 CNH 31 782 000 21/12/2016 Citibank (18 398)USD 70 453 COP 211 924 000 21/12/2016 Citibank (2 147)USD 13 434 021 CZK 322 000 000 21/12/2016 Citibank (24 199)USD 210 279 732 EUR 186 690 053 21/12/2016 Citibank (305 145)USD 225 174 250 GBP 172 072 460 21/12/2016 Citibank 1 284 067USD 318 402 HKD 2 467 000 21/12/2016 Citibank 73USD 21 216 933 HUF 5 859 509 000 21/12/2016 Citibank (99 522)USD 34 039 IDR 449 148 000 21/12/2016 Citibank 27USD 39 684 445 ILS 148 667 000 21/12/2016 Citibank (6 577)USD 470 991 INR 31 955 000 21/12/2016 Citibank (2 703)USD 121 395 496 JPY 12 330 655 000 21/12/2016 Citibank (791 374)USD 6 685 833 KRW 7 492 477 000 21/12/2016 Citibank (114 223)USD 49 423 693 MXN 956 682 000 21/12/2016 Citibank 416 156USD 10 204 444 MYR 42 148 000 21/12/2016 Citibank 52 059USD 11 686 365 NOK 96 492 000 21/12/2016 Citibank (389 506)USD 105 562 303 NZD 145 554 000 21/12/2016 Citibank 33 585USD 6 894 829 PHP 330 672 000 21/12/2016 Citibank 90 661USD 20 624 018 PLN 80 245 000 21/12/2016 Citibank (311 175)USD 200 812 968 SEK 1 694 759 000 21/12/2016 Citibank 2 213 269USD 62 625 465 SGD 85 191 000 21/12/2016 Citibank 114 580USD 54 484 975 TRY 164 875 000 21/12/2016 Citibank 391 699USD 857 140 TWD 26 847 000 21/12/2016 Citibank (1 193)USD 8 886 548 ZAR 126 595 000 21/12/2016 Citibank (181 414)ZAR 679 417 000 USD 47 109 736 21/12/2016 Citibank 1 556 702EUR 750 USD 834 05/04/2017 Credit Suisse International 16USD 1 002 EUR 750 05/04/2017 Credit Suisse International 152Total forward foreign exchange contracts 3 066 433

The accompanying notes form an integral part of these financial statements.
Schedule of Investments as at September 30, 2016 (cont.)(expressed in USD)
Merrill Lynch Investment Solutions – AQR Global Relative Value UCITS Fund
97Merrill Lynch Investment Solutions
Unaudited semi-annual report
Notional
Pay
Receive
Currency
Maturity date Counterparty
Unrealised appreciation/
(depreciation) USD
Commitment USD
Credit default swaps5 450 000 Fixed 5% Markit CDX North America
Investment Grade Index 27v1 USD 21/12/2021
Merrill Lynch, Pierce, Fenner
and Smith, Inc. (538 695) 5 450 00045 100 000 Fixed 5%
Markit iTraxx Europe Crossover Index 26v1 EUR 21/12/2021
Merrill Lynch, Pierce, Fenner
and Smith, Inc. (107 240) 45 100 000(143 100 000) Markit CDX North America
Investment Grade Index 27v1 Fixed 1% USD 21/12/2021
Merrill Lynch, Pierce, Fenner
and Smith, Inc. 282 613 143 100 000(190 600 000) Markit iTraxx Europe Index
26v1Fixed 1% EUR 21/12/2021
Merrill Lynch, Pierce, Fenner
and Smith, Inc. (54 488) 190 600 000Total Credit default swaps (417 810) 384 250 000
The maximum individual counterparty exposure for OTC Derivatives as at September 30, 2016 is 3.50% of the NAV.
Contracts for difference swaps
The Sub-Fund Merrill Lynch Investment Solutions - AQR Global Relative Value UCITS Fund entered into contracts for difference swaps with six counterparties (Bank of America N.A., Deutsche Bank AG, Goldman Sachs International, Merrill Lynch International Bank Ltd, Morgan Stanley Capital Services Inc. and Morgan Stanley International Plc..) with the following details:
1) Bank of America N.A.
Commitment of USD 29 322 415 for the short portfolio composed of 2 equities and 1 derivativeCommitment of USD 20 290 512 for the long portfolio composed of 2 equities and 3 derivatives
Market value of USD (189 401) detailed as follows:– unrealised depreciation of short portfolio: USD (443 529)– unrealised depreciation of long portfolio: USD (64 674)– realised result: USD 318 802 corresponding to the realised gain on securities which is still held at the counterparty (monthly reset)
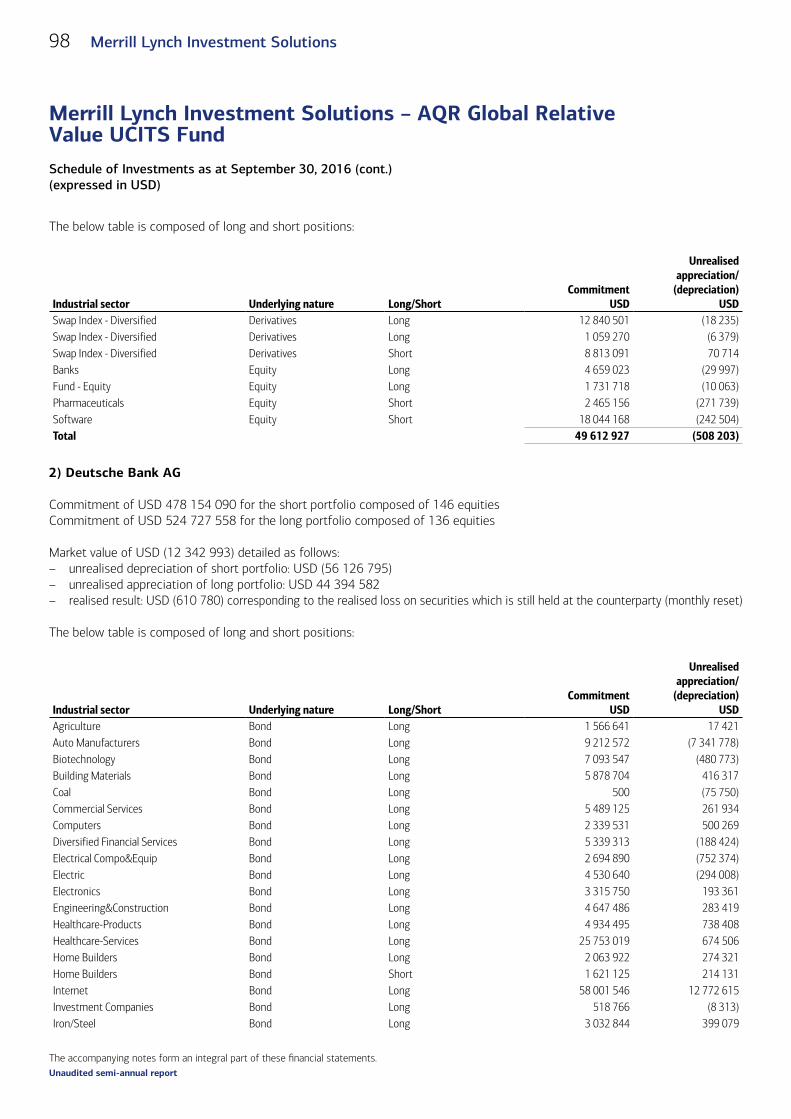
The accompanying notes form an integral part of these financial statements.
Schedule of Investments as at September 30, 2016 (cont.)(expressed in USD)
Merrill Lynch Investment Solutions – AQR Global Relative Value UCITS Fund
98 Merrill Lynch Investment Solutions
Unaudited semi-annual report
The below table is composed of long and short positions:
Industrial sector Underlying nature Long/ShortCommitment
USD
Unrealised appreciation/
(depreciation)USD
Swap Index - Diversified Derivatives Long 12 840 501 (18 235)Swap Index - Diversified Derivatives Long 1 059 270 (6 379)Swap Index - Diversified Derivatives Short 8 813 091 70 714Banks Equity Long 4 659 023 (29 997)Fund - Equity Equity Long 1 731 718 (10 063)Pharmaceuticals Equity Short 2 465 156 (271 739)Software Equity Short 18 044 168 (242 504)Total 49 612 927 (508 203)
2) Deutsche Bank AG
Commitment of USD 478 154 090 for the short portfolio composed of 146 equitiesCommitment of USD 524 727 558 for the long portfolio composed of 136 equities
Market value of USD (12 342 993) detailed as follows:– unrealised depreciation of short portfolio: USD (56 126 795)– unrealised appreciation of long portfolio: USD 44 394 582– realised result: USD (610 780) corresponding to the realised loss on securities which is still held at the counterparty (monthly reset)
The below table is composed of long and short positions:
Industrial sector Underlying nature Long/ShortCommitment
USD
Unrealised appreciation/
(depreciation)USD
Agriculture Bond Long 1 566 641 17 421Auto Manufacturers Bond Long 9 212 572 (7 341 778)Biotechnology Bond Long 7 093 547 (480 773)Building Materials Bond Long 5 878 704 416 317Coal Bond Long 500 (75 750)Commercial Services Bond Long 5 489 125 261 934Computers Bond Long 2 339 531 500 269Diversified Financial Services Bond Long 5 339 313 (188 424)Electrical Compo&Equip Bond Long 2 694 890 (752 374)Electric Bond Long 4 530 640 (294 008)Electronics Bond Long 3 315 750 193 361Engineering&Construction Bond Long 4 647 486 283 419Healthcare-Products Bond Long 4 934 495 738 408Healthcare-Services Bond Long 25 753 019 674 506Home Builders Bond Long 2 063 922 274 321Home Builders Bond Short 1 621 125 214 131Internet Bond Long 58 001 546 12 772 615Investment Companies Bond Long 518 766 (8 313)Iron/Steel Bond Long 3 032 844 399 079
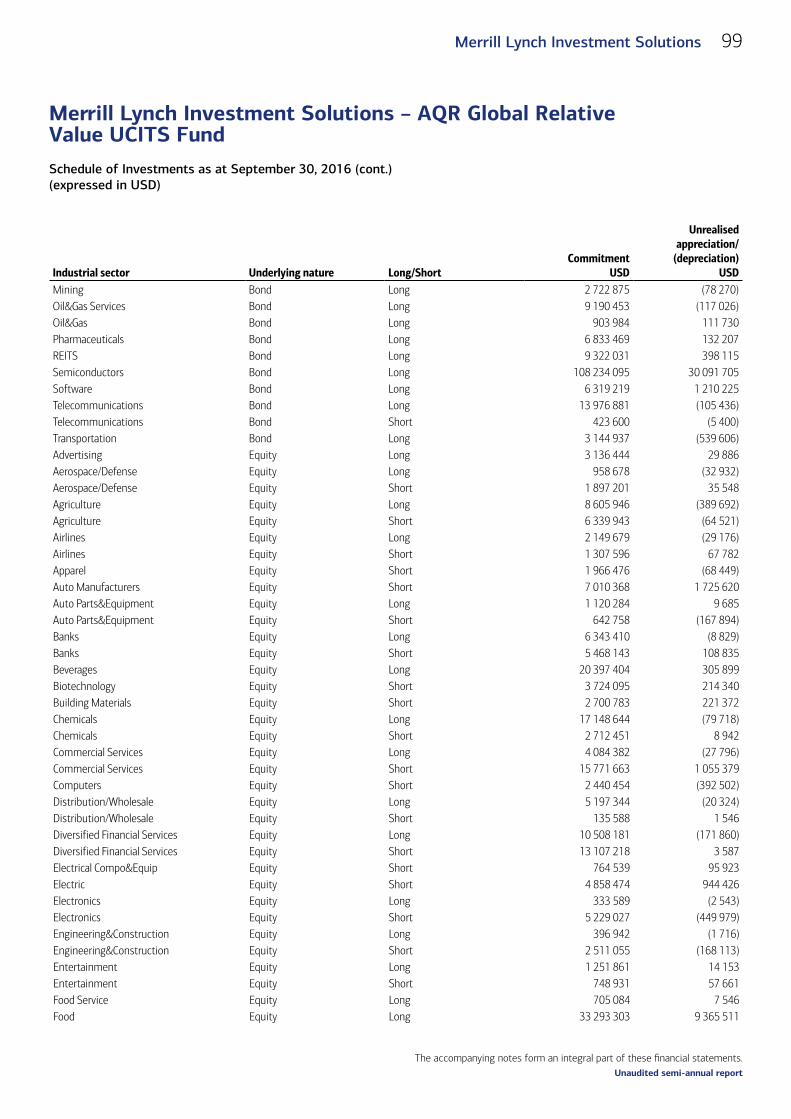
The accompanying notes form an integral part of these financial statements.
Schedule of Investments as at September 30, 2016 (cont.)(expressed in USD)
Merrill Lynch Investment Solutions – AQR Global Relative Value UCITS Fund
99Merrill Lynch Investment Solutions
Unaudited semi-annual report
Industrial sector Underlying nature Long/ShortCommitment
USD
Unrealised appreciation/
(depreciation)USD
Mining Bond Long 2 722 875 (78 270)Oil&Gas Services Bond Long 9 190 453 (117 026)Oil&Gas Bond Long 903 984 111 730Pharmaceuticals Bond Long 6 833 469 132 207REITS Bond Long 9 322 031 398 115Semiconductors Bond Long 108 234 095 30 091 705Software Bond Long 6 319 219 1 210 225Telecommunications Bond Long 13 976 881 (105 436)Telecommunications Bond Short 423 600 (5 400)Transportation Bond Long 3 144 937 (539 606)Advertising Equity Long 3 136 444 29 886Aerospace/Defense Equity Long 958 678 (32 932)Aerospace/Defense Equity Short 1 897 201 35 548Agriculture Equity Long 8 605 946 (389 692)Agriculture Equity Short 6 339 943 (64 521)Airlines Equity Long 2 149 679 (29 176)Airlines Equity Short 1 307 596 67 782Apparel Equity Short 1 966 476 (68 449)Auto Manufacturers Equity Short 7 010 368 1 725 620Auto Parts&Equipment Equity Long 1 120 284 9 685Auto Parts&Equipment Equity Short 642 758 (167 894)Banks Equity Long 6 343 410 (8 829)Banks Equity Short 5 468 143 108 835Beverages Equity Long 20 397 404 305 899Biotechnology Equity Short 3 724 095 214 340Building Materials Equity Short 2 700 783 221 372Chemicals Equity Long 17 148 644 (79 718)Chemicals Equity Short 2 712 451 8 942Commercial Services Equity Long 4 084 382 (27 796)Commercial Services Equity Short 15 771 663 1 055 379Computers Equity Short 2 440 454 (392 502)Distribution/Wholesale Equity Long 5 197 344 (20 324)Distribution/Wholesale Equity Short 135 588 1 546Diversified Financial Services Equity Long 10 508 181 (171 860)Diversified Financial Services Equity Short 13 107 218 3 587Electrical Compo&Equip Equity Short 764 539 95 923Electric Equity Short 4 858 474 944 426Electronics Equity Long 333 589 (2 543)Electronics Equity Short 5 229 027 (449 979)Engineering&Construction Equity Long 396 942 (1 716)Engineering&Construction Equity Short 2 511 055 (168 113)Entertainment Equity Long 1 251 861 14 153Entertainment Equity Short 748 931 57 661Food Service Equity Long 705 084 7 546Food Equity Long 33 293 303 9 365 511

The accompanying notes form an integral part of these financial statements.
Schedule of Investments as at September 30, 2016 (cont.)(expressed in USD)
Merrill Lynch Investment Solutions – AQR Global Relative Value UCITS Fund
100 Merrill Lynch Investment Solutions
Unaudited semi-annual report
Industrial sector Underlying nature Long/ShortCommitment
USD
Unrealised appreciation/
(depreciation)USD
Food Equity Short 32 177 243 (8 046 363)Forest Products&Paper Equity Long 3 200 154 (89 466)Gas Equity Long 2 576 095 42 571Healthcare-Products Equity Long 936 883 2 259Healthcare-Products Equity Short 4 138 690 (583 544)Healthcare-Services Equity Long 5 696 744 (415 113)Healthcare-Services Equity Short 23 868 735 721 895Home Builders Equity Long 17 841 006 482 874Home Builders Equity Short 2 177 845 49 575Home Furnishings Equity Long 151 783 492Household Products/Wares Equity Long 2 842 023 21 220Insurance Equity Long 3 576 528 (89 189)Insurance Equity Short 10 277 442 (10 824)Internet Equity Long 142 947 (1 743)Internet Equity Short 59 308 780 (9 776 764)Investment Companies Equity Long 55 028 1 919Iron/Steel Equity Short 2 589 196 (336 807)Leisure Time Equity Long 2 056 208 65 604Leisure Time Equity Short 674 871 33 768Lodging Equity Short 3 401 008 109 988Machinery-Diversified Equity Short 3 393 099 (224 973)Media Equity Long 1 382 217 (34 472)Media Equity Short 8 048 043 (165 864)Mining Equity Long 334 855 35 036Mining Equity Short 17 740 606 (1 114 028)Miscellaneous Manufactur Equity Short 2 677 920 (33 803)Oil&Gas Services Equity Long 3 804 887 214 654Oil&Gas Services Equity Short 5 572 345 240 615Oil&Gas Equity Long 11 947 672 (1 932 551)Oil&Gas Equity Short 7 808 651 (483 626)Packaging&Containers Equity Long 650 786 134 924Pharmaceuticals Equity Long 14 597 028 (2 351 257)Pharmaceuticals Equity Short 30 936 239 3 617 709Private Equity Equity Long 3 303 687 (68 424)Real Estate Equity Long 1 154 365 (116 564)REITS Equity Long 2 142 910 74 484REITS Equity Short 6 398 283 (16 288)Retail Equity Long 6 426 215 14 533Retail Equity Short 3 698 546 29 107Semiconductors Equity Short 134 814 996 (39 679 880)Software Equity Long 5 744 285 63 297Software Equity Short 6 193 477 (1 153 317)Telecommunications Equity Long 9 413 152 991 310

The accompanying notes form an integral part of these financial statements.
Schedule of Investments as at September 30, 2016 (cont.)(expressed in USD)
Merrill Lynch Investment Solutions – AQR Global Relative Value UCITS Fund
101Merrill Lynch Investment Solutions
Unaudited semi-annual report
Industrial sector Underlying nature Long/ShortCommitment
USD
Unrealised appreciation/
(depreciation)USD
Telecommunications Equity Short 24 782 519 (2 747 195)Transportation Equity Long 2 057 689 (113 783)Transportation Equity Short 1 479 573 57 296Water Equity Short 4 614 495 (51 705)Total 1 002 881 647 (11 732 211)
3) Goldman Sachs International
Commitment of USD 1 719 290 952 for the short portfolio composed of 644 equities and 1 derivative Commitment of USD 2 078 761 502 for the long portfolio composed of 725 equities and 4 derivatives
Market value of USD 371 021 detailed as follows:– unrealised depreciation of short portfolio: USD (9 788 495)– unrealised appreciation of long portfolio: USD 7 217 188– realised result: USD 2 942 328 corresponding to the realised gain on securities which is still held at the counterparty (monthly reset)
The below table is composed of long and short positions:
Industrial sector Underlying nature Long/ShortCommitment
USD
Unrealised appreciation/
(depreciation)USD
Swap Index - Diversified Derivatives Long 14 347 780 (151 847)Swap Index - Diversified Derivatives Long 5 490 059 (33 935)Swap Index - Diversified Derivatives Short 1 401 462 25 518Advertising Equity Long 4 371 803 (57 021)Advertising Equity Short 23 331 2 245Aerospace/Defense Equity Long 44 408 432 (259 091)Aerospace/Defense Equity Short 43 426 656 (1 114 581)Agriculture Equity Long 5 736 410 (326 107)Airlines Equity Long 21 051 320 814 646Airlines Equity Short 4 849 992 (128 146)Apparel Equity Long 16 968 298 (1 526 026)Apparel Equity Short 14 837 018 923 964Auto Manufacturers Equity Long 16 824 046 174 529Auto Manufacturers Equity Short 5 627 779 47 818Auto Parts&Equipment Equity Long 20 537 931 1 231 295Auto Parts&Equipment Equity Short 9 236 992 (356 789)Banks Equity Long 99 880 221 1 111 149Banks Equity Short 115 398 251 (1 725 122)Beverages Equity Long 19 967 211 422 806Beverages Equity Short 10 252 498 436 254Biotechnology Equity Long 37 818 090 (790 316)Biotechnology Equity Short 26 994 286 (1 101 373)

The accompanying notes form an integral part of these financial statements.
Schedule of Investments as at September 30, 2016 (cont.)(expressed in USD)
Merrill Lynch Investment Solutions – AQR Global Relative Value UCITS Fund
102 Merrill Lynch Investment Solutions
Unaudited semi-annual report
Industrial sector Underlying nature Long/ShortCommitment
USD
Unrealised appreciation/
(depreciation)USD
Building Materials Equity Long 20 025 364 (221 308)Building Materials Equity Short 6 754 997 225 666Chemicals Equity Long 110 744 336 352 818Chemicals Equity Short 75 746 566 640 478Coal Equity Long 2 681 054 64 086Coal Equity Short 1 403 944 (109 636)Commercial Services Equity Long 50 493 789 169 607Commercial Services Equity Short 42 973 588 423 494Computers Equity Long 73 871 654 2 697 564Computers Equity Short 33 784 583 (462 747)Cosmetics/Personal Care Equity Long 11 163 325 96 480Cosmetics/Personal Care Equity Short 3 886 419 (60 153)Distribution/Wholesale Equity Long 6 239 335 29 721Distribution/Wholesale Equity Short 12 936 121 220 590Diversified Financial Services Equity Long 88 298 173 1 636 808Diversified Financial Services Equity Short 84 862 538 (427 634)Electrical Compo&Equip Equity Long 5 610 148 (123 163)Electrical Compo&Equip Equity Short 11 306 673 591 775Electric Equity Long 151 911 717 (1 982 540)Electric Equity Short 98 715 478 894 935Electronics Equity Long 38 593 322 869 527Electronics Equity Short 39 038 450 (202 552)Energy-Alternate Sources Equity Long 888 003 (84 690)Energy-Alternate Sources Equity Short 2 963 276 65 823Engineering&Construction Equity Long 9 331 043 (100 806)Engineering&Construction Equity Short 10 688 360 934 581Entertainment Equity Long 18 301 080 650 854Entertainment Equity Short 16 993 876 (201 346)Environmental Control Equity Long 14 714 631 (298 163)Environmental Control Equity Short 18 673 303 277 009Food Equity Long 68 616 459 (1 992 067)Food Equity Short 51 546 403 1 806 167Forest Products&Paper Equity Long 7 187 513 149 569Forest Products&Paper Equity Short 332 361 (18 501)Gas Equity Long 33 141 454 (334 494)Gas Equity Short 12 526 094 398 001Hand/Machine Tools Equity Long 16 287 679 (133 010)Healthcare-Products Equity Long 96 788 426 585 142Healthcare-Products Equity Short 66 641 345 192 895Healthcare-Services Equity Long 84 430 713 92 406Healthcare-Services Equity Short 56 356 267 (558 146)Holding Companies-Divers Equity Long 1 483 355 (8 825)Holding Companies-Divers Equity Short 2 462 600 (6 529)Home Builders Equity Long 17 368 552 (11 812)Home Builders Equity Short 14 603 491 910 109

The accompanying notes form an integral part of these financial statements.
Schedule of Investments as at September 30, 2016 (cont.)(expressed in USD)
Merrill Lynch Investment Solutions – AQR Global Relative Value UCITS Fund
103Merrill Lynch Investment Solutions
Unaudited semi-annual report
Industrial sector Underlying nature Long/ShortCommitment
USD
Unrealised appreciation/
(depreciation)USD
Home Furnishings Equity Long 15 708 989 (1 097 150)Home Furnishings Equity Short 2 176 214 461 567Household Products/Wares Equity Long 15 237 259 (183 777)Household Products/Wares Equity Short 4 164 021 (196 271)Housewares Equity Long 5 146 123 (4 186)Housewares Equity Short 7 240 778 10 255Insurance Equity Long 113 393 100 1 760 277Insurance Equity Short 57 328 799 (762 934)Internet Equity Long 30 796 642 1 195 607Internet Equity Short 44 643 193 (1 097 707)Investment Companies Equity Long 3 017 234 72 632Investment Companies Equity Short 2 461 952 (25 654)Iron/Steel Equity Long 20 918 436 5 800Iron/Steel Equity Short 7 564 465 (393 462)Leisure Time Equity Long 5 581 600 185 875Leisure Time Equity Short 14 995 499 551 872Lodging Equity Long 6 867 303 (602 550)Lodging Equity Short 3 888 166 148 945Machinery-Constr&Mining Equity Long 3 719 787 172 779Machinery-Constr&Mining Equity Short 5 166 414 (284 008)Machinery-Diversified Equity Long 23 100 831 235 153Machinery-Diversified Equity Short 45 872 851 (1 612 980)Media Equity Long 18 143 632 (227 984)Media Equity Short 32 770 392 404 468Metal Fabricate/Hardware Equity Long 4 141 223 172 611Metal Fabricate/Hardware Equity Short 671 748 44 569Mining Equity Long 9 479 997 (624 210)Mining Equity Short 20 587 745 238 025Miscellaneous Manufactur Equity Long 44 067 698 305 305Miscellaneous Manufactur Equity Short 26 694 447 263 868Office Furnishings Equity Long 4 257 167 (697 904)Office/Business Equip Equity Long 6 020 300 237 788Oil&Gas Services Equity Long 11 748 573 20 333Oil&Gas Services Equity Short 30 265 271 (908 362)Oil&Gas Equity Long 60 606 784 989 668Oil&Gas Equity Short 64 059 100 (2 930 198)Packaging&Containers Equity Long 21 511 665 634 067Packaging&Containers Equity Short 22 223 760 (703 818)Pharmaceuticals Equity Long 72 191 112 (1 265 426)Pharmaceuticals Equity Short 41 354 332 555 189Pipelines Equity Long 15 795 868 318 493Pipelines Equity Short 32 340 703 (758 287)Real Estate Equity Long 3 127 947 (13 418)Real Estate Equity Short 7 545 859 (30 157)REITS Equity Long 10 267 685 (150 597)
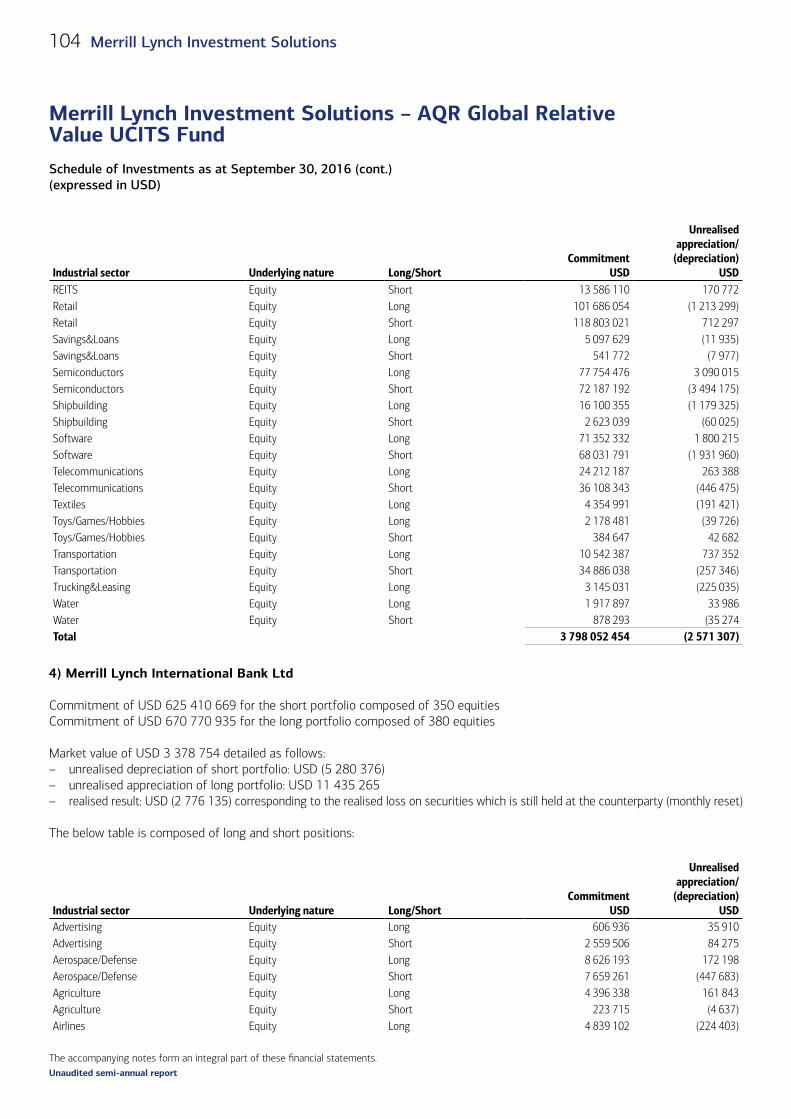
The accompanying notes form an integral part of these financial statements.
Schedule of Investments as at September 30, 2016 (cont.)(expressed in USD)
Merrill Lynch Investment Solutions – AQR Global Relative Value UCITS Fund
104 Merrill Lynch Investment Solutions
Unaudited semi-annual report
Industrial sector Underlying nature Long/ShortCommitment
USD
Unrealised appreciation/
(depreciation)USD
REITS Equity Short 13 586 110 170 772Retail Equity Long 101 686 054 (1 213 299)Retail Equity Short 118 803 021 712 297Savings&Loans Equity Long 5 097 629 (11 935)Savings&Loans Equity Short 541 772 (7 977)Semiconductors Equity Long 77 754 476 3 090 015Semiconductors Equity Short 72 187 192 (3 494 175)Shipbuilding Equity Long 16 100 355 (1 179 325)Shipbuilding Equity Short 2 623 039 (60 025)Software Equity Long 71 352 332 1 800 215Software Equity Short 68 031 791 (1 931 960)Telecommunications Equity Long 24 212 187 263 388Telecommunications Equity Short 36 108 343 (446 475)Textiles Equity Long 4 354 991 (191 421)Toys/Games/Hobbies Equity Long 2 178 481 (39 726)Toys/Games/Hobbies Equity Short 384 647 42 682Transportation Equity Long 10 542 387 737 352Transportation Equity Short 34 886 038 (257 346)Trucking&Leasing Equity Long 3 145 031 (225 035)Water Equity Long 1 917 897 33 986Water Equity Short 878 293 (35 274Total 3 798 052 454 (2 571 307)
4) Merrill Lynch International Bank Ltd
Commitment of USD 625 410 669 for the short portfolio composed of 350 equitiesCommitment of USD 670 770 935 for the long portfolio composed of 380 equities
Market value of USD 3 378 754 detailed as follows:– unrealised depreciation of short portfolio: USD (5 280 376)– unrealised appreciation of long portfolio: USD 11 435 265– realised result: USD (2 776 135) corresponding to the realised loss on securities which is still held at the counterparty (monthly reset)
The below table is composed of long and short positions:
Industrial sector Underlying nature Long/ShortCommitment
USD
Unrealised appreciation/
(depreciation)USD
Advertising Equity Long 606 936 35 910Advertising Equity Short 2 559 506 84 275Aerospace/Defense Equity Long 8 626 193 172 198Aerospace/Defense Equity Short 7 659 261 (447 683)Agriculture Equity Long 4 396 338 161 843Agriculture Equity Short 223 715 (4 637)Airlines Equity Long 4 839 102 (224 403)

The accompanying notes form an integral part of these financial statements.
Schedule of Investments as at September 30, 2016 (cont.)(expressed in USD)
Merrill Lynch Investment Solutions – AQR Global Relative Value UCITS Fund
105Merrill Lynch Investment Solutions
Unaudited semi-annual report
Industrial sector Underlying nature Long/ShortCommitment
USD
Unrealised appreciation/
(depreciation)USD
Airlines Equity Short 908 144 21 167Apparel Equity Long 1 538 831 10 356Apparel Equity Short 10 230 057 430 978Auto Manufacturers Equity Long 29 206 130 (175 386)Auto Manufacturers Equity Short 27 135 536 66 600Auto Parts&Equipment Equity Long 37 307 852 845 960Auto Parts&Equipment Equity Short 12 812 651 168 550Banks Equity Long 42 725 038 (968 144)Banks Equity Short 52 010 351 325 772Beverages Equity Long 4 671 408 150 343Beverages Equity Short 15 762 174 53 626Biotechnology Equity Long 1 486 611 24 782Building Materials Equity Long 5 475 381 61 020Building Materials Equity Short 9 701 760 (122 265)Chemicals Equity Long 55 510 623 1 337 288Chemicals Equity Short 33 316 279 136 290Commercial Services Equity Long 13 484 948 (39 557)Commercial Services Equity Short 12 257 973 (380 155)Computers Equity Long 25 842 920 860 691Computers Equity Short 2 453 173 112 829Cosmetics/Personal Care Equity Long 9 647 596 130 417Cosmetics/Personal Care Equity Short 12 414 718 (447 802)Distribution/Wholesale Equity Long 9 184 883 342 904Distribution/Wholesale Equity Short 990 826 (33 691)Diversified Financial Services Equity Long 7 541 991 280 098Diversified Financial Services Equity Short 13 615 556 1 075 401Electrical Compo&Equip Equity Long 14 523 811 820 314Electrical Compo&Equip Equity Short 11 690 771 (367 222)Electric Equity Long 25 944 806 528 770Electric Equity Short 20 894 861 (183 144)Electronics Equity Long 14 685 556 580 973Electronics Equity Short 25 106 823 (1 030 154)Energy-Alternate Sources Equity Long 3 172 338 (37 003)Energy-Alternate Sources Equity Short 698 093 (35 895)Engineering&Construction Equity Long 28 384 348 767 478Engineering&Construction Equity Short 5 320 635 61 757Entertainment Equity Long 2 854 249 (141 445)Entertainment Equity Short 2 786 344 (74 514)Environmental Control Equity Long 731 645 31 531Food Service Equity Long 879 960 15 891Food Equity Long 38 602 003 493 419Food Equity Short 36 853 652 574 881Forest Products&Paper Equity Long 4 630 727 44 864Forest Products&Paper Equity Short 57 575 1 457Gas Equity Long 7 738 358 129 968

The accompanying notes form an integral part of these financial statements.
Schedule of Investments as at September 30, 2016 (cont.)(expressed in USD)
Merrill Lynch Investment Solutions – AQR Global Relative Value UCITS Fund
106 Merrill Lynch Investment Solutions
Unaudited semi-annual report
Industrial sector Underlying nature Long/ShortCommitment
USD
Unrealised appreciation/
(depreciation)USD
Gas Equity Short 2 169 442 (11 364)Hand/Machine Tools Equity Long 2 155 726 (7 092)Hand/Machine Tools Equity Short 7 664 828 (55 365)Healthcare-Products Equity Long 5 408 411 (300 060)Healthcare-Products Equity Short 10 840 724 (352 835)Healthcare-Services Equity Long 2 451 659 45 031Healthcare-Services Equity Short 2 614 764 (175 682)Holding Companies-Divers Equity Short 1 555 302 111 005Home Builders Equity Long 153 424 (2 862)Home Builders Equity Short 1 460 326 (63 937)Home Furnishings Equity Long 13 111 029 (148 941)Household Products/Wares Equity Long 1 209 921 (13 326)Household Products/Wares Equity Short 235 517 (5 937)Insurance Equity Long 47 376 910 1 263 583Insurance Equity Short 15 590 839 (175 383)Internet Equity Long 172 183 1 754Internet Equity Short 21 835 109 (537 286)Iron/Steel Equity Long 3 759 139 156 366Iron/Steel Equity Short 14 535 215 (24 382)Leisure Time Equity Long 3 620 106 82 507Leisure Time Equity Short 9 513 040 (265 088)Lodging Equity Long 123 619 (1 604)Lodging Equity Short 4 138 490 (129 561)Machinery-Constr&Mining Equity Long 5 149 084 (10 298)Machinery-Constr&Mining Equity Short 2 996 953 (87 058)Machinery-Diversified Equity Long 11 573 767 281 131Machinery-Diversified Equity Short 16 702 609 (361 319)Media Equity Long 12 198 917 115 222Media Equity Short 13 580 456 (493 284)Metal Fabricate/Hardware Equity Long 3 680 796 177 026Metal Fabricate/Hardware Equity Short 12 989 539 (288 724)Mining Equity Long 2 585 734 214 497Mining Equity Short 5 080 233 (310 183)Miscellaneous Manufactur Equity Long 4 586 235 (42 274)Miscellaneous Manufactur Equity Short 4 892 061 19 170Office/Business Equip Equity Long 4 393 814 87 628Office/Business Equip Equity Short 6 627 693 131 466Oil&Gas Services Equity Long 1 208 208 (86 602)Oil&Gas Services Equity Short 9 269 463 56 015Oil&Gas Equity Long 5 724 160 153 403Oil&Gas Equity Short 10 057 753 (249 838)Packaging&Containers Equity Long 2 350 115 (58 401)Pharmaceuticals Equity Long 46 379 594 897 203Pharmaceuticals Equity Short 12 646 053 (412 603)Pipelines Equity Short 1 720 607 (76 718)

The accompanying notes form an integral part of these financial statements.
Schedule of Investments as at September 30, 2016 (cont.)(expressed in USD)
Merrill Lynch Investment Solutions – AQR Global Relative Value UCITS Fund
107Merrill Lynch Investment Solutions
Unaudited semi-annual report
Industrial sector Underlying nature Long/ShortCommitment
USD
Unrealised appreciation/
(depreciation)USD
Retail Equity Long 17 891 154 310 796Retail Equity Short 49 000 791 (13 986)Semiconductors Equity Long 8 015 273 387 884Semiconductors Equity Short 5 532 921 221 216Software Equity Long 14 196 084 859 970Software Equity Short 9 648 142 (989 244)Storage/Warehousing Equity Short 1 776 764 82 042Telecommunications Equity Long 17 807 377 269 588Telecommunications Equity Short 27 844 827 (515 673)Toys/Games/Hobbies Equity Long 6 364 080 440 126Toys/Games/Hobbies Equity Short 814 452 (133 625)Transportation Equity Long 19 800 491 (84 180)Transportation Equity Short 24 615 322 (158 636)Water Equity Long 3 083 342 206 108Total 1 296 181 603 6 154 887
5) Morgan Stanley Capital Services Inc.
Commitment of USD 160 343 for the short portfolio composed of 1 equityCommitment of USD 3 097 983 for the long portfolio composed of 3 equities
Market value of USD 40 904 detailed as follows:– unrealised depreciation of long portfolio: USD (23 983)– realised result: USD 64 887 corresponding to the realised gain on securities which is still held at the counterparty (monthly reset)
The below table is composed of long and short positions:
Industrial sector Underlying nature Long/ShortCommitment
USD
Unrealised appreciation/
(depreciation)USD
Banks Equity Long 1 805 418 (55 303)Commercial Services Equity Long 818 823 38 924Lodging Equity Long 473 742 (7 604)Telecommunications Equity Short 160 343 –Total 3 258 326 (23 983)
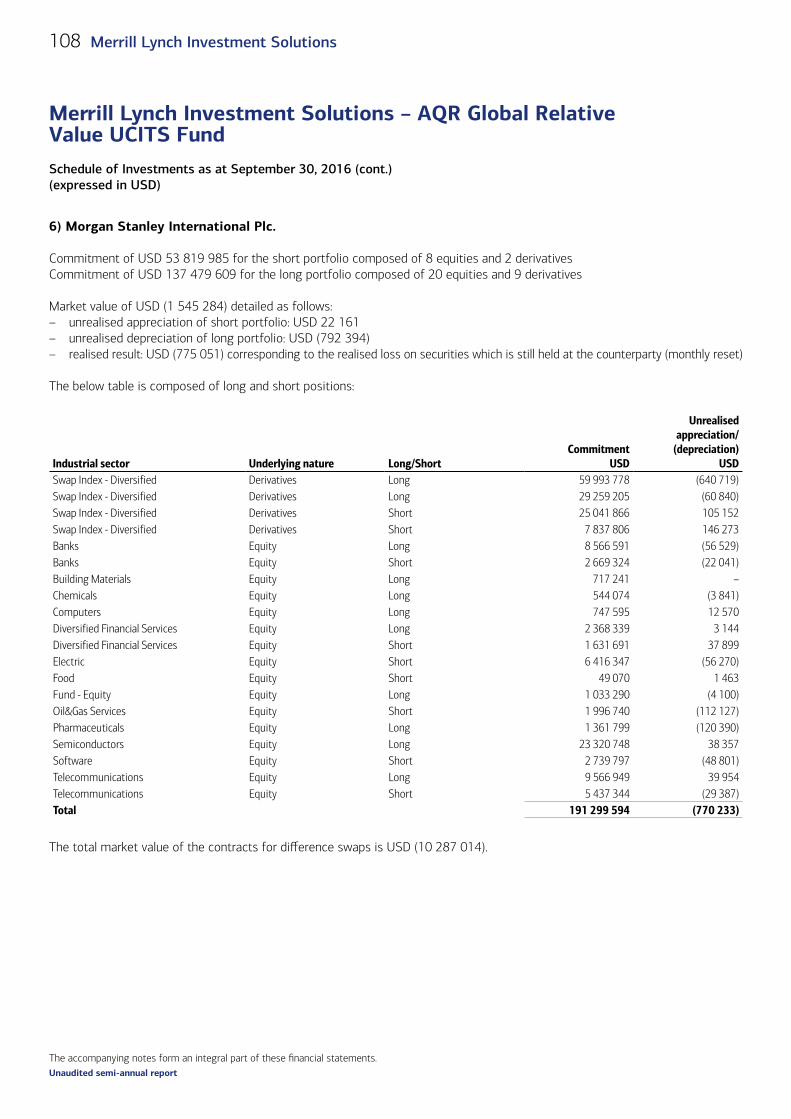
The accompanying notes form an integral part of these financial statements.
Schedule of Investments as at September 30, 2016 (cont.)(expressed in USD)
Merrill Lynch Investment Solutions – AQR Global Relative Value UCITS Fund
108 Merrill Lynch Investment Solutions
Unaudited semi-annual report
6) Morgan Stanley International Plc.
Commitment of USD 53 819 985 for the short portfolio composed of 8 equities and 2 derivativesCommitment of USD 137 479 609 for the long portfolio composed of 20 equities and 9 derivatives
Market value of USD (1 545 284) detailed as follows:– unrealised appreciation of short portfolio: USD 22 161– unrealised depreciation of long portfolio: USD (792 394)– realised result: USD (775 051) corresponding to the realised loss on securities which is still held at the counterparty (monthly reset)
The below table is composed of long and short positions:
Industrial sector Underlying nature Long/ShortCommitment
USD
Unrealised appreciation/
(depreciation)USD
Swap Index - Diversified Derivatives Long 59 993 778 (640 719)Swap Index - Diversified Derivatives Long 29 259 205 (60 840)Swap Index - Diversified Derivatives Short 25 041 866 105 152Swap Index - Diversified Derivatives Short 7 837 806 146 273Banks Equity Long 8 566 591 (56 529)Banks Equity Short 2 669 324 (22 041)Building Materials Equity Long 717 241 –Chemicals Equity Long 544 074 (3 841)Computers Equity Long 747 595 12 570Diversified Financial Services Equity Long 2 368 339 3 144Diversified Financial Services Equity Short 1 631 691 37 899Electric Equity Short 6 416 347 (56 270)Food Equity Short 49 070 1 463Fund - Equity Equity Long 1 033 290 (4 100)Oil&Gas Services Equity Short 1 996 740 (112 127)Pharmaceuticals Equity Long 1 361 799 (120 390)Semiconductors Equity Long 23 320 748 38 357Software Equity Short 2 739 797 (48 801)Telecommunications Equity Long 9 566 949 39 954Telecommunications Equity Short 5 437 344 (29 387)Total 191 299 594 (770 233)
The total market value of the contracts for difference swaps is USD (10 287 014).
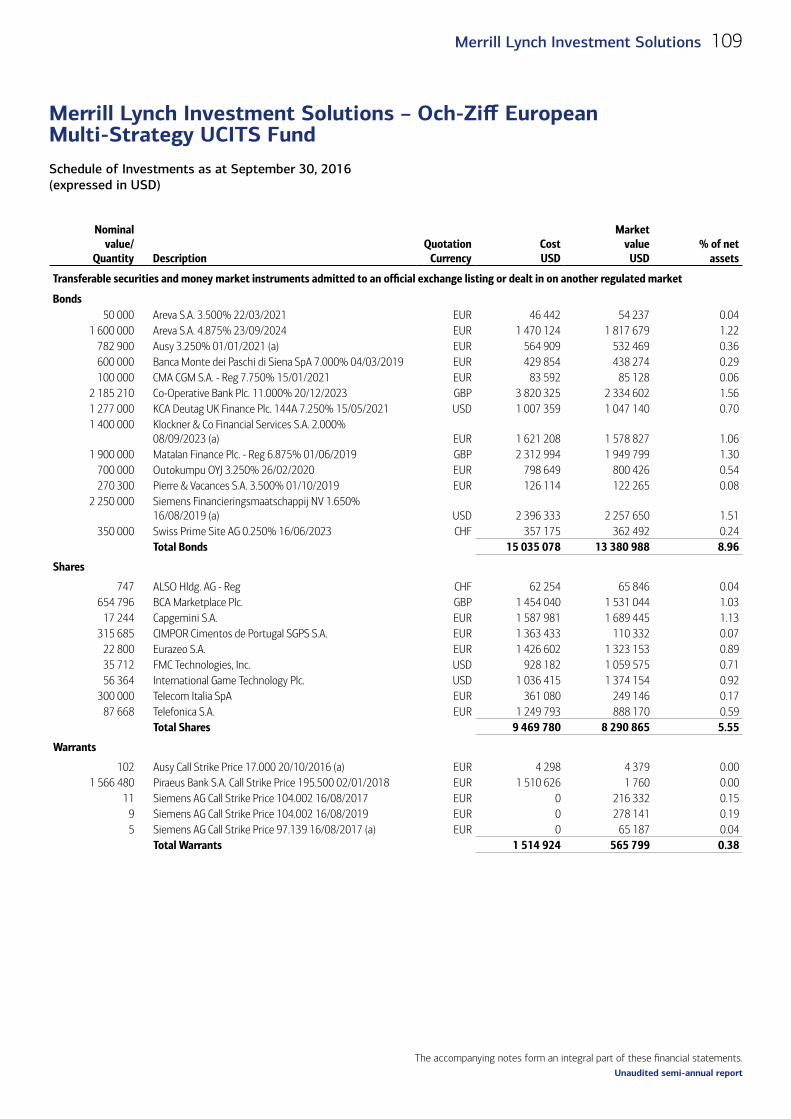
The accompanying notes form an integral part of these financial statements.
Schedule of Investments as at September 30, 2016 (expressed in USD)
Merrill Lynch Investment Solutions – Och-Ziff European Multi-Strategy UCITS Fund
109Merrill Lynch Investment Solutions
Unaudited semi-annual report
Schedule of Investments as at September 30, 2016 (expressed in USD)
Nominal value/
Quantity DescriptionQuotation
CurrencyCost USD
Market value
USD% of net
assets
Transferable securities and money market instruments admitted to an official exchange listing or dealt in on another regulated market (cont.)
Bonds50 000 Areva S.A. 3.500% 22/03/2021 EUR 46 442 54 237 0.04
1 600 000 Areva S.A. 4.875% 23/09/2024 EUR 1 470 124 1 817 679 1.22782 900 Ausy 3.250% 01/01/2021 (a) EUR 564 909 532 469 0.36600 000 Banca Monte dei Paschi di Siena SpA 7.000% 04/03/2019 EUR 429 854 438 274 0.29100 000 CMA CGM S.A. - Reg 7.750% 15/01/2021 EUR 83 592 85 128 0.06
2 185 210 Co-Operative Bank Plc. 11.000% 20/12/2023 GBP 3 820 325 2 334 602 1.561 277 000 KCA Deutag UK Finance Plc. 144A 7.250% 15/05/2021 USD 1 007 359 1 047 140 0.701 400 000 Klockner & Co Financial Services S.A. 2.000%
08/09/2023 (a) EUR 1 621 208 1 578 827 1.061 900 000 Matalan Finance Plc. - Reg 6.875% 01/06/2019 GBP 2 312 994 1 949 799 1.30
700 000 Outokumpu OYJ 3.250% 26/02/2020 EUR 798 649 800 426 0.54270 300 Pierre & Vacances S.A. 3.500% 01/10/2019 EUR 126 114 122 265 0.08
2 250 000 Siemens Financieringsmaatschappij NV 1.650% 16/08/2019 (a) USD 2 396 333 2 257 650 1.51
350 000 Swiss Prime Site AG 0.250% 16/06/2023 CHF 357 175 362 492 0.24Total Bonds 15 035 078 13 380 988 8.96
Shares
747 ALSO Hldg. AG - Reg CHF 62 254 65 846 0.04654 796 BCA Marketplace Plc. GBP 1 454 040 1 531 044 1.03
17 244 Capgemini S.A. EUR 1 587 981 1 689 445 1.13315 685 CIMPOR Cimentos de Portugal SGPS S.A. EUR 1 363 433 110 332 0.07
22 800 Eurazeo S.A. EUR 1 426 602 1 323 153 0.8935 712 FMC Technologies, Inc. USD 928 182 1 059 575 0.7156 364 International Game Technology Plc. USD 1 036 415 1 374 154 0.92
300 000 Telecom Italia SpA EUR 361 080 249 146 0.1787 668 Telefonica S.A. EUR 1 249 793 888 170 0.59
Total Shares 9 469 780 8 290 865 5.55
Warrants
102 Ausy Call Strike Price 17.000 20/10/2016 (a) EUR 4 298 4 379 0.001 566 480 Piraeus Bank S.A. Call Strike Price 195.500 02/01/2018 EUR 1 510 626 1 760 0.00
11 Siemens AG Call Strike Price 104.002 16/08/2017 EUR 0 216 332 0.159 Siemens AG Call Strike Price 104.002 16/08/2019 EUR 0 278 141 0.195 Siemens AG Call Strike Price 97.139 16/08/2017 (a) EUR 0 65 187 0.04
Total Warrants 1 514 924 565 799 0.38
Merrill Lynch Investment Solutions – Och-Ziff European Multi-Strategy UCITS Fund
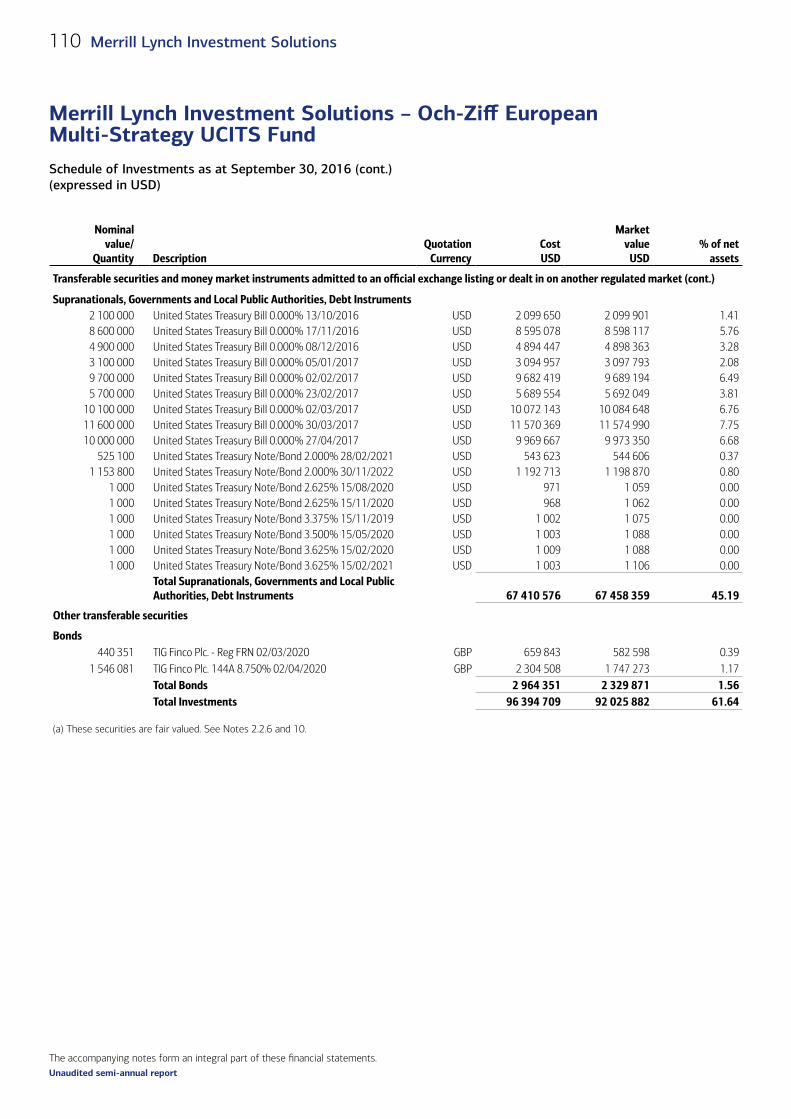
The accompanying notes form an integral part of these financial statements.
Schedule of Investments as at September 30, 2016 (cont.)(expressed in USD)
Merrill Lynch Investment Solutions – Och-Ziff European Multi-Strategy UCITS Fund
110 Merrill Lynch Investment Solutions
Unaudited semi-annual report
Nominal value/
Quantity DescriptionQuotation
CurrencyCost USD
Market value
USD% of net
assets
Transferable securities and money market instruments admitted to an official exchange listing or dealt in on another regulated market (cont.)
Supranationals, Governments and Local Public Authorities, Debt Instruments2 100 000 United States Treasury Bill 0.000% 13/10/2016 USD 2 099 650 2 099 901 1.418 600 000 United States Treasury Bill 0.000% 17/11/2016 USD 8 595 078 8 598 117 5.764 900 000 United States Treasury Bill 0.000% 08/12/2016 USD 4 894 447 4 898 363 3.283 100 000 United States Treasury Bill 0.000% 05/01/2017 USD 3 094 957 3 097 793 2.089 700 000 United States Treasury Bill 0.000% 02/02/2017 USD 9 682 419 9 689 194 6.495 700 000 United States Treasury Bill 0.000% 23/02/2017 USD 5 689 554 5 692 049 3.81
10 100 000 United States Treasury Bill 0.000% 02/03/2017 USD 10 072 143 10 084 648 6.7611 600 000 United States Treasury Bill 0.000% 30/03/2017 USD 11 570 369 11 574 990 7.7510 000 000 United States Treasury Bill 0.000% 27/04/2017 USD 9 969 667 9 973 350 6.68
525 100 United States Treasury Note/Bond 2.000% 28/02/2021 USD 543 623 544 606 0.371 153 800 United States Treasury Note/Bond 2.000% 30/11/2022 USD 1 192 713 1 198 870 0.80
1 000 United States Treasury Note/Bond 2.625% 15/08/2020 USD 971 1 059 0.001 000 United States Treasury Note/Bond 2.625% 15/11/2020 USD 968 1 062 0.001 000 United States Treasury Note/Bond 3.375% 15/11/2019 USD 1 002 1 075 0.001 000 United States Treasury Note/Bond 3.500% 15/05/2020 USD 1 003 1 088 0.001 000 United States Treasury Note/Bond 3.625% 15/02/2020 USD 1 009 1 088 0.001 000 United States Treasury Note/Bond 3.625% 15/02/2021 USD 1 003 1 106 0.00
Total Supranationals, Governments and Local Public Authorities, Debt Instruments 67 410 576 67 458 359 45.19
Other transferable securities
Bonds440 351 TIG Finco Plc. - Reg FRN 02/03/2020 GBP 659 843 582 598 0.39
1 546 081 TIG Finco Plc. 144A 8.750% 02/04/2020 GBP 2 304 508 1 747 273 1.17Total Bonds 2 964 351 2 329 871 1.56Total Investments 96 394 709 92 025 882 61.64
(a) These securities are fair valued. See Notes 2.2.6 and 10.

The accompanying notes form an integral part of these financial statements.
Schedule of Investments as at September 30, 2016 (cont.)(expressed in USD)
Merrill Lynch Investment Solutions – Och-Ziff European Multi-Strategy UCITS Fund
111Merrill Lynch Investment Solutions
Unaudited semi-annual report
Industrial classification of investments(as a percentage of net assets as at September 30, 2016) %
Geographical classification of investments(as a percentage of net assets as at September 30, 2016) %
Sovereign 45.19 United States 46.82 Computers 2.41 United Kingdom 6.15 Banks 1.85 France 3.78 Insurance 1.56 Netherlands 1.51 Miscellaneous Manufacturing 1.51 Luxembourg 1.06 Oil & Gas Services 1.41 Spain 0.59 Distribution/Wholesale 1.34 Finland 0.54 Machinery-Construction & Mining 1.26 Italy 0.46 Metal Fabricate/Hardware 1.06 Germany 0.38 Commercial Services 1.03 Switzerland 0.28 Private Equity 0.89 Portugal 0.07 Telecommunications 0.76 Greece 0.00Iron/Steel 0.54 61.64Electronics 0.38 Real Estate 0.24 Lodging 0.08 Building Materials 0.07 Transportation 0.06
61.64
Underlying nature
Currency contract
Details
Market
Maturity date
Number of contracts
bought
Number of contracts
soldCommitment
USD
Unrealised appreciation/
(depreciation) USD
Futures contracts Equity EUR Repsol S.A. Meff Renta Variable Madrid 16/12/2016 360 – 338 357 5 864Equity EUR Telefonica S.A. Meff Renta Variable Madrid 15/12/2017 132 – 89 534 4 049Index EUR CAC 40 10 Euro
Index Euronext Paris 21/10/2016 – 99 4 943 670 (63 421)Index EUR DAX Index Eurex Deutschland 16/12/2016 – 7 2 067 441 (37 687)Index EUR Euro Stoxx 50 Index Eurex Deutschland 16/12/2016 – 389 13 088 517 (80 261)Index GBP FTSE 100 Index ICE Futures Europe 16/12/2016 – 22 1 959 736 (32 501)Index EUR FTSE MIB Index Borsa Italiana 16/12/2016 – 42 3 860 219 (31 215)Index SEK OMX 30 Index OMX Nordic Exchange
Stockholm 21/10/2016 – 120 2 014 847 (36 683)Index USD S&P 500 E-Mini
Index Chicago Mercantile Exchange 16/12/2016 – 9 972 180 (19 985)Interest rate USD 5 Year US Treasury
Note Chicago Board of Trade 30/12/2016 – 1 121 516 (56)Interest rate EUR German Euro BOBL Eurex Deutschland 08/12/2016 – 30 4 453 282 (14 497)Total Futures contracts 33 909 299 (306 393)

The accompanying notes form an integral part of these financial statements.
Schedule of Investments as at September 30, 2016 (cont.)(expressed in USD)
Merrill Lynch Investment Solutions – Och-Ziff European Multi-Strategy UCITS Fund
112 Merrill Lynch Investment Solutions
Unaudited semi-annual report
Purchase
Sale
Maturity date Counterparty
Unrealised appreciation/
(depreciation) USD
Forward foreign exchange contractsUSD 534 390 CAD 700 000 03/10/2016 State Street Bank and Trust Co. 1 767DKK 2 000 000 USD 301 259 06/10/2016 State Street Bank and Trust Co. 613EUR 800 000 USD 895 510 06/10/2016 State Street Bank and Trust Co. 3 615MXN 20 300 000 USD 1 074 853 06/10/2016 State Street Bank and Trust Co. (26 204)USD 150 770 AUD 200 000 06/10/2016 State Street Bank and Trust Co. (2 277)USD 665 209 CHF 650 000 06/10/2016 State Street Bank and Trust Co. (5 384)USD 18 061 682 EUR 16 100 000 06/10/2016 State Street Bank and Trust Co. (33 201)USD 11 166 347 GBP 8 400 000 06/10/2016 State Street Bank and Trust Co. 254 220USD 644 756 HKD 5 000 000 06/10/2016 State Street Bank and Trust Co. 76USD 45 896 HUF 12 700 000 06/10/2016 State Street Bank and Trust Co. (282)EUR 295 702 USD 332 993 14/10/2016 State Street Bank and Trust Co. (525)CNH 107 224 000 USD 15 996 420 25/10/2016 State Street Bank and Trust Co. 55 567CHF 18 063 USD 18 678 31/10/2016 State Street Bank and Trust Co. (16)EUR 59 077 703 USD 66 514 108 31/10/2016 State Street Bank and Trust Co. (36 734)GBP 1 111 381 USD 1 441 689 31/10/2016 State Street Bank and Trust Co. 2 832USD 534 403 CAD 700 000 31/10/2016 State Street Bank and Trust Co. 1 658USD 59 CHF 57 31/10/2016 State Street Bank and Trust Co. 0USD 158 713 EUR 141 246 31/10/2016 State Street Bank and Trust Co. (224)USD 33 514 GBP 25 839 31/10/2016 State Street Bank and Trust Co. (70)CNH 47 632 593 USD 7 202 359 22/02/2017 State Street Bank and Trust Co. (119 808)USD 7 013 560 CNH 47 632 593 22/02/2017 State Street Bank and Trust Co. (68 991)CNH 8 300 000 USD 1 238 067 19/04/2017 State Street Bank and Trust Co. (7 411)USD 5 029 496 CNH 33 370 000 19/04/2017 State Street Bank and Trust Co. 81 668USD 15 510 635 CNH 102 973 626 27/04/2017 State Street Bank and Trust Co. 248 822Total forward foreign exchange contracts 349 711
Short/Long
Currency Description
Put/ Call
Strike Price
Maturity date Quantity
Market value
USDCommitment
USDOptions (cont.)Long CHF ABB Ltd. Call 22.000 17/03/2017 275 28 652 –Long EUR Airbus Group Call 60.000 20/12/2019 40 29 983 –Long EUR Airbus Group Put 52.000 20/12/2019 40 51 110 –Short EUR Altice NV Call 13.540 18/12/2020 (162 000) (1 180 441) 2 465 033*Long EUR Altice NV Call 20.000 18/12/2020 232 000 1 010 049 –Short EUR Altice NV Put 10.000 18/12/2020 (232 000) (539 771) 2 607 216Long EUR Altice NV Put 13.540 18/12/2020 162 000 678 863 –Long EUR BASF SE Put 60.000 20/12/2019 55 46 048 –Long EUR BASF SE Put 68.000 20/12/2019 176 221 721 –Long EUR BASF SE Put 60.000 18/12/2020 301 337 249 –Long EUR Cie de Saint-Gobain Call 48.000 21/12/2018 263 52 905 –Short EUR Daimler AG Put 52.000 16/12/2016 (440) (24 724) 2 571 254Long EUR Daimler AG Put 48.000 18/12/2020 268 271 061 –Long EUR Daimler AG Put 52.000 18/12/2020 578 719 059 –
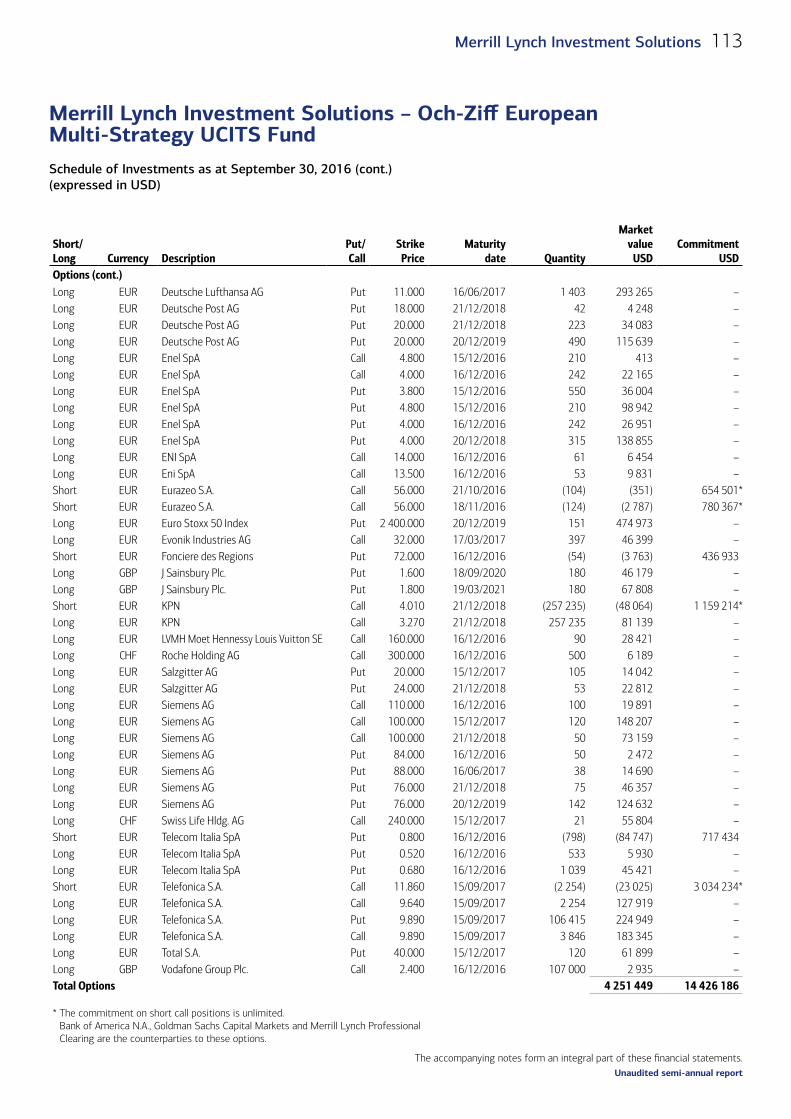
The accompanying notes form an integral part of these financial statements.
Schedule of Investments as at September 30, 2016 (cont.)(expressed in USD)
Merrill Lynch Investment Solutions – Och-Ziff European Multi-Strategy UCITS Fund
113Merrill Lynch Investment Solutions
Unaudited semi-annual report
Short/Long
Currency Description
Put/ Call
Strike Price
Maturity date Quantity
Market value
USDCommitment
USDOptions (cont.)Long EUR Deutsche Lufthansa AG Put 11.000 16/06/2017 1 403 293 265 –Long EUR Deutsche Post AG Put 18.000 21/12/2018 42 4 248 –Long EUR Deutsche Post AG Put 20.000 21/12/2018 223 34 083 –Long EUR Deutsche Post AG Put 20.000 20/12/2019 490 115 639 –Long EUR Enel SpA Call 4.800 15/12/2016 210 413 –Long EUR Enel SpA Call 4.000 16/12/2016 242 22 165 –Long EUR Enel SpA Put 3.800 15/12/2016 550 36 004 –Long EUR Enel SpA Put 4.800 15/12/2016 210 98 942 –Long EUR Enel SpA Put 4.000 16/12/2016 242 26 951 –Long EUR Enel SpA Put 4.000 20/12/2018 315 138 855 –Long EUR ENI SpA Call 14.000 16/12/2016 61 6 454 –Long EUR Eni SpA Call 13.500 16/12/2016 53 9 831 –Short EUR Eurazeo S.A. Call 56.000 21/10/2016 (104) (351) 654 501*Short EUR Eurazeo S.A. Call 56.000 18/11/2016 (124) (2 787) 780 367*Long EUR Euro Stoxx 50 Index Put 2 400.000 20/12/2019 151 474 973 –Long EUR Evonik Industries AG Call 32.000 17/03/2017 397 46 399 –Short EUR Fonciere des Regions Put 72.000 16/12/2016 (54) (3 763) 436 933Long GBP J Sainsbury Plc. Put 1.600 18/09/2020 180 46 179 –Long GBP J Sainsbury Plc. Put 1.800 19/03/2021 180 67 808 –Short EUR KPN Call 4.010 21/12/2018 (257 235) (48 064) 1 159 214*Long EUR KPN Call 3.270 21/12/2018 257 235 81 139 –Long EUR LVMH Moet Hennessy Louis Vuitton SE Call 160.000 16/12/2016 90 28 421 –Long CHF Roche Holding AG Call 300.000 16/12/2016 500 6 189 –Long EUR Salzgitter AG Put 20.000 15/12/2017 105 14 042 –Long EUR Salzgitter AG Put 24.000 21/12/2018 53 22 812 –Long EUR Siemens AG Call 110.000 16/12/2016 100 19 891 –Long EUR Siemens AG Call 100.000 15/12/2017 120 148 207 –Long EUR Siemens AG Call 100.000 21/12/2018 50 73 159 –Long EUR Siemens AG Put 84.000 16/12/2016 50 2 472 –Long EUR Siemens AG Put 88.000 16/06/2017 38 14 690 –Long EUR Siemens AG Put 76.000 21/12/2018 75 46 357 –Long EUR Siemens AG Put 76.000 20/12/2019 142 124 632 –Long CHF Swiss Life Hldg. AG Call 240.000 15/12/2017 21 55 804 –Short EUR Telecom Italia SpA Put 0.800 16/12/2016 (798) (84 747) 717 434Long EUR Telecom Italia SpA Put 0.520 16/12/2016 533 5 930 –Long EUR Telecom Italia SpA Put 0.680 16/12/2016 1 039 45 421 –Short EUR Telefonica S.A. Call 11.860 15/09/2017 (2 254) (23 025) 3 034 234*Long EUR Telefonica S.A. Call 9.640 15/09/2017 2 254 127 919 –Long EUR Telefonica S.A. Put 9.890 15/09/2017 106 415 224 949 –Long EUR Telefonica S.A. Call 9.890 15/09/2017 3 846 183 345 –Long EUR Total S.A. Put 40.000 15/12/2017 120 61 899 –Long GBP Vodafone Group Plc. Call 2.400 16/12/2016 107 000 2 935 –Total Options 4 251 449 14 426 186
* The commitment on short call positions is unlimited. Bank of America N.A., Goldman Sachs Capital Markets and Merrill Lynch Professional Clearing are the counterparties to these options.

The accompanying notes form an integral part of these financial statements.
Schedule of Investments as at September 30, 2016 (cont.)(expressed in USD)
Merrill Lynch Investment Solutions – Och-Ziff European Multi-Strategy UCITS Fund
114 Merrill Lynch Investment Solutions
Unaudited semi-annual report
Notional
Pay
Receive
Currency
Maturity date Counterparty
Unrealised appreciation/
(depreciation) USD
Commitment USD
Credit default swaps (cont.)430 000 Fixed 1% Hungary Government
Bond 4.750% 03/02/20151 USD 21/06/2019 Barclays Bank Plc. (4 849) 430 000
258 000 Fixed 1% Hungary Government Bond 6.250% 29/01/2020 USD 21/06/2019 Barclays Bank Plc. (2 362) 258 000
510 000 Fixed 1% Hungary Government Bond 4.750% 03/02/20151 USD 21/06/2019 Barclays Bank Plc. (11 426) 510 000
360 000 Fixed 1% Hungary Government Bond 4.750% 03/02/20151 USD 21/06/2019 Barclays Bank Plc. (7 738) 360 000
260 000 Fixed 1% Hungary Government Bond 4.750% 03/02/20151 USD 21/06/2019 JP Morgan Chase Bank N.A. (5 515) 260 000
230 000 Fixed 1% Hungary Government Bond 4.750% 03/02/20151 USD 21/06/2019 JP Morgan Chase Bank N.A. (4 578) 230 000
913 000 Fixed 1% BP Cap Markets America 4.200% 15/06/2018 EUR 21/12/2021 Société Générale (3 167) 913 000
1 113 000 Fixed 1% Repsol International Finance BV 4.875% 19/02/2019 EUR 21/12/2021 Société Générale (8 791) 1 113 000
1 226 000 Fixed 1% Shell International Finance BV 5.200% 22/03/2017 EUR 21/12/2021 Bank of America N.A. (5 225) 1 226 000
1 426 000 Fixed 1% Statoil ASA 3.125% 17/08/2017 EUR 21/12/2021 Bank of America N.A. (3 808) 1 426 000
350 000 Fixed 1% Technip 5.000% 12/08/20161 EUR 21/12/2021 Bank of America N.A. (2 781) 350 000
490 000 Fixed 1% Technip 5.000% 12/08/20161 EUR 21/12/2021 Barclays Bank Plc. (3 893) 490 000
1 226 000 Fixed 1% Total Capital S.A. 4.875% 28/01/2019 EUR 21/12/2021 Bank of America N.A. (5 398) 1 226 000
695 000 Fixed 5% Beni Stabili SpA SIIQ 4.125% 22/01/2018 EUR 21/06/2021 Credit Suisse International 14 706 695 000
202 000 Fixed 5% New Look Senior Issuer Plc. 8.000% 01/07/2023 EUR 21/06/2021 Credit Suisse International 17 203 202 000
217 000 Fixed 5% New Look Senior Issuer Plc. 8.000% 01/07/2023 EUR 21/06/2021 Goldman Sachs 23 497 217 000
112 000 Fixed 5% New Look Senior Issuer Plc. 8.000% 01/07/2023 EUR 21/06/2021 Goldman Sachs 10 205 112 000
1 271 787 Fixed 5% Markit iTraxx Europe Crossover Index 26v1 EUR 21/12/2021
Merrill Lynch, Pierce, Fenner and Smith, Inc. (7 294) 1 271 787
37 000 Fixed 5% Beni Stabili SpA SIIQ 4.125% 22/01/2018 EUR 21/03/2018
Morgan Stanley Capital Services LLC 2 299 37 000
684 000 Fixed 5% Alcatel-Lucent 8.500% 15/01/20161 EUR 21/03/2019
Credit Suisse Securities Ltd. (14 825) 684 000

The accompanying notes form an integral part of these financial statements.
Schedule of Investments as at September 30, 2016 (cont.)(expressed in USD)
Merrill Lynch Investment Solutions – Och-Ziff European Multi-Strategy UCITS Fund
115Merrill Lynch Investment Solutions
Unaudited semi-annual report
Notional
Pay
Receive
Currency
Maturity date Counterparty
Unrealised appreciation/
(depreciation) USD
Commitment USD
Credit default swaps (cont.)(500 000) Siemens
Financieringsmaatschappij NV 5.625% 11/06/2018 Fixed 1% USD 21/12/2019 Credit Suisse International (2 963) 500 000
(500 000) Siemens Financieringsmaatschappij NV 5.625% 11/06/2018 Fixed 1% USD 21/12/2019
Credit Suisse Securities Ltd. (2 259) 500 000
Total Credit default swaps (28 962) 13 010 787
1 When the underlying of the credit default swap matures, it will roll into the next available version of the credit protection.The maximum individual counterparty exposure for OTC Derivatives as at September 30, 2016 is 4.63% of the NAV.
Contracts for difference swaps
The Sub-Fund Merrill Lynch Investment Solutions - Och-Ziff European Multi-Strategy UCITS Fund entered into contracts for difference swaps with thirteen counterparties (Bank of America N.A., Barclays Bank Plc., BNP Paribas, Citibank NA, Credit Suisse Securities (Europe) Limited, Credit Suisse International, Deutsche Bank AG, Goldman Sachs International, HSBC Bank Plc., JPMorgan Chase Bank NA, Morgan Stanley Capital Services Inc., Societe Generale and UBS AG.) with the following details:
1) Bank of America N.A.
Commitment of USD 17 870 604 for the short portfolio composed of 29 equitiesCommitment of USD 28 090 789 for the long portfolio composed of 9 equities
Market value of USD 1 130 444 detailed as follows:– unrealised appreciation of short portfolio: USD 430 478– unrealised appreciation of long portfolio: USD 489 963– realised result: USD 210 003 corresponding to the realised gain on securities which is still held at the counterparty (monthly reset)
The below table is composed of long and short positions:
Industrial sector Underlying nature Long/ShortCommitment
USD
Unrealised appreciation/
(depreciation)USD
Diversified Financial Services Bond Long 2 532 596 (43 154)Food Bond Long 882 476 45 956Mining Bond Long 1 728 494 (172 413)Real Estate Bond Long 3 669 311 6 956Telecommunications Bond Long 7 419 227 (140 166)Aerospace/Defense Equity Short 2 057 (22)Airlines Equity Long 6 049 087 74 283Airlines Equity Short 130 628 35 931Banks Equity Short 105 322 84 491Biotechnology Equity Short 23 640 6 635Electric Equity Short 52 452 (8 830)Food Equity Short 407 152 32 280

The accompanying notes form an integral part of these financial statements.
Schedule of Investments as at September 30, 2016 (cont.)(expressed in USD)
Merrill Lynch Investment Solutions – Och-Ziff European Multi-Strategy UCITS Fund
116 Merrill Lynch Investment Solutions
Unaudited semi-annual report
Industrial sector Underlying nature Long/ShortCommitment
USD
Unrealised appreciation/
(depreciation)USD
Hand/Machine Tools Equity Short 23 446 6 166Healthcare-Products Equity Short 2 227 627 (54 364)Insurance Equity Short 153 310 (6 608)Internet Equity Short 12 551 2 462Investment Companies Equity Long 965 778 (12 270)Investment Companies Equity Short 57 624 18 916Iron/Steel Equity Short 376 979 17 106Machinery-Constr&Mining Equity Short 119 452 24 887Oil&Gas Services Equity Short 23 680 1 687Oil&Gas Equity Short 263 349 71 224Pharmaceuticals Equity Long 26 363 (288)Pharmaceuticals Equity Short 891 547 42 189Real Estate Equity Short 2 063 571 (117 548)Retail Equity Long 4 817 457 731 059Retail Equity Short 5 582 354 (492 859)Semiconductors Equity Short 478 (45)Software Equity Short 60 678 4 164Telecommunications Equity Short 5 292 707 762 616Total 45 961 393 920 441
2) Barclays Bank Plc.
Commitment of USD 3 758 863 for the short portfolio composed of 13 equitiesCommitment of USD 5 655 618 for the long portfolio composed of 5 equities
Market value of USD (95 156) detailed as follows:– unrealised depreciation of short portfolio: USD (58 835)– unrealised appreciation of long portfolio: USD 119 796– realised result: USD (156 117) corresponding to the realised loss on securities which is still held at the counterparty (monthly reset)
The below table is composed of long and short positions:
Industrial sector Underlying nature Long/ShortCommitment
USD
Unrealised appreciation/
(depreciation)USD
Airlines Equity Short 4 946 3 190Banks Equity Long 175 –Banks Equity Short 19 980 (41)Chemicals Equity Short 1 716 978 (126 630)Computers Equity Short 15 555 11Diversified Financial Services Equity Short 66 719 5 992Energy-Alternate Sources Equity Long 1 858 680 61 996Hand/Machine Tools Equity Short 30 217 33 033Insurance Equity Long 20 218 5 346

The accompanying notes form an integral part of these financial statements.
Schedule of Investments as at September 30, 2016 (cont.)(expressed in USD)
Merrill Lynch Investment Solutions – Och-Ziff European Multi-Strategy UCITS Fund
117Merrill Lynch Investment Solutions
Unaudited semi-annual report
Industrial sector Underlying nature Long/ShortCommitment
USD
Unrealised appreciation/
(depreciation)USD
Insurance Equity Short 891 691 (100 013)Internet Equity Short 6 278 1 231Metal Fabricate/Hardware Equity Short 952 395 91 585Oil&Gas Services Equity Short 25 626 29 831Oil&Gas Equity Long 238 771 23 729Pharmaceuticals Equity Long 3 537 774 28 725Software Equity Short 28 478 2 976Total 9 414 481 60 961
3) BNP Paribas
Commitment of USD 2 632 157 for the short portfolio composed of 7 equitiesCommitment of USD 5 219 634 for the long portfolio composed of 5 equities
Market value of USD 195 528 detailed as follows:– unrealised appreciation of short portfolio: USD 4 318– unrealised appreciation of long portfolio: USD 43 276– realised result: USD 147 934 corresponding to the realised gain on securities which is still held at the counterparty (monthly reset)
The below table is composed of long and short positions:
Industrial sector Underlying nature Long/ShortCommitment
USD
Unrealised appreciation/
(depreciation)USD
Apparel Bond Short 503 15REITS Bond Long 2 012 320 (15 833)Sovereign Bond Long 1 117 788 (54 632)Telecommunications Bond Long 2 089 526 113 741Computers Equity Short 990 114 2 421Investment Companies Equity Short 80 663 31 774Mining Equity Short 6 066 1 842Oil&Gas Services Equity Short 205 052 10 021Oil&Gas Equity Short 4 368 1 938Telecommunications Equity Short 1 345 391 (43 693)Total 7 851 791 47 594

The accompanying notes form an integral part of these financial statements.
Schedule of Investments as at September 30, 2016 (cont.)(expressed in USD)
Merrill Lynch Investment Solutions – Och-Ziff European Multi-Strategy UCITS Fund
118 Merrill Lynch Investment Solutions
Unaudited semi-annual report
4) Citibank NA
Commitment of USD 22 790 907 for the short portfolio composed of 25 equitiesCommitment of USD 23 524 480 for the long portfolio composed of 13 equities
Market value of USD 617 163 detailed as follows:– unrealised depreciation of short portfolio: USD (625 457)– unrealised appreciation of long portfolio: USD 1 363 854– realised result: USD (121 234) corresponding to the realised loss on securities which is still held at the counterparty (monthly reset)
The below table is composed of long and short positions:
Industrial sector Underlying nature Long/ShortCommitment
USD
Unrealised appreciation/
(depreciation)USD
Airlines Bond Long 1 392 803 (184 572)Computers Bond Long 255 665 9 552Hand/Machine Tools Bond Long 451 872 20 233Lodging Bond Long 145 469 (11 746)Oil&Gas Bond Long 863 065 179 389Telecommunications Bond Long 17 350 405 1 240 889Airlines Equity Short 242 924 42 139Auto Manufacturers Equity Long 1 785 305 86 542Banks Equity Short 175 790 (2 260)Biotechnology Equity Short 23 640 7 544Chemicals Equity Long 816 327 22 251Chemicals Equity Short 3 573 483 (7 364)Computers Equity Short 259 733 1 621Electric Equity Short 1 403 659 (9 549)Food Equity Short 546 765 28 078Fund - Equity Equity Short 3 784 041 (190 796)Hand/Machine Tools Equity Short 14 600 9 294Home Furnishings Equity Long 192 724 (4 535)Internet Equity Short 23 889 23 688Iron/Steel Equity Short 17 276 (10 213)Lodging Equity Long 6 762 (119)Machinery-Constr&Mining Equity Short 206 001 61 158Mining Equity Short 77 629 (33 775)Oil&Gas Services Equity Long 264 083 5 970Oil&Gas Services Equity Short 59 200 3 677Oil&Gas Equity Short 188 544 14 591Real Estate Equity Short 231 (2)REITS Equity Short 332 554 33 162Semiconductors Equity Short 2 388 (223)Software Equity Short 29 700 2 729Telecommunications Equity Short 11 828 860 (598 956)Total 46 315 387 738 397

The accompanying notes form an integral part of these financial statements.
Schedule of Investments as at September 30, 2016 (cont.)(expressed in USD)
Merrill Lynch Investment Solutions – Och-Ziff European Multi-Strategy UCITS Fund
119Merrill Lynch Investment Solutions
Unaudited semi-annual report
5) Credit Suisse Securities (Europe) Limited
Commitment of USD 43 867 425 for the short portfolio composed of 47 equitiesCommitment of USD 14 548 306 for the long portfolio composed of 14 equities
Market value of USD (1 070 264) detailed as follows:– unrealised depreciation of short portfolio: USD (704 477)– unrealised depreciation of long portfolio: USD (134 140)– realised result: USD (231 647) corresponding to the realised loss on securities which is still held at the counterparty (monthly reset)
The below table is composed of long and short positions:
Industrial sector Underlying nature Long/ShortCommitment
USD
Unrealised appreciation/
(depreciation)USD
Apparel Bond Short 1 348 710 51 931Auto Parts&Equipment Bond Short 855 000 (8 500)Chemicals Bond Short 1 335 000 7 388Coal Bond Short 1 745 441 (44 963)Computers Bond Long 2 238 679 21 317Computers Bond Short 2 957 376 (66 807)Hand/Machine Tools Bond Short 9 937 20Holding Companies-Divers Bond Short 1 051 227 22 589Home Furnishings Bond Long 3 261 942 (142 076)Insurance Bond Short 257 572 (4 793)Machinery-Constr&Mining Bond Short 1 727 843 (43 087)Miscellaneous Manufactur Bond Short 1 451 188 (23 403)Office/Business Equip Bond Short 424 549 (11 718)Oil&Gas Bond Short 758 125 17 191Real Estate Bond Long 463 568 19 013Real Estate Bond Short 3 787 262 30 769REITS Bond Long 883 400 7 811REITS Bond Short 1 187 317 (6 089)Retail Bond Short 447 614 2 071Telecommunications Bond Short 3 733 026 (3 447)Water Bond Short 403 122 4 607Airlines Equity Long 2 726 106 (232 142)Auto Manufacturers Equity Long 7 118 (409)Auto Parts&Equipment Equity Long 266 467 14 185Banks Equity Long 1 300 942 (8 324)Banks Equity Short 2 766 058 (21 091)Biotechnology Equity Short 23 640 7 544Building Materials Equity Short 75 984 (1 348)Chemicals Equity Long 372 665 1 117Diversified Financial Services Equity Short 1 702 183Electrical Compo&Equip Equity Short 108 944 (4 719)Electric Equity Long 1 515 168 153 531Electric Equity Short 687 773 4 019
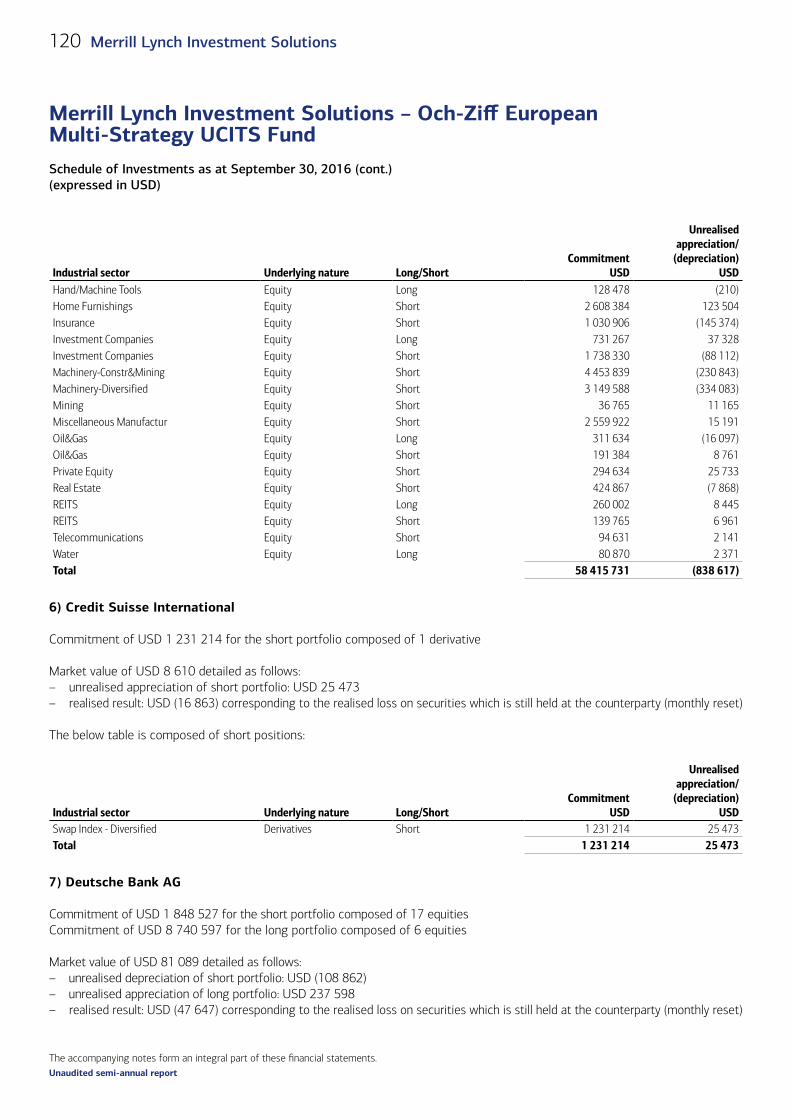
The accompanying notes form an integral part of these financial statements.
Schedule of Investments as at September 30, 2016 (cont.)(expressed in USD)
Merrill Lynch Investment Solutions – Och-Ziff European Multi-Strategy UCITS Fund
120 Merrill Lynch Investment Solutions
Unaudited semi-annual report
Industrial sector Underlying nature Long/ShortCommitment
USD
Unrealised appreciation/
(depreciation)USD
Hand/Machine Tools Equity Long 128 478 (210)Home Furnishings Equity Short 2 608 384 123 504Insurance Equity Short 1 030 906 (145 374)Investment Companies Equity Long 731 267 37 328Investment Companies Equity Short 1 738 330 (88 112)Machinery-Constr&Mining Equity Short 4 453 839 (230 843)Machinery-Diversified Equity Short 3 149 588 (334 083)Mining Equity Short 36 765 11 165Miscellaneous Manufactur Equity Short 2 559 922 15 191Oil&Gas Equity Long 311 634 (16 097)Oil&Gas Equity Short 191 384 8 761Private Equity Equity Short 294 634 25 733Real Estate Equity Short 424 867 (7 868)REITS Equity Long 260 002 8 445REITS Equity Short 139 765 6 961Telecommunications Equity Short 94 631 2 141Water Equity Long 80 870 2 371Total 58 415 731 (838 617)
6) Credit Suisse International
Commitment of USD 1 231 214 for the short portfolio composed of 1 derivative
Market value of USD 8 610 detailed as follows:– unrealised appreciation of short portfolio: USD 25 473– realised result: USD (16 863) corresponding to the realised loss on securities which is still held at the counterparty (monthly reset)
The below table is composed of short positions:
Industrial sector Underlying nature Long/ShortCommitment
USD
Unrealised appreciation/
(depreciation)USD
Swap Index - Diversified Derivatives Short 1 231 214 25 473Total 1 231 214 25 473
7) Deutsche Bank AG
Commitment of USD 1 848 527 for the short portfolio composed of 17 equitiesCommitment of USD 8 740 597 for the long portfolio composed of 6 equities
Market value of USD 81 089 detailed as follows:– unrealised depreciation of short portfolio: USD (108 862)– unrealised appreciation of long portfolio: USD 237 598– realised result: USD (47 647) corresponding to the realised loss on securities which is still held at the counterparty (monthly reset)

The accompanying notes form an integral part of these financial statements.
Schedule of Investments as at September 30, 2016 (cont.)(expressed in USD)
Merrill Lynch Investment Solutions – Och-Ziff European Multi-Strategy UCITS Fund
121Merrill Lynch Investment Solutions
Unaudited semi-annual report
The below table is composed of long and short positions:
Industrial sector Underlying nature Long/ShortCommitment
USD
Unrealised appreciation/
(depreciation)USD
Banks Equity Short 433 459 3 262Building Materials Equity Short 135 837 998Chemicals Equity Long 28 985 884Chemicals Equity Short 28 985 (884)Diversified Financial Services Equity Long 6 628 360 431 354Internet Equity Short 509 923 (36 049)Investment Companies Equity Long 57 624 (18 916)Investment Companies Equity Short 240 879 (68 590)Media Equity Short 29 613 735Oil&Gas Services Equity Long 1 073 378 (82 056)Oil&Gas Services Equity Short 59 200 4 217Oil&Gas Equity Short 803 (36)Real Estate Equity Long 779 075 (92 800)Real Estate Equity Short 15 213 (549)Retail Equity Long 173 175 (868)Retail Equity Short 173 175 868Telecommunications Equity Short 189 354 (8 531)Transportation Equity Short 32 086 (4 303)Total 10 589 124 128 736
8) Goldman Sachs International
Commitment of USD 13 046 295 for the short portfolio composed of 11 equities and 1 derivativeCommitment of USD 16 512 837 for the long portfolio composed of 7 equities
Market value of USD (518 730) detailed as follows:– unrealised depreciation of short portfolio: USD (225 780)– unrealised depreciation of long portfolio: USD (206 338)– realised result: USD (86 612) corresponding to the realised loss on securities which is still held at the counterparty (monthly reset)
The below table is composed of long and short positions:
Industrial sector Underlying nature Long/ShortCommitment
USD
Unrealised appreciation/
(depreciation)USD
Swap Index - Diversified Derivatives Short 365 297 1 868Airlines Equity Long 1 041 606 (66 747)Auto Manufacturers Equity Long 2 656 866 12 177Banks Equity Long 7 731 077 (228 967)Banks Equity Short 7 585 780 (166 718)Gas Equity Short 695 043 5 734Hand/Machine Tools Equity Short 2 483 469 (43 178)Healthcare-Products Equity Short 1 225 278 2 318

The accompanying notes form an integral part of these financial statements.
Schedule of Investments as at September 30, 2016 (cont.)(expressed in USD)
Merrill Lynch Investment Solutions – Och-Ziff European Multi-Strategy UCITS Fund
122 Merrill Lynch Investment Solutions
Unaudited semi-annual report
Industrial sector Underlying nature Long/ShortCommitment
USD
Unrealised appreciation/
(depreciation)USD
Insurance Equity Long 1 614 329 162 246Insurance Equity Short 557 561 (41 326)Lodging Equity Short 89 897 6 519Machinery-Diversified Equity Long 3 449 626 (58 028)Oil&Gas Services Equity Short 34 168 1 986Oil&Gas Equity Short 1 456 7 368Pharmaceuticals Equity Long 19 333 (27 019)Real Estate Equity Short 5 958 (128)Semiconductors Equity Short 2 388 (223)Total 29 559 132 (432 118)
9) HSBC Bank Plc.
Commitment of USD 4 645 455 for the short portfolio composed of 4 equitiesCommitment of USD 20 449 692 for the long portfolio composed of 9 equities
Market value of USD (1 122 099) detailed as follows:– unrealised depreciation of short portfolio: USD (16 922)– unrealised depreciation of long portfolio: USD (972 171)– realised result: USD (133 006) corresponding to the realised loss on securities which is still held at the counterparty (monthly reset)
The below table is composed of long and short positions:
Industrial sector Underlying nature Long/ShortCommitment
USD
Unrealised appreciation/
(depreciation)USD
Aerospace/Defense Equity Short 995 273 (48 584)Apparel Equity Short 366 128 (32 512)Commercial Services Equity Long 3 663 759 (343 159)Food Equity Long 2 059 163 (37 064)Home Furnishings Equity Long 2 811 247 9 500Mining Equity Short 36 942 (8 206)Oil&Gas Equity Long 10 276 (4 558)Oil&Gas Equity Short 3 247 112 72 380Retail Equity Long 9 673 131 (391 113)Telecommunications Equity Long 2 232 116 (205 778)Total 25 095 147 (989 094)

The accompanying notes form an integral part of these financial statements.
Schedule of Investments as at September 30, 2016 (cont.)(expressed in USD)
Merrill Lynch Investment Solutions – Och-Ziff European Multi-Strategy UCITS Fund
123Merrill Lynch Investment Solutions
Unaudited semi-annual report
10) JPMorgan Chase Bank NA
Commitment of USD 11 551 035 for the short portfolio composed of 17 equities and 2 derivativesCommitment of USD 21 869 109 for the long portfolio composed of 25 equities and 1 derivative
Market value of USD 324 190 detailed as follows:– unrealised depreciation of short portfolio: USD (476 536)– unrealised appreciation of long portfolio: USD 894 465– realised result: USD (93 739) corresponding to the realised loss on securities which is still held at the counterparty (monthly reset)
The below table is composed of long and short positions:
Industrial sector Underlying nature Long/ShortCommitment
USD
Unrealised appreciation/
(depreciation)USD
Miscellaneous Manufactur Bond Short 2 031 662 (32 149)Fund - Equity Derivatives Short 696 449 (42 295)Swap Index - Diversified Derivatives Long 533 634 1 776Swap Index - Diversified Derivatives Short 897 475 (13 607)Swap Index - Diversified Derivatives Short 390 611 (35 439)Airlines Equity Long 100 397 1 742Auto Manufacturers Equity Long 3 646 710 (22 350)Banks Equity Long 214 540 (105 551)Banks Equity Short 1 820 958 (44 390)Chemicals Equity Long 337 271 337 271Chemicals Equity Short 337 271 (337 271)Commercial Services Equity Long 510 402 (616)Distribution/Wholesale Equity Short 323 853 (35 449)Diversified Financial Services Equity Long 1 882 012 (78 678)Diversified Financial Services Equity Short 1 664 479 (18 576)Electrical Compo&Equip Equity Long 4 068 169 567 446Electric Equity Long 1 133 525 791Electronics Equity Long 3 381 494 78 499Food Equity Long 238 239 (1 250)Food Equity Short 1 794 168 55 836Hand/Machine Tools Equity Short 7 620 12 119Healthcare-Products Equity Long 87 050 21 592Insurance Equity Long 2 373 307 177 917Insurance Equity Short 1 416 594 (52 772)Internet Equity Long 2 380 031 131 624Investment Companies Equity Long 80 663 (31 774)Iron/Steel Equity Long 156 119 94 004Mining Equity Long 170 979 48 639Oil&Gas Services Equity Long 296 597 (88 986)Oil&Gas Equity Long 119 387 (231 044)Oil&Gas Equity Short 28 931 74 186REITS Equity Short 140 964 (6 729)Semiconductors Equity Long 7 640 713
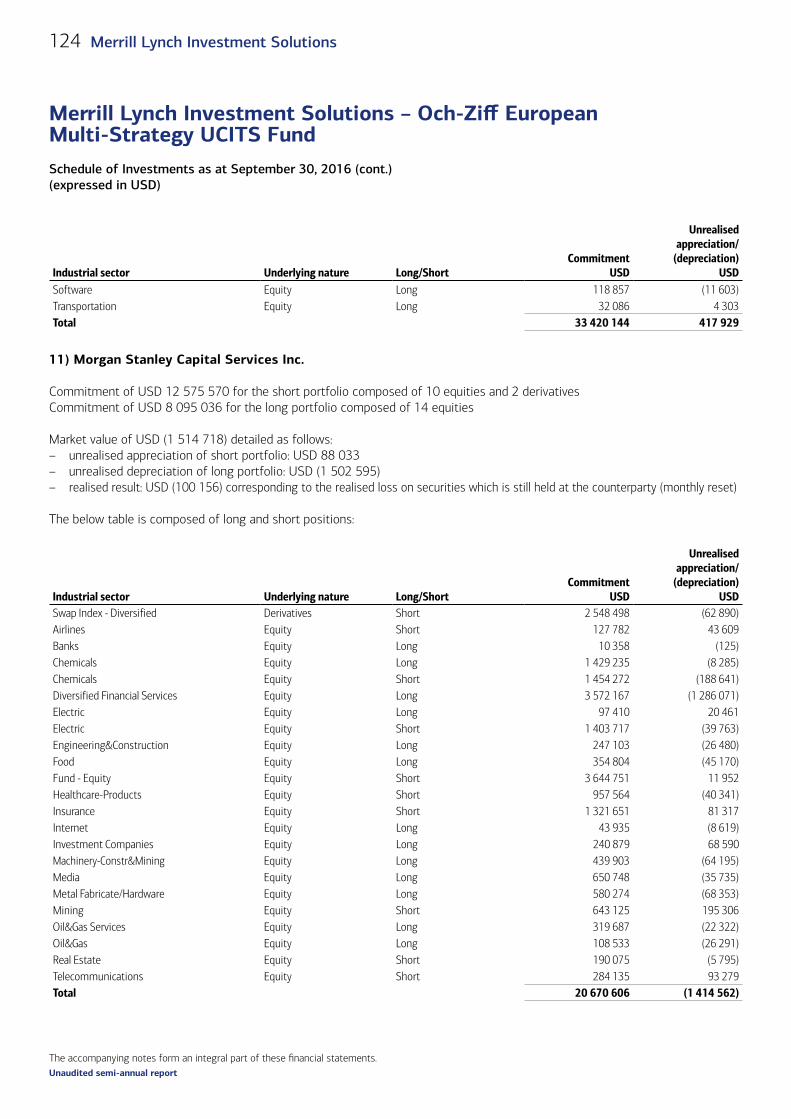
The accompanying notes form an integral part of these financial statements.
Schedule of Investments as at September 30, 2016 (cont.)(expressed in USD)
Merrill Lynch Investment Solutions – Och-Ziff European Multi-Strategy UCITS Fund
124 Merrill Lynch Investment Solutions
Unaudited semi-annual report
Industrial sector Underlying nature Long/ShortCommitment
USD
Unrealised appreciation/
(depreciation)USD
Software Equity Long 118 857 (11 603)Transportation Equity Long 32 086 4 303Total 33 420 144 417 929
11) Morgan Stanley Capital Services Inc.
Commitment of USD 12 575 570 for the short portfolio composed of 10 equities and 2 derivativesCommitment of USD 8 095 036 for the long portfolio composed of 14 equities
Market value of USD (1 514 718) detailed as follows:– unrealised appreciation of short portfolio: USD 88 033– unrealised depreciation of long portfolio: USD (1 502 595)– realised result: USD (100 156) corresponding to the realised loss on securities which is still held at the counterparty (monthly reset)
The below table is composed of long and short positions:
Industrial sector Underlying nature Long/ShortCommitment
USD
Unrealised appreciation/
(depreciation)USD
Swap Index - Diversified Derivatives Short 2 548 498 (62 890)Airlines Equity Short 127 782 43 609Banks Equity Long 10 358 (125)Chemicals Equity Long 1 429 235 (8 285)Chemicals Equity Short 1 454 272 (188 641)Diversified Financial Services Equity Long 3 572 167 (1 286 071)Electric Equity Long 97 410 20 461Electric Equity Short 1 403 717 (39 763)Engineering&Construction Equity Long 247 103 (26 480)Food Equity Long 354 804 (45 170)Fund - Equity Equity Short 3 644 751 11 952Healthcare-Products Equity Short 957 564 (40 341)Insurance Equity Short 1 321 651 81 317Internet Equity Long 43 935 (8 619)Investment Companies Equity Long 240 879 68 590Machinery-Constr&Mining Equity Long 439 903 (64 195)Media Equity Long 650 748 (35 735)Metal Fabricate/Hardware Equity Long 580 274 (68 353)Mining Equity Short 643 125 195 306Oil&Gas Services Equity Long 319 687 (22 322)Oil&Gas Equity Long 108 533 (26 291)Real Estate Equity Short 190 075 (5 795)Telecommunications Equity Short 284 135 93 279Total 20 670 606 (1 414 562)
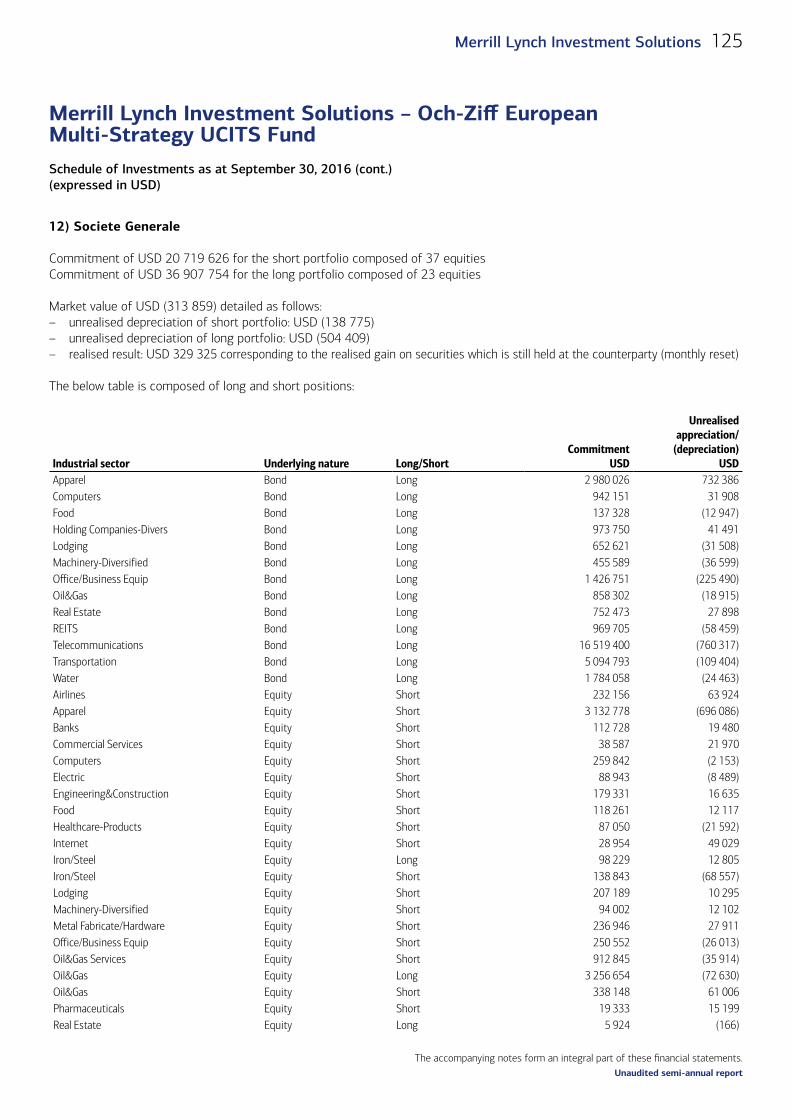
The accompanying notes form an integral part of these financial statements.
Schedule of Investments as at September 30, 2016 (cont.)(expressed in USD)
Merrill Lynch Investment Solutions – Och-Ziff European Multi-Strategy UCITS Fund
125Merrill Lynch Investment Solutions
Unaudited semi-annual report
12) Societe Generale
Commitment of USD 20 719 626 for the short portfolio composed of 37 equitiesCommitment of USD 36 907 754 for the long portfolio composed of 23 equities
Market value of USD (313 859) detailed as follows:– unrealised depreciation of short portfolio: USD (138 775)– unrealised depreciation of long portfolio: USD (504 409)– realised result: USD 329 325 corresponding to the realised gain on securities which is still held at the counterparty (monthly reset)
The below table is composed of long and short positions:
Industrial sector Underlying nature Long/ShortCommitment
USD
Unrealised appreciation/
(depreciation)USD
Apparel Bond Long 2 980 026 732 386Computers Bond Long 942 151 31 908Food Bond Long 137 328 (12 947)Holding Companies-Divers Bond Long 973 750 41 491Lodging Bond Long 652 621 (31 508)Machinery-Diversified Bond Long 455 589 (36 599)Office/Business Equip Bond Long 1 426 751 (225 490)Oil&Gas Bond Long 858 302 (18 915)Real Estate Bond Long 752 473 27 898REITS Bond Long 969 705 (58 459)Telecommunications Bond Long 16 519 400 (760 317)Transportation Bond Long 5 094 793 (109 404)Water Bond Long 1 784 058 (24 463)Airlines Equity Short 232 156 63 924Apparel Equity Short 3 132 778 (696 086)Banks Equity Short 112 728 19 480Commercial Services Equity Short 38 587 21 970Computers Equity Short 259 842 (2 153)Electric Equity Short 88 943 (8 489)Engineering&Construction Equity Short 179 331 16 635Food Equity Short 118 261 12 117Healthcare-Products Equity Short 87 050 (21 592)Internet Equity Short 28 954 49 029Iron/Steel Equity Long 98 229 12 805Iron/Steel Equity Short 138 843 (68 557)Lodging Equity Short 207 189 10 295Machinery-Diversified Equity Short 94 002 12 102Metal Fabricate/Hardware Equity Short 236 946 27 911Office/Business Equip Equity Short 250 552 (26 013)Oil&Gas Services Equity Short 912 845 (35 914)Oil&Gas Equity Long 3 256 654 (72 630)Oil&Gas Equity Short 338 148 61 006Pharmaceuticals Equity Short 19 333 15 199Real Estate Equity Long 5 924 (166)
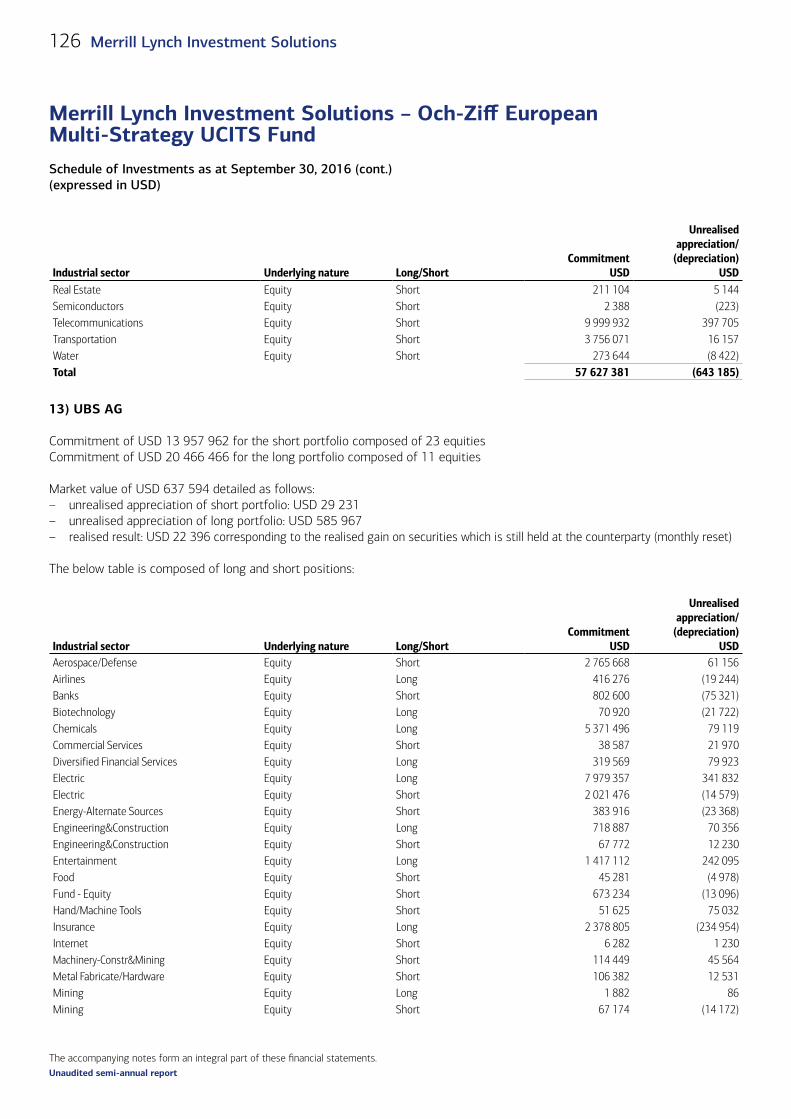
The accompanying notes form an integral part of these financial statements.
Schedule of Investments as at September 30, 2016 (cont.)(expressed in USD)
Merrill Lynch Investment Solutions – Och-Ziff European Multi-Strategy UCITS Fund
126 Merrill Lynch Investment Solutions
Unaudited semi-annual report
Industrial sector Underlying nature Long/ShortCommitment
USD
Unrealised appreciation/
(depreciation)USD
Real Estate Equity Short 211 104 5 144Semiconductors Equity Short 2 388 (223)Telecommunications Equity Short 9 999 932 397 705Transportation Equity Short 3 756 071 16 157Water Equity Short 273 644 (8 422)Total 57 627 381 (643 185)
13) UBS AG
Commitment of USD 13 957 962 for the short portfolio composed of 23 equitiesCommitment of USD 20 466 466 for the long portfolio composed of 11 equities
Market value of USD 637 594 detailed as follows:– unrealised appreciation of short portfolio: USD 29 231– unrealised appreciation of long portfolio: USD 585 967– realised result: USD 22 396 corresponding to the realised gain on securities which is still held at the counterparty (monthly reset)
The below table is composed of long and short positions:
Industrial sector Underlying nature Long/ShortCommitment
USD
Unrealised appreciation/
(depreciation)USD
Aerospace/Defense Equity Short 2 765 668 61 156Airlines Equity Long 416 276 (19 244)Banks Equity Short 802 600 (75 321)Biotechnology Equity Long 70 920 (21 722)Chemicals Equity Long 5 371 496 79 119Commercial Services Equity Short 38 587 21 970Diversified Financial Services Equity Long 319 569 79 923Electric Equity Long 7 979 357 341 832Electric Equity Short 2 021 476 (14 579)Energy-Alternate Sources Equity Short 383 916 (23 368)Engineering&Construction Equity Long 718 887 70 356Engineering&Construction Equity Short 67 772 12 230Entertainment Equity Long 1 417 112 242 095Food Equity Short 45 281 (4 978)Fund - Equity Equity Short 673 234 (13 096)Hand/Machine Tools Equity Short 51 625 75 032Insurance Equity Long 2 378 805 (234 954)Internet Equity Short 6 282 1 230Machinery-Constr&Mining Equity Short 114 449 45 564Metal Fabricate/Hardware Equity Short 106 382 12 531Mining Equity Long 1 882 86Mining Equity Short 67 174 (14 172)

The accompanying notes form an integral part of these financial statements.
Schedule of Investments as at September 30, 2016 (cont.)(expressed in USD)
Merrill Lynch Investment Solutions – Och-Ziff European Multi-Strategy UCITS Fund
127Merrill Lynch Investment Solutions
Unaudited semi-annual report
Industrial sector Underlying nature Long/ShortCommitment
USD
Unrealised appreciation/
(depreciation)USD
Miscellaneous Manufactur Equity Short 4 927 684 42 511Oil&Gas Services Equity Long 1 792 162 48 476Oil&Gas Services Equity Short 1 333 846 (75 582)Oil&Gas Equity Short 313 668 (9 966)Real Estate Equity Short 238 318 (11 931)Total 34 424 428 615 198
The total market value of the contracts for difference swaps is USD (1 635 590).
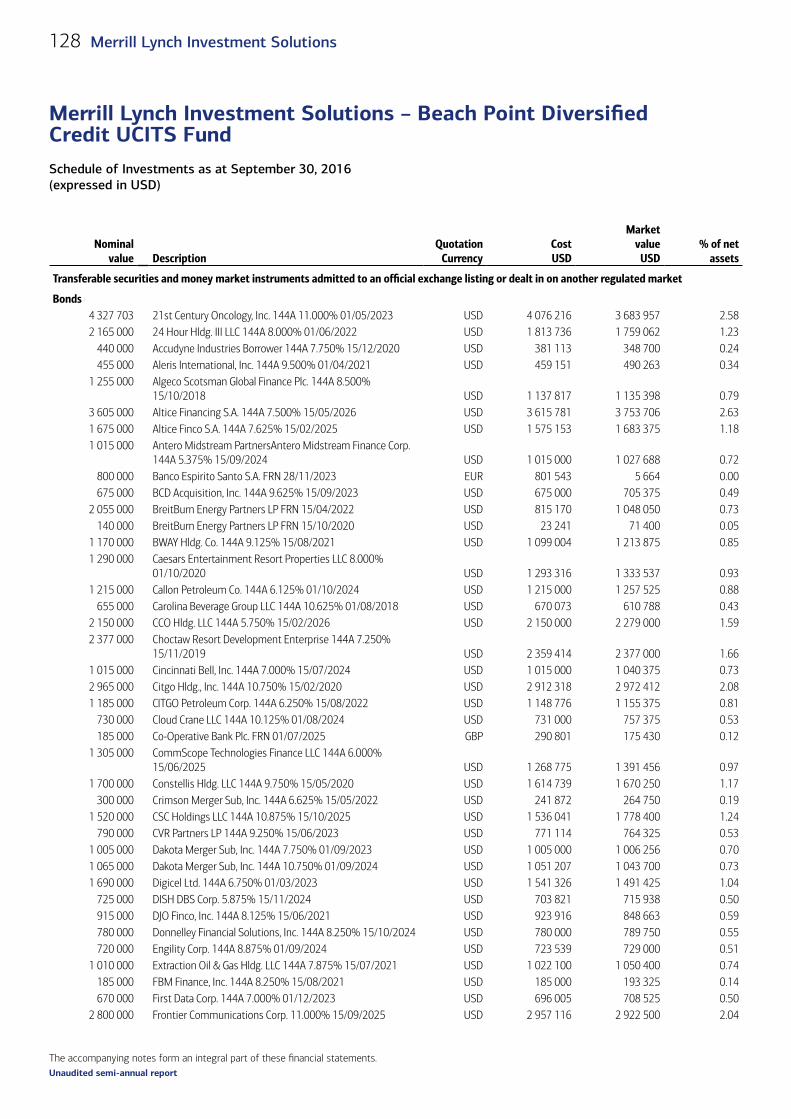
The accompanying notes form an integral part of these financial statements.
Schedule of Investments as at September 30, 2016 (expressed in USD)
Merrill Lynch Investment Solutions – Beach Point Diversified Credit UCITS Fund
128 Merrill Lynch Investment Solutions
Unaudited semi-annual report
Schedule of Investments as at September 30, 2016 (expressed in USD)
Nominal value Description
Quotation Currency
Cost USD
Market value
USD% of net
assets
Transferable securities and money market instruments admitted to an official exchange listing or dealt in on another regulated market (cont.)
Bonds (cont.)4 327 703 21st Century Oncology, Inc. 144A 11.000% 01/05/2023 USD 4 076 216 3 683 957 2.582 165 000 24 Hour Hldg. III LLC 144A 8.000% 01/06/2022 USD 1 813 736 1 759 062 1.23
440 000 Accudyne Industries Borrower 144A 7.750% 15/12/2020 USD 381 113 348 700 0.24455 000 Aleris International, Inc. 144A 9.500% 01/04/2021 USD 459 151 490 263 0.34
1 255 000 Algeco Scotsman Global Finance Plc. 144A 8.500% 15/10/2018 USD 1 137 817 1 135 398 0.79
3 605 000 Altice Financing S.A. 144A 7.500% 15/05/2026 USD 3 615 781 3 753 706 2.631 675 000 Altice Finco S.A. 144A 7.625% 15/02/2025 USD 1 575 153 1 683 375 1.181 015 000 Antero Midstream PartnersAntero Midstream Finance Corp.
144A 5.375% 15/09/2024 USD 1 015 000 1 027 688 0.72800 000 Banco Espirito Santo S.A. FRN 28/11/2023 EUR 801 543 5 664 0.00675 000 BCD Acquisition, Inc. 144A 9.625% 15/09/2023 USD 675 000 705 375 0.49
2 055 000 BreitBurn Energy Partners LP FRN 15/04/2022 USD 815 170 1 048 050 0.73140 000 BreitBurn Energy Partners LP FRN 15/10/2020 USD 23 241 71 400 0.05
1 170 000 BWAY Hldg. Co. 144A 9.125% 15/08/2021 USD 1 099 004 1 213 875 0.851 290 000 Caesars Entertainment Resort Properties LLC 8.000%
01/10/2020 USD 1 293 316 1 333 537 0.931 215 000 Callon Petroleum Co. 144A 6.125% 01/10/2024 USD 1 215 000 1 257 525 0.88
655 000 Carolina Beverage Group LLC 144A 10.625% 01/08/2018 USD 670 073 610 788 0.432 150 000 CCO Hldg. LLC 144A 5.750% 15/02/2026 USD 2 150 000 2 279 000 1.592 377 000 Choctaw Resort Development Enterprise 144A 7.250%
15/11/2019 USD 2 359 414 2 377 000 1.661 015 000 Cincinnati Bell, Inc. 144A 7.000% 15/07/2024 USD 1 015 000 1 040 375 0.732 965 000 Citgo Hldg., Inc. 144A 10.750% 15/02/2020 USD 2 912 318 2 972 412 2.081 185 000 CITGO Petroleum Corp. 144A 6.250% 15/08/2022 USD 1 148 776 1 155 375 0.81
730 000 Cloud Crane LLC 144A 10.125% 01/08/2024 USD 731 000 757 375 0.53185 000 Co-Operative Bank Plc. FRN 01/07/2025 GBP 290 801 175 430 0.12
1 305 000 CommScope Technologies Finance LLC 144A 6.000% 15/06/2025 USD 1 268 775 1 391 456 0.97
1 700 000 Constellis Hldg. LLC 144A 9.750% 15/05/2020 USD 1 614 739 1 670 250 1.17300 000 Crimson Merger Sub, Inc. 144A 6.625% 15/05/2022 USD 241 872 264 750 0.19
1 520 000 CSC Holdings LLC 144A 10.875% 15/10/2025 USD 1 536 041 1 778 400 1.24790 000 CVR Partners LP 144A 9.250% 15/06/2023 USD 771 114 764 325 0.53
1 005 000 Dakota Merger Sub, Inc. 144A 7.750% 01/09/2023 USD 1 005 000 1 006 256 0.701 065 000 Dakota Merger Sub, Inc. 144A 10.750% 01/09/2024 USD 1 051 207 1 043 700 0.731 690 000 Digicel Ltd. 144A 6.750% 01/03/2023 USD 1 541 326 1 491 425 1.04
725 000 DISH DBS Corp. 5.875% 15/11/2024 USD 703 821 715 938 0.50915 000 DJO Finco, Inc. 144A 8.125% 15/06/2021 USD 923 916 848 663 0.59780 000 Donnelley Financial Solutions, Inc. 144A 8.250% 15/10/2024 USD 780 000 789 750 0.55720 000 Engility Corp. 144A 8.875% 01/09/2024 USD 723 539 729 000 0.51
1 010 000 Extraction Oil & Gas Hldg. LLC 144A 7.875% 15/07/2021 USD 1 022 100 1 050 400 0.74185 000 FBM Finance, Inc. 144A 8.250% 15/08/2021 USD 185 000 193 325 0.14670 000 First Data Corp. 144A 7.000% 01/12/2023 USD 696 005 708 525 0.50
2 800 000 Frontier Communications Corp. 11.000% 15/09/2025 USD 2 957 116 2 922 500 2.04
Merrill Lynch Investment Solutions – Beach Point Diversified Credit UCITS Fund
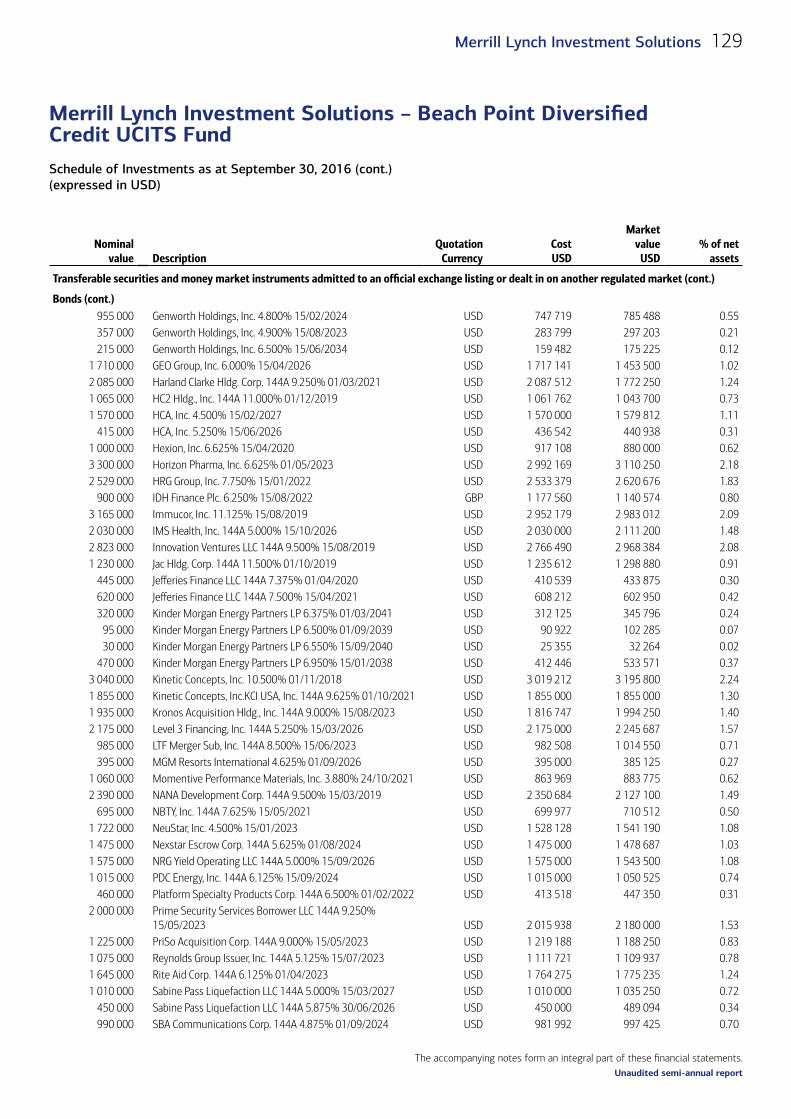
The accompanying notes form an integral part of these financial statements.
Schedule of Investments as at September 30, 2016 (cont.)(expressed in USD)
Merrill Lynch Investment Solutions – Beach Point Diversified Credit UCITS Fund
129Merrill Lynch Investment Solutions
Unaudited semi-annual report
Nominal value Description
Quotation Currency
Cost USD
Market value
USD% of net
assets
Transferable securities and money market instruments admitted to an official exchange listing or dealt in on another regulated market (cont.)
Bonds (cont.)955 000 Genworth Holdings, Inc. 4.800% 15/02/2024 USD 747 719 785 488 0.55357 000 Genworth Holdings, Inc. 4.900% 15/08/2023 USD 283 799 297 203 0.21215 000 Genworth Holdings, Inc. 6.500% 15/06/2034 USD 159 482 175 225 0.12
1 710 000 GEO Group, Inc. 6.000% 15/04/2026 USD 1 717 141 1 453 500 1.022 085 000 Harland Clarke Hldg. Corp. 144A 9.250% 01/03/2021 USD 2 087 512 1 772 250 1.241 065 000 HC2 Hldg., Inc. 144A 11.000% 01/12/2019 USD 1 061 762 1 043 700 0.731 570 000 HCA, Inc. 4.500% 15/02/2027 USD 1 570 000 1 579 812 1.11
415 000 HCA, Inc. 5.250% 15/06/2026 USD 436 542 440 938 0.311 000 000 Hexion, Inc. 6.625% 15/04/2020 USD 917 108 880 000 0.623 300 000 Horizon Pharma, Inc. 6.625% 01/05/2023 USD 2 992 169 3 110 250 2.182 529 000 HRG Group, Inc. 7.750% 15/01/2022 USD 2 533 379 2 620 676 1.83
900 000 IDH Finance Plc. 6.250% 15/08/2022 GBP 1 177 560 1 140 574 0.803 165 000 Immucor, Inc. 11.125% 15/08/2019 USD 2 952 179 2 983 012 2.092 030 000 IMS Health, Inc. 144A 5.000% 15/10/2026 USD 2 030 000 2 111 200 1.482 823 000 Innovation Ventures LLC 144A 9.500% 15/08/2019 USD 2 766 490 2 968 384 2.081 230 000 Jac Hldg. Corp. 144A 11.500% 01/10/2019 USD 1 235 612 1 298 880 0.91
445 000 Jefferies Finance LLC 144A 7.375% 01/04/2020 USD 410 539 433 875 0.30620 000 Jefferies Finance LLC 144A 7.500% 15/04/2021 USD 608 212 602 950 0.42320 000 Kinder Morgan Energy Partners LP 6.375% 01/03/2041 USD 312 125 345 796 0.24
95 000 Kinder Morgan Energy Partners LP 6.500% 01/09/2039 USD 90 922 102 285 0.0730 000 Kinder Morgan Energy Partners LP 6.550% 15/09/2040 USD 25 355 32 264 0.02
470 000 Kinder Morgan Energy Partners LP 6.950% 15/01/2038 USD 412 446 533 571 0.373 040 000 Kinetic Concepts, Inc. 10.500% 01/11/2018 USD 3 019 212 3 195 800 2.241 855 000 Kinetic Concepts, Inc.KCI USA, Inc. 144A 9.625% 01/10/2021 USD 1 855 000 1 855 000 1.301 935 000 Kronos Acquisition Hldg., Inc. 144A 9.000% 15/08/2023 USD 1 816 747 1 994 250 1.402 175 000 Level 3 Financing, Inc. 144A 5.250% 15/03/2026 USD 2 175 000 2 245 687 1.57
985 000 LTF Merger Sub, Inc. 144A 8.500% 15/06/2023 USD 982 508 1 014 550 0.71395 000 MGM Resorts International 4.625% 01/09/2026 USD 395 000 385 125 0.27
1 060 000 Momentive Performance Materials, Inc. 3.880% 24/10/2021 USD 863 969 883 775 0.622 390 000 NANA Development Corp. 144A 9.500% 15/03/2019 USD 2 350 684 2 127 100 1.49
695 000 NBTY, Inc. 144A 7.625% 15/05/2021 USD 699 977 710 512 0.501 722 000 NeuStar, Inc. 4.500% 15/01/2023 USD 1 528 128 1 541 190 1.081 475 000 Nexstar Escrow Corp. 144A 5.625% 01/08/2024 USD 1 475 000 1 478 687 1.031 575 000 NRG Yield Operating LLC 144A 5.000% 15/09/2026 USD 1 575 000 1 543 500 1.081 015 000 PDC Energy, Inc. 144A 6.125% 15/09/2024 USD 1 015 000 1 050 525 0.74
460 000 Platform Specialty Products Corp. 144A 6.500% 01/02/2022 USD 413 518 447 350 0.312 000 000 Prime Security Services Borrower LLC 144A 9.250%
15/05/2023 USD 2 015 938 2 180 000 1.531 225 000 PriSo Acquisition Corp. 144A 9.000% 15/05/2023 USD 1 219 188 1 188 250 0.831 075 000 Reynolds Group Issuer, Inc. 144A 5.125% 15/07/2023 USD 1 111 721 1 109 937 0.781 645 000 Rite Aid Corp. 144A 6.125% 01/04/2023 USD 1 764 275 1 775 235 1.241 010 000 Sabine Pass Liquefaction LLC 144A 5.000% 15/03/2027 USD 1 010 000 1 035 250 0.72
450 000 Sabine Pass Liquefaction LLC 144A 5.875% 30/06/2026 USD 450 000 489 094 0.34990 000 SBA Communications Corp. 144A 4.875% 01/09/2024 USD 981 992 997 425 0.70

The accompanying notes form an integral part of these financial statements.
Schedule of Investments as at September 30, 2016 (cont.)(expressed in USD)
Merrill Lynch Investment Solutions – Beach Point Diversified Credit UCITS Fund
130 Merrill Lynch Investment Solutions
Unaudited semi-annual report
Nominal value Description
Quotation Currency
Cost USD
Market value
USD% of net
assets
Transferable securities and money market instruments admitted to an official exchange listing or dealt in on another regulated market (cont.)
Bonds (cont.)1 830 000 SFR Group S.A. 144A 7.375% 01/05/2026 USD 1 830 000 1 870 608 1.31
985 000 Sinclair Television Group, Inc. 144A 5.125% 15/02/2027 USD 985 000 962 838 0.671 255 000 Sinclair Television Group, Inc. 144A 5.625% 01/08/2024 USD 1 224 069 1 283 237 0.901 450 000 Speedy Cash Intermediate Hldg. Corp. 144A 10.750%
15/05/2018 USD 1 455 560 1 044 000 0.73660 000 SPL Logistics Escrow LLC 144A 8.875% 01/08/2020 USD 540 969 537 900 0.38995 000 Tallgrass Energy Partners LP 144A 5.500% 15/09/2024 USD 995 000 1 002 463 0.70
2 445 000 TerraForm Power Operating LLC 144A FRN 01/02/2023 USD 2 114 935 2 512 237 1.76145 000 TerraForm Power Operating LLC 144A FRN 15/06/2025 USD 117 495 152 250 0.11
2 785 000 Transworld Systems, Inc. 144A 9.500% 15/08/2021 USD 2 565 583 1 503 900 1.051 660 000 Tribune Media Co. 5.875% 15/07/2022 USD 1 641 199 1 679 712 1.18
310 000 TVL Finance Plc. 144A 8.500% 15/05/2023 GBP 454 959 422 663 0.30120 000 TVL Finance Plc. 8.500% 15/05/2023 GBP 177 454 163 612 0.11
2 135 000 Universal Health Services, Inc. 144A 5.000% 01/06/2026 USD 2 135 000 2 223 069 1.56810 000 Valeant Pharmaceuticals International, Inc. 144A 5.500%
01/03/2023 USD 702 668 692 550 0.482 020 000 Valeant Pharmaceuticals International, Inc. 144A 5.625%
01/12/2021 USD 1 757 603 1 802 850 1.26225 000 Valeant Pharmaceuticals International, Inc. 144A 6.125%
15/04/2025 USD 184 081 193 781 0.14380 000 Valeant Pharmaceuticals International, Inc. 144A 6.375%
15/10/2020 USD 338 476 356 250 0.25180 000 Valeant Pharmaceuticals International, Inc. 144A 7.000%
01/10/2020 USD 166 607 174 600 0.12390 000 Warren Resources, Inc. FRN 01/08/2022 USD 385 249 3 900 0.00615 000 Weatherford International LLC 6.800% 15/06/2037 USD 424 326 442 800 0.31965 000 Weatherford International Ltd. 7.000% 15/03/2038 USD 660 896 709 275 0.50665 000 WFS Global Hldg. SAS 144A 9.500% 15/07/2022 EUR 750 797 737 752 0.52
1 455 000 WMG Acquisition Corp. 144A 5.000% 01/08/2023 USD 1 455 000 1 476 825 1.03325 000 Xerium Technologies, Inc. 144A 9.500% 15/08/2021 USD 320 255 329 063 0.23
1 830 000 Zayo Group LLC 6.375% 15/05/2025 USD 1 791 108 1 939 800 1.36Total Bonds 128 715 393 128 432 003 89.87
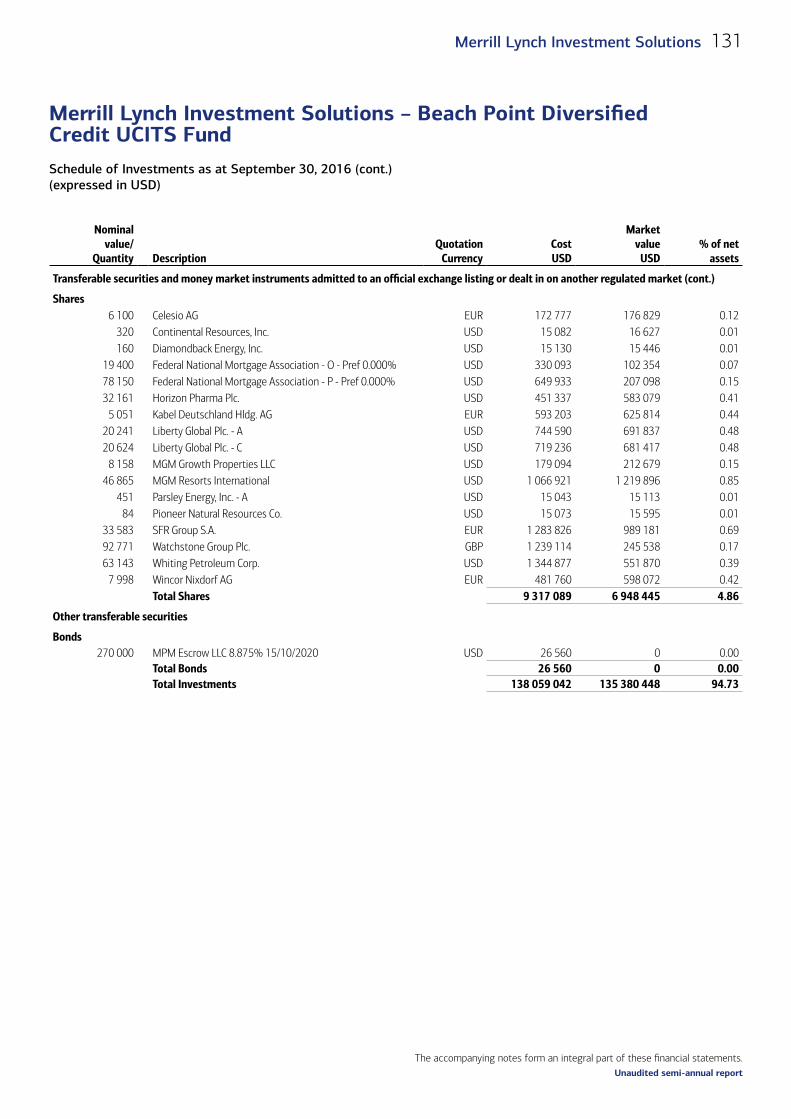
The accompanying notes form an integral part of these financial statements.
Schedule of Investments as at September 30, 2016 (cont.)(expressed in USD)
Merrill Lynch Investment Solutions – Beach Point Diversified Credit UCITS Fund
131Merrill Lynch Investment Solutions
Unaudited semi-annual report
Nominal value/
Quantity DescriptionQuotation
CurrencyCost USD
Market value
USD% of net
assets
Transferable securities and money market instruments admitted to an official exchange listing or dealt in on another regulated market (cont.)
Shares6 100 Celesio AG EUR 172 777 176 829 0.12
320 Continental Resources, Inc. USD 15 082 16 627 0.01160 Diamondback Energy, Inc. USD 15 130 15 446 0.01
19 400 Federal National Mortgage Association - O - Pref 0.000% USD 330 093 102 354 0.0778 150 Federal National Mortgage Association - P - Pref 0.000% USD 649 933 207 098 0.1532 161 Horizon Pharma Plc. USD 451 337 583 079 0.41
5 051 Kabel Deutschland Hldg. AG EUR 593 203 625 814 0.4420 241 Liberty Global Plc. - A USD 744 590 691 837 0.4820 624 Liberty Global Plc. - C USD 719 236 681 417 0.48
8 158 MGM Growth Properties LLC USD 179 094 212 679 0.1546 865 MGM Resorts International USD 1 066 921 1 219 896 0.85
451 Parsley Energy, Inc. - A USD 15 043 15 113 0.0184 Pioneer Natural Resources Co. USD 15 073 15 595 0.01
33 583 SFR Group S.A. EUR 1 283 826 989 181 0.6992 771 Watchstone Group Plc. GBP 1 239 114 245 538 0.1763 143 Whiting Petroleum Corp. USD 1 344 877 551 870 0.39
7 998 Wincor Nixdorf AG EUR 481 760 598 072 0.42Total Shares 9 317 089 6 948 445 4.86
Other transferable securities
Bonds270 000 MPM Escrow LLC 8.875% 15/10/2020 USD 26 560 0 0.00
Total Bonds 26 560 0 0.00Total Investments 138 059 042 135 380 448 94.73
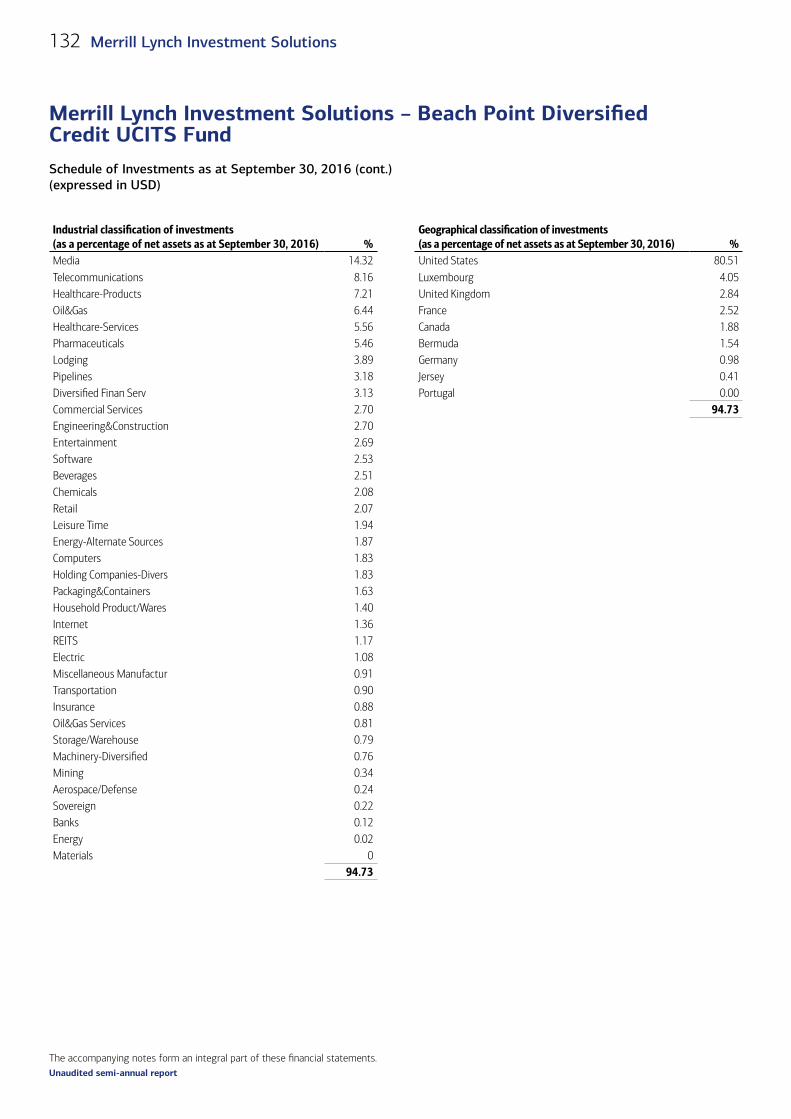
The accompanying notes form an integral part of these financial statements.
Schedule of Investments as at September 30, 2016 (cont.)(expressed in USD)
Merrill Lynch Investment Solutions – Beach Point Diversified Credit UCITS Fund
132 Merrill Lynch Investment Solutions
Unaudited semi-annual report
Industrial classification of investments(as a percentage of net assets as at September 30, 2016) %
Geographical classification of investments(as a percentage of net assets as at September 30, 2016) %
Media 14.32 United States 80.51Telecommunications 8.16 Luxembourg 4.05Healthcare-Products 7.21 United Kingdom 2.84Oil&Gas 6.44 France 2.52Healthcare-Services 5.56 Canada 1.88Pharmaceuticals 5.46 Bermuda 1.54Lodging 3.89 Germany 0.98Pipelines 3.18 Jersey 0.41Diversified Finan Serv 3.13 Portugal 0.00Commercial Services 2.70 94.73Engineering&Construction 2.70Entertainment 2.69Software 2.53Beverages 2.51Chemicals 2.08Retail 2.07Leisure Time 1.94Energy-Alternate Sources 1.87Computers 1.83Holding Companies-Divers 1.83Packaging&Containers 1.63Household Product/Wares 1.40Internet 1.36REITS 1.17Electric 1.08Miscellaneous Manufactur 0.91Transportation 0.90Insurance 0.88Oil&Gas Services 0.81Storage/Warehouse 0.79Machinery-Diversified 0.76Mining 0.34Aerospace/Defense 0.24Sovereign 0.22Banks 0.12Energy 0.02Materials 0
94.73

The accompanying notes form an integral part of these financial statements.
Schedule of Investments as at September 30, 2016 (cont.)(expressed in USD)
Merrill Lynch Investment Solutions – Beach Point Diversified Credit UCITS Fund
133Merrill Lynch Investment Solutions
Unaudited semi-annual report
Purchase
Sale
Maturity date Counterparty
Unrealised appreciation/
(depreciation) USD
Forward foreign exchange contracts EUR 2 148 000 USD 2 395 912 20/10/2016 State Street Bank and Trust Co 19 852GBP 411 000 USD 538 750 20/10/2016 State Street Bank and Trust Co (4 672)USD 5 677 595 EUR 5 008 000 20/10/2016 State Street Bank and Trust Co 45 311USD 2 452 145 GBP 1 816 000 20/10/2016 State Street Bank and Trust Co 92 326EUR 96 933 964 USD 109 135 527 31/10/2016 State Street Bank and Trust Co (60 275)GBP 5 704 796 USD 7 400 290 31/10/2016 State Street Bank and Trust Co 14 537USD 4 734 615 EUR 4 225 403 31/10/2016 State Street Bank and Trust Co (20 033)USD 164 914 GBP 127 156 31/10/2016 State Street Bank and Trust Co (357)USD 385 766 GBP 289 000 20/01/2017 State Street Bank and Trust Co 9 455Total forward foreign exchange contracts 96 144
Short/Long
Currency Description
Put/ Call
Strike Price
Maturity date Quantity
Market value
USDCommitment
USDOptionsShort USD SPDR S&P 500 ETF Put 197.000 21/10/2016 (2 733) (32 796) 53 840 000Long USD SPDR S&P 500 ETF Put 207.000 21/10/2016 2 733 150 315 –Total Options 117 519 32 796
State Street Global Markets is the counterparty to these options.
Notional
Pay
Receive
Currency
Maturity date Counterparty
Unrealised appreciation/
(depreciation) USD
Commitment USD
Credit default swaps16 800 000 USD Morgan Stanley USD 22/09/2023 (70 329) 7 032 950
Total Credit default swaps (70 329) 7 032 950
The maximum individual counterparty exposure for OTC Derivatives as at September 30, 2016 is 0.62% of the NAV.

The accompanying notes form an integral part of these financial statements.
Schedule of Investments as at September 30, 2016 (expressed in USD)
Merrill Lynch Investment Solutions – Merrill Lynch WNT Diversified Futures UCITS Fund
134 Merrill Lynch Investment Solutions
Unaudited semi-annual report
Merrill Lynch Investment Solutions – Merrill Lynch WNT Diversified Futures UCITS Fund
Schedule of Investments as at September 30, 2016 (expressed in USD)
Nominal value Description
Quotation Currency
Cost USD
Market value
USD% of net
assets
Transferable securities and money market instruments admitted to an official exchange listing or dealt in on another regulated market
Supranationals, Governments and Local Public Authorities, Debt Instruments19 000 000 Inter-American Development Bank 0.000% 05/10/2016 USD 18 999 346 18 999 791 7.1826 000 000 Inter-American Development Bank 0.000% 03/11/2016 USD 25 991 897 25 995 086 9.8219 000 000 Inter-American Development Bank 0.000% 17/11/2016 USD 18 993 054 18 994 775 7.1820 000 000 Inter-American Development Bank 0.000% 01/12/2016 USD 19 992 206 19 991 480 7.5522 000 000 International Bank for Reconstruction and Development
0.000% 20/10/2016 USD 21 996 981 21 998 020 8.3120 000 000 International Bank for Reconstruction and Development
0.000% 25/11/2016 USD 19 990 833 19 993 520 7.5520 000 000 International Bank for Reconstruction and Development
0.000% 08/12/2016 USD 19 988 667 19 990 460 7.5520 000 000 International Bank for Reconstruction and Development
0.000% 21/12/2016 USD 19 983 244 19 988 580 7.5526 000 000 International Bank for Reconstruction and Development
0.000% 04/01/2017 USD 25 976 752 25 981 852 9.8118 000 000 International Bank for Reconstruction and Development
0.000% 11/01/2017 USD 17 985 720 17 986 500 6.791 000 United States Treasury Note/Bond 6.000% 15/02/2026 USD 1 293 1 386 0.001 000 United States Treasury Note/Bond 6.500% 15/11/2026 USD 1 347 1 456 0.001 000 United States Treasury Note/Bond 6.750% 15/08/2026 USD 1 364 1 472 0.001 000 United States Treasury Note/Bond 6.875% 15/08/2025 USD 1 354 1 446 0.001 000 United States Treasury Note/Bond 7.500% 15/11/2024 USD 1 383 1 464 0.001 000 United States Treasury Note/Bond 7.625% 15/02/2025 USD 1 399 1 485 0.00
Total Supranationals, Governments and Local Public Authorities, Debt Instruments 209 906 840 209 928 773 79.29Total Investments 209 906 840 209 928 773 79.29
Industrial classification of investments(as a percentage of net assets as at September 30, 2016) %
Geographical classification of investments(as a percentage of net assets as at September 30, 2016) %
Sovereign 79.29 United States 79.2979.29 79.29

The accompanying notes form an integral part of these financial statements.
Schedule of Investments as at September 30, 2016 (cont.)(expressed in USD)
Merrill Lynch Investment Solutions – Merrill Lynch WNT Diversified Futures UCITS Fund
135Merrill Lynch Investment Solutions
Unaudited semi-annual report
Underlying nature
Currency contract
Details
Market
Maturity date
Number of contracts
bought
Number of contracts
soldCommitment
USD
Unrealised appreciation/
(depreciation)USD
Futures contracts (cont.)Currency USD Australian Dollar Chicago Mercantile Exchange 19/12/2016 86 – 6 578 140 93 065Currency USD Canadian Dollar Chicago Mercantile Exchange 20/12/2016 – 99 7 552 215 (32 560)Currency USD Euro Chicago Mercantile Exchange 19/12/2016 – 427 60 190 988 (25 994)Currency USD Japanese Yen Chicago Mercantile Exchange 19/12/2016 494 – 61 073 838 261 725Currency USD Mexican Peso (a) Chicago Mercantile Exchange 19/12/2016 – 156 3 988 140 35 940Currency USD New Zealand Dollar Chicago Mercantile Exchange 19/12/2016 28 – 2 033 920 (4 090)Currency USD Pound Sterling Chicago Mercantile Exchange 19/12/2016 – 494 40 128 238 832 019Currency USD Swiss Franc Chicago Mercantile Exchange 19/12/2016 – 15 1 940 625 (8 087)Index EUR Amsterdam Index NYSE Liffe Amsterdam 21/10/2016 7 – 711 298 12 609Index EUR CAC 40 10 Euro Index Euronext Paris 21/10/2016 42 – 2 097 314 23 622Index EUR DAX Index Eurex Deutschland 16/12/2016 27 – 7 974 415 67 639Index USD DJIA Mini Index Chicago Board of Trade 16/12/2016 54 – 4 919 130 23 110Index EUR Euro Stoxx 50 Index Eurex Deutschland 16/12/2016 281 – 9 454 687 18 059Index GBP FTSE 100 Index ICE Futures Europe 16/12/2016 102 – 9 086 050 236 223Index USD FTSE China A50 Index Singapore Exchange (was
SIMEX) 28/10/2016 101 – 966 318 (10 748)Index ZAR FTSE JSE TOP 40 Index South African Futures
Exchange 15/12/2016 – 13 434 179 (1 380)Index EUR FTSE MIB Index Borsa Italiana 16/12/2016 – 2 183 820 877Index HKD H-Shares Index Hong Kong Futures Exchange 28/10/2016 62 – 3 837 054 (84 999)Index HKD Hang Seng Index Hong Kong Futures Exchange 28/10/2016 90 – 13 526 196 (136 295)Index USD MSCI Emerging Markets
Mini Index ICE Futures US Indices 16/12/2016 187 – 8 531 875 118 610Index SGD MSCI Singapore Index Singapore Exchange (was
SIMEX) 28/10/2016 13 – 300 484 1 247Index USD MSCI Taiwan Index Singapore Exchange (was
SIMEX) 28/10/2016 87 – 2 972 790 (23 560)Index USD Nasdaq 100 E-Mini
Index Chicago Mercantile Exchange 16/12/2016 317 – 30 877 385 518 376Index JPY Nikkei 225 Index Osaka Exchange 08/12/2016 11 – 1 786 896 (30 316)Index SEK OMX 30 Index OMX Nordic Exchange
Stockholm 21/10/2016 83 – 1 393 602 18 256Index USD Russell 2000 Mini Index ICE Futures US Indices 16/12/2016 179 – 22 344 570 363 165Index USD S&P 500 E-Mini Index Chicago Mercantile Exchange 16/12/2016 – 365 39 427 300 (442 903)Index USD S&P MidCap 400 E-Mini
Index Chicago Mercantile Exchange 16/12/2016 16 – 2 479 360 30 875Index CAD S&P TSX 60 Index Montreal Exchange 15/12/2016 20 – 2 602 853 42 814Index USD SGX CNX Nifty Index Singapore Exchange (was
SIMEX) 27/10/2016 82 – 1 418 764 (35 276)Index AUD SPI 200 Index Australian Stock Exchange 15/12/2016 75 – 7 771 117 156 762Index JPY Topix Index Osaka Exchange 08/12/2016 8 – 1 045 178 (8 493)Interest rate AUD 10 Year Australian
Treasury Bond Australian Stock Exchange 15/12/2016 169 – 17 719 942 141 228Interest rate CAD 10 Year Government of
Canada Bond Montreal Exchange 19/12/2016 31 – 3 465 490 4 938

The accompanying notes form an integral part of these financial statements.
Schedule of Investments as at September 30, 2016 (cont.)(expressed in USD)
Merrill Lynch Investment Solutions – Merrill Lynch WNT Diversified Futures UCITS Fund
136 Merrill Lynch Investment Solutions
Unaudited semi-annual report
Underlying nature
Currency contract
Details
Market
Maturity date
Number of contracts
bought
Number of contracts
soldCommitment
USD
Unrealised appreciation/
(depreciation)USD
Futures contracts (cont.)Interest rate JPY 10 Year Japan
Government Bond Osaka Exchange 13/12/2016 15 – 22 565 546 94 603Interest rate USD 10 Year US Treasury
Note Chicago Board of Trade 20/12/2016 304 – 39 862 000 86 109Interest rate USD 2 Year US Treasury Note Chicago Board of Trade 30/12/2016 – 146 31 896 438 (40 641)Interest rate CAD 3 Month Canadian
Banker’s Acceptance Montreal Exchange 19/12/2016 – 19 3 582 243 (856)Interest rate CAD 3 Month Canadian
Banker’s Acceptance Montreal Exchange 13/03/2017 – 11 2 074 244 (856)Interest rate EUR 3 Month Euribor ICE Futures Europe 17/09/2018 198 – 55 836 708 2 992Interest rate EUR 3 Month Euribor ICE Futures Europe 19/06/2017 161 – 45 384 483 (17 349)Interest rate EUR 3 Month Euribor ICE Futures Europe 18/09/2017 190 – 53 567 335 (17 826)Interest rate EUR 3 Month Euribor ICE Futures Europe 18/12/2017 209 – 58 932 876 (14 342)Interest rate EUR 3 Month Euribor ICE Futures Europe 19/03/2018 211 – 59 502 755 (6 982)Interest rate EUR 3 Month Euribor ICE Futures Europe 18/06/2018 213 – 60 066 762 (3 821)Interest rate EUR 3 Month Euribor ICE Futures Europe 17/12/2018 175 – 49 345 710 5 155Interest rate EUR 3 Month Euribor ICE Futures Europe 18/03/2019 160 – 45 111 582 9 735Interest rate EUR 3 Month Euribor ICE Futures Europe 17/06/2019 145 – 40 876 261 11 210Interest rate EUR 3 Month Euribor ICE Futures Europe 16/09/2019 95 – 26 775 660 3 245Interest rate CHF 3 Month Euroswiss ICE Futures Europe 13/03/2017 – 4 1 040 128 (232)Interest rate CHF 3 Month Euroswiss ICE Futures Europe 19/12/2016 – 9 2 339 592 181Interest rate NZD 3 Month New Zealand
Bank Bill Australian Stock Exchange 14/12/2016 – 1 723 436 0Interest rate AUD 3 Month New Zealand
Bank Bill Australian Stock Exchange 09/03/2017 72 – 54 873 415 1 309Interest rate NZD 3 Month New Zealand
Bank Bill Australian Stock Exchange 15/03/2017 13 – 9 406 974 (3 392)Interest rate AUD 3 Year Australian
Treasury Bond Australian Stock Exchange 15/12/2016 217 – 18 816 219 12 897Interest rate USD 5 Year US Treasury Note Chicago Board of Trade 30/12/2016 – 67 8 141 547 (25 000)Interest rate AUD 90 Day Australian Bank
Bill Australian Stock Exchange 08/12/2016 47 – 35 815 749 (2 732)Interest rate AUD 90 Day Australian Bank
Bill Australian Stock Exchange 08/06/2017 47 – 35 823 665 4 266Interest rate AUD 90 Day Australian Bank
Bill Australian Stock Exchange 07/09/2017 52 – 39 636 640 786Interest rate USD 90 Day Eurodollar Chicago Mercantile Exchange 19/06/2017 175 – 43 319 063 (81 688)Interest rate USD 90 Day Eurodollar Chicago Mercantile Exchange 18/09/2017 189 – 46 768 050 (86 088)Interest rate USD 90 Day Eurodollar Chicago Mercantile Exchange 18/12/2017 202 – 49 962 175 (89 375)Interest rate USD 90 Day Eurodollar Chicago Mercantile Exchange 19/03/2018 195 – 48 221 063 (78 462)Interest rate USD 90 Day Eurodollar Chicago Mercantile Exchange 18/06/2018 195 – 48 206 438 (72 975)Interest rate USD 90 Day Eurodollar Chicago Mercantile Exchange 17/09/2018 180 – 44 482 500 (65 012)Interest rate USD 90 Day Eurodollar Chicago Mercantile Exchange 17/12/2018 159 – 39 274 988 (54 125)Interest rate USD 90 Day Eurodollar Chicago Mercantile Exchange 18/03/2019 141 – 34 819 950 (46 037)Interest rate USD 90 Day Eurodollar Chicago Mercantile Exchange 17/06/2019 127 – 31 353 125 (32 575)Interest rate USD 90 Day Eurodollar Chicago Mercantile Exchange 16/09/2019 84 – 20 730 150 (5 587)

The accompanying notes form an integral part of these financial statements.
Schedule of Investments as at September 30, 2016 (cont.)(expressed in USD)
Merrill Lynch Investment Solutions – Merrill Lynch WNT Diversified Futures UCITS Fund
137Merrill Lynch Investment Solutions
Unaudited semi-annual report
Underlying nature
Currency contract
Details
Market
Maturity date
Number of contracts
bought
Number of contracts
soldCommitment
USD
Unrealised appreciation/
(depreciation)USD
Futures contracts (cont.)Interest rate GBP 90 Day Sterling ICE Futures Europe 21/06/2017 167 – 27 040 696 21 271Interest rate GBP 90 Day Sterling ICE Futures Europe 20/09/2017 194 – 31 415 696 26 841Interest rate GBP 90 Day Sterling ICE Futures Europe 20/12/2017 212 – 34 333 996 32 459Interest rate GBP 90 Day Sterling ICE Futures Europe 21/03/2018 212 – 34 333 996 36 843Interest rate GBP 90 Day Sterling ICE Futures Europe 20/06/2018 212 – 34 330 554 34 245Interest rate GBP 90 Day Sterling ICE Futures Europe 19/09/2018 196 – 31 736 386 33 433Interest rate GBP 90 Day Sterling ICE Futures Europe 19/12/2018 171 – 27 682 824 32 848Interest rate GBP 90 Day Sterling ICE Futures Europe 20/03/2019 155 – 25 087 585 32 572Interest rate GBP 90 Day Sterling ICE Futures Europe 19/06/2019 138 – 22 329 321 22 944Interest rate GBP 90 Day Sterling ICE Futures Europe 18/09/2019 89 – 14 396 459 4 725Interest rate EUR Euro BTP Eurex Deutschland 08/12/2016 40 – 6 432 182 (17 531)Interest rate EUR Euro OAT Eurex Deutschland 08/12/2016 46 – 8 277 372 34 894Interest rate EUR German Euro BOBL Eurex Deutschland 08/12/2016 430 – 63 830 383 182 325Interest rate EUR German Euro BUND Eurex Deutschland 08/12/2016 276 – 51 394 973 283 928Interest rate EUR German Euro BUXL Eurex Deutschland 08/12/2016 1 – 215 972 3 551Interest rate EUR German Euro SCHATZ Eurex Deutschland 08/12/2016 634 – 79 894 981 72 727Interest rate GBP Long Gilt ICE Futures Europe 28/12/2016 62 – 10 490 074 (68 977)Interest rate EUR Short Euro BTP Eurex Deutschland 08/12/2016 22 – 2 788 822 (34)Interest rate USD US Long Bond Chicago Board of Trade 20/12/2016 141 – 23 710 031 (208 336)Interest rate USD US Ultra Long Bond Chicago Board of Trade 20/12/2016 88 – 16 181 000 (222 063)Total Futures contracts 2 135 852 944 1 981 658
(a) This security is fair valued. See Notes 2.2.6 and 9
Purchase
Sale
Maturity date Counterparty
Unrealised appreciation/
(depreciation)USD
Forward foreign exchange contracts (cont.)BRL 54 801 841 USD 16 800 000 04/10/2016 Merrill Lynch International Bank Ltd. 68 074USD 16 800 000 BRL 54 617 425 04/10/2016 Merrill Lynch International Bank Ltd. (11 310)CLP 1 999 700 000 USD 3 000 000 28/10/2016 Merrill Lynch International Bank Ltd. 28 821INR 1 639 370 050 USD 24 100 000 28/10/2016 Merrill Lynch International Bank Ltd. 416 198PHP 81 842 100 USD 1 700 000 28/10/2016 Merrill Lynch International Bank Ltd. (13 436)USD 600 000 PHP 29 068 500 28/10/2016 Merrill Lynch International Bank Ltd. 970CNY 40 194 573 USD 6 000 000 31/10/2016 Merrill Lynch International Bank Ltd. 20 176EUR 236 209 959 USD 265 942 887 31/10/2016 State Street Bank and Trust Co. (146 878)GBP 378 405 USD 490 869 31/10/2016 State Street Bank and Trust Co. 964IDR 64 689 200 000 USD 4 900 000 31/10/2016 Merrill Lynch International Bank Ltd. 36 976KRW 1 212 561 000 USD 1 100 000 31/10/2016 Merrill Lynch International Bank Ltd. 781MYR 1 649 500 USD 400 000 31/10/2016 Merrill Lynch International Bank Ltd. (1 744)RUB 135 679 000 USD 2 100 000 31/10/2016 Merrill Lynch International Bank Ltd. 40 315USD 1 600 000 CNY 10 662 740 31/10/2016 Merrill Lynch International Bank Ltd. 2 979USD 1 070 082 EUR 953 674 31/10/2016 State Street Bank and Trust Co. (3 043)

The accompanying notes form an integral part of these financial statements.
Schedule of Investments as at September 30, 2016 (cont.)(expressed in USD)
Merrill Lynch Investment Solutions – Merrill Lynch WNT Diversified Futures UCITS Fund
138 Merrill Lynch Investment Solutions
Unaudited semi-annual report
Purchase
Sale
Maturity date Counterparty
Unrealised appreciation/
(depreciation)USD
Forward foreign exchange contracts (cont.)USD 10 688 GBP 8 241 31/10/2016 State Street Bank and Trust Co. (23)USD 100 000 IDR 1 296 000 000 31/10/2016 Merrill Lynch International Bank Ltd. 1 091USD 200 000 MYR 828 300 31/10/2016 Merrill Lynch International Bank Ltd. 15USD 900 000 TWD 28 189 500 31/10/2016 Merrill Lynch International Bank Ltd. 36BRL 43 220 135 USD 13 200 000 03/11/2016 Merrill Lynch International Bank Ltd. (12 341)USD 100 000 BRL 326 600 03/11/2016 Merrill Lynch International Bank Ltd. 345PHP 81 933 000 USD 1 700 000 29/11/2016 Merrill Lynch International Bank Ltd. (12 998)CNY 30 872 000 USD 4 600 000 30/11/2016 Merrill Lynch International Bank Ltd. 18 631INR 175 856 500 USD 2 600 000 30/11/2016 Merrill Lynch International Bank Ltd. 15 509AUD 600 000 NZD 632 222 21/12/2016 Merrill Lynch International Bank Ltd. (17)EUR 100 000 NOK 931 172 21/12/2016 Merrill Lynch International Bank Ltd. (3 736)EUR 6 900 000 SEK 65 857 809 21/12/2016 Merrill Lynch International Bank Ltd. 65 622HUF 1 924 759 974 EUR 6 200 000 21/12/2016 Merrill Lynch International Bank Ltd. 8 582ILS 751 039 USD 200 000 21/12/2016 Merrill Lynch International Bank Ltd. 512NOK 16 368 192 EUR 1 800 000 21/12/2016 Merrill Lynch International Bank Ltd. 18 076NOK 21 000 000 SEK 21 725 367 21/12/2016 Merrill Lynch International Bank Ltd. 82 248NZD 3 190 683 AUD 3 100 000 21/12/2016 Merrill Lynch International Bank Ltd. (54 867)PLN 36 582 357 EUR 8 400 000 21/12/2016 Merrill Lynch International Bank Ltd. 68 873SEK 2 882 258 EUR 300 000 21/12/2016 Merrill Lynch International Bank Ltd. (641)SEK 1 049 428 NOK 1 000 000 21/12/2016 Merrill Lynch International Bank Ltd. (2 172)SGD 3 137 170 USD 2 300 000 21/12/2016 Merrill Lynch International Bank Ltd. 1 972TRY 28 278 593 USD 9 400 000 21/12/2016 Merrill Lynch International Bank Ltd. (122 173)USD 200 000 ILS 753 459 21/12/2016 Merrill Lynch International Bank Ltd. (1 158)USD 900 000 SGD 1 224 918 21/12/2016 Merrill Lynch International Bank Ltd. 1 188USD 800 000 TRY 2 424 629 21/12/2016 Merrill Lynch International Bank Ltd. 4 512ZAR 56 101 636 USD 3 900 000 21/12/2016 Merrill Lynch International Bank Ltd. 118 544INR 40 674 000 USD 600 000 23/12/2016 Merrill Lynch International Bank Ltd. 2 756Total forward foreign exchange contracts 638 229
The maximum individual counterparty exposure for OTC Derivatives as at September 30, 2016 is 0.54% of the NAV.
The Sub-Fund Merrill Lynch Investment Solutions – Merrill Lynch WNT Diversified Futures UCITS Fund entered into contracts for difference swaps with two counterparties (Morgan Stanley Capital Services Inc. and Morgan Stanley International Plc..) with the following details:
1) Morgan Stanley Capital Services Inc.
Commitment of USD 5 664 884 for the short portfolio composed of 52 equitiesCommitment of USD 1 560 001 for the long portfolio composed of 24 equities
Market value of USD (289 612) detailed as follows:– unrealised depreciation of short portfolio: USD (332 860)– unrealised appreciation of long portfolio: USD 12 302– realised result: USD 30 946 corresponding to the realised gain on securities which is still held at the counterparty (monthly reset)

The accompanying notes form an integral part of these financial statements.
Schedule of Investments as at September 30, 2016 (cont.)(expressed in USD)
Merrill Lynch Investment Solutions – Merrill Lynch WNT Diversified Futures UCITS Fund
139Merrill Lynch Investment Solutions
Unaudited semi-annual report
The below table is composed of long and short positions:
Industrial sector Underlying nature Long/ShortCommitment
USD
Unrealised appreciation/
(depreciation)USD
Shipbuilding Equity Long 742 –Software Equity Long 246 208 (23 954)Software Equity Short 1 876 773 (163 905)Telecommunications Equity Long 553 057 93 454Telecommunications Equity Short 2 281 608 (87 711)Textiles Equity Short 88 033 (3 569)Toys/Games/Hobbies Equity Short 268 978 23 364Transportation Equity Long 759 994 (57 198)Transportation Equity Short 1 149 492 (101 039)Total 7 224 885 (320 558)
2) Morgan Stanley International Plc.
Commitment of USD 22 658 920 for the short portfolio composed of 179 equitiesCommitment of USD 79 179 429 for the long portfolio composed of 311 equities
Market value of USD (452 890) detailed as follows:– unrealised depreciation of short portfolio: USD (72 167)– unrealised depreciation of long portfolio: USD (411 669)– realised result: USD 30 946 corresponding to the realised gain on securities which is still held at the counterparty (monthly reset)
The below table is composed of long and short positions:
Industrial sector Underlying nature Long/ShortCommitment
USD
Unrealised appreciation/
(depreciation)USD
Advertising Equity Long 1 462 183 (26 730)Aerospace/Defense Equity Long 817 480 (645)Aerospace/Defense Equity Short 656 386 2 369Agriculture Equity Long 1 162 822 (45 896)Airlines Equity Long 574 070 (6 039)Airlines Equity Short 80 057 (2 917)Apparel Equity Long 505 007 (29 046)Apparel Equity Short 240 160 7 935Auto Manufacturers Equity Long 967 453 (40 843)Auto Manufacturers Equity Short 9 213 44Auto Parts&Equipment Equity Long 168 086 7 082Banks Equity Long 4 509 421 (88 503)Banks Equity Short 1 014 071 11 637Beverages Equity Long 2 064 770 (7 921)Biotechnology Equity Long 1 597 782 (17 962)Biotechnology Equity Short 616 721 5 764

The accompanying notes form an integral part of these financial statements.
Schedule of Investments as at September 30, 2016 (cont.)(expressed in USD)
Merrill Lynch Investment Solutions – Merrill Lynch WNT Diversified Futures UCITS Fund
140 Merrill Lynch Investment Solutions
Unaudited semi-annual report
Industrial sector Underlying nature Long/ShortCommitment
USD
Unrealised appreciation/
(depreciation)USD
Building Materials Equity Long 228 436 (7 789)Building Materials Equity Short 192 539 (2 094)Chemicals Equity Long 2 336 430 6 818Chemicals Equity Short 277 735 1 028Commercial Services Equity Long 1 538 816 (36 532)Commercial Services Equity Short 460 705 2 860Computers Equity Long 4 022 050 251 057Cosmetics/Personal Care Equity Long 959 649 9 848Distribution/Wholesale Equity Long 507 726 (9 014)Distribution/Wholesale Equity Short 36 424 943Diversified Financial Services Equity Long 3 292 152 (46 871)Diversified Financial Services Equity Short 752 924 (13 623)Electrical Compo&Equip Equity Long 308 378 10 258Electrical Compo&Equip Equity Short 119 456 (2 981)Electric Equity Long 698 260 (7 224)Electric Equity Short 2 133 327 1 858Electronics Equity Long 1 232 953 8 390Electronics Equity Short 338 012 (3 509)Energy-Alternate Sources Equity Long 24 286 1 223Engineering&Construction Equity Long 393 795 (3 438)Environmental Control Equity Long 528 135 (5 179)Food Equity Long 2 200 552 (55 190)Food Equity Short 263 292 10 060Forest Products&Paper Equity Short 204 875 2 144Gas Equity Long 70 257 223Gas Equity Short 819 827 (23 597)Hand/Machine Tools Equity Long 138 588 (1 127)Hand/Machine Tools Equity Short 245 345 1 124Healthcare-Products Equity Long 2 531 684 38 539Healthcare-Products Equity Short 2 374 297 (27 200)Healthcare-Services Equity Long 778 093 3 259Healthcare-Services Equity Short 69 565 (1 046)Holding Companies-Divers Equity Short 181 584 977Home Builders Equity Long 941 047 (46 903)Home Builders Equity Short 228 214 10 214Home Furnishings Equity Long 321 698 (32 236)Home Furnishings Equity Short 37 834 (98)Household Products/Wares Equity Long 1 338 151 (26 804)Housewares Equity Short 103 424 (2 264)Insurance Equity Long 6 301 686 (46 756)Insurance Equity Short 657 547 56Internet Equity Long 1 972 462 68 795Internet Equity Short 434 490 (5 040)Iron/Steel Equity Long 407 567 7 927Leisure Time Equity Long 639 714 (56)

The accompanying notes form an integral part of these financial statements.
Schedule of Investments as at September 30, 2016 (cont.)(expressed in USD)
Merrill Lynch Investment Solutions – Merrill Lynch WNT Diversified Futures UCITS Fund
141Merrill Lynch Investment Solutions
Unaudited semi-annual report
Industrial sector Underlying nature Long/ShortCommitment
USD
Unrealised appreciation/
(depreciation)USD
Leisure Time Equity Short 63 208 (2 277)Lodging Equity Long 303 793 (14 182)Lodging Equity Short 137 460 (11 112)Machinery-Constr&Mining Equity Short 2 841 (219)Machinery-Diversified Equity Long 812 758 22 142Machinery-Diversified Equity Short 112 231 (2 260)Media Equity Long 1 995 882 (7 866)Media Equity Short 35 143 36Mining Equity Long 80 191 1 122Mining Equity Short 59 018 (1 042)Miscellaneous Manufactur Equity Long 1 181 088 (22 310)Miscellaneous Manufactur Equity Short 495 812 (1 117)Office/Business Equip Equity Long 143 432 1 774Oil&Gas Services Equity Long 144 048 7 194Oil&Gas Services Equity Short 793 515 (20 907)Oil&Gas Equity Long 1 231 706 2 930Oil&Gas Equity Short 1 557 920 13 789Packaging&Containers Equity Short 615 062 (11 328)Pharmaceuticals Equity Long 2 611 147 (108 541)Pharmaceuticals Equity Short 952 822 24 196Pipelines Equity Short 473 395 (72 080)Real Estate Equity Short 222 805 14 617REITS Equity Long 2 425 632 (21 517)REITS Equity Short 1 406 016 18 650Retail Equity Long 10 407 659 (182 985)Retail Equity Short 570 059 27 947Savings&Loans Equity Short 9 239 251Semiconductors Equity Long 4 532 878 172 842Semiconductors Equity Short 96 783 (4 560)Software Equity Long 2 568 519 (53 502)Software Equity Short 1 731 146 (1 666)Telecommunications Equity Long 2 135 964 7 390Telecommunications Equity Short 123 870 10 937Textiles Equity Long 55 895 (3 349)Toys/Games/Hobbies Equity Long 629 364 (43 978)Transportation Equity Long 377 833 6 452Transportation Equity Short 652 549 (28 667)Total 101 838 346 (483 837)
The total market value of the contracts for difference swaps is USD (452 890).

The accompanying notes form an integral part of these financial statements.
Schedule of Investments as at September 30, 2016 (expressed in EUR)
Merrill Lynch Investment Solutions – Merrill Lynch Enhanced Equity Volatility Premium Fund
142 Merrill Lynch Investment Solutions
Unaudited semi-annual report
Merrill Lynch Investment Solutions – Merrill Lynch Enhanced Equity Volatility Premium Fund
Schedule of Investments as at September 30, 2016 (expressed in EUR)
Nominal value Description
Quotation Currency
Cost EUR
Market value
EUR% of net
assets
Transferable securities and money market instruments admitted to an official exchange listing or dealt in on another regulated market
Supranationals, Governments and Local Public Authorities, Debt Instruments1 000 Bundesrepublik Deutschland 1.500% 15/02/2023 EUR 985 1 130 0.001 000 Bundesrepublik Deutschland 1.500% 15/05/2023 EUR 981 1 135 0.001 000 Bundesrepublik Deutschland 2.000% 15/08/2023 EUR 1 010 1 174 0.001 000 Bundesrepublik Deutschland 5.625% 04/01/2028 EUR 1 314 1 653 0.001 000 Bundesrepublik Deutschland 6.250% 04/01/2024 EUR 1 292 1 497 0.001 000 Bundesrepublik Deutschland 6.500% 04/07/2027 EUR 1 391 1 725 0.00
8 200 000 France Treasury Bill BTF 0.000% 12/10/2016 EUR 8 201 799 8 201 230 9.248 500 000 France Treasury Bill BTF 0.000% 01/02/2017 EUR 8 522 220 8 519 456 9.609 000 000 France Treasury Bill BTF 0.000% 01/03/2017(a) EUR 9 027 984 9 023 742 10.168 000 000 France Treasury Bill BTF 0.000% 29/03/2017 EUR 8 029 629 8 023 200 9.048 000 000 German Treasury Bill 0.000% 16/11/2016 EUR 8 008 555 8 007 176 9.026 000 000 German Treasury Bill 0.000% 07/12/2016 EUR 6 009 352 6 007 134 6.778 500 000 German Treasury Bill 0.000% 11/01/2017 EUR 8 520 847 8 516 932 9.596 000 000 German Treasury Bill 0.000% 25/01/2017 EUR 6 017 636 6 013 086 6.778 000 000 German Treasury Bill 0.000% 15/02/2017 EUR 8 024 791 8 021 264 9.039 000 000 German Treasury Bill 0.000% 15/03/2017 EUR 9 031 237 9 026 901 10.17
Total Supranationals, Governments and Local Public Authorities, Debt Instruments 79 401 023 79 368 435 89.39Total Investments 79 401 023 79 368 435 89.39
(a) This security is fair valued. See Notes 2.2.6 and 9.
Industrial classification of investments(as a percentage of net assets as at September 30, 2016) %
Geographical classification of investments(as a percentage of net assets as at September 30, 2016) %
Sovereign 89.39 Germany 51.3589.39 France 38.04
89.39
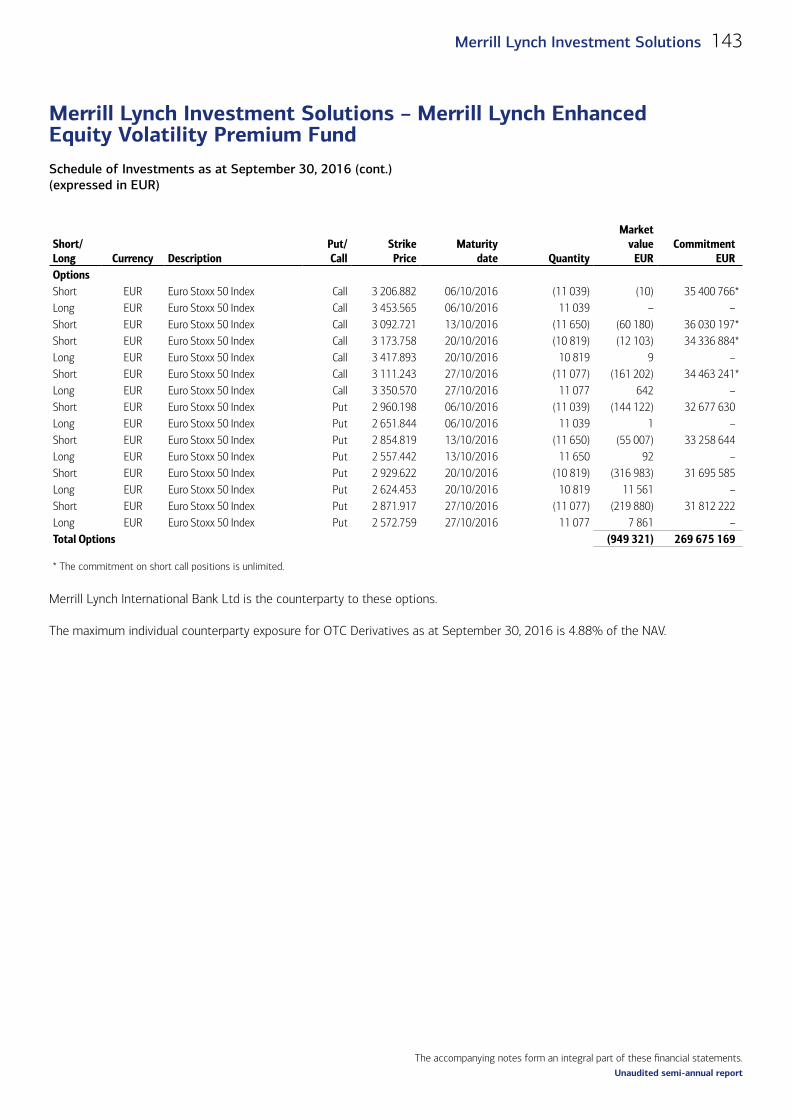
The accompanying notes form an integral part of these financial statements.
Schedule of Investments as at September 30, 2016 (cont.)(expressed in EUR)
Merrill Lynch Investment Solutions – Merrill Lynch Enhanced Equity Volatility Premium Fund
143Merrill Lynch Investment Solutions
Unaudited semi-annual report
Short/Long
Currency Description
Put/ Call
Strike Price
Maturity date Quantity
Market value
EURCommitment
EUROptionsShort EUR Euro Stoxx 50 Index Call 3 206.882 06/10/2016 (11 039) (10) 35 400 766*Long EUR Euro Stoxx 50 Index Call 3 453.565 06/10/2016 11 039 – –Short EUR Euro Stoxx 50 Index Call 3 092.721 13/10/2016 (11 650) (60 180) 36 030 197*Short EUR Euro Stoxx 50 Index Call 3 173.758 20/10/2016 (10 819) (12 103) 34 336 884*Long EUR Euro Stoxx 50 Index Call 3 417.893 20/10/2016 10 819 9 –Short EUR Euro Stoxx 50 Index Call 3 111.243 27/10/2016 (11 077) (161 202) 34 463 241*Long EUR Euro Stoxx 50 Index Call 3 350.570 27/10/2016 11 077 642 –Short EUR Euro Stoxx 50 Index Put 2 960.198 06/10/2016 (11 039) (144 122) 32 677 630Long EUR Euro Stoxx 50 Index Put 2 651.844 06/10/2016 11 039 1 –Short EUR Euro Stoxx 50 Index Put 2 854.819 13/10/2016 (11 650) (55 007) 33 258 644Long EUR Euro Stoxx 50 Index Put 2 557.442 13/10/2016 11 650 92 –Short EUR Euro Stoxx 50 Index Put 2 929.622 20/10/2016 (10 819) (316 983) 31 695 585Long EUR Euro Stoxx 50 Index Put 2 624.453 20/10/2016 10 819 11 561 –Short EUR Euro Stoxx 50 Index Put 2 871.917 27/10/2016 (11 077) (219 880) 31 812 222Long EUR Euro Stoxx 50 Index Put 2 572.759 27/10/2016 11 077 7 861 –Total Options (949 321) 269 675 169
* The commitment on short call positions is unlimited.
Merrill Lynch International Bank Ltd is the counterparty to these options.
The maximum individual counterparty exposure for OTC Derivatives as at September 30, 2016 is 4.88% of the NAV.

The accompanying notes form an integral part of these financial statements.
Schedule of Investments as at September 30, 2016 (expressed in USD)
Merrill Lynch Investment Solutions – Merrill Lynch MLCX Commodity Enhanced Beta Fund
144 Merrill Lynch Investment Solutions
Unaudited semi-annual report
Merrill Lynch Investment Solutions – Merrill Lynch MLCX Commodity Enhanced Beta Fund
Schedule of Investments as at September 30, 2016 (expressed in USD)
Nominal value Description
Quotation Currency
Cost USD
Market value
USD% of net
assets
Transferable securities and money market instruments admitted to an official exchange listing or dealt in on another regulated market
Supranationals, Governments and Local Public Authorities, Debt Instruments1 700 000 United States Treasury Bill 0.000% 06/10/2016 USD 1 699 932 1 699 985 8.551 300 000 United States Treasury Bill 0.000% 13/10/2016 USD 1 299 879 1 299 939 6.541 100 000 United States Treasury Bill 0.000% 20/10/2016 USD 1 099 854 1 099 930 5.531 800 000 United States Treasury Bill 0.000% 27/10/2016 USD 1 799 720 1 799 768 9.051 300 000 United States Treasury Bill 0.000% 03/11/2016 USD 1 299 696 1 299 778 6.541 600 000 United States Treasury Bill 0.000% 10/11/2016 USD 1 599 518 1 599 667 8.051 900 000 United States Treasury Bill 0.000% 17/11/2016 USD 1 899 318 1 899 584 9.551 800 000 United States Treasury Bill 0.000% 25/11/2016 USD 1 799 174 1 799 561 9.051 500 000 United States Treasury Bill 0.000% 01/12/2016 USD 1 499 276 1 499 554 7.541 600 000 United States Treasury Bill 0.000% 08/12/2016 USD 1 599 108 1 599 465 8.041 200 000 United States Treasury Bill 0.000% 15/12/2016 USD 1 199 663 1 199 550 6.031 200 000 United States Treasury Bill 0.000% 22/12/2016 USD 1 199 481 1 199 370 6.03
1 000 United States Treasury Note/Bond 6.000% 15/02/2026 USD 1 345 1 386 0.011 000 United States Treasury Note/Bond 6.500% 15/11/2026 USD 1 410 1 456 0.011 000 United States Treasury Note/Bond 6.750% 15/08/2026 USD 1 426 1 472 0.011 000 United States Treasury Note/Bond 6.875% 15/08/2025 USD 1 404 1 446 0.011 000 United States Treasury Note/Bond 7.500% 15/11/2024 USD 1 426 1 464 0.011 000 United States Treasury Note/Bond 7.625% 15/02/2025 USD 1 447 1 485 0.01
Total Supranationals, Governments and Local Public Authorities, Debt Instruments 18 003 077 18 004 860 90.56Total Investments 18 003 077 18 004 860 90.56
Industrial classification of investments(as a percentage of net assets as at September 30, 2016) %
Geographical classification of investments(as a percentage of net assets as at September 30, 2016) %
Sovereign 90.56 United States 90.5690.56 90.56
Purchase
Sale
Maturity date Counterparty
Unrealised appreciation/
(depreciation)USD
Forward foreign exchange contracts EUR 14 315 827 USD 16 087 114 31/10/2016 State Street Bank and Trust Co. 21 817GBP 91 924 USD 119 223 31/10/2016 State Street Bank and Trust Co. 255SEK 2 241 581 USD 262 641 31/10/2016 State Street Bank and Trust Co. (644)USD 64 642 EUR 57 528 31/10/2016 State Street Bank and Trust Co. (91)USD 2 670 GBP 2 059 31/10/2016 State Street Bank and Trust Co. (6)USD 3 224 SEK 27 517 31/10/2016 State Street Bank and Trust Co. 8Total forward foreign exchange contracts 21 339

The accompanying notes form an integral part of these financial statements.
Schedule of Investments as at September 30, 2016 (cont.)(expressed in USD)
Merrill Lynch Investment Solutions – Merrill Lynch MLCX Commodity Enhanced Beta Fund
145Merrill Lynch Investment Solutions
Unaudited semi-annual report
Notional
Pay
Receive
Currency
Maturity date Counterparty
Unrealised appreciation/
(depreciation) USD
Commitment USD
Equity swaps(19 464 842) Merrill Lynch eXtra Commodity
03 Total Return Index USD 1 month LIBOR USD 09/02/2017Merrill Lynch International
Bank Ltd 355 176 19 464 842Total Equity swaps 355 176 19 464 842
The maximum individual counterparty exposure for OTC Derivatives as at September 30, 2016 is 4.43% of the NAV.
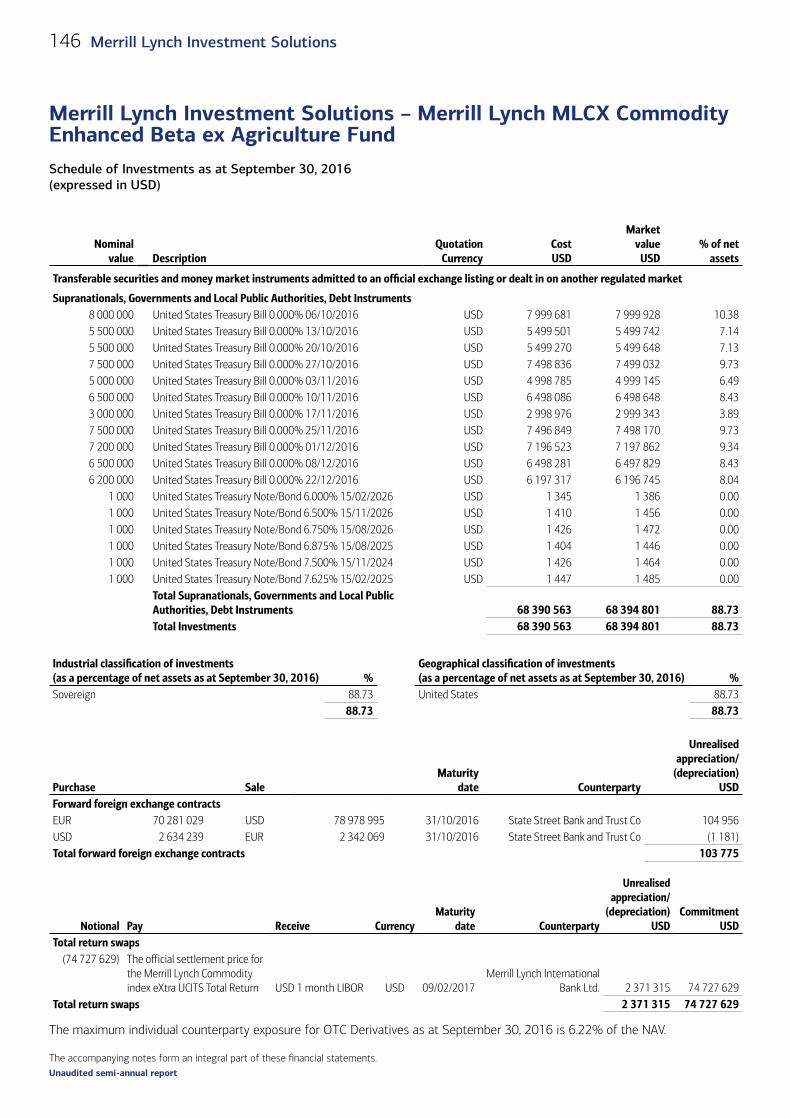
The accompanying notes form an integral part of these financial statements.
Schedule of Investments as at September 30, 2016 (expressed in USD)
Merrill Lynch Investment Solutions – Merrill Lynch MLCX Commodity Enhanced Beta ex Agriculture Fund
146 Merrill Lynch Investment Solutions
Unaudited semi-annual report
Merrill Lynch Investment Solutions – Merrill Lynch MLCX Commodity Enhanced Beta ex Agriculture Fund
Schedule of Investments as at September 30, 2016 (expressed in USD)
Nominal value Description
Quotation Currency
Cost USD
Market value
USD% of net
assets
Transferable securities and money market instruments admitted to an official exchange listing or dealt in on another regulated market
Supranationals, Governments and Local Public Authorities, Debt Instruments8 000 000 United States Treasury Bill 0.000% 06/10/2016 USD 7 999 681 7 999 928 10.385 500 000 United States Treasury Bill 0.000% 13/10/2016 USD 5 499 501 5 499 742 7.145 500 000 United States Treasury Bill 0.000% 20/10/2016 USD 5 499 270 5 499 648 7.137 500 000 United States Treasury Bill 0.000% 27/10/2016 USD 7 498 836 7 499 032 9.735 000 000 United States Treasury Bill 0.000% 03/11/2016 USD 4 998 785 4 999 145 6.496 500 000 United States Treasury Bill 0.000% 10/11/2016 USD 6 498 086 6 498 648 8.433 000 000 United States Treasury Bill 0.000% 17/11/2016 USD 2 998 976 2 999 343 3.897 500 000 United States Treasury Bill 0.000% 25/11/2016 USD 7 496 849 7 498 170 9.737 200 000 United States Treasury Bill 0.000% 01/12/2016 USD 7 196 523 7 197 862 9.346 500 000 United States Treasury Bill 0.000% 08/12/2016 USD 6 498 281 6 497 829 8.436 200 000 United States Treasury Bill 0.000% 22/12/2016 USD 6 197 317 6 196 745 8.04
1 000 United States Treasury Note/Bond 6.000% 15/02/2026 USD 1 345 1 386 0.001 000 United States Treasury Note/Bond 6.500% 15/11/2026 USD 1 410 1 456 0.001 000 United States Treasury Note/Bond 6.750% 15/08/2026 USD 1 426 1 472 0.001 000 United States Treasury Note/Bond 6.875% 15/08/2025 USD 1 404 1 446 0.001 000 United States Treasury Note/Bond 7.500% 15/11/2024 USD 1 426 1 464 0.001 000 United States Treasury Note/Bond 7.625% 15/02/2025 USD 1 447 1 485 0.00
Total Supranationals, Governments and Local Public Authorities, Debt Instruments 68 390 563 68 394 801 88.73Total Investments 68 390 563 68 394 801 88.73
Industrial classification of investments(as a percentage of net assets as at September 30, 2016) %
Geographical classification of investments(as a percentage of net assets as at September 30, 2016) %
Sovereign 88.73 United States 88.7388.73 88.73
Purchase
Sale
Maturity date Counterparty
Unrealised appreciation/
(depreciation)USD
Forward foreign exchange contracts EUR 70 281 029 USD 78 978 995 31/10/2016 State Street Bank and Trust Co 104 956USD 2 634 239 EUR 2 342 069 31/10/2016 State Street Bank and Trust Co (1 181)Total forward foreign exchange contracts 103 775
Notional
Pay
Receive
Currency
Maturity date Counterparty
Unrealised appreciation/
(depreciation)USD
Commitment USD
Total return swaps(74 727 629) The official settlement price for
the Merrill Lynch Commodity index eXtra UCITS Total Return USD 1 month LIBOR USD 09/02/2017
Merrill Lynch International Bank Ltd. 2 371 315 74 727 629
Total return swaps 2 371 315 74 727 629
The maximum individual counterparty exposure for OTC Derivatives as at September 30, 2016 is 6.22% of the NAV.

The accompanying notes form an integral part of these financial statements.
Schedule of Investments as at September 30, 2016 (expressed in USD)
Merrill Lynch Investment Solutions – Merrill Lynch MLCX Commodity Alpha Fund
147Merrill Lynch Investment Solutions
Unaudited semi-annual report
Merrill Lynch Investment Solutions – Merrill Lynch MLCX Commodity Alpha Fund
Schedule of Investments as at September 30, 2016 (expressed in USD)
Nominal value Description
Quotation Currency
Cost USD
Market value
USD% of net
assets
Transferable securities and money market instruments admitted to an official exchange listing or dealt in on another regulated market
Supranationals, Governments and Local Public Authorities, Debt Instruments1 800 000 United States Treasury Bill 0.000% 06/10/2016 USD 1 799 940 1 799 984 8.351 800 000 United States Treasury Bill 0.000% 13/10/2016 USD 1 799 865 1 799 915 8.351 400 000 United States Treasury Bill 0.000% 20/10/2016 USD 1 399 832 1 399 910 6.491 700 000 United States Treasury Bill 0.000% 27/10/2016 USD 1 699 716 1 699 781 7.891 800 000 United States Treasury Bill 0.000% 03/11/2016 USD 1 799 563 1 799 692 8.351 700 000 United States Treasury Bill 0.000% 10/11/2016 USD 1 699 500 1 699 646 7.881 800 000 United States Treasury Bill 0.000% 17/11/2016 USD 1 799 385 1 799 606 8.351 600 000 United States Treasury Bill 0.000% 25/11/2016 USD 1 599 328 1 599 610 7.421 600 000 United States Treasury Bill 0.000% 01/12/2016 USD 1 599 214 1 599 525 7.421 600 000 United States Treasury Bill 0.000% 08/12/2016 USD 1 599 108 1 599 466 7.421 450 000 United States Treasury Bill 0.000% 15/12/2016 USD 1 449 592 1 449 456 6.721 200 000 United States Treasury Bill 0.000% 22/12/2016 USD 1 199 481 1 199 370 5.56
1 000 United States Treasury Note/Bond 6.000% 15/02/2026 USD 1 364 1 386 0.011 000 United States Treasury Note/Bond 6.500% 15/11/2026 USD 1 430 1 456 0.011 000 United States Treasury Note/Bond 6.750% 15/08/2026 USD 1 445 1 472 0.011 000 United States Treasury Note/Bond 6.875% 15/08/2025 USD 1 421 1 446 0.011 000 United States Treasury Note/Bond 7.500% 15/11/2024 USD 1 441 1 464 0.011 000 United States Treasury Note/Bond 7.625% 15/02/2025 USD 1 461 1 485 0.01
Total Supranationals, Governments and Local Public Authorities, Debt Instruments 19 453 086 19 454 670 90.26Total Investments 19 453 086 19 454 670 90.26
Industrial classification of investments(as a percentage of net assets as at September 30, 2016) %
Geographical classification of investments(as a percentage of net assets as at September 30, 2016) %
Sovereign 90.26 United States 90.26 90.26 90.26
Purchase
Sale
Maturity date Counterparty
Unrealised appreciation/
(depreciation)USD
Forward foreign exchange contracts EUR 9 009 392 USD 10 143 449 31/10/2016 State Street Bank and Trust Co. (5 602)GBP 7 101 243 USD 9 211 768 31/10/2016 State Street Bank and Trust Co. 18 095USD 74 506 EUR 66 217 31/10/2016 State Street Bank and Trust Co. (5)USD 241 893 GBP 186 504 31/10/2016 State Street Bank and Trust Co. (517)Total forward foreign exchange contracts 11 971
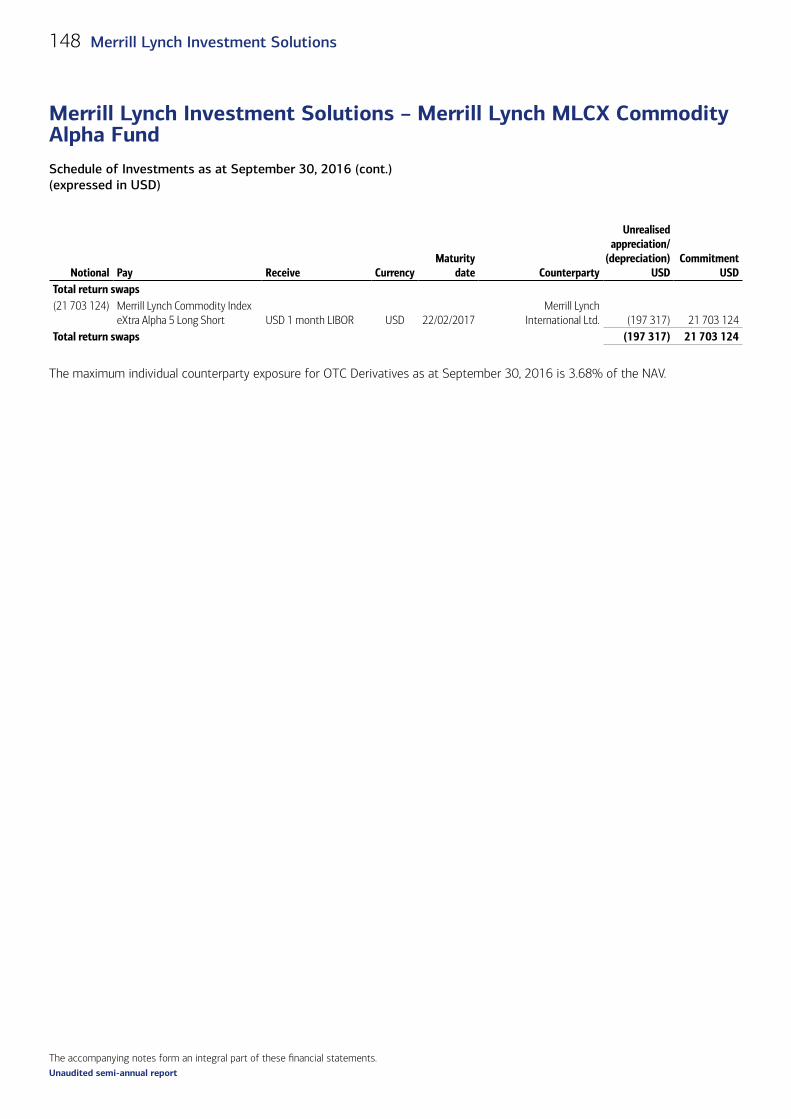
The accompanying notes form an integral part of these financial statements.
Schedule of Investments as at September 30, 2016 (cont.)(expressed in USD)
Merrill Lynch Investment Solutions – Merrill Lynch MLCX Commodity Alpha Fund
148 Merrill Lynch Investment Solutions
Unaudited semi-annual report
Notional
Pay
Receive
Currency
Maturity date Counterparty
Unrealised appreciation/
(depreciation)USD
Commitment USD
Total return swaps(21 703 124) Merrill Lynch Commodity Index
eXtra Alpha 5 Long Short USD 1 month LIBOR USD 22/02/2017Merrill Lynch
International Ltd. (197 317) 21 703 124Total return swaps (197 317) 21 703 124
The maximum individual counterparty exposure for OTC Derivatives as at September 30, 2016 is 3.68% of the NAV.

The accompanying notes form an integral part of these financial statements.
Schedule of Investments as at September 30, 2016 (expressed in EUR)
Merrill Lynch Investment Solutions – Fenician Equity Long Short UCITS Fund
149Merrill Lynch Investment Solutions
Unaudited semi-annual report
Merrill Lynch Investment Solutions – Fenician Equity Long Short UCITS Fund
Schedule of Investments as at September 30, 2016 (expressed in EUR)
Nominal value/
Quantity DescriptionQuotation
CurrencyCost EUR
Market value
EUR% of net
assets
Transferable securities and money market instruments admitted to an official exchange listing or dealt in on another regulated market
Shares7 000 Anheuser-Busch InBev S.A./NV EUR 802 499 816 200 2.21
225 500 Banca Popolare dell’Emilia Romagna SC EUR 765 746 746 856 2.02175 704 Banco Popolare SC EUR 364 043 368 275 1.00194 117 Buzzi Unicem SpA - Rsp EUR 1 612 826 1 960 582 5.30
15 600 Cover 50 SpA EUR 289 865 147 030 0.40350 000 Italcementi SpA EUR 3 699 236 3 703 000 10.02
46 600 Koninklijke Ahold Delhaize NV EUR 987 749 945 514 2.5653 000 Koninklijke Philips NV EUR 1 242 995 1 398 140 3.78
7 500 Monsanto Co. USD 731 499 682 061 1.8540 000 Porsche Automobil Hldg. SE - Pref EUR 1 891 066 1 817 400 4.92
320 000 Telecom Italia SpA EUR 238 262 236 480 0.64945 000 Telecom Italia SpA - Rsp EUR 591 375 570 780 1.54
Total Shares 13 217 161 13 392 318 36.24
Supranationals, Governments and Local Public Authorities, Debt Instruments
7 000 000 Italy Buoni Ordinari del Tesoro BOT 0.000% 31/03/2017 EUR 7 009 398 7 007 840 18.97Total Supranationals, Governments and Local Public Authorities, Debt Instruments 7 009 398 7 007 840 18.97Total Investments 20 226 559 20 400 158 55.21
Industrial classification of investments(as a percentage of net assets as at September 30, 2016) %
Geographical classification of investments(as a percentage of net assets as at September 30, 2016) %
Sovereign 18.97 Italy 39.89 Building Materials 15.32 Netherlands 6.34 Auto Manufacturers 4.92 Germany 4.92 Electronics 3.78 Belgium 2.21 Banks 3.02 United States 1.85 Food 2.56 55.21Beverages 2.21 Telecommunications 2.18 Chemicals 1.85 Apparel 0.40
55.21
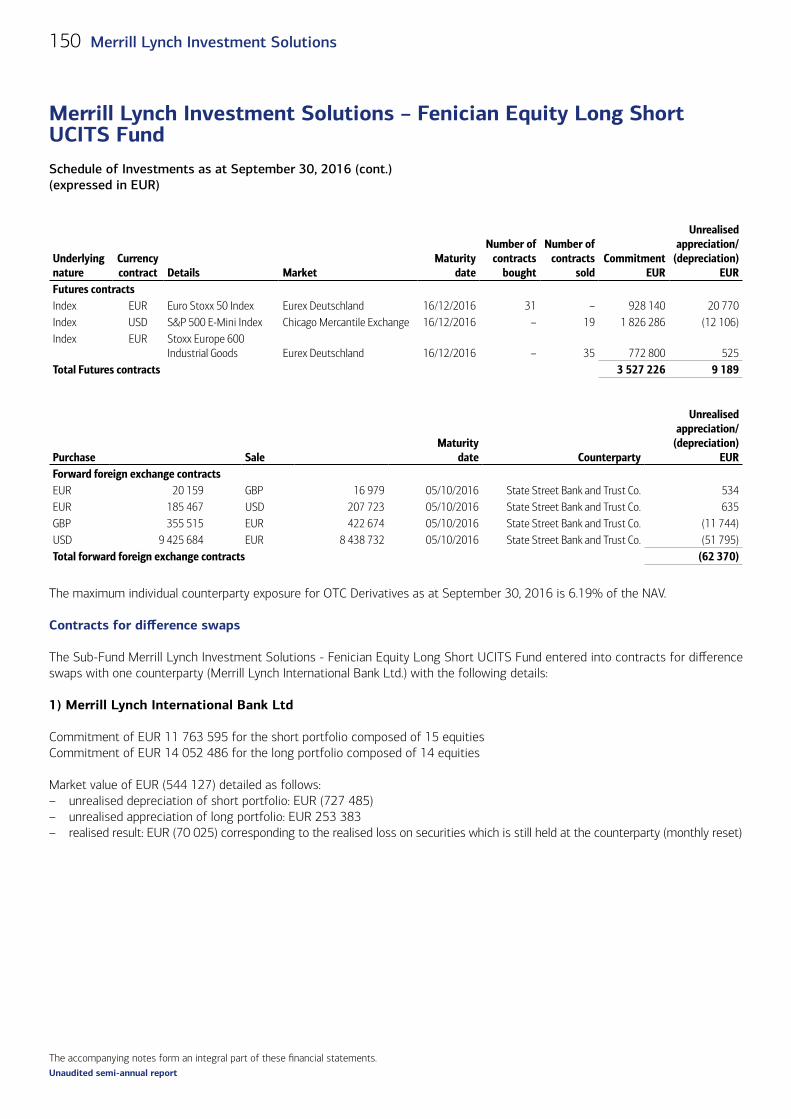
The accompanying notes form an integral part of these financial statements.
Schedule of Investments as at September 30, 2016 (cont.)(expressed in EUR)
Merrill Lynch Investment Solutions – Fenician Equity Long Short UCITS Fund
150 Merrill Lynch Investment Solutions
Unaudited semi-annual report
Underlying nature
Currency contract
Details
Market
Maturity date
Number of contracts
bought
Number of contracts
soldCommitment
EUR
Unrealised appreciation/
(depreciation)EUR
Futures contractsIndex EUR Euro Stoxx 50 Index Eurex Deutschland 16/12/2016 31 – 928 140 20 770Index USD S&P 500 E-Mini Index Chicago Mercantile Exchange 16/12/2016 – 19 1 826 286 (12 106)Index EUR Stoxx Europe 600
Industrial Goods Eurex Deutschland 16/12/2016 – 35 772 800 525Total Futures contracts 3 527 226 9 189
Purchase
Sale
Maturity date Counterparty
Unrealised appreciation/
(depreciation)EUR
Forward foreign exchange contracts EUR 20 159 GBP 16 979 05/10/2016 State Street Bank and Trust Co. 534EUR 185 467 USD 207 723 05/10/2016 State Street Bank and Trust Co. 635GBP 355 515 EUR 422 674 05/10/2016 State Street Bank and Trust Co. (11 744)USD 9 425 684 EUR 8 438 732 05/10/2016 State Street Bank and Trust Co. (51 795)Total forward foreign exchange contracts (62 370)
The maximum individual counterparty exposure for OTC Derivatives as at September 30, 2016 is 6.19% of the NAV.
Contracts for difference swaps
The Sub-Fund Merrill Lynch Investment Solutions - Fenician Equity Long Short UCITS Fund entered into contracts for difference swaps with one counterparty (Merrill Lynch International Bank Ltd.) with the following details:
1) Merrill Lynch International Bank Ltd
Commitment of EUR 11 763 595 for the short portfolio composed of 15 equitiesCommitment of EUR 14 052 486 for the long portfolio composed of 14 equities
Market value of EUR (544 127) detailed as follows:– unrealised depreciation of short portfolio: EUR (727 485)– unrealised appreciation of long portfolio: EUR 253 383– realised result: EUR (70 025) corresponding to the realised loss on securities which is still held at the counterparty (monthly reset)

The accompanying notes form an integral part of these financial statements.
Schedule of Investments as at September 30, 2016 (cont.)(expressed in EUR)
Merrill Lynch Investment Solutions – Fenician Equity Long Short UCITS Fund
151Merrill Lynch Investment Solutions
Unaudited semi-annual report
The below table is composed of long and short positions:
Industrial sector Underlying nature Long/ShortCommitment
EUR
Unrealised appreciation/
(depreciation)EUR
Airlines Equity Long 969 120 36 651Apparel Equity Short 386 250 (11 612)Auto Manufacturers Equity Short 1 782 270 39 136Banks Equity Short 1 151 877 (737)Beverages Equity Long 4 614 702 155 534Building Materials Equity Long 744 125 46 076Building Materials Equity Short 1 688 125 (381 830)Chemicals Equity Long 363 766 (10 965)Food Equity Long 1 153 250 27 123Food Equity Short 860 690 (49 571)Fund - Equity Equity Short 1 652 605 (163 351)Household Products/Wares Equity Short 571 037 1 291Insurance Equity Long 1 575 632 (185 680)Insurance Equity Short 1 569 632 (20 187)Leisure Time Equity Long 810 281 3 109Media Equity Long 2 013 272 2 360Media Equity Short 552 818 15 749Mining Equity Long 465 062 94 388Mining Equity Short 544 065 (179 986)Oil&Gas Equity Short 388 325 3 693Pharmaceuticals Equity Long 953 236 74 963Pharmaceuticals Equity Short 259 973 6 553Retail Equity Short 355 928 13 367Telecommunications Equity Long 390 040 9 824Total 25 816 081 (474 102)
The total market value of the contracts for difference swaps is EUR (544 129).
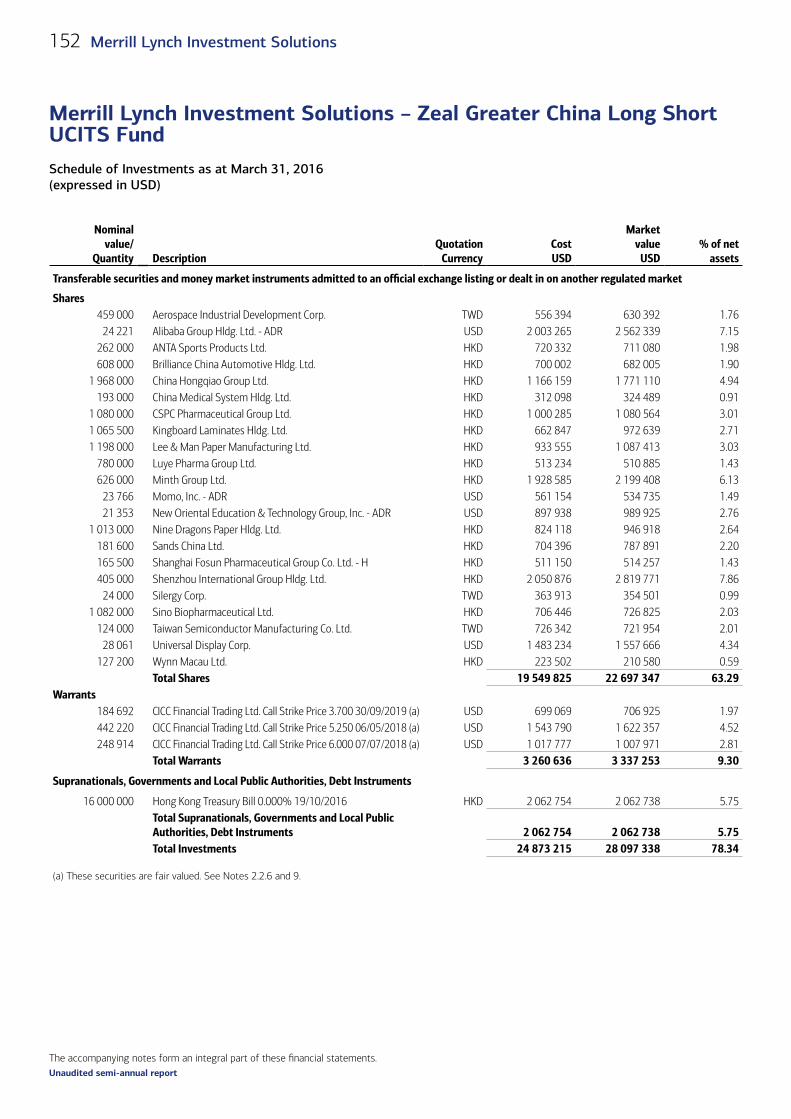
The accompanying notes form an integral part of these financial statements.
Schedule of Investments as at March 31, 2016 (expressed in USD)
Merrill Lynch Investment Solutions – Zeal Greater China Long Short UCITS Fund
152 Merrill Lynch Investment Solutions
Unaudited semi-annual report
Nominal value/
Quantity DescriptionQuotation
CurrencyCost USD
Market value
USD% of net
assets
Transferable securities and money market instruments admitted to an official exchange listing or dealt in on another regulated market
Shares459 000 Aerospace Industrial Development Corp. TWD 556 394 630 392 1.76
24 221 Alibaba Group Hldg. Ltd. - ADR USD 2 003 265 2 562 339 7.15262 000 ANTA Sports Products Ltd. HKD 720 332 711 080 1.98608 000 Brilliance China Automotive Hldg. Ltd. HKD 700 002 682 005 1.90
1 968 000 China Hongqiao Group Ltd. HKD 1 166 159 1 771 110 4.94193 000 China Medical System Hldg. Ltd. HKD 312 098 324 489 0.91
1 080 000 CSPC Pharmaceutical Group Ltd. HKD 1 000 285 1 080 564 3.011 065 500 Kingboard Laminates Hldg. Ltd. HKD 662 847 972 639 2.711 198 000 Lee & Man Paper Manufacturing Ltd. HKD 933 555 1 087 413 3.03
780 000 Luye Pharma Group Ltd. HKD 513 234 510 885 1.43626 000 Minth Group Ltd. HKD 1 928 585 2 199 408 6.13
23 766 Momo, Inc. - ADR USD 561 154 534 735 1.4921 353 New Oriental Education & Technology Group, Inc. - ADR USD 897 938 989 925 2.76
1 013 000 Nine Dragons Paper Hldg. Ltd. HKD 824 118 946 918 2.64181 600 Sands China Ltd. HKD 704 396 787 891 2.20165 500 Shanghai Fosun Pharmaceutical Group Co. Ltd. - H HKD 511 150 514 257 1.43405 000 Shenzhou International Group Hldg. Ltd. HKD 2 050 876 2 819 771 7.86
24 000 Silergy Corp. TWD 363 913 354 501 0.991 082 000 Sino Biopharmaceutical Ltd. HKD 706 446 726 825 2.03
124 000 Taiwan Semiconductor Manufacturing Co. Ltd. TWD 726 342 721 954 2.0128 061 Universal Display Corp. USD 1 483 234 1 557 666 4.34
127 200 Wynn Macau Ltd. HKD 223 502 210 580 0.59Total Shares 19 549 825 22 697 347 63.29
Warrants184 692 CICC Financial Trading Ltd. Call Strike Price 3.700 30/09/2019 (a) USD 699 069 706 925 1.97442 220 CICC Financial Trading Ltd. Call Strike Price 5.250 06/05/2018 (a) USD 1 543 790 1 622 357 4.52248 914 CICC Financial Trading Ltd. Call Strike Price 6.000 07/07/2018 (a) USD 1 017 777 1 007 971 2.81
Total Warrants 3 260 636 3 337 253 9.30
Supranationals, Governments and Local Public Authorities, Debt Instruments
16 000 000 Hong Kong Treasury Bill 0.000% 19/10/2016 HKD 2 062 754 2 062 738 5.75Total Supranationals, Governments and Local Public Authorities, Debt Instruments 2 062 754 2 062 738 5.75Total Investments 24 873 215 28 097 338 78.34
(a) These securities are fair valued. See Notes 2.2.6 and 9.
Merrill Lynch Investment Solutions – Zeal Greater China Long Short UCITS Fund
Schedule of Investments as at March 31, 2016 (expressed in USD)
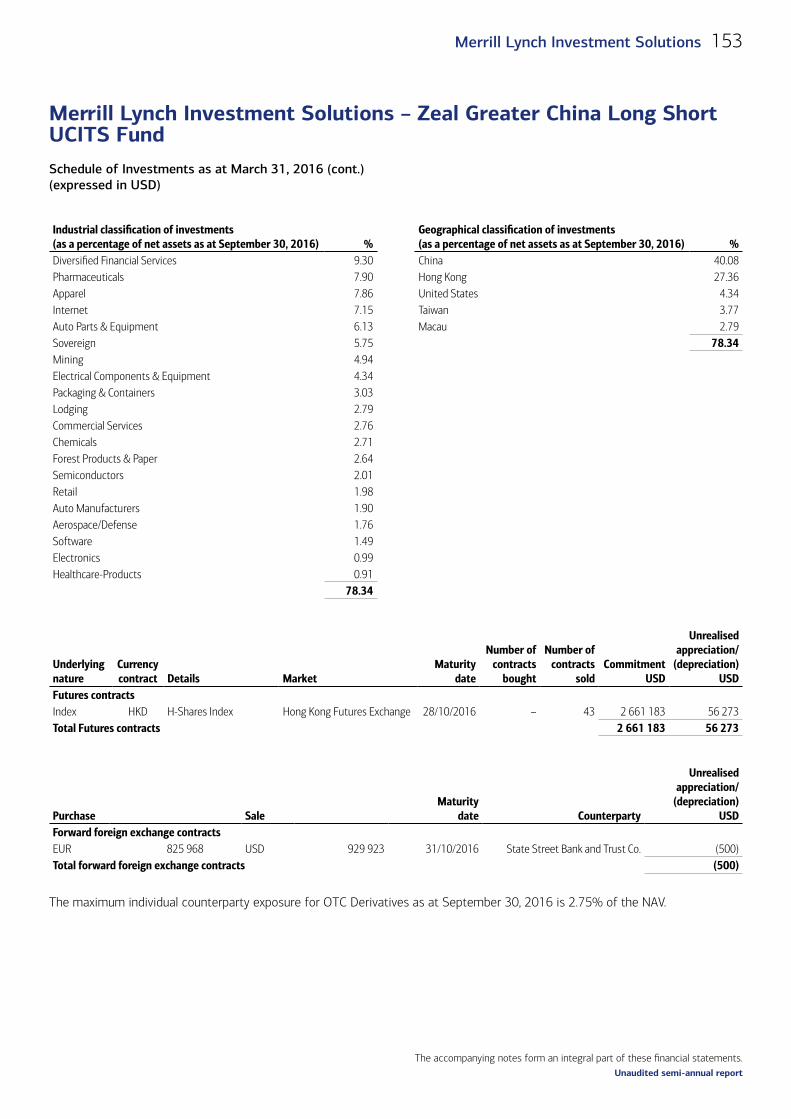
The accompanying notes form an integral part of these financial statements.
Schedule of Investments as at March 31, 2016 (cont.)(expressed in USD)
Merrill Lynch Investment Solutions – Zeal Greater China Long Short UCITS Fund
153Merrill Lynch Investment Solutions
Unaudited semi-annual report
Industrial classification of investments(as a percentage of net assets as at September 30, 2016) %
Geographical classification of investments(as a percentage of net assets as at September 30, 2016) %
Diversified Financial Services 9.30 China 40.08 Pharmaceuticals 7.90 Hong Kong 27.36 Apparel 7.86 United States 4.34 Internet 7.15 Taiwan 3.77 Auto Parts & Equipment 6.13 Macau 2.79Sovereign 5.75 78.34Mining 4.94 Electrical Components & Equipment 4.34Packaging & Containers 3.03Lodging 2.79Commercial Services 2.76Chemicals 2.71Forest Products & Paper 2.64Semiconductors 2.01Retail 1.98Auto Manufacturers 1.90Aerospace/Defense 1.76Software 1.49Electronics 0.99Healthcare-Products 0.91
78.34
Underlying nature
Currency contract
Details
Market
Maturity date
Number of contracts
bought
Number of contracts
soldCommitment
USD
Unrealised appreciation/
(depreciation)USD
Futures contractsIndex HKD H-Shares Index Hong Kong Futures Exchange 28/10/2016 – 43 2 661 183 56 273Total Futures contracts 2 661 183 56 273
Purchase
Sale
Maturity date Counterparty
Unrealised appreciation/
(depreciation)USD
Forward foreign exchange contracts EUR 825 968 USD 929 923 31/10/2016 State Street Bank and Trust Co. (500)Total forward foreign exchange contracts (500)
The maximum individual counterparty exposure for OTC Derivatives as at September 30, 2016 is 2.75% of the NAV.

The accompanying notes form an integral part of these financial statements.
Schedule of Investments as at March 31, 2016 (cont.)(expressed in USD)
Merrill Lynch Investment Solutions – Zeal Greater China Long Short UCITS Fund
154 Merrill Lynch Investment Solutions
Unaudited semi-annual report
Contracts for difference swaps
The Sub-Fund Merrill Lynch Investment Solutions - Zeal Voyage Greater China UCITS Fund entered into contracts for difference swaps with two counterparties (Merrill Lynch International Bank Ltd and Morgan Stanley International Plc..) with the following details:
1) Merrill Lynch International Bank Ltd
Commitment of USD 3 838 563 for the short portfolio composed of 10 equitiesCommitment of USD 1 083 186 for the long portfolio composed of 2 equities
Market value of USD 95 275 detailed as follows:– unrealised appreciation of short portfolio: USD 106 010– unrealised appreciation of long portfolio: USD 24 552– realised result: USD (35 287) corresponding to the realised loss on securities which is still held at the counterparty (monthly reset)
The below table is composed of long and short positions:
Industrial sector Underlying nature Long/ShortCommitment
USD
Unrealised appreciation/
(depreciation)USD
Computers Equity Short 221 236 22 937Electric Equity Short 519 653 (13 976)Electronics Equity Short 1 465 430 199 184Internet Equity Long 395 817 61 899Metal Fabricate/Hardware Equity Short 592 701 (40 775)Real Estate Equity Long 687 369 (37 347)Semiconductors Equity Short 1 039 543 (61 360)Total 4 921 749 130 562
2) Morgan Stanley International Plc.
Commitment of USD 494 008 for the short portfolio composed of 1 equity
Market value of USD (15 934) detailed as follows:– unrealised depreciation of short portfolio: USD (30 971)– realised result: USD 15 037 corresponding to the realised gain on securities which is still held at the counterparty (monthly reset)
The below table is composed of short positions:
Industrial sector Underlying nature Long/ShortCommitment
USD
Unrealised appreciation/
(depreciation)USD
Electric Equity Short 494 008 (30 971)Total 494 008 (30 971)
The total market value of the contracts for difference swaps is USD 79 342.

The accompanying notes form an integral part of these financial statements.
Schedule of Investments as at September 30, 2016 (expressed in USD)
Merrill Lynch Investment Solutions – Gotham U.S. Equity Long/Short UCITS Fund
155Merrill Lynch Investment Solutions
Unaudited semi-annual report
Merrill Lynch Investment Solutions – Gotham U.S. Equity Long/Short UCITS Fund
Schedule of Investments as at September 30, 2016 (expressed in USD)
Quantity DescriptionQuotation
CurrencyCost USD
Market value
USD% of net
assets
Transferable securities and money market instruments admitted to an official exchange listing or dealt in on another regulated market (cont.)
Shares (cont.)234 3M Co. USD 40 282 41 238 0.09
1 359 Aaron's, Inc. USD 34 009 34 546 0.074 Abaxis, Inc. USD 183 206 0.00
3 079 AbbVie, Inc. USD 185 638 194 193 0.416 ABM Industries, Inc. USD 238 238 0.00
1 307 Accenture Plc. - A USD 144 863 159 676 0.3415 Acorda Therapeutics, Inc. USD 315 313 0.0045 Actuant Corp. - A USD 1 043 1 046 0.00
399 Advanced Drainage Systems, Inc. USD 10 689 9 600 0.022 757 Agilent Technologies, Inc. USD 129 574 129 827 0.28
5 Air Products & Chemicals, Inc. USD 752 752 0.002 749 Akamai Technologies, Inc. USD 140 071 145 670 0.311 582 Akorn, Inc. USD 46 600 43 125 0.091 056 Alaska Air Group, Inc. USD 72 813 69 548 0.15
259 Alexion Pharmaceuticals, Inc. USD 33 941 31 738 0.076 Allegiant Travel Co. USD 792 792 0.00
2 637 Altria Group, Inc. USD 171 212 166 737 0.36918 AMAG Pharmaceuticals, Inc. USD 17 683 22 500 0.05
1 847 AMC Networks, Inc. - A USD 106 946 95 785 0.202 170 American Airlines Group, Inc. USD 78 196 79 444 0.17
381 American Renal Associates Hldg., Inc. USD 8 224 6 961 0.011 046 American Woodmark Corp. USD 75 805 84 276 0.181 726 AmerisourceBergen Corp. USD 144 266 139 426 0.301 975 AMETEK, Inc. USD 93 129 94 365 0.201 551 Amgen, Inc. USD 234 279 258 722 0.552 655 Analog Devices, Inc. USD 154 812 171 115 0.36
498 Analogic Corp. USD 40 154 44 123 0.09192 AngioDynamics, Inc. USD 3 275 3 368 0.01
1 ANSYS, Inc. USD 92 93 0.001 984 Apple, Inc. USD 218 597 224 291 0.48
318 Applied Industrial Technologies, Inc. USD 14 874 14 863 0.035 923 Applied Materials, Inc. USD 174 432 178 578 0.38
58 Archer-Daniels-Midland Co. USD 2 445 2 446 0.018 685 Archrock, Inc. USD 86 505 113 600 0.241 031 Argan, Inc. USD 50 154 61 025 0.132 157 Armstrong World Industries, Inc. USD 92 267 89 127 0.19
772 Asbury Automotive Group, Inc. USD 42 467 42 977 0.09532 Ascena Retail Group, Inc. USD 3 035 2 974 0.01
7 945 Aspen Technology, Inc. USD 290 734 371 747 0.793 840 AT&T, Inc. USD 160 364 155 942 0.337 793 Atwood Oceanics, Inc. USD 88 247 67 721 0.142 591 Automatic Data Processing, Inc. USD 233 349 228 526 0.49
899 AutoNation, Inc. USD 43 207 43 790 0.09
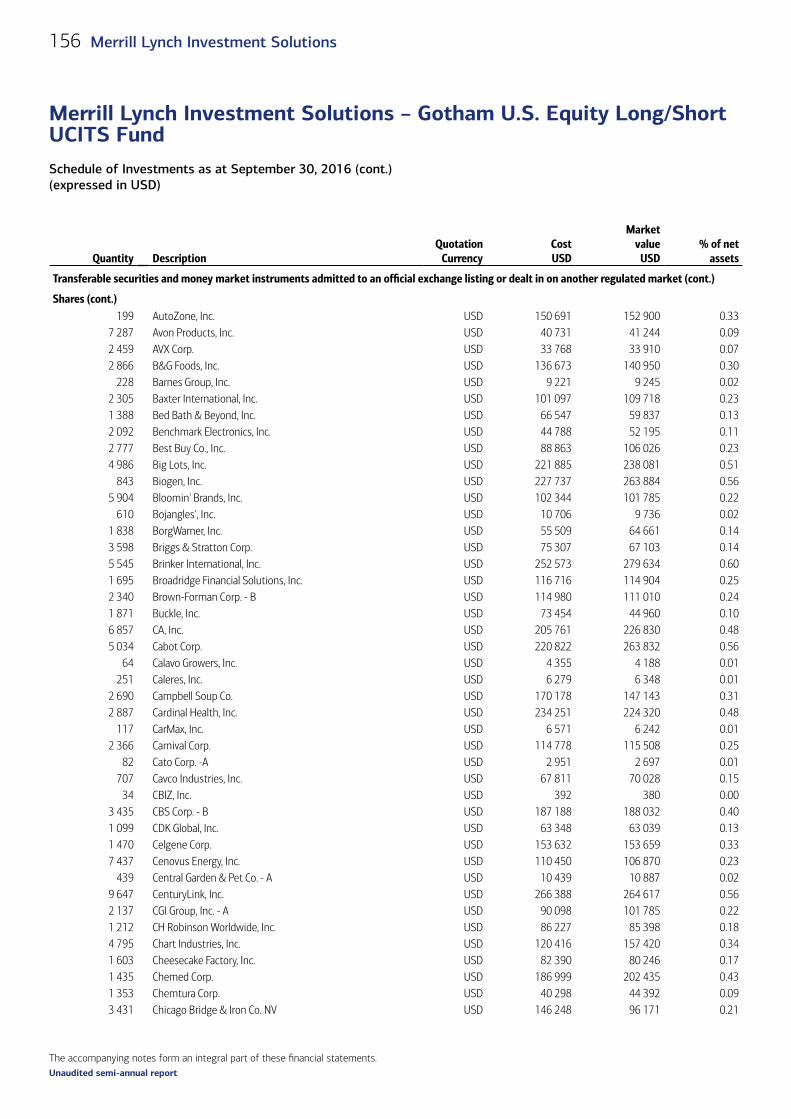
The accompanying notes form an integral part of these financial statements.
Schedule of Investments as at September 30, 2016 (cont.)(expressed in USD)
Merrill Lynch Investment Solutions – Gotham U.S. Equity Long/Short UCITS Fund
156 Merrill Lynch Investment Solutions
Unaudited semi-annual report
Quantity DescriptionQuotation
CurrencyCost USD
Market value
USD% of net
assets
Transferable securities and money market instruments admitted to an official exchange listing or dealt in on another regulated market (cont.)
Shares (cont.)199 AutoZone, Inc. USD 150 691 152 900 0.33
7 287 Avon Products, Inc. USD 40 731 41 244 0.092 459 AVX Corp. USD 33 768 33 910 0.072 866 B&G Foods, Inc. USD 136 673 140 950 0.30
228 Barnes Group, Inc. USD 9 221 9 245 0.022 305 Baxter International, Inc. USD 101 097 109 718 0.231 388 Bed Bath & Beyond, Inc. USD 66 547 59 837 0.132 092 Benchmark Electronics, Inc. USD 44 788 52 195 0.112 777 Best Buy Co., Inc. USD 88 863 106 026 0.234 986 Big Lots, Inc. USD 221 885 238 081 0.51
843 Biogen, Inc. USD 227 737 263 884 0.565 904 Bloomin' Brands, Inc. USD 102 344 101 785 0.22
610 Bojangles', Inc. USD 10 706 9 736 0.021 838 BorgWarner, Inc. USD 55 509 64 661 0.143 598 Briggs & Stratton Corp. USD 75 307 67 103 0.145 545 Brinker International, Inc. USD 252 573 279 634 0.601 695 Broadridge Financial Solutions, Inc. USD 116 716 114 904 0.252 340 Brown-Forman Corp. - B USD 114 980 111 010 0.241 871 Buckle, Inc. USD 73 454 44 960 0.106 857 CA, Inc. USD 205 761 226 830 0.485 034 Cabot Corp. USD 220 822 263 832 0.56
64 Calavo Growers, Inc. USD 4 355 4 188 0.01251 Caleres, Inc. USD 6 279 6 348 0.01
2 690 Campbell Soup Co. USD 170 178 147 143 0.312 887 Cardinal Health, Inc. USD 234 251 224 320 0.48
117 CarMax, Inc. USD 6 571 6 242 0.012 366 Carnival Corp. USD 114 778 115 508 0.25
82 Cato Corp. -A USD 2 951 2 697 0.01707 Cavco Industries, Inc. USD 67 811 70 028 0.15
34 CBIZ, Inc. USD 392 380 0.003 435 CBS Corp. - B USD 187 188 188 032 0.401 099 CDK Global, Inc. USD 63 348 63 039 0.131 470 Celgene Corp. USD 153 632 153 659 0.337 437 Cenovus Energy, Inc. USD 110 450 106 870 0.23
439 Central Garden & Pet Co. - A USD 10 439 10 887 0.029 647 CenturyLink, Inc. USD 266 388 264 617 0.562 137 CGI Group, Inc. - A USD 90 098 101 785 0.221 212 CH Robinson Worldwide, Inc. USD 86 227 85 398 0.184 795 Chart Industries, Inc. USD 120 416 157 420 0.341 603 Cheesecake Factory, Inc. USD 82 390 80 246 0.171 435 Chemed Corp. USD 186 999 202 435 0.431 353 Chemtura Corp. USD 40 298 44 392 0.093 431 Chicago Bridge & Iron Co. NV USD 146 248 96 171 0.21
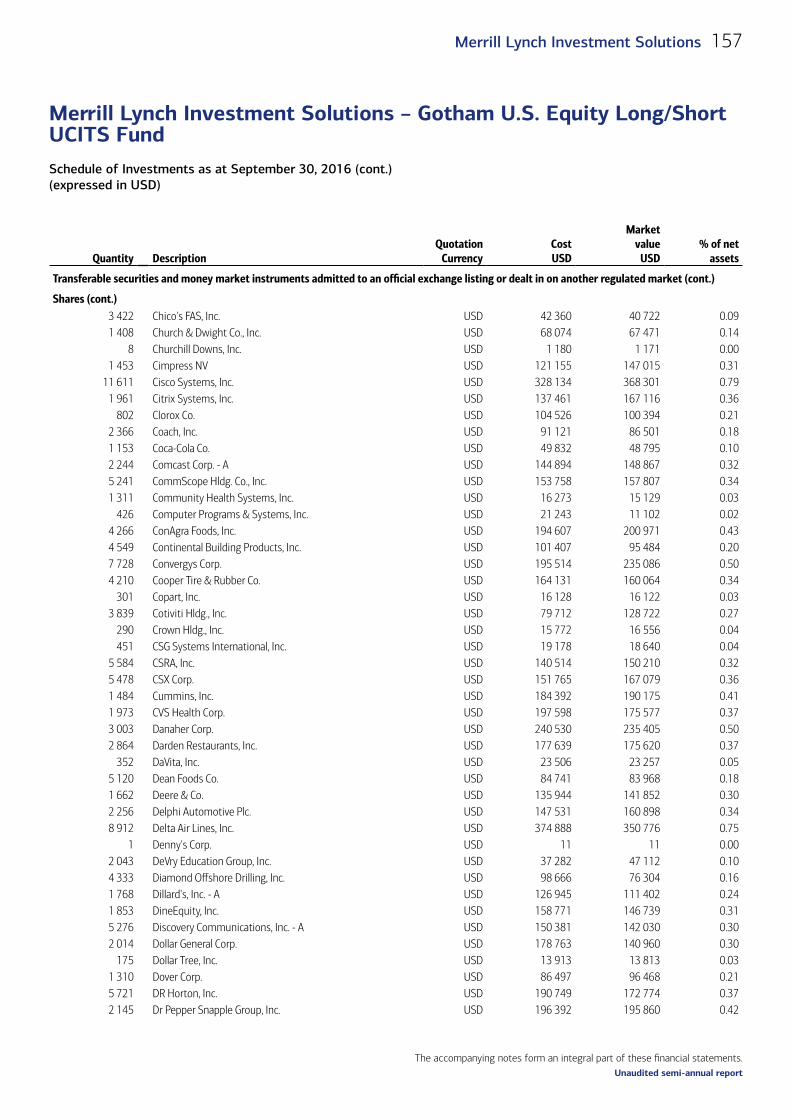
The accompanying notes form an integral part of these financial statements.
Schedule of Investments as at September 30, 2016 (cont.)(expressed in USD)
Merrill Lynch Investment Solutions – Gotham U.S. Equity Long/Short UCITS Fund
157Merrill Lynch Investment Solutions
Unaudited semi-annual report
Quantity DescriptionQuotation
CurrencyCost USD
Market value
USD% of net
assets
Transferable securities and money market instruments admitted to an official exchange listing or dealt in on another regulated market (cont.)
Shares (cont.)3 422 Chico's FAS, Inc. USD 42 360 40 722 0.091 408 Church & Dwight Co., Inc. USD 68 074 67 471 0.14
8 Churchill Downs, Inc. USD 1 180 1 171 0.001 453 Cimpress NV USD 121 155 147 015 0.31
11 611 Cisco Systems, Inc. USD 328 134 368 301 0.791 961 Citrix Systems, Inc. USD 137 461 167 116 0.36
802 Clorox Co. USD 104 526 100 394 0.212 366 Coach, Inc. USD 91 121 86 501 0.181 153 Coca-Cola Co. USD 49 832 48 795 0.102 244 Comcast Corp. - A USD 144 894 148 867 0.325 241 CommScope Hldg. Co., Inc. USD 153 758 157 807 0.341 311 Community Health Systems, Inc. USD 16 273 15 129 0.03
426 Computer Programs & Systems, Inc. USD 21 243 11 102 0.024 266 ConAgra Foods, Inc. USD 194 607 200 971 0.434 549 Continental Building Products, Inc. USD 101 407 95 484 0.207 728 Convergys Corp. USD 195 514 235 086 0.504 210 Cooper Tire & Rubber Co. USD 164 131 160 064 0.34
301 Copart, Inc. USD 16 128 16 122 0.033 839 Cotiviti Hldg., Inc. USD 79 712 128 722 0.27
290 Crown Hldg., Inc. USD 15 772 16 556 0.04451 CSG Systems International, Inc. USD 19 178 18 640 0.04
5 584 CSRA, Inc. USD 140 514 150 210 0.325 478 CSX Corp. USD 151 765 167 079 0.361 484 Cummins, Inc. USD 184 392 190 175 0.411 973 CVS Health Corp. USD 197 598 175 577 0.373 003 Danaher Corp. USD 240 530 235 405 0.502 864 Darden Restaurants, Inc. USD 177 639 175 620 0.37
352 DaVita, Inc. USD 23 506 23 257 0.055 120 Dean Foods Co. USD 84 741 83 968 0.181 662 Deere & Co. USD 135 944 141 852 0.302 256 Delphi Automotive Plc. USD 147 531 160 898 0.348 912 Delta Air Lines, Inc. USD 374 888 350 776 0.75
1 Denny's Corp. USD 11 11 0.002 043 DeVry Education Group, Inc. USD 37 282 47 112 0.104 333 Diamond Offshore Drilling, Inc. USD 98 666 76 304 0.161 768 Dillard's, Inc. - A USD 126 945 111 402 0.241 853 DineEquity, Inc. USD 158 771 146 739 0.315 276 Discovery Communications, Inc. - A USD 150 381 142 030 0.302 014 Dollar General Corp. USD 178 763 140 960 0.30
175 Dollar Tree, Inc. USD 13 913 13 813 0.031 310 Dover Corp. USD 86 497 96 468 0.215 721 DR Horton, Inc. USD 190 749 172 774 0.372 145 Dr Pepper Snapple Group, Inc. USD 196 392 195 860 0.42

The accompanying notes form an integral part of these financial statements.
Schedule of Investments as at September 30, 2016 (cont.)(expressed in USD)
Merrill Lynch Investment Solutions – Gotham U.S. Equity Long/Short UCITS Fund
158 Merrill Lynch Investment Solutions
Unaudited semi-annual report
Quantity DescriptionQuotation
CurrencyCost USD
Market value
USD% of net
assets
Transferable securities and money market instruments admitted to an official exchange listing or dealt in on another regulated market (cont.)
Shares (cont.)132 Drew Industries, Inc. USD 12 751 12 939 0.03
1 288 Dril-Quip, Inc. USD 71 100 71 793 0.15223 Dun & Bradstreet Corp. USD 25 135 30 466 0.07792 Dycom Industries, Inc. USD 65 729 64 770 0.14
2 805 Eagle Materials, Inc. USD 216 517 216 826 0.462 178 EarthLink Hldg. Corp. USD 13 674 13 504 0.03
528 Eaton Corp. Plc. USD 33 689 34 695 0.075 131 eBay, Inc. USD 127 846 168 810 0.36
723 Edgewell Personal Care Co. USD 56 281 57 493 0.12195 Eldorado Resorts, Inc. USD 2 776 2 742 0.01
2 155 Electronic Arts, Inc. USD 166 914 184 037 0.39619 Emergent BioSolutions, Inc. USD 19 525 19 517 0.04
4 466 Emerson Electric Co. USD 237 059 243 442 0.5221 Enbridge, Inc. USD 935 929 0.00
1 537 EnerSys USD 103 006 106 345 0.239 141 Ensco Plc. - A USD 70 920 77 698 0.17
176 Estee Lauder Cos, Inc. - A USD 15 840 15 587 0.034 243 Expeditors International of Washington, Inc. USD 204 568 218 599 0.472 162 Express Scripts Hldg. Co. USD 166 753 152 486 0.332 706 Express, Inc. USD 52 865 31 904 0.07
586 F5 Networks, Inc. USD 58 251 73 039 0.16448 Fair Isaac Corp. USD 57 496 55 816 0.12
3 FibroGen, Inc. USD 62 62 0.001 173 Fidelity National Information Services, Inc. USD 93 884 90 356 0.19
449 Finish Line, Inc. - A USD 10 300 10 363 0.02762 Fiserv, Inc. USD 79 423 75 796 0.16
1 173 FLIR Systems, Inc. USD 37 860 36 856 0.083 400 Flowers Foods, Inc. USD 51 797 51 408 0.112 151 FMC Corp. USD 95 491 103 979 0.221 153 Foot Locker, Inc. USD 71 092 78 081 0.17
880 Fortive Corp. USD 43 786 44 792 0.1011 208 Frank's International NV USD 175 522 145 704 0.31
583 Fresh Del Monte Produce, Inc. USD 34 292 34 922 0.0725 FTD Cos, Inc. USD 594 514 0.00
596 FTI Consulting, Inc. USD 25 919 26 558 0.067 670 Gap, Inc. USD 196 525 170 581 0.361 693 Garmin Ltd. USD 69 275 81 450 0.17
79 General Mills, Inc. USD 5 058 5 047 0.014 636 General Motors Co. USD 139 892 147 286 0.31
413 Gentex Corp. USD 6 684 7 252 0.021 969 Genuine Parts Co. USD 191 873 197 786 0.422 303 Gibraltar Industries, Inc. USD 69 459 85 556 0.183 754 Gilead Sciences, Inc. USD 350 919 297 016 0.63

The accompanying notes form an integral part of these financial statements.
Schedule of Investments as at September 30, 2016 (cont.)(expressed in USD)
Merrill Lynch Investment Solutions – Gotham U.S. Equity Long/Short UCITS Fund
159Merrill Lynch Investment Solutions
Unaudited semi-annual report
Quantity DescriptionQuotation
CurrencyCost USD
Market value
USD% of net
assets
Transferable securities and money market instruments admitted to an official exchange listing or dealt in on another regulated market (cont.)
Shares (cont.)393 Global Brass & Copper Hldg., Inc. USD 10 724 11 354 0.02
8 318 Globus Medical, Inc. - A USD 197 283 187 737 0.4068 Gorman-Rupp Co. USD 1 808 1 741 0.00
253 Graham Hldg. Co. - B USD 160 452 121 787 0.262 235 Greif, Inc. - A USD 81 504 110 834 0.241 020 Group 1 Automotive, Inc. USD 61 462 65 158 0.144 313 Halyard Health, Inc. USD 136 378 149 489 0.321 525 Harley-Davidson, Inc. USD 71 953 80 200 0.172 215 Harman International Industries, Inc. USD 186 479 187 057 0.402 532 Harris Corp. USD 206 069 231 957 0.49
131 Harsco Corp. USD 1 400 1 301 0.001 163 Hawaiian Hldg., Inc. USD 41 120 56 522 0.122 688 HCA Hldg., Inc. USD 198 035 203 293 0.431 946 Headwaters, Inc. USD 35 578 32 926 0.07
4 Heartland Express, Inc. USD 76 76 0.003 928 Herman Miller, Inc. USD 120 194 112 341 0.249 218 Hewlett Packard Enterprise Co. USD 167 136 209 709 0.451 508 Hibbett Sports, Inc. USD 53 173 60 169 0.13
391 Hill-Rom Hldg., Inc. USD 22 802 24 234 0.05578 Hillenbrand, Inc. USD 18 389 18 288 0.04
1 299 HMS Hldg. Corp. USD 28 805 28 799 0.06254 Hologic, Inc. USD 9 749 9 863 0.02
2 497 Home Depot, Inc. USD 331 599 321 314 0.69450 Hormel Foods Corp. USD 16 918 17 068 0.04
20 922 HP, Inc. USD 266 629 324 919 0.69385 HSN, Inc. USD 15 563 15 323 0.03935 Hub Group, Inc. - A USD 36 537 38 111 0.08
1 014 Huntington Ingalls Industries, Inc. USD 127 857 155 568 0.339 745 Huntsman Corp. USD 160 872 158 551 0.34
553 ICU Medical, Inc. USD 56 793 69 888 0.151 153 Illinois Tool Works, Inc. USD 120 239 138 176 0.295 107 IMS Health Hldg., Inc. USD 131 715 160 053 0.34
566 INC Research Hldg., Inc. - A USD 23 263 25 232 0.051 220 Incyte Corp. USD 100 651 115 034 0.251 253 Ingram Micro, Inc. - A USD 31 397 44 682 0.10
316 Innophos Hldg., Inc. USD 12 725 12 333 0.03492 Insteel Industries, Inc. USD 16 954 17 830 0.04
4 367 Insys Therapeutics, Inc. USD 107 797 51 487 0.11481 Integer Hldg. Corp. USD 11 138 10 433 0.02606 Intel Corp. USD 25 584 22 876 0.05
2 392 Inteliquent, Inc. USD 44 782 38 607 0.081 619 InterDigital, Inc. USD 84 509 128 225 0.27
860 International Business Machines Corp. USD 135 032 136 611 0.29
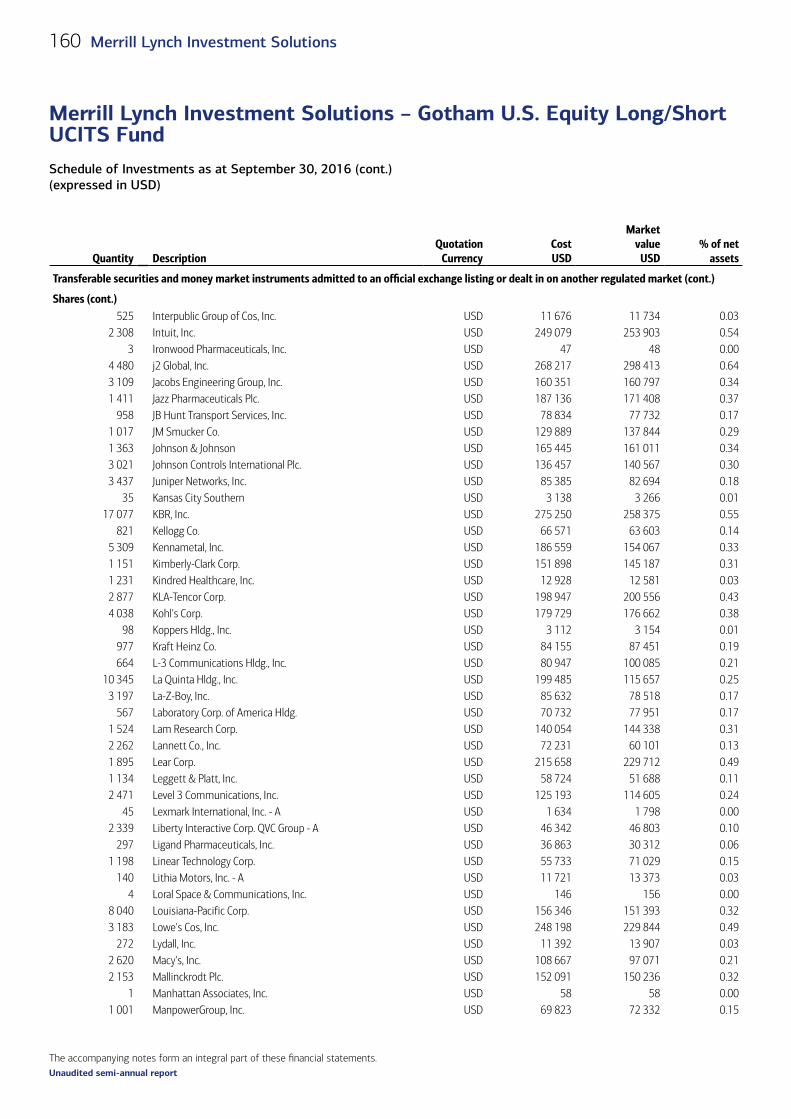
The accompanying notes form an integral part of these financial statements.
Schedule of Investments as at September 30, 2016 (cont.)(expressed in USD)
Merrill Lynch Investment Solutions – Gotham U.S. Equity Long/Short UCITS Fund
160 Merrill Lynch Investment Solutions
Unaudited semi-annual report
Quantity DescriptionQuotation
CurrencyCost USD
Market value
USD% of net
assets
Transferable securities and money market instruments admitted to an official exchange listing or dealt in on another regulated market (cont.)
Shares (cont.)525 Interpublic Group of Cos, Inc. USD 11 676 11 734 0.03
2 308 Intuit, Inc. USD 249 079 253 903 0.543 Ironwood Pharmaceuticals, Inc. USD 47 48 0.00
4 480 j2 Global, Inc. USD 268 217 298 413 0.643 109 Jacobs Engineering Group, Inc. USD 160 351 160 797 0.341 411 Jazz Pharmaceuticals Plc. USD 187 136 171 408 0.37
958 JB Hunt Transport Services, Inc. USD 78 834 77 732 0.171 017 JM Smucker Co. USD 129 889 137 844 0.291 363 Johnson & Johnson USD 165 445 161 011 0.343 021 Johnson Controls International Plc. USD 136 457 140 567 0.303 437 Juniper Networks, Inc. USD 85 385 82 694 0.18
35 Kansas City Southern USD 3 138 3 266 0.0117 077 KBR, Inc. USD 275 250 258 375 0.55
821 Kellogg Co. USD 66 571 63 603 0.145 309 Kennametal, Inc. USD 186 559 154 067 0.331 151 Kimberly-Clark Corp. USD 151 898 145 187 0.311 231 Kindred Healthcare, Inc. USD 12 928 12 581 0.032 877 KLA-Tencor Corp. USD 198 947 200 556 0.434 038 Kohl's Corp. USD 179 729 176 662 0.38
98 Koppers Hldg., Inc. USD 3 112 3 154 0.01977 Kraft Heinz Co. USD 84 155 87 451 0.19664 L-3 Communications Hldg., Inc. USD 80 947 100 085 0.21
10 345 La Quinta Hldg., Inc. USD 199 485 115 657 0.253 197 La-Z-Boy, Inc. USD 85 632 78 518 0.17
567 Laboratory Corp. of America Hldg. USD 70 732 77 951 0.171 524 Lam Research Corp. USD 140 054 144 338 0.312 262 Lannett Co., Inc. USD 72 231 60 101 0.131 895 Lear Corp. USD 215 658 229 712 0.491 134 Leggett & Platt, Inc. USD 58 724 51 688 0.112 471 Level 3 Communications, Inc. USD 125 193 114 605 0.24
45 Lexmark International, Inc. - A USD 1 634 1 798 0.002 339 Liberty Interactive Corp. QVC Group - A USD 46 342 46 803 0.10
297 Ligand Pharmaceuticals, Inc. USD 36 863 30 312 0.061 198 Linear Technology Corp. USD 55 733 71 029 0.15
140 Lithia Motors, Inc. - A USD 11 721 13 373 0.034 Loral Space & Communications, Inc. USD 146 156 0.00
8 040 Louisiana-Pacific Corp. USD 156 346 151 393 0.323 183 Lowe's Cos, Inc. USD 248 198 229 844 0.49
272 Lydall, Inc. USD 11 392 13 907 0.032 620 Macy's, Inc. USD 108 667 97 071 0.212 153 Mallinckrodt Plc. USD 152 091 150 236 0.32
1 Manhattan Associates, Inc. USD 58 58 0.001 001 ManpowerGroup, Inc. USD 69 823 72 332 0.15

The accompanying notes form an integral part of these financial statements.
Schedule of Investments as at September 30, 2016 (cont.)(expressed in USD)
Merrill Lynch Investment Solutions – Gotham U.S. Equity Long/Short UCITS Fund
161Merrill Lynch Investment Solutions
Unaudited semi-annual report
Quantity DescriptionQuotation
CurrencyCost USD
Market value
USD% of net
assets
Transferable securities and money market instruments admitted to an official exchange listing or dealt in on another regulated market (cont.)
Shares (cont.)111 Marathon Petroleum Corp. USD 4 557 4 505 0.01
4 069 Marriott International, Inc. - A USD 278 047 273 979 0.58320 Marten Transport Ltd. USD 6 283 6 720 0.01
1 897 Masco Corp. USD 62 831 65 086 0.14821 MasterCard, Inc. - A USD 77 961 83 553 0.18
78 Matson, Inc. USD 2 950 3 111 0.0161 Matthews International Corp. - A USD 3 706 3 706 0.01
1 575 Maxim Integrated Products, Inc. USD 63 334 62 890 0.1310 854 MaxLinear, Inc. - A USD 211 003 220 011 0.47
1 223 McDonald's Corp. USD 146 125 141 085 0.301 226 McKesson Corp. USD 218 892 204 435 0.44
664 Mead Johnson Nutrition Co. USD 52 785 52 463 0.1111 813 Mentor Graphics Corp. USD 212 090 312 336 0.67
1 890 Meridian Bioscience, Inc. USD 37 210 36 458 0.082 822 Meritor, Inc. USD 30 451 31 409 0.073 822 Michael Kors Hldg. Ltd. USD 190 961 178 831 0.381 535 MicroStrategy, Inc. - A USD 308 831 257 020 0.551 157 Minerals Technologies, Inc. USD 68 374 81 788 0.17
796 Mistras Group, Inc. USD 19 350 18 682 0.041 361 Mondelez International, Inc. - A USD 59 513 59 748 0.13
100 Monotype Imaging Hldg., Inc. USD 2 114 2 211 0.00440 Moog, Inc. - A USD 25 683 26 198 0.06
2 749 MSG Networks, Inc. - A USD 49 169 51 159 0.11784 MTS Systems Corp. USD 37 398 36 088 0.08
93 Mueller Water Products, Inc. - A USD 1 123 1 167 0.0058 Multi Packaging Solutions International Ltd. USD 817 836 0.00
3 015 Myriad Genetics, Inc. USD 90 122 62 049 0.1383 National Beverage Corp. USD 3 936 3 656 0.01
1 409 National Oilwell Varco, Inc. USD 46 173 51 767 0.11201 National Presto Industries, Inc. USD 18 012 17 646 0.04974 Natus Medical, Inc. USD 32 021 38 268 0.08469 NetApp, Inc. USD 13 818 16 800 0.04
2 268 NETGEAR, Inc. USD 107 147 137 191 0.293 654 New York Times Co. - A USD 50 501 43 665 0.094 909 News Corp. - A USD 53 913 68 628 0.15
286 NIC, Inc. USD 6 366 6 721 0.01743 Nike, Inc. - B USD 41 107 39 119 0.08
1 204 Noble Corp. Plc. USD 8 408 7 633 0.021 575 Norfolk Southern Corp. USD 140 733 152 869 0.33
254 Northrop Grumman Corp. USD 55 120 54 343 0.121 851 Nutrisystem, Inc. USD 52 983 54 956 0.12
27 NVR, Inc. USD 46 997 44 276 0.0959 O'Reilly Automotive, Inc. USD 16 775 16 526 0.04

The accompanying notes form an integral part of these financial statements.
Schedule of Investments as at September 30, 2016 (cont.)(expressed in USD)
Merrill Lynch Investment Solutions – Gotham U.S. Equity Long/Short UCITS Fund
162 Merrill Lynch Investment Solutions
Unaudited semi-annual report
Quantity DescriptionQuotation
CurrencyCost USD
Market value
USD% of net
assets
Transferable securities and money market instruments admitted to an official exchange listing or dealt in on another regulated market (cont.)
Shares (cont.)1 886 Oceaneering International, Inc. USD 57 483 51 884 0.112 646 Omnicom Group, Inc. USD 221 083 224 910 0.481 127 ONEOK, Inc. USD 54 803 57 917 0.12
928 Open Text Corp. USD 45 163 60 190 0.131 458 OPKO Health, Inc. USD 13 973 15 440 0.034 809 Oracle Corp. USD 189 412 188 898 0.40
77 OSI Systems, Inc. USD 5 034 5 034 0.012 942 PACCAR, Inc. USD 159 206 172 931 0.372 334 Packaging Corp. of America USD 151 030 189 661 0.40
297 PAREXEL International Corp. USD 20 422 20 627 0.041 751 Parker-Hannifin Corp. USD 198 774 219 803 0.47
807 Patterson Cos, Inc. USD 38 801 37 074 0.08371 Paychex, Inc. USD 21 366 21 470 0.05
1 357 Pegasystems, Inc. USD 33 885 40 018 0.091 525 Pentair Plc. USD 95 115 97 966 0.211 056 PepsiCo, Inc. USD 114 379 114 861 0.254 733 Pfizer, Inc. USD 151 710 160 307 0.343 393 Photronics, Inc. USD 33 737 34 982 0.073 683 Pilgrim's Pride Corp. USD 91 193 77 785 0.175 178 Pinnacle Entertainment, Inc. USD 57 477 63 897 0.144 137 Pitney Bowes, Inc. USD 78 008 75 128 0.161 417 Plantronics, Inc. USD 64 880 73 627 0.161 047 Post Hldg., Inc. USD 86 883 80 797 0.17
8 PPG Industries, Inc. USD 828 827 0.004 288 PRA Health Sciences, Inc. USD 175 555 242 315 0.52
182 Prestige Brands Hldg., Inc. USD 8 687 8 785 0.02489 Procter & Gamble Co. USD 42 713 43 888 0.09
6 Progress Software Corp. USD 163 163 0.001 534 PVH Corp. USD 156 456 169 507 0.362 688 Quad/Graphics, Inc. USD 58 207 71 823 0.152 311 Qualcomm, Inc. USD 121 977 158 303 0.341 290 Quanta Services, Inc. USD 33 007 36 107 0.082 102 Quest Diagnostics, Inc. USD 156 762 177 892 0.383 430 Quintiles Transnational Hldg., Inc. USD 201 595 278 036 0.598 127 Rackspace Hosting, Inc. USD 188 170 257 545 0.55
814 Ralph Lauren Corp. USD 73 198 82 328 0.18366 Raven Industries, Inc. USD 8 574 8 429 0.02
2 445 Rayonier Advanced Materials, Inc. USD 33 831 32 690 0.07228 Regal Beloit Corp. USD 13 855 13 564 0.03252 Regeneron Pharmaceuticals, Inc. USD 105 033 101 309 0.22741 Repligen Corp. USD 23 190 22 371 0.05
1 039 Republic Services, Inc. USD 49 028 52 418 0.112 990 ResMed, Inc. USD 174 038 193 722 0.41
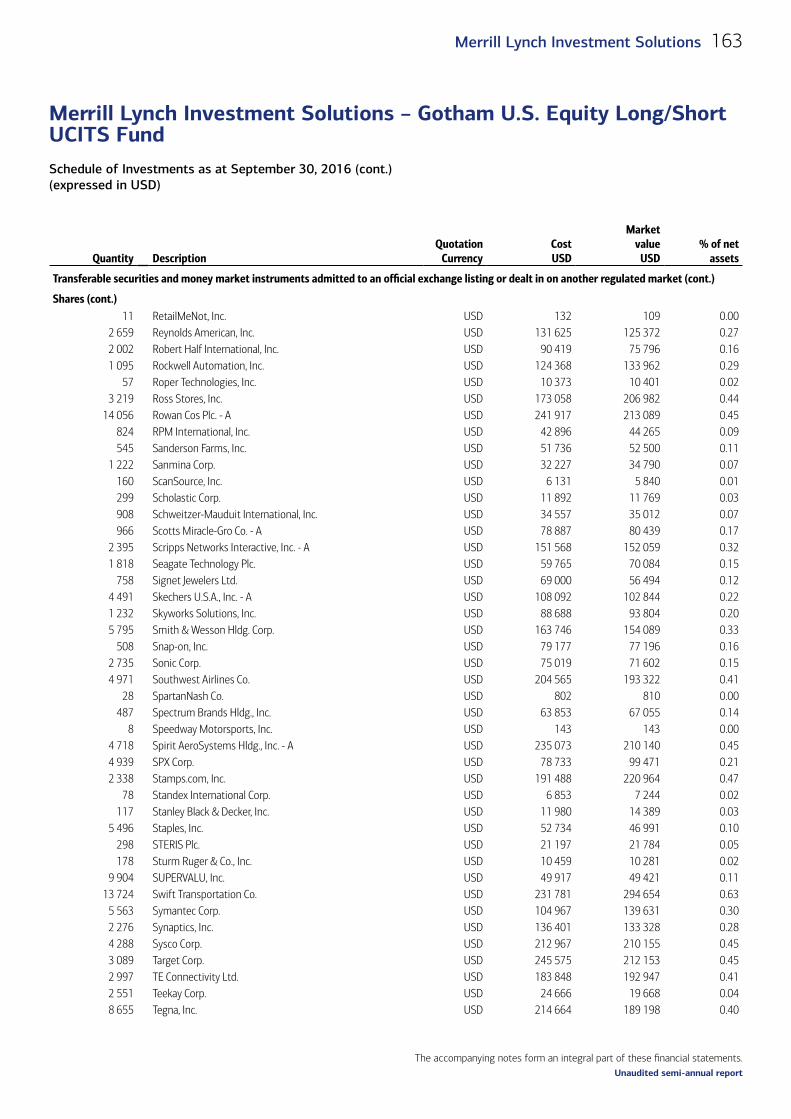
The accompanying notes form an integral part of these financial statements.
Schedule of Investments as at September 30, 2016 (cont.)(expressed in USD)
Merrill Lynch Investment Solutions – Gotham U.S. Equity Long/Short UCITS Fund
163Merrill Lynch Investment Solutions
Unaudited semi-annual report
Quantity DescriptionQuotation
CurrencyCost USD
Market value
USD% of net
assets
Transferable securities and money market instruments admitted to an official exchange listing or dealt in on another regulated market (cont.)
Shares (cont.)11 RetailMeNot, Inc. USD 132 109 0.00
2 659 Reynolds American, Inc. USD 131 625 125 372 0.272 002 Robert Half International, Inc. USD 90 419 75 796 0.161 095 Rockwell Automation, Inc. USD 124 368 133 962 0.29
57 Roper Technologies, Inc. USD 10 373 10 401 0.023 219 Ross Stores, Inc. USD 173 058 206 982 0.44
14 056 Rowan Cos Plc. - A USD 241 917 213 089 0.45824 RPM International, Inc. USD 42 896 44 265 0.09545 Sanderson Farms, Inc. USD 51 736 52 500 0.11
1 222 Sanmina Corp. USD 32 227 34 790 0.07160 ScanSource, Inc. USD 6 131 5 840 0.01299 Scholastic Corp. USD 11 892 11 769 0.03908 Schweitzer-Mauduit International, Inc. USD 34 557 35 012 0.07966 Scotts Miracle-Gro Co. - A USD 78 887 80 439 0.17
2 395 Scripps Networks Interactive, Inc. - A USD 151 568 152 059 0.321 818 Seagate Technology Plc. USD 59 765 70 084 0.15
758 Signet Jewelers Ltd. USD 69 000 56 494 0.124 491 Skechers U.S.A., Inc. - A USD 108 092 102 844 0.221 232 Skyworks Solutions, Inc. USD 88 688 93 804 0.205 795 Smith & Wesson Hldg. Corp. USD 163 746 154 089 0.33
508 Snap-on, Inc. USD 79 177 77 196 0.162 735 Sonic Corp. USD 75 019 71 602 0.154 971 Southwest Airlines Co. USD 204 565 193 322 0.41
28 SpartanNash Co. USD 802 810 0.00487 Spectrum Brands Hldg., Inc. USD 63 853 67 055 0.14
8 Speedway Motorsports, Inc. USD 143 143 0.004 718 Spirit AeroSystems Hldg., Inc. - A USD 235 073 210 140 0.454 939 SPX Corp. USD 78 733 99 471 0.212 338 Stamps.com, Inc. USD 191 488 220 964 0.47
78 Standex International Corp. USD 6 853 7 244 0.02117 Stanley Black & Decker, Inc. USD 11 980 14 389 0.03
5 496 Staples, Inc. USD 52 734 46 991 0.10298 STERIS Plc. USD 21 197 21 784 0.05178 Sturm Ruger & Co., Inc. USD 10 459 10 281 0.02
9 904 SUPERVALU, Inc. USD 49 917 49 421 0.1113 724 Swift Transportation Co. USD 231 781 294 654 0.63
5 563 Symantec Corp. USD 104 967 139 631 0.302 276 Synaptics, Inc. USD 136 401 133 328 0.284 288 Sysco Corp. USD 212 967 210 155 0.453 089 Target Corp. USD 245 575 212 153 0.452 997 TE Connectivity Ltd. USD 183 848 192 947 0.412 551 Teekay Corp. USD 24 666 19 668 0.048 655 Tegna, Inc. USD 214 664 189 198 0.40

The accompanying notes form an integral part of these financial statements.
Schedule of Investments as at September 30, 2016 (cont.)(expressed in USD)
Merrill Lynch Investment Solutions – Gotham U.S. Equity Long/Short UCITS Fund
164 Merrill Lynch Investment Solutions
Unaudited semi-annual report
Quantity DescriptionQuotation
CurrencyCost USD
Market value
USD% of net
assets
Transferable securities and money market instruments admitted to an official exchange listing or dealt in on another regulated market (cont.)
Shares (cont.)5 438 Teradata Corp. USD 178 448 168 578 0.362 852 Teradyne, Inc. USD 58 407 61 546 0.13
93 Terex Corp. USD 2 254 2 363 0.014 377 Tessera Technologies, Inc. USD 169 096 168 252 0.361 839 Tetra Tech, Inc. USD 63 961 65 229 0.14
117 Texas Instruments, Inc. USD 7 087 8 211 0.02764 Tiffany & Co. USD 53 438 55 489 0.12
1 890 Time Warner, Inc. USD 145 166 150 463 0.321 042 Timken Co. USD 34 968 36 616 0.081 193 TJX Cos, Inc. USD 91 299 89 213 0.191 134 Tractor Supply Co. USD 86 737 76 375 0.16
555 TransCanada Corp. USD 22 454 26 396 0.06609 Travelport Worldwide Ltd. USD 8 097 9 153 0.02
2 059 Trinseo S.A. USD 114 878 116 457 0.252 976 Triumph Group, Inc. USD 110 203 82 971 0.18
72 tronc, Inc. USD 1 228 1 215 0.003 253 TrueBlue, Inc. USD 64 801 73 713 0.161 088 TTM Technologies, Inc. USD 10 187 12 458 0.03
675 Tupperware Brands Corp. USD 37 310 44 125 0.0910 779 Twenty-First Century Fox, Inc. - A USD 311 402 261 067 0.56
477 Tyson Foods, Inc. - A USD 27 272 35 618 0.081 762 UniFirst Corp. USD 202 902 232 337 0.501 530 Union Pacific Corp. USD 128 333 149 221 0.323 024 United Continental Hldg., Inc. USD 163 216 158 669 0.342 852 United Natural Foods, Inc. USD 110 043 114 194 0.241 476 United Parcel Service, Inc. - B USD 157 236 161 415 0.342 688 United Rentals, Inc. USD 162 636 210 981 0.45
430 United Technologies Corp. USD 41 762 43 688 0.093 626 United Therapeutics Corp. USD 548 251 428 158 0.911 098 Universal Corp. USD 60 972 63 926 0.142 068 Universal Health Services, Inc. - B USD 272 422 254 819 0.54
997 Urban Outfitters, Inc. USD 29 939 34 416 0.07152 US Ecology, Inc. USD 6 733 6 816 0.01
3 402 USG Corp. USD 89 051 87 942 0.191 080 Vail Resorts, Inc. USD 154 169 169 430 0.363 886 Valero Energy Corp. USD 209 252 205 958 0.44
344 Vector Group Ltd. USD 7 327 7 401 0.022 472 VeriSign, Inc. USD 208 666 193 409 0.412 054 Verisk Analytics, Inc. - A USD 167 192 166 949 0.36
190 Veritiv Corp. USD 9 421 9 532 0.024 374 Verizon Communications, Inc. USD 227 540 227 361 0.49
60 Verso Corp. - A USD 458 387 0.00276 Vertex Pharmaceuticals, Inc. USD 24 660 24 070 0.05
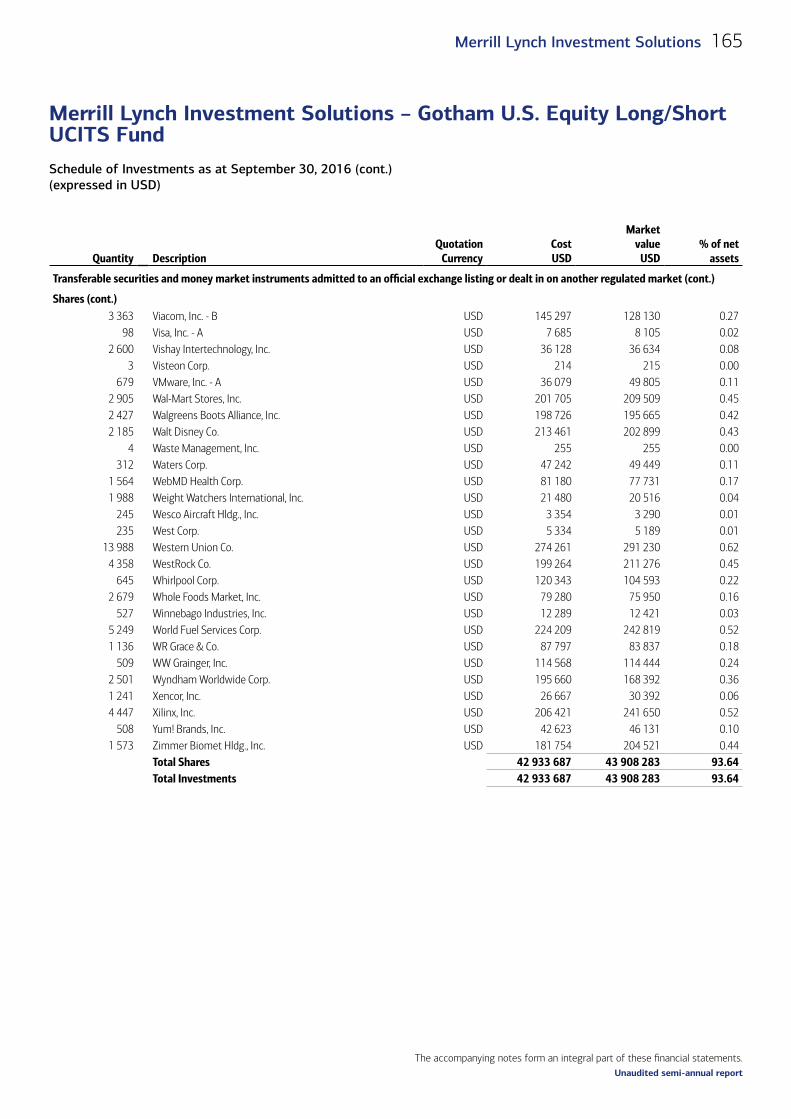
The accompanying notes form an integral part of these financial statements.
Schedule of Investments as at September 30, 2016 (cont.)(expressed in USD)
Merrill Lynch Investment Solutions – Gotham U.S. Equity Long/Short UCITS Fund
165Merrill Lynch Investment Solutions
Unaudited semi-annual report
Quantity DescriptionQuotation
CurrencyCost USD
Market value
USD% of net
assets
Transferable securities and money market instruments admitted to an official exchange listing or dealt in on another regulated market (cont.)
Shares (cont.)3 363 Viacom, Inc. - B USD 145 297 128 130 0.27
98 Visa, Inc. - A USD 7 685 8 105 0.022 600 Vishay Intertechnology, Inc. USD 36 128 36 634 0.08
3 Visteon Corp. USD 214 215 0.00679 VMware, Inc. - A USD 36 079 49 805 0.11
2 905 Wal-Mart Stores, Inc. USD 201 705 209 509 0.452 427 Walgreens Boots Alliance, Inc. USD 198 726 195 665 0.422 185 Walt Disney Co. USD 213 461 202 899 0.43
4 Waste Management, Inc. USD 255 255 0.00312 Waters Corp. USD 47 242 49 449 0.11
1 564 WebMD Health Corp. USD 81 180 77 731 0.171 988 Weight Watchers International, Inc. USD 21 480 20 516 0.04
245 Wesco Aircraft Hldg., Inc. USD 3 354 3 290 0.01235 West Corp. USD 5 334 5 189 0.01
13 988 Western Union Co. USD 274 261 291 230 0.624 358 WestRock Co. USD 199 264 211 276 0.45
645 Whirlpool Corp. USD 120 343 104 593 0.222 679 Whole Foods Market, Inc. USD 79 280 75 950 0.16
527 Winnebago Industries, Inc. USD 12 289 12 421 0.035 249 World Fuel Services Corp. USD 224 209 242 819 0.521 136 WR Grace & Co. USD 87 797 83 837 0.18
509 WW Grainger, Inc. USD 114 568 114 444 0.242 501 Wyndham Worldwide Corp. USD 195 660 168 392 0.361 241 Xencor, Inc. USD 26 667 30 392 0.064 447 Xilinx, Inc. USD 206 421 241 650 0.52
508 Yum! Brands, Inc. USD 42 623 46 131 0.101 573 Zimmer Biomet Hldg., Inc. USD 181 754 204 521 0.44
Total Shares 42 933 687 43 908 283 93.64Total Investments 42 933 687 43 908 283 93.64

The accompanying notes form an integral part of these financial statements.
Schedule of Investments as at September 30, 2016 (cont.)(expressed in USD)
Merrill Lynch Investment Solutions – Gotham U.S. Equity Long/Short UCITS Fund
166 Merrill Lynch Investment Solutions
Unaudited semi-annual report
Industrial classification of investments(as a percentage of net assets as at September 30, 2016) %
Industrial classification of investments(as a percentage of net assets as at September 30, 2016) (cont.) %
Retail 11.68 Home Furnishings 1.08 Software 6.71 Beverages 1.02 Pharmaceuticals 4.99 Oil & Gas Services 0.92 Computers 4.59 Apparel 0.86 Semiconductors 4.20 Household Products/Wares 0.82 Commercial Services 4.03 Agriculture 0.80 Media 3.90 Auto Manufacturers 0.68 Biotechnology 3.85 Home Builders 0.64 Telecommunications 3.77 Hand/Machine Tools 0.55 Food 3.70 Advertising 0.51 Healthcare-Products 2.98 Entertainment 0.51 Transportation 2.95 Textiles 0.50 Healthcare-Services 2.07 Leisure Time 0.42 Miscellaneous Manufacturing 2.07 Distribution/Wholesale 0.37 Airlines 1.94 Cosmetics/Personal Care 0.33 Internet 1.88 Shipbuilding 0.33 Electronics 1.84 Environmental Control 0.26 Building Materials 1.78 Housewares 0.26 Chemicals 1.76 Office Furnishings 0.24 Aerospace/Defense 1.64 Diversified Financial Services 0.20 Oil & Gas 1.62 Pipelines 0.18 Machinery-Diversified 1.53 Office/Business Equipment 0.16 Engineering & Construction 1.41 Metal Fabricate/Hardware 0.12 Auto Parts & Equipment 1.38 Forest Products & Paper 0.07 Electrical Components & Equipment 1.20 Machinery-Construction & Mining 0.01 Lodging 1.19 Storage/Warehousing 0.01 Packaging & Containers 1.13 93.64
Geographical classification of investments(as a percentage of net assets as at September 30, 2016) %United States 89.65 United Kingdom 1.19 Netherlands 0.83 Ireland 0.71 Canada 0.64 Switzerland 0.58 Bermuda 0.04
93.64
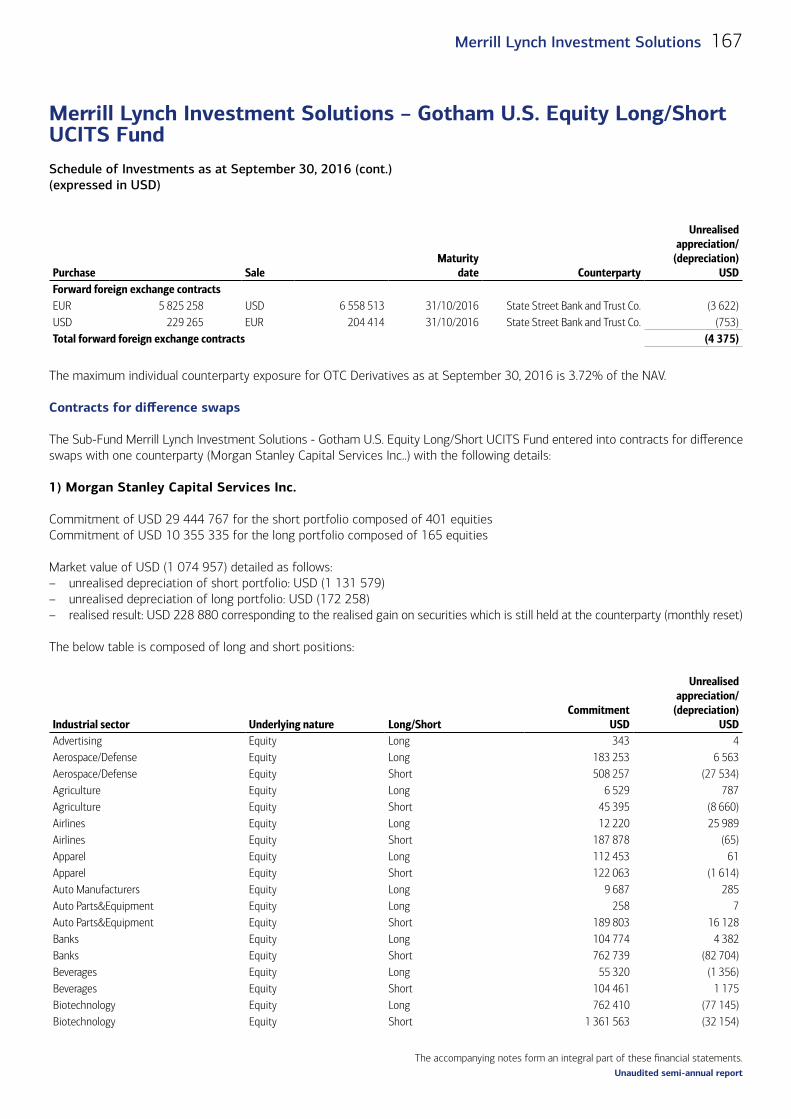
The accompanying notes form an integral part of these financial statements.
Schedule of Investments as at September 30, 2016 (cont.)(expressed in USD)
Merrill Lynch Investment Solutions – Gotham U.S. Equity Long/Short UCITS Fund
167Merrill Lynch Investment Solutions
Unaudited semi-annual report
Purchase
Sale
Maturity date Counterparty
Unrealised appreciation/
(depreciation)USD
Forward foreign exchange contracts EUR 5 825 258 USD 6 558 513 31/10/2016 State Street Bank and Trust Co. (3 622)USD 229 265 EUR 204 414 31/10/2016 State Street Bank and Trust Co. (753)Total forward foreign exchange contracts (4 375)
The maximum individual counterparty exposure for OTC Derivatives as at September 30, 2016 is 3.72% of the NAV.
Contracts for difference swaps
The Sub-Fund Merrill Lynch Investment Solutions - Gotham U.S. Equity Long/Short UCITS Fund entered into contracts for difference swaps with one counterparty (Morgan Stanley Capital Services Inc..) with the following details:
1) Morgan Stanley Capital Services Inc.
Commitment of USD 29 444 767 for the short portfolio composed of 401 equitiesCommitment of USD 10 355 335 for the long portfolio composed of 165 equities
Market value of USD (1 074 957) detailed as follows:– unrealised depreciation of short portfolio: USD (1 131 579)– unrealised depreciation of long portfolio: USD (172 258)– realised result: USD 228 880 corresponding to the realised gain on securities which is still held at the counterparty (monthly reset)
The below table is composed of long and short positions:
Industrial sector Underlying nature Long/ShortCommitment
USD
Unrealised appreciation/
(depreciation)USD
Advertising Equity Long 343 4Aerospace/Defense Equity Long 183 253 6 563Aerospace/Defense Equity Short 508 257 (27 534)Agriculture Equity Long 6 529 787Agriculture Equity Short 45 395 (8 660)Airlines Equity Long 12 220 25 989Airlines Equity Short 187 878 (65)Apparel Equity Long 112 453 61Apparel Equity Short 122 063 (1 614)Auto Manufacturers Equity Long 9 687 285Auto Parts&Equipment Equity Long 258 7Auto Parts&Equipment Equity Short 189 803 16 128Banks Equity Long 104 774 4 382Banks Equity Short 762 739 (82 704)Beverages Equity Long 55 320 (1 356)Beverages Equity Short 104 461 1 175Biotechnology Equity Long 762 410 (77 145)Biotechnology Equity Short 1 361 563 (32 154)

The accompanying notes form an integral part of these financial statements.
Schedule of Investments as at September 30, 2016 (cont.)(expressed in USD)
Merrill Lynch Investment Solutions – Gotham U.S. Equity Long/Short UCITS Fund
168 Merrill Lynch Investment Solutions
Unaudited semi-annual report
Industrial sector Underlying nature Long/ShortCommitment
USD
Unrealised appreciation/
(depreciation)USD
Building Materials Equity Long 208 263 (10 335)Building Materials Equity Short 555 826 5 335Chemicals Equity Long 407 555 29 330Chemicals Equity Short 1 184 220 (30 258)Commercial Services Equity Long 948 375 14 531Commercial Services Equity Short 1 160 614 (6 969)Computers Equity Long 632 432 (3 364)Computers Equity Short 332 854 (11 672)Cosmetics/Personal Care Equity Short 361 837 9 566Distribution/Wholesale Equity Short 612 431 115 905Diversified Financial Services Equity Long 250 884 (589)Diversified Financial Services Equity Short 101 496 7 835Electrical Compo&Equip Equity Long 40 054 7 381Electrical Compo&Equip Equity Short 63 029 (2 464)Electric Equity Short 207 901 1 366Electronics Equity Long 1 182 (1 781)Electronics Equity Short 557 363 (16 306)Energy-Alternate Sources Equity Short 199 361 1 968Engineering&Construction Equity Long 174 099 (26 947)Engineering&Construction Equity Short 753 322 7 655Entertainment Equity Long 13 621 –Entertainment Equity Short 207 013 3 542Environmental Control Equity Long 6 078 349Environmental Control Equity Short 288 927 4 447Food Service Equity Short 50 868 (821)Food Equity Long 326 154 (6 161)Food Equity Short 1 107 722 (62 913)Forest Products&Paper Equity Short 227 213 (77 524)Hand/Machine Tools Equity Short 130 906 5 228Healthcare-Products Equity Long 228 410 2 157Healthcare-Products Equity Short 1 271 654 (62 368)Healthcare-Services Equity Long 240 011 (8 207)Healthcare-Services Equity Short 688 983 (96 881)Home Builders Equity Long 13 873 (887)Home Builders Equity Short 307 789 87 590Home Furnishings Equity Long 121 332 (709)Home Furnishings Equity Short 39 265 (8 592)Household Products/Wares Equity Long 459 946 (53 581)Household Products/Wares Equity Short 9 413 217Housewares Equity Short 23 203 (296)Internet Equity Long 108 447 (5 293)Internet Equity Short 555 166 (27 123)Leisure Time Equity Long 368 (2)Leisure Time Equity Short 61 574 (5 838)Lodging Equity Long 151 183 6 497

The accompanying notes form an integral part of these financial statements.
Schedule of Investments as at September 30, 2016 (cont.)(expressed in USD)
Merrill Lynch Investment Solutions – Gotham U.S. Equity Long/Short UCITS Fund
169Merrill Lynch Investment Solutions
Unaudited semi-annual report
Industrial sector Underlying nature Long/ShortCommitment
USD
Unrealised appreciation/
(depreciation)USD
Lodging Equity Short 493 593 (9 704)Machinery-Diversified Equity Long 222 213 (63 279)Machinery-Diversified Equity Short 1 054 159 (31 728)Media Equity Long 492 717 (28 824)Media Equity Short 1 257 829 (172 155)Metal Fabricate/Hardware Equity Short 21 838 (953)Mining Equity Short 85 866 (4 342)Miscellaneous Manufactur Equity Long 82 013 631Miscellaneous Manufactur Equity Short 196 164 (5 503)Office Furnishings Equity Short 94 451 (7 733)Office/Business Equip Equity Short 305 789 (121 176)Oil&Gas Services Equity Short 515 324 (25 437)Oil&Gas Equity Long 25 593 39 873Oil&Gas Equity Short 354 433 (6 372)Packaging&Containers Equity Long 84 607 (1 193)Packaging&Containers Equity Short 347 116 (88 577)Pharmaceuticals Equity Long 812 422 (15 574)Pharmaceuticals Equity Short 1 395 737 41 009Pipelines Equity Short 41 588 (429)Real Estate Equity Short 15 077 2 617Retail Equity Long 902 551 (16 324)Retail Equity Short 2 073 249 (31 226)Semiconductors Equity Long 593 705 (1 837)Semiconductors Equity Short 1 185 559 (42 211)Shipbuilding Equity Long 742 –Software Equity Long 246 208 (23 954)Software Equity Short 1 876 773 (163 905)Telecommunications Equity Long 553 057 93 454Telecommunications Equity Short 2 281 608 (87 711)Textiles Equity Short 88 033 (3 569)Toys/Games/Hobbies Equity Short 268 978 23 364Transportation Equity Long 759 994 (57 198)Transportation Equity Short 1 149 492 (101 039)Total 39 800 101 (1 303 838)
The total market value of the contracts for difference swaps is USD (1 074 958).
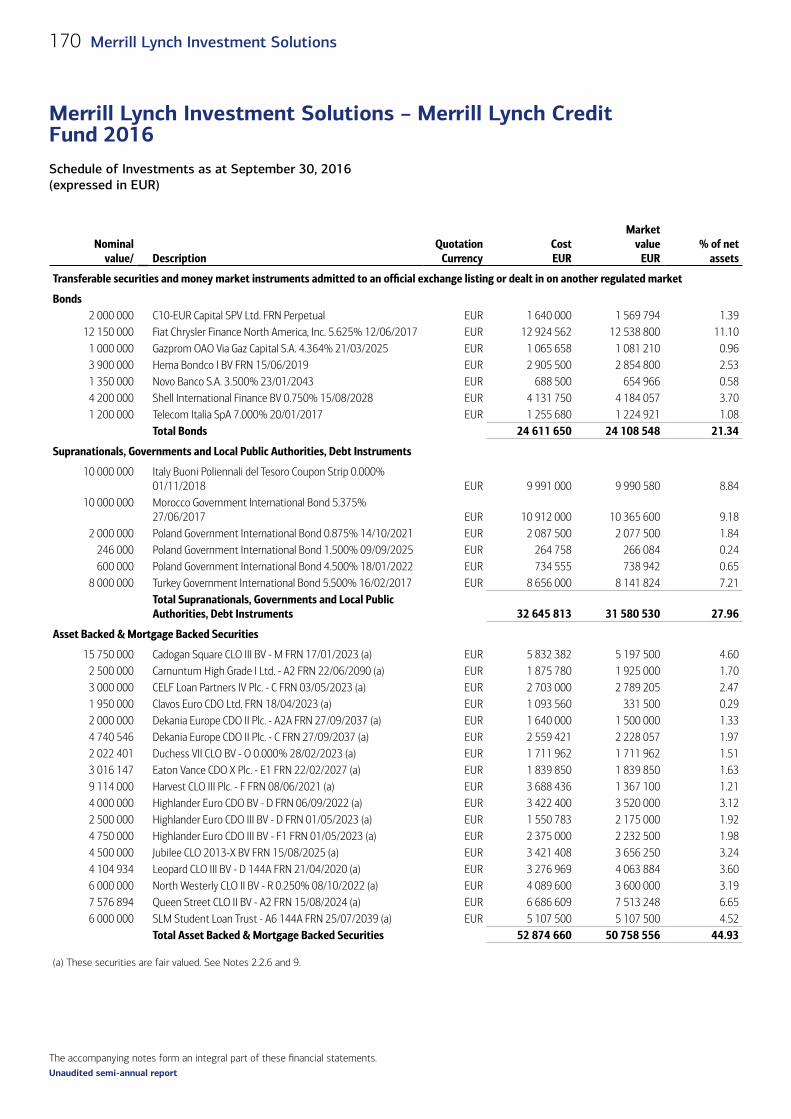
The accompanying notes form an integral part of these financial statements.
Schedule of Investments as at September 30, 2016 (expressed in EUR)
Merrill Lynch Investment Solutions – Merrill Lynch CreditFund 2016
170 Merrill Lynch Investment Solutions
Unaudited semi-annual report
Merrill Lynch Investment Solutions – Merrill Lynch CreditFund 2016
Schedule of Investments as at September 30, 2016 (expressed in EUR)
Nominal value/ Description
Quotation Currency
Cost EUR
Market value
EUR% of net
assets
Transferable securities and money market instruments admitted to an official exchange listing or dealt in on another regulated market (cont.)
Bonds2 000 000 C10-EUR Capital SPV Ltd. FRN Perpetual EUR 1 640 000 1 569 794 1.39
12 150 000 Fiat Chrysler Finance North America, Inc. 5.625% 12/06/2017 EUR 12 924 562 12 538 800 11.101 000 000 Gazprom OAO Via Gaz Capital S.A. 4.364% 21/03/2025 EUR 1 065 658 1 081 210 0.963 900 000 Hema Bondco I BV FRN 15/06/2019 EUR 2 905 500 2 854 800 2.531 350 000 Novo Banco S.A. 3.500% 23/01/2043 EUR 688 500 654 966 0.584 200 000 Shell International Finance BV 0.750% 15/08/2028 EUR 4 131 750 4 184 057 3.701 200 000 Telecom Italia SpA 7.000% 20/01/2017 EUR 1 255 680 1 224 921 1.08
Total Bonds 24 611 650 24 108 548 21.34
Supranationals, Governments and Local Public Authorities, Debt Instruments
10 000 000 Italy Buoni Poliennali del Tesoro Coupon Strip 0.000% 01/11/2018 EUR 9 991 000 9 990 580 8.84
10 000 000 Morocco Government International Bond 5.375% 27/06/2017 EUR 10 912 000 10 365 600 9.18
2 000 000 Poland Government International Bond 0.875% 14/10/2021 EUR 2 087 500 2 077 500 1.84246 000 Poland Government International Bond 1.500% 09/09/2025 EUR 264 758 266 084 0.24600 000 Poland Government International Bond 4.500% 18/01/2022 EUR 734 555 738 942 0.65
8 000 000 Turkey Government International Bond 5.500% 16/02/2017 EUR 8 656 000 8 141 824 7.21Total Supranationals, Governments and Local Public Authorities, Debt Instruments 32 645 813 31 580 530 27.96
Asset Backed & Mortgage Backed Securities
15 750 000 Cadogan Square CLO III BV - M FRN 17/01/2023 (a) EUR 5 832 382 5 197 500 4.602 500 000 Carnuntum High Grade I Ltd. - A2 FRN 22/06/2090 (a) EUR 1 875 780 1 925 000 1.703 000 000 CELF Loan Partners IV Plc. - C FRN 03/05/2023 (a) EUR 2 703 000 2 789 205 2.471 950 000 Clavos Euro CDO Ltd. FRN 18/04/2023 (a) EUR 1 093 560 331 500 0.292 000 000 Dekania Europe CDO II Plc. - A2A FRN 27/09/2037 (a) EUR 1 640 000 1 500 000 1.334 740 546 Dekania Europe CDO II Plc. - C FRN 27/09/2037 (a) EUR 2 559 421 2 228 057 1.972 022 401 Duchess VII CLO BV - O 0.000% 28/02/2023 (a) EUR 1 711 962 1 711 962 1.513 016 147 Eaton Vance CDO X Plc. - E1 FRN 22/02/2027 (a) EUR 1 839 850 1 839 850 1.639 114 000 Harvest CLO III Plc. - F FRN 08/06/2021 (a) EUR 3 688 436 1 367 100 1.214 000 000 Highlander Euro CDO BV - D FRN 06/09/2022 (a) EUR 3 422 400 3 520 000 3.122 500 000 Highlander Euro CDO III BV - D FRN 01/05/2023 (a) EUR 1 550 783 2 175 000 1.924 750 000 Highlander Euro CDO III BV - F1 FRN 01/05/2023 (a) EUR 2 375 000 2 232 500 1.984 500 000 Jubilee CLO 2013-X BV FRN 15/08/2025 (a) EUR 3 421 408 3 656 250 3.244 104 934 Leopard CLO III BV - D 144A FRN 21/04/2020 (a) EUR 3 276 969 4 063 884 3.606 000 000 North Westerly CLO II BV - R 0.250% 08/10/2022 (a) EUR 4 089 600 3 600 000 3.197 576 894 Queen Street CLO II BV - A2 FRN 15/08/2024 (a) EUR 6 686 609 7 513 248 6.656 000 000 SLM Student Loan Trust - A6 144A FRN 25/07/2039 (a) EUR 5 107 500 5 107 500 4.52
Total Asset Backed & Mortgage Backed Securities 52 874 660 50 758 556 44.93
(a) These securities are fair valued. See Notes 2.2.6 and 9.

The accompanying notes form an integral part of these financial statements.
Schedule of Investments as at September 30, 2016 (cont.)(expressed in EUR)
Merrill Lynch Investment Solutions – Merrill Lynch CreditFund 2016
171Merrill Lynch Investment Solutions
Unaudited semi-annual report
Nominal value/ Description
Quotation Currency
Cost EUR
Market value
EUR% of net
assets
Transferable securities and money market instruments admitted to an official exchange listing or dealt in on another regulated market (cont.)
Other transferable securities
Bonds2 500 000 ESPRI Ltd. FRN 15/12/2021 (a) EUR 1 375 000 1 500 000 1.33
Total Bonds 1 375 000 1 500 000 1.33Total Investments 111 507 123 107 947 634 95.56
(a) These securities are fair valued. See Notes 2.2.6 and 9.
Industrial classification of investments(as a percentage of net assets as at September 30, 2016) %
Geographical classification of investments(as a percentage of net assets as at September 30, 2016) %
Other ABS 40.41 Netherlands 36.04 Sovereign 27.96 United States 15.62 Auto Manufacturers 11.10 Italy 9.92 Oil & Gas 4.66 Morocco 9.18 Student Loan ABS 4.52 Ireland 8.90Retail 2.53 Turkey 7.21Building Materials 1.39 Poland 2.73Diversified Financial Services 1.33 Jersey 1.70Telecommunications 1.08 British Virgin Islands 1.39Banks 0.58 Cayman Islands 1.33Banks 95.56 Luxembourg 0.96
Portugal 0.5895.56

The accompanying notes form an integral part of these financial statements.
Schedule of Investments as at September 30, 2016 (cont.)(expressed in EUR)
Merrill Lynch Investment Solutions – Merrill Lynch CreditFund 2016
172 Merrill Lynch Investment Solutions
Unaudited semi-annual report
Notional
Pay
Receive
Currency
Maturity date Counterparty
Unrealised appreciation/
(depreciation) EUR
Commitment EUR
Total return swaps(142 670 922) Bank of America Merrill Lynch
US Banking Total Return IndexEUR 3 months EURIBOR EUR 15/12/2016 Merrill Lynch International
Bank Ltd. 1 088 926 142 670 922
Basket composed of:Quantity Description Currency
(2 000 000) C10-EUR Capital SPV Ltd. FRN Perpetual EUR(15 750 000) Cadogan Square CLO III BV - M FRN 17/01/2023 EUR
(2 500 000) Carnuntum High Grade I Ltd. - A2 FRN 22/06/2090 EUR(3 000 000) CELF Loan Partners IV Plc. - C FRN 03/05/2023 EUR(1 950 000) Clavos Euro CDO Ltd. FRN 18/04/2023 EUR(2 000 000) Dekania Europe CDO II Plc. - A2A FRN 27/09/2037 EUR(4 740 546) Dekania Europe CDO II Plc. - C FRN 27/09/2037 EUR(2 022 401) Duchess VII CLO BV - O 0.000% 28/02/2023 EUR(3 016 147) Eaton Vance CDO X Plc. - E1 FRN 22/02/2027 EUR (2 500 000) ESPRI Ltd. FRN 15/12/2021 EUR
(12 150 000) Fiat Chrysler Finance North America, Inc. 5.625% 12/06/2017 EUR
(1 000 000) Gazprom OAO Via Gaz Capital S.A. 4.364% 21/03/2025 EUR(9 114 000) Harvest CLO III Plc. - F FRN 08/06/2021 EUR (3 900 000) Hema Bondco I BV FRN 15/06/2019 EUR (4 000 000) Highlander Euro CDO BV - D FRN 06/09/2022 EUR(2 500 000) Highlander Euro CDO III BV - D FRN 01/05/2023 EUR (4 750 000) Highlander Euro CDO III BV - F1 FRN 01/05/2023 EUR
(10 000 000) Italy Buoni Poliennali del Tesoro Coupon Strip 0.000% 01/11/2018 EUR
(4 500 000) Jubilee CLO 2013-X BV FRN 15/08/2025 EUR (4 104 934) Leopard CLO III BV - D 144A FRN 21/04/2020 EUR
(10 000 000) Morocco Government International Bond 5.375% 27/06/2017 EUR
(6 000 000) North Westerly CLO II BV - R 0.250% 08/10/2022 EUR (1 350 000) Novo Banco S.A. 3.500% 23/01/2043 EUR (2 000 000) Poland Government International Bond 0.875%
14/10/2021 EUR (246 000) Poland Government International Bond 1.500%
09/09/2025 EUR (600 000) Poland Government International Bond 4.500%
18/01/2022 EUR(7 576 894) Queen Street CLO II BV - A2 FRN 15/08/2024 EUR (4 200 000) Shell International Finance BV 0.750% 15/08/2028 EUR (6 000 000) SLM Student Loan Trust - A6 144A FRN 25/07/2039 EUR(1 200 000) Telecom Italia SpA 7.000% 20/01/2017 EUR(8 000 000) Turkey Government International Bond 5.500%
16/02/2017 EUR
The maximum individual counterparty exposure for OTC Derivatives as at September 30, 2016 is 2.80% of the NAV.

The accompanying notes form an integral part of these financial statements.
Schedule of Investments as at September 30, 2016 (expressed in USD)
Merrill Lynch Investment Solutions – Passport Capital Global Equity Long Short UCITS Fund
173Merrill Lynch Investment Solutions
Unaudited semi-annual report
Merrill Lynch Investment Solutions – Passport Capital Global Equity Long Short UCITS Fund
Schedule of Investments as at September 30, 2016 (expressed in USD)
Quantity DescriptionQuotation
CurrencyCost USD
Market value
USD% of net
assets
Transferable securities and money market instruments admitted to an official exchange listing or dealt in on another regulated market
Shares2 806 Affiliated Managers Group, Inc. USD 402 819 406 028 1.007 044 Albemarle Corp. USD 587 667 602 192 1.48
16 508 Alibaba Group Hldg. Ltd. - ADR USD 1 487 265 1 746 381 4.297 013 Allergan Plc. USD 1 667 606 1 615 164 3.971 046 Alphabet, Inc. - C USD 804 367 813 045 2.00
37 393 AngloGold Ashanti Ltd. - ADR USD 620 537 595 297 1.467 515 ASML Hldg. NV - Reg USD 821 646 823 494 2.03
25 091 British American Tobacco Plc. GBP 1 564 955 1 606 845 3.9516 285 Cabot Oil & Gas Corp. USD 398 461 420 153 1.0372 576 Cemex SAB de CV - ADR USD 606 913 576 253 1.4250 112 China Mobile Ltd. HKD 584 044 606 375 1.49
7 918 Concho Resources, Inc. USD 869 106 1 087 537 2.679 780 Constellation Brands, Inc. - A USD 1 529 086 1 628 272 4.004 245 Crown Castle International Corp. USD 411 658 399 921 0.986 449 Dollar Tree, Inc. USD 510 292 509 020 1.254 985 Facebook, Inc. - A USD 539 877 639 426 1.57
32 813 Flex Ltd. USD 412 316 446 913 1.1043 161 Johnson Controls International Plc. USD 2 021 419 2 008 281 4.9439 928 Liberty Global Plc. - C USD 1 187 678 1 319 221 3.24
129 388 Marvell Technology Group Ltd. USD 1 647 775 1 716 979 4.2227 922 Microsoft Corp. USD 1 509 815 1 608 307 3.9619 600 Molson Coors Brewing Co. - B USD 1 913 970 2 152 080 5.2920 978 Newmont Mining Corp. USD 862 355 824 226 2.0342 718 Pfizer, Inc. USD 1 370 673 1 446 859 3.56
5 593 Schlumberger Ltd. USD 413 313 439 834 1.0819 224 Sempra Energy USD 1 923 423 2 060 621 5.0715 835 Silver Wheaton Corp. USD 346 950 428 020 1.0533 245 Symantec Corp. USD 800 252 834 449 2.0542 834 Tencent Hldg. Ltd. HKD 920 471 1 176 341 2.89
7 437 Visa, Inc. - A USD 604 785 615 040 1.51Total Shares 29 341 494 31 152 574 76.58
Warrants
290 923 Alinma Bank Call Strike Price 3.410 06/08/2020 (a) USD 988 964 882 442 2.17Total Warrants 988 964 882 442 2.17Total Investments 30 330 458 32 035 016 78.75
(a) This security is fair valued. See Notes 2.2.6 and 9.

The accompanying notes form an integral part of these financial statements.
Schedule of Investments as at September 30, 2016 (cont.)(expressed in USD)
Merrill Lynch Investment Solutions – Passport Capital Global Equity Long Short UCITS Fund
174 Merrill Lynch Investment Solutions
Unaudited semi-annual report
Industrial classification of investments(as a percentage of net assets as at September 30, 2016) %
Geographical classification of investments(as a percentage of net assets as at September 30, 2016) %
Internet 12.80 United States 50.54Beverages 9.29 United Kingdom 9.36Pharmaceuticals 7.53 China 7.18Semiconductors 6.25 Bermuda 4.22Electronics 6.04 Netherlands 2.03Gas 5.07 Hong Kong 1.49Mining 4.54 South Africa 1.46Software 3.96 Mexico 1.42Agriculture 3.95 Canada 1.05Oil & Gas 3.70 78.75Media 3.24Diversified Financial Services 2.51Banks 2.17Telecommunications 1.49Chemicals 1.48Building Materials 1.42Retail 1.25Oil & Gas Services 1.08REITS 0.98
78.75
Purchase
Sale
Maturity date Counterparty
Unrealised appreciation/
(depreciation)USD
Forward foreign exchange contracts CHF 2 124 968 USD 2 197 357 31/10/2016 State Street Bank and Trust Co. (1 829)EUR 22 586 170 USD 25 429 201 31/10/2016 State Street Bank and Trust Co. (14 041)USD 8 681 CHF 8 412 31/10/2016 State Street Bank and Trust Co. (11)USD 1 179 EUR 1 050 31/10/2016 State Street Bank and Trust Co. (2)Total forward foreign exchange contracts (15 883)
Short/Long
Currency Description
Put/ Call
Strike Price
Maturity date Quantity
Market value
USDCommitment
USDOptionsLong USD Nasdaq 100 Stock Index Put 4 575.000 21/10/2016 10 6 680 –Short USD Russell 2000 Index Put 1 170.000 30/09/2016 (51) (306) 5 967 000Long USD Russell 2000 Index Put 1 220.000 30/09/2016 46 230 –Total Options 6 604 5 967 000
Merrill Lynch Professional Clearing is the counterparty to these options.
The maximum individual counterparty exposure for OTC Derivatives as at September 30, 2016 is 2.44% of the NAV.

The accompanying notes form an integral part of these financial statements.
Schedule of Investments as at September 30, 2016 (cont.)(expressed in USD)
Merrill Lynch Investment Solutions – Passport Capital Global Equity Long Short UCITS Fund
175Merrill Lynch Investment Solutions
Unaudited semi-annual report
Contracts for difference swaps
The Sub-Fund Passport Capital Global Equity Long Short UCITS Fund entered into contracts for difference swaps with one counterparty (Morgan Stanley International Plc..) with the following details:
1) Morgan Stanley International Plc.
Commitment of USD 9 366 893 for the short portfolio composed of 24 equitiesCommitment of USD 790 089 for the long portfolio composed of 4 equities
Market value of USD (76 359) detailed as follows:– unrealised depreciation of short portfolio: USD (25 835)– unrealised depreciation of long portfolio: USD (6 233)– realised result: USD (44 291) corresponding to the realised loss on securities which is still held at the counterparty (monthly reset)
The below table is composed of long and short positions:
Industrial sector Underlying nature Long/ShortCommitment
USD
Unrealised appreciation/
(depreciation)USD
Auto Parts&Equipment Equity Short 461 583 (14 303)Banks Equity Short 1 366 437 62 006Distribution/Wholesale Equity Short 782 216 (3 326)Electric Equity Short 387 343 (3 807)Engineering&Construction Equity Long 198 612 (5 524)Food Equity Short 788 148 (32 609)Healthcare-Services Equity Short 499 867 1 594Home Builders Equity Short 372 126 23 467Machinery-Constr&Mining Equity Long 401 041 6 743Machinery-Diversified Equity Long 190 436 (7 452)Media Equity Short 384 626 (1 491)Pharmaceuticals Equity Short 394 629 1 752Retail Equity Short 1 941 396 (51 348)Software Equity Short 793 210 (5 415)Telecommunications Equity Short 1 195 312 (2 355)Total 10 156 982 (32 068)
The total market value of the contracts for difference swaps is USD (76 358).
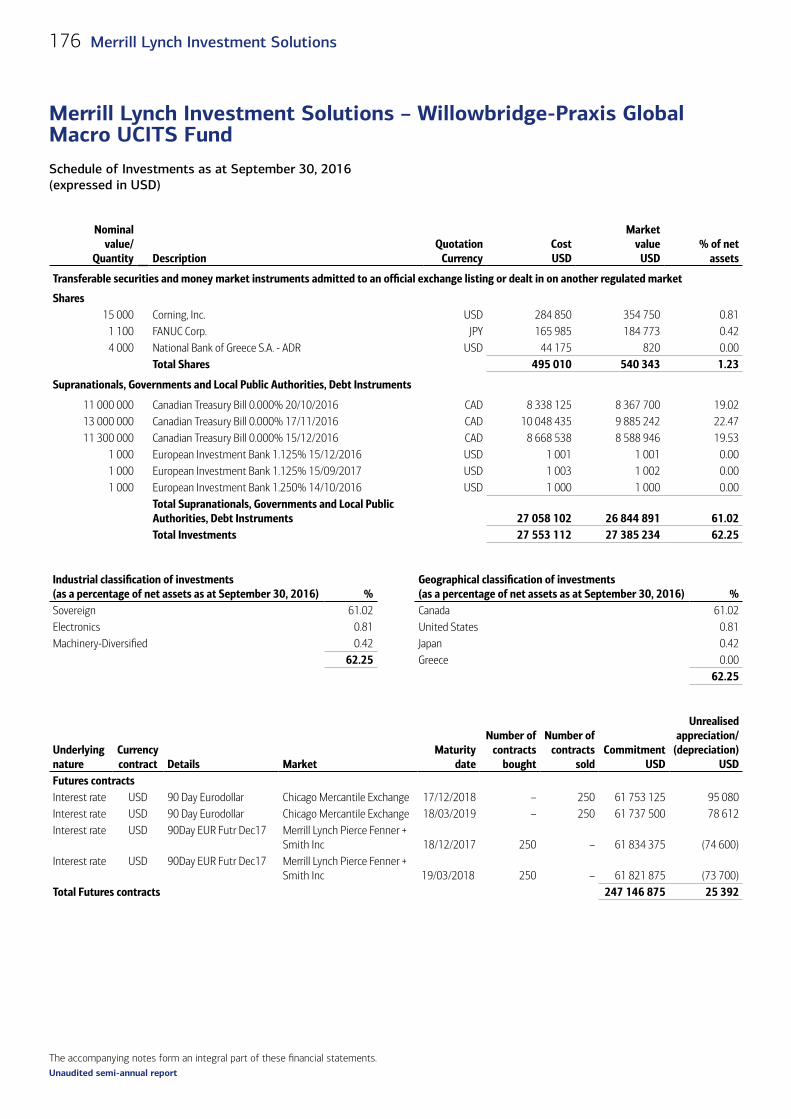
The accompanying notes form an integral part of these financial statements.
Schedule of Investments as at September 30, 2016 (expressed in USD)
Merrill Lynch Investment Solutions – Willowbridge-Praxis Global Macro UCITS Fund
176 Merrill Lynch Investment Solutions
Unaudited semi-annual report
Merrill Lynch Investment Solutions – Willowbridge-Praxis Global Macro UCITS Fund
Schedule of Investments as at September 30, 2016 (expressed in USD)
Nominal value/
Quantity DescriptionQuotation
CurrencyCost USD
Market value
USD% of net
assets
Transferable securities and money market instruments admitted to an official exchange listing or dealt in on another regulated market
Shares15 000 Corning, Inc. USD 284 850 354 750 0.81
1 100 FANUC Corp. JPY 165 985 184 773 0.424 000 National Bank of Greece S.A. - ADR USD 44 175 820 0.00
Total Shares 495 010 540 343 1.23
Supranationals, Governments and Local Public Authorities, Debt Instruments
11 000 000 Canadian Treasury Bill 0.000% 20/10/2016 CAD 8 338 125 8 367 700 19.0213 000 000 Canadian Treasury Bill 0.000% 17/11/2016 CAD 10 048 435 9 885 242 22.4711 300 000 Canadian Treasury Bill 0.000% 15/12/2016 CAD 8 668 538 8 588 946 19.53
1 000 European Investment Bank 1.125% 15/12/2016 USD 1 001 1 001 0.001 000 European Investment Bank 1.125% 15/09/2017 USD 1 003 1 002 0.001 000 European Investment Bank 1.250% 14/10/2016 USD 1 000 1 000 0.00
Total Supranationals, Governments and Local Public Authorities, Debt Instruments 27 058 102 26 844 891 61.02Total Investments 27 553 112 27 385 234 62.25
Industrial classification of investments(as a percentage of net assets as at September 30, 2016) %
Geographical classification of investments(as a percentage of net assets as at September 30, 2016) %
Sovereign 61.02 Canada 61.02Electronics 0.81 United States 0.81Machinery-Diversified 0.42 Japan 0.42
62.25 Greece 0.0062.25
Underlying nature
Currency contract
Details
Market
Maturity date
Number of contracts
bought
Number of contracts
soldCommitment
USD
Unrealised appreciation/
(depreciation)USD
Futures contractsInterest rate USD 90 Day Eurodollar Chicago Mercantile Exchange 17/12/2018 – 250 61 753 125 95 080Interest rate USD 90 Day Eurodollar Chicago Mercantile Exchange 18/03/2019 – 250 61 737 500 78 612Interest rate USD 90Day EUR Futr Dec17 Merrill Lynch Pierce Fenner +
Smith Inc 18/12/2017 250 – 61 834 375 (74 600)Interest rate USD 90Day EUR Futr Dec17 Merrill Lynch Pierce Fenner +
Smith Inc 19/03/2018 250 – 61 821 875 (73 700)Total Futures contracts 247 146 875 25 392

The accompanying notes form an integral part of these financial statements.
Schedule of Investments as at September 30, 2016 (cont.)(expressed in USD)
Merrill Lynch Investment Solutions – Willowbridge-Praxis Global Macro UCITS Fund
177Merrill Lynch Investment Solutions
Unaudited semi-annual report
Purchase
Sale
Maturity date Counterparty
Unrealised appreciation/
(depreciation)USD
Forward foreign exchange contracts USD 8 352 316 CAD 11 000 000 21/10/2016 State Street Bank and Trust Co (18 715)EUR 9 452 277 USD 10 642 082 31/10/2016 State Street Bank and Trust Co (5 878)USD 1 388 286 EUR 1 238 411 31/10/2016 State Street Bank and Trust Co (5 240)USD 10 054 138 CAD 13 000 000 18/11/2016 State Street Bank and Trust Co 159 127CNH 7 990 000 USD 1 207 040 23/11/2016 Merrill Lynch International Ltd. (13 221)USD 1 203 422 CNH 7 990 000 23/11/2016 Merrill Lynch International Ltd. 9 603CNH 7 990 000 USD 1 206 675 28/11/2016 Merrill Lynch International Ltd. (13 238)USD 1 203 313 CNH 7 990 000 28/11/2016 Merrill Lynch International Ltd. 9 876USD 8 692 308 CAD 11 300 000 16/12/2016 State Street Bank and Trust Co 89 601CNH 16 019 000 USD 2 382 298 23/12/2016 Merrill Lynch International Ltd. 6 930USD 2 412 500 CNH 16 019 000 23/12/2016 Merrill Lynch International Ltd. 23 272USD 2 441 728 SAR 9 187 000 04/01/2017 Merrill Lynch International Ltd. (1 786)CNH 16 362 000 USD 2 452 339 23/01/2017 Merrill Lynch International Ltd. (15 769)USD 2 416 839 CNH 16 362 000 23/01/2017 Merrill Lynch International Ltd. (19 731)THB 220 749 000 USD 6 144 830 01/02/2017 Merrill Lynch International Ltd. 217 836USD 6 051 234 THB 220 749 000 01/02/2017 Merrill Lynch International Ltd. (311 432)Total forward foreign exchange contracts 111 235
The maximum individual counterparty exposure for OTC Derivatives as at September 30, 2016 is 4.70% of the NAV.

The accompanying notes form an integral part of these financial statements.
Schedule of Investments as at September 30, 2016 (expressed in USD)
Merrill Lynch Investment Solutions – Ramius Merger Arbitrage UCITS Fund
178 Merrill Lynch Investment Solutions
Unaudited semi-annual report
Merrill Lynch Investment Solutions – Ramius Merger Arbitrage UCITS Fund
Schedule of Investments as at September 30, 2016 (expressed in USD)
Nominal value/
Quantity DescriptionQuotation
CurrencyCost USD
Market value
USD% of net
assets
Transferable securities and money market instruments admitted to an official exchange listing or dealt in on another regulated market
Bonds233 000 Rackspace Hosting, Inc. 144A 6.500% 15/01/2024 USD 256 883 255 717 1.32
Total Bonds 256 883 255 717 1.32Shares29 984 Astoria Financial Corp. USD 453 607 437 766 2.2614 762 Chemtura Corp. USD 483 711 484 341 2.507 551 Cynapsus Therapeutics, Inc. USD 302 720 303 701 1.5712 020 EverBank Financial Corp. USD 221 582 232 707 1.202 786 Imperva, Inc. USD 136 137 149 636 0.7713 691 Infoblox, Inc. USD 352 699 361 032 1.8619 328 Ingram Micro, Inc. - A USD 676 671 689 237 3.5535 860 Intersil Corp. - A USD 761 469 786 410 4.0522 538 Joy Global, Inc. USD 617 719 625 204 3.224 911 Lexmark International, Inc. - A USD 179 525 196 244 1.019 877 LinkedIn Corp. - A USD 1 895 615 1 887 692 9.731 216 Monsanto Co. USD 125 309 124 275 0.6421 398 Rackspace Hosting, Inc. USD 674 379 678 103 3.4910 047 Rite Aid Corp. USD 81 656 77 262 0.4067 783 SunEdison Semiconductor Ltd. USD 775 039 772 048 3.9821 767 Syngenta AG - ADR USD 1 806 275 1 906 789 9.835 200 Talen Energy Corp. USD 71 890 72 020 0.371 160 Twitter, Inc. USD 26 679 26 738 0.14
Total Shares 9 642 682 9 811 205 50.57
Supranationals, Governments and Local Public Authorities, Debt Instruments
4 000 000 United States Treasury Bill 0.000% 01/12/2016 USD 3 998 264 3 998 812 20.61Total Supranationals, Governments and Local Public Authorities, Debt Instruments 3 998 264 3 998 812 20.61Total Investments 13 897 829 14 065 734 72.50
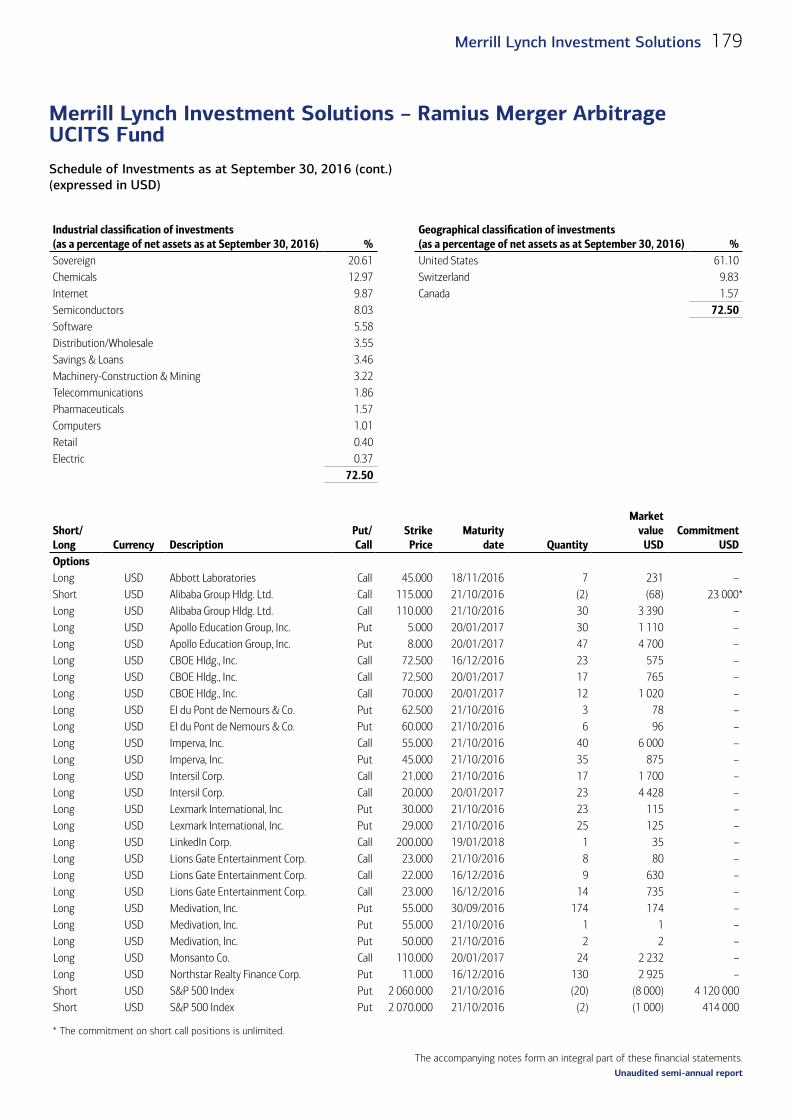
The accompanying notes form an integral part of these financial statements.
Schedule of Investments as at September 30, 2016 (cont.)(expressed in USD)
Merrill Lynch Investment Solutions – Ramius Merger Arbitrage UCITS Fund
179Merrill Lynch Investment Solutions
Unaudited semi-annual report
Industrial classification of investments(as a percentage of net assets as at September 30, 2016) %
Geographical classification of investments(as a percentage of net assets as at September 30, 2016) %
Sovereign 20.61 United States 61.10 Chemicals 12.97 Switzerland 9.83 Internet 9.87 Canada 1.57 Semiconductors 8.03 72.50Software 5.58 Distribution/Wholesale 3.55 Savings & Loans 3.46 Machinery-Construction & Mining 3.22 Telecommunications 1.86 Pharmaceuticals 1.57 Computers 1.01 Retail 0.40 Electric 0.37
72.50
Short/Long
Currency Description
Put/Call
Strike Price
Maturity date Quantity
Market value
USDCommitment
USDOptions (cont.)Long USD Abbott Laboratories Call 45.000 18/11/2016 7 231 –Short USD Alibaba Group Hldg. Ltd. Call 115.000 21/10/2016 (2) (68) 23 000*Long USD Alibaba Group Hldg. Ltd. Call 110.000 21/10/2016 30 3 390 –Long USD Apollo Education Group, Inc. Put 5.000 20/01/2017 30 1 110 –Long USD Apollo Education Group, Inc. Put 8.000 20/01/2017 47 4 700 –Long USD CBOE Hldg., Inc. Call 72.500 16/12/2016 23 575 –Long USD CBOE Hldg., Inc. Call 72.500 20/01/2017 17 765 –Long USD CBOE Hldg., Inc. Call 70.000 20/01/2017 12 1 020 –Long USD EI du Pont de Nemours & Co. Put 62.500 21/10/2016 3 78 –Long USD EI du Pont de Nemours & Co. Put 60.000 21/10/2016 6 96 –Long USD Imperva, Inc. Call 55.000 21/10/2016 40 6 000 –Long USD Imperva, Inc. Put 45.000 21/10/2016 35 875 –Long USD Intersil Corp. Call 21.000 21/10/2016 17 1 700 –Long USD Intersil Corp. Call 20.000 20/01/2017 23 4 428 –Long USD Lexmark International, Inc. Put 30.000 21/10/2016 23 115 –Long USD Lexmark International, Inc. Put 29.000 21/10/2016 25 125 –Long USD LinkedIn Corp. Call 200.000 19/01/2018 1 35 –Long USD Lions Gate Entertainment Corp. Call 23.000 21/10/2016 8 80 –Long USD Lions Gate Entertainment Corp. Call 22.000 16/12/2016 9 630 –Long USD Lions Gate Entertainment Corp. Call 23.000 16/12/2016 14 735 –Long USD Medivation, Inc. Put 55.000 30/09/2016 174 174 –Long USD Medivation, Inc. Put 55.000 21/10/2016 1 1 –Long USD Medivation, Inc. Put 50.000 21/10/2016 2 2 –Long USD Monsanto Co. Call 110.000 20/01/2017 24 2 232 –Long USD Northstar Realty Finance Corp. Put 11.000 16/12/2016 130 2 925 –Short USD S&P 500 Index Put 2 060.000 21/10/2016 (20) (8 000) 4 120 000Short USD S&P 500 Index Put 2 070.000 21/10/2016 (2) (1 000) 414 000
* The commitment on short call positions is unlimited.
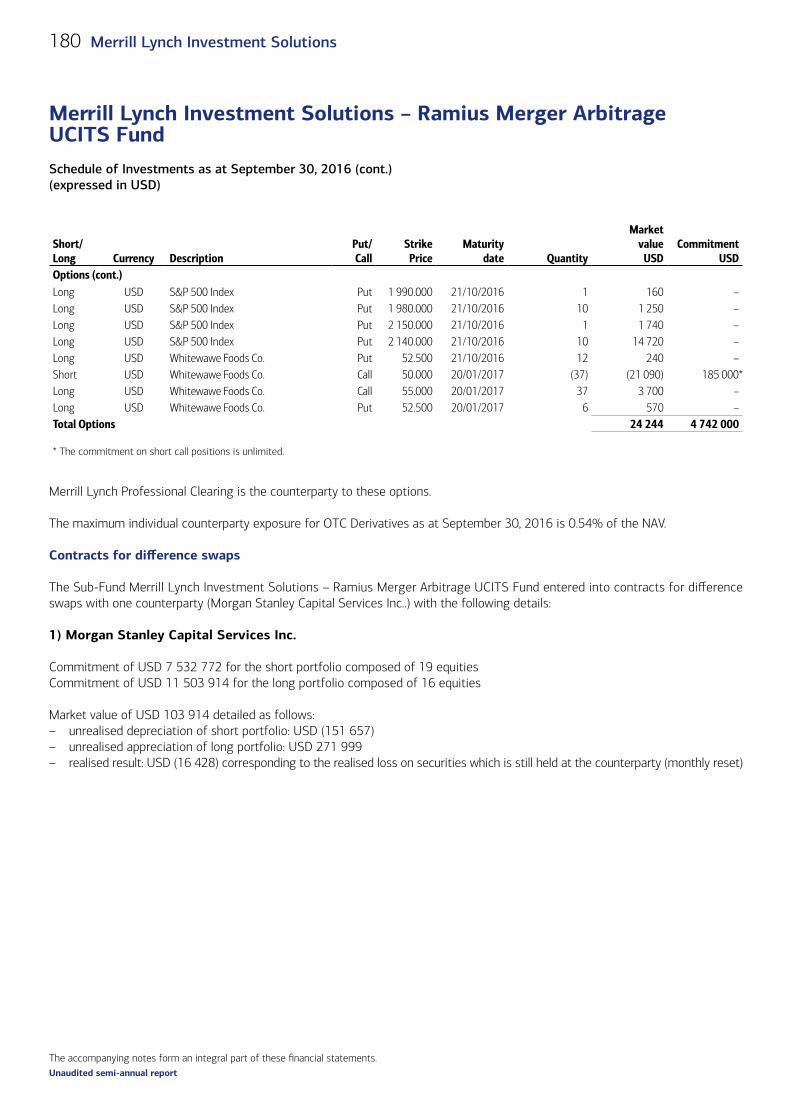
The accompanying notes form an integral part of these financial statements.
Schedule of Investments as at September 30, 2016 (cont.)(expressed in USD)
Merrill Lynch Investment Solutions – Ramius Merger Arbitrage UCITS Fund
180 Merrill Lynch Investment Solutions
Unaudited semi-annual report
Short/Long
Currency Description
Put/Call
Strike Price
Maturity date Quantity
Market value
USDCommitment
USDOptions (cont.)Long USD S&P 500 Index Put 1 990.000 21/10/2016 1 160 –Long USD S&P 500 Index Put 1 980.000 21/10/2016 10 1 250 –Long USD S&P 500 Index Put 2 150.000 21/10/2016 1 1 740 –Long USD S&P 500 Index Put 2 140.000 21/10/2016 10 14 720 –Long USD Whitewawe Foods Co. Put 52.500 21/10/2016 12 240 –Short USD Whitewawe Foods Co. Call 50.000 20/01/2017 (37) (21 090) 185 000*Long USD Whitewawe Foods Co. Call 55.000 20/01/2017 37 3 700 –Long USD Whitewawe Foods Co. Put 52.500 20/01/2017 6 570 –Total Options 24 244 4 742 000
* The commitment on short call positions is unlimited.
Merrill Lynch Professional Clearing is the counterparty to these options.
The maximum individual counterparty exposure for OTC Derivatives as at September 30, 2016 is 0.54% of the NAV.
Contracts for difference swaps
The Sub-Fund Merrill Lynch Investment Solutions – Ramius Merger Arbitrage UCITS Fund entered into contracts for difference swaps with one counterparty (Morgan Stanley Capital Services Inc..) with the following details:
1) Morgan Stanley Capital Services Inc.
Commitment of USD 7 532 772 for the short portfolio composed of 19 equitiesCommitment of USD 11 503 914 for the long portfolio composed of 16 equities
Market value of USD 103 914 detailed as follows:– unrealised depreciation of short portfolio: USD (151 657)– unrealised appreciation of long portfolio: USD 271 999– realised result: USD (16 428) corresponding to the realised loss on securities which is still held at the counterparty (monthly reset)
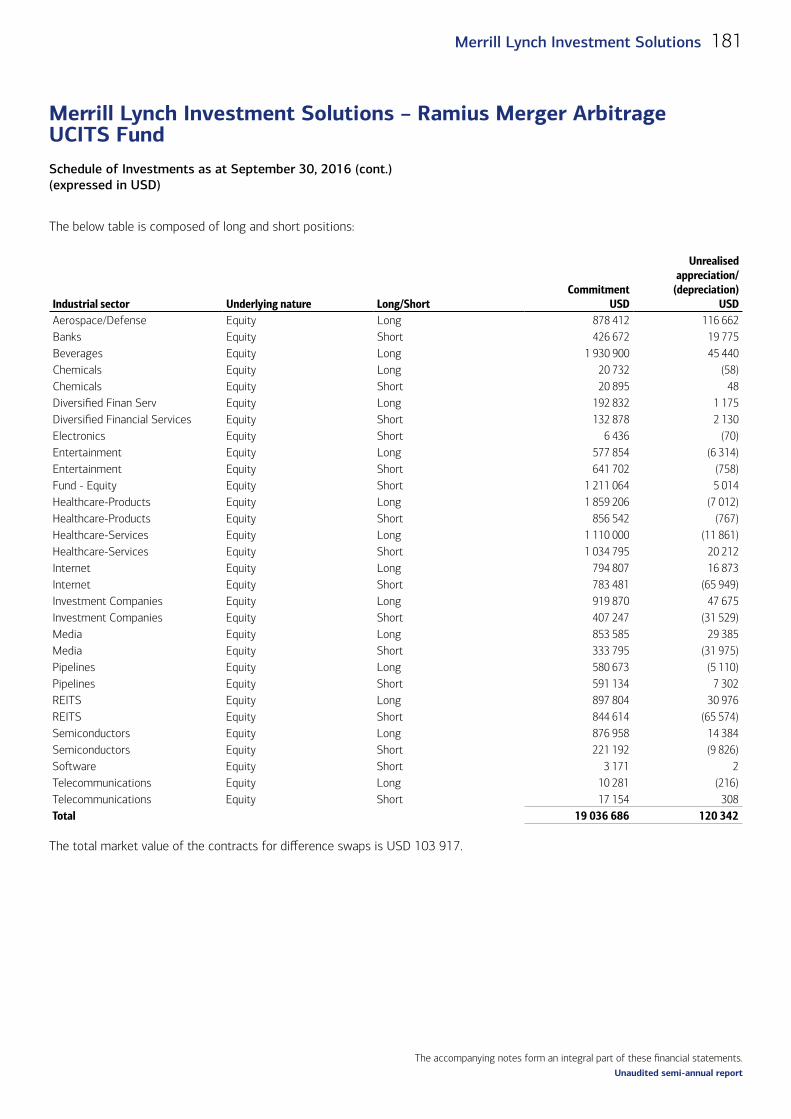
The accompanying notes form an integral part of these financial statements.
Schedule of Investments as at September 30, 2016 (cont.)(expressed in USD)
Merrill Lynch Investment Solutions – Ramius Merger Arbitrage UCITS Fund
181Merrill Lynch Investment Solutions
Unaudited semi-annual report
The below table is composed of long and short positions:
Industrial sector Underlying nature Long/ShortCommitment
USD
Unrealised appreciation/
(depreciation)USD
Aerospace/Defense Equity Long 878 412 116 662Banks Equity Short 426 672 19 775Beverages Equity Long 1 930 900 45 440Chemicals Equity Long 20 732 (58)Chemicals Equity Short 20 895 48Diversified Finan Serv Equity Long 192 832 1 175Diversified Financial Services Equity Short 132 878 2 130Electronics Equity Short 6 436 (70)Entertainment Equity Long 577 854 (6 314)Entertainment Equity Short 641 702 (758)Fund - Equity Equity Short 1 211 064 5 014Healthcare-Products Equity Long 1 859 206 (7 012)Healthcare-Products Equity Short 856 542 (767)Healthcare-Services Equity Long 1 110 000 (11 861)Healthcare-Services Equity Short 1 034 795 20 212Internet Equity Long 794 807 16 873Internet Equity Short 783 481 (65 949)Investment Companies Equity Long 919 870 47 675Investment Companies Equity Short 407 247 (31 529)Media Equity Long 853 585 29 385Media Equity Short 333 795 (31 975)Pipelines Equity Long 580 673 (5 110)Pipelines Equity Short 591 134 7 302REITS Equity Long 897 804 30 976REITS Equity Short 844 614 (65 574)Semiconductors Equity Long 876 958 14 384Semiconductors Equity Short 221 192 (9 826)Software Equity Short 3 171 2Telecommunications Equity Long 10 281 (216)Telecommunications Equity Short 17 154 308Total 19 036 686 120 342
The total market value of the contracts for difference swaps is USD 103 917.
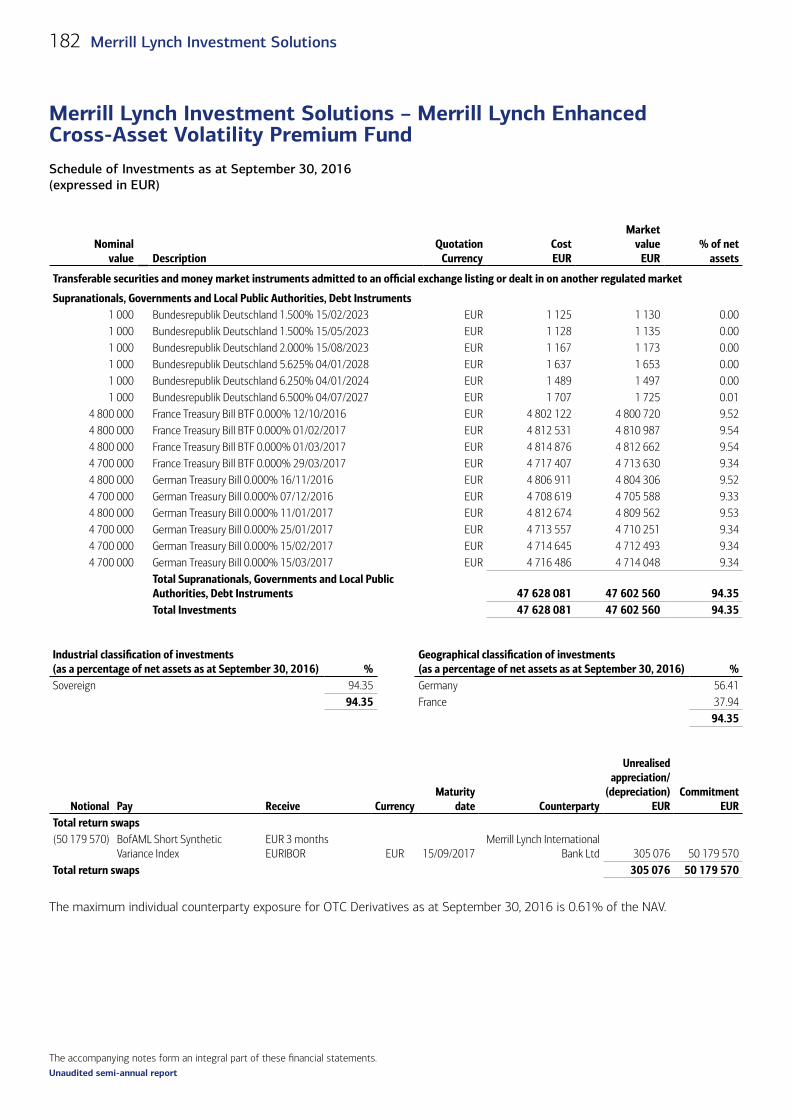
The accompanying notes form an integral part of these financial statements.
Schedule of Investments as at September 30, 2016 (expressed in EUR)
Merrill Lynch Investment Solutions – Merrill Lynch Enhanced Cross-Asset Volatility Premium Fund
182 Merrill Lynch Investment Solutions
Unaudited semi-annual report
Merrill Lynch Investment Solutions – Merrill Lynch Enhanced Cross-Asset Volatility Premium Fund
Schedule of Investments as at September 30, 2016 (expressed in EUR)
Nominal value Description
Quotation Currency
Cost EUR
Market value
EUR% of net
assets
Transferable securities and money market instruments admitted to an official exchange listing or dealt in on another regulated market
Supranationals, Governments and Local Public Authorities, Debt Instruments1 000 Bundesrepublik Deutschland 1.500% 15/02/2023 EUR 1 125 1 130 0.001 000 Bundesrepublik Deutschland 1.500% 15/05/2023 EUR 1 128 1 135 0.001 000 Bundesrepublik Deutschland 2.000% 15/08/2023 EUR 1 167 1 173 0.001 000 Bundesrepublik Deutschland 5.625% 04/01/2028 EUR 1 637 1 653 0.001 000 Bundesrepublik Deutschland 6.250% 04/01/2024 EUR 1 489 1 497 0.001 000 Bundesrepublik Deutschland 6.500% 04/07/2027 EUR 1 707 1 725 0.01
4 800 000 France Treasury Bill BTF 0.000% 12/10/2016 EUR 4 802 122 4 800 720 9.524 800 000 France Treasury Bill BTF 0.000% 01/02/2017 EUR 4 812 531 4 810 987 9.544 800 000 France Treasury Bill BTF 0.000% 01/03/2017 EUR 4 814 876 4 812 662 9.544 700 000 France Treasury Bill BTF 0.000% 29/03/2017 EUR 4 717 407 4 713 630 9.344 800 000 German Treasury Bill 0.000% 16/11/2016 EUR 4 806 911 4 804 306 9.524 700 000 German Treasury Bill 0.000% 07/12/2016 EUR 4 708 619 4 705 588 9.334 800 000 German Treasury Bill 0.000% 11/01/2017 EUR 4 812 674 4 809 562 9.534 700 000 German Treasury Bill 0.000% 25/01/2017 EUR 4 713 557 4 710 251 9.344 700 000 German Treasury Bill 0.000% 15/02/2017 EUR 4 714 645 4 712 493 9.344 700 000 German Treasury Bill 0.000% 15/03/2017 EUR 4 716 486 4 714 048 9.34
Total Supranationals, Governments and Local Public Authorities, Debt Instruments 47 628 081 47 602 560 94.35Total Investments 47 628 081 47 602 560 94.35
Industrial classification of investments(as a percentage of net assets as at September 30, 2016) %
Geographical classification of investments(as a percentage of net assets as at September 30, 2016) %
Sovereign 94.35 Germany 56.4194.35 France 37.94
94.35
Notional
Pay
Receive
Currency
Maturity date Counterparty
Unrealised appreciation/
(depreciation)EUR
Commitment EUR
Total return swaps(50 179 570) BofAML Short Synthetic
Variance IndexEUR 3 months EURIBOR EUR 15/09/2017
Merrill Lynch International Bank Ltd 305 076 50 179 570
Total return swaps 305 076 50 179 570
The maximum individual counterparty exposure for OTC Derivatives as at September 30, 2016 is 0.61% of the NAV.

Unaudited semi-annual report
183Merrill Lynch Investment Solutions 183Merrill Lynch Investment Solutions
Unaudited semi-annual report
Notes to the financial statements as at September 30, 2016 Note 1 – Activity
Merrill Lynch Investment Solutions (the “SICAV”) has been incorporated on November 5, 2007 under Luxembourg laws as a “Société d’Investissement à Capital Variable” (SICAV) for an unlimited period of time. The SICAV is governed by the provisions of Part I and it fulfils the provisions of Article 27 of the Luxembourg Law of December 17, 2010 relating to Undertakings for Collective Investment, as may be amended from time to time.
The Articles of Incorporation created on November 5, 2007 and amended on December 22, 2011 are deposited with the Register of Commerce and Companies of Luxembourg and have been published in the Mémorial C, “Recueil des Sociétés et Associations” (the “Mémorial”) on November 30, 2007 and February 21, 2012 respectively. The SICAV is registered with the Register of Commerce and Companies of Luxembourg under the number B 133.445.
As at September 30, 2016, twenty-one Sub-Funds are available to investors:
Sub-Funds Launch DateMerrill Lynch Investment Solutions – Marshall Wace TOPS UCITS Fund (Market Neutral) November 23, 2007Merrill Lynch Investment Solutions – York Event-Driven UCITS Fund July 29, 2009Merrill Lynch Investment Solutions – CCI Healthcare Long-Short UCITS Fund January 29, 2010Merrill Lynch Investment Solutions – Theorema European Equity Long-Short UCITS Fund June 16, 2010Merrill Lynch Investment Solutions – York Asian Event-Driven UCITS Fund November 3, 2010Merrill Lynch Investment Solutions – AQR Global Relative Value UCITS Fund December 1, 2010Merrill Lynch Investment Solutions – Och-Ziff European Multi-Strategy UCITS Fund February 22, 2011Merrill Lynch Investment Solutions – Beach Point Diversified Credit UCITS Fund March 25, 2013Merrill Lynch Investment Solutions – Merrill Lynch WNT Diversified Futures UCITS Fund October 23, 2013Merrill Lynch Investment Solutions – Merrill Lynch Enhanced Equity Volatility Premium Fund November 27, 2013Merrill Lynch Investment Solutions – Merrill Lynch MLCX Commodity Enhanced Beta Fund May 7, 2014Merrill Lynch Investment Solutions – Merrill Lynch MLCX Commodity Enhanced Beta ex Agriculture Fund June 5, 2014Merrill Lynch Investment Solutions – Fenician Equity Long Short UCITS Fund July 15, 2014Merrill Lynch Investment Solutions – Zeal Greater China Long Short UCITS Fund August 29, 2014Merrill Lynch Investment Solutions – Gotham U.S. Equity Long/Short UCITS Fund December 15, 2014Merrill Lynch Investment Solutions – Passport Capital Global Equity Long Short UCITS Fund July 20, 2015Merrill Lynch Investment Solutions – Willowbridge-Praxis Global Macro UCITS Fund September 22, 2015Merrill Lynch Investment Solutions – Merrill Lynch Credit Fund 2016 February 19, 2016Merrill Lynch Investment Solutions – Merrill Lynch MLCX Commodity Alpha Fund February 19, 2016Merrill Lynch Investment Solutions – Ramius Merger Arbitrage UCITS Fund July 8, 2016Merrill Lynch Investment Solutions – Merrill Lynch Enhanced Cross-Asset Volatility Premium Fund September 16, 2016
Merrill Lynch Investment Solutions – Graham Capital Systematic Macro UCITS Fund was liquidated on May 11, 2016. Merrill Lynch Investment Solutions – Merrill Lynch Dynamic Capital Protection UCITS Fund was liquidated on July 8, 2016. Merrill Lynch Investment Solutions – Ramius Merger Arbitrage UCITS Fund was launched on July 8, 2016. Merrill Lynch Investment Solutions – Merrill Lynch Enhanced Cross-Asset Volatility Premium Fund was launched on September 16, 2016.
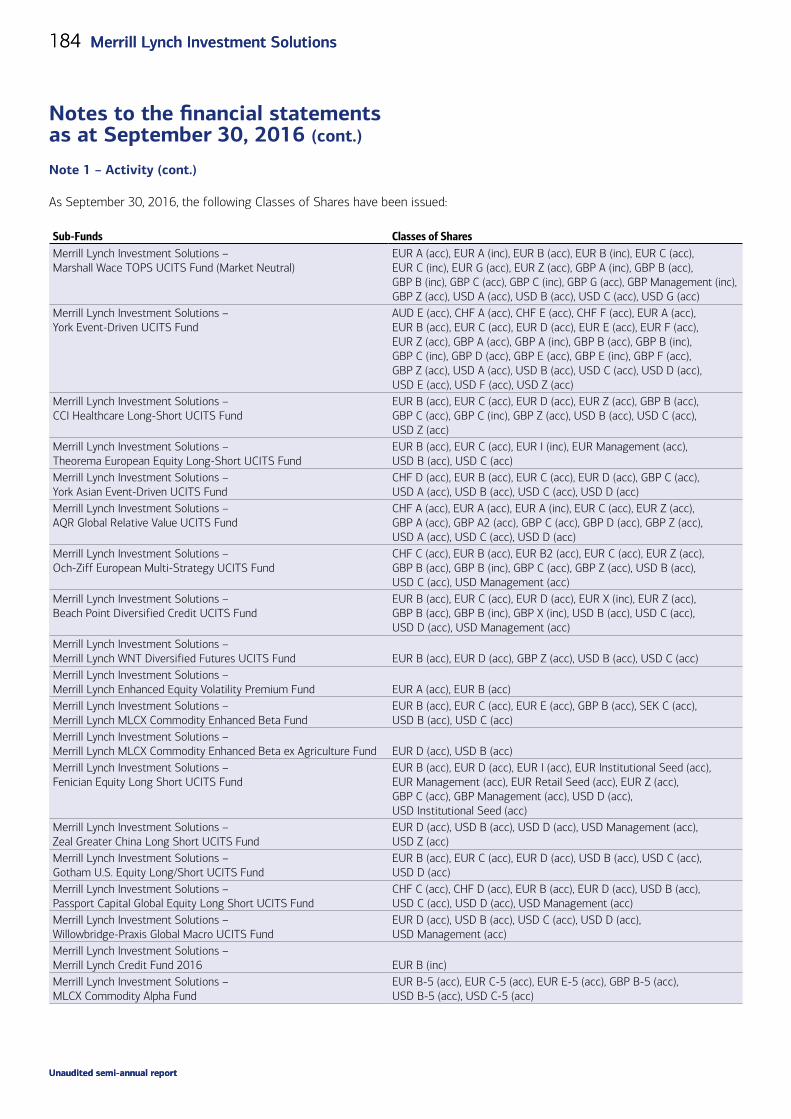
Unaudited semi-annual report
184 Merrill Lynch Investment Solutions
Notes to the financial statements as at September 30, 2016 (cont.)
184 Merrill Lynch Investment Solutions
Unaudited semi-annual report
As September 30, 2016, the following Classes of Shares have been issued:
Sub-Funds Classes of SharesMerrill Lynch Investment Solutions – Marshall Wace TOPS UCITS Fund (Market Neutral)
EUR A (acc), EUR A (inc), EUR B (acc), EUR B (inc), EUR C (acc), EUR C (inc), EUR G (acc), EUR Z (acc), GBP A (inc), GBP B (acc), GBP B (inc), GBP C (acc), GBP C (inc), GBP G (acc), GBP Management (inc), GBP Z (acc), USD A (acc), USD B (acc), USD C (acc), USD G (acc)
Merrill Lynch Investment Solutions – York Event-Driven UCITS Fund
AUD E (acc), CHF A (acc), CHF E (acc), CHF F (acc), EUR A (acc), EUR B (acc), EUR C (acc), EUR D (acc), EUR E (acc), EUR F (acc), EUR Z (acc), GBP A (acc), GBP A (inc), GBP B (acc), GBP B (inc), GBP C (inc), GBP D (acc), GBP E (acc), GBP E (inc), GBP F (acc), GBP Z (acc), USD A (acc), USD B (acc), USD C (acc), USD D (acc), USD E (acc), USD F (acc), USD Z (acc)
Merrill Lynch Investment Solutions – CCI Healthcare Long-Short UCITS Fund
EUR B (acc), EUR C (acc), EUR D (acc), EUR Z (acc), GBP B (acc), GBP C (acc), GBP C (inc), GBP Z (acc), USD B (acc), USD C (acc), USD Z (acc)
Merrill Lynch Investment Solutions – Theorema European Equity Long-Short UCITS Fund
EUR B (acc), EUR C (acc), EUR I (inc), EUR Management (acc), USD B (acc), USD C (acc)
Merrill Lynch Investment Solutions – York Asian Event-Driven UCITS Fund
CHF D (acc), EUR B (acc), EUR C (acc), EUR D (acc), GBP C (acc), USD A (acc), USD B (acc), USD C (acc), USD D (acc)
Merrill Lynch Investment Solutions – AQR Global Relative Value UCITS Fund
CHF A (acc), EUR A (acc), EUR A (inc), EUR C (acc), EUR Z (acc), GBP A (acc), GBP A2 (acc), GBP C (acc), GBP D (acc), GBP Z (acc), USD A (acc), USD C (acc), USD D (acc)
Merrill Lynch Investment Solutions – Och-Ziff European Multi-Strategy UCITS Fund
CHF C (acc), EUR B (acc), EUR B2 (acc), EUR C (acc), EUR Z (acc), GBP B (acc), GBP B (inc), GBP C (acc), GBP Z (acc), USD B (acc), USD C (acc), USD Management (acc)
Merrill Lynch Investment Solutions – Beach Point Diversified Credit UCITS Fund
EUR B (acc), EUR C (acc), EUR D (acc), EUR X (inc), EUR Z (acc), GBP B (acc), GBP B (inc), GBP X (inc), USD B (acc), USD C (acc), USD D (acc), USD Management (acc)
Merrill Lynch Investment Solutions – Merrill Lynch WNT Diversified Futures UCITS Fund EUR B (acc), EUR D (acc), GBP Z (acc), USD B (acc), USD C (acc)Merrill Lynch Investment Solutions – Merrill Lynch Enhanced Equity Volatility Premium Fund EUR A (acc), EUR B (acc)Merrill Lynch Investment Solutions – Merrill Lynch MLCX Commodity Enhanced Beta Fund
EUR B (acc), EUR C (acc), EUR E (acc), GBP B (acc), SEK C (acc), USD B (acc), USD C (acc)
Merrill Lynch Investment Solutions – Merrill Lynch MLCX Commodity Enhanced Beta ex Agriculture Fund EUR D (acc), USD B (acc)Merrill Lynch Investment Solutions – Fenician Equity Long Short UCITS Fund
EUR B (acc), EUR D (acc), EUR I (acc), EUR Institutional Seed (acc), EUR Management (acc), EUR Retail Seed (acc), EUR Z (acc), GBP C (acc), GBP Management (acc), USD D (acc), USD Institutional Seed (acc)
Merrill Lynch Investment Solutions – Zeal Greater China Long Short UCITS Fund
EUR D (acc), USD B (acc), USD D (acc), USD Management (acc), USD Z (acc)
Merrill Lynch Investment Solutions – Gotham U.S. Equity Long/Short UCITS Fund
EUR B (acc), EUR C (acc), EUR D (acc), USD B (acc), USD C (acc), USD D (acc)
Merrill Lynch Investment Solutions – Passport Capital Global Equity Long Short UCITS Fund
CHF C (acc), CHF D (acc), EUR B (acc), EUR D (acc), USD B (acc), USD C (acc), USD D (acc), USD Management (acc)
Merrill Lynch Investment Solutions – Willowbridge-Praxis Global Macro UCITS Fund
EUR D (acc), USD B (acc), USD C (acc), USD D (acc), USD Management (acc)
Merrill Lynch Investment Solutions – Merrill Lynch Credit Fund 2016 EUR B (inc)Merrill Lynch Investment Solutions – MLCX Commodity Alpha Fund
EUR B-5 (acc), EUR C-5 (acc), EUR E-5 (acc), GBP B-5 (acc), USD B-5 (acc), USD C-5 (acc)
Note 1 – Activity (cont.)

Unaudited semi-annual report
185Merrill Lynch Investment Solutions
Notes to the financial statements as at September 30, 2016 (cont.)
185Merrill Lynch Investment Solutions
Unaudited semi-annual report
Sub-Funds Classes of SharesMerrill Lynch Investment Solutions – Ramius Merger Arbitrage UCITS Fund USD B (acc), USD C (acc), USD D (acc), USD Management (acc)Merrill Lynch Investment Solutions – Merrill Lynch Enhanced Cross-Asset Volatility Premium Fund EUR A (acc)
The accounting year of the SICAV ends on March 31 every year.
Note 2 – Principal accounting policies
2.1 Presentation of financial statementsThe financial statements are prepared in accordance with Luxembourg regulations relating to Undertakings for Collective Investment.
2.2 Valuation of investment in securities2.2.1 Securities or money market instruments quoted or traded on an official stock exchange or any other regulated market, are valued on the basis of the last known price, and if the securities or money market instruments are listed on several stock exchanges or regulated markets, the last known price of the stock exchange which is the principal market for security or money market in question, unless these prices are not representative.
2.2.2 For securities or money market instruments not quoted or traded on an official stock exchange or any other regulated market, and for quoted securities or money market instruments, but for which the last known price is not representative, valuation is based on the probable sales price estimated prudently and in good faith by the Board of Directors of the SICAV.
2.2.3 Liquid assets and money market instruments with a maturity of less than 12 months may be valued at nominal value plus any accrued interest or using an amortised cost method.
2.2.4 Investments in other open-ended UCIs are valued on the basis of the respective last available net asset value of such UCIs at each Valuation Day.
2.2.5 Units or shares of a closed-ended UCI are valued in accordance with the valuation rules set out in items 2.2.1 and 2.2.2.
2.2.6 Any of the above mentioned assets for which the valuation in accordance with the above paragraphs is not possible, practicable or representative of their fair value are valued at fair market value, as determined in good faith by the Board of Directors of the SICAV.
2.3 Valuation of swaps2.3.1 Credit default swapA credit default swap is a credit derivative transaction in which two parties enter into an agreement, whereby one party (the protection buyer) pays the other (the protection seller) a fixed periodic coupon for the specified life of the agreement in return for a payment contingent on a credit event related to the underlying reference obligation.
If a credit event occurs, the protection seller would be obligated to make a payment, which may be either: (i) a net cash settlement equal to the notional amount of the swap less the auction value of the reference obligation or (ii) the notional amount of the swap in exchange for the delivery of the reference obligation. Selling protection effectively adds leverage to a sub-fund’s portfolio up to the notional amount of swap agreements.
The notional amount represents the maximum potential liability under a contract and is not reflected in the statement of net assets. Potential liabilities under these contracts may be reduced by: the auction rates of the underlying reference obligations; upfront payments received at the inception of a swap; and net amounts received from credit default swaps purchased with the identical reference obligation.
Note 1 – Activity (cont.)
Unaudited semi-annual report
186 Merrill Lynch Investment Solutions
Notes to the financial statements as at September 30, 2016 (cont.)
186 Merrill Lynch Investment Solutions
Unaudited semi-annual report
Credit default swaps are marked to market at each NAV calculation date. The market value is based on the valuation elements laid down in the contracts, and is obtained from third party pricing agents, market makers or internal models.
The unrealised appreciation/(depreciation) is disclosed in the statement of net assets under “Unrealised appreciation/(depreciation) on swap contracts”. Realised gains/(losses) and change in unrealised appreciation/depreciation resulting there from are included in the statement of operations and changes in net assets respectively under the heading “Net realised gains/(losses) on swap contracts” and “Change in net unrealized appreciation/depreciation on swap contracts”.
2.3.2 Total return swapA total return swap is a bilateral agreement in which each party agrees to exchange payments based on the performance of an underlying instrument represented by a security, commodity, basket or index thereof for a fixed or variable rate. One party pays out the total return of a specific reference asset, and in return, receives a regular stream of payments. The total performance will include gains and losses on the underlying, as well as any interest or dividends during the contract period according to the type of underlying. The cash flows to be exchanged are calculated by reference to an agreed upon notional amount or quantity. To the extent the total return of the reference asset underlying the transaction exceeds or falls short of the offsetting payment, the Fund will receive a payment from or make a payment to the counterparty.
Total return swaps are marked to market at each NAV calculation date. The estimated market value is based on the valuation elements laid down in the contracts, and is obtained from third party pricing agents, market makers or internal models.
The unrealised appreciation/(depreciation) is disclosed in the statement of net assets under “Unrealised appreciation/(depreciation) on swap contracts”. Realised gains/(losses) and changes in unrealised appreciation/depreciation as a result thereof are included in the statement of operations and changes in net assets respectively under “Net realised gain/(loss) on swap contracts” and “Net change in unrealised appreciation/depreciation on swaps contracts.”
2.3.3 Gap risk swapGap risk swaps are valued based on the objective to limit the maximum cumulative loss over a predetermined period (a Floor NAV). In case the NAV of the Sub-Fund goes beyond the Floor NAV (a Gap Event), the counterparty of the swap will pay the Sub-Fund a value which will bring the NAV per share to the Floor NAV.
The unrealised appreciation/(depreciation) is disclosed in the statement of net assets under “Unrealised appreciation/(depreciation) on swap contracts”. Realised gains/(losses) and changes in unrealised appreciation/depreciation as a result thereof are included in the statement of operations and changes in net assets respectively under “Net realised gain/(loss) on swap contracts” and “Net change in unrealised appreciation/depreciation on swaps contracts.”
2.4 Valuation of contracts for difference swapsContracts for differences are contracts entered into between a broker and the sub-fund under which the parties agree to make payments to each other so as to replicate the economic consequences of holding a long or short position in the underlying security. Contracts for differences also mirror any corporate actions that take place.
Contracts for differences are valued based on the closing market price of the underlying security, less any financing charges attributable to each contract. Upon entering into contracts for differences, the sub- fund may be required to pledge to the broker an amount of cash and/or other assets equal to a certain percentage of the contract amount (“initial margin”). Subsequently, payments known as “variation margin” are made or received by the sub-fund periodically, depending on fluctuations in the value of the underlying security.
The unrealised appreciation/(depreciation) is disclosed in the statement of net assets under “Unrealised appreciation/(depreciation) on contracts for differences”. Realised gains/(losses) and changes in unrealised appreciation/depreciation as a result thereof are included in the statement of operations and changes in net assets respectively under “Net realised gain/(loss) on contracts for differences” and “Net change in unrealized appreciation/depreciation on contracts for differences”.
Note 2 – Principal accounting policies (cont.)
2.3 Valuation of swaps (cont.)2.3.1 Credit default swap (cont.)

Unaudited semi-annual report
187Merrill Lynch Investment Solutions
Notes to the financial statements as at September 30, 2016 (cont.)
187Merrill Lynch Investment Solutions
Unaudited semi-annual report
2.5 Valuation of futures contractsFutures contracts provide for the delayed delivery of the underlying instrument at a fixed price or for a cash amount based on the change in the value of the underlying instrument at a specific date in the future. Upon entering into a futures contract, the sub-fund is required to deposit with the broker, cash or securities in an amount equal to a certain percentage of the contract amount which is referred to as the initial margin account. Subsequent payments, referred to as variation margin, are made or received by the sub-fund periodically and are based on changes in the market Value of open futures contracts.
The unrealised appreciation/(depreciation) on future contracts is disclosed in the statement of net assets under “Unrealised appreciation/(depreciation) on futures contracts”. Changes in the market value of open futures contracts are recorded as unrealised appreciation/depreciation in the statement of operations and changes in net assets under “Change in net unrealised appreciation/depreciation on futures contracts”.
Realised gains or losses, representing the difference between the value of the contract at the time it was opened and the value at the time it was closed, are reported at the closing or expiration of futures contracts in the statement of operations and changes in net assets under “Net realized gains/ (losses) on futures contracts”. Securities deposited as initial margin are designated in the statement of investments and cash deposited is recorded in the statement of net assets. A receivable and/ or a payable to brokers for the daily variation margin is also recorded in the statement of net assets.
2.6 Valuation of options contractsA purchaser of a put option has the right, but not the obligation, to sell the underlying instrument at an agreed upon price (“strike price”) to the option seller. A purchaser of a call option has the right, but not the obligation, to purchase the underlying instrument at the strike price from the option seller. Purchased Options – Premiums paid by the sub–fund for purchased options are included in the statement of net assets as an investment. The option is adjusted daily to reflect the current market value of the option and the change is recorded as unrealised appreciation or depreciation. If the option is allowed to expire, the Fund will lose the entire premium it paid and record a realised loss for the premium amount. Premiums paid for purchased options which are exercised or closed are added to the amounts paid or offset against the proceeds on the underlying investment transaction to determine the realised gain/loss or cost basis of the security.
Written Options – Premiums received by the sub-fund for written options are included in the statement of net assets. The amount of the liability is adjusted daily to reflect the current market value of the written option and the change in market value is recorded as unrealised appreciation or depreciation. Premiums received from written options that expire are treated as realised gains. The sub-fund records a realised gain or loss on written options based on whether the cost of the closing transaction exceeds the premium received. If a call option is exercised by the option buyer, the premium received by the sub-fund is added to the proceeds from the sale of the underlying security to the option buyer and compared to the cost of the closing transaction to determine whether there has been a realised gain or loss. If a put option is exercised by an option buyer, the premium received by the option seller reduces the cost basis of the purchased security.
Written uncovered call options subject the sub-fund to unlimited risk of loss. Written covered call options limit the upside potential of a security above the strike price. Written put options subject the Fund to risk of loss if the value of the security declines below the exercise price minus the put premium. The sub-fund is not subject to credit risk on written options as the counterparty has already performed its obligation by paying the premium at the inception of the contract.
Outstanding options traded on a regulated market are valued based on the closing price or the last available market price of the instruments. OTC options are marked to market based upon prices obtained from third party pricing agents and verified against the value from the counterparty. The market value of options is included in the statement of net assets under the heading “Options bought/ (written) at market value”.
The realised gains/(losses) and change in unrealised appreciation/depreciation on options are disclosed in the statement of operations and changes in net assets respectively under the headings “Net realised gains/(losses) on options” and “Change in net unrealised appreciation/depreciation on options.”
Note 2 – Principal accounting policies (cont.)

Unaudited semi-annual report
188 Merrill Lynch Investment Solutions
Notes to the financial statements as at September 30, 2016 (cont.)
188 Merrill Lynch Investment Solutions
Unaudited semi-annual report
2.7 Valuation of forward foreign exchange contractsForward foreign exchange contracts represent obligations to purchase or sell foreign currency on a specified future date at a price fixed at the time the contracts are entered into. Non-deliverable forward foreign exchange contracts are settled with the counterparty in cash without the delivery of foreign currency. The values of the forward foreign exchange contracts are adjusted daily based on the applicable exchange rate of the underlying currency. Changes in the value of these contracts are recorded as unrealised appreciation or depreciation until the contract settlement date. When the forward contract is closed, the sub-fund records a realised gain or loss equal to the difference between the value at the time the contract was opened and the value at the time it was closed.
The unrealised appreciation/(depreciation) on forward foreign exchange contracts is disclosed in the statement of net assets under “Unrealised appreciation/(depreciation) on forward foreign exchange contracts”. Realised gains/(losses) and change in unrealised appreciation/depreciation resulting there from are included in the statement of operations and changes in net assets respectively under “Net realised gains/(losses) on forward foreign exchange contracts” and “Change in net unrealised appreciation/depreciation on forward foreign exchange contracts”.
2.8 Net realised gains or losses resulting from investmentsThe realised gains or losses resulting from the sales of investments are calculated on an average cost basis.
2.9 Foreign exchange translationThe accounts of each Sub-Fund are maintained in the reference currency of the Sub-Fund and the financial statements are expressed in EUR currency.
The acquisition cost of securities expressed in a currency other than the reference currency is translated into the reference currency at the exchange rates prevailing on the date of purchase.
Income and expenses expressed in other currencies than the reference currency are converted at exchange rates ruling at the transaction date.
Assets and liabilities expressed in other currencies than the reference currency are converted at exchange rates ruling at the year-end. The realised gains and losses or unrealised appreciation and depreciations on foreign exchange translation are recognized in the Statement of Operations and Changes in Net Assets in determining the increase or decrease in net assets.
The following exchange rates (against EUR) as at 5 p.m. Central European Time have been used to convert the investments and other assets and liabilities denominated in currencies other than EUR for all Sub-Funds denominated in EUR:
Currency September 30, 2016AUD 1.468539CAD 1.476954CHF 1.089412CZK 27.021997DKK 7.446243GBP 0.865127HKD 8.716137HUF 309.065021IDR 14666.714615JPY 113.801613KRW 1237.697199MXN 21.749465MYR 4.647475NOK 8.981747NZD 1.545380
Note 2 – Principal accounting policies (cont.)

Unaudited semi-annual report
189Merrill Lynch Investment Solutions
Notes to the financial statements as at September 30, 2016 (cont.)
189Merrill Lynch Investment Solutions
Unaudited semi-annual report
Note 2 – Principal accounting policies (cont.)
Currency September 30, 2016PHP 54.498684PLN 4.301176SEK 9.628045SGD 1.532245THB 38.939672TRY 3.372187TWD 35.226075USD 1.123800ZAR 15.453656
The following exchange rates (against USD) as at 5 p.m. Central European Time have been used to convert the investments and other assets and liabilities denominated in currencies other than USD for all Sub-Funds denominated in USD except for the Merrill Lynch Investment Solutions – Graham Capital Systematic Macro UCITS Fund:
Currency September 30, 2016AUD 1.30676BRL 3.24885CAD 1.31425CHF 0.96940CLP 658.91000CNH 6.67345CNY 6.67000COP 2880.00000CZK 24.04520DKK 6.62595EUR 0.88984GBP 0.76982HKD 7.75595HUF 275.01780IDR 13051.00000ILS 3.75210INR 66.58000JPY 101.26500KRW 1101.35000MXN 19.35350MYR 4.13550NOK 7.99230NZD 1.37514PHP 48.49500PLN 3.82735RUB 63.02125SAR 3.75175SEK 8.56740SGD 1.36345THB 34.65000TRY 3.00070TWD 31.34550ZAR 13.75125
2.9 Foreign exchange translation (cont.)

Unaudited semi-annual report
190 Merrill Lynch Investment Solutions
Notes to the financial statements as at September 30, 2016 (cont.)
190 Merrill Lynch Investment Solutions
Unaudited semi-annual report
Note 2 – Principal accounting policies (cont.)
The following exchange rates (against USD) as at 9 p.m. Central European Time have been used to convert the investments and other assets and liabilities denominated in currencies other than USD for the Merrill Lynch Investment Solutions – Graham Capital Systematic Macro UCITS Fund:
Currency September 30, 2016AUD 1.304972CAD 1.311600CHF 0.970550EUR 0.889798GBP 0.770505HKD 7.756000JPY 101.405000MXN 19.387300NOK 7.998200NZD 1.372307SEK 8.575200
The following exchange rate (against EUR) has been used to calculate the combined total in the Statement of Net Assets and in the Statement of Operations and Changes in Net Assets for all Sub-Funds denominated in USD except for the Merrill Lynch Investment Solutions – Graham Capital Systematic Macro UCITS Fund:
Currency September 30, 2016USD 1.123800062
The following exchange rate (against EUR) has been used to calculate the combined total in the Statement of Net Assets and in the Statement of Operations and Changes in Net Assets for the Merrill Lynch Investment Solutions – Graham Capital Systematic Macro UCITS Fund:
Currency September 30, 2016USD 1.123850582
2.10 IncomeDividend income and dividend expense are recorded on the ex-dividend date and interest income and interest expense are accrued over the life of the investment. Interest income includes accretion of market discount, original issue discounts and amortisation of premiums and is recorded into income over the life of the underlying investment. Interest income and dividend income are recognised on a gross basis before withholding tax, if any. Interest income is accrued on a daily basis.
2.11 Formation expensesFormation expenses and those of the launch of new Sub-Funds are born by CM Investment Solutions Limited.
2.9 Foreign exchange translation (cont.)

Unaudited semi-annual report
191Merrill Lynch Investment Solutions
Notes to the financial statements as at September 30, 2016 (cont.)
191Merrill Lynch Investment Solutions
Unaudited semi-annual report
The investment management fees which are payable to the Investment Manager in connection with the services to be provided by them, and distribution fees which are payable to the Investment Manager or CM Investment Solutions Limited pursuant to the relevant agreements between each of them, are payable monthly in arrears and calculated on each banking day (as defined in the Prospectus) on the net assets of each Share Class and at the combined annual rates mentioned below.
The performance fees which are payable to the Investment Manager, are payable annually or on crystallisation, and are calculated on each banking day (as defined in the Prospectus) at the combined annual rates mentioned below.
Sub-Funds
Class
Combined investment
management and distribution fee
Performance fee
Merrill Lynch Investment Solutions – Marshall Wace TOPS UCITS Fund (Market Neutral)
Class A 1.75% 25%Class B 1.50% 20%Class C 2.25% 20%Class G 1.50% 20%
Management Class 0.60% 10%Class Z 1.50% 20%
Merrill Lynch Investment Solutions – York Event-Driven UCITS Fund
Class A 1.25%1 25%Class B 1.25%1 15%Class C 2.25%2 15%Class D 1.00% 10%Class E 1.25%1 20%Class F 2.25%2 20%Class Z 1.25%1 20%
Merrill Lynch Investment Solutions – CCI Healthcare Long-Short UCITS Fund
Class B 1.50% 20%Class C 2.25% 20%Class D 1.50% 15%Class Z 1.50% 20%
Merrill Lynch Investment Solutions – Theorema European Equity Long-Short UCITS Fund
Class B 2.00% 20%Class C 2.75% 20%Class I 1.75% 20%
Management Class 2.00% 0%Merrill Lynch Investment Solutions – York Asian Event-Driven UCITS Fund
Class A 1.50% 25%Class B 1.50% 20%Class C 2.25% 20%Class D 1.25% 10%
Merrill Lynch Investment Solutions – Graham Capital Systematic Macro UCITS Fund3
Class B 1.35% 20%Class C 2.10% 20%
Merrill Lynch Investment Solutions – AQR Global Relative Value UCITS Fund
Class A 1.00% 10%Class A2 1.00% 15%Class C 2.00% 10%
Class D 1.00% 10%Class Z 1.00% 10%
Merrill Lynch Investment Solutions – Och-Ziff European Multi-Strategy UCITS Fund
Class B 2.00% 20%Class B2 2.00%4 20%
Class C 2.75% 20%Management Class 0.00% 0%
Class Z 2.00% 20%1 The rate of combined Investment management and distribution fee changed from 1.50% to 1.25% in the Prospectus of August 2016.2 The rate of combined Investment management and distribution fee changed from 2.50% to 2.25% in the Prospectus of August 2016.3 Liquidated on May 11, 20164 The rate of combined Investment management and distribution fee changed from 2.75% to 2.00% in the Prospectus of August 2016.
Note 3 – Investment management, distribution and performance fees

Unaudited semi-annual report
192 Merrill Lynch Investment Solutions
Notes to the financial statements as at September 30, 2016 (cont.)
192 Merrill Lynch Investment Solutions
Unaudited semi-annual report
Sub-Funds
Class
Combined investment
management and distribution fee
Performance fee
Merrill Lynch Investment Solutions – Beach Point Diversified Credit UCITS Fund
Class B 1.50% 20%Class C 2.25% 20%Class D 1.00% 10%
Management Class 0.00% 0%Class X 1.50% 20%Class Z 1.50% 20%
Merrill Lynch Investment Solutions – Merrill Lynch WNT Diversified Futures UCITS Fund
Class B 1.35% 20%Class C 2.10% 20%Class D 1.30% 20%Class Z 1.35% 20%
Merrill Lynch Investment Solutions – Merrill Lynch Dynamic Capital Protection UCITS Fund5 Class B 0.80% 0%Merrill Lynch Investment Solutions – Merrill Lynch Enhanced Equity Volatility Premium Fund
Class A 0.40% 0%Class B 0.90% 0%
Merrill Lynch Investment Solutions – Merrill Lynch MLCX Commodity Enhanced Beta Fund
Class B 0.75% 0%Class C 1.75% 0%Class E 0.60% 0%
Merrill Lynch Investment Solutions – Merrill Lynch MLCX Commodity Enhanced Beta ex Agriculture Fund
Class B 0.75% 0%
Class D 0.60% 0%Merrill Lynch Investment Solutions – Fenician Equity Long Short UCITS Fund
Class B 1.50% 20%Class C 2.25% 20%Class D 1.00% 15%Class I 1.50% 20%
Class Institutional Seed 1.00% 10%Management Class 0.00% 0%
Class Retail Seed 1.00% 10%Class Z 1.50% 20%
Merrill Lynch Investment Solutions – Zeal Greater China Long Short UCITS Fund
Class B 1.75% 15%Class D 1.25% 15%
Management Class 0.00% 0%Class Z 1.75% 15%
Merrill Lynch Investment Solutions – Gotham U.S. Equity Long/Short UCITS Fund
Class B 1.50% 15%Class C 2.25% 15%Class D 1.25% 15%Class X 1.50% 15%
Merrill Lynch Investment Solutions – Passport Capital Global Equity Long Short UCITS Fund
Class B 1.25% 15%Class C 2.00% 15%Class D 0.95% 10%
Management Class 0.00% 0%Merrill Lynch Investment Solutions – Willowbridge-Praxis Global Macro UCITS Fund
Class B 1.25% 15%Class C 2.00% 15%Class D 1.00% 10%
Management Class 0.00% 0%Merrill Lynch Investment Solutions – Merrill Lynch Credit Fund 2016 Class B 0.05% 0%5 Liquidated on July 8, 2016
Note 3 – Investment management, distribution and performance fees (cont.)
Unaudited semi-annual report
193Merrill Lynch Investment Solutions
Notes to the financial statements as at September 30, 2016 (cont.)
193Merrill Lynch Investment Solutions
Unaudited semi-annual report
Sub-Funds
Class
Combined investment
management and distribution fee
Performance fee
Merrill Lynch Investment Solutions – Merrill Lynch MLCX Commodity Alpha Fund
Class B-5 0.85% 0%Class C-5 1.85% 0%Class E-5 0.60% 0%
Merrill Lynch Investment Solutions – Ramius Merger Arbitrage UCITS Fund6
Class B 1.25% 20%Class C 2.00% 20%Class D 1.00% 10%
Management Class 0.00% 0%Merrill Lynch Investment Solutions – Merrill Lynch Enhanced Cross-Asset Volatility Premium Fund7 Class A 0.50% 0%6 Launched on July 8, 20167 Launched on September 16, 2016
Note 4 – Operating and administrative fees
In respect of each Sub-Fund, the SICAV shall pay to CM Investment Solutions Limited an operating and administrative fee equal to a certain percentage of the Net Asset Value of the relevant Share Class calculated in the same manner as for the calculation of the investment management fee. The operating and administrative fee shall be calculated and accrued as an expense of the relevant Share Class and shall be payable monthly in arrears.
Note 5 – Custodian, Administrator, Registrar Agent fees
Each of the Custodian, the Administrator and the Registrar Agent are entitled to receive from CM Investment Solutions Limited fees pursuant to the relevant agreements between each of them and the SICAV in accordance with usual market practice. In addition, reasonable disbursements and out-of-pocket expenses incurred by such parties are charged to CM Investment Solutions Limited as appropriate.
Note 6 – Taxation
The SICAV’s assets are subject to tax (“Taxe d’abonnement”) in the Grand Duchy of Luxembourg of 0.05% of the net assets p.a. (except Sub-Funds or Classes of Shares reserved to Institutional Investors that can benefit from the reduced tax rate of 0.01% of the net assets p.a. as stipulated in the Prospectus) payable quarterly. The SICAV’s income is not taxable in Luxembourg. No tax will be deducted at source from any dividends paid by the SICAV. Income received from the SICAV may be subject to withholding taxes in the country of origin of the issuer of the security, in respect of which such income is paid.
No duty or tax is payable in Luxembourg in connection with the issue of Shares of the SICAV, except for one lump sum capital levy of EUR 75 which is payable at incorporation.
Investment income from dividends and interest received by the SICAV may be subject to withholding taxes at varying rates. Such withholding taxes are usually not recoverable.
Note 3 – Investment management, distribution and performance fees (cont.)

Unaudited semi-annual report
194 Merrill Lynch Investment Solutions
Notes to the financial statements as at September 30, 2016 (cont.)
194 Merrill Lynch Investment Solutions
Unaudited semi-annual report
Note 7 – Cash collateral information
The table below provides the cash collateral balances due from / due to the brokers in relations to the Swaps, Forward foreign exchange contracts, OTC Options contracts and Contracts for difference swaps held as at September 30, 2016. The cash collateral balances are included in the Statement of Net Assets respectively under “Due from Broker” and “Due to Broker”.
Sub-Funds
Due from / (due to) brokers Counterparty Currency
Cash collateral balances
Merrill Lynch Investment Solutions – Marshall Wace TOPS UCITS Fund (Market Neutral)
Due from BNP Paribas USD 401 738 502Due from Deutsche Bank AG USD 11 750 000Due from Goldman Sachs
International USD 40 000 000Due to JPMorgan Chase
Bank NA USD (17 000 000)Due from Merrill Lynch International
Bank Ltd USD (1)Due from Morgan Stanley Capital
Services Inc. USD 1 238 520Due from Morgan Stanley
International Plc. USD 48 114 588Due to State Street Bank and
Trust Co. USD (10 000 000)Merrill Lynch Investment Solutions – York Event-Driven UCITS Fund
Due from Bank of America EUR 980 633Due from Citibank NA EUR 66Due from Credit Suisse Securities
(Europe) Limited EUR 89 581Due from Goldman Sachs
International EUR 231 358Due from JPMorgan Chase Bank NA EUR 250 000Due from Merrill Lynch International
Bank Ltd EUR 85 620Due from Merrill Lynch Professional
Clearing Corp. EUR 1 683 412Due from Morgan Stanley Capital
Services Inc. EUR 10 500 035Due to Morgan Stanley Capital
Services Inc. EUR (150)Due from State Street Bank and
Trust Co. EUR 104 504Due from UBS AG EUR 1 901 414

Unaudited semi-annual report
195Merrill Lynch Investment Solutions
Notes to the financial statements as at September 30, 2016 (cont.)
195Merrill Lynch Investment Solutions
Unaudited semi-annual report
Sub-Funds
Due from / (due to) brokers Counterparty Currency
Cash collateral balances
Merrill Lynch Investment Solutions – CCI Healthcare Long-Short UCITS Fund
Due from Credit Suisse Securities (Europe) Limited USD 2 142 724
Due from Goldman Sachs International USD 7 811 376
Due from JPMorgan Chase Bank NA USD 642
Due from Merrill Lynch International Bank Ltd USD 9 767 396
Due from Merrill Lynch Professional Clearing Corp. USD 173 702
Due from Morgan Stanley Capital Services Inc. USD 6 290 000
Due from State Street Bank and Trust Co. USD 3 300 000
Merrill Lynch Investment Solutions – Theorema European Equity Long Short UCITS Fund
Due from JPMorgan Chase Bank NA EUR 11 700 968
Due from Merrill Lynch International Bank Ltd EUR 17 044 907
Due to Merrill Lynch International Bank Ltd EUR (7 063 416)
Merrill Lynch Investment Solutions – York Asian Event-Driven UCITS Fund
Due from Bank of America EUR 4 516 180Due from Citibank NA EUR 2 666 148Due from Credit Suisse Securities
(Europe) Limited EUR 1 653 330Due from Deutsche Bank AG EUR 267 016Due from Goldman Sachs
International EUR 1 591 441Due from JPMorgan Chase
Bank NA EUR 2 705 723Due to JPMorgan Chase
Bank NA EUR (34)Due from Merrill Lynch International
Bank Ltd EUR 45 459Due from Merrill Lynch Professional
Clearing Corp. EUR 110 645Due from Morgan Stanley
International Plc. EUR 6 330 068Due from State Street Bank and
Trust Co. EUR 1 337 848Due from UBS AG EUR 3 204 309
Note 7 – Cash collateral information (cont.)

Unaudited semi-annual report
196 Merrill Lynch Investment Solutions
Notes to the financial statements as at September 30, 2016 (cont.)
196 Merrill Lynch Investment Solutions
Unaudited semi-annual report
Sub-Funds
Due from / (due to) brokers Counterparty Currency
Cash collateral balances
Merrill Lynch Investment Solutions – AQR Global Relative Value UCITS Fund
Due from Bank of America USD 3 839 981Due from Citibank NA USD 48 803 592Due from Deutsche Bank AG USD 12 847 452Due from Goldman Sachs
International USD 152 970 000Due from Merrill Lynch International
Bank Ltd USD 26 732 712Due to Merrill Lynch International
Bank Ltd USD (3 664)Due from Merrill Lynch Professional
Clearing Corp. USD 8 457 560Due from Morgan Stanley Capital
Services Inc. USD 1 200 000Due from Morgan Stanley
International Plc. USD 39 400 000Merrill Lynch Investment Solutions – Och-Ziff European Multi-Strategy UCITS Fund
Due from Bank of America USD 5 933 543Due from Barclays Bank Plc. USD 907 587Due from BNP Paribas USD 910 000Due from Citibank NA USD 3 738 911Due from Credit Suisse International USD 418 709Due from Credit Suisse Securities
(Europe) Limited USD 6 713 746Due from Deutsche Bank AG USD 280 067Due to Deutsche Bank AG USD (18 802)Due from Goldman Sachs
International USD 4 095 820Due from HSBC Bank Plc. USD 4 097 949Due from JPMorgan Chase Bank NA USD 3 174 148Due to JPMorgan Chase Bank NA USD (109)Due to Merrill Lynch International
Bank Ltd USD (6 300 000)Due from Merrill Lynch Professional
Clearing Corp. USD 182 411Due from Morgan Stanley Capital
Services Inc. USD 1 410 000Due to Morgan Stanley Capital
Services Inc. USD (1 800 000)Due from Société Générale USD 4 660 000Due from State Street Bank and
Trust Co. USD 2 088 577Due from UBS AG USD 5 040 000
Merrill Lynch Investment Solutions – Beach Point Diversified Credit UCITS Fund
Due from Merrill Lynch International Bank Ltd USD 2 450 341
Due from State Street Bank and Trust Co. USD 790 000
Note 7 – Cash collateral information (cont.)
Unaudited semi-annual report
197Merrill Lynch Investment Solutions
Notes to the financial statements as at September 30, 2016 (cont.)
197Merrill Lynch Investment Solutions
Unaudited semi-annual report
Sub-Funds
Due from / (due to) brokers Counterparty Currency
Cash collateral balances
Merrill Lynch Investment Solutions – Merrill Lynch WNT Diversified Futures UCITS Fund
Due from Merrill Lynch International Bank Ltd USD 22 650 000
Due from Morgan Stanley Capital Services Inc. USD 1 230 000
Due from State Street Bank and Trust Co. USD 1 020 000
Merrill Lynch Investment Solutions – Merrill Lynch Enhanced Volatility Premium Fund
Due fromMerrill Lynch International Bank Ltd EUR 5 285 000
Merrill Lynch Investment Solutions – Merrill Lynch MLCX Commodity Enhanced Beta Fund
Due fromMerrill Lynch International Bank Ltd USD 560 000
Merrill Lynch Investment Solutions – Merrill Lynch MLCX Commodity Enhanced Beta ex Agriculture Fund
Due from Merrill Lynch International Bank Ltd USD 2 700 000
Due from State Street Bank and Trust Co. USD 250 000
Merrill Lynch Investment Solutions – Fenician Equity Long Short UCITS Fund
Due from JPMorgan Chase Bank NA EUR 2 487 787Due from Merrill Lynch International
Bank Ltd EUR 7 538 294Due to Merrill Lynch International
Bank Ltd EUR (206 189)Due from State Street Bank and
Trust Co. EUR 1 600 000Merrill Lynch Investment Solutions – Zeal Greater China Long Short UCITS Fund
Due from Merrill Lynch International Bank Ltd USD 2 404 499
Due from Morgan Stanley International Plc. USD 1 342 498
Due from Royal Bank of Scotland Plc. USD 809 544
Merrill Lynch Investment Solutions – Gotham U.S. Equity Long/Short UCITS Fund
Due from Morgan Stanley Capital Services Inc. USD 2 820 000
Due from Morgan Stanley International Plc. USD 8 681
Due from State Street Bank and Trust Co. USD 1 000 000
Merrill Lynch Investment Solutions – Passport Capital Global Equity Long Short UCITS Fund
Due from Merrill Lynch Professional Clearing Corp. USD 75 289
Due from Morgan Stanley Capital Services Inc. USD 1 070 000
Due from Morgan Stanley International Plc. USD 2 212 358
Merrill Lynch Investment Solutions – Willowbridge-Praxis Global Macro UCITS Fund
Due from Merrill Lynch International Bank Ltd USD 5 893 267
Due from State Street Bank and Trust Co. USD 1 850 000
Note 7 – Cash collateral information (cont.)

Unaudited semi-annual report
198 Merrill Lynch Investment Solutions
Notes to the financial statements as at September 30, 2016 (cont.)
198 Merrill Lynch Investment Solutions
Unaudited semi-annual report
Sub-Funds
Due from / (due to) brokers Counterparty Currency
Cash collateral balances
Merrill Lynch Investment Solutions – Merrill Lynch MLCX Commodity Alpha Fund
Due from Merrill Lynch International Bank Ltd USD 970 000
Due from State Street Bank and Trust Co. USD 290 000
Merrill Lynch Investment Solutions – Ramius Merger Arbitrage Ucits Fund
Due from Merrill Lynch International Bank Ltd USD 3 721 932
Due from Morgan Stanley International Plc. USD 412 631
The table below provides the margin cash balances due from / due to the brokers in relations to the futures contracts held as at September 30, 2016. The margin cash balances are included in the Statement of Net Assets respectively under “Due from Broker” and “Due to Broker”.
Sub-Funds
Due from / (due to) brokers Counterparty Currency
Margin cash balances
Merrill Lynch Investment Solutions – Marshall Wace TOPS UCITS Fund (Market Neutral)
Due from UBS AG
USD 12 584 776Merrill Lynch Investment Solutions – York Event-Driven UCITS Fund
Due from Merrill Lynch International Bank Ltd EUR 2 990 775Due to Merrill Lynch International Bank Ltd EUR (542 633)
Merrill Lynch Investment Solutions – Theorema European Equity Long-Short UCITS Fund
Due from Merrill Lynch International Bank Ltd EUR 1 671 523Due to Merrill Lynch International Bank Ltd
EUR (1 052 342)Merrill Lynch Investment Solutions – York Asian Event-Driven UCITS Fund
Due from Merrill Lynch International Bank Ltd EUR 3 165 534Due to Merrill Lynch International Bank Ltd EUR (1 425 276)
Merrill Lynch Investment Solutions – AQR Global Relative Value UCITS Fund
Due from Merrill Lynch International Bank Ltd USD 37 226 786Due to Merrill Lynch International Bank Ltd USD (3 219 674)
Merrill Lynch Investment Solutions – Och-Ziff European Multi-Strategy UCITS Fund
Due from Merrill Lynch International Bank Ltd USD 8 134 965Due to Merrill Lynch International Bank Ltd USD (150 794)
Merrill Lynch Investment Solutions – Merrill Lynch WNT Diversified Futures UCITS Fund
Due from Merrill Lynch International Bank Ltd
USD 14 211 700Merrill Lynch Investment Solutions – Fenician Equity Long Short UCITS Fund
Due from Merrill Lynch International Bank Ltd EUR 5 247 422Due to Merrill Lynch International Bank Ltd EUR (91 405)
Merrill Lynch Investment Solutions – Zeal Greater Long Short China UCITS Fund
Due to Merrill Lynch International Bank LtdUSD (260)
Merrill Lynch Investment Solutions – Willowbridge-Praxis Global Macro Ucits Fund
Due from Merrill Lynch International Bank Ltd USD 5 851 095Due to Merrill Lynch International Bank Ltd USD (97 962)
Note 7 – Cash collateral information (cont.)

Unaudited semi-annual report
199Merrill Lynch Investment Solutions
Notes to the financial statements as at September 30, 2016 (cont.)
199Merrill Lynch Investment Solutions
Unaudited semi-annual report
Note 8 – Stock collateral information
The table below provides the stock collateral information as at September 30, 2016.
Sub-Funds Counterparty Security name
Type of collateral Currency
Nominal value
Merrill Lynch Investment Solutions –AQR Global Relative Value UCITS Fund
Goldman Sachs International
United States Treasury Bill 0% 02/02/2017 Bond USD 26 420 000
Goldman Sachs International
United States Treasury Bill 0% 06/10/2016 Bond USD 49 050 000
Merrill Lynch International Ltd.
United States Treasury Bill 0% 08/09/2016 Bond USD 26 000 000
Deutsche Bank AG United States Treasury Bill 0% 12/01/2017 Bond USD 52 710 000
Deutsche Bank AG United States Treasury Bill 0% 17/11/2016 Bond USD 21 930 000
Goldman Sachs International
United States Treasury Bill 0% 22/09/2016 Bond USD 69 250 000
Merrill Lynch International Ltd.
United States Treasury Bill 0% 25/11/2016 Bond USD 8 000 000
Merrill Lynch Investment Solutions – Och-Ziff European Multi-Strategy UCITS Fund
Morgan Stanley International
United States Treasury Bill 0%27/04/2017 Bond USD 3 286 000
Deutsche Bank AG United States Treasury Bill 0% 05/01/2017 Bond USD 83 000
Deutsche Bank AG United States Treasury Bill 0% 02/02/2017 Bond USD 1 197 800
Deutsche Bank AG United States Treasury Bill 0% 30/03/2017 Bond USD 1 280 000
Merrill Lynch Investment Solutions –Merrill Lynch WNT Diversified Futures UCITS Fund
Bank of New York Mellon International Bank for Reconstruction and Development 0% 20/10/2016 Bond USD 24 000 000
Bank of New York Mellon Inter-American Development Bank 0% 03/11/2016 Bond USD 19 000 000
Merrill Lynch Investment Solutions – Gotham U.S. Equity Long/Short UCITS Fund
Bank of New York Mellon AbbVie, Inc. Stock USD 3 200 Bank of New York Mellon Amgen, Inc. Stock USD 1 379 Bank of New York Mellon Apple, Inc. Stock USD 1 879 Bank of New York Mellon Aspen Technology, Inc. Stock USD 8 030 Bank of New York Mellon Big Lots, Inc. Stock USD 5 420 Bank of New York Mellon Biogen, Inc. Stock USD 800 Bank of New York Mellon Brinker International, Inc. Stock USD 5 470 Bank of New York Mellon CA, Inc. Stock USD 4 500 Bank of New York Mellon Cabot Corp. Stock USD 5 180 Bank of New York Mellon Cardinal Health, Inc. Stock USD 2 020 Bank of New York Mellon CBS Corp. - B Stock USD 2 050 Bank of New York Mellon CenturyLink, Inc. Stock USD 9 660 Bank of New York Mellon Chicago Bridge & Iron Co. NV Stock USD 180 Bank of New York Mellon Cisco Systems, Inc. Stock USD 12 230 Bank of New York Mellon Citrix Systems, Inc. Stock USD 1 980 Bank of New York Mellon ConAgra Foods, Inc. Stock USD 4 079 Bank of New York Mellon Convergys Corp. Stock USD 7 186 Bank of New York Mellon Cummins, Inc. Stock USD 1 360 Bank of New York Mellon CVS Health Corp. Stock USD 1 750 Bank of New York Mellon Danaher Corp. Stock USD 2 830 Bank of New York Mellon Darden Restaurants, Inc. Stock USD 2 020

Unaudited semi-annual report
200 Merrill Lynch Investment Solutions
Notes to the financial statements as at September 30, 2016 (cont.)
200 Merrill Lynch Investment Solutions
Unaudited semi-annual report
Sub-Funds Counterparty Security name
Type of collateral Currency
Nominal value
Merrill Lynch Investment Solutions – Gotham U.S. Equity Long/Short UCITS Fund (cont.)
Bank of New York Mellon Delta Air Lines, Inc. Stock USD 9 145 Bank of New York Mellon Discovery Communications,
Inc. - A Stock USD 4 969 Bank of New York Mellon eBay, Inc. Stock USD 6 330 Bank of New York Mellon Emerson Electric Co. Stock USD 3 140 Bank of New York Mellon Express Scripts Hldg. Co. Stock USD 1 449 Bank of New York Mellon Gilead Sciences, Inc. Stock USD 3 500 Bank of New York Mellon HCA Hldg., Inc. Stock USD 1 040 Bank of New York Mellon Hewlett Packard Enterprise Co. Stock USD 9 739 Bank of New York Mellon Home Depot, Inc. Stock USD 2 360 Bank of New York Mellon HP, Inc. Stock USD 18 720 Bank of New York Mellon Huntington Ingalls
Industries, Inc. Stock USD 760 Bank of New York Mellon Intuit, Inc. Stock USD 2 272 Bank of New York Mellon j2 Global, Inc. Stock USD 4 120 Bank of New York Mellon JM Smucker Co. Stock USD 770 Bank of New York Mellon KBR, Inc. Stock USD 17 347 Bank of New York Mellon Lowe's Cos, Inc. Stock USD 3 030 Bank of New York Mellon McKesson Corp. Stock USD 560 Bank of New York Mellon Medivation, Inc. Stock USD 1 819 Bank of New York Mellon Mentor Graphics Corp. Stock USD 11 440 Bank of New York Mellon Michael Kors Hldg. Ltd. Stock USD 3 200 Bank of New York Mellon MicroStrategy, Inc. - A Stock USD 1 370 Bank of New York Mellon Oracle Corp. Stock USD 3 050 Bank of New York Mellon Packaging Corp. of America Stock USD 2 718 Bank of New York Mellon Pfizer, Inc. Stock USD 4 170 Bank of New York Mellon Qualcomm, Inc. Stock USD 2 640 Bank of New York Mellon Quintiles Transnational
Hldg., Inc. Stock USD 3 440 Bank of New York Mellon Rackspace Hosting, Inc. Stock USD 7 560 Bank of New York Mellon Robert Half International, Inc. Stock USD 925 Bank of New York Mellon Southwest Airlines Co. Stock USD 4 190 Bank of New York Mellon Spirit AeroSystems Hldg.,
Inc. - A Stock USD 3 019 Bank of New York Mellon Stanley Black & Decker, Inc. Stock USD 94 Bank of New York Mellon Staples, Inc. Stock USD 5 340 Bank of New York Mellon Swift Transportation Co. Stock USD 13 410 Bank of New York Mellon Symantec Corp. Stock USD 5 397 Bank of New York Mellon Target Corp. Stock USD 3 005 Bank of New York Mellon Tegna, Inc. Stock USD 9 190 Bank of New York Mellon Twenty-First Century Fox,
Inc. - A Stock USD 11 610 Bank of New York Mellon Tyson Foods, Inc. - A Stock USD 662 Bank of New York Mellon United Natural Foods, Inc. Stock USD 3 775 Bank of New York Mellon United Rentals, Inc. Stock USD 2 900 Bank of New York Mellon United Technologies Corp. Stock USD 160 Bank of New York Mellon United Therapeutics Corp. Stock USD 3 580
Note 8 – Stock collateral information (cont.)

Unaudited semi-annual report
201Merrill Lynch Investment Solutions
Notes to the financial statements as at September 30, 2016 (cont.)
201Merrill Lynch Investment Solutions
Unaudited semi-annual report
Sub-Funds Counterparty Security name
Type of collateral Currency
Nominal value
Merrill Lynch Investment Solutions – Gotham U.S. Equity Long/Short UCITS Fund (cont.)
Bank of New York Mellon Universal Health Services, Inc. - B Stock USD 2 010
Bank of New York Mellon Urban Outfitters, Inc. Stock USD 860 Bank of New York Mellon Verizon Communications, Inc. Stock USD 3 100 Bank of New York Mellon Wal-Mart Stores, Inc. Stock USD 2 470 Bank of New York Mellon Walt Disney Co. Stock USD 2 320 Bank of New York Mellon Wyndham Worldwide Corp. Stock USD 1 720 Bank of New York Mellon Xilinx, Inc. Stock USD 4 240 Bank of New York Mellon Zimmer Biomet Hldg., Inc. Stock USD 1 776
Merrill Lynch Investment Solutions –RAMIUS MERGER ARB UCITS Fund
Bank of New York Mellon Astoria Financial Corp. Stock USD 20 000 Bank of New York Mellon EverBank Financial Corp. Stock USD 10 000 Bank of New York Mellon Ingram Micro, Inc. - A Stock USD 8 000 Bank of New York Mellon Joy Global, Inc. Stock USD 4 000 Bank of New York Mellon Lexmark International, Inc. - A Stock USD 6 000 Bank of New York Mellon LinkedIn Corp. - A Stock USD 1 000 Bank of New York Mellon Syngenta AG - ADR Stock USD 1 500
Note 9 – Fair valuation
The Directors have appointed CM Investment Solutions Limited to act as the competent person. The following table sets forth the securities where a competent person was used to determine the value as at September 30, 2016.
Sub-Funds CurrencyNumber of
assets valued
Value% of
net assetsMerrill Lynch Investment Solutions – Marshall Wace TOPS UCITS Fund (Market Neutral) USD 6 93 966 116 2.98Merrill Lynch Investment Solutions – York Event-Driven UCITS Fund EUR 4 516 401 0.34Merrill Lynch Investment Solutions – York Asian Event-Driven UCITS Fund EUR 1 – 0.00Merrill Lynch Investment Solutions – AQR Global Relative Value UCITS Fund USD 5 15 025 972 1.01Merrill Lynch Investment Solutions – Och-Ziff European Multi-Strategy UCITS Fund USD 10 7 296 864 4.89Merrill Lynch Investment Solutions – Beach Point Diversified Credit UCITS Fund USD 1 – 0.00Merrill Lynch Investment Solutions – Merrill Lynch WNT Diversified Futures UCITS Fund USD 2 4 501 169 1.70Merrill Lynch Investment Solutions – Merrill Lynch Enhanced Equity Volatility Premium Fund EUR 1 9 023 391 10.16Merrill Lynch Investment Solutions – Zeal Greater China Long Short UCITS Fund USD 3 3 337 253 9.31Merrill Lynch Investment Solutions – Passport Capital Global Equity Long Short UCITS Fund USD 1 882 442 2.17Merrill Lynch Investment Solutions – Credit Fund 2016 EUR 18 52 258 449 46.26
Note 10 – Directors fees
Unaffiliated directors were each paid a quarterly gross fee of USD 11,250 during the period ended September 30, 2016, which were borne by the SICAV.
Note 8 – Stock collateral information (cont.)
Merrill Lynch Investment Solutions
Unaudited semi-annual report as at September 30, 2016