PhytoplanktonCompositionandAbundance ... inaSedgwick-Rafter chamber ofavolumeof0.67 mlforphyto-...
22
RESEARCH ARTICLE Phytoplankton Composition and Abundance in Restored Maltański Reservoir under the Influence of Physico-Chemical Variables and Zooplankton Grazing Pressure Anna Kozak*, Ryszard Goldyn, Renata Dondajewska Department of Water Protection, Faculty of Biology, Adam Mickiewicz University, Poznań, Poland * [email protected] Abstract In this paper we present the effects of environmental factors and zooplankton food pressure on phytoplankton in the restored man-made Maltański Reservoir (MR). Two methods of res- toration: biomanipulation and phosphorus inactivation have been applied in the reservoir. Nine taxonomical groups of phytoplankton represented in total by 183 taxa were stated there. The richest groups in respect of taxa number were green algae, cyanobacteria and di- atoms. The diatoms, cryptophytes, chrysophytes, cyanobacteria, green algae and eugleno- phytes dominated in terms of abundance and/or biomass. There were significant changes among environmental parameters resulting from restoration measures which influenced the phytoplankton populations in the reservoir. These measures led to a decrease of phospho- rus concentration due to its chemical inactivation and enhanced zooplankton grazing as a result of planktivorous fish stocking. The aim of the study is to analyse the reaction of phyto- plankton to the restoration measures and, most importantly, to determine the extent to which the qualitative and quantitative composition of phytoplankton depends on variables changing under the influence of restoration in comparison with other environmental vari- ables. We stated that application of restoration methods did cause significant changes in phytoplankton community structure. The abundance of most phytoplankton taxa was nega- tively correlated with large zooplankton filter feeders, and positively with zooplankton preda- tors and concentrations of ammonium nitrogen and partly of phosphates. However, restoration was insufficient in the case of decreasing phytoplankton abundance. The effects of restoration treatments were of less importance for the abundance of phytoplankton than parameters that were independent of the restoration. This was due to the continuous inflow of large loads of nutrients from the area of the river catchment. PLOS ONE | DOI:10.1371/journal.pone.0124738 April 23, 2015 1 / 22 OPEN ACCESS Citation: Kozak A, Gołdyn R, Dondajewska R (2015) Phytoplankton Composition and Abundance in Restored Maltański Reservoir under the Influence of Physico-Chemical Variables and Zooplankton Grazing Pressure. PLoS ONE 10(4): e0124738. doi:10.1371/journal.pone.0124738 Academic Editor: Adrianna Ianora, Stazione Zoologica Anton Dohrn, ITALY Received: November 12, 2014 Accepted: March 4, 2015 Published: April 23, 2015 Copyright: © 2015 Kozak et al. This is an open access article distributed under the terms of the Creative Commons Attribution License, which permits unrestricted use, distribution, and reproduction in any medium, provided the original author and source are credited. Data Availability Statement: All relevant data are within the paper. Funding: This research was financed by the grant No NN305 372838 from the Ministry of Science and Higher Education (Poland). The funders had no role in study design, data collection and analysis, decision to publish, or preparation of the manuscript. Competing Interests: The authors have declared that no competing interests exist.
Transcript of PhytoplanktonCompositionandAbundance ... inaSedgwick-Rafter chamber ofavolumeof0.67 mlforphyto-...

RESEARCH ARTICLE
Phytoplankton Composition and Abundancein Restored Maltański Reservoir under theInfluence of Physico-Chemical Variables andZooplankton Grazing PressureAnna Kozak*, Ryszard Gołdyn, Renata Dondajewska
Department of Water Protection, Faculty of Biology, AdamMickiewicz University, Poznań, Poland
AbstractIn this paper we present the effects of environmental factors and zooplankton food pressure
on phytoplankton in the restored man-made Maltański Reservoir (MR). Two methods of res-
toration: biomanipulation and phosphorus inactivation have been applied in the reservoir.
Nine taxonomical groups of phytoplankton represented in total by 183 taxa were stated
there. The richest groups in respect of taxa number were green algae, cyanobacteria and di-
atoms. The diatoms, cryptophytes, chrysophytes, cyanobacteria, green algae and eugleno-
phytes dominated in terms of abundance and/or biomass. There were significant changes
among environmental parameters resulting from restoration measures which influenced the
phytoplankton populations in the reservoir. These measures led to a decrease of phospho-
rus concentration due to its chemical inactivation and enhanced zooplankton grazing as a
result of planktivorous fish stocking. The aim of the study is to analyse the reaction of phyto-
plankton to the restoration measures and, most importantly, to determine the extent to
which the qualitative and quantitative composition of phytoplankton depends on variables
changing under the influence of restoration in comparison with other environmental vari-
ables. We stated that application of restoration methods did cause significant changes in
phytoplankton community structure. The abundance of most phytoplankton taxa was nega-
tively correlated with large zooplankton filter feeders, and positively with zooplankton preda-
tors and concentrations of ammonium nitrogen and partly of phosphates. However,
restoration was insufficient in the case of decreasing phytoplankton abundance. The effects
of restoration treatments were of less importance for the abundance of phytoplankton than
parameters that were independent of the restoration. This was due to the continuous inflow
of large loads of nutrients from the area of the river catchment.
PLOS ONE | DOI:10.1371/journal.pone.0124738 April 23, 2015 1 / 22
OPEN ACCESS
Citation: Kozak A, Gołdyn R, Dondajewska R (2015)Phytoplankton Composition and Abundance inRestored Maltański Reservoir under the Influence ofPhysico-Chemical Variables and ZooplanktonGrazing Pressure. PLoS ONE 10(4): e0124738.doi:10.1371/journal.pone.0124738
Academic Editor: Adrianna Ianora, StazioneZoologica Anton Dohrn, ITALY
Received: November 12, 2014
Accepted: March 4, 2015
Published: April 23, 2015
Copyright: © 2015 Kozak et al. This is an openaccess article distributed under the terms of theCreative Commons Attribution License, which permitsunrestricted use, distribution, and reproduction in anymedium, provided the original author and source arecredited.
Data Availability Statement: All relevant data arewithin the paper.
Funding: This research was financed by the grantNo NN305 372838 from the Ministry of Science andHigher Education (Poland). The funders had no rolein study design, data collection and analysis, decisionto publish, or preparation of the manuscript.
Competing Interests: The authors have declaredthat no competing interests exist.

IntroductionThe eutrophication of water bodies accelerated by human activity creates the need for variousactivities to be undertaken to restore good water quality. Phytoplankton, as a very reactive ele-ment of the lake ecosystem, is first to react to changes in the environment. These changes con-cern both quantitative and qualitative phytoplankton structure [1–4]. Considerable changes inthe phytoplankton community were reported from the restored Lake Trummen. After removalof the top sediment layer the species diversity of phytoplankton increased and phytoplanktonbiomass decreased in the lake [5]. At the same time the actual plankton community disap-peared (forms such as cysts, spores, zygotes, hormogonia etc. were removed with the sedi-ments). The costs of this removal are the most important disadvantage in applying this methodas it is several times more expensive than P-inactivation [6]. Chemical treatment, which seemsto be one of the most popular restoration methods used on lakes, results in rapid and satisfacto-ry effects [7–15]. Owing to their effectiveness for phosphorus inactivation, aluminum and/oriron, salts have most often been used as coagulants applied in lakes and reservoirs during resto-rations [1]. Other compounds can also be used to precipitate phosphorus from the water col-umn or for inactivation in bottom sediments, for example Phoslock, Sinobent, nitrates,magnesium chloride, etc. [10]. The immediate effect of an application of Phoslock causing a de-crease of phytoplankton abundance, especially cyanobacteria, was stated in the Laguna NiguelLake in California. Cyanobacteria-dominated blooms at high densities were replaced by dia-toms and green algae soon after the application of Phoslock [16]. Sometimes one method ofrestoration treatment is insufficient to cause a decrease of phytoplankton growth [17]. A com-bination of two methods seems to be more effective, e.g. simultaneously applied flocculentpolyaluminium chloride and Phoslock turned out to be more effective in reducing the cyano-bacterial bloom caused byMicrocystis aeruginosa and Aphanizomenon flos-aquae in LakeRauwbraken, located in the south of the Netherlands [18]. Diatoms, also a very sensitive group,was replaced by another, green algae, soon after a Phoslock application [19]. However, the re-sponses of phytoplankton to restoration treatments are not always are so spectacular. Reportsfrom the restored Lake Balaton stated that the response of phytoplankton was not easily visibleand sometimes counterintuitive [20].
Chemical methods cause substantial changes in the whole ecosystem and require largeamounts of chemicals [18]. Such a treatment, with tonnes of chemicals dosed into the water,was not acceptable in the case of Maltański Reservoir. Therefore, sustainable treatment wasadopted there with a small amount of coagulant being applied several times a year. This is anew approach to the restoration of lakes, and its impact on phytoplankton is not yetwell documented.
This study focused on phytoplankton dynamics under the influence of changes in phospho-rus concentration due to its inactivation, as well as zooplankton grazing due to implementedbiomanipulation measures. The influence of these variables was also compared with the impactof other environmental variables to assess to what extent the restoration methods are effectivein limiting the growth of phytoplankton in the reservoir.
Materials and MethodsMaltański Reservoir (52°240N, 16°580E) is located in the central part of Poznań, mid-westernPoland. It was created in 1952 by damming the waters of the River Cybina. It has a maximumdepth of ca 5 m. Its area is 64 ha, average depth 3 m and a volume of 2�106 m3. It accumulateswater from the lower course of the River Cybina, the right tributary of the River Warta. Thecatchment area of the River Cybina represents a typical agricultural region, farms and fieldsdominate there. The reservoir is intensely used for recreation and for water sports, and sport
Phytoplankton in Restored Reservoir versus Physico-Chemical Variables
PLOS ONE | DOI:10.1371/journal.pone.0124738 April 23, 2015 2 / 22

events of significant international importance take place there. It has been completely drainedat 4-years intervals since autumn 1992 and filled with water early in the following spring so asto carry out maintenance of the weir and sports facilities. The water quality of the reservoir,since its filling with water in 1993, has been hypertrophic. Therefore it was restored for the firsttime in the years 1993–96 by means of biomanipulation. The reservoir was stocked with preda-tory fish (pike Esox lucius (L.), pikeperch Stizostedion lucioperca (L.) and wels catfish Silurusglanis L.) and an increase of water transparency was expected due to a cascading top-down im-pact on phytoplankton density [21–22]. However, the effectiveness of stocking was not suffi-cient as so-called feed back effects appeared [23–24]. Phytoplankton abundance during theapplication of the biomanipulation method was low only at the beginning of the experiment; insubsequent years dominating colonial cyanobacteria and permanent water bloom during sum-mer seasons made the recreational use of this reservoir impossible [17]. Therefore, a secondmethod was implemented from 2005 to strengthen the restoration treatment [25]—this timeiron sulphate (PIX) was added to the reservoir in small doses.
During this study, in the period of 2009–2012, juvenile fish of species such as pikeperch,pike and wels catfish were stocked in Maltański Reservoir, especially fry and summer and au-tumn fingerlings (Wiśniewski, unpubl.). Approximately 600–800 kg per 1 ha every year wereintroduced in the period of 2009–2011. The reservoir was not stocked with fish in 2012 becauseit was the last year before its draining. During the draining at the end of 2012 all the fish werecaught and removed from the reservoir. The most abundant species were bream Abramisbrama (L.)- 47%, roach Rutilus rutilus (L.)- 15% and perch Perca fluviatilis (L.)- 14%. Altogeth-er, there were 21,442 kg of fish. Phosphorus inactivation was undertaken using small doses ofcoagulants several times a year. Three coagulants were dosed there: PIX, Sinobent and magne-sium chloride. PIX was dosed 9 times a year in 2009, 6 times in 2010 and 2011, and 3 times in2012. Each time the dose of the coagulant amounted to 500–700 kg for the whole reservoir(about 10 kg ha-1). Additionally, once in 2011 and three times in 2012 a dose of 150 kg of a newcoagulant Sinobent [10] was added into the reservoir. 300 kg of MgCl2 were also added there 3times in 2012.
This paper includes the results of a 4-year-long series of studies of plankton and physico-chemical characteristics of water, from the period beginning in 2009 when Maltański Reservoirwas filled with water till its drainage in 2012. The composition and abundance of nine phyto-plankton groups and zooplankton, i.e. cladocerans, copepods and rotifers was analysed.
Phyto- and zooplankton composition as well as selected water features were analysed in 2week intervals, mostly fromMarch to October, from the surface and from the depth of 1, 2 and3 m. Each time the material was collected using a 5 L sampler. Phytoplankton samples werecollected without filtration. For zooplankton analyses 10 l of water was filtered through aplankton net, mesh size 30 μm. The water temperature, concentration of dissolved oxygen,conductivity and pH were measured directly in the field using a WTW 350 multi-parametermeter. Secchi disk visibility was also measured. Physico-chemical and biological parameters,such as concentration of nitrogen (ammonium, nitrite, nitrate, organic and total N) and phos-phorus (dissolved phosphates and total phosphorus) were analysed in the vertical profile of thelake. Concentration of nitrogen and phosphorus forms and chlorophyll-a were analysedspectrophotometrically according to standard methods [26].
Samples of phyto- and zooplankton were fixed with Lugol solution. Phytoplankton compo-sition and abundance was analysed using an Olympus microscope. The specimens (spec.) werecounted in a Sedgwick-Rafter chamber of a volume of 0.67 ml for phyto- and 1 ml for zoo-plankton. Phytoplankton biomass was calculated by approximating the shape of specimenswith geometric figures [27]. Crustacean biomass was calculated acc. to Bottrell et al. [28] basedon the relationship between body length and body weight for each crustacean species. Rotifer
Phytoplankton in Restored Reservoir versus Physico-Chemical Variables
PLOS ONE | DOI:10.1371/journal.pone.0124738 April 23, 2015 3 / 22

biomass was taken after Ejsmont-Karabin [29] and Radwan [30]. The influence of zooplanktonon individual taxa of phytoplankton as well as on the size of groups and taxonomical groupswas analysed. For this purpose the phytoplankton was divided into two size fractions i.e. nano-phytoplankton (up to 30 μm) and the microphytoplankton (above 30 μm).
Indicators of the specific Shannon–Weaver diversity index [31] of the phytoplankton andevenness index were counted using the PAST program (http:folk.uio.no/ohammer/past/).
Differences between phytoplankton abundance, biomass and its biodiversity (Shannon-Weaver and evenness indexes) of the individual studied years were tested by the non-paramet-ric ANOVA Kruskal-Wallis Rank test (p< 0.05, PAST program). In order to ascertain the en-vironmental variables in determining the abundance and biomass of phytoplankton theCanonical Correspondence Analysis was applied [32]. The appropriateness of using RDA waschecked using DCA. Redundancy analysis (RDA) was used to create models explaining rela-tionships between phytoplankton and physico-chemical parameters and zooplankton foodpressure. The phytoplankton (2 size groups, nine taxonomic groups and individual taxa ap-pearing in high density>500 spec. ml-1) was correlated with the parameters directly connectedwith restoration and independent of restoration treatment in order to determine which ofthem have a significant impact.
Only biomass (both of phyto- and zooplankton) was chosen for graphic illustration in thepresent paper. As zooplankton biomass is correlated with filtering rate and grazing rate [33–34], it perfectly reflects the alimentary pressure of the zooplankton on the phytoplankton. Test-ing correlations, zooplankton was divided into 3 groups: predators (mostly copepods: cyclo-poids, elder larval forms of copepodites and Leptodora kindtii from Cladocera), filter feeders(cladocerans without L. kindtii together with calanoids from Copepoda) and small zooplank-ton (rotifers and nauplii—the young larval copepod forms). Such a division was necessitateddue to two main factors influencing zooplankton: firstly—their feeding habits, and secondly—their exposure to the feeding pressure of fish (as biomanipulation, as a result of fish pressure,caused changes in zooplankton abundance and biomass).
The analysed parameters influencing phytoplankton which were directly connected withrestoration procedures were tested separately from physico-chemical parameters that were in-dependent of restoration. There were 4 parameters in the first group, i.e. filter feeders (mostlycladocerans) and predators (mostly cyclopoids) connected with biomanipulation (directlyunder food pressure of fish) and concentration of PO4-P and NH4-N, associated with chemicaltreatments, i.e. iron sulphate and magnesium chloride. The results obtained from all the sam-pling depths in the vertical profile were tested. The Monte Carlo permutation test with 499 un-restricted permutations of the constraining variable was used to assess the statisticalsignificance in the regression.
The work did not involve any endangered or protected biological species. No specific per-missions were required for these locations and activities.
Results
Physical and chemical variablesThe highest values of Secchi depth (SD) in the MR during the studied period were stated in thefirst year of the study (after filling the reservoir with water). The maximum value of 3.8 m wasfound in May 2009 (Table 1). Between 2010 and 2011 a clear reduction of Secchi depth was vis-ible. Throughout the whole of 2010 it did not exceed 1.65 m (June) and 1.2 m in 2011 (April).A clear improvement was found in 2012 and the transparency increased to 3.3 m (May). Thewater temperature in consecutive seasons reached its highest values in the summer months
Phytoplankton in Restored Reservoir versus Physico-Chemical Variables
PLOS ONE | DOI:10.1371/journal.pone.0124738 April 23, 2015 4 / 22
and ranged from 24.2 °C (2012) to 24.9 °C (in 2010) in the studied period (Table 1). The lowesttemperature in summer was found in the last year of the study.
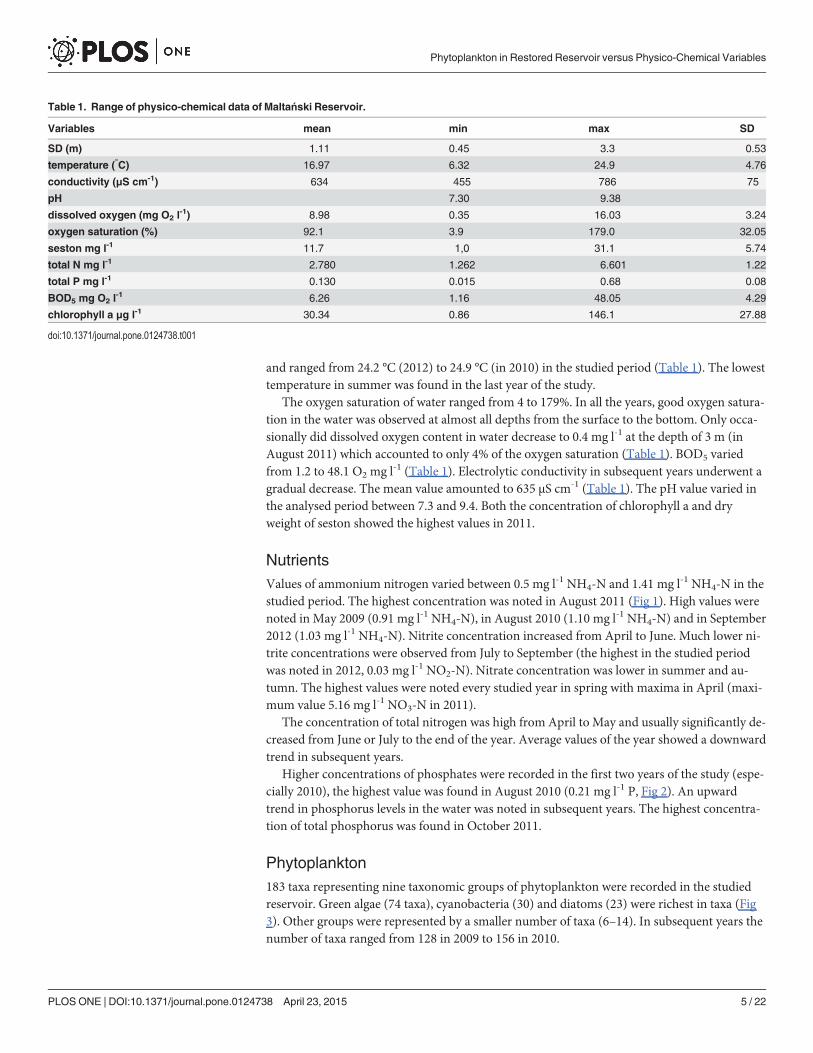
The oxygen saturation of water ranged from 4 to 179%. In all the years, good oxygen satura-tion in the water was observed at almost all depths from the surface to the bottom. Only occa-sionally did dissolved oxygen content in water decrease to 0.4 mg l-1 at the depth of 3 m (inAugust 2011) which accounted to only 4% of the oxygen saturation (Table 1). BOD5 variedfrom 1.2 to 48.1 O2 mg l-1 (Table 1). Electrolytic conductivity in subsequent years underwent agradual decrease. The mean value amounted to 635 μS cm-1 (Table 1). The pH value varied inthe analysed period between 7.3 and 9.4. Both the concentration of chlorophyll a and dryweight of seston showed the highest values in 2011.
NutrientsValues of ammonium nitrogen varied between 0.5 mg l-1 NH4-N and 1.41 mg l-1 NH4-N in thestudied period. The highest concentration was noted in August 2011 (Fig 1). High values werenoted in May 2009 (0.91 mg l-1 NH4-N), in August 2010 (1.10 mg l-1 NH4-N) and in September2012 (1.03 mg l-1 NH4-N). Nitrite concentration increased from April to June. Much lower ni-trite concentrations were observed from July to September (the highest in the studied periodwas noted in 2012, 0.03 mg l-1 NO2-N). Nitrate concentration was lower in summer and au-tumn. The highest values were noted every studied year in spring with maxima in April (maxi-mum value 5.16 mg l-1 NO3-N in 2011).
The concentration of total nitrogen was high from April to May and usually significantly de-creased from June or July to the end of the year. Average values of the year showed a downwardtrend in subsequent years.
Higher concentrations of phosphates were recorded in the first two years of the study (espe-cially 2010), the highest value was found in August 2010 (0.21 mg l-1 P, Fig 2). An upwardtrend in phosphorus levels in the water was noted in subsequent years. The highest concentra-tion of total phosphorus was found in October 2011.
Phytoplankton183 taxa representing nine taxonomic groups of phytoplankton were recorded in the studiedreservoir. Green algae (74 taxa), cyanobacteria (30) and diatoms (23) were richest in taxa (Fig3). Other groups were represented by a smaller number of taxa (6–14). In subsequent years thenumber of taxa ranged from 128 in 2009 to 156 in 2010.
Table 1. Range of physico-chemical data of Maltański Reservoir.
Variables mean min max SD
SD (m) 1.11 0.45 3.3 0.53
temperature (°C) 16.97 6.32 24.9 4.76
conductivity (μS cm-1) 634 455 786 75
pH 7.30 9.38
dissolved oxygen (mg O2 l-1) 8.98 0.35 16.03 3.24
oxygen saturation (%) 92.1 3.9 179.0 32.05
seston mg l-1 11.7 1,0 31.1 5.74
total N mg l-1 2.780 1.262 6.601 1.22
total P mg l-1 0.130 0.015 0.68 0.08
BOD5 mg O2 l-1 6.26 1.16 48.05 4.29
chlorophyll a μg l-1 30.34 0.86 146.1 27.88
doi:10.1371/journal.pone.0124738.t001
Phytoplankton in Restored Reservoir versus Physico-Chemical Variables
PLOS ONE | DOI:10.1371/journal.pone.0124738 April 23, 2015 5 / 22
The highest value of the Shannon–Weaver diversity index was observed in 2012 (3.71, Fig4). The average values of this index for each year were lowest in the first year of the study (2.25in 2009). The value reached 2.71 and 2.58 in next two years and the highest mean value in thefourth year of the study (3.07 in 2012). Differences in values of Shannon–Weaver diversityindex between the individual years were significant in most cases (p< 0.01, ANOVA Kruskal-Wallis test). Only the differences between the 2011 value versus other years were notstatistically significant.
The mean values of the evenness index in subsequent years were similar in first two years(0.28 and 0.27), while the highest value was noticed in 2012. The lowest value was reached inOctober 2011 (0.04), while the highest in June 2012 (0.55, Fig 5). The differences between thevalues in every studied year were statistically significant (p< 0.01, ANOVA Kruskal-Wallistest).
Phytoplankton abundance in each of the sucessive years of the research evolved with thehighest values in April (2009 and 2010) or September (2011 and 2012). Comparing consecu-tive years, the highest abundance of phytoplankton specimens was found in 2011 60�103
Fig 1. Concentration of nitrogen forms in Maltański Reservoir.
doi:10.1371/journal.pone.0124738.g001
Phytoplankton in Restored Reservoir versus Physico-Chemical Variables
PLOS ONE | DOI:10.1371/journal.pone.0124738 April 23, 2015 6 / 22

Fig 2. Concentration of phosphate phosphorus on the surface and the depth of 3m.
doi:10.1371/journal.pone.0124738.g002
Fig 3. The participation of taxa belonging to main algal groups identified in Maltański Reservoir.CYA-Cyanobacteria, EUG-Euglenophyceae, CRY-Cryptophyceae, CHR-Chrysophyceae,BAC-Bacillariophyceae, CHL-Chlorophyceae, DIN-Dinophyceae, XAN-Xantophyceae,CON-Conjugatophyceae.
doi:10.1371/journal.pone.0124738.g003
Phytoplankton in Restored Reservoir versus Physico-Chemical Variables
PLOS ONE | DOI:10.1371/journal.pone.0124738 April 23, 2015 7 / 22

spec. ml-1 (Fig 6). The highest values of the remaining years of the study were significantlylower (29.0 103 spec. ml-1 in 2009 and ranging 10.6–14.2 103 spec. ml-1 in 2010 and 2012). Aclear decline in phytoplankton was recorded in late spring and summer (the so-called clearwater phase established in May 2009 and 2012), when the abundance of phytoplankton de-creased to 350 spec. ml-1 in 2009 and 550 spec. ml-1 in 2012 (the average value of the depthprofile).
Fig 4. Themean, maximum andminimum values of Shannon-Weaver index in each year in Maltański Reservoir.
doi:10.1371/journal.pone.0124738.g004
Fig 5. The diversity of evenness parameter in each sampling date in Maltański Reservoir.
doi:10.1371/journal.pone.0124738.g005
Phytoplankton in Restored Reservoir versus Physico-Chemical Variables
PLOS ONE | DOI:10.1371/journal.pone.0124738 April 23, 2015 8 / 22

Seasonal changes in the dominance of particular groups of phytoplankton were found insubsequent years of the study. Chrysophytes (especially in 2009), cryptophytes, diatoms andchlorophytes dominated in phytoplankton in the period from April to May. The species thatwere the most abundant in phytoplankton during this period were Erkenia subaequiciliataSkuja, Dinobryon sociale (Ehrenberg) Ehrenberg, Chrysococcus sp., Cryptomonas marssoniiSkuja, Rhodomonas lacustris Pascher & Ruttner, Desmodesmus communis (E.Hegewald) E.Hegewald, Schroederia setigera (Schröder) Lemmermann, Tetraedron minimum (A.Braun)Hansgirg, Ulnaria acus (Kützing) M.Aboal and U. delicatissima var. angustissima (Grunow) M.Aboal & P.C.Silva. Diatoms and green algae increased their share in the density in June. Then,from July to August or September a gradual increase in the share of cyanobacteria in the totalabundance of phytoplankton was recorded. High abundance of this group was found especiallyin 2011. Its number increased gradually from July to October. The share of cyanobacteria inthe studied period was the smallest in 2012, when it did not exceed 40%, while the maximumshare in the period 2009–2011 ranged from 55–85%. The highest share of cyanobacteria in thestudied period was recorded in September. Due to temperature decrease in October, the phyto-plankton density significantly decreased and the share of cyanobacteria was lower. Exceptional-ly in 2011 cyanobacteria also dominated in abundance in October. The most numerous speciesof this group in subsequent years were Pseudanabaena limnetica (Lemmermann) Komárek,Planktolyngbya limnetica (Lemmermann) J.Komárková-Legnerová & G.Cronberg (especiallyin 2011), Aphanizomenon gracile (Lemmermann) Lemmermann and Limnothrix redekei (vanGoor) Meffert.
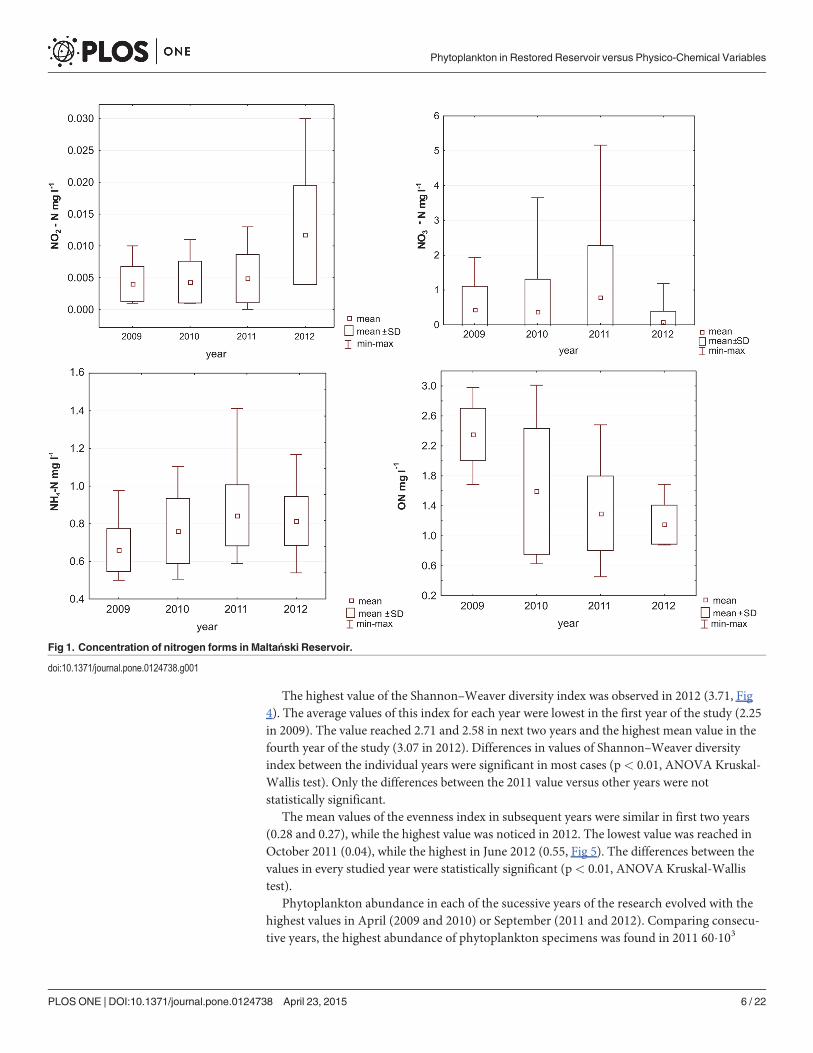
The lowest values of phytoplankton biomass in subsequent years were found in the firstyear of the study and the highest in 2011 (Fig 7). These values ranged from 0.2 to 11.7 μg ml- 1
in 2009, 1.2–34.4 μg ml- 1 in 2010, 10.3–66.0 μg ml- 1 in 2011 and 3.9–49.5 μg ml- 1 in 2012.The groups constituting the highest biomass of phytoplankton were diatoms, cryptophytesand cyanobacteria.
Phytoplankton was also divided into two groups based on the possibility of its consumptionby zooplankton: nonedible microplankton and edible nanoplankon. Microplankton abundance
Fig 6. The abundance of phytoplankton groups in the investigated period (an example from the depth of 1 m).
doi:10.1371/journal.pone.0124738.g006
Phytoplankton in Restored Reservoir versus Physico-Chemical Variables
PLOS ONE | DOI:10.1371/journal.pone.0124738 April 23, 2015 9 / 22
varied from 70.0 to 58.0 103 spec. in 1 ml. Nanoplankton was less abundant and ranged from52 to 25.7 spec. ml-1. On the other hand, in the biomass of these two size fractions, microplank-ton ranged from 0.15 to the value of 61.74 μg ml- 1, while nanoplankton ranged from 0.02 to9.40 μg ml—1.
The differences of the values of abundances and biomass of phytoplankton from the fourstudied years were statistically significant (ANOVA Kruskal-Wallis test, p< 0.01).
Zooplankton143 zooplankton taxa were determined in total of which 97 were rotifers, 28 cladocerans and18 copepods. Rotifers were the most abundant zooplankton group, they amount to even morethan 99% in the abundance. The share of copepods and cladocerans was smaller, 48% and 40%,respectively (Fig 8). The abundance of filter feeders changed in subsequent years. The lowestabundance of cladorerans was found in 2011. Rotifer abundance increased in each growing sea-son, reaching two peaks: in May or June and August or September. Throughout the four-yearperiod the highest number of rotifers was found in September 2011 (more than 25 103 spec.l-1). The most numerous taxa were Synchaeta sp. (especially in September 2009), Keratellacochlearis Gosse and K. cochlearis f. tecta, Polyarthra dolichoptera Idelson, K. quadrataO. F.Müller, Anuraeopsis fissa Gosse (September 2010, 2011, 2012), Brachionus angularis Gosse (inJune 2011), Trichocerca pusilla Lauterborn and T. ruosseleti Voigt (June 2012), Filinia termina-lis Plate (May 2010). The most important respecting biomass of rotifers were Synchaeta pecti-nata Ehrenberg, Polyarthra dolichoptera, Asplanchna priodonta Gosse, Keratella quadrataMüller and Filinia longiseta Ehrenberg.
The average abundance of cladocerans and copepods in the first two years of the study wasat a similar level (approximately 100 spec. l-1). There was a significant decrease in their abun-dance in 2011 and the presence of cladocerans in the water column was recorded only sporadi-cally (Figs 8 and 9). In contrast, in 2011 copepods developed quite frequently, their averageannual value was even higher than in previous years. Cladocerans were recorded again in large
Fig 7. The biomass of phytoplankton groups in the investigated period (an example from the depth of 1 m).
doi:10.1371/journal.pone.0124738.g007
Phytoplankton in Restored Reservoir versus Physico-Chemical Variables
PLOS ONE | DOI:10.1371/journal.pone.0124738 April 23, 2015 10 / 22

numbers in 2012 and their average abundance in this year increased significantly compared tothe previous year.
The most abundant cladoceran species were Bosmina longirostris, B. coregoni, Daphniacucullata (especially from June to September 2010 and 2012), D. hyalina (May 2009), Chydorussp. (August 2012), Ch. sphaericus (August to September 2012), Diaphanosoma brachyurum(August 2011), Daphnia longispina and D. similis (May 2009 and June 2012). Cladocerans wererather rare in 2011, neither D. similis nor D. longispina nor D. hyalina were noted then.
Fig 8. Share of the abundance of zooplankton groups in Maltański Reservoir (an example from the depth of 2 m).
doi:10.1371/journal.pone.0124738.g008
Fig 9. The abundance of cladocerans and copepods (an example from the depth of 2 m).
doi:10.1371/journal.pone.0124738.g009
Phytoplankton in Restored Reservoir versus Physico-Chemical Variables
PLOS ONE | DOI:10.1371/journal.pone.0124738 April 23, 2015 11 / 22

Among the most frequently represented copepod taxa were:Mesocyclops leuckarti (April2012, August 2010), Thermocyclops oithonoides (most often listed in the period from July toSeptember in all four years of study), Acanthocyclops vermicularis (July-September 2011)Acanthocyclops sp. and Cyclops vicinus. Filter feeding copepods such as Eudiaptomus e.g. E.gracilis were recorded mainly in the period from April to May 2009. Their presence in the re-maining years was only sporadic.
Cladocerans such as Daphnia cucullata, D. similis, D. hyalina D. longispina and a predatoryspecies Leptodora kindtii had the largest share in the total biomass. Among the copepods, juve-nile forms were of the highest biomass, i.e. copepodites and Cyclops furcifer and C. vicinus.
Phytoplankton vs. variables directly connected with restoration(zooplankton filter feeders, zooplankton predators, NH4-N, PO4-P)The ordination diagram of RDA showed relationships between the biomass of phytoplanktonsize fractions and taxonomic groups versus selected environmental factors and zooplanktongrazing pressure, directly dependent on restoration measures (Figs 10 and 11). Both nano- andmicrophytoplankton were negatively correlated with zooplankton filter feeders and positivelywith zooplanktonic predators and NH4-N. No significant correlation between nano- andmicrophytoplankton and PO4-P was noted. The 4 variables explain only 13.1% of variance inthe studied relationships. The Monte Carlo test showed that not all the factors were equally im-portant (Fig 10A and Table 2).
Phytoplankton individual taxonomic groups were negatively correlated with zooplanktonfilter feeders. Such groups as diatoms, euglenophytes and dinophytes were positively correlatedwith zooplankton predators and NH4-N. Cyanobacteria and chlorophytes in particular werepositively correlated with PO4-P. The 4 variables explain 12.8% of variance in the studied rela-tionships. The Monte Carlo test showed that all 4 factors were statistically significant (Fig 10Band Table 2B).
Individual taxa were also influenced by nutrients and zooplankton. For example, species be-longing to cyanobacteria: Aphanizomenon gracile, Cuspidothrix issatschenkoi, Planktothrixagardhii and Pseudanabaena limnetica were positively correlated with NH4-N and PO4-P andzooplankton predators (Fig 10C and Table 2C). Most of the taxa were negatively correlatedwith zooplankton filter feeders but such green algae as Oocystis lacustris, Pediastrum boryanumand Oocystis marssonii were positively correlated with filter feeders. Small sized Tetraedronminimum, Rhodomonas lacustris, and bigger Scenedesmus acuminatus, Koliella spiculiformis,Fragilaria crotonensis,Monoraphidium contortum, Nitzschia acicularis were negatively corre-lated with zooplankton filter feeders. The ordination diagram of RDA explains 15.8% of vari-ance of phytoplankton taxa.
Phytoplankton vs. environmental variables independent of therestoration measures (rotifers+nauplii, temperature, conductivity,oxygen saturation, BOD5, organic nitrogen, NO3-N and NO2-N)Nano- and microphytoplankton were positively correlated with BOD5 and water oxygen satu-ration and negatively with conductivity. These size groups of phytoplankton were not correlat-ed with smaller zooplankton (rotifers+nauplii), temperature, pH, organic nitrogen, NO3-N andNO2-N (p>0,05, Fig 11A and Table 3A). The ordination diagram of RDA explains 27.9% ofvariance of the phytoplankton size groups.
Taxonomical groups e.g. diatoms, chrysophytes and cryptophytes were negatively correlatedwith organic nitrogen, conductivity and temperature. Chrysophytes were positively correlatedwith NO2-N. The ordination diagram of RDA explains 24.1% of variance of the phytoplankton
Phytoplankton in Restored Reservoir versus Physico-Chemical Variables
PLOS ONE | DOI:10.1371/journal.pone.0124738 April 23, 2015 12 / 22

Phytoplankton in Restored Reservoir versus Physico-Chemical Variables
PLOS ONE | DOI:10.1371/journal.pone.0124738 April 23, 2015 13 / 22
taxonomical groups. Taxonomical groups of phytoplankton were not correlated with NO3-Nand smaller zooplankton (p>0.05, Fig 11B and Table 3B).
Most of the considered taxa of phytoplankton were positively correlated with the tempera-ture e.g. Coelastrum astroideum, Tetraedron minimum, Desmodesmus opoliensis, Oocystislacustris. Other taxa: Erkenia subaequiciliata, Kolliella spiculiformis, Rhodomonas lacustriswere negatively correlated with the temperature. Cyanobacteria such as Aphanizomenon grac-ile, Pseudanabaena limnetica, Cuspidothrix issatschenkoi were positively correlated with smallzooplankton. Phytoplankton taxa did not correlate with pH and oxygen saturation (p>0,05,Fig 11C and Table 3C). The ordination diagram of RDA explains 38.0% of variance of thephytoplankton taxa.
DiscussionPhytoplankton is the first biological community to respond to environmental changes. There-fore, it was expected that as a result of MR restoration treatment a low density of phytoplank-ton and the disappearance of cyanobacteria bloom, which disqualified the reservoir as arecreational facility, would be achieved. Indeed, both seasonal changes of species compositionand abundance in the analysed period as well as differences between years have been con-firmed. Changes in the quantity and quality of the composition of phytoplankton in the fouryears of the study were significantly related to both restoration methods, biomanipulation andP-inactivation. As a consequence of the application of two methods of restoration, the abun-dance and biomass of phytoplankton was low, especially in the first two years following therefilling of the reservoir. Water transparency in the past had always been highest in the firstyear after the reservoir filling because the abundance of planktivorous fish was low [17]. As thereservoir was stocked with predatory fish, effectiveness of biomanipulation was also strongestat that time. The maximum abundance in the subsequent years of the study did not exceed29.0 �103 spec. ml-1 in 2009, 14.2�103 spec. ml-1 in 2010 and 10.6 �103 spec. ml-1 in 2012, whilein the past it often exceeded 30.0 �103 spec. ml-1 [25].
The decrease of phytoplankton abundance and its structural changes were certainly influ-enced by biomanipulation. Phytoplankton dynamics were strictly connected with the abun-dance and taxonomic composition of zooplankton (negative and positive correlations). Thegrowth of nanophytoplankton and most of the phytoplankton taxonomical groups, especiallythe most abundant green algae, diatoms and cyanobacteria, were effectively limited by zoo-plankton filter feeders, particularly large cladocerans observed in the years 2009, 2010 and2012 (negative correlation), particularly in May and June. A similar phenomenon of a highabundance of cladocerans, an increased abundance of Daphnia spp. and an increased
Fig 10. RDA biplot showing relationships between phytoplankton size fractions (a), taxonomicalgroups (b), the most abundant taxa and selected environmental factors directly dependent onrestoration measures (c). Abbreviations: cond-conductivity, ON-organic nitrogen, oxy-oxygen saturation,temp-temperature, R+n—rotifers and nauplii, FILT- filter feeders, PRED- predators, nono-nanophytoplankton, micro-microphytoplankton, Aph.gra.-Aphanizomenon gracile, Ast.for.-Asterionellaformosa, Aul.gran.-Aulacoseira granulata, centr- centric diatom, Chr.min.-Chrysococcus minutus., Chl.sp.-Chlamydomonas sp., Coe.ast.- Coelastrum astroideum, Cry.mar.- Cryptomonas marssonii, Cry. ova.-Cryptomonas ovata, Cry.ref.- Cryptomonas reflexa, Cus.iss.-Cuspidothrix issatschenkoi, Cru. tet.-Crucigenia tetrapedia, Des.com.- Desmodesmus communis, Des.opo.- Desmodesmus opoliensis, Din.div.-Dinobryon divergens, Erk.sub.-Erkenia subaequiciliata, Fra.cro.-Fragilaria crotonensis, Kol.spi.-Koliellaspiculiformis, Lim.red-Limnothrix redekei,Mon.con.-Monoraphidium contortum,Mon.min.- Monoraphidiumminutum, Nit.aci.- Nitszchia acicularis, Nit.clo.- Nitszchia acicularis var. closterioides, Nit. spp—Nitszchiaspp., Ooc.lac.- Oocystis lacustris, Ped.bor.- Pediastrum boryanum, Pha.lent.- Phacotus lenticularis, Pla.aga—Planktothrix agardhii, Rho.lac.- Rhodomonas lacustris, Sce.acu.- Scenedesmus acuminatus, Syn.uve.-Synura uvella, Uln.acu.- Ulnaria acus.
doi:10.1371/journal.pone.0124738.g010
Phytoplankton in Restored Reservoir versus Physico-Chemical Variables
PLOS ONE | DOI:10.1371/journal.pone.0124738 April 23, 2015 14 / 22

Phytoplankton in Restored Reservoir versus Physico-Chemical Variables
PLOS ONE | DOI:10.1371/journal.pone.0124738 April 23, 2015 15 / 22

zooplankton/phytoplankton ratio has been reported from other restored lakes [35–36]. Only inthe third year of the study was phytoplankton density in the MR high, reaching a maximum of60 thousand spec. ml-1. The probable explanation was that a large number of planktivorousfish entered the reservoir with the river water. During that time draining water from a prelimi-nary reservoir located upstream took place [10]. The pressure of planktivorous fish must havebeen so high that in 2011 large filter feeders were absent (especially D. similis, D. longispinaand D. hyalina) and the numbers of other daphnids were lowest in the period of the four-yearcycle. The low number of daphnids in 2011 can also be attributed to the intensive growth of cy-anobacteria. Many authors point out that the filtration apparatus of Daphniamay be cloggedby filamentous cyanobacteria [37].
Cyanobacterial taxa are considered to be unattractive food for zooplankton filtrators [34].On the other hand, the decrease in cladoceran abundance was possibly caused by the inhibitoryeffect of cyanocacteria due to the production of toxins. Daphnia species attempt to stay awayfrom toxic cyanobacteria [38]. It is also worth noting that in an experiment relating to the pres-ence of filamentous cyanobacteria in the water, large-size populations are converted to smallerones. Among cladocerans of the genus Daphnia, D. cucullata is considered to be the most resis-tant species. It may be favoured by its lower sensitivity to filament inhibition combined withlower susceptibility to fish predation [39]. This is confirmed by observations in the MR, inwhich the only species of the genus Daphnia in 2011 was D. cucullata. The fact that Daphnia isable to eliminate large bloom-forming cyanobacterial colonies effectively is known from the lit-erature, especially after being released from fish predation [40–41]. This was confirmed byRDA analysis in the present studies, in which Cyanobacteria were negatively correlated with
Fig 11. RDA biplot showing relationships between phytoplankton size fractions (a), taxonomicalgroups (b), the most abundant taxa and selected factors independent from the restorationmeasurments (c). Abbreviations the same as on Fig 10.
doi:10.1371/journal.pone.0124738.g011
Table 2. Forward selection results of Monte Carlo test of relationships between phytoplankton (sizefractions (a), taxonomical groups (b), the most abundant taxa (c)) and selected environmental factorsdirectly dependent on restoration measures.
Variable LambdaA P F
a nano-and microplankton
PRED 0.05 0.002 10.85
FILT 0.05 0.008 10.06
NH4 0.03 0.008 7.77
PO4 0.00 0.658 0.20
b taxonomical groups
NH4 0.04 0.004 7.58
PRED 0.02 0.006 5.32
FILT 0.04 0.006 8.12
PO4 0.03 0.006 6.83
c the most abundant taxa
PRED 0.10 0.002 22.28
FILT 0.02 0.030 4.96
NH4 0.02 0.024 5.24
PO4 0.02 0.054 3.51
Abbreviations: FILT- filter feeders, PRED- predators.
doi:10.1371/journal.pone.0124738.t002
Phytoplankton in Restored Reservoir versus Physico-Chemical Variables
PLOS ONE | DOI:10.1371/journal.pone.0124738 April 23, 2015 16 / 22

filter feeders, although the relation was not very strong. As an example Planktothrix agardhiiand Pseudanabaena limnetica were negatively correlated with zooplankton filter feeders. Thesetaxa could simultanously even be stimulated by zooplankton predators (positive correlation).Their nutrient excretions may cause an increase in phytoplankton biomass, as stated in Swar-zędzkie Lake [42–43].
A positive effect of biomanipulation on lessening the abundance of phytoplankton wasdemonstrated in the MR in 1993–1996 [17]. It was shown, however, that it is very difficult toachieve a spectacular long-term decline in phytoplankton abundance and biomass using thebiomanipulation procedure. There was a so-called feedback effect that significantly reduces theeffectiveness of biomanipulation. Therefore, an additional method of restoration was used inMR from 2005, aimed at phosphorus binding from the water column and depositing it in theform of insoluble salts in bottom sediments. The main aim of this chemical treatment was toremove the phosphorus loads available for phytoplankton. This method also failed to achieve along term decrease of phytoplankton abundance in the first years of its use [25]. In such
Table 3. Forward selection results of Monte Carlo test of relationships between a-phytoplankton sizefractions, b-taxonomical groups, c-the most abundant taxa and selected environmental factors inde-pendent from restoration measurements.
Variable LambdaA P F
a nano-and microplankton
cond 0.12 0.002 27.42
oxy 0.11 0.002 28.00
BOD5 0.02 0.010 6.90
NO3 0.01 0.064 2.89
ON 0.01 0.170 1.75
NO2 0.00 0.284 1.32
R+n 0.01 0.458 0.48
temp 0.00 0.462 0.51
pH 0.00 0.950 0.02
b taxonomical groups
cond 0.08 0.002 18.22
oxy 0.04 0.002 9.00
ON 0.03 0.002 6.37
pH 0.02 0.014 4.87
NO3 0.02 0.014 4.74
temp 0.02 0.014 4.58
BOD5 0.02 0.020 4.67
NO2 0.01 0.060 2.78
R+n 0.00 0.338 1.10
c the most abundant taxa
R+n 0.20 0.002 51.60
cond 0.04 0.002 9.74
ON 0.03 0.002 8.12
BOD5 0.04 0.008 10.24
temp 0.03 0.002 9.27
NO2 0.02 0.002 7.44
NO3 0.01 0.076 2.74
oxy 0.01 0.142 2.09
pH 0.00 0.310 1.06
doi:10.1371/journal.pone.0124738.t003
Phytoplankton in Restored Reservoir versus Physico-Chemical Variables
PLOS ONE | DOI:10.1371/journal.pone.0124738 April 23, 2015 17 / 22

throughflow lakes, the restoration activity should be continued due to the constant inflow ofnutrients from the catchment area (rainwater outlets). Similar situation were noted in other re-stored lakes eg Lake Rusałka, Swarzędzkie or Uzarzewskie [13, 45]. In those lakes water bloomsduring the summer and/or autumn were caused by intense external and internal nutrient load-ing. There were also examples of intense decreases of cyanobacterial abundance in relativelysmall and isolated lakes such as Trumen (Sweden) [5] or Lake Rauwbraken (The Netherlands)[18]. Cyanobacteria positively correlated with NH4-N and PO4-P in MR. Both parameters es-pecially influenced the larger phytoplankton (microplankton, positive correlation). This corre-lation was probably strongly influenced by the data from 2011, when the concentration ofammonium nitrogen clearly increasedExperiments carried out on several lakes in Poland andaround the world show that the most effective treatment is achieved by using several methodssimultaneously [10]. The use of chemicals (iron sulphate, magnesium chloride and Sinobent)not only results in the precipitation of phosphorus but also adversely affects the phytoplankton.As shown by Budzyńska [44], these chemical substances used in two water bodies affect thecyanobacterial filaments, shortening their lengths. This fact could facilitate their consumptionby cladocerans. The chemical treatment probably had the greatest influence on cyanobacteriaand green algae which positively correlated with PO4-P and NH4-N. The case study of Mal-tański Reservoir has demonstrated that the use of one restoration method was less effectivethan the simultaneous use of two methods. In 1993–96, when MR was restored with biomani-pulation only, phytoplankton abundance was higher and reached 15�103, 34�103, 72�103 and36�103 spec.ml-1 in subsequent years [17,45]. These values were much lower in the presentstudy due to the simultaneous use of the second method of restoration, with the exception of2011. The use of a chemical treatment causes an immediate effect, although its result is short-term. After a few weeks phytoplankton abundance returns to its former, pretreatment state.Similar experiences with this method have also been reported from other water bodies such asRusałka Reservoir and Lake Uzarzewskie by Budzyńska [44]. This phenomenon is caused bythe external load of nutrients continuously flowing to these lakes with waters fromtheir tributaries.
Statistical analyses indicated the importance of physico-chemical and biological environ-mental variables to be more significant than variables connected with restoration measures interms of influencing the abundance of phytoplankton. As expected, it was found that the bio-mass of different groups of phytoplankton was positively correlated with NO2-N, pH, oxygensaturation and BOD5 and negatively with conductivity.
Water temperature clearly influenced the development of various groups of phytoplankton.Many taxa, e.g. Coelastrum astroideum, Pediastrum boryanum, Desmodesmus opoliensis, posi-tively correlated with temperature. During the considered period in MR euglenophytes, chloro-phytes, dinophytes and xantophytes dominated, especially at higher temperatures, whileeuglenophytes, cryptophytes, diatoms and chrysophytes dominated at lower temperatures. Thedominance of a phytoplankton group is dependent on resistance to grazing, resistance to sedi-mentation and the ability to perform vertical migration [46]. It is believed that cyanobacteriahave the best chance to dominate the phytoplankton at higher water temperatures [47], al-though some studies do not support the hypothesis that cyanobacteria have higher optimumtemperatures for growth and higher growth rates than chlorophytes [48]. There are cyanobac-terial species e.g Planktothrix rubescens, P. agardhii orWoronichiania naegeliana that causewater blooms in autumn, in low temperatures [49–51]. Cyanobacteria also grew intensively inMR in the autumn, when the temperature dropped. Moreover, other groups of phytoplankton,especially green algae, dominated during the period of higher water temperature. The restora-tion treatments leading to a decline in phytoplankton abundance and biomass, especially of cy-anobacteria, were important there. Due to these treatments the abundance of cyanobacteria
Phytoplankton in Restored Reservoir versus Physico-Chemical Variables
PLOS ONE | DOI:10.1371/journal.pone.0124738 April 23, 2015 18 / 22

was lowest in September 2009, however, their percentage was highest (33%) at the same time.The most important cyanobacteria species were Pseudanabaena limnetica and Cuspidothrixissatschenkoi. The first belongs to Oscillatoriales and is resistant to shading and water mixing[52]. The second one is a species invasive to Polish algal flora [53–56]. Both species were ob-served in this reservoir from the seventies [57]. They are strictly related to the availability ofPO4-P (positive correlation, p = 0.05) and are able to form intense algal blooms [58]. In Sep-tember 2010, the presence of Aphanizomenon gracile was revealed in MR. These taxa are alsopotentially toxic species [59–60]. According to a study conducted by Mehnert et al. [61], inva-sive species have a higher growth rate than native species, which may explain the high share ofC. issatschenkoi in the first year of MR research. In turn, after the restoration of Lake Balaton[20, 61] the coexistence of A. gracile and an invasive species of blue-green algae was reported.Interestingly, during the analysed period the cyanobacterium Aphanizomenon flos-aquae,which is a taxon typical of this reservoir and which causes water blooms, was not recorded.This species appeared in the reservoir in previous periods in the first years after filling withwater, e.g. in 1993, when biomanipulation treatments were used for the first time in the reser-voir [17, 45] and in 2005, when an additional method of remediation—chemical treatment—was applied there [25].
An increasing amount of data is available on the concentration of toxins derived from cya-nobacteria in inland waters which are used as a source of drinking water or for recreationalpurposes [62–65]. Therefore, substantial restoration activities should be undertaken for theirelimination or restriction.
Some phytoplankton species can adapt to lower temperatures. The highest participation inthe abundance and biomass of phytoplankton in spring was noted in case of diatoms, chryso-phytes, cryptophytes and chlorophytes. These groups prefer lower temperatures (negative cor-relation,). This observation is consistent with the model of plankton succession (PEG) [47].Erkenia subaequiciliata, Dinobryon sociale, Rhodomonas lacustris, Koliella spiculiformis andChrysococcus sp were the most abundant species. These so-called R-species [66] tolerate lowlight intensity. Some of them are known to be successful in phosphorus-limited conditions dueto their mixotrophy, e.g. Dinobryon [67] or Rhodomonas [68]. All these species were positivelycorrelated in this study with conductivity, NO2-N, organic nitrogen, oxygen saturation andnegatively correlated with PO4-P concentration. They are species that maintain growth at a lowaverage light level and are tolerant of a well-mixed, poorly insolated environment. They werealso under high pressure from zooplankton filter feeders (negative correlation).
Larger phytoplankton taxa, not only cyanobacteria such as Aphanizomenon gracile, Pseuda-nabaena limnetica, Cuspidothrix issatschenkoi, but also Nitzschia sp., Fragilaria crotonensis,Scenedesmus acuminatus, could also be stimulated by the zooplankton, especially smaller ones(mostly rotifers). Most of the phytoplankton taxa were positively correlated with small zoo-plankton. The ordination diagram of variables that were not directly influenced by the restora-tion measures explained 38.0% of variance of the phytoplankton taxa, of which smallzooplankton explained 20% of variance (Table 3C).
Factors connected with restoration procedures had less influence than parameters indepen-dent of restoration. The ordination diagram of RDA in the case of factors connected with resto-ration displayed a smaller percentage of variance in the algal size fractions and/or taxaabundance than those independent of restoration. The listed parameters as well as many otherfactors which were not taken into account in this study affected the quantitative and qualitativecomposition of the phytoplankton in the reservoir.
The restoration in MR did not cause the spectacular decrease in the phytoplankton abun-dance. Supplies of nutrients from surface runoff are responsible for that so restoration shouldbe continued in this reservoir.
Phytoplankton in Restored Reservoir versus Physico-Chemical Variables
PLOS ONE | DOI:10.1371/journal.pone.0124738 April 23, 2015 19 / 22
Author ContributionsConceived and designed the experiments: AK. Performed the experiments: AK RD RG. Ana-lyzed the data: AK. Contributed reagents/materials/analysis tools: AK RG. Wrote the paper:AK.
References1. Gawrońska H, Łopata M, Jaworska B. The effectiveness of the phosphorus inactivation method in re-
ducing the trophy of lakes of different morphometric and hydrological features Limnol. Rev. 2007; 7(1):27–34.
2. Jaworska B, Dunalska J, Górniak D, Bowszys M. Phytoplankton dominance structure and abundanceas indicators of the trophic state and ecological status of Lake Kortowskie (northeast Poland) restoredwith selective hypolimnetic withdrawal Arch. Pol. Fish. 2014; 22 (1): 7–15.
3. Łopata M, Gawrońska H, Jaworska B, Wiśniewski G. Restoration of two shallow, urban lakes using thephosphorus inactivation method—Preliminary results. Water Sci. Technol. 2013; 68 (10): 2127–2135.doi: 10.2166/wst.2013.461 PMID: 24292458
4. Kozak A, Gołdyn R. Variation in phyto-and zooplankton of the restored Lake Uzarzewskie. Pol. J. Envi-ron. Stud. 2014; 23 (4): 1201–1209.
5. Cronberg G Changes in the phytoplankton of Lake Trummen induced by restoration. Hydrobiologia1982; 86: 185–193.
6. Cooke GD,Welch EB, Peterson S, Nichols SA. Restoration and Management of Lakes and Reservoirs,Third Edition, Taylor and Francis group; 2003. pp. 1–616.
7. Łopata M. Gawrońska H. Phosphorus immobilization in Lake Głęboczek following treatment with polya-luminum chloride Oceanol. Hydrobiol. Stud. 2008; 37 (2): 99–105
8. Gołdyn R, Podsiadłowski S, Kowalczewska-Madura K, Dondajewska R, Szelag-Wasielewska E, Bud-zyńska A, et al. Functioning of the Lake Rusałka ecosystem in Poznań (western Poland). Oceanol.Hydrobiol. Stud. 2010; 39 (3): 65–80.
9. Gołdyn R, Messyasz B, Domek P. WindhorstW., Hugenschmidt C., Nicoara M, et al. The response ofLake Durowskie ecosystem to restoration measures. Carpath. J. Earth Environ. Sci. 2013; 8 (3): 43–48.
10. Gołdyn R, Podsiadłowski S, Dondajewska R, Kozak A. The sustainable restoration of lakes—towardsthe challenges of theWater Framework Directive. Ecohydrol. Hydrobiol. 2014; 23 (4): 1201–1209.
11. Grochowska JK, Brzozowska R. The influence of different recultivation methods on the water buffer ca-pacity in a degraded urban lake. Knowledge and Management of Aquatic Ecosystems 2013; 410: Arti-cle no 1.
12. Kowalczewska-Madura K, Gołdyn R, Dondajewska R. Phosphorus release from the bottom sedimentsof Lake Rusałka (Poznań, Poland Oceanol. Hydrobiol. Stud. 2010; 39 (4): 135–144.
13. Kozak A, Kowalczewska-Madura K, Gołdyn R, Czart A. Phytoplankton composition and physico-chemi-cal properties in restored Swarzędzkie Lake—preliminary results. Arch. Pol. Fish. 2014; 22: 17–28.
14. Kozak A, Dondajewska R, Kowalczewska-Madura K, Gołdyn R, Holona T. Water Quality and phyto-plankton community in selected recreational lakes and reservoirs under restoration measures in West-ern Poland. Pol. J. Natur. Sc. 2013; 28 (2): 217–226.
15. Zamparas M, Zacharias I. Restoration of eutrophic freshwater by managing internal nutrient loads. A re-view. Sci. Total Environ. 2014; 496: 551–562. doi: 10.1016/j.scitotenv.2014.07.076 PMID: 25108796
16. BishopWM, McNabb T, Cormican I. Willis BE, Hyde S. Operational Evaluation of Phoslock PhosphorusLocking Technology in Laguna Niguel Lake, California. Water Air Soil Pollut. 2014; 225: 2018.
17. Kozak A, Gołdyn R. Zooplankton versus phyto- and bacterioplankton in the Maltanski Reservoir (Po-land) during an extensive biomanipulation experiment J. Plankton Res. 2004; 26 (1): 37–48.
18. Lürling M, van Oosterhout F. Controlling eutrophication by combined bloom precipitation and sedimentphosphorus inactivation. Water Res. 2013; 47: 6527–6537. doi: 10.1016/j.watres.2013.08.019 PMID:24041525
19. Moos MT, Taffs KH, Longstaff BJ, Ginn BK. Establishing ecological reference conditions and trackingpost-application effectiveness of lanthanum-saturated bentonite clay (Phoslock) for reducing phospho-rus in aquatic systems: An applied paleolimnological approach. J. Environ. Manage. 2014; 141: 77–85.doi: 10.1016/j.jenvman.2014.02.038 PMID: 24768837
20. Padisak J, Reynolds CS. Selection of phytoplankton associations in Lake Balaton, Hungary, in re-sponse to eutrophication and restoration measures, with special reference to the cyanoprokaryotes.Hydrobiologia 1998; 384: 41–53.
Phytoplankton in Restored Reservoir versus Physico-Chemical Variables
PLOS ONE | DOI:10.1371/journal.pone.0124738 April 23, 2015 20 / 22
21. Shapiro J, Lamarra V, Lynch M. Biomanipulation, an ecosystem approach to lake restoration., In Brezo-nik P.L. J.L Fox (Eds.), Proceedings Symposium onWater quality management through biological con-trol. Univ. Florida Gainsville; 1991: 85–96.
22. Gołdyn R, Kozak A, Romanowicz W. Food-webmanipulation in the Maltański Reservoir. Hydrobiologia,1997; 342–343: 327–333.
23. Benndorf J. Conditions for effective biomanipulation; conclusions derived from whole-lake experimentsin Europe. Hydrobiologia, 1990; 200–201 (1): 187–203.
24. Jeppesen E, Jensen JP, Søndergaard M, Lauridsen T, Pedersen LJ, Jensen L. Top-down control infreshwater lakes: The role of nutrient state, submerged macrophytes and water depth. Hydrobiologia,1997; 342–343: 151–164.
25. Kozak A. Phytoplankton in the restored Maltański Reservoir in the years 2005–2006. Teka Kom. Ochr.Kszt. Środ. Przyr. 2007; 4: 7–13.
26. Elbanowska H, Zerbe J, Siepak J. Physico-chemical water analyses [Fizyczno-chemiczne badaniewód] (in Polish). UAM Publ., Poznań; 1999.
27. Wetzel RG, Likens GE. Limnological Analyses. Springer Verlag, New York. 1991.
28. Bottrell HM, Duncan A, Gliwicz ZM, Grygierek A, Herzig A, Hillbricht-Ilkowska H, et al. A review of someproblems in zooplankton production studies—Norw. J. Zool. 1976; 24: 419–456.
29. Ejsmont-Karabin J. Empirical equations for biomass calculation of planktonic rotifers, Pol. Arch. Hydro-biol. 1998; 45: 513–522.
30. Radwan S (ed.). Freshwater fauna of Poland [Fauna słodkowodna Polski] (in Polish). 32 A, B., PolskieTowarzystwo Hydrobiologiczne, Uniwersytet Łódzki, OficynaWydawnicza Tercja, Łódź; 2004.
31. Shannon CE, Weaver W. The Mathematical Theory of Communication, University of Illinois Press, Ur-bana; 1949.
32. ter Braak CJF, Smilauer P. CANOCO reference manual and CanoDraw for Windows user's guide: soft-ware for canonical community ordination (version 4.5). TNO Institute of Applied Computer Science,Wageningen; 2002.
33. Knoechel R, Holtby LB. Cladoceran filtering rate: body length relationship for bacterial and large algalparticles. Limnol. Oceanogr. 1986; 31: 195–200.
34. Lampert W. The relationship between zooplankton biomass and grazing: a review. Limnologica (Berlin)1988; 19: 11–20.
35. Chen F, Shu T, Jeppesen E, Liu Z, Chen Y. Restoration of a subtropical eutrophic shallow lake inChina: Effects on nutrient concentrations and biological communities. Hydrobiologia 2013; 718 (1):59–71
36. Jeppesen E, Søndergaard M, Meerhoff M, Lauridsen TL, Jensen JP. Shallow lake restoration by nutri-ent loading reduction—Some recent findings and challenges ahead. Hydrobiologia, 2007; 584 (1):239–252.
37. Bednarska A, Dawidowicz P. Change in filter-screen morphology and depth selection: Uncoupled re-sponses of Daphnia to the presence of filamentous cyanobacteria. Limnol. Oceanogr. 2007; 52 (6):2358–2363.
38. Forsyth DJ, James M R, Cryer M. Alteration of seasonal and dial patterns in vertical migration of zoo-plankton by Anabaena and planktivorous fish. Arch. Hydrobiol. 1990; 117: 385–404.
39. Hawkins P, Lampert W. The effect of Daphnia body size on filtering rate inhibition in the presence of afilamentous Cyanobacterium. Limnol.Oceanogr. 1989; 34(6): 1084–1089.
40. Kurmayer R. Competitive ability of Daphnia under dominance of non-toxic filamentous cyanobacteria.Hydrobiologia 2001; 442: 279–289.
41. Sarnelle O. Initial conditions mediate the interaction between Daphnia and bloom-forming cyanobacte-ria. Limnol. Oceanogr. 2007; 52 (5): 2120–2127.
42. Gołdyn R, Kowalczewska-Madura K. Interactions between phytoplankton and zooplankton in the hy-pertrophic Swarzedzkie Lake in western Poland. J. Plankton Res. 2008; 30 (1): 33–42.
43. Kowalczewska-Madura K, Gołdyn R. Models of phosphorus turn-over in a hypertrophic Lake: The LakeSwarzedzkie case study. Oceanol. Hydrobiol. Stud. 2010; 39 (3): 21–33.
44. Budzyńska A. Changes in the phytoplankton of two lakes under the influence of iron treatment restora-tion. [Zmiany w fitoplanktonie dwóch jezior pod wpływem rekultywacji z użyciem siarczanu żelaza] (inPolish). PhD thesis, AdamMickiewicz University; 2010.
45. Kozak A. Seasonal changes occurring over four years in a reservoir's phytoplankton composition. Pol.J. Environ. Stud., 2005; 14 (4): 451–465.
Phytoplankton in Restored Reservoir versus Physico-Chemical Variables
PLOS ONE | DOI:10.1371/journal.pone.0124738 April 23, 2015 21 / 22
46. Sommer U, Gliwicz ZM, Lampert W, Duncan A. The PEG-model of succession of planktonic events infresh waters. Arch. Hydrobiol. 1986; 106: 433–471.
47. Elliott JA. Is the future blue-green? A review of the current model predictions of how climate changecould affect pelagic freshwater cyanobacteria. Water Res. 2012; 46 (5): 1364–1371. doi: 10.1016/j.watres.2011.12.018 PMID: 22244968
48. Lürling M, Eshetu F, Faassen EJ, Kosten S, Huszar VLM. Comparison of cyanobacterial and greenalgal growth rates at different temperatures. Freshwater Biology 2013; 58: 552–559. doi: 10.1016/j.archoralbio.2012.06.001 PMID: 22749497
49. Wilk-Woźniak E, Mazurkiewicz-BorońG. The autumn dominance of cyanoprokaryotes in a deep meso-eutrophic submontane reservoir. Biologia 2003; 58, 1: 17–24
50. Walsby A E, Schanz F, Schmid M. The Burgundy-blood phenomenon: A model of buoyancy change ex-plains autumnal waterblooms by Planktothrix rubescens in Lake Zürich. New Phytol. 2006; 169, 1:109–122. PMID: 16390423
51. Pawlik-Skowrońska B, Toporowska M. Blooms of toxin-producing Cyanobacteria—A real threat insmall dam reservoirs at the beginning of their operation. Oceanol. Hydrobiol. Stud. 2011; 40, 4: 30–37.
52. Mischke U. Cyanobacteria associations in shallow polytrophic lakes: influence of environmental fac-tors. Acta Oecol. 2003; 24: 11–23.
53. Stefaniak K, Kokocinski M. Occurrence of invasive Cyanobacteria species in polimictic lakes of theWielkopolska region (western Poland). Oceanol. Hydrobiol. Stud., 2005; 34(Suppl. 3), 137–148.
54. Pełechata A, Pełechaty M, Pukacz A. Cyanoprokaryota of shallow lakes of Lubuskie Lakeland (mid-western Poland). Oceanol. Hydrobiol. Stud. 2006; 35, 1: 3–14.
55. Kobos J, Błaszczyk A, Hohlfeld N, Toruńska-Sitarz A, Krakowiak A, Hebel A, et al. Cyanobacteria andcyanotoxins in Polish freshwater bodies. Oceanol. Hydrobiol. Stud. 2013; 42(4):358–378.
56. Wilk-Woźniak E, Najberek K. Towards clarifying the presence of alien algae in inland waters—can wepredict places of their occurrence? Biologia 2013; 68/5: 838–844
57. Stefko B. Fitoplankton Jeziora Maltańskiego. In Dąmbska, I. (ed.) Fitoplankton sztucznych jezior poło-żonych na terenie Poznania [Phytoplankton of manmade lakes located in Poznań] (in Polish). PTPN,Prace Kom. Biol. 1976; 42: 55–117.
58. Rojo C, Alvarez Cobelas M. Population dynamics of Limnothrix redekei, Oscillatoria lanceaeformis,Planktothrix agardhii and Pseudanabaena limnetica (cyanobacteria) in a shallow hypertrophic lake(Spain). Hydrobiologia, 1994; 275–276 (1): 165–171.
59. Kopp R, Mareš J, Palíková M, Navrátil S, Kubíček Z, Ziková A, et al. Biochemical parameters of bloodplasma and content of microcystins in tissues of common carp (Cyprinus carpio L.) from a hypertrophicpond with cyanobacterial water bloom: Review Article, Aquaculture Res. 2009; 40 (15): 1683–1693.
60. Hodoki Y, Ohbayashi K, Kobayashi Y Okuda N, Nakano I. Detection and identification of potentiallytoxic cyanobacteria: Ubiquitous distribution ofMicrocystis aeruginosa andCuspidothrix issatschenkoiin Japanese lakes. Harmful Algae 2012; 16: 9.
61. Mehnert G, Leunert F, Cirés S, Jöhnk D, Rücker J, Nixdorf B, et al. Competitiveness of invasive and na-tive cyanobacteria from temperate freshwaters under various light and temperature conditions. J.Plankton Res. 2010; 32 (7): 1009–1021.
62. Ballot A, Fastner J, Lentz M, Wiedner C. First report of anatoxin-a-producing cyanobacterium Aphani-zomenon issatschenkoi in northeastern Germany. Toxicon 2010; 56 (6): 964–971. doi: 10.1016/j.toxicon.2010.06.021 PMID: 20615427
63. Zagajewski P, Gołdyn R, FabiśM.Water blooms and their toxicity in public swimming areas of lakes inthe Poznań district. Oceanol. Hydrobiol. Stud. 2007; 36 (1): 181–187.
64. Zagajewski P, Gołdyn R, FabiśM. Cyanobacterial volume and microcystin concentration in recreationallakes (Poznań—Western Poland). Oceanol. Hydrobiol. Stud. 2009; 38 (2): 113–120.
65. Kokociński M, Mankiewicz-Boczek J, Jurczak T, Spoof L, Meriluoto J, Rejmonczyk E, et al. Aphanizo-menon gracile (Nostocales), a cylindrospermopsin-producing cyanobacterium in Polish lakes. Environ.Sci. Pollut. Res. 2013; 20 (8): 5243–5264.
66. Reynolds CS, Huszar V, Kruk C, Naselli-Flores L, Melo S. Towards a functional classification of thefreshwater phytoplankton. J. Plankton Res. 2002; 24 (5): 417–428.
67. Kangro K, Laugaste R, Nõges P, Ott I. Long-term changes and seasonal development of phytoplanktonin a strongly stratified, hypertrophic lake In: I. Ott and T. Ko˜iv (eds), Lake Verevi, Estonia—A HighlyStratified Hypertrophic Lake. Hydrobiologia 2005; 547: 91–10.
68. Hammer A, Schumann R, Schubert H. Light and temperature acclimation of Rhodomonas salina (cryp-tophyceae): Photosynthetic performance. Aquat. Microb. Ecol. 2002; 29 (3): 287–296.
Phytoplankton in Restored Reservoir versus Physico-Chemical Variables
PLOS ONE | DOI:10.1371/journal.pone.0124738 April 23, 2015 22 / 22