
PHYSIOLOGIC INSTRUMENTATION IN THE NAVAL AIR … 4.3 Air Vehicle Department 4.4 Propulsion and Power...
50
Report No. NAWCADWAR-9500Ö-4.6 PHYSIOLOGIC INSTRUMENTATION IN THE NAVAL AIR WARFARE CENTER HUMAN-USE CENTRIFUGE TO DETERMINE THE EFFECTS OF CUMULATIVE +Gz ON COGNITIVE PERFORMANCE Estrella M. Forster, M.S., Jeffrey G. Morrison, Ph.D. and Edward M. Hitchcock, B.S. Engineering Corp. Human Systems Engineering Division (Code 4.6.4.1) NAVAL AIR WARFARE CENTER AIRCRAFT DIVISION WARMINSTER P.O. Box 5152 Warminster, PA 18974-0591 Mark W. Scerbo, Ph.D. OLD DOMINION UNIVERSITY DEPARTMENT OF PSYCHOLOGY Norfolk, VA 23529 1 OCTOBER 1994 ^ELECTEfl ^AUQjaaiaaa | ^ FINAL REPORT Period Covering January 1993 to May 1994 Approved for Public Release; Distribution is Unlimited. Prepared for Engineering Group Human Systems Engineering Division (Code 4.6) NAVAL AIR WARFARE CENTER AIRCRAFT DIVISION WARMINSTER P.O. Box 5152 Warminster, PA 18974-0591 19950821 032
Transcript of PHYSIOLOGIC INSTRUMENTATION IN THE NAVAL AIR … 4.3 Air Vehicle Department 4.4 Propulsion and Power...

Report No. NAWCADWAR-9500Ö-4.6
PHYSIOLOGIC INSTRUMENTATION IN THE NAVAL AIR WARFARE CENTER HUMAN-USE CENTRIFUGE TO DETERMINE THE EFFECTS OF CUMULATIVE +Gz ON COGNITIVE PERFORMANCE
Estrella M. Forster, M.S., Jeffrey G. Morrison, Ph.D. and Edward M. Hitchcock, B.S. Engineering Corp. Human Systems Engineering Division (Code 4.6.4.1) NAVAL AIR WARFARE CENTER AIRCRAFT DIVISION WARMINSTER P.O. Box 5152 Warminster, PA 18974-0591
Mark W. Scerbo, Ph.D. OLD DOMINION UNIVERSITY DEPARTMENT OF PSYCHOLOGY Norfolk, VA 23529
1 OCTOBER 1994
^ELECTEfl ^AUQjaaiaaa | ^
FINAL REPORT Period Covering January 1993 to May 1994
Approved for Public Release; Distribution is Unlimited.
Prepared for Engineering Group Human Systems Engineering Division (Code 4.6) NAVAL AIR WARFARE CENTER AIRCRAFT DIVISION WARMINSTER P.O. Box 5152 Warminster, PA 18974-0591
19950821 032

DISCLAIMS! NOTICE
THIS DOCUMENT IS BEST
QUALITY AVAILABLE. THE COPY
FURNISHED TO DTIC CONTAINED
A SIGNIFICANT NUMBER OF
COLOR PAGES WHICH DO NOT
REPRODUCE LEGIBLY ON BLACK
AND WHITE MICROFICHE.
NOTICES
REPORT NUMBERING SYSTEM - The numbering of technical project reports issued by the Naval Air Warfare Center, Aircraft Division, Warminster is arranged for specific identification purposes. Each number consists of the Center acronym, the calendar year in which the number was assigned, the sequence number of the report within the specific calendar year, and the official 2- digit correspondence code of the Functional Department responsible for the report. For example: Report No. NAWCADWAR-95010-4.6 indicates the tenth Center report for the year 1995 and prepared by the Crew Systems Engineering Department. The numerical codes are as follows.
Code Department
4.1 Systems Engineering Department
4.2 Cost Analysis Department
4.3 Air Vehicle Department
4.4 Propulsion and Power Department
4.5 Avionics Department
4.6 Crew Systems Engineering Department
4.10 Cone. Analy., Eval. and Plan (CAEP) Department
PRODUCT ENDORSEMENT - The discussion or instructions concerning commercial products herein do not constitute an endorsement by the Government nor do they convey or imply the license or right to use such products.
Reviewed By:
Reviewed By:
^zfv-eJ/A. If/I -fam-trz^ Date: ^//f^ Author/COTR
0^ TlutfjJ/ Date:>/^7/?5 LEVEL III Manager

REPORT DOCUMENTATION PAGE Form Approved
OMB No. 0704-0188
Public reporting burden for this collection of information is estimated to average 1 hour per response, including the time for reviewing instructions, searching existing data sources, gathering and maintaining the data needed, and completing and reviewing the collection of Information. Send comments regarding this burden estimate or any other aspect of this collection of information, including suggestions for reducing this burden, to Washington Headquarters Services, Directorate for information Operations and Reports, 1215 Jefferson Davis Highway, Suite 1204, Arlington, VA 22202-4302, and to the Office of management and Budget, Paperwork Reduction Project (0704-0188), Washington, DC 20503.
1. AGENCY USE ONLY (Leave blank) 2. REPORT DATE
1 OCT 1994 3. REPORT TYPE AND DATES COVERED
FINAL 1/93 - 5/94 4. TITLE AND SUBTITLE
PHYSIOLOGIC INSTRUMENTATION IN THE NAVAL AIR WARFARE CENTER HUMAN-USE CENTRIFUGE TO DETERMINE THE EFFECTS OF CUMULATIVE +Gz ON COGNITIVE PERFORMANCE
5. FUNDING NUMBERS
6. AUTHOR(S)
*Estrella M. Forster, M.S., Jeffrey G. Morrison, Ph.D., and Edward M. Hitchcock, B.S.
** Mark W. Scerbo, Ph.D. 7. PERFORMING ORGANIZATION NAME(S) AND ADDRESS(ES)
Engineering Group, Human Systems Engineering Division (Code 4.6.4.1) NAVAL AIR WARFARE CENTER; AIRCRAFT DIVISION WARMINSTER P.O. Box 5152 Warminster, PA 18974-0591
8. PERFORMING ORGANIZATION REPORT NUMBER
N AWC AD WAR-95006-4.6
9. SPONSORING / MONITORING AGENCY NAME(S) AND ADDRESS(ES)
* Engineering Group, Human Systems Engineering Division (Code 4.6) NAVAL AIR WARFARE CENTER; AIRCRAFT DIVISION WARMINSTER P.O. Box 5152 Warminster, PA 18974-0591
10. SPONSORING /MONITORING AGENCY REPORT NUMBER
11. SUPPLEMENTARY NOTES
"MarkW. Scerbo, Ph.D. OLD DOMINION UNIVERSITY; DEPARTMENT OF PSYCHOLOGY Norfolk, VA 23529
12a. DISTRIBUTION /AVAILABILITY STATEMENT
APPROVED FOR PUBLIC RELEASE; DISTRIBUTION IS UNLIMITED.
12b.DISTRIBUTION CODE
13. ABSTRACT (Maximum 200 words}
A study to determine the effect of intermittent periods of positive acceleration (+Gz) on human physiology and cognitive performance was accomplished at the Naval Air Warfare Center (NAWC) human-use centrifuge. This report discusses the materials and methods utilized to obtain various physiologic measures during this study: electroencephalogram (EEG); electrooculogram (EOG); electromyogram (EMG); infrared plethysmography (IRP); electrocardiogram (ECG); and respiration rate (RM). The methods discussed herein are specific to the NAWC centrifuge and may serve as a guide for future research.
14. SUBJECT TERMS
POSITIVE ACCELERATION (+Ge)
15. NUMBER OF PAGES
16. PRICE CODE
17. SECURITY CLASSIFICATION OF REPORT
UNCLASSIFIED
18. SECURITY CLASSIFICATION OF THIS PAGE
UNCLASSIFIED
19. SECURITY CLASSIFICATION OF ABSTRACT
UNCLASSIFIED
20. LIMITATION OF ABSTRACT
SAR NSN 7540-01-280-5500 Standard Form 298 (Rev. 2-89)
Prescribed by ANSI Std. Z39-18 298-102

NAWCADWAR-95006-4.6
ACKNOWLEDGMENTS
This report could not have been possible without the aid of codes 4.6.4.1, 4.6.4.2, and 4.6.2.4 of the Naval Air Warfare Center, Aircraft Division, Warminster, PA.
!©33S3iss Fe
^ me TAU □
J"£tlfieatIon____
NAWCADWAR-95006-4.6
CONTENTS
Page
ACKNOWLEDGMENTS 2
LIST OF FIGURES 4
ABSTRACT 6
I. INTRODUCTION 7
II. METHOD 7
III. ELECTROENCEPHALOGRAM (EEG) 7
IV. ELECTROOCULOGRAM(EOG) 10
V. ELECTROM YOGRAM (EMG) 11
VI. ELECTROCARDIOGRAM (ECG) 13
VII. INFRARED P L E T H Y S M O G R A M (IRP) 14
VIII. RESPIRATION MONITOR (RM) 15
IX. BIBLIOGRAPHY 17
APPENDIX: Sources 19
FIGURES 21
NAWCADWAR-95006-4.6
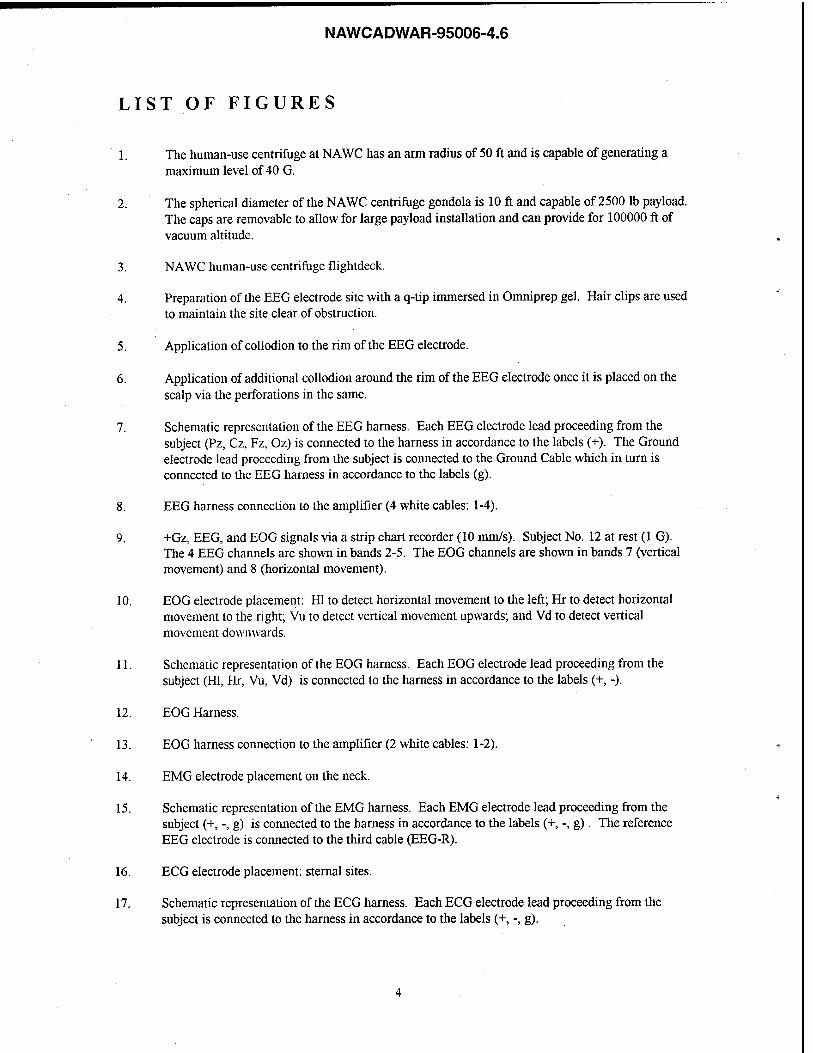
LIST OF FIGURES
1. The human-use centrifuge at NAWC has an arm radius of 50 ft and is capable of generating a maximum level of 40 G.
2. The spherical diameter of the NAWC centrifuge gondola is 10 ft and capable of 2500 lb payload. The caps are removable to allow for large payload installation and can provide for 100000 ft of vacuum altitude.
3. NAWC human-use centrifuge flightdeck.
4. Preparation of the EEG electrode site with a q-tip immersed in Omniprep gel. Hair clips are used to maintain the site clear of obstruction.
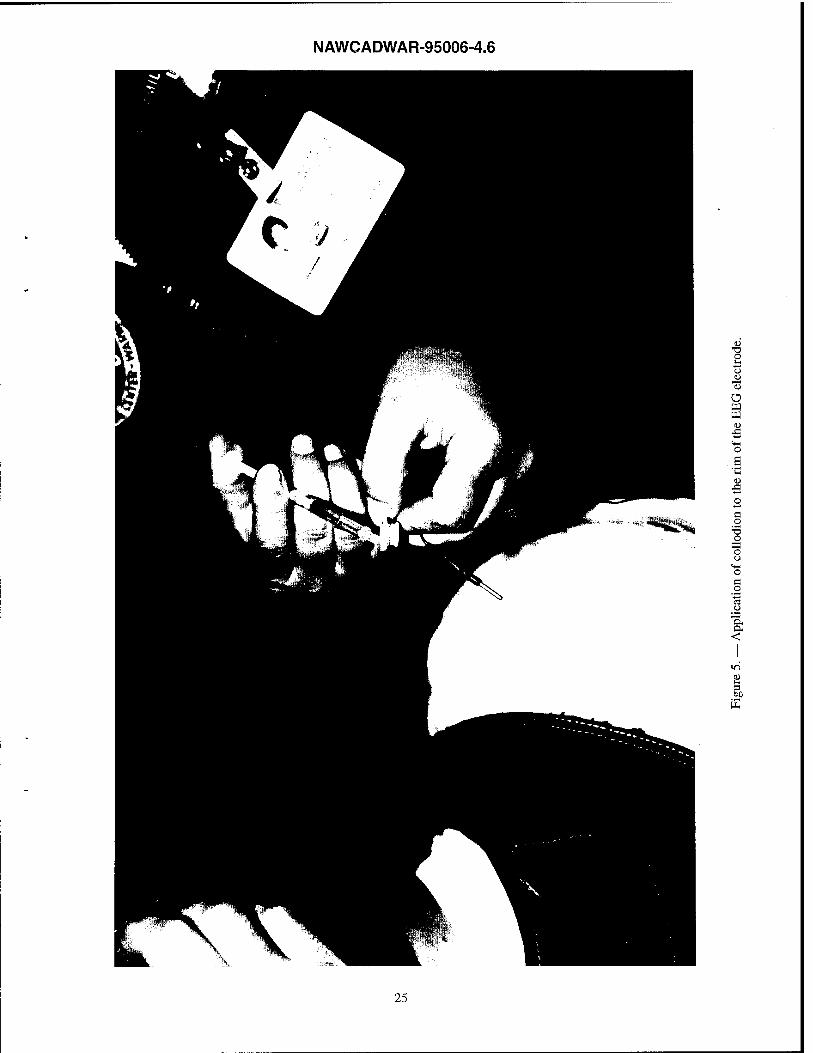
5. Application of collodion to the rim of the EEG electrode.
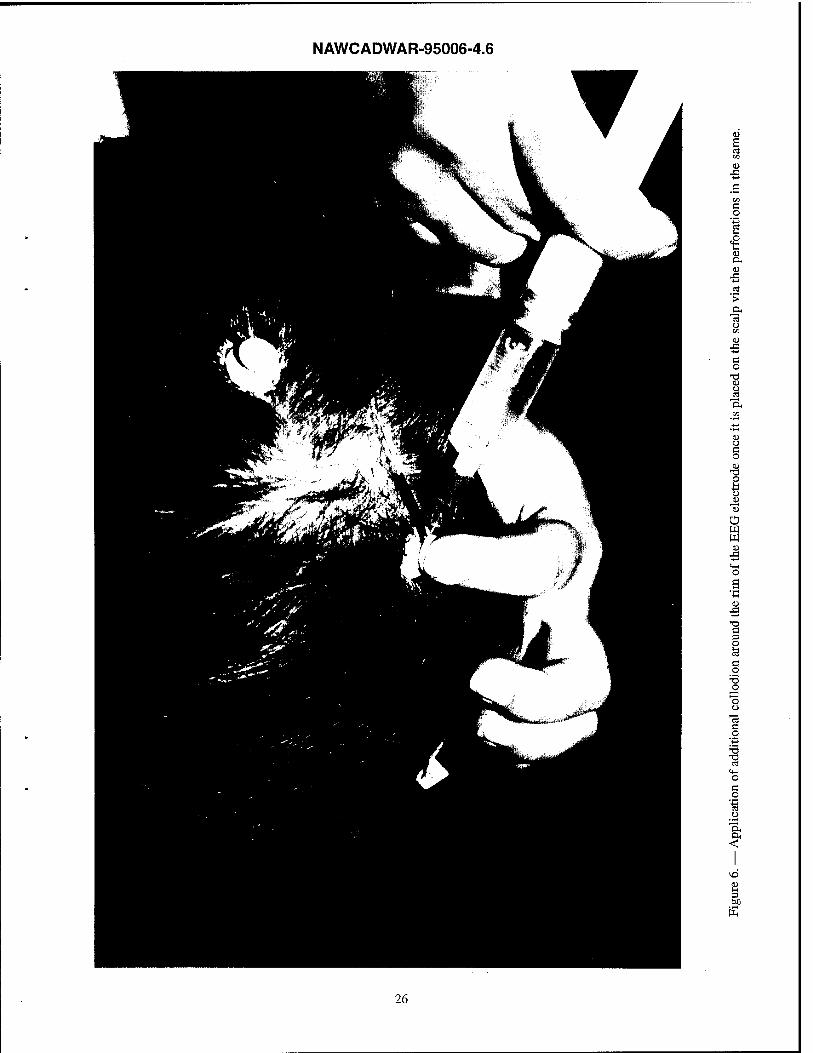
6. Application of additional collodion around the rim of the EEG electrode once it is placed on the scalp via the perforations in the same.
7. Schematic representation of the EEG harness. Each EEG electrode lead proceeding from the subject (Pz, Cz, Fz, Oz) is connected to the harness in accordance to the labels (+). The Ground electrode lead proceeding from the subject is connected to the Ground Cable which in turn is connected to the EEG harness in accordance to the labels (g).
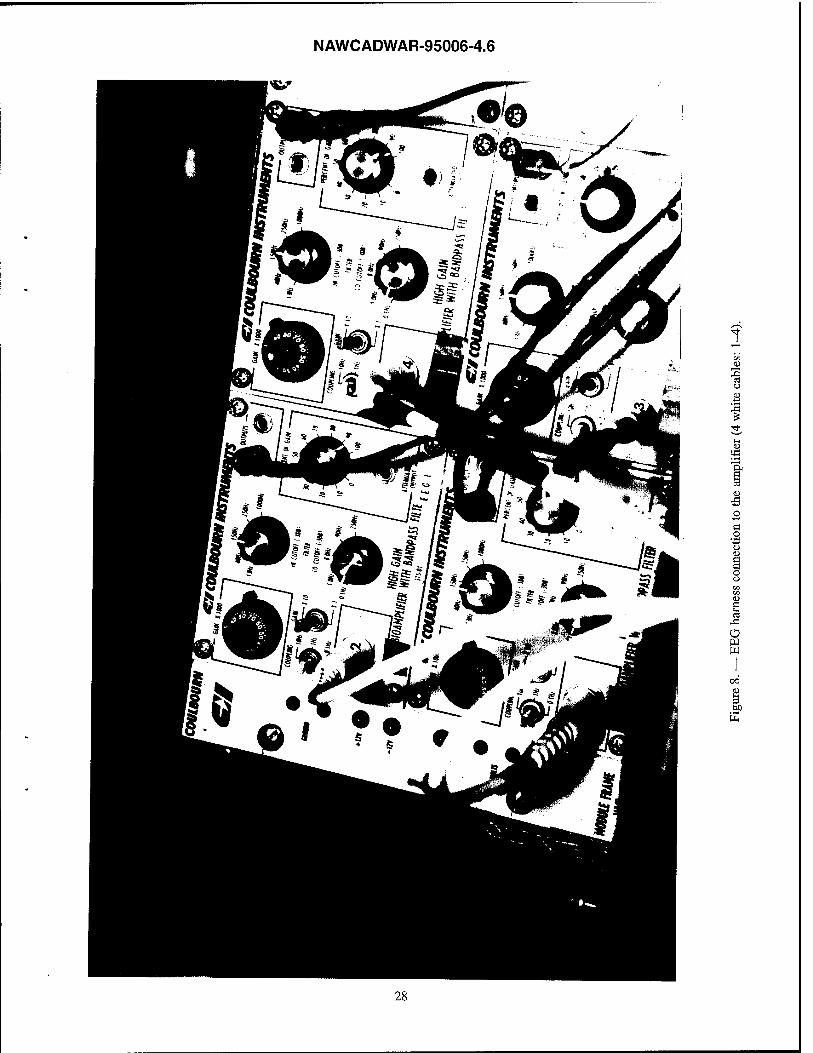
8. EEG harness connection to the amplifier (4 white cables: 1-4).
9. +Gz, EEG, and EOG signals via a strip chart recorder (10 mm/s). Subject No. 12 at rest (1 G). The 4 EEG channels are shown in bands 2-5. The EOG channels are shown in bands 7 (vertical movement) and 8 (horizontal movement).
10. EOG electrode placement: HI to detect horizontal movement to the left; Hr to detect horizontal movement to the right; Vu to detect vertical movement upwards; and Vd to detect vertical movement downwards.
11. Schematic representation of the EOG harness. Each EOG electrode lead proceeding from the subject (HI, Hr, Vu, Vd) is connected to the harness in accordance to the labels (+, -).
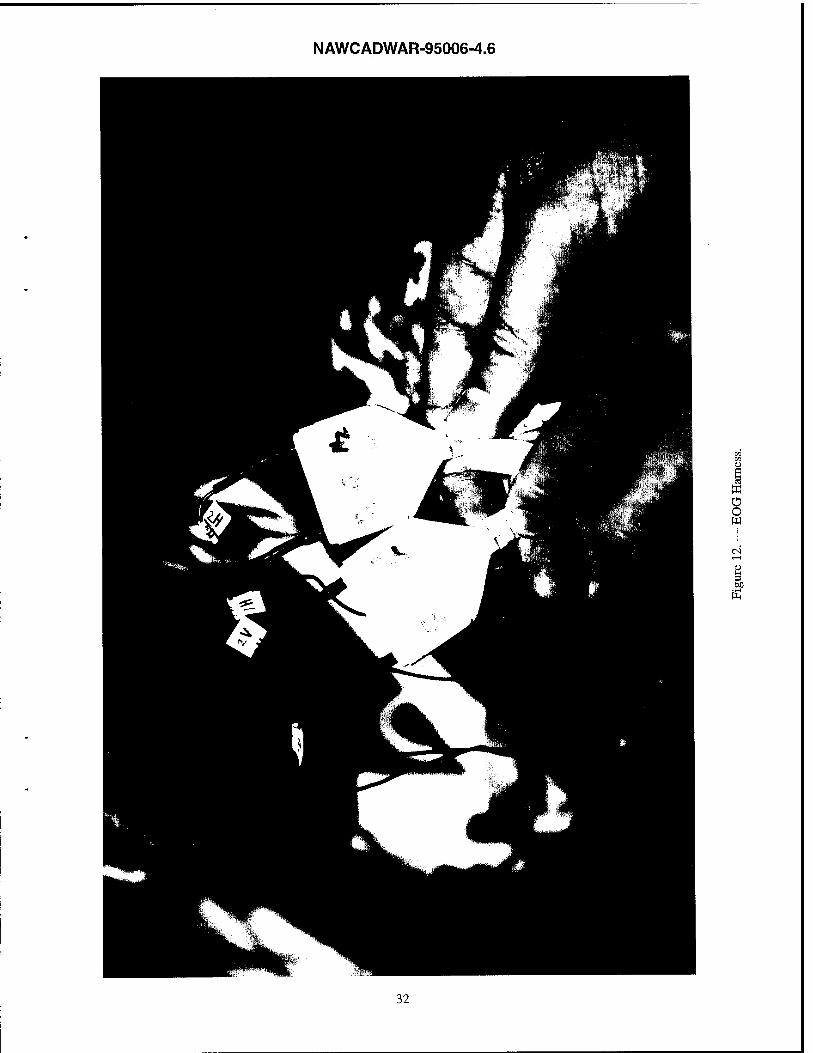
12. EOG Harness.
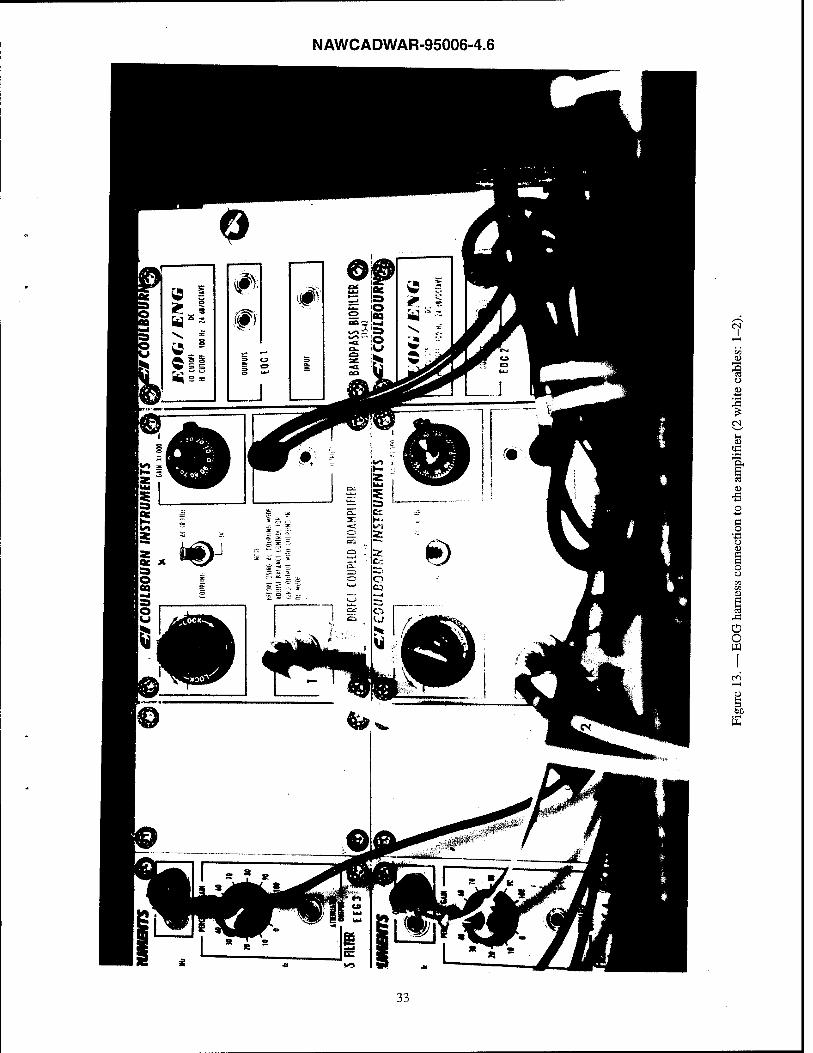
13. EOG harness connection to the amplifier (2 white cables: 1-2).
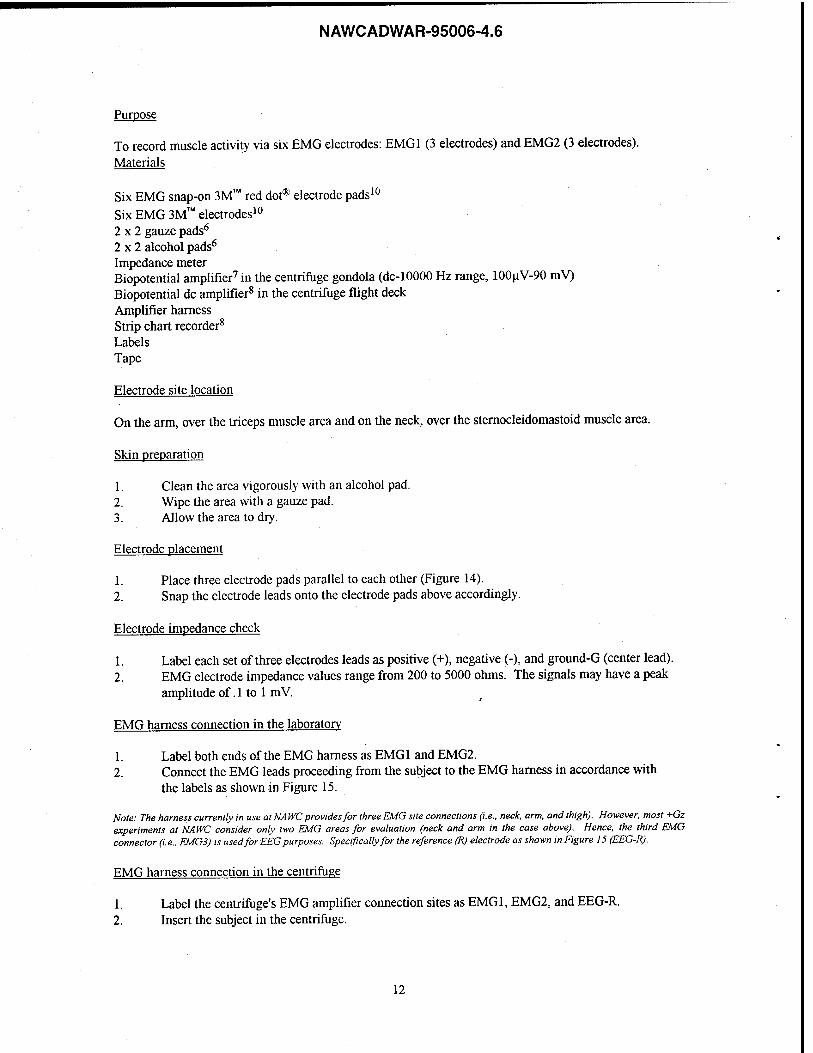
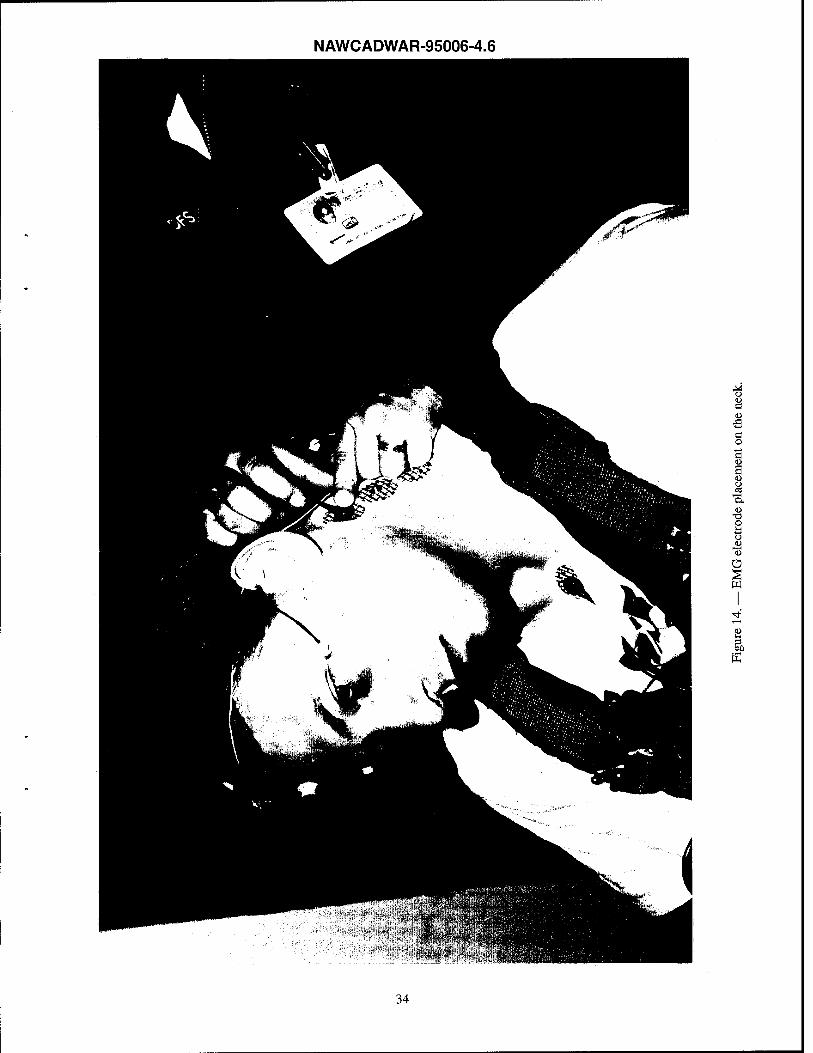
14. EMG electrode placement on the neck.
15. Schematic representation of the EMG harness. Each EMG electrode lead proceeding from the subject (+, -, g) is connected to the harness in accordance to the labels (+, -, g). The reference EEG electrode is connected to the third cable (EEG-R).
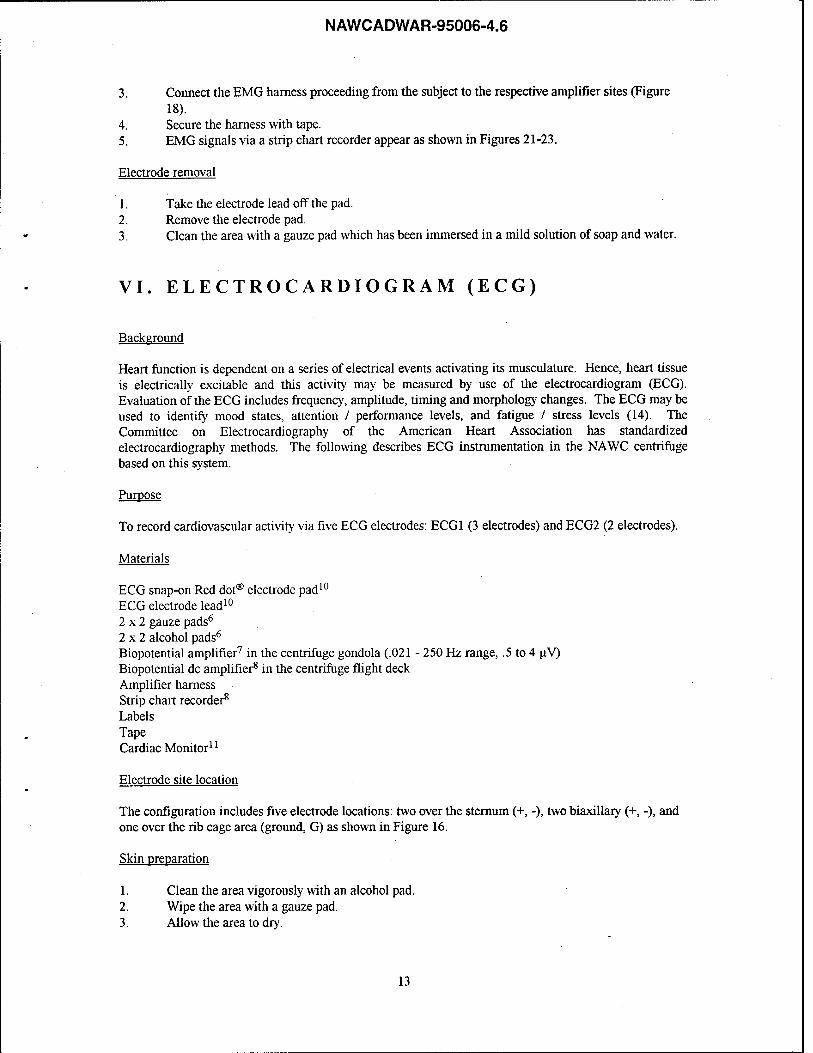
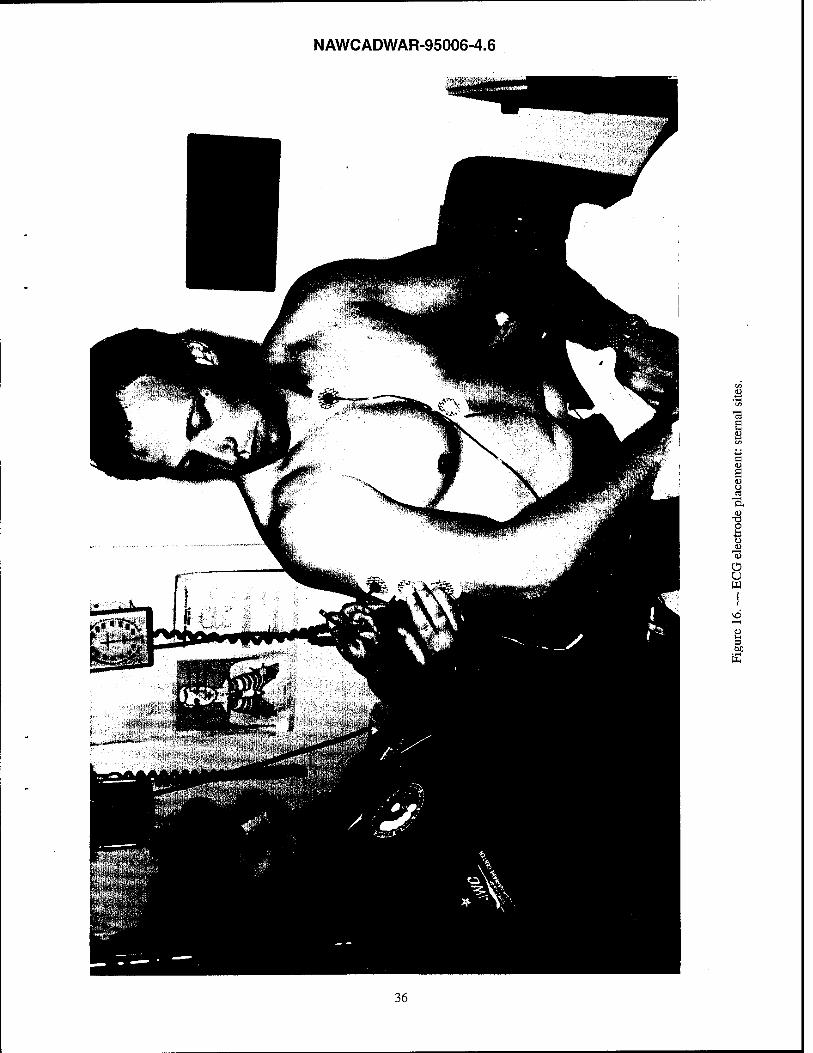
16. ECG electrode placement: sternal sites.
17. Schematic representation of the ECG harness. Each ECG electrode lead proceeding from the subject is connected to the harness in accordance to the labels (+, -, g).

NAWCADWAR-95006-4.6
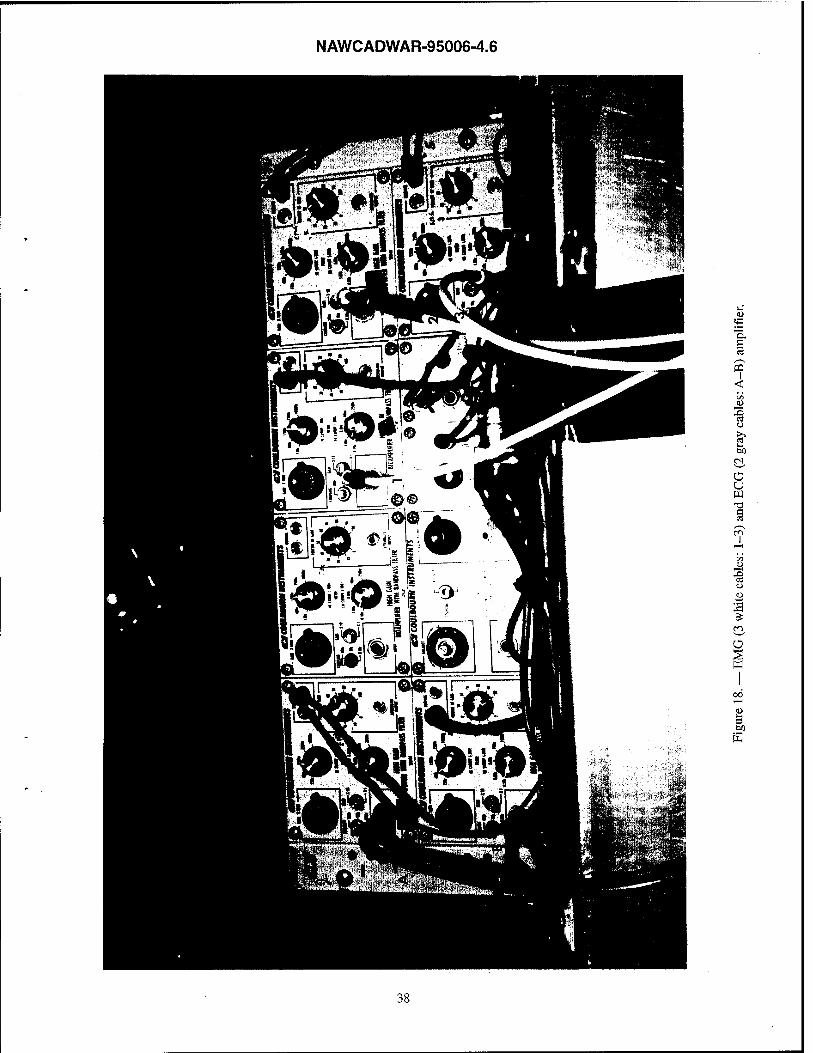
18. EMG (3 white cables: 1-3) and ECG (2 gray cables: A-B) amplifier.
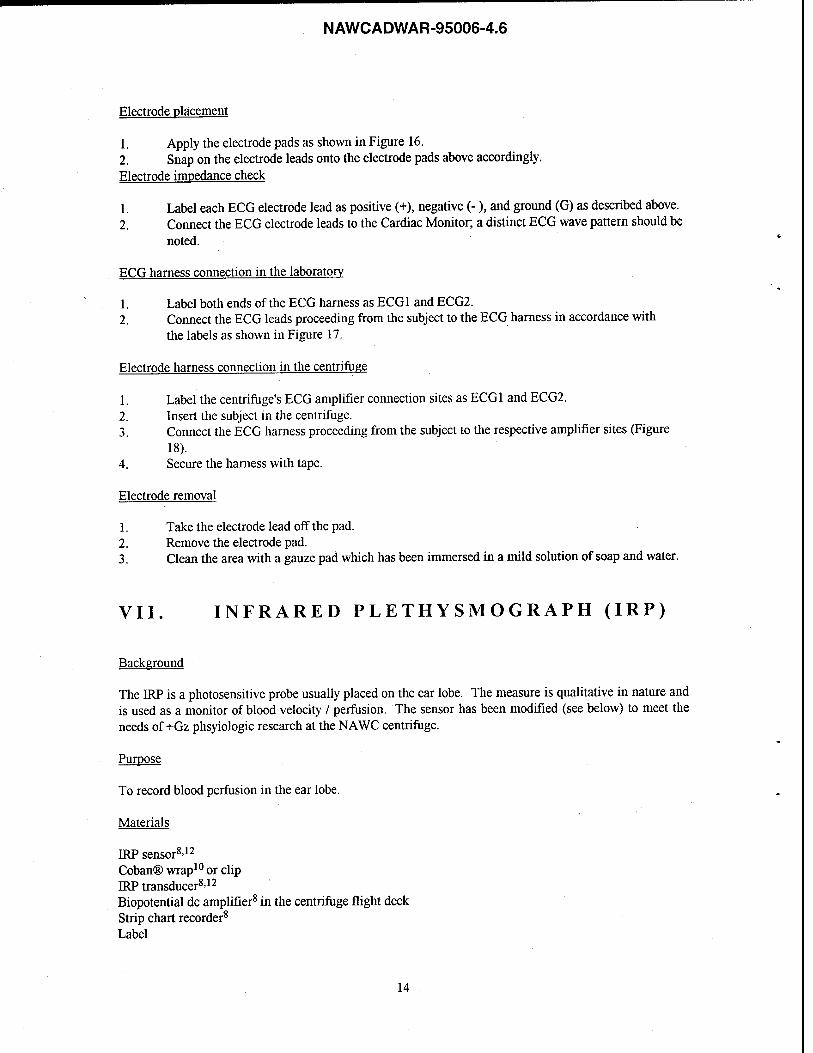
19. IRP placement on the ear.
20. RM placement: below the subject's chest, above the G-suit.
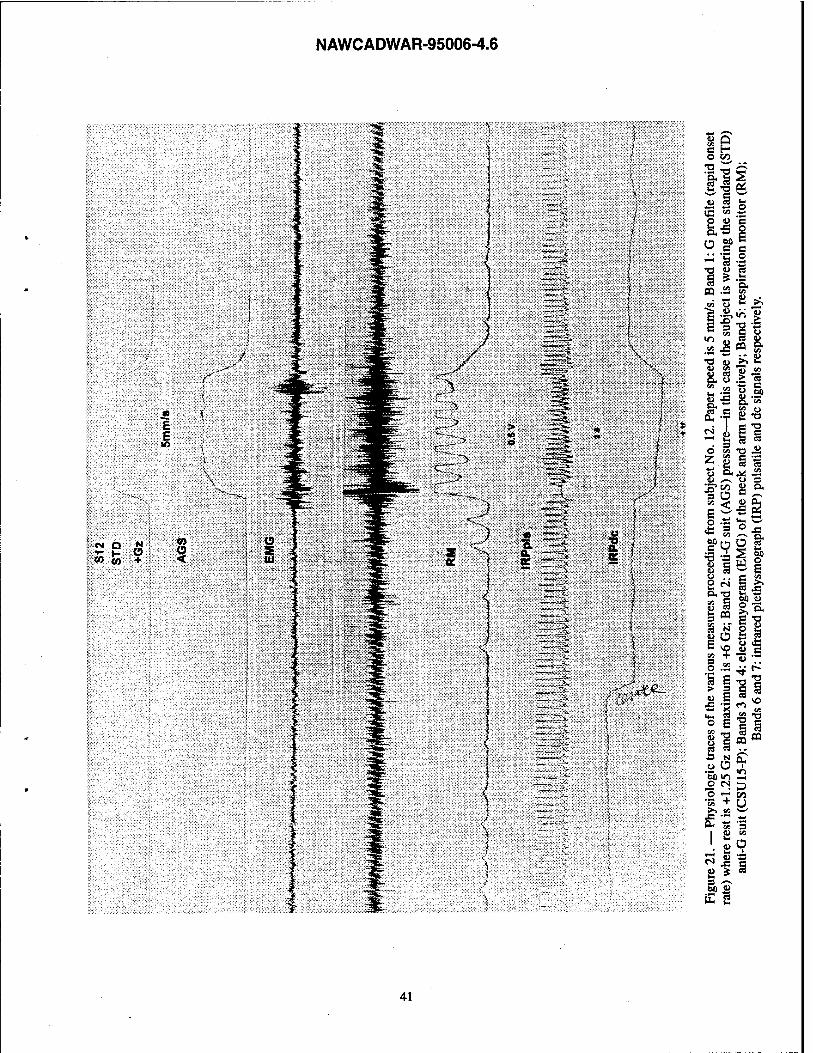
21. Phsyiologic traces of the various measures proceeding from subject No. 12. Paper speed is 5 mm/s. Band 1: G profile (rapid onset rate) where rest is +1.25 Gz and maximum is +6 Gz; Band 2: anti-G suit (AGS) pressure- in this case the subject is wearing the standard (STD) anti-G suit (CSU15-P); Bands 3 and 4: electromyogram (EMG) of the neck and arm respectively; Band 5: respiration monitor (RM); Bands 6 and 7: infrared plethysmograph (IRP) pulsatile and dc signals respectively.
22. Phsyiologic traces of the various measures proceeding from subject No. 12. Paper speed is 5 mm/s. Band 1: G profile (rapid onset rate, aerial combat maneuver) where the alternating G levels are +3 and +5 Gz; Band 2: anti-G suit (AGS) pressure - in this case the subject is wearing the standard (STD) anti-G suit (CSU15-P); Bands 3 and 4: electromyogram (EMG) of the neck and arm respectively; Band 5: respiration monitor (RM); Bands 6 and 7: infrared plethysmograph (IRP) pulsatile and dc signals respectively.
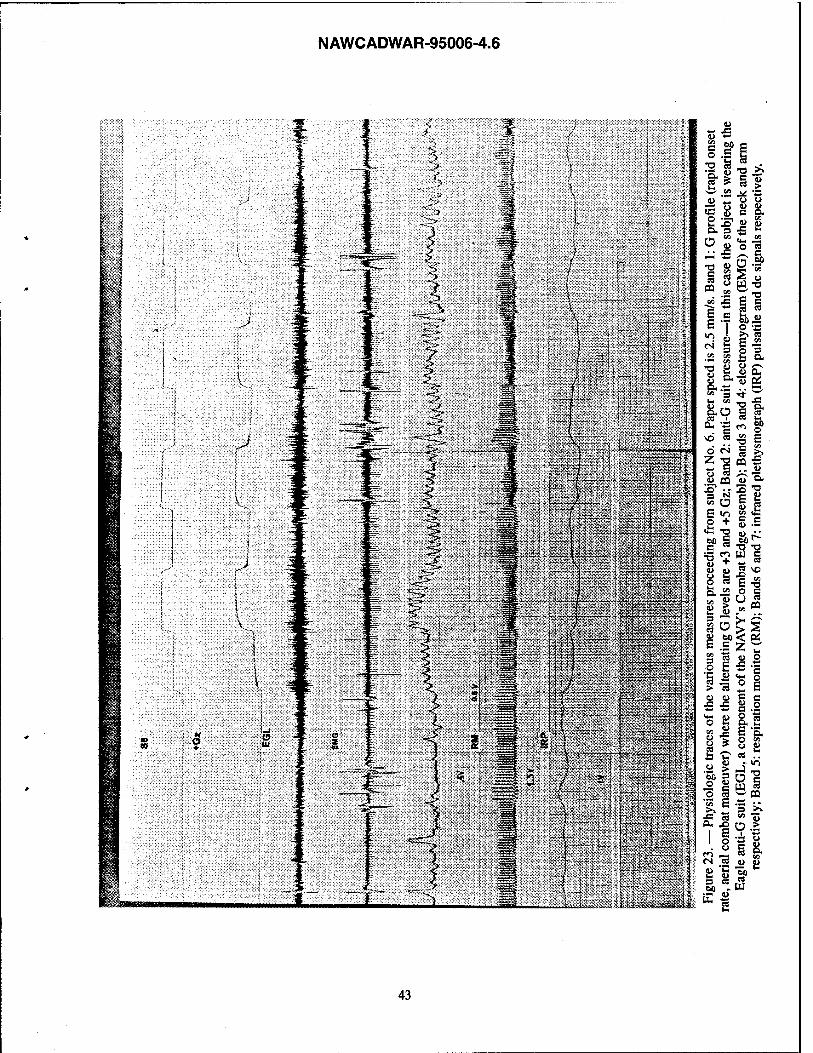
23. Phsyiologic traces of the various measures proceeding from subject No. 6. Paper speed is 2.5 mm/s. Band 1: G profile (rapid onset rate, aerial combat maneuver) where the alternating G levels are +3 and +5 Gz; Band 2: anti-G suit pressure - in this case the subject is wearing the Eagle anti-G suit (EGL, a component of the NAVY's Combat Edge ensemble); Bands 3 and 4: electromyogram (EMG) of the neck and arm respectively; Band 5: respiration monitor (RM); Bands 6 and 7: infrared plethysmograph (IRP) pulsatile and dc signals respectively.
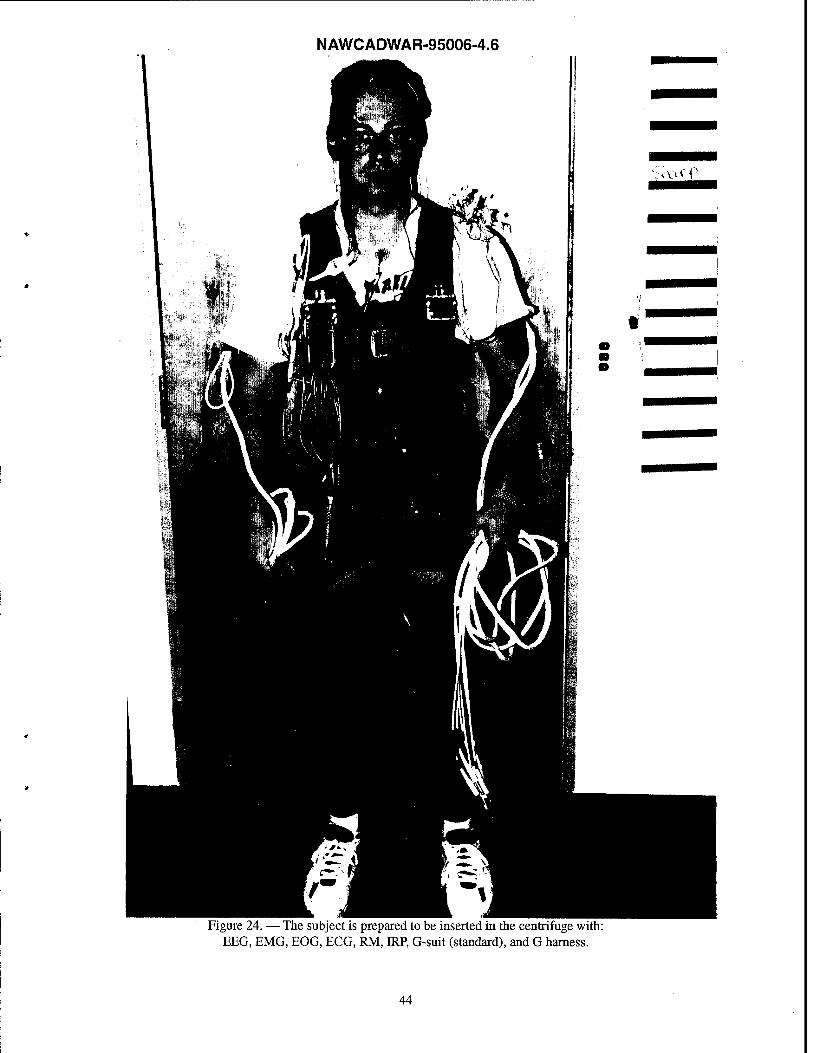
24. The subject is prepared to be inserted in the centrifuge with: EEG, EMG, EOG, ECG, RM, IRP, G-suit (standard), and G harness.
NAWCADWAR-95006-4.6
ABSTRACT
A study to determine the effect of intermittent periods of positive acceleration (+Gz) on human physiology and cognitive perfomance was accomplished at the Naval Air Warfare Center (NAWC) human-use centrifuge. This report discusses the materials and methods utilized to obtain various physiologic, measures during this study: electroencephalogram (EEG); electrooculogram (EOG); electromyogram (EMG); infrared plethysmography (IRP); electrocardiogram (ECG); and respiration rate (RM). The methods discussed herein are specific to the NAWC centrifuge and may serve as a guide for future
research.
NAWCADWAR-95006-4.6
I. INTRODUCTION
The tactical aviator is typically exposed to a highly demanding environment in terms of both workload and physiologic Stressors. Two notable Stressors found in the tactical aviation cockpit are decision making tasks as well as intermittent periods of high +Gz. Mental tasks are performed at a physiological cost to the operator (9): Also, physiological activity varies with tasks demands and there are physiological activity individual differences. Hence, human performance studies, by necessity, need to address the psychophysiology of the subject under study. A study addressing these issues was accomplished at the Naval Air Warfare Center human-use centrifuge (Figure 1) under the title Cumulative Effects of G on Cognitive Performance (6,11). The perfomance task presented during the study was a variant of the NASA Multi-Attribute-Task (MAT) battery (3,10). The tasks employed included: 1) resource management; 2) compensatory tracking; and 3) system monitoring. The study encompassed several physiologic measures: electroencephalogram (EEG); electrooculogram (EOG); electromyogram (EMG); infrared plethysmography (IRP); electrocardiogram (ECG); and respiration rate (RM). This report describes the materials and methods utilized to obtain these measures (Figure 24).
II. METHOD
Description of the physiologic measures is presented in the following manner:
Background How the measure is generally used Purpose Physiologic site specifically monitored for the study described above Materials Materials required to obtain the measure Sensor preparation Material preparation for use Sensor connection Procedures to obtain the measure Sensor removal and storage Procedures for removal and storage of the sensors
III. ELECTROENCEPHALOGRAM (EEG)
Background
There is continued oscillating electrical activity in the brain. The activity is characterized by electrical potential differences in one part of the brain cell (neuron) relative to another; where the current flow between active groups of neurons produces a wave-like response (brain waves) which may be recorded from surface electrodes on the scalp. The record of this electrical activity is called the electroencephalogram or EEG. EEG evaluation includes measures of frequency, amplitude, and coherence. The character of the EEG depends on the level of excitation of the various brain structures (14). Distinct brain wave patterns recorded in the EEG may be identified and associated with mood states, tumor location, sleep stages, and attention / performance levels (1-2,4,9,13,15-17).
The International Federation of EEG Societies has adopted a 10-20 electrode system to standardize the placement of EEG electrodes. Three types of electrode connections are used: a) between each of a pair; b) between a monopolar lead and a distant reference electrode; and c) between a monopolar lead and the average of all (14). The following describes EEG instrumentation in the NAWC centrifuge based on this system (5,8,12,) as it applies to the study mentioned above.
NAWCADWAR-95006-4.6
Purpose
To record brain electrical activity via four EEG electrodes: Fz (frontal), Cz (central), Pz (parietal), and Oz (occipital).
Materials
Six 16 mm Ag/AgCl biopotential skin electrodes1
Electrode conducting gel2
Monoject® syringe6 with blunted needle, 12 cc Omniprep3 abrasive gel Acetone4
0.9% saline solution5
Tape measure Felt tip marker Hair comb Hair clips 2x2 gauze pads6
2x2 alcohol pads6
Portable fan Collodion4 (non flexible) Impedance meter Biopotential amplifier7 in the centrifuge gondola (Figure 2), Hi/Lo pass filter (.1-150 Hz), 5 to 300 uV Biopotential dc amplifier8 in the centrifuge flight deck (Figure 3) Amplifier harness (cable connector) Ground cable Strip chart recorder8
Labels Tape
Electrode site location
1. Part the subject's hair along the midline of the head using hair clips (to keep the midline exposed).
2. Measure the distance from inion to nasion (Dm ). 3. Locate the halfway point of this distance (Cz). Mark the location with a felt tip marker.
Example: if Djn = 40 cm, Cz is at the 20 cm mark. 4. Locate the Fz point-20% away from Cz toward the front of the head. Mark the location with a
felt tip marker. Example: if Djn = 40 cm, Fz is 8 cm away from Cz, toward the front of the head. 5. Locate the Pz point-20% away from Cz toward the back of the head. Mark the location with a
felt tip marker. Example: if Dm = 40 cm, Pz is 8 cm away from Cz, toward the back of the head. 6. Locate the Oz point-40% away from Cz (20% from Pz) toward the back of the head. Mark the
location with a felt tip marker. Example: if Dm = 40 cm, Oz is 16 cm away from Cz (8 cm away from Pz) toward the back of the head.
7. Locate the ground (G) electrode point in the forehead. Mark the location with a felt tip marker. 8. Locate the reference (R) electrode point in the mastoid process behind either ear. Mark the
location with a felt tip marker.
Skin preparation
1. Apply Omniprep abrasive gel to a gauze pad and rub into the scalp electrode points identified above. Apply the gel in a circular motion with enough force to remove the top layers of skin. The area should not be larger than the sensor area of the EEG electrode (Figure 4).
2. Remove any excess gel off the site with a gauze pad.
NAWCADWAR-95006-4.6
3. Wipe the site with an alcohol pad. 4. Allow the site to dry before cementing the electrode to the site (use a portable fan if necessary).
Electrode placement
1. Using a 1 cc syringe, apply Collodion to the rim of the EEG electrode. Note: for the study mentioned above, three holes were drilled into the electrodes' rims with a 1mm bit (Figure 5).
2. Press the electrode to the prepared scalp and hold it in position. 3. Apply additional Collodion around the rim of the electrode if necessary (be careful not to obstruct
the perforations in the electrode). 4. Fan the area dry while holding the electrode in place until the Collodion bond is secure. 5. Direct electrode conducting gel into each perforation of the electrode until it oozes out of the
opposite perforations (Figure 6).
Electrode impedance check
1. Label each EEG electrode lead: Pz, Oz, Cz, Fz, G, and R. 2. Check each electrode impedance against the ground electrode with an impedance meter.
Impedance values should be below 5000 ohms.
EEG harness connection in the laboratory
1. Label both ends of the EEG harness as Pz, Oz, Cz, and Fz. 2. Connect each EEG electrode lead proceeding from the subject to the EEG harness in accordance
to the labels as shown in Figure 7. 3. Connect the ground EEG electrode lead proceeding from the subject to the ground cable in
accordance to Figure 7. 4. Connect the ground cable to the EEG harness in accordance to Figure 7. 5. The reference EEG electrode is connected via the electromyogram harness (see below).
EEG harness connection in the centrifuge
1. Label the centrifuge's EEG amplifier connection sites as Fz, Oz, Cz, and Pz. 2. Insert the subject in the centrifuge. 3. Connect the EEG harness proceeding from the subject to the respective amplifier's sites (Figure
8). 4. Secure the harness with tape. 5. The signals for Oz, Fz, Pz, and Cz via a strip chart recorder appear as shown in Figure 9.
Electrode removal
1. Soak a piece of gauze in acetone and rub it around the rim of the electrode on the scalp. Continue in this fashion until the Collodion dissolves and the electrode pulls free.
2. Clean the area with a gauze pad which has been immersed in a mild solution of soap and water. 3. Clean the Collodion and gel off the electrodes (including the perforations) with acetone. 4. Soak the electrodes in saline solution.
NAWCADWAR-95006-4.6
IV. ELECTROOCULOGRAM (EOG)
Background
Two eye structures are considered when evaluating eye movement: the cornea (light transmitting) and the retina (sensory). Changes in the electric dipole between these two structures may be measured from surface electrodes. For example, the electrical output is zero when the gaze is straight ahead (the dipole is symmetrically located between the two electrodes). The record of this electrical activity is called the electrooculogram (EOG). EOG evaluation includes frequency and amplitude changes. However, large eye movements (>30°) do not always produce amplitudes proportional to eye position (14). Distinct eye movements recorded in the EOG may be identified and associated with sleep stages, reading ability, emotion, workload, and fatigue (2,4,9-10,13,15-17). Typically, eye movements are recorded to aid in the identification of artifacts in the EEG record (to remove corrupted portions of the EEG record). The following describes EOG instrumentation in the NAWC centrifuge based on the study mentioned above.
Purpose
To record eye movement via four EOG electrodes: Vu / Vd for vertical eye movement (up and down) and HI / Hr for horizontal eye movement (left and right).
Materials
Four 11 mm Ag/AgCl biopotential skin electrodes1
Electrode conducting gel2
Monoject® syringe6, lcc Omniprep3 abrasive gel 0.9% saline solution5
SensorMedics EOG adhesive collars1
2x2 alcohol pads6
2x2 gauze pads6
Cotton tipped applicators9
Impedance meter Felt tip marker Biopotential amplifier7 in the centrifuge gondola (dc-50 Hz range, 50 to 3500 uV) Amplifier harness Biopotential dc amplifier8 in the centrifuge flight deck Strip chart recorder8
Labels Tape
Electrode site location
1. Locate the HI and Hr areas in the temporal sides of the subject's right and left eyes. These areas are parallel with the pupil (as the subject looks straight ahead). Mark the locations with a felt tip marker.
2. Locate the Vu and Vd areas above and below the right (or left) eye. These areas are in line with the pupil (as the subject looks straight ahead). Mark the locations with a felt tip marker.
Skin preparation
1. Apply Omniprep abrasive gel to a cotton tipped applicator and rub the gel into the electrode site in a circular fashion. The area should not be larger than the sensor area of the electrode.
10

NAWCADWAR-95006-4.6
2. Remove any excess gel off the site with a gauze pad. 3. Wipe the area with an alcohol pad. 4. Dry the area with a gauze pad.
Electrode placement
1. Place an adhesive EOG collar around the EOG electrode. 2. Fill the center of the EOG electrode with conducting gel. 3. Apply the prepared electrode to the skin electrode sites as shown in Figure 10.
Electrode impedance check
1. Label each EOG electrode lead: Vu, Vd, HI, and Hr. 2. Check each electrode impedance against the ground EEG electrode with an impedance meter.
Impedance values should be below 7000 ohms.
EOG harness connection in the laboratory
1. Label both ends of the EOG harness as V and H. 2. Connect each EOG electrode lead proceeding from the subject to the EOG harness in accordance
to the labels as shown in Figures 11 and 12.
EOG harness connection in the centrifuge
1. Label the centrifuge's EOG amplifier connection sites as V and H. 2. Insert the subject in the centrifuge. 3. Connect the EOG harness proceeding from the subject to the respective amplifier's sites (Figure
13). 4. Secure the harness with tape. 5. The signals for EOG vertical and horizontal eye movement via a strip chart recorder appear
as shown in Figure 9.
Electrode removal
1. Remove the electrode carefully. 2. Clean the area with a gauze pad which has been immersed in a mild a solution of soap and water. 3. Remove the EOG adhesive collar from the electrode. 4. Clean the conducting gel off the electrode. 5. Soak the electrode in saline solution.
V. ELECTROMYOGRAM (EMG)
Background
Skeletal muscle is organized on the basis of the muscle fiber. The components of the muscle fiber constitute a bioelectric source. Hence, muscle activity may be recorded via surface skin electrodes (14). EMG evaluation includes mean tension level, variance of the level, criterion levels, and pattern. Muscle movement recorded in the EMG may be identified and associated with motor performance, mood states, attention level, and sleep stages (1-2,4,9,13,15-17). Typically, muscle movement is recorded to aid in the identification of artifacts in the EEG record (to remove corrupted portions of the EEG record). The following describes EMG instrumentation in the NAWC centrifuge based on the study mentioned above.
11
NAWCADWAR-95006-4.6
Purpose
To record muscle activity via six EMG electrodes: EMG1 (3 electrodes) and EMG2 (3 electrodes). Materials
Six EMG snap-on 3M™ red dot® electrode pads10
Six EMG 3M™ electrodes10
2x2 gauze pads6
2x2 alcohol pads6
Impedance meter Biopotential amplifier7 in the centrifuge gondola (dc-10000 Hz range, 100uV-90 mV) Biopotential dc amplifier8 in the centrifuge flight deck Amplifier harness Strip chart recorder8
Labels Tape
Electrode site location
On the arm, over the triceps muscle area and on the neck, over the sternocleidomastoid muscle area.
Skin preparation
1. Clean the area vigorously with an alcohol pad. 2. Wipe the area with a gauze pad. 3. Allow the area to dry.
Electrode placement
1. Place three electrode pads parallel to each other (Figure 14). 2. Snap the electrode leads onto the electrode pads above accordingly.
Electrode impedance check
1. Label each set of three electrodes leads as positive (+), negative (-), and ground-G (center lead). 2. EMG electrode impedance values range from 200 to 5000 ohms. The signals may have a peak
amplitude of. 1 to 1 mV.
EMG harness connection in the laboratory
1. Label both ends of the EMG harness as EMG 1 and EMG2. 2. Connect the EMG leads proceeding from the subject to the EMG harness in accordance with
the labels as shown in Figure 15.
Note: The harness currently in use at NAWC provides for three EMG site connections (i.e., neck, arm, and thigh). However, most +Gz experiments at NAWC consider only two EMG areas for evaluation (neck and arm in the case above). Hence, the third EMG connector (i.e., EMGS) is usedfor■ EEG purposes. Specifically for the reference (R) electrode as shown in Figure 15 (EEG-R).
EMG harness connection in the centrifuge
1. Label the centrifuge's EMG amplifier connection sites as EMG1, EMG2, and EEG-R. 2. Insert the subject in the centrifuge.
12
NAWCADWAR-95006-4.6
3. Connect the EMG harness proceeding from the subject to the respective amplifier sites (Figure 18).
4. Secure the harness with tape. 5. EMG signals via a strip chart recorder appear as shown in Figures 21-23.
Electrode removal
1. Take the electrode lead off the pad. 2. Remove the electrode pad. 3. Clean the area with a gauze pad which has been immersed in a mild solution of soap and water.
VI. ELECTROCARDIOGRAM (ECG)
Background
Heart function is dependent on a series of electrical events activating its musculature. Hence, heart tissue is electrically excitable and this activity may be measured by use of the electrocardiogram (ECG). Evaluation of the ECG includes frequency, amplitude, timing and morphology changes. The ECG may be used to identify mood states, attention / performance levels, and fatigue / stress levels (14). The Committee on Electrocardiography of the American Heart Association has standardized electrocardiography methods. The following describes ECG instrumentation in the NAWC centrifuge based on this system.
Purpose
To record cardiovascular activity via five ECG electrodes: ECG1 (3 electrodes) and ECG2 (2 electrodes).
Materials
ECG snap-on Red dot® electrode pad10
ECG electrode lead10
2x2 gauze pads6
2x2 alcohol pads6
Biopotential amplifier7 in the centrifuge gondola (.021 - 250 Hz range, .5 to 4 uV) Biopotential dc amplifier8 in the centrifuge flight deck Amplifier harness Strip chart recorder8
Labels Tape Cardiac Monitor11
Electrode site location
The configuration includes five electrode locations: two over the sternum (+, -), two biaxillary (+, -), and one over the rib cage area (ground, G) as shown in Figure 16.
Skin preparation
1. Clean the area vigorously with an alcohol pad. 2. Wipe the area with a gauze pad. 3. Allow the area to dry.
13
NAWCADWAR-95006-4.6
Electrode placement
1. Apply the electrode pads as shown in Figure 16. 2. Snap on the electrode leads onto the electrode pads above accordingly. Electrode impedance check
1. Label each ECG electrode lead as positive (+), negative (-), and ground (G) as described above. 2. Connect the ECG electrode leads to the Cardiac Monitor; a distinct ECG wave pattern should be
noted.
ECG harness connection in the laboratory
1. Label both ends of the ECG harness as ECG1 and ECG2. 2. Connect the ECG leads proceeding from the subject to the ECG harness in accordance with
the labels as shown in Figure 17.
Electrode harness connection in the centrifuge
1. Label the centrifuge's ECG amplifier connection sites as ECG1 and ECG2. 2. Insert the subject in the centrifuge. 3. Connect the ECG harness proceeding from the subject to the respective amplifier sites (Figure
18). 4. Secure the harness with tape.
Electrode removal
1. Take the electrode lead off the pad. 2. Remove the electrode pad. 3. Clean the area with a gauze pad which has been immersed in a mild solution of soap and water.
VII. INFRARED P L E THY S M O GRAPH (IRP)
Background
The IRP is a photosensitive probe usually placed on the ear lobe. The measure is qualitative in nature and is used as a monitor of blood velocity / perfusion. The sensor has been modified (see below) to meet the needs of+Gz phsyiologic research at the NAWC centrifuge.
Purpose
To record blood perfusion in the ear lobe.
Materials
IRP sensor8'12
Coban® wrap10 or clip IRP transducer8'12
Biopotential dc amplifier8 in the centrifuge flight deck Strip chart recorder8
Label
14
NAWCADWAR-95006-4.6
Sensor application
The sensor's window should face the ear lobe. Place the sensor in such a way that it remains in the ear lobe area (use a clip or Coban® wrap). The sensor should not be placed so tightly that it would limit blood flow (Figure 19). Occasionally, the ear lobe may not provide sufficient area for sensor placement. In that case, place the sensor in the pinna and use coban wrap to secure the same. Note: the sensor in this example was obtained from Gould Instruments and modified by NAWC personnel to separate the ac (pulsatile) and dc (bulk flow) signals.
IRP connection in the centrifuge
1. Label the IRP lead proceeding from the subject as IRP. 2. Label the IRP transducer located in the centrifuge gondola as IRP. 3. Insert the subject in the centrifuge. 4. Connect the IRP proceeding from the subject to the pressure transducer and secure it with tape. 6. The IRP signal via a strip chart recorder appears as shown in Figures 21-23.
VIII. RESPIRATION MONITOR (RM)
Background
Respiration characteristics are usually monitored via strain gauges, thermistors or girth measure instrumentation. The metrics usually obtained include respiration rate, pattern, time sequence, and volume. Mood states, mental workload, and stress levels are usually evaluated in relation to respiration parameters. The following describes RM instrumentation in the NAWC centrifuge based on the study mentioned above.
Purpose
To record respiration rate (frequency per minute) via a respiratory monitor composed of an inflatable bladder.
Materials
Respiration Cuff/Band with inflatable bladder (RM)13
Pressure transducer14
Stopcock Airflow control bulb Biopotential dc amplifier8 in the centrifuge flight deck Strip chart recorder8
Flexible plastic tubing Plastic straps Labels Tape
Cuff application
The RM is placed below and around the rib cage area. The bladder portion of the RM should be facing the subject. Inflation of the RM should allow the subject to breath easily (Figure 20).
15

NAWCADWAR-95006-4.6
RM connection in the centrifuge
1. Label the RM tubing proceeding from the subject as Outlet, and the pressure transducer located in the centrifuge gondola as Inlet.
3. Insert the subject in the centrifuge. 4. Connect the RM to the pressure transducer and secure the tubing with tape. 6. Inflate the bladder via the air bulb and maintain the air pressure in the bladder by using a
stopcock. Do not over inflate the bladder. Straps around the tubing connections may be required to avoid air leakage.
5. The RM signal via a strip chart recorder appears as shown in Figures 21-23.
16

NAWCADWAR-95006-4.6
BIBLIOGRAPHY
1. Comperatore CA, Caldwell JA, Stephens RL, Chiaramonte JA, Pearson JY, Trast ST, Mattingly AD. The use of electrophysiological and cognitive variables in the assessment of degradation during periods of sustained wakefulness. Fort Detrick, MD: USAARL; 1992 Technical Report No. USAARL 93-5.
2. Comstock JR., Ed. Mental State Estimation. Langley, VA: NASA Langley Research Center; 1988 Conference Publication No. 2504.
3. Comstock JR, Arnegard RJ. Multi Attribute Task Battery. Langley, VA: NASA Langley Research Center; 1990 Technical Report Draft.
4. Crick F, Koch C. The problem of unconsciousness. Scientific American 1992;267:153-159.
5. Davies DR, Parasuraman R. The psychology of vigilance. London: Academic Press, 1982.
6. Forster EM, Morrison JG, Hitchcock EH, Scerbo MW, and Shull RN. Cummulative effects of +Gz on cognitive performance [abstract]. Aviat. Space Environ. Med. 1994;65:446.
7. Generic Acceleration Protocol: Advisory Committee for the Protection of Human Subjects (ACPHS). Warminster PA; Naval Air Warfare Center Aircraft Division; 1994 Protocol No. 258.
8. Jasper HH. The 10-20 electrode system of the International Federation in Electroencephalo graphy and Clinical Neurophysiology. EEG & CN J. 1958;10(Appendix):371-375.
9. Mackie RR., ed. Vigilance: theory, operational performance, and physiological correlates. New York:Plenum Press, 1977.
10. Morrison JG. Technical description and methodology for using ADAPT: the NAWC-AD-WAR variant of the NASA Multi Attribute Task (MAT) battery. Warminster, PA: Naval Air Warfare Center Aircraft Division; 1994 Technical Report No. NA WCADWAR-...
11. Morrsion JG, Forster EM, Hitchcock EM, Barba CA, Santarelli TP, Scerbo MW. Cumulative effects of G on cognitive tasks [abstract]. Proceedings of the 38th annual meeting of the Human Factors and Ergonomics Society, 1994.
12. Reeves DL, Stanny RR, Wilson GF, Herning RI, Pickworth W, VanOrden KF, Caldwell JA. The OMPAT level I neurophysiological performance assessment battery (NPPAB). Pensacola, FL: Naval Air Station; 1991 Technical Report No NAMRL-Monograph 43.
13. Shapiro D, Schwartz GE. Psychophysiological contributions to social psychology. Am. Rev. Psychol. 1970;21:87-107.
14. Webster JG, ed. Medical Instrumentation: Application and Design. Boston: Houghton Mifflin Company, 1978.
15. Wierwille WW, Rahimi M, Casali JG. Evaluation of 16 measures of mental workload using a simulated flight task emphasizing mediational activity. Human Factors. 1985;27:489-502.
16. Wierwille WW, Williges RC. An annotated bibliography on operator mental work assessment. Patuxent River, MD: Naval Air Test Center; 1979 Technical Report No. SY-27R-80.
17

NAWCADWAR-95006-4.6
17. Wierwille WW, Williges RC. Survey and analysis of operator workload assessment techniques. Patuxent River, MD: Naval Air Test Center; 1978 Technical Report No. SY-78-101.
18
NAWCADWAR-95006-4.6
APPENDIX: LIST OF SOURCES
1. SensorMedics Corporation 1717 South State College Blvd. Anaheim, CA 92806
2. SignaGel™ Parker Laboratories, Inc. Orange, NJ 07050
3. Omniprep™ D. O. Weaver and Company 425 S. Cherry Denver, CO 80222
4. North-Strong 15 Ave A Alfa Industrial Park Phillipsburg, NJ 08865
5. Baxter Healthcare Corporation Deerfield, EL 60015
6. Triad Medical Inc. Franklin, WI 53132
7. Coulbourn Amplifier S575-01 Coulbourn Instruments
8. Gould Amplifier and Recorder RS 3800 Gould Instruments 8333 Rockside Rd Valley View, OH 44125
9. Citimed Corporation Citronelle, AL 36522
10. 3M Corporation, Healthcare Division Bldg 375-5E-08, PO Box 33275 St Paul, MN 55133
11. PhysioControl Inc Cardiac Monitor, Lidepack 8 Defibrillator Redmond, WA 98052
12. IRP: modified by Barry Shender, PhD. from: Gould Instruments9, Model 369500-313519 Code 6023, NAWC Warminster. PA 18974
19

NAWCADWAR-95006-4.6
13. Grass Instruments Quincy, MA 50687
14. Omega Engineering Inc Pressure Transducer PX240 One Omega Drive Box 4047 Stamford, CN 06907
20

NAWCADWAR-95006-4.6
-, * ■ i
Ü
o i-H
5
C
G 0) too
o w
"3
O
ja U
1 M
'S a u o »
3 ja 0) ja H
3
21

NAWCADWAR-95006-4.6
O ü O e« >n > «N «g O * D O
Is o CS r^
O •a
"o 3 a T3
D a
«si 'Si " a
<-> r ^s z £ u ft ■5 O o U
! 1- -a xi ft CS w >
I u
cfl
H CS
.SP« H
22

NAWCADWAR-95006-4.6
23

NAWCADWAR-95006-4.6
(!) bU & tl) u &
o a a
T) o <l> •Ö C/)
U 3
VI g Ä .i3 o .& o
cr Ü ert D
J3 O
<u £ C/D
a; A) .y S3 Crt •4—' (1) a -a o 3 o ■3
"5) S O o ffl •a W <U
<i> 3 .a t4H g o crt a U. o *l—I
"I"") a e« £ •a
a OH
3 bß
24
NAWCADWAR-95006-4.6
■8 o 1-1
o u
o m w u
S3 -t-> <4H
O
B c <D
J3
a o ■ i—i T3 _o o u
c o
o
25
NAWCADWAR-95006-4.6
-s d
d o
1 a <D ft
JJ s
■§• O
O J3
Ö o
a
O d o
« o Ü Ü D
i—I
Ü
W u
o a
•c ■3 a 3 o S3 d o
o
-a d o
t*H o d o
& £
I
26

NAWCADWAR-95006-4.6
EEG harmee ^ 71
EEG Amplifier
V
assr<J§V>" ^-—-.
Subject Ground Cable Figure 7. —Schematic representation of the EEG harness. Each EEG electrode lead proceeding from the subject (Pz, Cz, Fz, Oz)
is connected to the harness in accordance to the labels (+). The Ground electrode lead proceeding from the subject is connected to the Ground Cable which in turn is connected to the EEG harness in accordance to the labels (g).
27
NAWCADWAR-95006-4.6
t i—i
■s a
s PH
Ö _o o a a o ü
Ü
3
28

NAWCADWAR-95006-4.6
o Si* 3
;
\
"v;
?
i:
.>-
St
-
i i
o 8
2oo
- O 5 s z e
<« -a
1 Ü
6-a
2.1
J3 1 > J3 to O lo So
en *^
^£ OH
w J - J3
Ü f 15 «j a s J2 60 4)
fc 1 JO t>
O ffl sa
All.
29

NAWCADWAR-95006-4.6
Figure 10. — EOG electrode placement: HI to detect horizontal movement to the left; Hr to detect horizontal movement to the right; Vu to detect vertical movement upwards; and Vd to detect vertical movement downwards.
30

NAWCADWAR-95006-4.6
EOG.hameee <£. 7i
EOG Amplifier
V
Subject
Figure 11. — Schematic representation of the EOG harness. Each EOG electrode lead proceeding from the subject (HI, Hr, Vu, Vd) is connected to the harness in accordance to the labels (+, -).
31
NAWCADWAR-95006-4.6
O o w
CN
3
32
NAWCADWAR-95006-4.6
7
0)
o
C4
10
■3 o a o
•o o 4) c a o o
O O w
3
33
NAWCADWAR-95006-4.6
M o a
4-i
a o 3 I o es
-8 o to o
o
3
PH
34

NAWCADWAR-95006-4.6
EMG hameee ^ 71
EMG Amplifier
W
€3 &
EMG1
© © O
EMG2
© © O
EEG-R [EMG3]
O
Subject Figure 15. — Schematic representation of the EMG harness. Each EMG electrode lead proceeding from the subject (+, -, g) is
connected to the harness in accordance to the labels (+, -, g). The reference EEG electrode is connected to the third cable (EEG-R).
35
NAWCADWAR-95006-4.6
-a
a
0) o es
o a o
O U
3
PH
36

NAWCADWAR-95006-4.6
ECG hameee ^
ECG Amplifier
V
Subject Figure 17. — Schematic representation of the ECG harness.
Each ECG electrode lead proceeding from the subject is connected to the harness in accordance to the labels (+, - g).
37
NAWCADWAR-95006-4.6
<D
1
Ü u w
en I
o CD
Ü
3 M
38

NAWCADWAR-95006-4.6
0) ID
C o a
Ö
3 (=0
39

NAWCADWAR-95006-4.6
o
o
o D
3 CO
CO
I "öS
a
ft
o u M
40
NAWCADWAR-95006-4.6
r
E
IM Q
? CO CO + ! <
el
41

NAWCADWAR-95006-4.6
E E
V ' <'
cjK*
■>:
: + o < T :
..,.L. —■>? . ' ,.:,... «0 ■ .ia* O a a. a
"TT^~.'Jt . ,..,.'.' .:
~Z3ß--
J ~-3g*~
c «-* o "2 S« S 3 cd CA £
4> a> £ «0
jA J5 S
U CA cd o
o
8. CO
"ö3
u O CA
IE 8 8. CO 1—1
c H CD
T3 *T Cd CO s I •o "c3 « 8 3 § c CO CO J* CA
CO
8 a, eu C
ej •a ■o
CA Ü
J3
CM
B cd
"O < O eu ■>—• >—s V5
CO '3 CO
Ü S
ed CA
"3 Ix a ex 8. (2
o 1
c E cd
a. cd i-*
fN 60 s_^
fN O f >> o. d E S Z § p 60 *■< PQ is O cj eu
Ü
o
"öS E CA
£ CO </i •* U E +
ll ep en
-o c ed
CA
"E.
g c + T3 ^ CU E _c
eu 1) u o
CA
cd CQ
1M
i § CA eu
<U lO ^■m" VO
g a D CA •o B ed
CQ
CA 60 1/3 Cd
I U
CA E *2 y^V
9 o
>
eu
■i tu *•*
CO
Ü 1
1 S
o £ «I o
8 eu
"E o E
CA £ CO c u •w
eu > 1 5 o 9 T3 t-i
U C 'E, '5b o
E 2 CA
CA
8 jo eu .. 'CA >> td
1 c T3 S ed
I O u i CQ
i , eu
<N •c eu
£ <N V cd l> 9 tu 60 4—•
cd £ u*
42
NAWCADWAR-95006-4.6
43
NAWCADWAR-95006-4.6
Figure 24. — The subject is prepared to be inserted in the centrifuge with: EEG, EMG, EOG, ECG, RM, IRP, G-suit (standard), and G harness.
44
No. of Copies
Advanced Physiologic Training Unit 1 833 Med Gp/SGT Holloman AFB, NM 88330
Federal Aviation Administration 1 CAMI Library AAC 84D1, P.O. Box 25082 Oklahoma City, OK 73125
1 copy for Civil Aeromedical Institute
Headquarters 1 Boiling AFB, DC 20332
1 copy for Office of the Surgeon General (SGP)
Dr. Bill Albery 1 AL/CFBG Bldg. 29 2245 Third St. WPAFB, OH 45433-7008

No. of Copies
Naval Aerospace Medical Institute 2 Naval Air Station, Pensacola, FL 32508
FAA Civil Aeromedical Institute 1 Oklahoma City, OK 73124
NASA Ames Research Center 1 Moffott Field, CA 94035
NASA 1 Johnson Space Center Houston, TX 77058
Mr. Robert Montgomery 1 125 James Way ETC Corporation Southamptom, PA 18966-3877
Dr. Jean-Michel Ciere 1 Lamas/CEV F-91228 Bretigny-SUR-ORGE CEDEX France
Defense Technical Information Center 2 Bldg. 5, Cameron Station Alexandria, VA 22314
Naval Aerospace Medicine Institute. 2 Naval Air Station Pensacola, FL 32508
Office of Naval Research 1 Code 1433 Washington, DC 20375
Naval Postgraduate School 1 Monterey, CA 93940
AL/CA-CF 1 Brooks AFB, TX 78235
1 copy for Dr. Russell R. Burton
AL/CFTF 2 Brooks AFB, TX 78235
1 copy for Dr. John W. Burns 1 copy for Dr. Paul Werchan

No. of Copies
Dr. David Glaister 1
Royal Air Force Institute of Aviation Medicine Farnborough Hanes GU14852 England
Mr. Michael Paul 1
Defense and Civil Institute of Environmental Medicine 1133 Sheppard Avenue P.O. Box 2000 Downsview, Ontario, Canada
Air University Library 1
AUL/LSE, Maxwell AFB, AL 38112
Armstrong Laboratory 1
Strughold Aeromedial Library/TSK-4 Brooks AFB, TX 78235
Commander, USAF Armstrong Aerospace 1 Medical Research Lab Wright-Patterson AFB, OH 45433
Commander, Naval Training Systems Command 1 12350 Research Parkway Orlando, FL 82826
U.S. Air Force Tactical Air Command 1
Office of the Command Surgeon (SGP) Langley AFB, VA 23665
Naval Air Warfare Center 3
Warminster, PA 18974-0591 1 copy for Office of Chief Aeromedical Scientist 2 copies for Code 7.2.5.5
1299th Physiological Training Flight , 1 Malcom Grow USAF Medical Center Andrews AFB, Washington, DC 20331-5300
Dr. Fred Buick 1
DCIEM 1133 Sheppard Ave. W. North York, Ontario Canada M3M 3B9
Air Force Office of Scientific Research Boiling AFB, DC 20332-6448


![Distribution From A Physiologic Perspective Problems / Questions Related to Introduction Distribution From A Physiologic Perspective] Five “Distribution.](https://static.fdocuments.in/doc/165x107/56649ea35503460f94ba7de8/distribution-from-a-physiologic-perspective-problems-questions-related-to.jpg)