Physico-Chemical Parameters of Coir Industry...
23
Chapter -III Physico-Chemical Parameters of Coir Industry Effluents 3.1 Introduction The coir industry in India is one of the major agro-based industries which continues to play a prominent role in the national economy and also contributes notable job opportunities to the rural communities. Coir is a natural organic hard fibre derived from a renewable resource namely, coconut husk. Coir fibre is used commercially for the manufacture of wide range of coir yarn, and products like ropes, brushes mat and mattings etc. Only 36 per cent of available coconut husks in India are used for extraction of coir (Kasthuri et al., 2011). Therefore, there is enough scope to enhance its application. Dyeing of coir fibre is essential for improving the marketability of coir products and satisfying the requirements of consumers. These dyes are applied to the materials from their solution in water with the aid of chemicals like acetic acid, sulphuric acid, formic acid, common salt etc. Thus coir industries consume voluminous quantities of water and diverse chemicals, ranging from inorganic to organic compounds, for wet processing of fibre (Banat et al., 1996). This makes the effluents coloured, highly acidic, high in BOD, COD, total suspended solids (TSS) and contain nitrogen, phosphates, toxic chemicals, dyes and pigments, oils and grease etc. Out of these chemicals, dyes are the most important pollutant to be treated since it may affect not only the aquatic flora and fauna but also may cause serious harmful changes in the entire food web.
Transcript of Physico-Chemical Parameters of Coir Industry...
Chapter -III
Physico-Chemical Parameters of Coir Industry Effluents
3.1 Introduction
The coir industry in India is one of the major agro-based industries
which continues to play a prominent role in the national economy and also
contributes notable job opportunities to the rural communities. Coir is a natural
organic hard fibre derived from a renewable resource namely, coconut husk.
Coir fibre is used commercially for the manufacture of wide range of coir yarn,
and products like ropes, brushes mat and mattings etc. Only 36 per cent of
available coconut husks in India are used for extraction of coir (Kasthuri et al.,
2011). Therefore, there is enough scope to enhance its application.
Dyeing of coir fibre is essential for improving the marketability of coir
products and satisfying the requirements of consumers. These dyes are applied
to the materials from their solution in water with the aid of chemicals like acetic
acid, sulphuric acid, formic acid, common salt etc. Thus coir industries consume
voluminous quantities of water and diverse chemicals, ranging from inorganic
to organic compounds, for wet processing of fibre (Banat et al., 1996). This
makes the effluents coloured, highly acidic, high in BOD, COD, total suspended
solids (TSS) and contain nitrogen, phosphates, toxic chemicals, dyes and
pigments, oils and grease etc. Out of these chemicals, dyes are the most
important pollutant to be treated since it may affect not only the aquatic flora
and fauna but also may cause serious harmful changes in the entire food web.

68 Chapter 3Chapter 3Chapter 3Chapter 3
In this chapter, an attempt has been made to find the physico-chemical
properties of the waste water from a coir industry in Kerala, South India.
3.2 Materials and Methods
3.2.1 Sample collection
Alleppy, the leading coir industrial cluster in Kerala, South India (Lat.9⁰
30’ N, Long. 76⁰ 23’ E) was chosen for effluent sample collection. The coir dye
effluent samples were collected from the Dye house of a coir industry on
January, 2009 and carried out during dyeing and washing operations. Standard
procedures (Spot and Grab) were followed during sampling and the samples
were taken from three sites spanning a distance of 500 m. The first sample (S1)
was collected from source (outlet of finishing unit), second sample (S2) from
the effluent treatment plant and third sample (S3) from nearby water body
(pond). All the samples of the effluents were collected in sterile, dry and
properly stopper polypropylene bottles.
3.2.2 Sample Preservation and Analysis
Water samples may undergo change with regard to their chemical,
physical and biological quality during transportation and storing. To preserve
the integrity of the samples after collection, the samples were refrigerated at
4⁰C. The samples for the determination of Dissolved oxygen were siphoned into
the DO bottles without giving any chance for aeration. The pH and temperature
of the effluents were determined at the spots, whereas, the rest of
physicochemical and microbiological parameters determined instantly after
bringing the samples to the laboratory. The samples were transported to
laboratory at 4⁰C as in accordance with the standard methods (APHA, 1998).
Physico-chemical analysis of the effluent such as pH, Temperature, Dissolved

PhysicoPhysicoPhysicoPhysico----Chemical Parameters of Coir Industry EffluentsChemical Parameters of Coir Industry EffluentsChemical Parameters of Coir Industry EffluentsChemical Parameters of Coir Industry Effluents 69
Oxygen (DO), Biological Oxygen Demand (BOD), Chemical Oxygen Demand
(COD), Total Hardness, Electrical conductivity, Chloride content and Total
Suspended Solids (TSS) was carried out according to standard methods of
American Public Health Association (APHA, 1998).
3.2.3 Chemicals and Glass wares
The chemicals, reagents and standards used in the present study were of
analytical grade purchased from HiMedia Industries, Mumbai and Sisco
Research Laboratories, India. Distilled and de-ionized water was used for all
analytical work and for preparing stock solutions. Acid and alkali resistant
borosilicate glass wares manufactured by M/S Borosil, India were used.
3.2.4 Determination of pH
pH is a measure of acidity or alkalinity of a solution and measures the
concentration of hydrogen ions in water. The pH of the sample was measured
using a pH meter (Systronics digital pH meter 335). The pH meter was
standardized by immersing the electrode in buffer solution of known pH of 4
and 9.2. And then the electrode was immersed in the sample till a stable reading
was obtained.
3.2.5 Determination of Temperature
Temperature is a measure of heat in terms of a standardized unit. It is an
important ecological factor which greatly affects vital activities like
metabolism, behaviour, reproduction and development of aquatic organisms.
Temperature was noted at the site prior to its collection with a thermometer.

70 Chapter 3Chapter 3Chapter 3Chapter 3
3.2.6 Determination of Dissolved Oxygen (Winkler’s Method)
In natural and wastewater, Dissolved Oxygen (DO) levels depend on the
physical, chemical and biological activities of the water. The analysis of DO
plays a key role in water pollution control activities and waste treatment process
control.
When Manganous sulphate is added to the sample containing alkaline
Potassium iodide, manganous hydroxide, Mn(OH)2 is formed, which is oxidised
by the DO of the sample to give a brown precipitate of manganic hydroxide,
MnO(OH)2. Upon acidification with H2SO4, the manganic hydroxide forms
manganic sulphate which acts as an oxidizing agent to release free iodine from
potassium iodide. The released iodine is stochiometrically equivalent to that of
dissolved oxygen (DO) originally present in the sample and is then titrated with
a standard solution of sodium thiosulphate using starch as the indicator.
Reagents
1. Alkaline iodide - sodium azide solution:- 50 gm NaOH and 15 gm KI was
dissolved in distilled water and diluted to 100 ml followed by the addition
of 1g NaN3.
2. MnSO4. H2O solution:- Dissolved 36.4 gm MnSO4. H2O in water and diluted to 100 ml.
3. Stock Sodium thiosulphate solution (0.1 N):- Dissolved 25 gm Na2S2O3.
7H2O and 0.1 gm Na2CO3 in distilled water and made up to 1000 ml.
4. Standard Sodium thiosulphate solution (0.025 N):- Dilute 250 ml stock
sodium thiosulphate solution to 1000 ml with freshly boiled and cooled
distilled water.

PhysicoPhysicoPhysicoPhysico----Chemical Parameters of Coir Industry EffluentsChemical Parameters of Coir Industry EffluentsChemical Parameters of Coir Industry EffluentsChemical Parameters of Coir Industry Effluents 71
5. K2Cr2O7 standard solution (0.1 N):- Dissolved 1.23 g K2Cr2O7 in distilled
water and made up to 250 ml.
6. Starch solution:- A paste of 2gm of soluble starch powder and 0.2gm
salicylic acid as preservative was prepared in distilled water and added to
100 ml boiling distilled water. Boiling was continued for a few minutes and
was used after cooling.
A glass stopper DO bottle of 250 ml volume was taken and filled it with
sample avoiding any bubbling. No air was trapped in the bottle after the stopper
was placed. 1 ml of MnS04 solution (Winkler-A) was added followed by 1 ml of
alkaline iodide - azide solution with the help of separate pipettes. The bottle was
stoppered carefully and inverted 2-3 times to allow mixing of reagent. Presence
of brown precipitate indicated dissolved oxygen.
1 ml of concentrated H2SO4 was added and the solution was mixed until
the precipitate gets dissolved. 201 ml of this solution was taken in a conical
flask and titrated against 0.025 N Na2S2O3 using starch (2ml) as indicator. The
end point was the colour change from blue to colourless. The titrations were
repeated to get concordant values.
Calculation
Where V = Volume of Thiosulphate
N = Normality of Thiosulphate
VI = Volume of sample bottle after placing the stopper
V2 = Volume of MnSO4 and KI added

72 Chapter 3Chapter 3Chapter 3Chapter 3
3.2.7 Determination of Biochemical Oxygen Demand (BOD)
BOD is the measure of degradable organic material present in a water
sample. It can be defined as the amount of oxygen required by the micro
organisms in destroying the biologically degradable organic matter under
aerobic conditions. Here the living organisms serve as the medium for oxidation
of the organic matter CO2 and H2O.
Microbes C6H12O6 + 6O2 ----------------> CO2 + H2O+ New microbes
On the basis of the above relationship, it is possible to interpret BOD
data in terms of organic matter as well as the amount of oxygen used during its
oxidation.
Reagents
All reagents listed in DO estimation were used for BOD. In addition
following reagents were required:
1. Phosphate buffer: Dissolved 8.5gm KH2PO
4, 21.75gm K
2HPO
4, 33.5gm
Na2HPO
4.7H
2O and 1.7gm NH
4C; in distilled water and diluted to 1000mL.
The pH was made to 7.2 without further adjustment
2. Magnesium sulphate: Dissolved 22.5gm MgSO4.7H
2O in about 700mL of
distilled water and diluted to 1 Litre.
3. Calcium chloride: Dissolved 27.5gm anhydrous CaCl2
in about 700mL of
distilled water and diluted to 1 Litre.
4. Ferric chloride: Dissolved 0.25gm FeCl3.6H
2O in about 700mL of distilled
water and diluted to 1 L.

PhysicoPhysicoPhysicoPhysico----Chemical Parameters of Coir Industry EffluentsChemical Parameters of Coir Industry EffluentsChemical Parameters of Coir Industry EffluentsChemical Parameters of Coir Industry Effluents 73
5. Acid and Alkali solutions 1N: Prepared 1N H2SO
4 and 1N NaOH or
neutralization of caustic or acidic sample
Preparation of dilution water: For the dilution of sample, one litre of distilled
water was taken and aerated by clean filtered compressed air until DO
saturation attained at 20°C. To this, 1 ml each of phosphate buffer, magnesium
sulphate, calcium chloride and ferric chloride was added and mixed well.
(Samples S1 and S2 were diluted 1% whereas S3 was diluted 5%).
Procedure: The sample was taken in three labelled BOD bottles and stopper
immediately. Dissolved oxygen of one of the BOD bottles was analysed
immediately and the other two was incubated for 5 days at 20°C. A blank was
prepared using plain dilution water siphoned in a BOD bottle in order to
measure the oxygen consumption by dilution water. After 5 days, the DO of the
water sample in the incubated BOD bottle was calculated by Winkler method.
Calculation
[Do-D5] x 100BOD at 20°C as O2, mg/L =
% dilution
where Do is the DO of the sample immediately after preparation and D5
is the DO of the sample after 5 days.
3.2.8 Determination of Total Hardness of the Sample
Water hardness is a traditional measure of the capacity of water to
precipitate soap. Total hardness is defined as the sum of the calcium and
magnesium concentration, both expressed as CaCO3, in mg/L. The
determination of the total hardness of water is based on a complexometric
titration of calcium and magnesium with an aqueous solution of the disodium
salt of EDTA at pH value of 10. If an indicator dye like Eriochrome Black T

74 Chapter 3Chapter 3Chapter 3Chapter 3
(EBT), when added to solution containing calcium and magnesium ions, the
colour of the solution turned to wine red. The titrant, EDTA complexes with
magnesium and calcium ions and removes them from the association of the
indicator and thus changed the colour. When completely complexed with
EDTA, the solution becomes blue, which is the end point of the titration.
Reagents
1. Buffer solution:- 16.9 gm NH4C1 was dissolved in 143 ml concentrated
NH4OH and to this 1.179 gm Sodium EDTA. 2H2O followed by 0.78 gm
MgSO4. 7H20 were added and made up to 250 ml using distilled water in a
volumetric flask. The pH was adjusted to 10.1 ± 0.1.
2. Standard EDTA solution (0.1M) - Dissolved 9.306 gm Sodium EDTA. 2H2O
in 250 ml distilled water in a volumetric flask.
3. Standard MgSO4 solution:- 0.6162 gm MgSO4 in 250 ml water.
4. Eriochrome black T indicator- Dissolved 0.2 gm of Eriochrome Black T
indicator in 15 ml of concentrated ammonia solution and 5 ml absolute
alcohol. Do not store more than two days before use.
25 ml of well mixed sample was taken in a 250 ml conical flask and
2 ml of buffer solution was added to give a pH of 10.0 followed by 3 drops of
EBT indicator solution. It was then titrated against standard EDTA solution
taken in the burette until wine red colour changes to blue and the volume of
EDTA required (A) was noted. A reagent blank was conducted and the volume
of EDTA taken (B) was noted. The volume of EDTA required by the sample
was calculated as C= (A-B). Titrations were repeated to get concordant values.

PhysicoPhysicoPhysicoPhysico----Chemical Parameters of Coir Industry EffluentsChemical Parameters of Coir Industry EffluentsChemical Parameters of Coir Industry EffluentsChemical Parameters of Coir Industry Effluents 75
Calculation
C D 1000 Total Hardness as CaCO3 mg/L=
V
× ×
Where C= volume of EDTA required by sample,
V = Volume of water sample,
D = mg CaCO3 equivalent to 1 ml EDTA titrant
3.2.9 Determination of Electrical Conductivity
Conductivity is the capacity of water to carry an electrical current and
varies both with number and types of ions in the solutions, which in turn is
related to the concentration of ionized substances in the water. Most dissolved
inorganic substances in water are in the ionized form and hence contribute to
conductance.
Reagents
Standard KCl solution - 3.727 gm KCl was weighed out and made up to
500 ml. The solution has a concentration of 0.1 N and conductivity of 14.13
mmho/cm.
The conductivity meter (Systronics direct Reading Conductivity Meter-
303) was calibrated using 0.1 N KCl solution. The electrode was washed with
distilled water and wiped with tissue paper. The conductivity of the standard
was set on the display by adjusting the calibration control. Then the
conductivity of the water sample was determined.

76 Chapter 3Chapter 3Chapter 3Chapter 3
3.2.10 Determination of Chemical Oxygen Demand
Chemical Oxygen Demand (COD) test is commonly used to indirectly
measure the amount of organic compounds in water sample. Chemical Oxygen
Demand (COD) is expressed in terms of mg of oxygen required per litre of
water (mg/L) and was determined following the official method mentioned in
APHA (1998). The organic matter present in the sample gets oxidized
completely by potassium dichromate (K2Cr2O7) in presence of sulphuric acid to
produce carbon dioxide and water. The excess of K2Cr2O7 remaining after the
reaction is titrated with Ferrous ammonium sulphate, Fe(NH4)2 SO4. The
dichromate consumed gives the oxygen required for the oxidation of organic
matter. COD results can be obtained in 3-4 hrs as compared to 3-5days required
for BOD test. Further, the test is relatively easy, precise, and is unaffected by
interferences as in the BOD test.
Apparatus
1. Reflux apparatus consisting of Leibig condenser
2. Heating mantle
3. Burette.
Reagents
1. Standard Potassium Dichromate Reagent-Digestion solution (K2Cr2O7
0.00833 M):- Weigh accurately 4.913 gm of potassium dichromate and
33.3 gm of mercuric sulphate in a beaker and the contents were dissolved
in 167 ml of concentrated sulphuric acid and transferred to 1000 ml
standard flask and the volume was made up to 1000 ml using distilled
water.

PhysicoPhysicoPhysicoPhysico----Chemical Parameters of Coir Industry EffluentsChemical Parameters of Coir Industry EffluentsChemical Parameters of Coir Industry EffluentsChemical Parameters of Coir Industry Effluents 77
2. Sulphuric Acid Reagent- Catalyst solution:- 3 gm of silver sulphate crystals
were weighed and dissolved in 300 ml Con. H2SO4
3. Standard Ferrous Ammonium Sulphate solution [Fe(NH4)2 (SO4)2. 6H2O]
(0.025 M):- 4.9 gm of Fe(NH4)2 (SO4) 2 . 6H2O in 150 ml water and 2.5 ml
Con. H2SO4, then made up to 500 ml.
4. Diphenylamine indicator
5. Mercuric sulphate crystals
To 0.4 gm HgSO4 taken in a reflux flask 10 ml of sample diluted to 20
ml was added. 50 ml of concentrated K2Cr2O7 solution was placed into the flask
together with glass pieces. 30 ml H2SO4 containing Ag2SO4 was added and
mixed thoroughly. The flask was connected to a condenser. The contents were
mixed thoroughly before heating. Care was taken since improper mixing result
in bumping and the sample may be blown out. It was then refluxed for one hour,
then cooled and the condense was washed out with distilled water. The sample
was diluted to 150 ml and cooled. The excess of K2Cr2O7 was then titrated with
0.025 M Fe (NH4)2 (SO4 )2. 6H2O using diphenylamine indicator. The end point
of the titration was the first sharp colour change from blue - green to reddish
brown. A blank was also run simultaneously in the same manner using distilled
water.
Calculation
( ) ( )A B x M x 8 x 1000 COD mg / L
Volume of sample, ml
−=
Where, A = Volume of Ferrous Ammonium sulphate added to the blank (ml)
78 Chapter 3Chapter 3Chapter 3Chapter 3
B = Volume of Ferrous Ammonium sulphate added to the sample (ml)
M = Molarity of Ferrous Ammonium sulphate
8= milliequivalent weight of O2
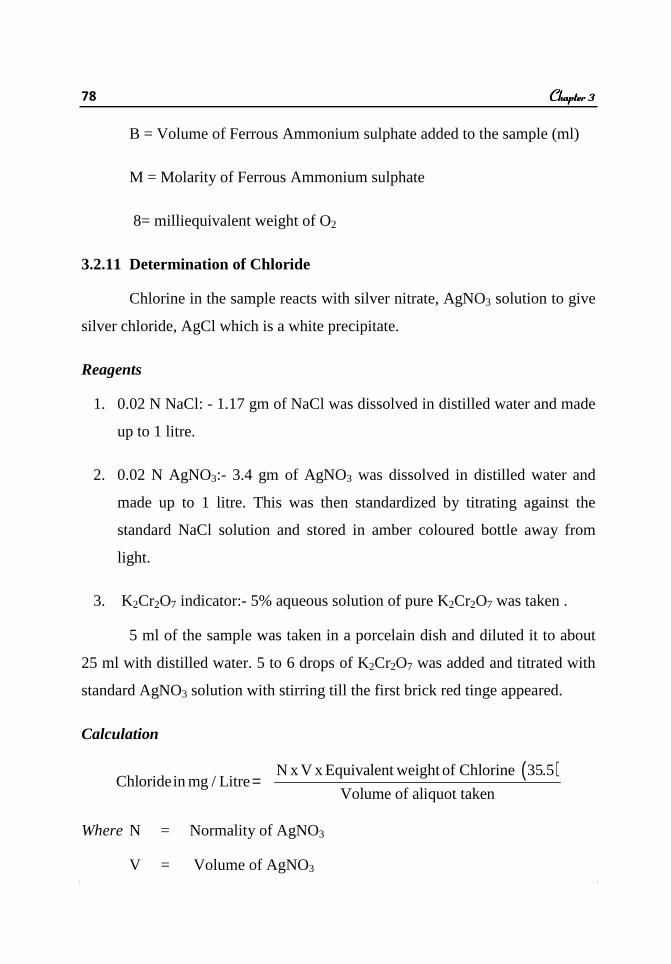
3.2.11 Determination of Chloride
Chlorine in the sample reacts with silver nitrate, AgNO3 solution to give
silver chloride, AgCl which is a white precipitate.
Reagents
1. 0.02 N NaCl: - 1.17 gm of NaCl was dissolved in distilled water and made
up to 1 litre.
2. 0.02 N AgNO3:- 3.4 gm of AgNO3 was dissolved in distilled water and
made up to 1 litre. This was then standardized by titrating against the
standard NaCl solution and stored in amber coloured bottle away from
light.
3. K2Cr2O7 indicator:- 5% aqueous solution of pure K2Cr2O7 was taken .
5 ml of the sample was taken in a porcelain dish and diluted it to about
25 ml with distilled water. 5 to 6 drops of K2Cr2O7 was added and titrated with
standard AgNO3 solution with stirring till the first brick red tinge appeared.
Calculation
( )N x V x Equivalent weight of Chlorine 35.5Chloride in mg / Litre
Volume of aliquot taken=
Where N = Normality of AgNO3
V = Volume of AgNO3

PhysicoPhysicoPhysicoPhysico----Chemical Parameters of Coir Industry EffluentsChemical Parameters of Coir Industry EffluentsChemical Parameters of Coir Industry EffluentsChemical Parameters of Coir Industry Effluents 79
3.2.12 Determination of Total Suspended Solids (TSS)
The term TSS applies to the dry weight of the material that is removed
from a measured volume of water sample by filtration through a standard filter.
To achieve reproducibility and comparability of the results, close attention of
procedural details, especially filter characteristics and time and temperature of
drying is required.
Apparatus
1. Filtration apparatus
2. Filter paper
3. Weighing dishes
4. Evaporating dishes
A known volume of sample (100 ml) was filtered using filtration
apparatus attached with suction pump. The filter paper was removed from
filtration apparatus and transferred it to a crucible ignited to a constant weight
(W1). It was then dried for 1 hour at 130⁰C in a hot air oven, cooled in a
desiccator and weight of the crucible was recorded (W2). The process of drying,
cooling, desiccating and weighing was repeated until a constant weight was
obtained.
Calculation
( ) ( )2 1W W x 1000Total suspended solids mg / L
Volume of sample, ml
−=

80 Chapter 3Chapter 3Chapter 3Chapter 3
3.3 Results
The effluent sample collected from the Dye house of coir industry in
Alleppy, Kerala, South India, was black in colour, with pungent smell and the
experimental data on various physico-chemical properties of water samples is
presented in Table 3.1. The physicochemical values of effluent sample showed
a considerably high load of pH, TSS, BOD/COD and chloride compared to
General Standards of discharge of environmental pollutants published by
Central Pollution Control Board. However, there observed a significant decline
in the values for the samples collected from treatment plant and nearby pond
except in case of pH and DO.
The analysis of the raw effluent showed its highly acidic nature with a
pH value of 8.6 ±0.3. The pH values of treated as well as pond water showed
alkaline character with values 7.8 ±0.5 and 7.5 ±0.2 respectively.
The temperature of raw effluent was very high when compared to the
other two. It was observed that raw effluent was having a temperature of
52.2±0.7 ⁰C whereas it decreased to 32.3 ±0.4 ⁰C and 28.0 ±0.3 ⁰C for samples
collected from treatment plant and the nearby pond respectively.
The Dissolved Oxygen (DO) for coir industry effluent at each sampling
site was as shown in Table 3.1. The DO values ranged from 2.09 ±0.41 to
4.98±1.31 mg/L and showed an increasing trend from effluent source to final
outlet.
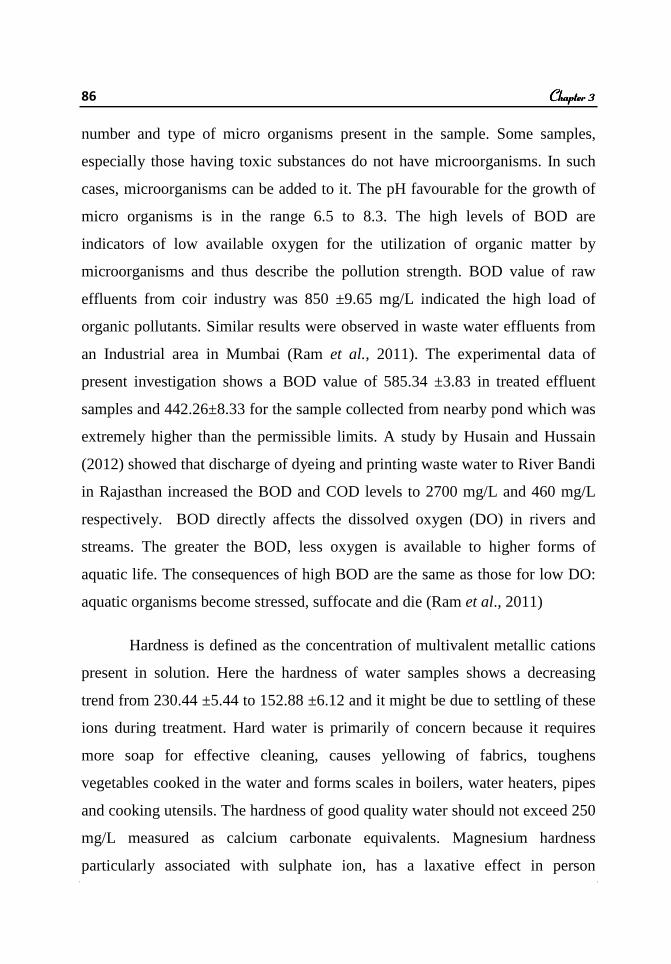
The Biological Oxygen Demand (BOD) values showed greater
variations in different sites. The effluent discharge collected from source had a
BOD of 850.0±9.65 mg/L whereas samples S2 and S3 showed BOD of 585.34
±3.83 and 442.26 ±8.33 respectively.

PhysicoPhysicoPhysicoPhysico----Chemical Parameters of Coir Industry EffluentsChemical Parameters of Coir Industry EffluentsChemical Parameters of Coir Industry EffluentsChemical Parameters of Coir Industry Effluents 81
Fig 3.1. The raw effluent tank of a coir dyeing industry. The sample S1 was collected from this tank.
Fig 3.2. An effluent treatment plant in the coir dyeing industry. The sample S2 was collected from the outlet of this treatment plant.

82 Chapter 3Chapter 3Chapter 3Chapter 3
Table 3.1: Physico-chemical parameters of coir industry effluents
SI No
Parameters Sample 1
S1
Sample 2
S2
Sample 3
S3
Standard values (for
Inland Surface water)*
1 pH 8.6 ±0.3 7.8 ±0.5 7.5 ±0.2 5.5-9.0
2 Temperature (⁰C) 52.2 ±0.7 32.3 ±0.4 28.0 ±0.3 -
3 D.O (mg/L) 2.09 ±0.41 3.95 ±0.72 4.98 ±1.31 6.0
4 BOD (mg/L) 850.0 ±9.65 585.34 ±3.83
442.26 ±8.33 30
5 Total hardness
(mg/L) 230.44 ±5.44
180.95 ±4.11
152.88 ±6.12 200
6 Electrical
Conductivity (m mho/cm)
5.7 ±1.2 4.4 ±0.8 2.8 ±0.4 -
7 COD (mg/L) 1376.54±12.23 896.34 ±8.65
528.36 ±9.48 250
8 Chloride (mg/L) 676.58 ±13.11 665.34 ±7.89
274.4 ±14.32 250
9 T.S.S(mg/L) 815.2 ±2.5 734.6 ±5.8 350.1 ±3.2 100
*General effluent standards for discharge of Environmental pollutants as per Schedule-VI, Part A, GSR 801(E) dt 31.12.93.
Values are calculated from three replicas and are represented as mean
±SD. Sample 1- Water collected from raw effluent (outlet of finishing tank),
Sample 2- Water collected from the treatment plant, Sample 3- Water collected
from nearby pond (approx. 500m away from discharge).

PhysicoPhysicoPhysicoPhysico----Chemical Parameters of Coir Industry EffluentsChemical Parameters of Coir Industry EffluentsChemical Parameters of Coir Industry EffluentsChemical Parameters of Coir Industry Effluents 83
The total hardness of raw effluent was 230.44 ± 5.44 mg/L and showed
a decreasing trend after treatment with a value of 180.95 ± 4.11 mg/L for S2
and 152.88 ± 6.12 mg/L for S3.
The electrical conductivity value of raw effluent was observed as 5.7 ±
1.2 m mho/cm whereas that of treated effluent was 4.4 ± 0.8 m mho/cm. The
pond water showed a less value of 2.8 ± 0.4 m mho/cm.
The Chemical Oxygen Demand (COD) level of the raw effluent was
1376.54 ± 12.23 mg/L whereas the values of sample from treatment tank and
nearby pond were 896.34 ± 8.65 and 528.36 ± 9.48 mg/L respectively. BOD
and COD level of the effluent were high as compared to BIS Standards.
The chloride content of samples were too high and were respectively
676.58 ± 13.11, 665.34 ± 7.89 and 274.4 ± 14.32 mg/L for raw, treated effluents
and pond water.
TSS (Total suspended solids) of raw effluent was observed as 815.2 ±
2.5 mg/L and for treated effluent, the value was 734.6 ± 5.8 mg/L. TSS was
further decreased to 350.1 ± 3.2 mg/L for the sample taken from pond.
3.4 Discussion
Many of the South Asian countries especially those developing ones are
experiencing severe environmental problems due to rapid industrialization. The
effluent discharged by textile and coir industries leads to soil and water
pollution and ultimately makes the livelihood of poor more pathetic. The results
of different physico-chemical parameters of the effluent samples from source to
sink of the selected coir industry were falling above the limits of General
standards for discharge of Environmental pollutants (as per schedule of

84 Chapter 3Chapter 3Chapter 3Chapter 3
Environmental Protection Rules; 1993). The effluent generated was highly
coloured, foul smelling and have acidic pH with high temperature. The colour
was black due to mixture of dyes used in the dyeing process. The presence of
colour in the effluents due to high exhaustion rate of unused dyes reduces light
penetration, thereby limiting the biological activity in it which ultimately
reduces the self purification capacity of the ecosystem (Sarnaik and Kanekar,
1995; Banat et al., 1996).
pH is one of the important measurement of waste waters since effluents
with extreme pH is difficult to treat by any biological means. If the effluent is
typically acidic (<5) or alkaline (>7.5), there is a need of neutralization. High or
low pH affects the chemical reactions in aquatic environment and would kill
aquatic life. In the present study, the pH of dye effluent was observed to be 8.6
± 0.3 which was similar to the study of Arun and Bhaskara (2010). Biyearly
average pH values of 8.1, 8.7, 6.3 and 6.9 were observed for samples collected
from different industries of Taloja industrial area, Mumbai (Ram et al., 2011).
The high pH in the waste water limits the growth of microorganisms and
thereby renders the bioremediation in water ecology (Banat et al., 1996). The
pH values changed to 7.8 ±0.5 after treatment. This might be due to the
chemicals used for neutralizing the effluent. The most important cause for
damage to external environment was many of the coir industries does not have
treatment plant and discharges the waste water directly to nearby streams.
Temperature is one of the most important ecological factors which
control behavioural characteristics of aquatic organisms, solubility of gases and
salts in water. In the present study it was observed that the temperature of the
effluent was considerably high (52.2⁰C) and when discharged directly to
streams it brings down the solubility of gases in water and makes aquatic life in

PhysicoPhysicoPhysicoPhysico----Chemical Parameters of Coir Industry EffluentsChemical Parameters of Coir Industry EffluentsChemical Parameters of Coir Industry EffluentsChemical Parameters of Coir Industry Effluents 85
danger. Increase in temperature may become barrier to fish migration and
affects species reproduction.
Dissolved Oxygen (DO) is an index of physical and biological processes
going on in water. Non polluted waters are usually saturated with DO. The two
main sources of DO in water are diffusion from air and photosynthetic activity
within water. Oxygen is considered to be a limiting factor, especially in lakes
and in waters with heavy load of organic material. Low DO may prove lethal
for many of the organisms. DO is affected by thermal pollution, sewage and
effluents. From the DO value, we can control the rate of aeration during
biological treatment of effluents. The DO of the coir industry effluent was
observed to be lower than the treated solution and nearby water body indicating
possible pollution. DO value of samples increased from 2.09 ±0.4 to 3.95 ±0.72
after treatment and to 4.98 ±1.31 that of pond water. A healthy water body
should have a DO of at least 5.2 mg/L. The low level of DO could lead to
production of hydrogen sulphide gas in presence of organic materials and
sulphates (WHO, 2002) due to action of anaerobic organisms. Also the water
becomes uninhabitable to gill breathing aquatic organisms. The low DO value
of raw effluent was due to high temperature since warm water hold less DO
than cold water. The results were in agreement with other reports that
mentioned about industrial effluents. Adewoye et al. (2005) had earlier reported
that indiscriminate deposition of effluent in to an aquatic system might decrease
the dissolved oxygen concentration.
Technically BOD is the amount of oxygen utilized by micro organisms
in aerobic degradation of the dissolved organic matter in water over a 5-day
period. The demand of oxygen is in general proportional to the amount of
oxidizable organic matter present in the solution. BOD test can be affected by
86 Chapter 3Chapter 3Chapter 3Chapter 3
number and type of micro organisms present in the sample. Some samples,
especially those having toxic substances do not have microorganisms. In such
cases, microorganisms can be added to it. The pH favourable for the growth of
micro organisms is in the range 6.5 to 8.3. The high levels of BOD are
indicators of low available oxygen for the utilization of organic matter by
microorganisms and thus describe the pollution strength. BOD value of raw
effluents from coir industry was 850 ±9.65 mg/L indicated the high load of
organic pollutants. Similar results were observed in waste water effluents from
an Industrial area in Mumbai (Ram et al., 2011). The experimental data of
present investigation shows a BOD value of 585.34 ±3.83 in treated effluent
samples and 442.26±8.33 for the sample collected from nearby pond which was
extremely higher than the permissible limits. A study by Husain and Hussain
(2012) showed that discharge of dyeing and printing waste water to River Bandi
in Rajasthan increased the BOD and COD levels to 2700 mg/L and 460 mg/L
respectively. BOD directly affects the dissolved oxygen (DO) in rivers and
streams. The greater the BOD, less oxygen is available to higher forms of
aquatic life. The consequences of high BOD are the same as those for low DO:
aquatic organisms become stressed, suffocate and die (Ram et al., 2011)
Hardness is defined as the concentration of multivalent metallic cations
present in solution. Here the hardness of water samples shows a decreasing
trend from 230.44 ±5.44 to 152.88 ±6.12 and it might be due to settling of these
ions during treatment. Hard water is primarily of concern because it requires
more soap for effective cleaning, causes yellowing of fabrics, toughens
vegetables cooked in the water and forms scales in boilers, water heaters, pipes
and cooking utensils. The hardness of good quality water should not exceed 250
mg/L measured as calcium carbonate equivalents. Magnesium hardness
particularly associated with sulphate ion, has a laxative effect in person

PhysicoPhysicoPhysicoPhysico----Chemical Parameters of Coir Industry EffluentsChemical Parameters of Coir Industry EffluentsChemical Parameters of Coir Industry EffluentsChemical Parameters of Coir Industry Effluents 87
unaccustomed to it. The total hardness value of the present study was found to
be within permissible limits.
Conductivity of water sample is its ability to carry electrical current and
is a measure of the total dissolved solid concentration such as NaCl. Salinity of
water is determined by measuring its electrical conductivity and is the most
important parameter in determining the suitability of water for irrigation.
Effluent has the highest conductivity of 5.7 ±1.2 followed by the treated one.
Pond water has observed to display the lowest conductivity value of 2.8 ±0.4.
The decrease in conductivity from source to sink is due to physical treatment of
the waste water. The high value of conductivity reveals the factor that this water
is not suitable for irrigation as it causes heavy metal accumulation.
The Chemical Oxygen Demand (COD) is a measure of chemically
oxidisable organic matter in the waste water. Here effluent has the highest COD
value revealing the fact that it contains more chemically oxidisable matter and
shows the highly toxic effect when it is given out to the surroundings without
treatment. COD value reduced considerably after treatment indicates the
degradation of toxic chemicals. COD values are extensively used in the analysis
of domestic and industrial waste water. In conjugation with BOD test, COD test
is helpful in indicating toxic conditions and the presence of biologically
resistant organic substances. COD test has an advantage over BOD in that the
result can be obtained in about 3h, as compared to 5 days required for BOD test.
Here the COD value of the effluent has been observed to be 1376.54 ±12.23
mg/L (Table-3.1) which is very high as compared to the COD levels in pond
water and the treated solution. High COD value of 3027 mg/L was observed in
a study conducted on Indigo dye effluent (Dogan and Hauk, 2012) reveals the
fact that dye waste water contains high load of inorganic pollutants also.

88 Chapter 3Chapter 3Chapter 3Chapter 3
Chloride occurs in all natural waters in widely varying concentrations.
Excessive chloride (>250 mg/L) imparts a salty taste to water. From the results,
it can be observed that the raw effluent has the maximum chloride content of
676.58 ± 13.11 mg/L and after treatment it decreased to 665.34 ±8.65 and
became 274.40 ±14.32 when the effluent reached nearby pond (Table 3.1). The
results indicate chloride content of coir industry effluent was above the
acceptable limit of 250 mg/L. High chloride contents are harmful for
agricultural crops if such wastes containing high chlorides are used for
irrigation purposes (Agarwal, 1996).
Total suspended solids of effluent are extremely valuable in the analysis
of polluted water. They cut down the light transmission through the water and
so lower the rate of photosynthesis in aquatic flora. It is a major parameter used
to evaluate the strength of domestic waste water and to determine the efficiency
of the treatment unit. The Suspended solids are responsible for the conditions
generally referred as 'soil sickness' of the soil when the soil pores are clogged
by suspended matter. It leads to anaerobic conditions in the root zone because of
which organic acids are liberated. Further, aerobic conditions necessary for soil
microbial processes are also inhibited to denitrification and loss of nitrogen.
H2S is also produced which will be toxic to plants. These conditions are
associated with 'soil sickness'. The levels of TSS in effluent sample were
observed to be 815.2 ±2.5 mg/L and that of treated and pond water were
734.6±5.8 and 350.1 ±3.2 mg/L respectively (Table-3.1). Chemical coagulation
found to be mainly responsible for removing dissolved solids, suspended solids
(TSS) and COD from the effluent (Lin and Peng, 1994) and it is further
enhanced when used with activated sludge process (Lin and Liu, 1994). The
success of biological wastewater treatment is governed by the abilities of
microorganisms to induce floc formation, facilitating the separation of particles

PhysicoPhysicoPhysicoPhysico----Chemical Parameters of Coir Industry EffluentsChemical Parameters of Coir Industry EffluentsChemical Parameters of Coir Industry EffluentsChemical Parameters of Coir Industry Effluents 89
from the treated water. This was indicated by the values of TSS, BOD and COD
of sample 2 and sample 3. The general decrease in physiochemical load in the
effluent from source to sink suggested a gradual decline in pollution level.
More efforts are needed in order to maintain the values according to
National Standards limit. The study also showed the importance of a treatment
method which substantially reduces the pollutants prior to the discharge of this
waste water to nearby streams.
The experimental data suggests a need to implement common
objectives, compatible policies and programmes for improvement in the dye
waste water treatment methods. As much work is not available on the toxicity
induced by the effluents from coir industry in Kerala and perhaps this is the first
specific report. In this work, we are trying to bring this very serious pollution
problem to the public for proper care and remediation as Alappuzha, the Venice
of East and the present tourist spot is getting spoiled.