PHYSICO-CHEMICAL ANALYSIS OF SURFACE AND GROUND WATER OF BARGARH
12
IJRRAS 2 (3) ● March 2010 Mahananda & al. ● Physico-chemical Analysis of Ground & Surface Water 284 PHYSICO-CHEMICAL ANALYSIS OF SURFACE AND GROUND WATER OF BARGARH DISTRICT, ORISSA, INDIA 1 M.R.Mahananda, 2 B.P.Mohanty & 3 N.R. Behera Department of Environmental Sciences, Sambalpur University, Jyoti-Vihar, Burla-768019, Orissa, India ABSTRACT The piece of investigation was carried out to study the ground water as well as surface water quality, nutrient status and physico-chemical characteristic of Bargarh district of Orissa, India. The study area is situated between 21 o 36 ’’ E longitude and 176.362 mts above sea level and 59km to west of Sambalpur district. The present work has been conducted by monitoring two types of ground water i.e. dug well water and bore well water of 10 wards of the town as well as 3 types of ponds, viz. temple pond, small community pond & large community pond of the town. Attempts were made to study and analyze the physico-chemical characteristics of the water. Various parameters like Temperature, pH, Total suspended solids, and Total dissolved solids, Alkalinity, Dissolved oxygen, Chemical Oxygen Demand, Nitrate, Chloride, Sodium, Potassium, Phosphate, Fluoride, Total Coli forms(Pond water) etc. give a picture of quality parameter in both dug well and bore well water as well as pond water of the town. By observing the result it can be concluded that the parameters which were taken for study the water quality are below the pollution level for ground water which satisfy the requirement for the use of various purposes like domestic, agricultural, industrial etc. But incase of surface water, the water quality of small community pond are above the permissible limit. Key words: Ground water, Surface water, physicochemical characteristics. 1. INTRODUCTION Much of the current concern with regards to environmental quality is focused on water because of its importance in maintaining the human health and health of the ecosystem. Fresh water is finite resource, essential for agriculture, industry and even human existence, without fresh water of adequate quantity and quality, sustainable development will not be possible 1 . There is an extensive literature, which stresses deterioration of water quality 2,3,4,5 .The addition of various kinds of pollutants and nutrients through the agency sewage, industrial effluents, agricultural run off etc. in to the water bodies brings about a series of changes in the physicochemical and characteristics of water, which have been the subject of several investigations 6,7,8,9,10 . Fresh water resource is becoming day-by-day at the faster rate of deterioration of the water quality is now a global problem 11 . Discharge of toxic chemicals, over pumping of aquifer and contamination of water bodies with substance that promote algae growth are some of the today’s major cause for water quality degradation. Direct contamination of surface water with metals in discharges from mining, smelting and industrial manufacturing, is a long-standing phenomenon. Today there is trace contamination not only of surface water but also of groundwater bodies, which are susceptible to leaching from waste dumps, mine tailings and industrial production sites 12 .Organic manure, municipal waste and some fungicides often contain fairly high concentration of heavy metals. Soils receiving repeated applications of organic manures, fungicides and pesticides have exhibited high concentration of extractable heavy metals and that thereby increase their concentration in runoff (Moore et al., 1998), while falling as rain, water picks up small amounts of gases, ions, dust and particulate matter from the atmosphere 12,13 .These added substances may be arbitrarily classified as biological, chemical (both organic and inorganic), physical and radiological impurities. They include industrial and commercial solvents, metal and acid salts, sediments, pesticides, herbicides, plant nutrients, radioactive materials, decaying animal and vegetable matter and living microorganisms, such as algae, bacteria and viruses 14 . These impurities may give water a bad taste, color, odor or turbidity and cause hardness, corrosiveness, staining or frothing 15 . Water quality reflects the composition of water as affected by natural cause and man’s cultural activities expressed in terms of measurable quantities and related to intended water use 1 . The composition of surface and groundwater is dependent on natural factors (geological, topographical, meteorological, hydrological and biological) in the drainage basin and varies with seasonal difference in runoff volumes, weather conditions and
Transcript of PHYSICO-CHEMICAL ANALYSIS OF SURFACE AND GROUND WATER OF BARGARH

IJRRAS 2 (3) ● March 2010 Mahananda & al. ● Physico-chemical Analysis of Ground & Surface Water
284
PHYSICO-CHEMICAL ANALYSIS OF SURFACE AND GROUND
WATER OF BARGARH DISTRICT, ORISSA, INDIA
1M.R.Mahananda,
2B.P.Mohanty &
3N.R. Behera
Department of Environmental Sciences, Sambalpur University, Jyoti-Vihar, Burla-768019, Orissa, India
ABSTRACT
The piece of investigation was carried out to study the ground water as well as surface water quality,
nutrient status and physico-chemical characteristic of Bargarh district of Orissa, India. The study area is situated
between 21o 36
’’ E longitude and 176.362 mts above sea level and 59km to west of Sambalpur district. The present
work has been conducted by monitoring two types of ground water i.e. dug well water and bore well water of 10
wards of the town as well as 3 types of ponds, viz. temple pond, small community pond & large community pond of
the town. Attempts were made to study and analyze the physico-chemical characteristics of the water. Various
parameters like Temperature, pH, Total suspended solids, and Total dissolved solids, Alkalinity, Dissolved oxygen,
Chemical Oxygen Demand, Nitrate, Chloride, Sodium, Potassium, Phosphate, Fluoride, Total Coli forms(Pond
water) etc. give a picture of quality parameter in both dug well and bore well water as well as pond water of the
town.
By observing the result it can be concluded that the parameters which were taken for study the water
quality are below the pollution level for ground water which satisfy the requirement for the use of various purposes
like domestic, agricultural, industrial etc. But incase of surface water, the water quality of small community pond are
above the permissible limit.
Key words: Ground water, Surface water, physicochemical characteristics.
1. INTRODUCTION
Much of the current concern with regards to environmental quality is focused on water because of
its importance in maintaining the human health and health of the ecosystem. Fresh water is finite resource, essential
for agriculture, industry and even human existence, without fresh water of adequate quantity and quality, sustainable
development will not be possible1. There is an extensive literature, which stresses deterioration of water
quality2,3,4,5
.The addition of various kinds of pollutants and nutrients through the agency sewage, industrial effluents,
agricultural run off etc. in to the water bodies brings about a series of changes in the physicochemical and
characteristics of water, which have been the subject of several investigations6,7,8,9,10
. Fresh water resource is
becoming day-by-day at the faster rate of deterioration of the water quality is now a global problem11
. Discharge of
toxic chemicals, over pumping of aquifer and contamination of water bodies with substance that promote algae
growth are some of the today’s major cause for water quality degradation. Direct contamination of surface water
with metals in discharges from mining, smelting and industrial manufacturing, is a long-standing phenomenon.
Today there is trace contamination not only of surface water but also of groundwater bodies, which are susceptible
to leaching from waste dumps, mine tailings and industrial production sites12
.Organic manure, municipal waste and
some fungicides often contain fairly high concentration of heavy metals. Soils receiving repeated applications of
organic manures, fungicides and pesticides have exhibited high concentration of extractable heavy metals and that
thereby increase their concentration in runoff (Moore et al., 1998), while falling as rain, water picks up small
amounts of gases, ions, dust and particulate matter from the atmosphere12,13
.These added substances may be
arbitrarily classified as biological, chemical (both organic and inorganic), physical and radiological impurities. They
include industrial and commercial solvents, metal and acid salts, sediments, pesticides, herbicides, plant nutrients,
radioactive materials, decaying animal and vegetable matter and living microorganisms, such as algae, bacteria and
viruses14
. These impurities may give water a bad taste, color, odor or turbidity and cause hardness, corrosiveness,
staining or frothing15
. Water quality reflects the composition of water as affected by natural cause and man’s cultural
activities expressed in terms of measurable quantities and related to intended water use1. The composition of surface
and groundwater is dependent on natural factors (geological, topographical, meteorological, hydrological and
biological) in the drainage basin and varies with seasonal difference in runoff volumes, weather conditions and
IJRRAS 2 (3) ● March 2010 Mahananda & al. ● Physico-chemical Analysis of Ground & Surface Water
285
water levels16
. Groundwater is an increasingly important resource all over the world. The term groundwater is
usually reserved for the subsurface water that occurs beneath the water table in soils and geologic formation that are
fully saturated17
. It supports drinking water supply; livestock needs irrigation, industrial and many commercial
activities18
. Groundwater is generally less susceptible to contamination and pollution when compared to surface
water bodies19
. Also the natural impurities in rainwater, which replenishes groundwater systems, get removed while
infiltrating through soil strata18
. But, in India, where groundwater is used intensively for irrigation and industrial
purposes, a variety of land and water based human activities are causing pollution of this precious resource20
.
Importantly, groundwater can also be contaminated by naturally occurring sources. Soil and geologic formation
containing high levels of heavy metals can leach those metals into groundwater. This can be aggravated by over-
pumping wells, particularly for agriculture14
. Pollution caused by fertilizers and pesticides used in Agriculture, often
dispersed over large areas, is a great threat to fresh groundwater ecosystems. Pollution of groundwater due to
industrial effluents and municipal waste in water bodies is another major concern in many cities and industrial
clusters in India. Groundwater is very difficult to remediate, except in small defined areas and therefore the
emphasis has to be on prevention. Lakes and ponds in Orissa, have provided livelihood to millions of people over
the century. Orissa has about 1.2 lakh hectare of wet land comprising ponds, tanks and swamps. Owing to the
human activities, the ponds have become dumping ground of domestic wastes and other refuge of the society21
. So,
the knowledge of extent of pollution and the status of water become essential in order to preserve the valuable
sources of water for future generation.
The main objective of this work has to analyze various physico-chemical parameters of the surface and ground water
of Bargarh district, Orissa.
MATERIALS AND METHODS
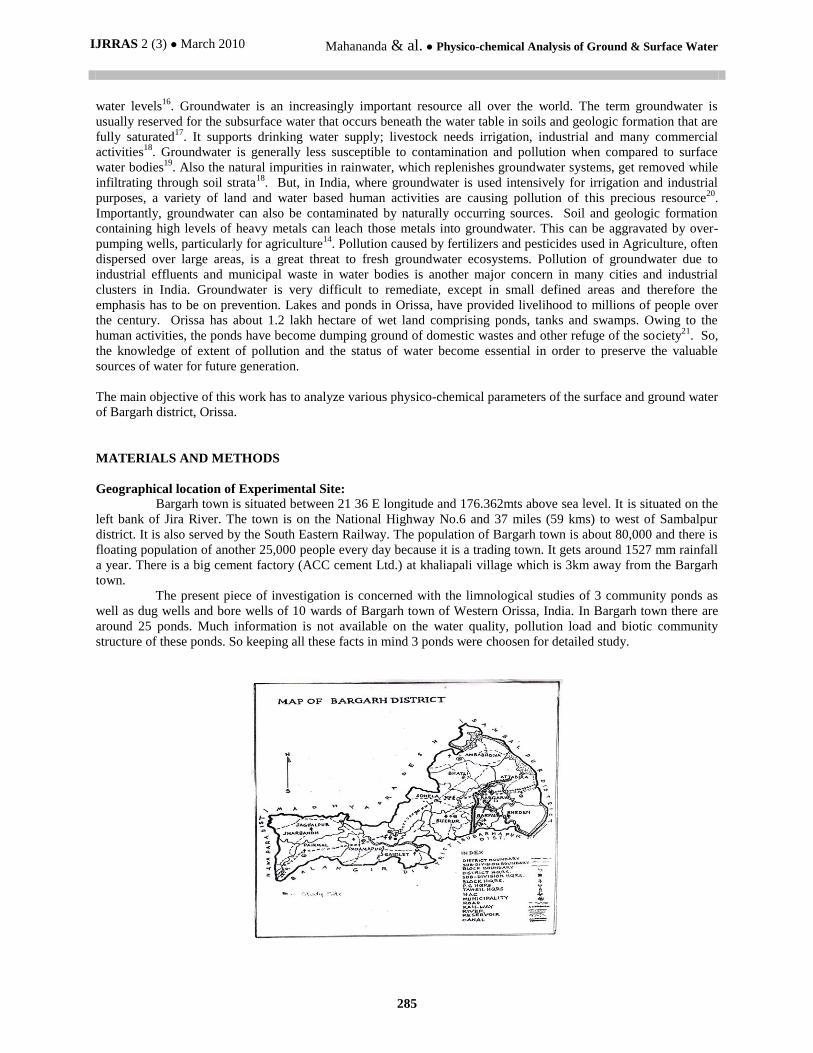
Geographical location of Experimental Site:
Bargarh town is situated between 21 36 E longitude and 176.362mts above sea level. It is situated on the
left bank of Jira River. The town is on the National Highway No.6 and 37 miles (59 kms) to west of Sambalpur
district. It is also served by the South Eastern Railway. The population of Bargarh town is about 80,000 and there is
floating population of another 25,000 people every day because it is a trading town. It gets around 1527 mm rainfall
a year. There is a big cement factory (ACC cement Ltd.) at khaliapali village which is 3km away from the Bargarh
town.
The present piece of investigation is concerned with the limnological studies of 3 community ponds as
well as dug wells and bore wells of 10 wards of Bargarh town of Western Orissa, India. In Bargarh town there are
around 25 ponds. Much information is not available on the water quality, pollution load and biotic community
structure of these ponds. So keeping all these facts in mind 3 ponds were choosen for detailed study.
IJRRAS 2 (3) ● March 2010 Mahananda & al. ● Physico-chemical Analysis of Ground & Surface Water
286
Temple pond (TP) locally known as Manabandha with less human activities. Another small community pond (SCP)
with diverse human activities like washing, bathing, defection on the bank etc. with intact banks. The third pond is a
large community pond (LCP) which does not have bank on all sides. This pond receives municipal waste on the one
side of its bank through open drains, particularly during rainy season. This pond is also used for various purposes as
mentioned under small community pond (SCP).
The pond temple is a square area pond with 32,400 sq. mt. in area.
The other study pond is a small community pond locally known as Dorabandha. It is a rectangular type of
pond having area 21,000 sq.mt
The third study pond is a large perennial community pond locally known as Khajuriketabandha having area
25,000 sq. mt.
The area experiences a seasonal tropical climate with a very not dry summer followed by well
distributed rain southeast monsoon. The climate can be broadly divided into three distinct seasons i.e. summer,
rainy, and winter. The summer extends from March to May, the rainy season from June to mid September and the
winter from mid September to February.
PHYSICOCHEMICAL ANALYSIS:
The temperatures of the samples were noted at the sampling point itself. The samples were put to examination in the
laboratory to determine some physical, chemical and biological parameters. Analysis was carried out for various
water quality parameters such as pH, TDS, TSS, Total alkalinity, DO, COD, Nitrate(NO2), Phosphate, Chloride,
Sodium, Potassium, Fluoride using standard method. The reagents used for the analysis were AR grade and double
distilled water was used for preparation of solutions. Presumptive test using lactose broth was performed for water
samples to detect the presence of bacteria.
RESULTS & DISCUSSION:
The variation in physico-chemical characteristics of the dug well water, and bore well water of ten wards
and three ponds have been summarized in the tables 1, 2, and 3. The interpretation of data has been made with the
help of statistical tools.
Temperature:
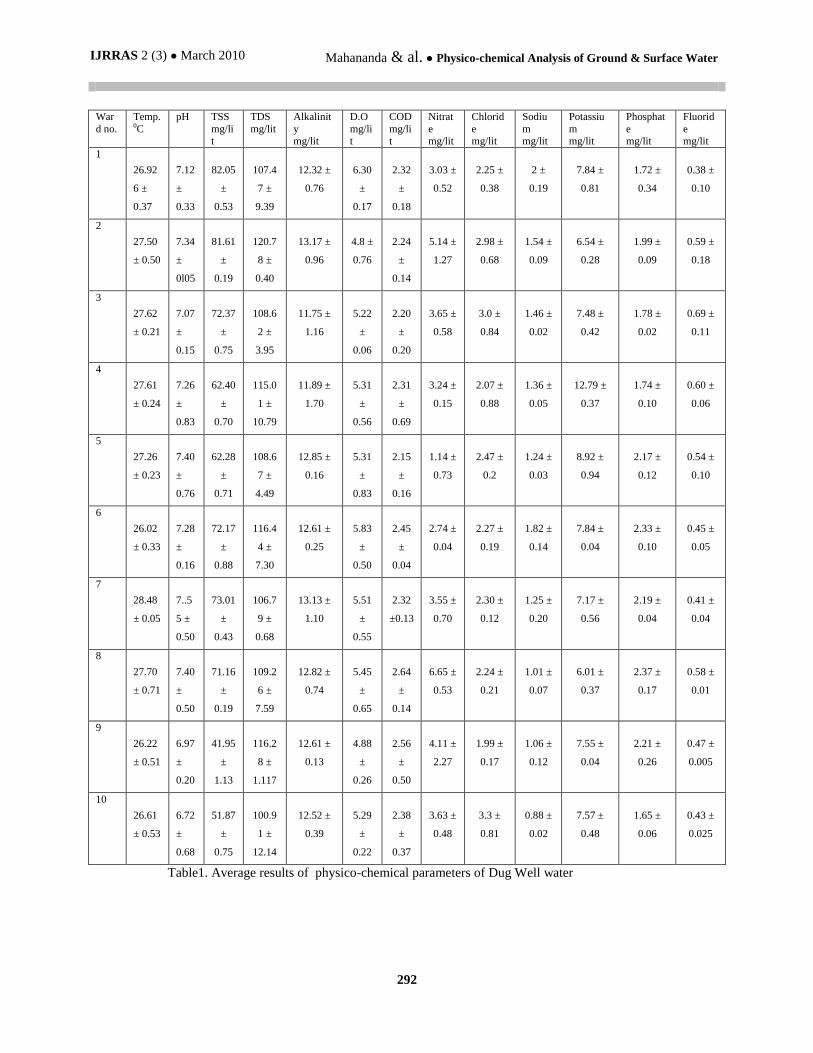
The temperature of dug well ranged from a minimum of 26.02 ± 0.330C to a maximum of 28.48 ± 0.05
0C in ward
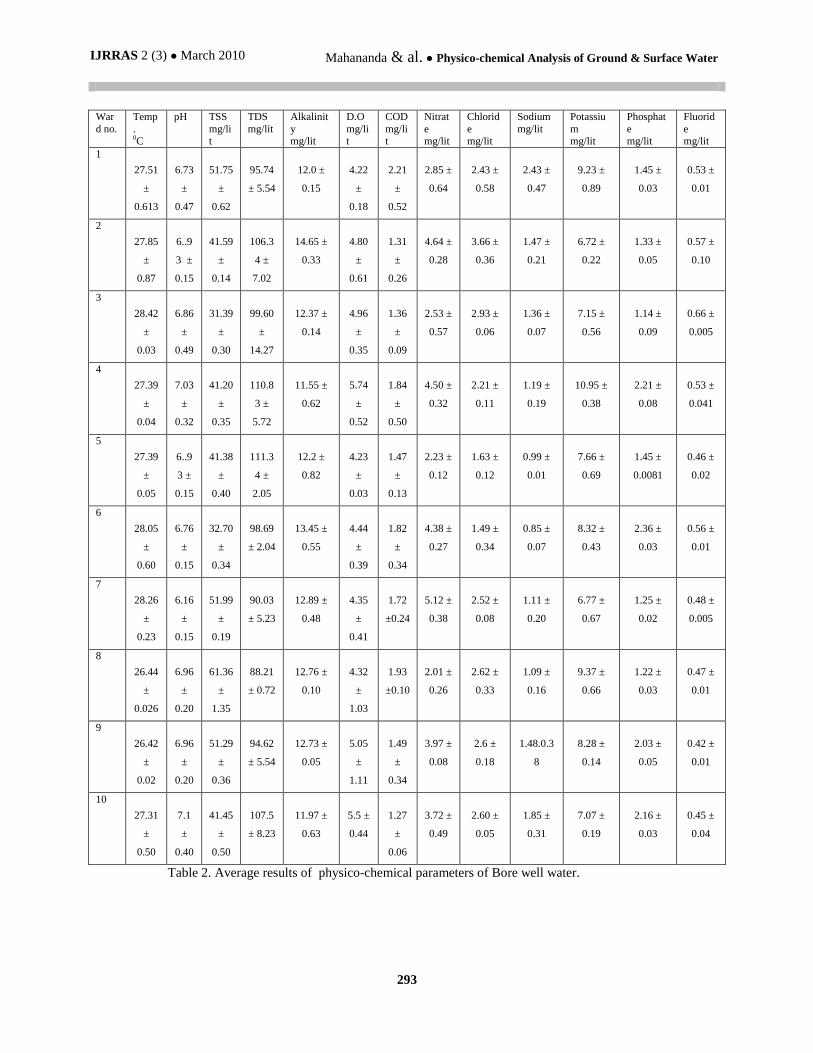
no. 6 and ward no. 7 respectively (Table-1). Similarly the variation in temperature of bore well water ranged from a
minimum of 26.42 ± 0.020C to a maximum of 28.42 ± 0.03 in ward no. 9 and ward no. 3 respectively (Table-2). In
case of pond water, the temperature of temple pond (TP) is highest i.e. 28.170C and temperature of large community
pond (LCP) is 26.90C (Table-3).
During the present investigation, there was no great difference between the temperature of the dug well and
bore well water, which can be explained on the basis of depth of water. In case of pond water, the difference
between air and water temperature of temple pond (TP) is comparatively more than small community pond (SCP)
and large community pond (LCP). This may be because of macrophytic growth in TP that act as blanket barrier
between air and water. (Wisenberg Lundi, 1943)
pH:
The pH of dug well water ranged from a minimum of 6.72±0.68 to a maximum of 7.55 ± 0.50 of ward no.10 and
ward no. 7 respectively (Table-1). Similarly the variation of pH of bore well water ranged from a minimum of 6.16
± 0.15 to a maximum of 7.03 ± 0.32 of ward no. 7 and ward no. 4 respectively (Table-2). In case of pond water, pH
values of all the three ponds were found to be high. The maximum value was 9.45 of LCP and the minimum value
was 8.2 of TP (Table-3).
During the present investigation a pattern of pH change was noticed. In both dug well and bore well the
maximum value of pH, which indicates the alkaline nature of water might be due to high temperature that reduces
IJRRAS 2 (3) ● March 2010 Mahananda & al. ● Physico-chemical Analysis of Ground & Surface Water
287
the solubility of CO2. In all the ponds, pH is always alkaline. The photosynthetic activity of dense phytoplankton in
SCP and LCP is the cause of higher pH value in SCP and LCP than TP.
Total Suspended Solids (TSS):
The total suspended solids of dug well water varied from a minimum of 41.95 ± 1.13 mg/lit to a maximum of 82.05
± 0.53mg/lit of ward no. 9 and ward no.1 respectively (Table-1). Similarly the variation of total suspended solids of
bore well water varied from a minimum of 31.39 ± 0.30 mg/lit and 61.36 ± 1.35 mg/lit of ward no. 3 and ward no. 8
respectively (Table-2). The total suspended solids in SCP was maximum i.e. 1162 mg/lit and minimum was 284
mg/lit in TP (Table-3).
Water high in suspended solid may be aesthetically unsatisfactory for bathing22
. The total
suspended solids are composed of carbonates, bicarbonates, chlorides, phosphates and nitrates of calcium,
magnesium, sodium, potassium, manganese, organic matter, salt and other particles. The effect of presence of total
suspended solids is the turbidity due to silt and organic matter. In dug well, the minimum value was recorded in
ward no. 10 and maximum value in ward no. 9. In bore well, the minimum value was recorded in ward no. 3. The
maximum number is ward no 8 might be due to the presence of several suspended particles. The higher amount of
total solids in SCP in comparison to TP and LCP was perhaps due to run off from many bathing ghats, municipality
solid garbage dump and other wastages. The higher concentration of total suspended solid in SCP is an index that it
is more polluted.
Total Dissolved Solid (TDS):
The total dissolved solids of dug well water ranged from a minimum of 100.91 ± 12.14 mg/lit to
a maximum of 120.78 ± 0.40 mg/lit of ward no. 10 and ward no. 2 respectively (Table-1). Similarly the variation of
total dissolved solids of bore well water ranged from a minimum of 88.21 ± 0.72 mg/lit to a maximum of 111.34 ±
2.05 mg/lit of ward no. 8 and ward no. 5 respectively (Table-2). The dissolved solid of SCP was maximum i.e. 1132
mg/lit and the dissolved solid of TP was minimum i.e. 323 mg/lit (Table-3).
In water, total dissolved solids are composed mainly of carbonates, bicarbonates, chlorides, phosphates
and nitrates of calcium, magnesium, sodium, potassium and manganese, organic matter, salt and other particles.
Their minimum values were recorded in ward no. 10 and in ward no. 8 for dug well and bore well respectively. In
SCP, the maximum value of TDS was recorded which reflects the pollution of SCP.
Alkalinity:
Table: 1 represent the variation in total alkalinity of dug well water ranged from a minimum of
11.75 ± 1.16 mg/lit to a maximum of 13.17 ± 0.96 mg/lit ward no. 3 and ward no. 2 respectively. Similarly the
variation in total alkalinity of bore well water ranged from a minimum of 11.55 ± 0.62 mg/lit to a maximum of
14.65 ± 0.33 mg/lit of ward no. 4 and ward no. 2 respectively (Table-2). Table: 3 represent the variation in
total alkalinity of pond water. The maximum value was 369 mg/lit in SCP and the minimum value was 119 mg/lit
in LCP.
The alkalinity of water is caused mainly due to OH, CO3, HCO3 ions. Alkalinity is an estimate of the
ability of water to resist change in pH upon addition of acid. The alkalinity of dug well water was minimum in ward
no. 3 and alkalinity of bore well water was minimum in ward no. 4. The maximum alkalinity for dug well and bore
well water was recorded in ward no. 2. This may be due to low water table and lower temperature bringing down
the rate of decomposition of salts to a minimum there by increasing the alkalinity. The alkalinity of SCP is higher
than the other 2 ponds which exceed the highest desirable limit but within maximum permissible limit as per ICMR
specification, so from alkalinities point of view, qualities of water is poor.
Dissolved Oxygen (DO):
Table 1 & 2 show the variation is dissolved oxygen of dug well water and bore well water. The
dissolved oxygen of dug well water ranged from a minimum of 4.8 ± 0.76 mg/lit to a maximum of 6.30 ± 0.17
mg/lit of ward no.2 and ward no. 1 respectively. Similarly the dissolved oxygen of bore well water ranged from a
minimum of 4.22 ± 0.18 mg/lit to a maximum of 5.74 ± 0.52 mg/lit of ward no. 1 and ward no.4 respectively.Table-
3 shows the variation in dissolved oxygen of pond water. The maximum value of DO was found to be 6.25 mg/lit in
LCP and the minimum value of DO was found to be 2.35 mg/lit SCP.
IJRRAS 2 (3) ● March 2010 Mahananda & al. ● Physico-chemical Analysis of Ground & Surface Water
288
The minimum value of DO was recorded in ward no. 2 in the case of dug well and in ward no. 1 in case
of bore well is might be due to the high rate of oxygen consumption by oxidisable mater. The maximum values
were recorded in ward no. 1 and ward no. 4 for dug well and bore well respectively can be explained on the basis of
the capacity of water to hold oxygen. In LCP, the mean oxygen content was higher than TP and SCP. The higher
level of nutrient load and other factors caused lower level of DO in LCP.
Chemical Oxygen Demand (COD):
Table 1 and 2 show the variation in COD of dug well water and bore well water. The COD of dug
well water ranged from a minimum of 2.15 ± 0.16 mg/lit to a maximum of 2.64 ± 0.14 mg/lit of ward no. 5 and ward
no. 8 respectively. Similarly the COD value of bore well water ranged from a minimum of 1.27 ± 0.06 mg/lit to a
maximum of 2.21 ± 0.52 mg/lit of ward no. 10 and ward no. 1 respectively. Table 3 represents the variation in COD
of pond water. The COD of TP was found to be minimum i.e. 30.87 mg/lit and the COD value of SCP was found to
be maximum i.e. 134.65 mg/lit.
Chemical oxygen demand determines the oxygen required for chemical oxidation of organic matter.
COD values convey the amount of dissolved oxidisable organic matter including the non-biodegradable matters
present in it. The minimum values of COD in ward no. 5 and ward no. 10 of dug well and bore well respectively
might be due to low organic matter. While the maximum value in ward no. 8 and ward no. 1 of dug well and bore
well respectively might be due to high concentration of pollutants and organic matter. In TP, low COD value in
comparison to SCP and LCP was observed which indicates that SCP and LCP are more pollutant than TP.
Nitrate:
Table 1 and 2 show the variation in nitrate content of dug well and bore well water. The variation in nitrate content
of dug well water ranged from a minimum of 1.14 ± 0.73 mg/lit to a maximum of 6.65 ± 0.53mg/lit of ward no. 5
and ward no. 8 respectively. Similarly the variation in nitrate content of bore well water ranged from a minimum of
2.01 ± 0.26 mg/lit to a maximum of 5.12 ± 0.38mg/lit of ward no. 8 and ward no. 7 respectively. Table-3 shows the
variation in nitrate content of pond water. The maximum nitrate content was found in SCP i.e. 7.25 mg/lt and the
minimum was founding TP i.e. 6.21mg/lt.
Nitrates represent the final product of the biochemical oxidation of ammonia. Monitoring of nitrates in
drinking water supply is very important because of health effects on humans and animals. The nitrate content was
minimum in ward no. 5 and ward no.8 for dug well and bore well respectively. The maximum nitrate content was in
ward no. 8 and ward no. 7 for dug well and bore well respectively. This might be due to leaching of nitrate from
near by agricultural field. Maximum nitrate content was found in SCP than TP & LCP which indicates that the
water of SCP is more pollutant.
Chloride:
Table 1 and 2 show the variation in chloride content of dug well and bore well water. The
chloride content of dug well water ranged from a minimum of 1.99 ± 0.17 mg/lit to a maximum of 3.3 ± 0.81 mg/lit
of ward no. 9 and ward no.10 respectively. Similarly the chloride content of bore well water ranged from a
minimum of 1.49 ± 0.34mg/lit to a maximum of 3.66 ± 0.36 mg/lit of ward no. 6 and ward no. 2 respectively. Table
3 shows the variation in chloride content of pond water. The maximum chloride content was found to be 9.25 mg/lit
in SCP and the minimum chloride content was found to be 7.65 mg/lit in TP.
The minimum values of chloride content were recorded in ward no. 9 and ward no.6 for dug well and
bore well respectively and the maximum values were recorded in ward no. 10 and ward no. 2 for dug well and bore
well respectively. The higher content of chloride in ponds may be due to animal origin like human faces and sewage
inflow. Chloride increases with the increasing degree of eutrophication. The maximum chloride was found in SCP
which indicates that higher amount of pollutants present in the pond and the minimum value was recorded in TP.
Sodium:
Table 1 and 2 show the variation in sodium content of dug well and bore well. The sodium
content of dug well ranged from a minimum of 0.88 ± 0.02 mg/lit to a maximum of 2.0 ± 0.19 mg/lit of ward no.10
and ward no.1 respectively. Similarly the sodium content of bore well ranged from a minimum of 0.85 ± 0.07mg/lit
to a maximum of 2.43 ± 0.47 mg/lit of ward no.6 and ward no. 1 respectively. Table 3 shows the variation in sodium
content of pond water. The maximum sodium content was found in LCP i.e. 1.08 mg/lit and the minimum sodium
content was found in TP i.e. 0.32 mg/lit.
The minimum value of 0.88 mg/lit in ward no. 10 and 0.85 mg/lit in ward no. 6 of dug well and bore
well respectively can be explained on the basis of lower microbial activity. While the maximum value of 2 mg/lit in
ward no. 1 and 2.43 mg/lit of ward no. 1 of dug well and bore well respectively might be due to high rate of
IJRRAS 2 (3) ● March 2010 Mahananda & al. ● Physico-chemical Analysis of Ground & Surface Water
289
mineralization in the sediments, increasing sodium into the nutrient pool there by making more sodium to solubilise
.In surface water the sodium concentration may be less than 1 mg/lit or exceed 300 mg/lit depending upon the
geographical area. The highest amount of sodium, potassium and chloride in SCP made the water of SCP sour to
taste. The minimum value was recorded in TP. Water containing more than 200 mg/lit sodium should not be used
for drinking by those on moderately restricted sodium diet. A maximum drinking water standard of 100 mg/lit has
been proposed for general public.
Potassium:
Table 1 and 2 show the variation in potassium content of dug well and bore well. The variation in
potassium content in dug well ranged from a minimum of 6.01 ± 0.37mg/lit to a maximum of 12.79 ± 0.37 mg/lit of
ward no.8 and ward no. 4 respectively. Similarly the variation in potassium content of bore well ranged from a
minimum of 6.72 ± 0.22 mg/lit to a maximum of 10.95 ± 0.38 mg/lit of ward no.2 and ward no. 4 respectively.
Table 3 shows the variation in potassium content in pond water. The maximum value of potassium was found to be
7.21mg/lit in LCP and the minimum value of potassium is found to be 6.26 mg/lit in TP.
Potassium remains mostly in solution without undergoing precipitation. The high value in ward no. 4
both for dug well and bore well might be due to the presence of geochemical strata in both dug well and bore well.
The potassium content was higher in SCP than TP and LCP.
Phosphate:
The variation in phosphate content in dug well and bore well water is shown in table 1 and 2. The
variation in phosphate content in dug well ranged from a minimum of 1.65 ± 0.06 mg/lit in ward no.10 to a
maximum of 2.37 ± 0.17 mg/lit in ward no. 8. The variation in phosphate content of bore well ranged from a
minimum of 1.14 ± 0.09 mg/lit to a maximum of 2.36 ± 0.03 mg/lit of ward no.3 and ward no. 6 respectively. Table
3 shows the variation in phosphate content in pond water. The maximum value was found to be 1.75 mg/lit in TP
and the minimum value was found to be 1.42 mg/lit in LCP.
Phosphate occurs in natural waters in low quantity as many aquatic plants absorb and store phosphorous
many times their actual immediate needs. Maximum phosphate concentration is observed in dug well which
interferes with chemical coagulation of turbid water. In dug well, maximum value was found in ward no. 8 and
minimum value was found in ward no. 10. In bore well, maximum value was found in ward no. 6 and minimum
value was found in ward no. 3. In pond water, the maximum value was found in TP than SCP and LCP. The
maximum value may be due to the solar radiation, which might have encouraged the biological degradation of the
organic matter.
Fluoride:
Table 1 and 2 shows the variation in fluoride in dug well and bore well water. The variation in fluoride of dug well
water ranged from a minimum of 0.38 ± 0.10 mg/lit to a maximum of 0.69 ± 0.11 mg/lit of ward no.1 and ward no.
3 respectively. Similarly the variation in fluoride of bore well water ranged from a minimum of 0.42 ± 0.01 mg/lit
to a maximum of 0.66 ± 0.005 mg/lit of ward no. 9 and word no. 3 respectively. Table 3 shows the variation in
fluoride in pond water. The maximum fluoride content was found to be 0.51 mg/lit in SCP and the minimum was
found to be 0.32 mg/lit in LCP.
Fluoride at a lower concentration at an average of 1 mg/lit is regarded as an important constituent of
drinking water23
. The minimum value were recorded in ward no. 9 and 1 of dug well and bore well respectively
while the maximum values were recorded in ward no. 3 for both water. The values are lower than the prescribed
value. But as its high concentration cause serious health problem in that concern it is well below. Surface water
generally contains less than 0.5 mg/lit fluoride. However, when present in much greater concentration, it becomes a
pollutant. Areas exist where the fluoride content of water ranges from 1.5 to 6 mg/lit, for example in the Kurnool
district of Andhra Pradesh. In the present investigation, the maximum value was recorded in SCP.
Total Coliform and Faecal Coliform:
The maximum numbers of total coliform were found to be 2200/100 ml in TP, and the minimum
numbers of total coliform were found to be 290/100 ml in LCP. The numbers of total Coliform were found to be
980/100 ml in SCP. The maximum numbers of faecal Coliform were found to be 340/100 ml in LCP and the
minimum numbers of faecal Coliform were found to be 8/100 ml in TP. The numbers of Faecal Coliform were
found to be 87/100 ml in SCP.
The fairly high values of total Coliform and faecal Coliform are indicative of increasing pollution
of the ponds by organic means particularly through the discharge of sewage and domestic effluents into the ponds.
The total coliforms were found maximum in TP and faecal coliform were found maximum in LCP which is due to
IJRRAS 2 (3) ● March 2010 Mahananda & al. ● Physico-chemical Analysis of Ground & Surface Water
290
discharge of excreta from human beings and other homeotherms. Therefore a potential health risk exists due to
presence of microbial pathogens in water.
Statistical Analysis-
Interrelationship studies between different variables are very helpful tool in promoting research and
opening new frontiers of knowledge. The study of correlation reduces the range of uncertainty associated with
decision making. The correlation coefficient analysis was done by using SPSS statistical tools and the data were
depicted in Table- 4, 5 & 6.
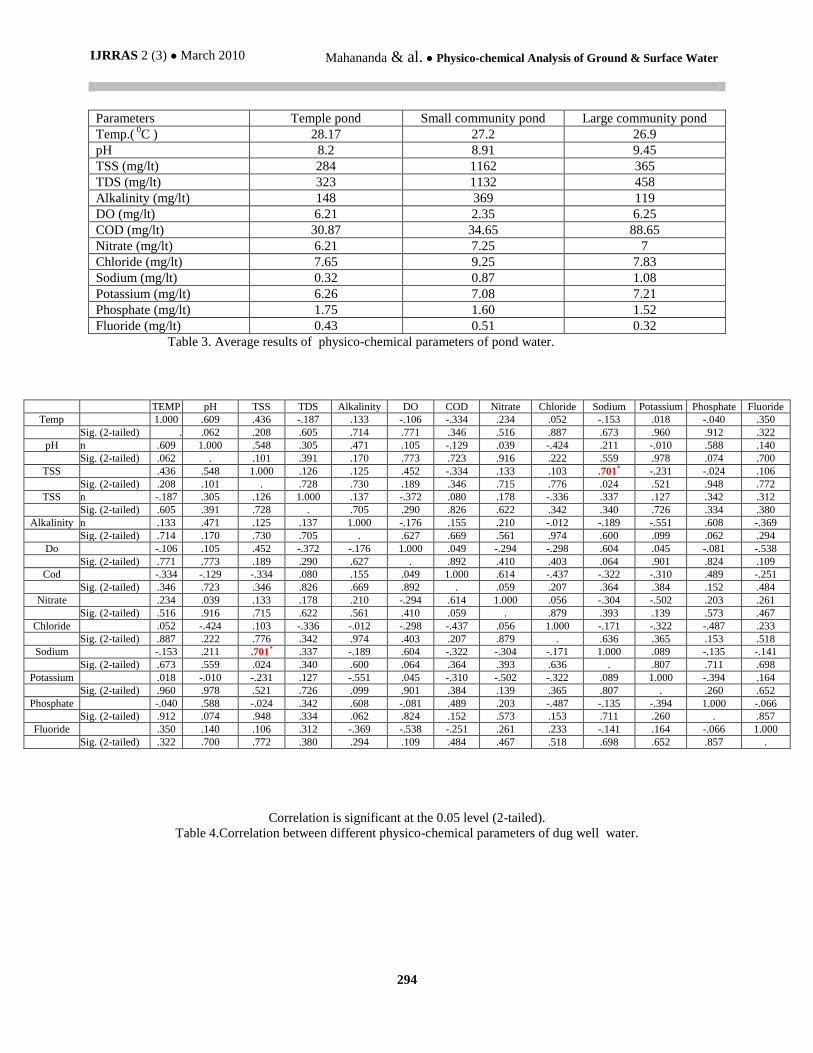
In Dug well water, the high positively correlated value (0.701) was found between the Sodium and Total
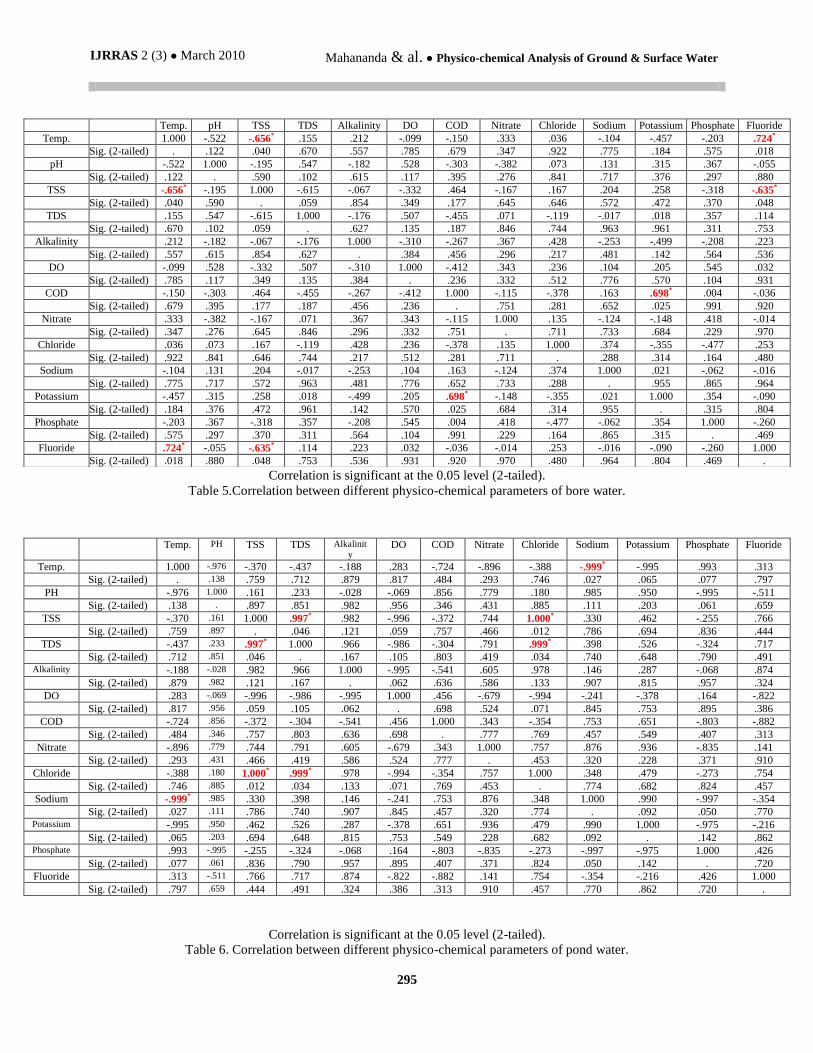
suspended solid (TSS). In Bore well water, the high positively correlated values were found between Temperature
and Fluoride (0.724), COD and Potassium (0.698).In Bore well water, the high negatively correlated values were
found between TSS and Temperature (-0.656), TSS and Fluoride (-.635).The high positively correlated values in
Pond water were TSS and Chloride (1.000), TDS and Chloride (0.999), TSS and TDS (0.997). In pond water, the
high negatively correlated value was between Sodium and Temperature (-.999).
CONCLUSION
The study assessed the evolution of water quality in ground water and pond water of Bargarh district. A
comparative study of both type of ground water i.e. dug well and bore well as well as pond water was carried out by
taking certain important parameters like temperature, pH, total suspended solid, total dissolved solid, alkalinity,
dissolved oxygen, chemical oxygen demand, nitrate, chloride, sodium, potassium, phosphate, fluoride and total
coliform and faecal coliform (pond water).
In this present investigation it was found that the maximum parameters were not at the level of
pollution except few parameters like nitrate for ground water. So both type of ground water satisfy the requirement
for the use in various purposes. But the study of pond water indicated that the community ponds are highly polluted
and unsafe for human use. Temple pond is comparatively less polluted than small community pond and large
community pond.
REFERENCES
1. N. Kumar, “A View on Freshwater environment”, Ecol. Env & Cons. 3, 1997 (3-4).
2. T.N. Tiwari, and M. Mishra, “Pollution in the river Ganga at Varanashi”. Life Science Advances 5, 1986, pp.
130-137.
3. T.N. Tiwari, and M. Ali, “River pollution in Katmandu valley variation of water quality index”, JEP I, 1987,
pp. 347-351.
4. P.M Reddy, and V. Venkateswar, “Assessment of water quality in the river Tungabhadra near Kurnol”, A.P.J.
Environ. Biol. 8, 1987, pp. 109-119.
5. R.D.Khulab, “Prospective in aquatic biology”. Papyrus Pub. House, New Delhi. ed 1989.
6. R.A. Vollenweidre, “Scientific fundamental of the eutrophication of lakes and flowing waters with special
reference to nitrogen and phosphorus, as factoring eutrophication”. O. E C. D. Paris. 1986.
7. National Academy of Science. Eutrophication causes consequences and correctives. Nat.Acad. Sci. Washington,
D.C.
8. C.P.Milway, “Educational in large lakes and impoundments”. Proc.Upplasale Symp. DECD Paris. 1969.
9. T. Olimax, and U. Sikorska, “Field experiment on the effect of municipal sewage on macrophytes and epifauna
in the lake littoral”. Bull. Acad. Pol. Sc. Clii 23, 1975, pp.445-447.
IJRRAS 2 (3) ● March 2010 Mahananda & al. ● Physico-chemical Analysis of Ground & Surface Water
291
10. E. Piecznska, Usikorna and T. Olimak, “The influence of domestic sewage on the littoral zone of lakes”. Pol.
Arch. Hydrobiol. 22, 1975,pp.141-156.
11. H.B.Mahananda, M.R. Mahananda, and B.P. Mohanty, “Studies on the Physico-chemical and Biological
Parameters of a Fresh Water Pond Ecosystem as an Indicator of Water Pollution”. Ecol. Env & Cons.11(3-4),
2005, pp 537-541.
12. P.D.Moore, Jr. T.C. Daniel, J.T.Gilmour, B.R. Shereve, D.R.Edward, and B.H.Wood, “Decreasing Metal
Runoff from Poultry Litter with Aluminium Sulfate”. J. Env. Qual. 27 , 1998,pp.92-99.
13. A. Kumar, Periodicity and Abundance of Plankton in Relation to Physico-Chemical Characteristics of Tropical
Wetlands of South Bihar. Ecol. Env. and Cons. Vol., 1995, pp.47-54.
14. Gay and Proop, “Aspects of River Pollution, Butterworths Scientific Publication”, London. 1993.
15. R.A.Vollenwider, “Water Management research. Scientific fundamentals of the of the eutrophication of lakes
and flowing waters with particular reference to nitrogen and phosphorus as factor in eutorophication,” 1998, pp.
45-72.
16. B.A.Muller, : Residential Water Source and the Risk of Childhood Brain Tumors. Env. Health. Perspt. Vol. 109
(6), 2001.
17. P.G. “Parivesh Groundwater”, Ed. Dilip Biswas, July 2003 p. 3.
18. P.J.Veslind, “National Geographic Senior Writer”, National Geographic, Vol. 183, No. 5. 1993.
19. C.L. Zaman, “A Nested Case Control Study of Methemoglobinemia Risk Factors in Children of Transylvania,
Romania”. Env. Health Perspt. Vol. 110 (B), 2002.
20. R.K. Trivedy, “Physico-Chemical Characteristics and Phytoplankton of the River Panchganga Near Kolhapur,
Maharastra”. River Pollution in India (Ed. R.K. Trivedy) Ashish Publishing House, New Delhi, 1990,pp.159-
178.
21. Welch, Limnology 2nd
Edn. McGraw Hill Book Co., New York. 1952.
22. APHA, “Standard method for examination of water and waste water”, American Public Health Association,
Washington, D.C. 1989.
23. WHO, World Health Organisation, 1972.
IJRRAS 2 (3) ● March 2010 Mahananda & al. ● Physico-chemical Analysis of Ground & Surface Water
292
War
d no.
Temp. 0C
pH TSS
mg/lit
TDS
mg/lit
Alkalinit
y mg/lit
D.O
mg/lit
COD
mg/lit
Nitrat
e mg/lit
Chlorid
e mg/lit
Sodiu
m mg/lit
Potassiu
m mg/lit
Phosphat
e mg/lit
Fluorid
e mg/lit
1
26.92
6 ±
0.37
7.12
±
0.33
82.05
±
0.53
107.4
7 ±
9.39
12.32 ±
0.76
6.30
±
0.17
2.32
±
0.18
3.03 ±
0.52
2.25 ±
0.38
2 ±
0.19
7.84 ±
0.81
1.72 ±
0.34
0.38 ±
0.10
2
27.50
± 0.50
7.34
±
0l05
81.61
±
0.19
120.7
8 ±
0.40
13.17 ±
0.96
4.8 ±
0.76
2.24
±
0.14
5.14 ±
1.27
2.98 ±
0.68
1.54 ±
0.09
6.54 ±
0.28
1.99 ±
0.09
0.59 ±
0.18
3
27.62
± 0.21
7.07
±
0.15
72.37
±
0.75
108.6
2 ±
3.95
11.75 ±
1.16
5.22
±
0.06
2.20
±
0.20
3.65 ±
0.58
3.0 ±
0.84
1.46 ±
0.02
7.48 ±
0.42
1.78 ±
0.02
0.69 ±
0.11
4
27.61
± 0.24
7.26
±
0.83
62.40
±
0.70
115.0
1 ±
10.79
11.89 ±
1.70
5.31
±
0.56
2.31
±
0.69
3.24 ±
0.15
2.07 ±
0.88
1.36 ±
0.05
12.79 ±
0.37
1.74 ±
0.10
0.60 ±
0.06
5
27.26
± 0.23
7.40
±
0.76
62.28
±
0.71
108.6
7 ±
4.49
12.85 ±
0.16
5.31
±
0.83
2.15
±
0.16
1.14 ±
0.73
2.47 ±
0.2
1.24 ±
0.03
8.92 ±
0.94
2.17 ±
0.12
0.54 ±
0.10
6
26.02
± 0.33
7.28
±
0.16
72.17
±
0.88
116.4
4 ±
7.30
12.61 ±
0.25
5.83
±
0.50
2.45
±
0.04
2.74 ±
0.04
2.27 ±
0.19
1.82 ±
0.14
7.84 ±
0.04
2.33 ±
0.10
0.45 ±
0.05
7
28.48
± 0.05
7..5
5 ±
0.50
73.01
±
0.43
106.7
9 ±
0.68
13.13 ±
1.10
5.51
±
0.55
2.32
±0.13
3.55 ±
0.70
2.30 ±
0.12
1.25 ±
0.20
7.17 ±
0.56
2.19 ±
0.04
0.41 ±
0.04
8
27.70
± 0.71
7.40
±
0.50
71.16
±
0.19
109.2
6 ±
7.59
12.82 ±
0.74
5.45
±
0.65
2.64
±
0.14
6.65 ±
0.53
2.24 ±
0.21
1.01 ±
0.07
6.01 ±
0.37
2.37 ±
0.17
0.58 ±
0.01
9
26.22
± 0.51
6.97
±
0.20
41.95
±
1.13
116.2
8 ±
1.117
12.61 ±
0.13
4.88
±
0.26
2.56
±
0.50
4.11 ±
2.27
1.99 ±
0.17
1.06 ±
0.12
7.55 ±
0.04
2.21 ±
0.26
0.47 ±
0.005
10
26.61
± 0.53
6.72
±
0.68
51.87
±
0.75
100.9
1 ±
12.14
12.52 ±
0.39
5.29
±
0.22
2.38
±
0.37
3.63 ±
0.48
3.3 ±
0.81
0.88 ±
0.02
7.57 ±
0.48
1.65 ±
0.06
0.43 ±
0.025
Table1. Average results of physico-chemical parameters of Dug Well water
IJRRAS 2 (3) ● March 2010 Mahananda & al. ● Physico-chemical Analysis of Ground & Surface Water
293
War
d no.
Temp
. 0C
pH TSS
mg/lit
TDS
mg/lit
Alkalinit
y mg/lit
D.O
mg/lit
COD
mg/lit
Nitrat
e mg/lit
Chlorid
e mg/lit
Sodium
mg/lit
Potassiu
m mg/lit
Phosphat
e mg/lit
Fluorid
e mg/lit
1
27.51
±
0.613
6.73
±
0.47
51.75
±
0.62
95.74
± 5.54
12.0 ±
0.15
4.22
±
0.18
2.21
±
0.52
2.85 ±
0.64
2.43 ±
0.58
2.43 ±
0.47
9.23 ±
0.89
1.45 ±
0.03
0.53 ±
0.01
2
27.85
±
0.87
6..9
3 ±
0.15
41.59
±
0.14
106.3
4 ±
7.02
14.65 ±
0.33
4.80
±
0.61
1.31
±
0.26
4.64 ±
0.28
3.66 ±
0.36
1.47 ±
0.21
6.72 ±
0.22
1.33 ±
0.05
0.57 ±
0.10
3
28.42
±
0.03
6.86
±
0.49
31.39
±
0.30
99.60
±
14.27
12.37 ±
0.14
4.96
±
0.35
1.36
±
0.09
2.53 ±
0.57
2.93 ±
0.06
1.36 ±
0.07
7.15 ±
0.56
1.14 ±
0.09
0.66 ±
0.005
4
27.39
±
0.04
7.03
±
0.32
41.20
±
0.35
110.8
3 ±
5.72
11.55 ±
0.62
5.74
±
0.52
1.84
±
0.50
4.50 ±
0.32
2.21 ±
0.11
1.19 ±
0.19
10.95 ±
0.38
2.21 ±
0.08
0.53 ±
0.041
5
27.39
±
0.05
6..9
3 ±
0.15
41.38
±
0.40
111.3
4 ±
2.05
12.2 ±
0.82
4.23
±
0.03
1.47
±
0.13
2.23 ±
0.12
1.63 ±
0.12
0.99 ±
0.01
7.66 ±
0.69
1.45 ±
0.0081
0.46 ±
0.02
6
28.05
±
0.60
6.76
±
0.15
32.70
±
0.34
98.69
± 2.04
13.45 ±
0.55
4.44
±
0.39
1.82
±
0.34
4.38 ±
0.27
1.49 ±
0.34
0.85 ±
0.07
8.32 ±
0.43
2.36 ±
0.03
0.56 ±
0.01
7
28.26
±
0.23
6.16
±
0.15
51.99
±
0.19
90.03
± 5.23
12.89 ±
0.48
4.35
±
0.41
1.72
±0.24
5.12 ±
0.38
2.52 ±
0.08
1.11 ±
0.20
6.77 ±
0.67
1.25 ±
0.02
0.48 ±
0.005
8
26.44
±
0.026
6.96
±
0.20
61.36
±
1.35
88.21
± 0.72
12.76 ±
0.10
4.32
±
1.03
1.93
±0.10
2.01 ±
0.26
2.62 ±
0.33
1.09 ±
0.16
9.37 ±
0.66
1.22 ±
0.03
0.47 ±
0.01
9
26.42
±
0.02
6.96
±
0.20
51.29
±
0.36
94.62
± 5.54
12.73 ±
0.05
5.05
±
1.11
1.49
±
0.34
3.97 ±
0.08
2.6 ±
0.18
1.48.0.3
8
8.28 ±
0.14
2.03 ±
0.05
0.42 ±
0.01
10
27.31
±
0.50
7.1
±
0.40
41.45
±
0.50
107.5
± 8.23
11.97 ±
0.63
5.5 ±
0.44
1.27
±
0.06
3.72 ±
0.49
2.60 ±
0.05
1.85 ±
0.31
7.07 ±
0.19
2.16 ±
0.03
0.45 ±
0.04
Table 2. Average results of physico-chemical parameters of Bore well water.
IJRRAS 2 (3) ● March 2010 Mahananda & al. ● Physico-chemical Analysis of Ground & Surface Water
294
Parameters Temple pond Small community pond Large community pond
Temp.( 0C ) 28.17 27.2 26.9
pH 8.2 8.91 9.45
TSS (mg/lt) 284 1162 365
TDS (mg/lt) 323 1132 458
Alkalinity (mg/lt) 148 369 119
DO (mg/lt) 6.21 2.35 6.25
COD (mg/lt) 30.87 34.65 88.65
Nitrate (mg/lt) 6.21 7.25 7
Chloride (mg/lt) 7.65 9.25 7.83
Sodium (mg/lt) 0.32 0.87 1.08
Potassium (mg/lt) 6.26 7.08 7.21
Phosphate (mg/lt) 1.75 1.60 1.52
Fluoride (mg/lt) 0.43 0.51 0.32
Table 3. Average results of physico-chemical parameters of pond water.
Correlation is significant at the 0.05 level (2-tailed).
Table 4.Correlation between different physico-chemical parameters of dug well water.
TEMP pH TSS TDS Alkalinity DO COD Nitrate Chloride Sodium Potassium Phosphate Fluoride
Temp 1.000 .609 .436 -.187 .133 -.106 -.334 .234 .052 -.153 .018 -.040 .350
Sig. (2-tailed) . .062 .208 .605 .714 .771 .346 .516 .887 .673 .960 .912 .322
pH n .609 1.000 .548 .305 .471 .105 -.129 .039 -.424 .211 -.010 .588 .140
Sig. (2-tailed) .062 . .101 .391 .170 .773 .723 .916 .222 .559 .978 .074 .700
TSS .436 .548 1.000 .126 .125 .452 -.334 .133 .103 .701* -.231 -.024 .106
Sig. (2-tailed) .208 .101 . .728 .730 .189 .346 .715 .776 .024 .521 .948 .772
TSS n -.187 .305 .126 1.000 .137 -.372 .080 .178 -.336 .337 .127 .342 .312
Sig. (2-tailed) .605 .391 .728 . .705 .290 .826 .622 .342 .340 .726 .334 .380
Alkalinity n .133 .471 .125 .137 1.000 -.176 .155 .210 -.012 -.189 -.551 .608 -.369
Sig. (2-tailed) .714 .170 .730 .705 . .627 .669 .561 .974 .600 .099 .062 .294
Do -.106 .105 .452 -.372 -.176 1.000 .049 -.294 -.298 .604 .045 -.081 -.538
Sig. (2-tailed) .771 .773 .189 .290 .627 . .892 .410 .403 .064 .901 .824 .109
Cod -.334 -.129 -.334 .080 .155 .049 1.000 .614 -.437 -.322 -.310 .489 -.251
Sig. (2-tailed) .346 .723 .346 .826 .669 .892 . .059 .207 .364 .384 .152 .484
Nitrate .234 .039 .133 .178 .210 -.294 .614 1.000 .056 -.304 -.502 .203 .261
Sig. (2-tailed) .516 .916 .715 .622 .561 .410 .059 . .879 .393 .139 .573 .467
Chloride .052 -.424 .103 -.336 -.012 -.298 -.437 .056 1.000 -.171 -.322 -.487 .233
Sig. (2-tailed) .887 .222 .776 .342 .974 .403 .207 .879 . .636 .365 .153 .518
Sodium -.153 .211 .701* .337 -.189 .604 -.322 -.304 -.171 1.000 .089 -.135 -.141
Sig. (2-tailed) .673 .559 .024 .340 .600 .064 .364 .393 .636 . .807 .711 .698
Potassium .018 -.010 -.231 .127 -.551 .045 -.310 -.502 -.322 .089 1.000 -.394 .164
Sig. (2-tailed) .960 .978 .521 .726 .099 .901 .384 .139 .365 .807 . .260 .652
Phosphate -.040 .588 -.024 .342 .608 -.081 .489 .203 -.487 -.135 -.394 1.000 -.066
Sig. (2-tailed) .912 .074 .948 .334 .062 .824 .152 .573 .153 .711 .260 . .857
Fluoride .350 .140 .106 .312 -.369 -.538 -.251 .261 .233 -.141 .164 -.066 1.000
Sig. (2-tailed) .322 .700 .772 .380 .294 .109 .484 .467 .518 .698 .652 .857 .
IJRRAS 2 (3) ● March 2010 Mahananda & al. ● Physico-chemical Analysis of Ground & Surface Water
295
Correlation is significant at the 0.05 level (2-tailed).
Table 5.Correlation between different physico-chemical parameters of bore water.
Correlation is significant at the 0.05 level (2-tailed).
Table 6. Correlation between different physico-chemical parameters of pond water.
Temp. pH TSS TDS Alkalinity DO COD Nitrate Chloride Sodium Potassium Phosphate Fluoride
Temp. 1.000 -.522 -.656* .155 .212 -.099 -.150 .333 .036 -.104 -.457 -.203 .724*
Sig. (2-tailed) . .122 .040 .670 .557 .785 .679 .347 .922 .775 .184 .575 .018
pH -.522 1.000 -.195 .547 -.182 .528 -.303 -.382 .073 .131 .315 .367 -.055
Sig. (2-tailed) .122 . .590 .102 .615 .117 .395 .276 .841 .717 .376 .297 .880
TSS -.656* -.195 1.000 -.615 -.067 -.332 .464 -.167 .167 .204 .258 -.318 -.635*
Sig. (2-tailed) .040 .590 . .059 .854 .349 .177 .645 .646 .572 .472 .370 .048
TDS .155 .547 -.615 1.000 -.176 .507 -.455 .071 -.119 -.017 .018 .357 .114
Sig. (2-tailed) .670 .102 .059 . .627 .135 .187 .846 .744 .963 .961 .311 .753
Alkalinity .212 -.182 -.067 -.176 1.000 -.310 -.267 .367 .428 -.253 -.499 -.208 .223
Sig. (2-tailed) .557 .615 .854 .627 . .384 .456 .296 .217 .481 .142 .564 .536
DO -.099 .528 -.332 .507 -.310 1.000 -.412 .343 .236 .104 .205 .545 .032
Sig. (2-tailed) .785 .117 .349 .135 .384 . .236 .332 .512 .776 .570 .104 .931
COD -.150 -.303 .464 -.455 -.267 -.412 1.000 -.115 -.378 .163 .698* .004 -.036
Sig. (2-tailed) .679 .395 .177 .187 .456 .236 . .751 .281 .652 .025 .991 .920
Nitrate .333 -.382 -.167 .071 .367 .343 -.115 1.000 .135 -.124 -.148 .418 -.014
Sig. (2-tailed) .347 .276 .645 .846 .296 .332 .751 . .711 .733 .684 .229 .970
Chloride .036 .073 .167 -.119 .428 .236 -.378 .135 1.000 .374 -.355 -.477 .253
Sig. (2-tailed) .922 .841 .646 .744 .217 .512 .281 .711 . .288 .314 .164 .480
Sodium -.104 .131 .204 -.017 -.253 .104 .163 -.124 .374 1.000 .021 -.062 -.016
Sig. (2-tailed) .775 .717 .572 .963 .481 .776 .652 .733 .288 . .955 .865 .964
Potassium -.457 .315 .258 .018 -.499 .205 .698* -.148 -.355 .021 1.000 .354 -.090
Sig. (2-tailed) .184 .376 .472 .961 .142 .570 .025 .684 .314 .955 . .315 .804
Phosphate -.203 .367 -.318 .357 -.208 .545 .004 .418 -.477 -.062 .354 1.000 -.260
Sig. (2-tailed) .575 .297 .370 .311 .564 .104 .991 .229 .164 .865 .315 . .469
Fluoride .724* -.055 -.635* .114 .223 .032 -.036 -.014 .253 -.016 -.090 -.260 1.000
Sig. (2-tailed) .018 .880 .048 .753 .536 .931 .920 .970 .480 .964 .804 .469 .
Temp. PH TSS TDS Alkalinit
y DO COD Nitrate Chloride Sodium Potassium Phosphate Fluoride
Temp. 1.000 -.976 -.370 -.437 -.188 .283 -.724 -.896 -.388 -.999* -.995 .993 .313
Sig. (2-tailed) . .138 .759 .712 .879 .817 .484 .293 .746 .027 .065 .077 .797
PH -.976 1.000 .161 .233 -.028 -.069 .856 .779 .180 .985 .950 -.995 -.511
Sig. (2-tailed) .138 . .897 .851 .982 .956 .346 .431 .885 .111 .203 .061 .659
TSS -.370 .161 1.000 .997* .982 -.996 -.372 .744 1.000* .330 .462 -.255 .766
Sig. (2-tailed) .759 .897 . .046 .121 .059 .757 .466 .012 .786 .694 .836 .444
TDS -.437 .233 .997* 1.000 .966 -.986 -.304 .791 .999* .398 .526 -.324 .717
Sig. (2-tailed) .712 .851 .046 . .167 .105 .803 .419 .034 .740 .648 .790 .491 Alkalinity -.188 -.028 .982 .966 1.000 -.995 -.541 .605 .978 .146 .287 -.068 .874
Sig. (2-tailed) .879 .982 .121 .167 . .062 .636 .586 .133 .907 .815 .957 .324
DO .283 -.069 -.996 -.986 -.995 1.000 .456 -.679 -.994 -.241 -.378 .164 -.822
Sig. (2-tailed) .817 .956 .059 .105 .062 . .698 .524 .071 .845 .753 .895 .386
COD -.724 .856 -.372 -.304 -.541 .456 1.000 .343 -.354 .753 .651 -.803 -.882
Sig. (2-tailed) .484 .346 .757 .803 .636 .698 . .777 .769 .457 .549 .407 .313
Nitrate -.896 .779 .744 .791 .605 -.679 .343 1.000 .757 .876 .936 -.835 .141
Sig. (2-tailed) .293 .431 .466 .419 .586 .524 .777 . .453 .320 .228 .371 .910
Chloride -.388 .180 1.000* .999* .978 -.994 -.354 .757 1.000 .348 .479 -.273 .754
Sig. (2-tailed) .746 .885 .012 .034 .133 .071 .769 .453 . .774 .682 .824 .457
Sodium -.999* .985 .330 .398 .146 -.241 .753 .876 .348 1.000 .990 -.997 -.354
Sig. (2-tailed) .027 .111 .786 .740 .907 .845 .457 .320 .774 . .092 .050 .770 Potassium -.995 .950 .462 .526 .287 -.378 .651 .936 .479 .990 1.000 -.975 -.216
Sig. (2-tailed) .065 .203 .694 .648 .815 .753 .549 .228 .682 .092 . .142 .862 Phosphate .993 -.995 -.255 -.324 -.068 .164 -.803 -.835 -.273 -.997 -.975 1.000 .426
Sig. (2-tailed) .077 .061 .836 .790 .957 .895 .407 .371 .824 .050 .142 . .720
Fluoride .313 -.511 .766 .717 .874 -.822 -.882 .141 .754 -.354 -.216 .426 1.000
Sig. (2-tailed) .797 .659 .444 .491 .324 .386 .313 .910 .457 .770 .862 .720 .